Lessons from NAFTA William Maloney, Luis Serven World Bank Canadian Standing Senate Committee on Foreign Affairs www.worldbank.org/laceconomist

Lessons from NAFTA William Maloney, Luis Serven World Bank Canadian Standing Senate Committee on Foreign Affairs .
Dec 18, 2015
Welcome message from author
This document is posted to help you gain knowledge. Please leave a comment to let me know what you think about it! Share it to your friends and learn new things together.
Transcript

Lessons from NAFTA
William Maloney, Luis ServenWorld Bank
Canadian Standing Senate Committee on Foreign Affairs
www.worldbank.org/laceconomist
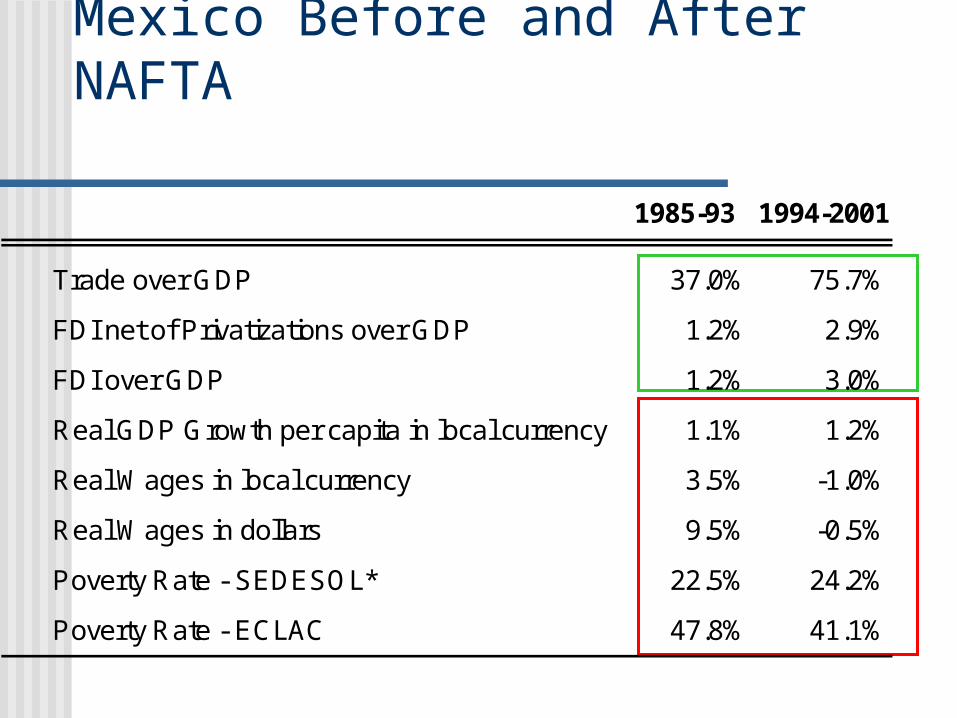
Mexico Before and After NAFTA
1985-93 1994-2001
Trade over GDP 37.0% 75.7%
FDI net of Privatizations over GDP 1.2% 2.9%
FDI over GDP 1.2% 3.0%
Real GDP Growth per capita in local currency 1.1% 1.2%
Real Wages in local currency 3.5% -1.0%
Real Wages in dollars 9.5% -0.5%
Poverty Rate - SEDESOL* 22.5% 24.2%
Poverty Rate - ECLAC 47.8% 41.1%
How to evaluate the impact of NAFTA?
Only ten years have elapsed. Other major events occurred simultaneously:
Tequila Crisis and 1995 recession Unilateral reforms 1986-1993 – anticipated NAFTA
effect and delayed reform effects FDI boom to “emerging” economies, not just Mexico Ongoing decline in commodity prices (agriculture) and
ongoing employment trends Our multifaceted approach:
History – before and after NAFTA – structural change? Differences across sectors and states International comparisons – Mexico versus other Latin
economies
Did Mexico benefit from NAFTA? Yes, but could have been better.
On the whole, yes But not so much as proponents promised. Not as
bad as critics claimed either. Gave a modest impulse to economic convergence in
N.A. Notable impact on trade and FDI
Benefits were not equally shared by all sectors and regions
The benefits are not automatic They depend on complementary domestic reforms Institutions, education, technology, infrastructure

Plan of the presentation Trade FDI Income convergence with N.A. Divergence across regions Productivity and innovation Labor Markets Agriculture

Trade

Nafta spurs trade
But the FTA was not the only factor: rapid US growth in late 1990s Real depreciation of the peso Lagged effect of unilateral reforms of the 1980s
No evidence of trade diversion in the aggregate NAFTA estimated to be responsible for a 25-30% increase in
exports

Big increase in trade
Figure 4. Latin America: Imports plus Exports over GDP
0
20
40
60
80
100
120
1990 1991 1992 1993 1994 1995 1996 1997 1998 1999 2000
ARG BRA CHL COL CRI MEX ALC
Trade/GDP

Foreign Direct Investment
FDI rose, but not only in Mexico: Only a temporary effect?
Entradas Netas de Inversión Extranjera Directa(porcentaje del PIB)
0%
1%
2%
3%
4%
5%
6%
7%
19
80
19
81
19
82
19
83
19
84
19
85
19
86
19
87
19
88
19
89
19
90
19
91
19
92
19
93
19
94
19
95
19
96
19
97
19
98
19
99
20
00
20
01
México América Central y el Caribe América del Sur
Sources: WIR and IMF.
Net FDI inflows as a % of GDP

Convergence of GDP/Capita

The development gap between the U.S. and Mexico
Debt Crisis
Tequila
1960 1964 1968 1972 1976 1980 1984 1988 1992 1996 20001.0
1.5
2.0
2.5
3.0
3.5
4.0
4.5
5.0
5.5
Ratio of GDP per capita US/Mexico
Institutional gaps limit the reduction of the income per capita gap
1.331.24
2.05
1.45
0.58
1.71
1.07
1.70
1.241.18
1.58
1.19
1.58
0.28
0.120.06
-0.41-0.28
-1.00
-0.50
0.00
0.50
1.00
1.50
2.00
2.50
Va
ria
ble
ra
ng
es
fro
m -
2 t
o +
2 f
or
all
cou
ntr
ies
CAN USA MEX
Voice and Accountability
Political Stability
Government Effectiveness
Regulatory Quality
Rule of Law Control of Corruption

Divergence across Regions

The development gap within Mexico: state GDP/capita
-
5,000
10,000
15,000
20,000
25,000
30,000
35,000
40,000
45,000
1940 1950 1960 1970 1980 1988 1990 1993 1995 2000
GD
P p
er
Ca
pit
a (
19
93
pe
so
s)
Chiapas Chihuahua Guerrero Nuevo LeónOaxaca Sonora Distrito Federal

Why Different Performance of Mexican States during the 1990s?
Initial education (literacy,education level)
Infrastructure Political instability and institutions If poor States had had the same
education, and infrastructure in 1990, they would have grown more than the rich ones (“conditional convergence”)

Productivity and Innovation
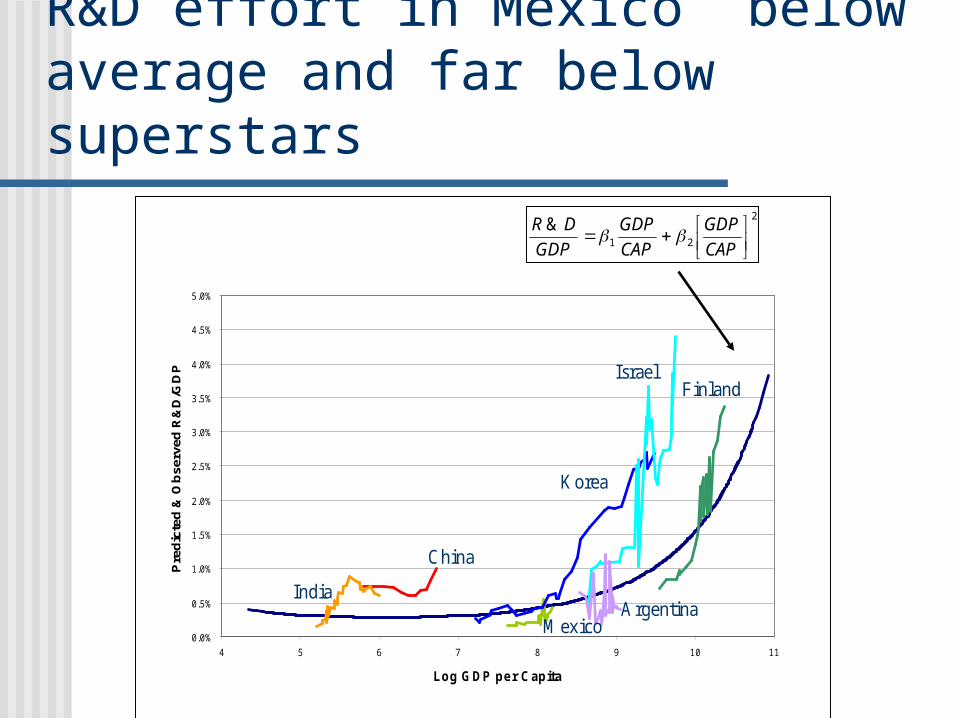
R&D effort in Mexico below average and far below superstars
0.0%
0.5%
1.0%
1.5%
2.0%
2.5%
3.0%
3.5%
4.0%
4.5%
5.0%
4 5 6 7 8 9 10 11
Log G DP pe r Capita
Pre
dic
ted
& O
bse
rved
R&
D/G
DP
IndiaArgentina
China
IsraelFinland
Korea
M exico
2
21
&
CAP
GDP
CAP
GDP
GDP
DR

R&D gap in Mexico, modest post-NAFTA recovery …
-160%
-140%
-120%
-100%
-80%
-60%
-40%
-20%
0%
Per
cen
t D
evia
tio
n f
rom
th
e M
edia
n
Mexico's R&D
NAFTA

Labor Markets
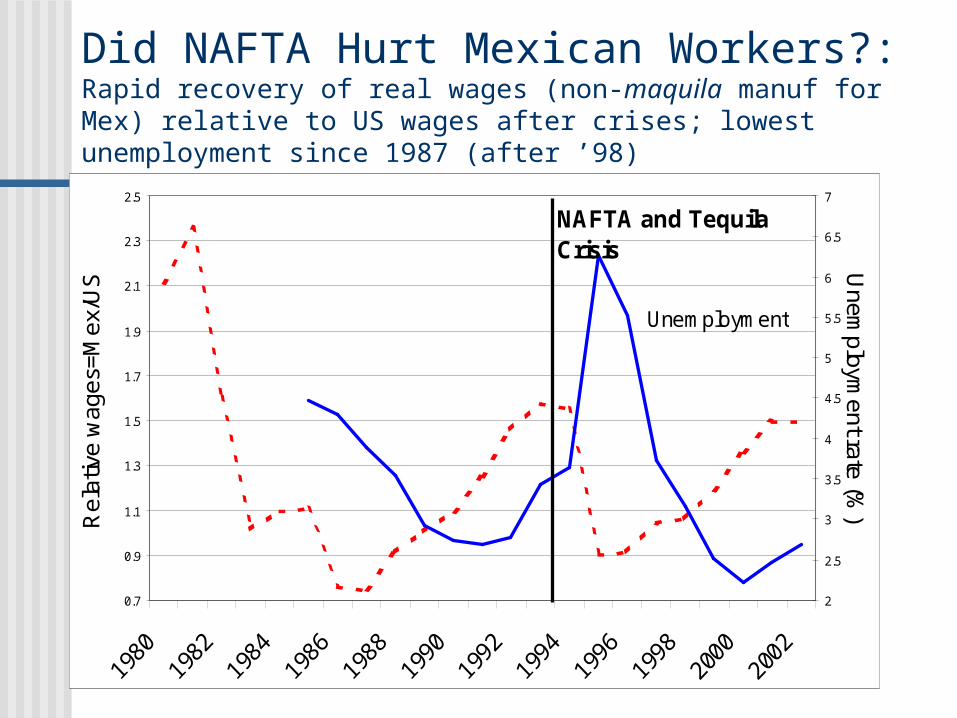
Did NAFTA Hurt Mexican Workers?:Rapid recovery of real wages (non-maquila manuf for Mex) relative to US wages after crises; lowest unemployment since 1987 (after ’98)
Manufacturing Real Wages and Unemployment Evolution
0.7
0.9
1.1
1.3
1.5
1.7
1.9
2.1
2.3
2.5
Rel
ativ
e w
ages
=Mex
/US
2
2.5
3
3.5
4
4.5
5
5.5
6
6.5
7
Unem
ployment rate (%
)
Unemployment
NAFTA and Tequila Crisis

0.0%
5.0%
10.0%
15.0%
20.0%
25.0%
30.0%
35.0%
% a
bo
ve n
on
-tra
da
ble
s
Note: Non agricultural workers. Conditional on human capital
NonTrad.
More Exports/Worker More Imports/Worker
Human Capital Adjusted Wages
Did NAFTA hurt Mexican workers?Higher wages paid by firms with international competition; wages recovered faster after 1995 in export sectors; & limited effect on rural employment
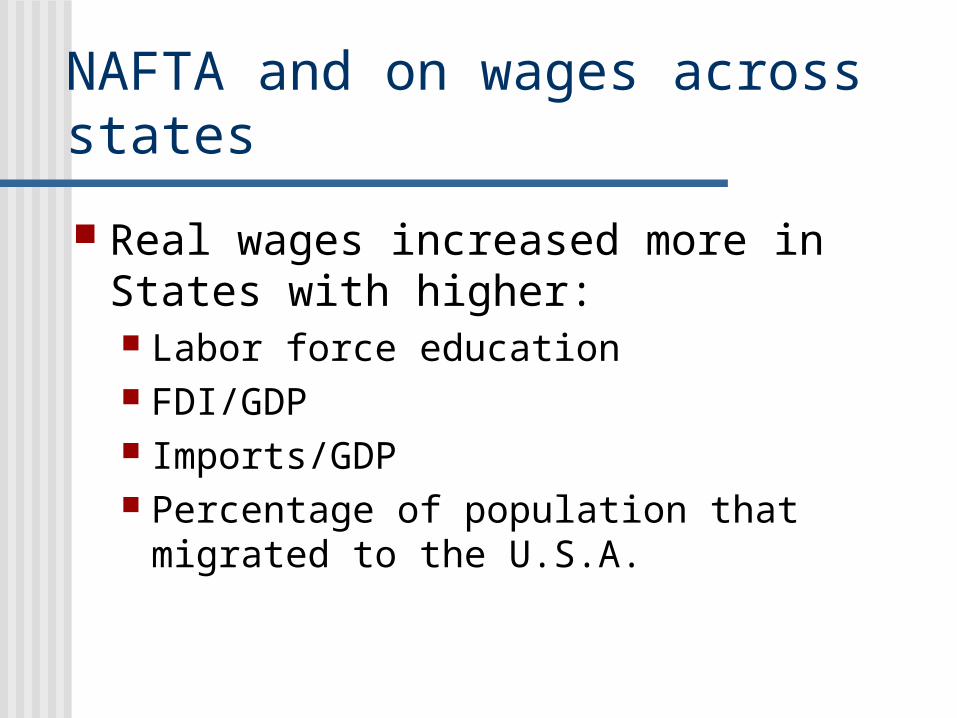
NAFTA and on wages across states
Real wages increased more in States with higher: Labor force education FDI/GDP Imports/GDP Percentage of population that migrated
to the U.S.A.

Is there an inequality story?: yes in wages, but not in household income
Year World Bank Gini
SEDESOL Gini
1992 55.9 47.5
1996 54.4 45.6
2000 54.6 48.1
2002 n.a. 45.4
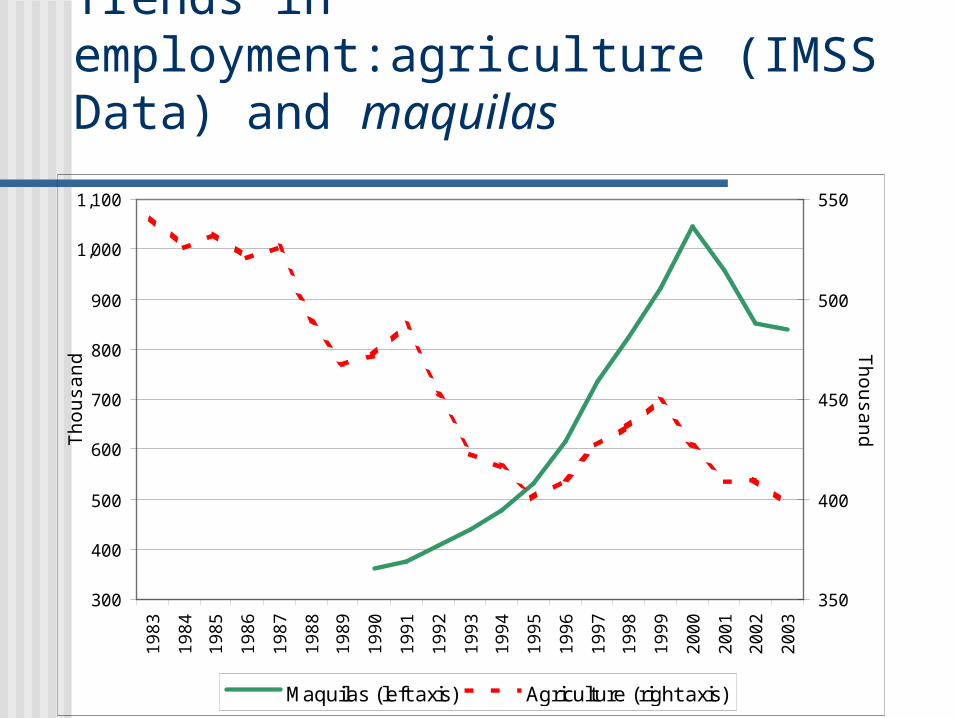
Trends in employment:agriculture (IMSS Data) and maquilas
300
400
500
600
700
800
900
1,000
1,100
19
83
19
84
19
85
19
86
19
87
19
88
19
89
19
90
19
91
19
92
19
93
19
94
19
95
19
96
19
97
19
98
19
99
20
00
20
01
20
02
20
03
Tho
usan
ds
350
400
450
500
550
Thousands
Maquilas (left axis) Agriculture (right axis)

Agriculture
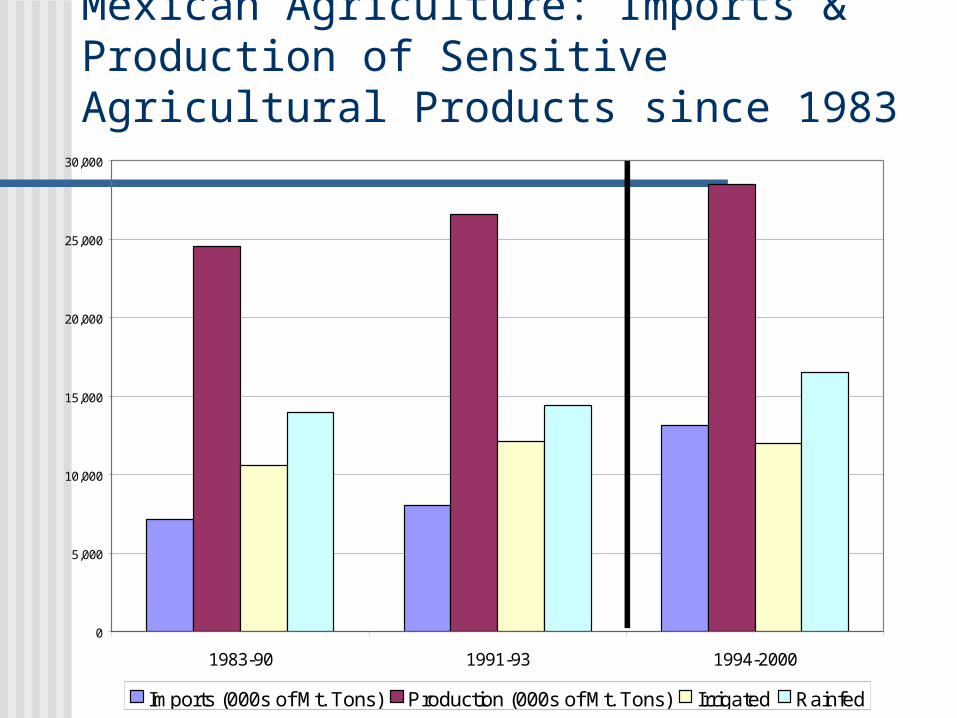
Mexican Agriculture: Imports & Production of Sensitive Agricultural Products since 1983
0
5,000
10,000
15,000
20,000
25,000
30,000
1983-90 1991-93 1994-2000
Imports (000s of Mt. Tons) Production (000s of Mt. Tons) Irrigated Rainfed
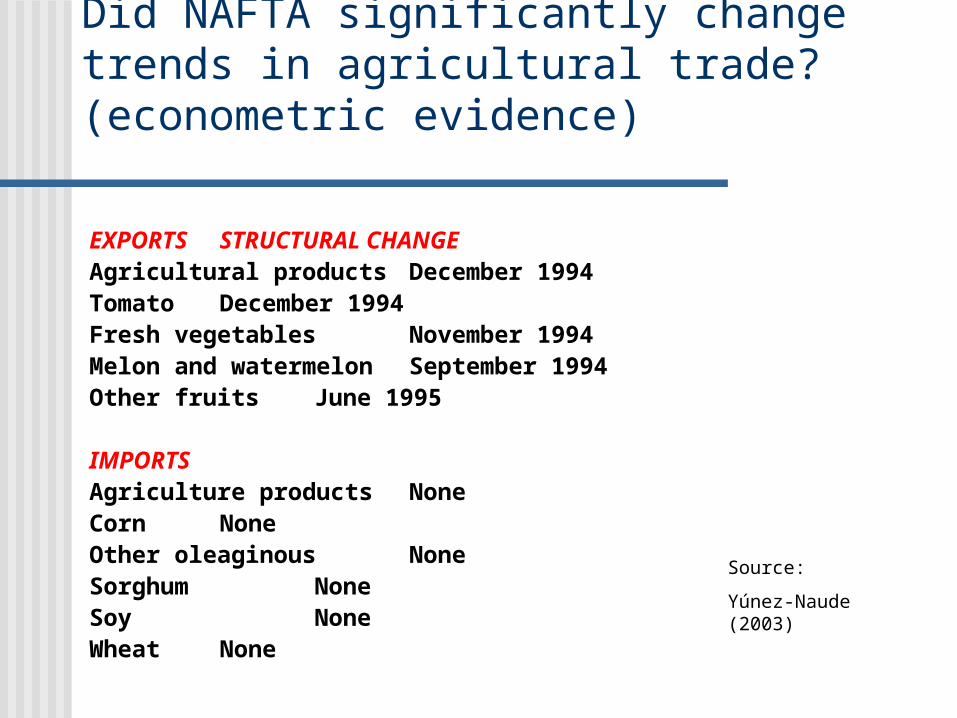
Did NAFTA significantly change trends in agricultural trade? (econometric evidence)
EXPORTS STRUCTURAL CHANGEAgricultural products December 1994 Tomato December 1994 Fresh vegetables November 1994 Melon and watermelon September 1994 Other fruits June 1995
IMPORTS Agriculture products NoneCorn NoneOther oleaginous NoneSorghum NoneSoy NoneWheat None
Source:
Yúnez-Naude (2003)
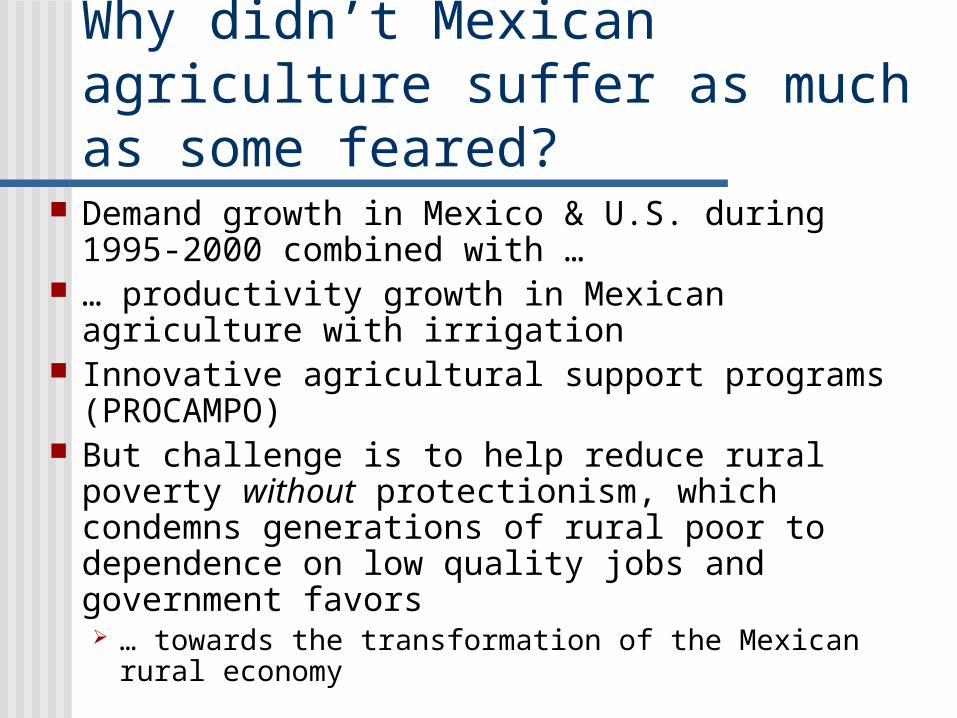
Why didn’t Mexican agriculture suffer as much as some feared?
Demand growth in Mexico & U.S. during 1995-2000 combined with …
… productivity growth in Mexican agriculture with irrigation
Innovative agricultural support programs (PROCAMPO)
But challenge is to help reduce rural poverty without protectionism, which condemns generations of rural poor to dependence on low quality jobs and government favors … towards the transformation of the Mexican
rural economy

End
Related Documents