Lesson - 6 :'. OPERATING LEVERAGE AND BREAK - EVEN ANALYSIS OBJECTIVES: After studying this lesson, you will be able to understand : '. .• the concept of operating leverage .• technique of break even analysis .• the approaches for determination of break even point '* the assumptions and limitations of break even analysis :: •. r ., STRUCTURE : 6.1 Introduction 6.2 Meaning of leverage 6.3 Types of leverages 6.4 Concept of Break - even analysis 6.5 Effect of changes in variables on break - even point 6.6 Utility and limitations of break - even/analysis 6.7 Summary 6,8 Key Words 6.9 Self - assesment questions 6.10 Further readings , . 6.1 Introduction: A firm can raise funds for its long - term requirements through equity or debt capital. The use of debt capital for the benefit of 'shareholders is known as financial leverage, Further, the firm uses assets involving some fixed operating cost that influences the earnings available to equity shareholders. This· effect is indicated by operating leverage. In the present lesson, operating leverage and the technique of break- even analysis are explained. In lesson 7 you will have an understanding of financial leverage and EBIT - EPS analysis. ' . 6.2 Meaning of leverage: The term leverage refers to "an increased means for accomplishing some purpose". For example, leverage helps us in lifting heavy objects, which may not be otherwise possible, In financial management, the concept of leverage has a special meaning.

Welcome message from author
This document is posted to help you gain knowledge. Please leave a comment to let me know what you think about it! Share it to your friends and learn new things together.
Transcript
Lesson - 6
:'.OPERATING LEVERAGE AND BREAK - EVEN ANALYSISOBJECTIVES:
After studying this lesson, you will be able to understand :'.
.• the concept of operating leverage
.• technique of break even analysis
.• the approaches for determination of break even point
'* the assumptions and limitations of break even analysis:: •. r
., STRUCTURE :
6.1 Introduction
6.2 Meaning of leverage
6.3 Types of leverages
6.4 Concept of Break - even analysis
6.5 Effect of changes in variables on break - even point
6.6 Utility and limitations of break - even/analysis
6.7 Summary
6,8 Key Words
6.9 Self - assesment questions
6.10 Further readings ,.
6.1 Introduction:A firm can raise funds for its long - term requirements through equity or debt capital. The use of
debt capital for the benefit of 'shareholders is known as financial leverage, Further, the firm uses assetsinvolving some fixed operating cost that influences the earnings available to equity shareholders. This·effect is indicated by operating leverage. In the present lesson, operating leverage and the technique ofbreak- even analysis are explained. In lesson 7 you will have an understanding of financial leverageand EBIT - EPS analysis. ' .
6.2 Meaning of leverage:The term leverage refers to "an increased means for accomplishing some purpose". For example,
leverage helps us in lifting heavy objects, which may not be otherwise possible, In financial management,the concept of leverage has a special meaning.

-- Fininancial Management -------j®~'"'-------Operating- Leverage ... --
Here leverage means the employment 'Of "an asset or rource of finance which involves some fixedoperating cost or ficad return. This fixed cost or fixed return is the fulcrum of leverage. If a firm is notrequired to pay fixed cost or return, 'there will be no leverage. Thus, the Leverage influences the earnings ,of equity shareholders and the risk to .them as well. A higher leverage results in higher earnings anrgreater risk and vice versa.
6.3. Types of leverages:
Leverages are of three types 1) Operating Leverage, 2) Financial Leverage 3) Combined/CompositeLeverage.
6.3.1. Operating leverage:
Operating leverage refers to the use of fixed costs in the operation of a firm. If the firm's total costcomprises fixed cost which does not change with the volume of out put or sales, the operating leverageis said to exist. If there are no fixed costs, there will be no operating leverage.
If a firm has greater amount of fixed costs when compared to variable cost, it will have a higherdegree of operating leverage and if the fixed cost is less. it will have a lower degree of operatingleverage. Thus, operating leverage increases with fixed cost.
Operating leverage indicates the effects of a changes in sales on operating profit, also known asearnings before interest and taxes (EBIT). It is both favorable and unfavorable. A higher operatingleverage indicates that even a small change in sales (increase or decrease) will cause a greater change inoperating profit.
6.3.2. Measurement of operating leverage:
The existence of fixed costs in the total cost structure of a firm results in operating leverage. Operatingleverage is a function of three factors: total fixed cost, contribution and sales volume. Degree ofoperations leverage is calculated as follows :
Operating leverage Contributri>n
Operatingprofit
Sales - Variable ope~atingcos tsEBIT=
Dlustration 1
From the following information compute operating leverage and comment :
Fixed cost = Rs. 50,000; Variable cost = 70% of sales
Sales: Rs. 2,00,000 in the previous yearL. '
Rs. 2,50,000 in the current year ',0,'

-- C.D.E ------------<@>------ Acharya Nagarjuna University --
SolutionPrevious year Current year Percentage
Rs Rs change
Sales 2,00,000 2,50,000 25%
Less : Variable cost 1,40,000 1,75,000
(70% of sales)
Contribution 60,000 75,000
Less : Fixed cost 50,000 50,000
Operati ng Profit (EB IT) 10,000 25,000 150%
Degree of Operating leverage Contribution
EBIT
= 60,000 = 610,000
Comment : The operating leverage of 6 in the above illustation indicates that if sales increase by1% operating profit shall increase by 6%. Thus, 25% increase in sales has resulted in an increase of150% in the operating profit.
The degree of operating leverage may also be calculated in a different way. It may be defined asthe ratio of percentage change in operating profit to the percentage change in sales. Thus, it is calculatedas :
Degree of operating leverage _ Percentage chang~ in operations profits or EBITPercentage change in sales
~ EBIT ~ Sales
EBIT Sales
If data from the above illustration is taken, the Degree of operating leverage is as under :
DOL = 150% = 625%
6.3.4. Utility of operating leverage:
Operating leverage is very useful in ascertaining the effect of a change in sales on operating profit.A high degree of operating leverage indicates that even a small change in sales will have a large effect one'EBIT. In other words, a small increase in sales will have larger increase in operating income. This,leverage also adversely affects the earnings of the firm. In case of high degree of leverage, even a smalh:fall in sales will result in a greater decrease in operating profit. Since it is very risky, no firm would liketo operate under conditions of high degree of operating leverage.

-- Fininancial Management .-------(®~-------Operating Leverage ... --
6.3.5 Operating Risk
Opereting risk is the risk of the firm not being ahle to cover its fixed operating Casts. The lager themagnitude of feed operating costs the larger is the vdome of rales to cover all feed Costs. The higher thefeed gereting costs, the higher the degree of operating liverage and the higher the Break even volume Inthis Conteet the break even analysin is presented here under.
6.4 Concept of Break - Even analysis:Break - even analysis is a widely used technique to study cost, volume and profit relationships.
This is a very useful technique that helps the management of a firm in profit planning. In a narrowersense, break - even analysis refers to the technique used for determining that level of activity where totalcost equals total revenue. But in a broader sense, it refers to that technique which determines the probableprofit at any level of activity. It portrays the relationship between cost of production, volume of productionand selling price. Hence, it is also known as cost volume profit analysis (C-V-P Analysis).
Even though break - even analysis and CVP analysis are interchangeably used, there is a slightdifference between the two. CVP analysis is broader and it includes the entire gamut of profit planning,while 'break - even analysis' is a techniane used in this process. Hence, CVP analysis is the ITloreappropriate term to be used for studying the CVP relationships. However the term break - even analysisis so popular that these two terms are used as synonymous.
6.4.1. Assumptions of Break - Even analysis: .The technique of break - even analysis is subject to the following assumptions :
1. The total cost can be segregated into fixed and variable components.
2. Total fixed cost remains constant at all levels of output.
3. Variable cost per unit remains constant and total variable cost changes directly in proportion tosales volume.
4. Selling price per unit remains unchanged at all levels of output.
5. The firm produces, only one product or in case of multiple products, the sales - mix remainsconstant.
6. There is synchronisation between production and sales. It means that there will be no opening orclosing stock.
6.4.2. Meaning of Break - Even point and its Determination:The break - even point may be defined as that level of sales volume at which total revenue is equal
to total cost. It is a point of no profit or no loss. At this point of sales, the firm's. total revenue breaksevenly with total cost, and hence the name. Any increase in sales beyond this point will fetch profits tothe firm and if sales fall below this point, the firm will incur loss. Thus, the break - even point is:
, . Sales revenue = When Total Variable cost + Total fixed cost

-- C.D.E -------------(@)------ Acharya NagarjunaUniversity r--~.There are two approaches to compute the break - even point
a) Algebraic Formula Approach, and
b) Graphic or Chart Approach
a) The Algebraic formula approach:
By using algebraic formula, the break - even point can be computed, i) in terms of units of salesvolume ii) in terms of money value of sales volume, and Hi) as a percentage of estimated capacity.
If
F
V
P
Q
TR
TC
Then'
TR
TC
If
F
V
P
Q
TR
TC
Them
TR
TC
= Total fiad costs
= Variable cost per unit
= Prica per unit
= quality reld
= total revenue
= Total cost
= Price per unit x quality sold = P.Q
= Total variable cost + Total fiad cost
= {Variable cost per unit x paantity old} + Total
= Totalfiard costs
= Variable cost per unit
= Price Per unit
= Quantity rold
= Total revence
= Total Cost
= Price per unit X Quantity Sold P.Q
= Total Variable cost + Total Fiad Cost
= (Variable cost per unit X Quantity sold) + total fixed cost
at th eak even point of sales total revence is iqual to total cost therefore
= Y.Q+F
TR TC.Jlf= ,.
P.Q = Y.Q+F
PQ-VQ = F

-- Fininancial Management -------<([91-------- Operating Leverage; .. --'"
Q [P-V] = F
F FQ=-=.--P-V C
Here. Q is the break even rales
F is the total Final cost
P is the Price per unit
V is the Variable cost per unit
C is the Cantritution per unit
i) Break ~Even point (in units) :
Break - even point is a point of no profit or no loss., It can be calculated with the help of thefollowing formula:
Fixed costBreak - even point (in units) = ---Contribution per unit
(Where, contribution per unit = Selling price per unit - Variable cost per unit.
Since total contribution is equal to total fixed cost at break - even point, fixed cost is divided bycontribution per unit to get the break - even point in units.
ii) Break - Even point (in rupees) :
Break - even point in rupee value can be 'calculated with the help of following formula:
Fa) Break - even point (in rupees) = -- = pP-V
Where, F = Fixed cost
P = Selling price par unit
U = Variable cost per unit-.
b) Break - even point can also be calculated as follows
Break - even point (in' rupees) Fixed cost
P/V Ratio
Where, PN Ratio. ,
It is a ratio between contribution and sales. Which is also known as conntribution ratio This ratioindicates the extent to which sales will contribute to meet fixed cost up to break - even point and to totalprofit of the firm after break - even point. It is calculated as .:
\
-- C.D.E ---....;..---------C@l--,--.,..----AcharyaNagarjunaUniversity
P-V CP IV Ratio = -. - x 100 or- x 100P PWhere, P = Price, V= Variable. cost
C = P - V = Contribution
VSince, C = P - V and S represents variable cost to sales ratio, the PN ratio can also be calculated
as below:
PN Ratio = 1- V 'or 1- Variable cos t ratio."', P
Thus, if variable cost ratio is 60% or .6, then PN ratio will be 40% or .4.<, --
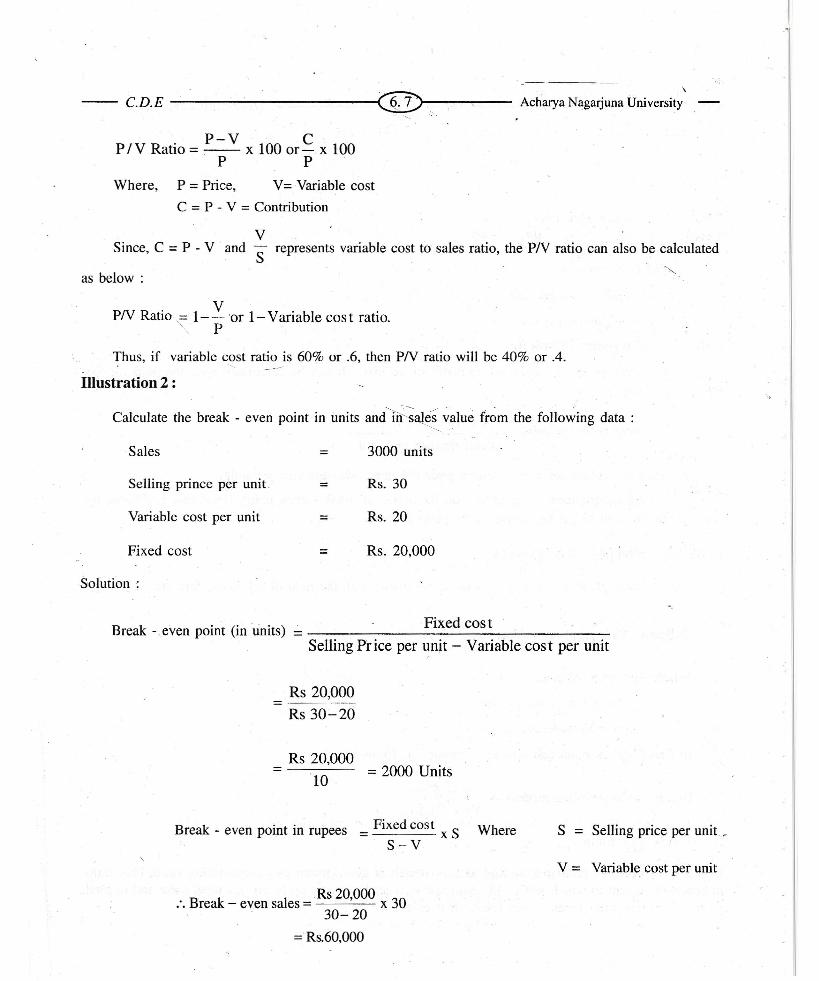
Illustration 2 :
Calculate the break - even point in units andlir~al~s value from the following data :
Sales = 3000 units
Selling prince per unit = Rs.30
Variable cost per unit = Rs.20
Fixed cost Rs.20,000=
Solution:
Break - even point (in units) Fixed cost
Selling Price per unit - Variable cost per unit
Rs 20,000=Rs 30-20
Rs 20,000=10 = 2000 Units
Break - even point in rupees = Fixed cost x S WhereS-V
S = Selling price per unit.
V = Variable cost per unit
. B k I Rs 20,000 30:. rea - even sa es = x30-20
= Rs.60,OOO

i
-- Fininancial Management-------l@>--------OperatingLeverage ...---+Alternately, Break - even sales = Break - even point units x selling price
\\I
= 2000 units x Rs !)O
= Rs 60,000
iii) Break - Even point as a percentage of estimated capacity:
Break - even sales can also be expressed as a percentage of estimated capacity of the firm. It is'calculated as :
= Break-even sales x 100Break - even point (as percentage; of capacity) Estimated capacity
Illustiarlon 3 :
Total estimated capacity = 1,00,000 units,
Break - even point = 60,000 units, then find out
break - even point as percentage of estimated capacity.
Solution:
Break - even point (as percentage of capacity) = Break - even po int x 100Estimated capacity
= 60,000 units x 1001,00,000 units
=60%
b) Graphic or Cnart Approach:
The break - even point can also be shown graphically. A break - even chart portrays a pictorialview of the relationship between costs, volume and profits. The break - even chart shows that the break- even point occurs where the total cost line and total revence, line intersect each other. This chart alsoshows not only the break - even point but also the profit or loss at various levels of sales.
The break - 'even chart is drawn by following the steps given below:
1., I
Volume of output sales (units or!rupees) is presented on horizontal axis or x- axis
Costs and sales revenue are plotted on vertical or y- axis
Fixed cost line is drawn parallel to x-axis as fixed costs remain constant at all levels of activity.
Total cost line is drawn starting at fixed cost line touching the y- axis
Total revence line is drawn starting at the origin of the two axes.
I 2.
3."
4.
5.
CD.E --------- -----1<U:)-----. Acharya Nagarjuna University -
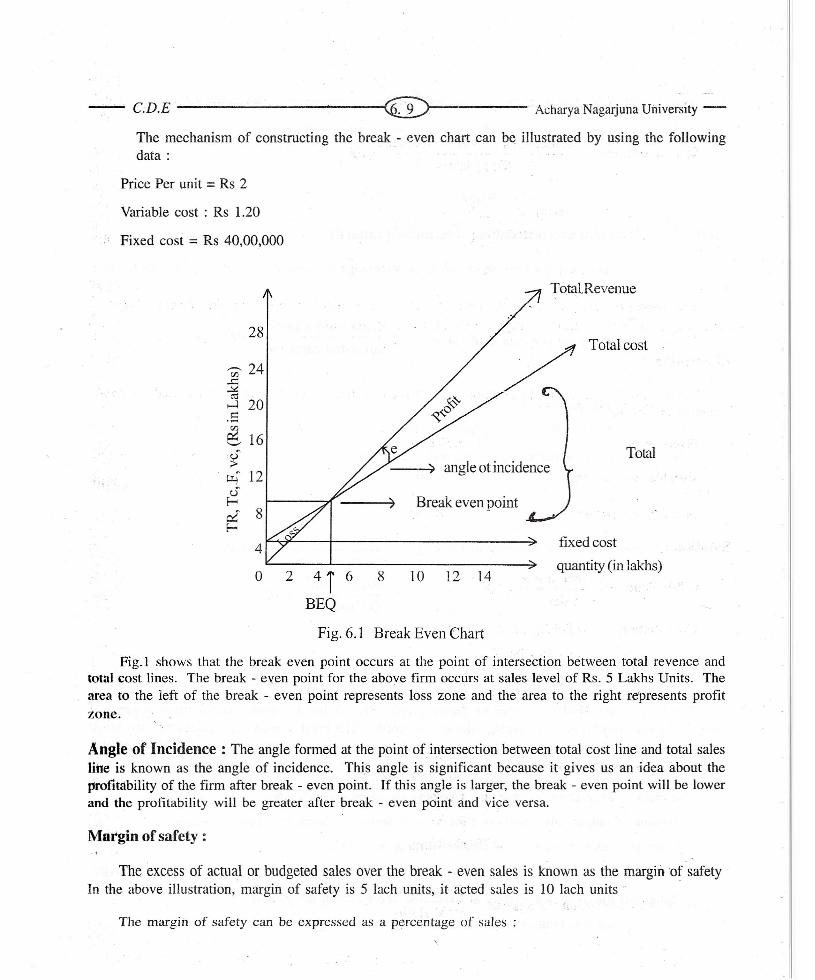
The mechanism of constructing the break- even chart can be illustrated by using the followingdata:
Price Per unit = Rs 2
Variable cost : Rs 1.20
Fixed cost = Rs 40,00,000
Total.Revenue
28
'00' 24:S2(\l
~ 20.Senex:: 16.........,
'i~ 12JE-
~8
40 2 4T 6 8
BEQ
Total cost
Total--~) angle ot incidence
) .Break even point
fixed cost
quantity (in lakhs)10 12 14
Fig. 6.1 Break Even Chart
Fig.1 shows that the break even point occurs at the point of intersection between total revence andtotal cost lines. The break - even point for the above firm occurs at sales level of Rs. 5 Lakhs Units. Thearea to the left of the break - even point represents loss zone and the area to the right represents profitzone.
Angle of Incidence : The angle formed at the point of intersection between total cost line and total salesline is known as the angle of incidence. This angle is significant because it gives us an idea about theprofitability of the firm after break - even point. If this angle is larger, the break - even point will be lowerand the profitability will be greater after break - even point and vice versa.
Margin of safety:
The excess of actual or budgeted sales over the break - even sales is known as the margin 'of safetyIn the above illustration, margin of safety is 5 lach units, it acted sales is 10 lach units ~.
"The margin of safety can be expressed as a percentage of sales :
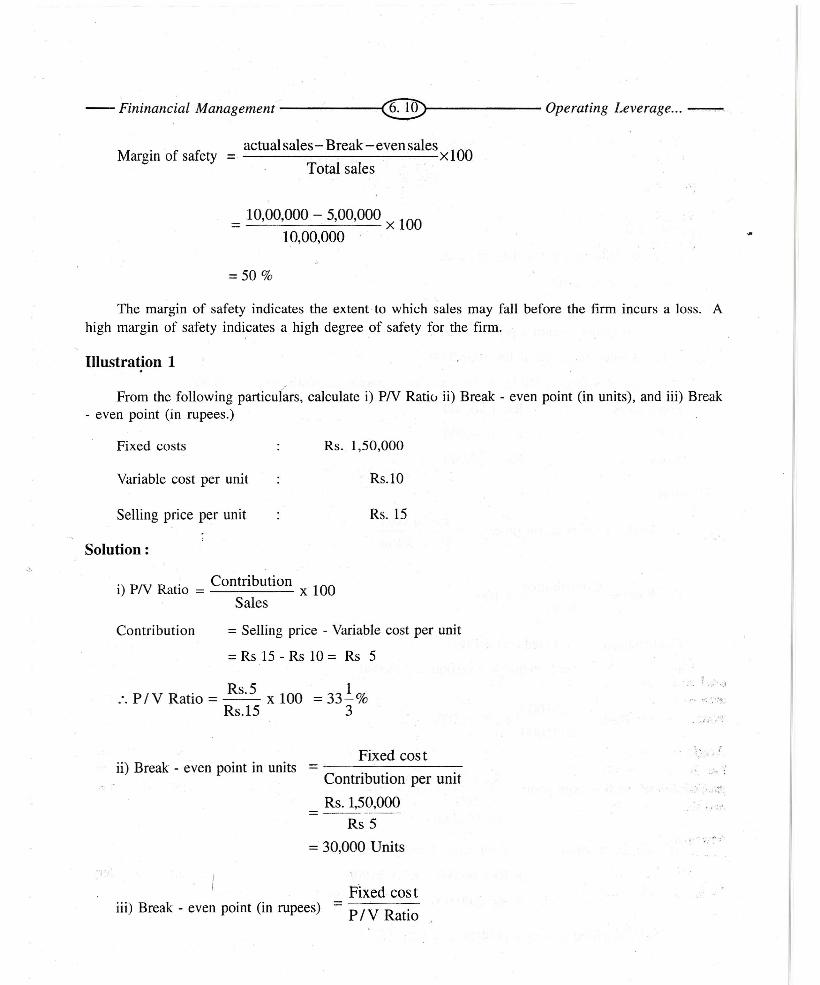
-- Fininancial Management -----~e)--------Operating Leverage ... -.-. -..
Margin of safety= actual sales- Break-even sales x 100
Total sales
= 10,00,000 - 5,00,000 x 10010,00,000
=50 %
The margin of safety indicates the extent to which sales may fall before the firm incurs a loss. Ahigh margin of safety indicates a high degree of safety for the firm.
Illustration 1.r
From the following particulars, calculate i) PN Ratio ii) Break - even point (in units), and iii) Break- even point (in rupees.)
Fixed costs Rs. 1,50,000
Variable cost per unit Rs.1O
Selling price per unit Rs.15
Solution:
i) PN Ratio = Contribution x 100Sales
Contribution = Selling price - Variable cost per unit
= Rs 15 - Rs 10 = Rs 5
:. PIV Ratio = Rs.5 x 100 = 33!%Rs.15 3
. ; ..,'.J
Fixed costii) Break - even point in units - ~-------
Contribution per unitRs. 1,50,000
=Rs5
= 30,000 Units
..:., ~~.. t~
".: .•.'
iii) Break - even point (in rupees)FIxed cost
P/V Ratio

--- C.D.E --------------1@------ Acharya Nagarjuna University -/-
Rs. 1,50,000=-----
331.%3
= 4,50,000
Illustration 2
From the following particulars calculate :
1) Break - even point
2) Margin of safety
3) Sales required to earn a profit of Rs. 1,50,000
4) Profit when sales are of Rs. 10,00,000
5) Margin of safety available, if the company is earning a profit of Rs. 2,00,000
Fixed costs Rs. 1,50,000
Rs. 1,00,000
Rs. 5,00,000
Profit
Sales
Solution:
Fixed cost1) Break - even point (in rupees) =
P/V Ratio
PN Ratio = Contribution x 100Sales
Contribution = Fixed cost + Profit
= 1,50,000 + 1,00,000 ,; 2,50,000
:. P I V Ratio = 2,50,000 x 100 = 50%5,00,000
H b k . Rs. 1,50,000 1,50,000ence, rea - even pomt = or ---50% 50
= Rs 3,00,000
2) Margin of safety = Total sales Break - even sales
= Rs 5,00,000 - Rs 3,00,000
= Rs. 2,00,000
3) Sales required to earn a profit of Rs. 1,50,000--

Period I ,- 1,00,000
1,20,000
15,000
23,000
-- Fininancial Management - --i@ ------OpefatingLeverage --
Fixed cost + Target profitSales to earn targeted profit = ---------''''---....!..--P/V Ratio
~ Rs. 1,50,000 + 1,50,00050%
= Rs. 3,00,000 x 10050
= Rs 6,00,000
4) Profit when sales are Rs. 10,00,000
Profit = (Sales x PN Ratio) - Fixed cost
50= (Rs 10,00,000 x 100) - Rs. 1,50,000
= Rs 5,00,000 - Rs. 1,50,000
= Rs. 3,50,000
5) Margin of safety when profit is Rs. 2,00,000
. ProfitMargin of safety - ----
P/V Ratio
= Rs. 2,00,000 x 10050
= Rs. 4,00,000
Illustration 3
The following figures of sales and profits for two periods are available in respect of a firm :
Sales Profit
Period II
you are required to calculate :
a) PN- Ratio\
b) Break - even point
c')
d)
e)
Sales required to earn a profit of Rs. 20,000
Profit at estimated sales of Rs. 1,50,000
Margin of Safety at a profit of Rs 50,000

·~C.D.E --------------i®~----Acharya Nagarjuna University -
Solution:
a) PN Ratio = Change in profits, x 100Change in Sales
= 23,000 -15,000 x 1001,20,000 - 1,00,000
= 8000 x 100 = 40%20,000
Fixed costb) Break - even point =
P/V Ratio/
,
As fixed cost is not given, it should be computed. Take data of one period .and calculate the fixedcost in the following manner.
Profit = (Sales. x PN Ratio) - Fixed cost
,:,;.,; :. Fixed cost = (Sales x PN Ratio) - profit
= (1,00,000 .. 40%) - 15,000
= 40,000 - 15,000 = 25,000
B ·k . Rs.25000:. rea - even pomt = ----40%
= 25000 x 10040
= Rs. 62,500
c) Sales required to earn a profit of Rs. 20,000
Fixed cas t + Desired profitSales for targeted profit = --------~-. P/V Ratio
Rs 25,000 + 20,000=40%
= 45,000. x 100 =Rs, 1,12,50040
d) Profit when sales are Rs. 1,50,000
Profit = (sales x PN Ratio) - Fixed cost

-- Fininanciai Management -...,....,..-------i@~------ Operating Leverage ... -r--""""
40.= (1,50,000 x -) - 25,000. 100
= 60,000 - 25,000
= Rs. 35,000
e) Margin of safety at a profit of Rs. 5<5,000'.
Margin of safetyProfit
P IV Ratio
= 50,000 = Rs.l 25 00040% "
6.5 Effect (,f changes in Fixed cost:
Break - even point of a firm are is affected by the changes in fixed cost.
An Uncrease is Fieed cost results is the lercrease of break even point. The minimum quantityrequired to recover all costs rises
tl<TC'fe"Ie
~ I FL- ._-T - - - - '-,".- - - - ~ .I
F------T'----+------ ..,L- ------- r:II
II__ L_.__ C-\.

C.D.E --------r"----~-___1®~-----Acharya Nagatjuna University
In Fig 6.2 TC,[is the imitial to tal cost, TR is the to the revece and IlEO is break even quantity whenfieed cost is F,.
When fieed cost uncreased from FI to F2 the total cost carve shifted free TC, to TC2. Break evenpoint nereed to point 'B' from 'A' Break even quantity increased from BEO I to BE02
Similary, if fieed cost deereased from F2 to F, the total cost carve shifts free TC2 to TC, movery thebreak even ponto BEO, from BE02
Effect of changes in fixed costs:
A change in fixed costs does not affect PN ratio. Other factors remaining constant" a decrease infixed costs will lower the break - even point and raise the profits. On the other hand, an increase in fixedcosts will result in a higher break - even point and lower amount of profits.
The effect of the changes in these factors can be shown with the the help of the following illustration:
Illustration 4 :
ABC Ltd has prepared the following budget estimates forthe year 2003 - 2004 :
Sales 15,~00 units
Fixed expenses Rs. 34,000
Sales Rs. 1,50,000
Variable costs Rs. 6 per unit
You are required to :
i) find out the PN Ratio, break - even point and margin of safety.
ii) Show the effect of increase in fieed cost by Rs 6000 bre~k - even point and margin of safety:
Solution:i) When the F =Rs 34,000
Sales Rs. 1,50,000
Less Variable cost (15000 x Rs6) 90,000
Contribution
Rs
Price per unit 10
Legs Varable cost per unit : 6
Cantribution -per unit 4
60,000
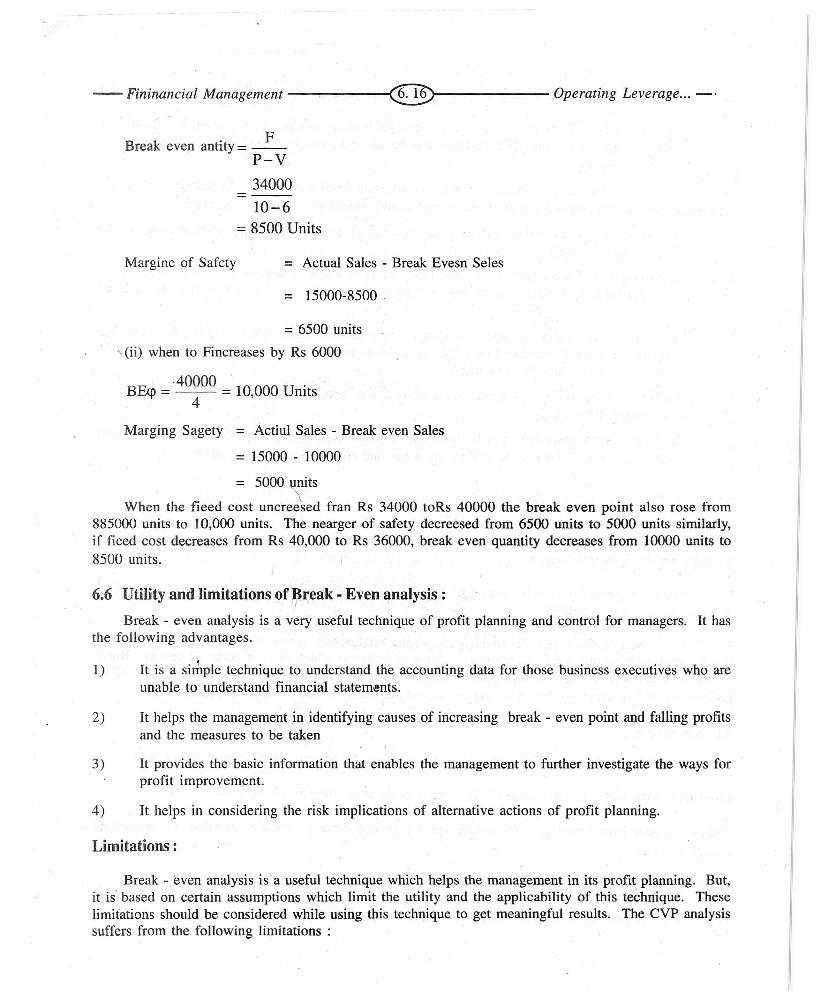
-- Fininancial Management -----~@------- Operating Leverage ... -,
Break even antity e _F_P-V3400010-6
= 8500 Units
Margine of Safety = Actual Sales - Break Evesn Seles
= 15000-8500
= 6500 units
\ (ii) when to Fincreases by Rs 6000
·40000 . .BE<p= = 10,000 Umts
4
Marging Sagety = Actiul Sales - Break even Sales
= 15000 - 10000
= 5000~ts
When the fieed cost uncreesed fran Rs 34000 toRs 40000 the break even point also rose from885000 units to 10,000 units. The nearger of safety decree sed from 6500 units to 5000 units similarly,if fieed cost decreases from Rs 40,000 to Rs 36000, break even quantity decreases from 10000 units to8500 units.
6.6 Utility-and limitations of Break - Even analysis :"
IBreak - even analysis is a very useful technique of profit planning and control for managers. It has
the following advant~ges.
1) It is a simple technique to understand the accounting data for those business executives who areunable to understand financial statements.
2) It helps the management in identifying causes of increasing break - even point and falling profitsand the measures to be taken
3) It provides the basic information that enables the management to further investigate the ways forprofit improvement.
4) It helps in considering the risk implications of alternative actions of profit planning.
Limitations:
Break - even analysis. is' a useful technique which helps the management in its profit planning. But,it is based on certain assumptions which limit the utility and the applicability of this technique. Theselimitations should be considered while using this technique to get meaningful results. The CVP analysissuffers from the following limitations :

-- C.D.E -------------<@.-------AcharyaNagarjunaUniversity-
;1) One important assumption of break - even analysis is that costs can be separated into fixed andvariable components. But this classification is not always possible. Most of the expenses belongto mixed category.
2)_ Total fixed costs do not remain constant at different level, of output'. .In practice, they areconstant over a relevant range of output and would increase in a step - wise fashion. .
3) The assumption of a constant variable cost per unit is unrealistic. Total variable costs do notchange proportionately to output. :.
4r The assumption of a constant selling price may be valid under conditions of perfect competition.But under imperfect market conditions selling price should be reduced to sell more units ofoutput.
5) The break - (" en analysis is best suited for a single product firm. But it is difficult to use thistechnique for a multi - product firm. The break - even point for a multi - product firm as a wholeis valid only if the sales mix is constant. .
6) The break - even analysis is short - term technique of profit planning and has a limited use inlong - range planning.
7) The break - even analysis is a static tool. It shows the relationship between costs, volume andprofit of afirm at a given point 'of time assuming that costs and sales to be static.
6.7 Summary:
In financial management, leverage refers to the employment of an asset or source of funds forwhich the firm pays a fixed cost or return. Leverages are of three types - operating leverage, financialleverage and composite leverage.
/ Operating leverage refers to the use of fixed costs in the operation of a firm and indicates the effectof a change in sales on EBIT.
Break - even anal7sis or CVP analysis shows the relationship between costs, volume and profit.Break - even point is that level of activity or volume of output at which there is no profit or loss. Break- even analysis is a very 'useful technique to help the management in profit planning. In spite of itslimitations, it is a very popular technique in ascertaining cost, volume and profit relationships.
6.8 Key words:
Leverage : The employment of an asset or source of funds for which a fixed cost or return paid,
Operating leverage: The existence of fixed costs in the cost structure of the firm.
Degree of operating leverage: The percentage change in operating income in response to a percentagechange in sales
Break- even point : The level of activity or output at which there is no profit or loss.
PN Ratio : A ratio between contribution and sales .. .

-- Fininancial Management ---- .•.••.--<Or------- Operating Leverage ... --
Margin of safety : The difference between total sales and break ~ even sales. It indicates the quantumof sales, the firm C~.!1afford to lose before incurring any loss.
Angle of incidence : The angle formed at break ~ even point between total sales and total cost lines. Itindicates the profit making capacity. after break ~ even point.
6.9 Self - assessment Questions:
1) What is Operating Leverage ? How does it help in magnifying earnings of a firm ?
2) What is break ~ even analysis? Explain the assumptions and limitations of the technique.
3) What is break ~ even point? How is it calculated?
. 4) What is break ~ even chart ? Explain different methods of constructing break ~ even chart.
5) Explain the following concepts?~
c) Angle of incidencea) PN Ratio b) Margin of safety
6.10 Further readiilgs
1.
2.
3.
James C. Van Horne Financial Management
Financial Management
Financial Management
Khan and Jain
Pandey I.M.
Related Documents