Lesson 12-1 Pages 606-611 Stem-and-Leaf Plots

Lesson 12-1 Pages 606-611 Stem-and-Leaf Plots. What you will learn! 1. How to display data in stem-and-leaf plots. 2. How to interpret data in stem-and-leaf.
Dec 13, 2015
Welcome message from author
This document is posted to help you gain knowledge. Please leave a comment to let me know what you think about it! Share it to your friends and learn new things together.
Transcript
Lesson 12-1 Pages 606-611
Stem-and-Leaf Plots
What you will learn!1. How to display data in stem-and-leaf plots.
2. How to interpret data in stem-and-leaf plots.
Stem-and-leaf plotStem-and-leaf plotStemsStemsLeavesLeavesBack-to-back stem-and-leaf Back-to-back stem-and-leaf plotplot
What you really need to know!
One way to organize and display data is to use a stem-and-leaf plot. In a stem-and-leaf plot, numerical data are listed in ascending or descending order.
What you really need to know!
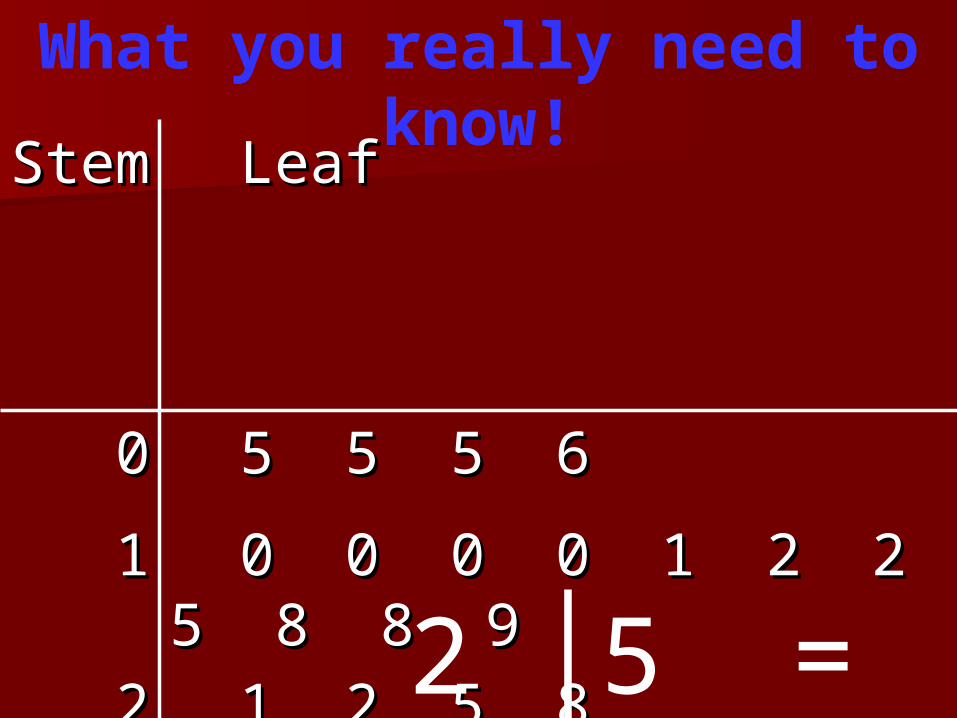
Stem Stem
LeafLeaf
00 5 5 5 65 5 5 6
11 0 0 0 0 1 2 2 5 8 8 90 0 0 0 1 2 2 5 8 8 9
22 1 2 5 81 2 5 8
33 00 2 │5 = 25


Example 1:
Display the data on the following slide in a stem-and-leaf plot.
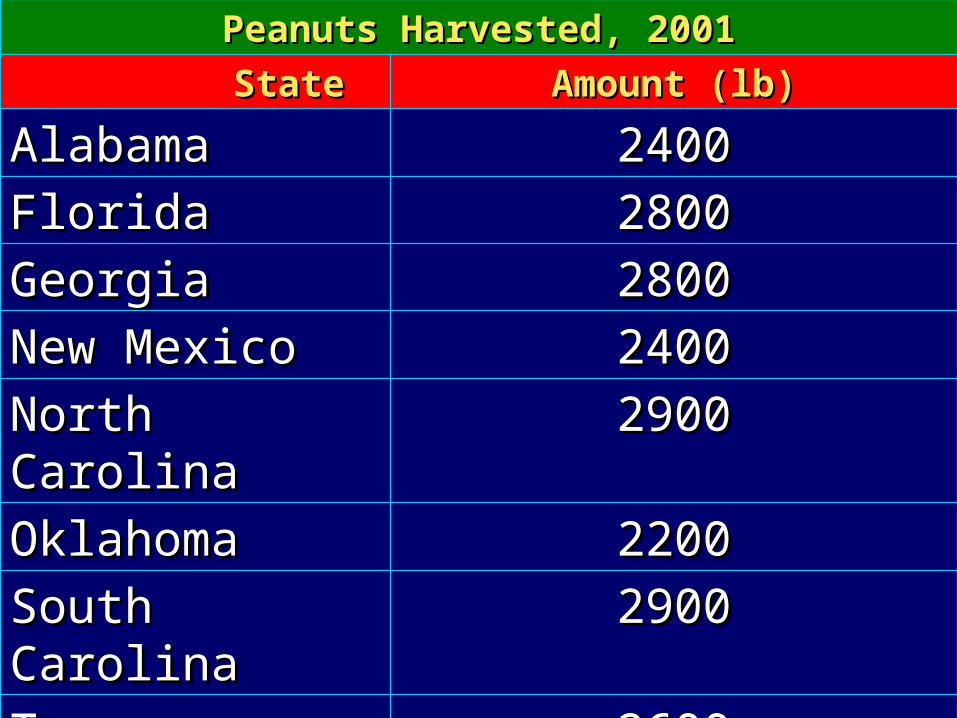
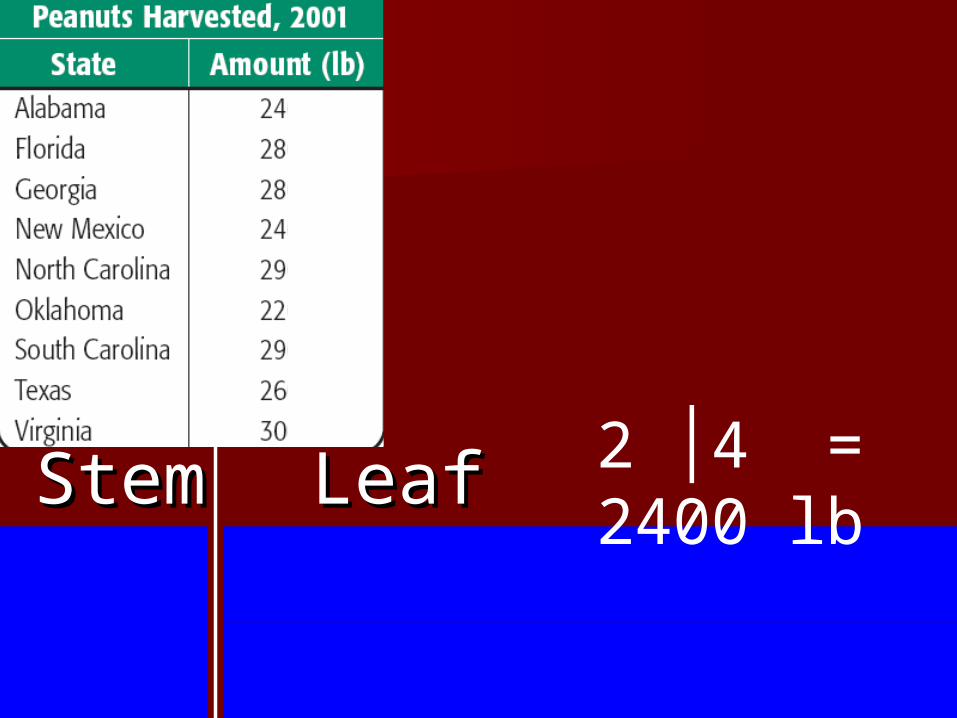
Peanuts Harvested, 2001Peanuts Harvested, 2001
StateState Amount (lb)Amount (lb)
AlabamaAlabama 24002400FloridaFlorida 28002800GeorgiaGeorgia 28002800New MexicoNew Mexico 24002400North CarolinaNorth Carolina 29002900OklahomaOklahoma 22002200South CarolinaSouth Carolina 29002900TexasTexas 26002600VirginiaVirginia 30003000
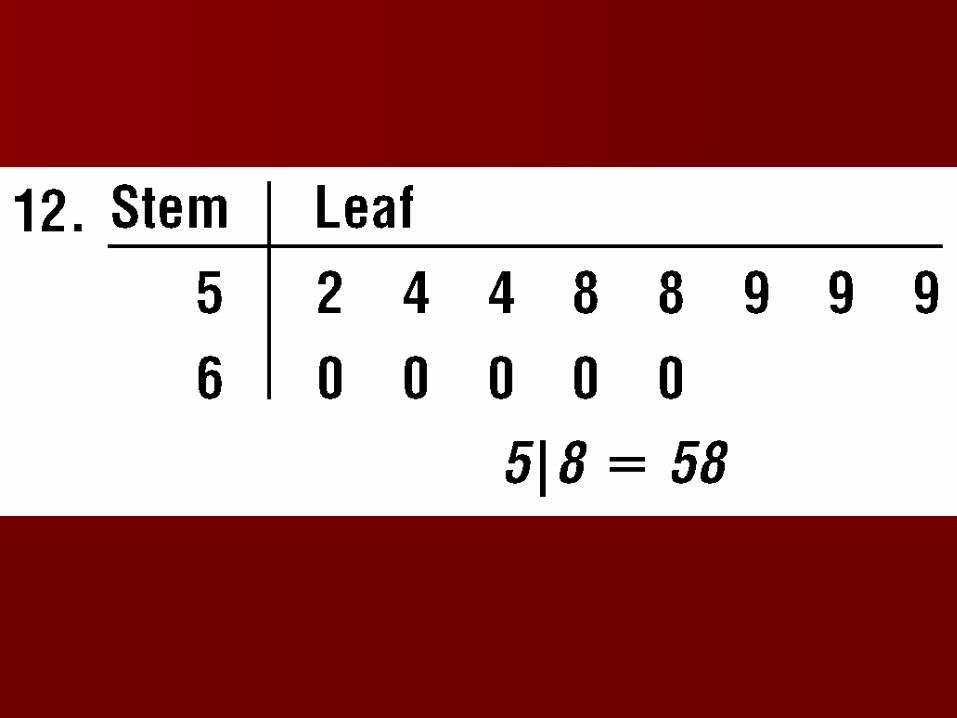
Stem Stem
LeafLeaf
22 2 4 4 6 8 8 9 92 4 4 6 8 8 9 933 00
2 │4 = 2400 lb
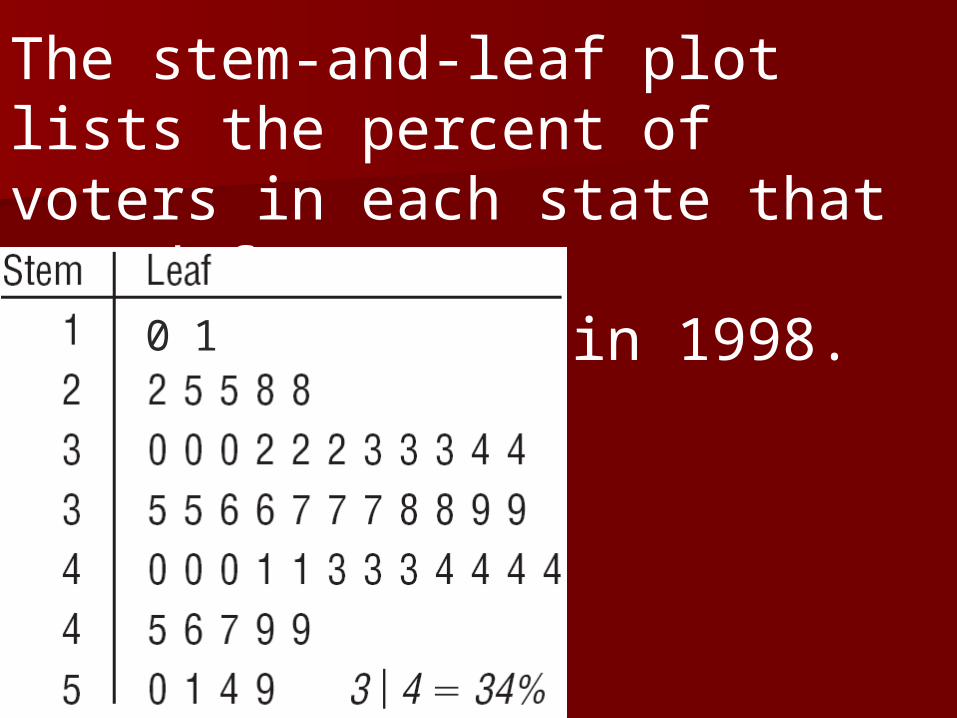
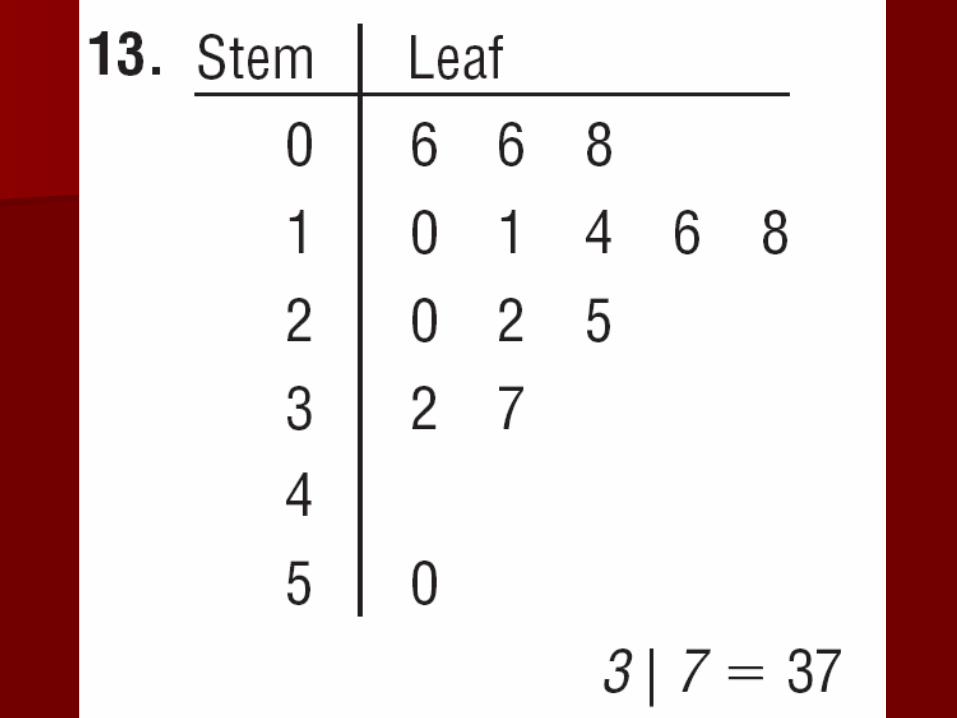
The stem-and-leaf plot lists the percent of voters in each state that voted for U.S. representatives in 1998.
0 1
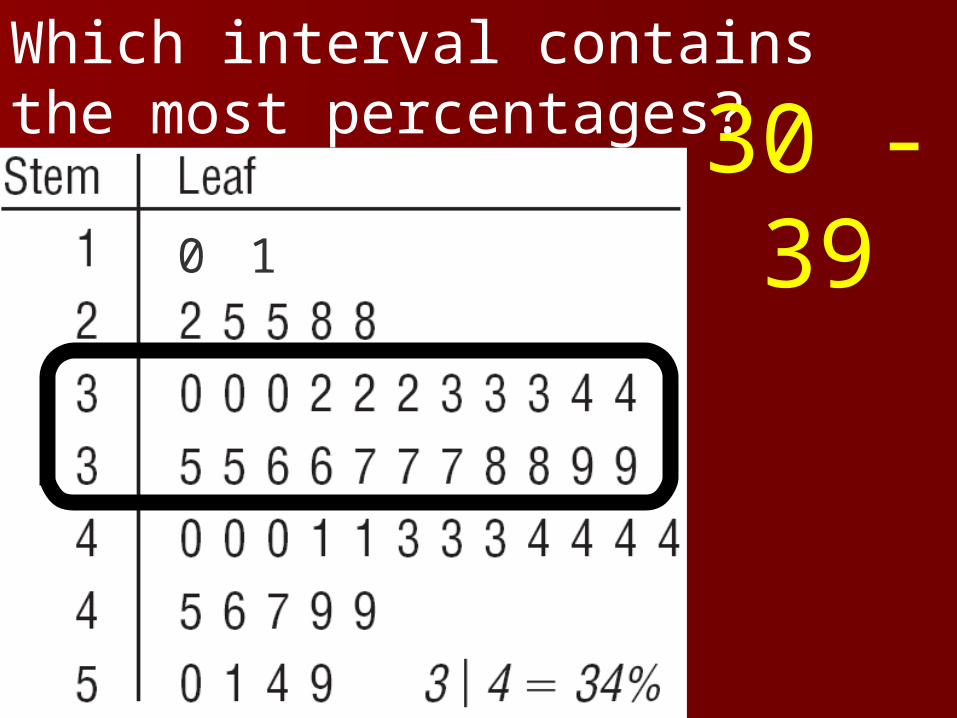
Which interval contains the most percentages? 30 -39
0 1
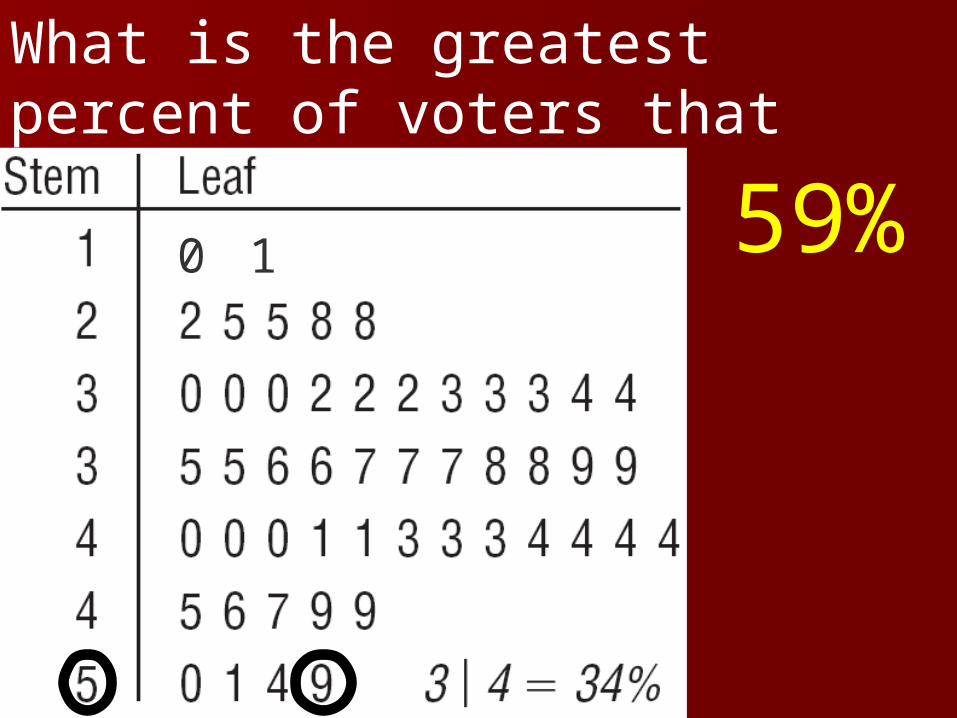
What is the greatest percent of voters that voted for U.S. representatives?
59%0 1
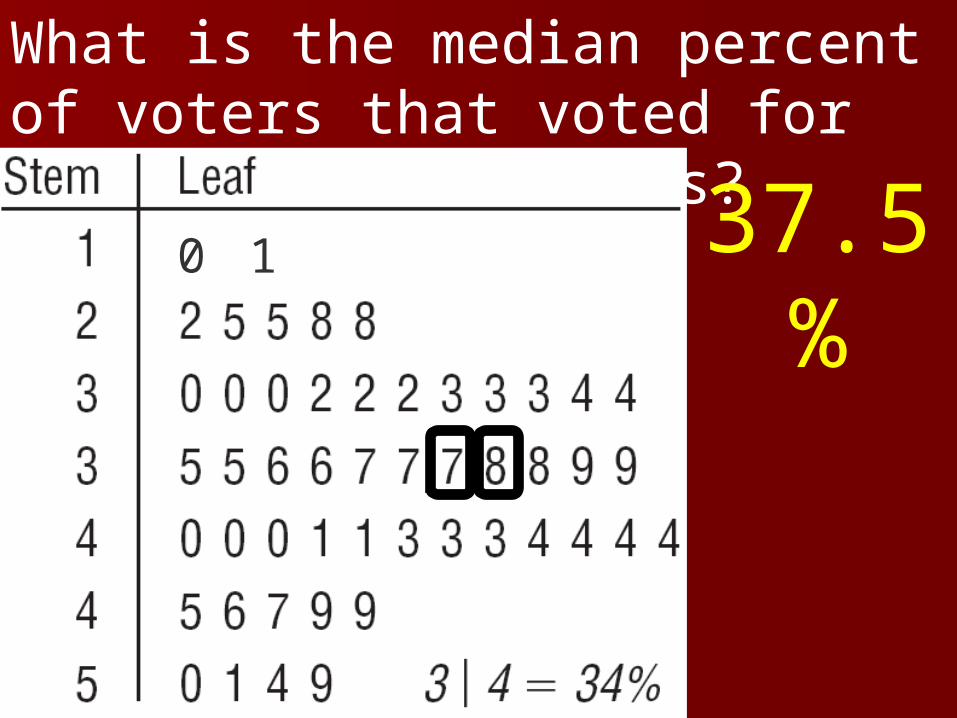
What is the median percent of voters that voted for U.S. representatives?
37.5%0 1
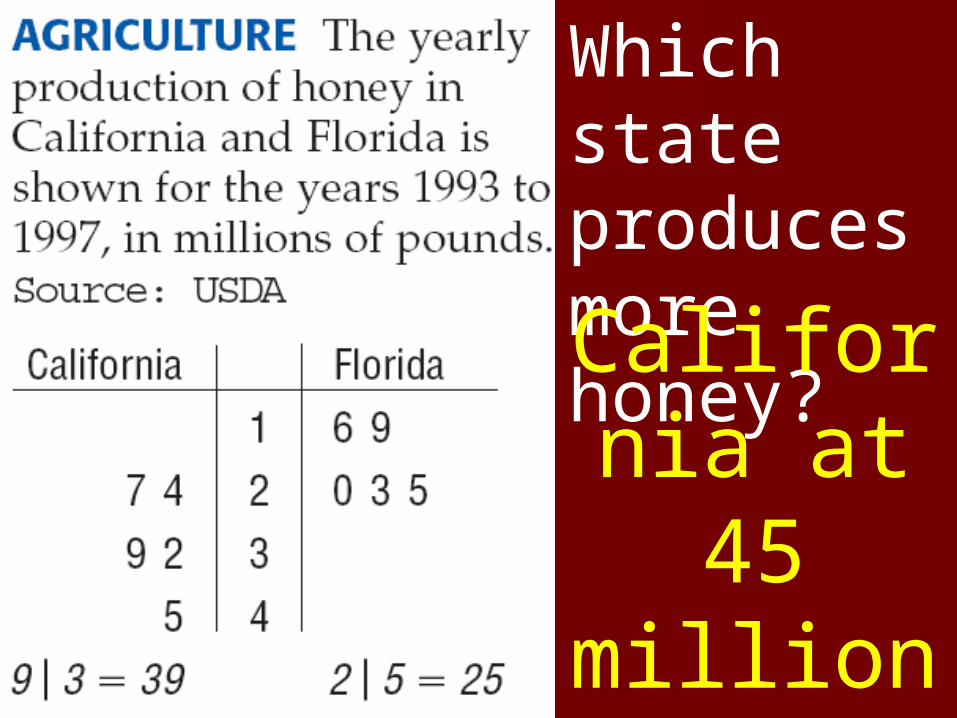
Which state produces more honey?
California at 45
million pounds.
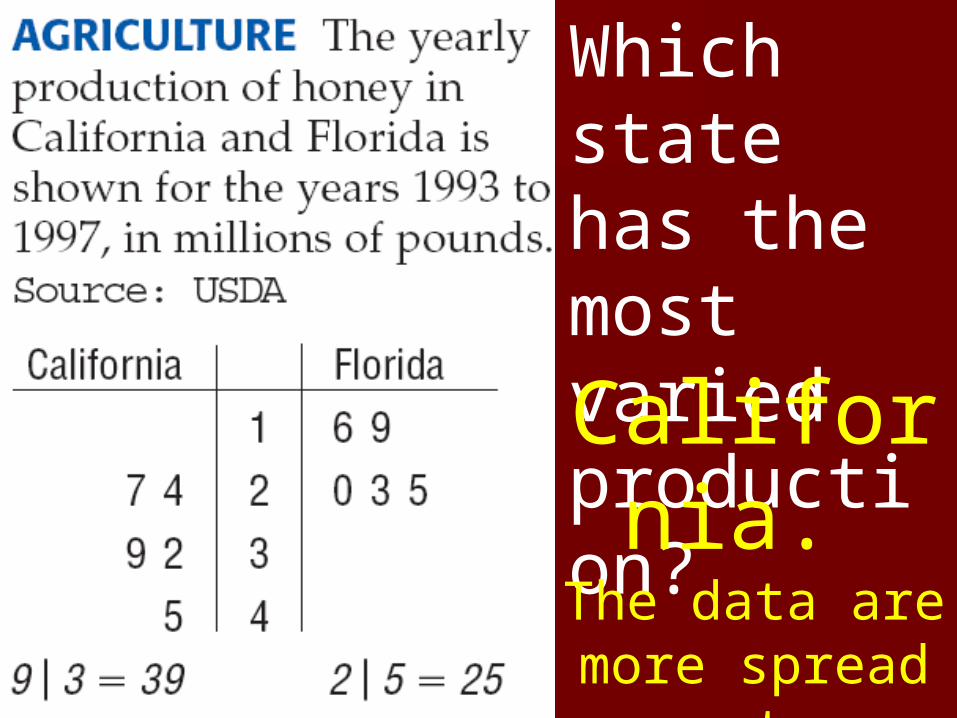
Which state has the most varied production?
California. The data are
more spread out.
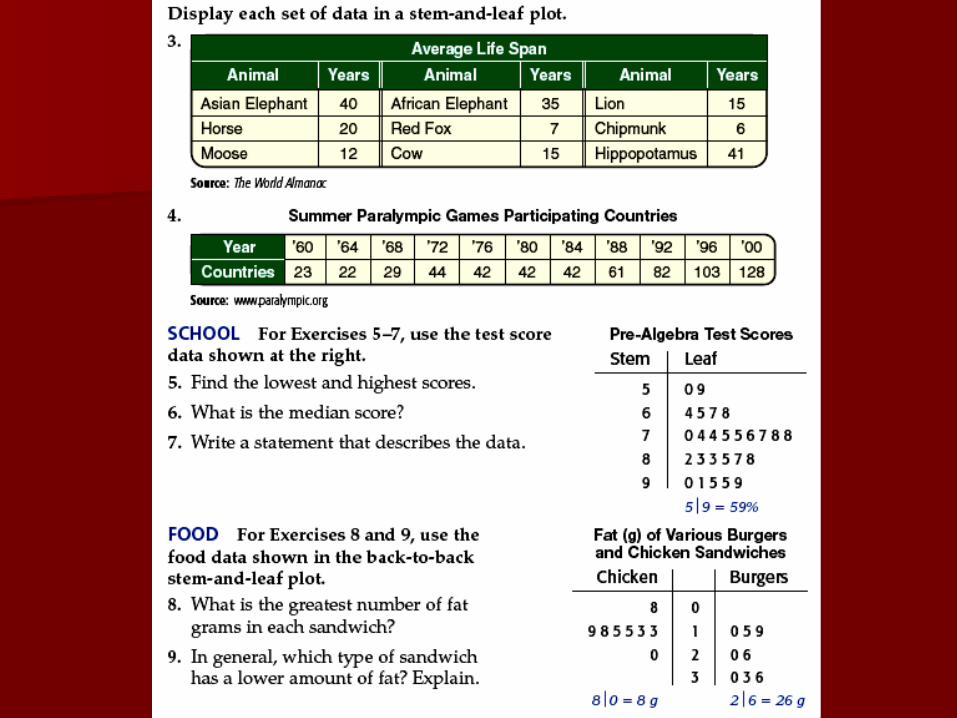
Page 608
Guided Practice
#’s 3-9

Pages 606-608 with someone at home and
study examples!
Read:
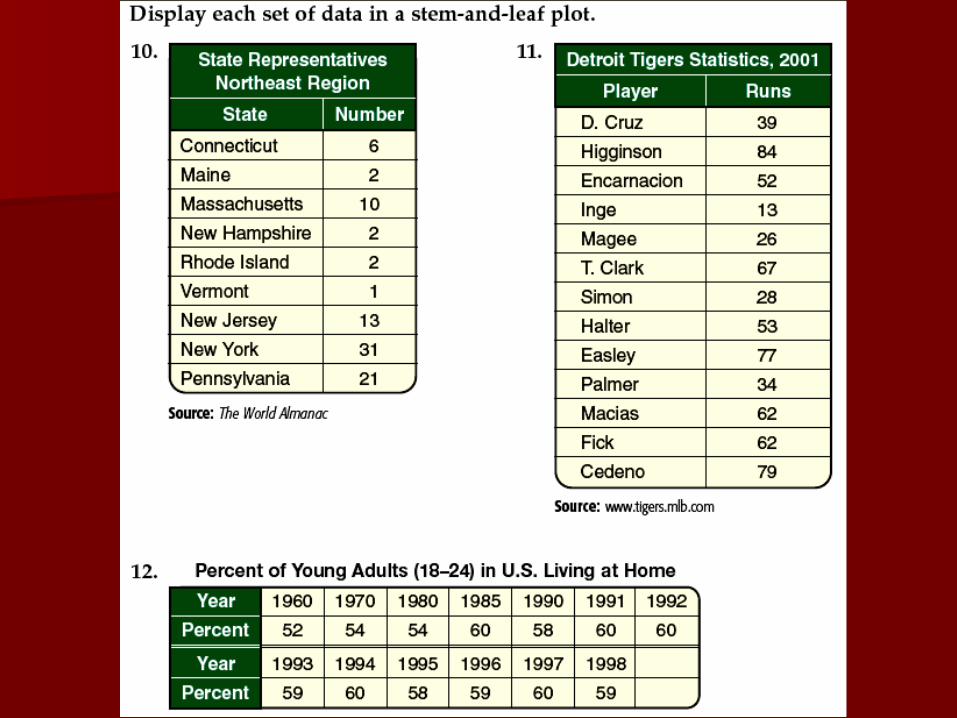
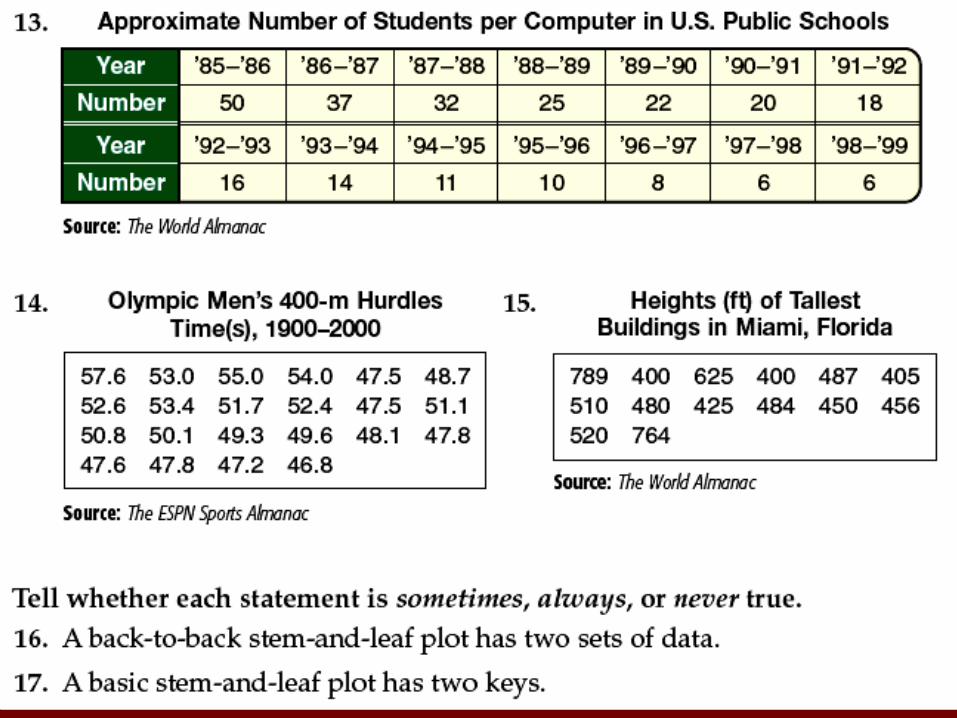
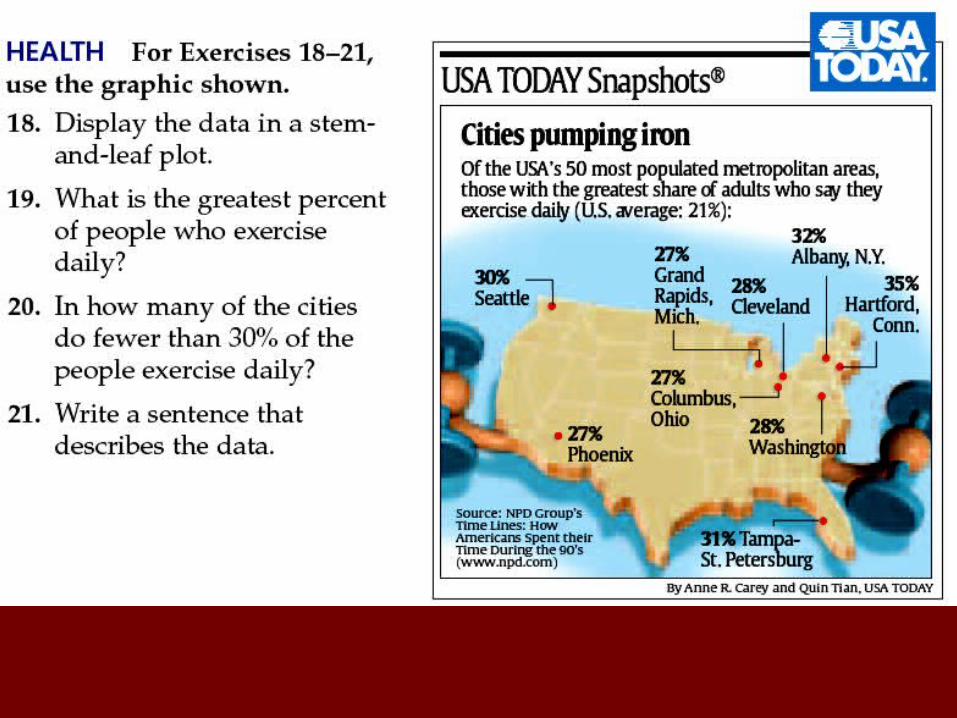
Homework: Pages 609-611
#’s 10, 12, 14, 16-24
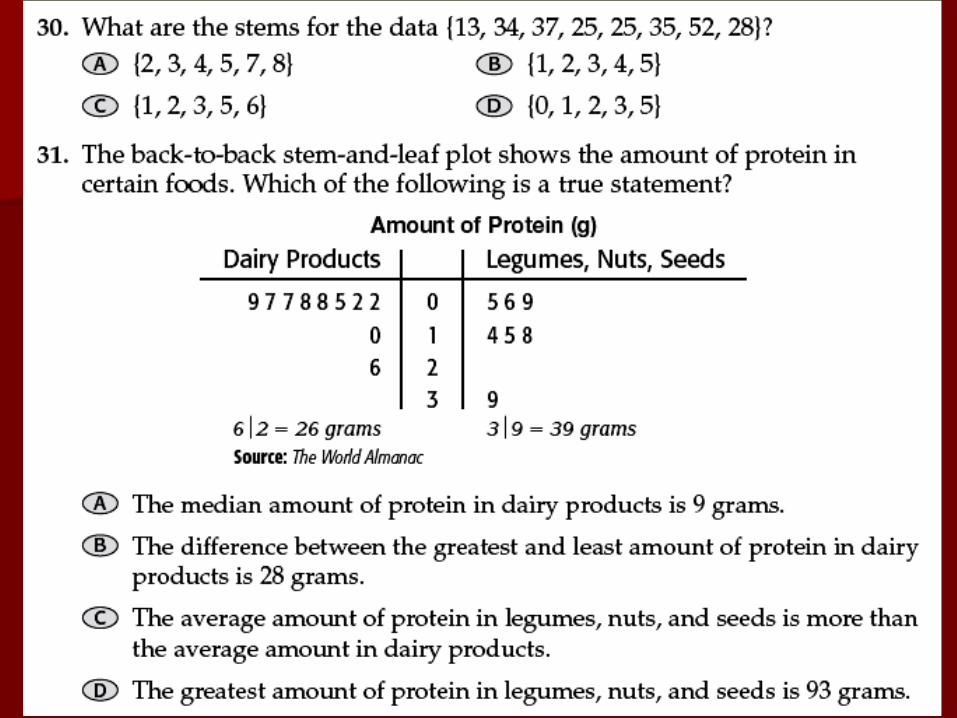
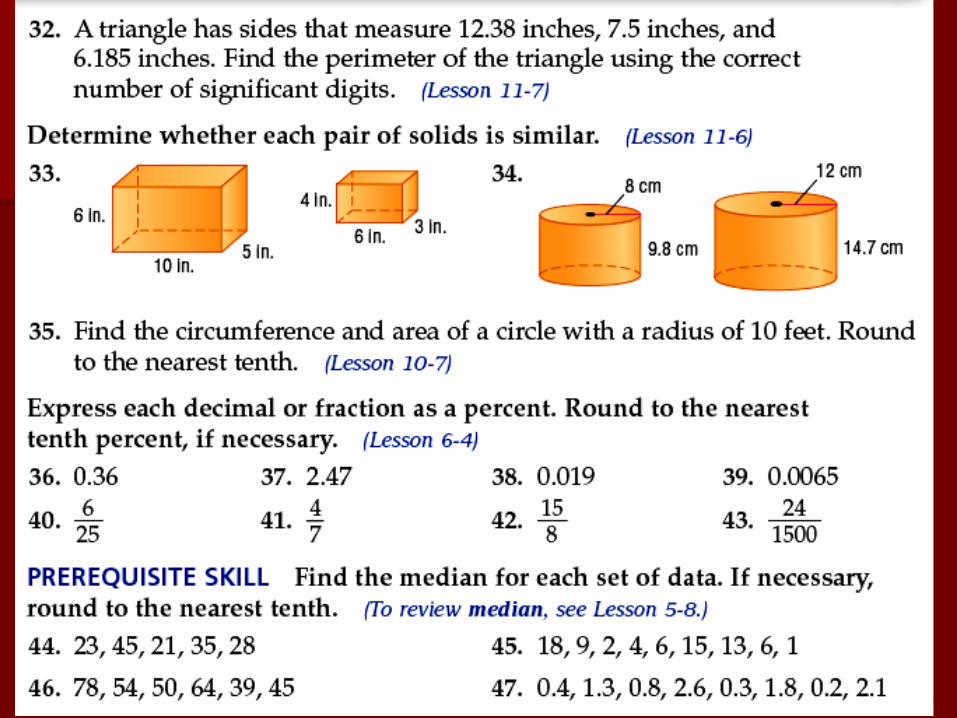
#’s 30-47
Lesson Check 12-1

Page
752
Lesson 12-1
Related Documents