13 Leptin Gene Polymorphisms and Their Phenotypic Associations T. van der Lende,* M. F. W. te Pas,* R. F. Veerkamp,* and S. C. Liefers { *Division of Animal Resources Development, Animal Sciences Group Wageningen UR 8200 AB Lelystad, The Netherlands { Animal Breeding and Genetics Group, Wageningen Institute of Animal Sciences Wageningen University, 6700 AH Wageningen, The Netherlands I. Introduction II. Structural Organization of the Leptin Gene and Leptin Protein III. Polymorphisms in the Human Leptin Gene IV. Polymorphisms in the Bovine Leptin Gene V. Polymorphisms in the Porcine Leptin Gene VI. Concluding Remarks References In an era of rapidly increasing prevalence of human obesity and associated health problems, leptin gene polymorphisms have drawn much attention in biomedical research. Leptin gene polymorphisms have furthermore drawn much attention from animal scientists for their possible roles in economically important production and reproduction traits. Of the polymorphisms reported for exonic, intronic, and promoter regions of the leptin gene, 16 have been included in association studies in humans, 19 in cattle, and 6 (all exonic or intronic) in pigs. In Vitamins and Hormones, Volume 71 0083-6729/05 $35.00 Copyright 2005, Elsevier Inc. All rights reserved. DOI: 10.1016/S0083-6729(05)71013-X 373

Welcome message from author
This document is posted to help you gain knowledge. Please leave a comment to let me know what you think about it! Share it to your friends and learn new things together.
Transcript

13
Vitamins and Hormones, Volume 71
Copyright 2005, Elsevier Inc. All rights reserve
Leptin Gene
Polymorphisms and
Their Phenotypic
Associations
T. van der Lende,* M. F. W. te Pas,*R. F. Veerkamp,* and S. C. Liefers
{
*Division of Animal Resources Development, Animal Sciences Group Wageningen UR
8200 AB Lelystad, The Netherlands{Animal Breeding and Genetics Group, Wageningen Institute of Animal Sciences
Wageningen University, 6700 AH Wageningen, The Netherlands
I.
I ntroduction0083-d. DOI: 10.1016/S0083-67373
II.
S tructural Organization of the Leptin Gene andLeptin Protein
I
II. P olymorphisms in the Human Leptin GeneI
V. P olymorphisms in the Bovine Leptin GeneV.
P olymorphisms in the Porcine Leptin GeneV
I. C oncluding RemarksR
eferencesof rapidly increasing prevalence of human ob
In an era esity andassociated health problems, leptin gene polymorphisms have drawn
much attention in biomedical research. Leptin gene polymorphisms
have furthermore drawn much attention from animal scientists for their
possible roles in economically important production and reproduction
traits. Of the polymorphisms reported for exonic, intronic, and
promoter regions of the leptin gene, 16 have been included in association
studies in humans, 19 in cattle, and 6 (all exonic or intronic) in pigs. In
6729/05 $35.0029(05)71013-X
374 van der Lende et al.
humans, associations have been found with overweight or (early‐onset)obesity, non‐insulin‐dependent diabetes mellitus, prostate cancer, and
non‐Hodgkin’s lymphoma. In cattle, associations have been found with
feed intake, milk yield traits, carcass traits, and reproduction‐relatedtraits, and in pigs with feed intake, average daily gain, carcass traits
(backfat/leanness), and reproduction performance traits. Many of the
polymorphisms were only included in a limited number of association
studies, or the phenotypes studied varied largely for a given
polymorphism between studies. Therefore, many of the associations
found for these polymorphisms need to be confirmed in future studies
before firm conclusions can be drawn. # 2005 Elsevier Inc.
I. INTRODUCTION
Leptin is a cytokine‐like hormone that is primarily synthesized and se-
creted by white adipose tissue (Masuzaki et al., 1995; Zhang et al., 1994).
Leptin produced in other tissues, for example, in the placenta (Green et al.,
1995; Hassink et al., 1997; Masuzaki et al., 1997; Senarıs et al., 1997), fundus
of the stomach (Bado et al., 1998), mammary epithelium (Chelikani et al.,
2003; Smith‐Kirwin et al., 1998), skeletal muscle (Wang et al., 1998, 1999),
and brain and pituitary (Jin et al., 2000; Morash et al., 1999; Wiesner et al.,
1999), likely acts in a paracrine/autocrine fashion at these sites (Considine,
2003). Leptin as a hormone has important functions in the regulation of
body weight (i.e., maintaining the balance between feed intake and energy
expenditure; Pelleymounter et al., 1995), reproduction (extensively reviewed
in Henson and Castracane, 2003), immune functions (Lord et al., 1998), and
bone formation and growth (Cornish et al., 2002; Hamrick et al., 2004;
Steppan et al., 2000). In an era of rapidly increasing prevalence of human
obesity and associated health problems such as, for example, non‐insulin‐dependent diabetes mellitus (NIDDM), cardiovascular disorders, and
hypertension, leptin has drawn much attention in biomedical research (see,
e.g., Peelman et al., 2004b; Rahmouni and Haynes, 2004). For completely
diVerent reasons, leptin has also drawn much attention from animal scien-
tists. In livestock production, traits such as feed intake, feed eYciency,
energy balance, fast lean growth (i.e., body composition), fertility, and
reproductive eYciency are very important for the profitability of milk and
meat production enterprises (Hossner, 1998).
The discovery in 1994 of the leptin gene and the identification of the
recessive mutations in this gene responsible for the obese phenotype and
various associated disorders in Jackson Laboratory C57BL/6J mice (Zhang
et al., 1994) and SM/Ckc‐þDAC mice (Moon and Friedman, 1997; Zhang
et al., 1994), that is, the ob allele and the ob2J allele, respectively, has
Leptin Gene Polymorphisms 375
triggered in biomedical and livestock research—for the above‐mentioned
reasons—the search for polymorphisms in the leptin gene of human and
livestock (to date, cattle and pig). More specifically, interest focused on the
possible associations of such polymorphisms with clinical traits (human) and
economically important traits (livestock). In livestock, the identification of
genetic markers that are positively associated with economically important
traits has the potential to be used in breeding programs to significantly alter
the rate of genetic improvement.
The objective of this chapter is to review the polymorphisms that have
been found in the leptin gene and its promoter region, as well as the observed
phenotypic associations of these polymorphisms, both in humans and live-
stock. Throughout this chapter, amino acid (aa) residues of leptin are
numbered according to their position in the 167‐aa leptin peptide (i.e., the
leptin peptide including a signaling peptide).
II. STRUCTURAL ORGANIZATION OF THELEPTIN GENE AND LEPTIN PROTEIN
The human leptin gene encodes a 3.5‐kb cDNA (Gong et al., 1996). The
leptin gene has three exons. The coding region is contained in exons 2 and 3,
as exon 1 is not translated. The first part of exon 2 encodes a signaling
peptide of 21 aa residues that is not represented in the mature leptin protein.
Leptin has 67% sequence identity among species such as human, gorilla,
chimpanzee, orangutan, rhesus monkey, dog, cow, pig, rat, and mouse
(Zhang et al., 1997).
To understand the regulation of leptin gene transcription, the leptin
promoter region has been isolated and characterized. To date, several im-
portant transcription factor binding domains have been identified in the
leptin‐promoter region of the human, rodent, and ruminant genes. These
include domains for CCAAT/enhancer binding proteins (Gong et al., 1996;
Hwang et al., 1996; Miller et al., 1996; Taniguchi et al., 2002), cAMP
response element‐binding protein (Gong et al., 1996), adipocyte determina-
tion diVerentiation dependent factor 1/sterol regulatory element binding
protein 1 (Kim et al., 1998), peroxisome proliferator activated receptor g(Hollenberg et al., 1997), hypoxia‐inducible factor 1 (Ambrosini et al., 2002;
Grosfeld et al., 2002; Meißner et al., 2003), SP1 (Fukuda and Iritani, 1999;
He et al., 1995; Mason et al., 1998), LP1 binding factor (Mason et al., 1998),
glucocorticoids (Gong et al., 1996), insulin (Meißner et al., 2003), and a
placental‐specific transcription factor (Bi et al., 1997). CCAAT/enhancer
binding protein is an important transcription factor for the transcription
of most genes expressed in adipose tissue and for other genes involved in
energy metabolism (Darlington et al., 1995). Several groups (Hwang et al.,
1996; Mason et al., 1998) mutated the CCAAT/enhancer binding protein site

376 van der Lende et al.
of the leptin promoter in rat and mouse and demonstrated that this site was
functional in regulating leptin gene expression.
The leptin protein has a weight of approximately 16 kD. In human and
mice, two leptin proteins, one with 167 aa residues (167 aa leptin) and
another with 166 aa residues (166 aa leptin) have been found, diVering in
the presence or absence of a glutamine residue at position þ49 (Isse et al.,
1995; Zhang et al., 1994). These two variants are not a result of allelic
variation, or the existence of two diVerent leptin loci, but the result of
alternative splicing of mRNA (Isse et al., 1995; Oberkofler et al., 1997).
Although the absence of glutamine 49 has little influence on the secondary‐structure prediction of 166 aa leptin in comparison to 167 aa leptin, a
diVerence in function can, at present, not be ruled out (Oberkofler et al.,
1997). Structure prediction algorithms and nuclear magnetic resonance
analysis of a crystalline form of leptin revealed that leptin is a protein
with a four‐alpha‐helix bundle structure (helix A, B, C, and D) that is
similar to the structure of the hemopoietic cytokine‐family (Rock et al.,
1996; Zhang et al., 1997). It shows the highest structural similarity with the
cytokines of the interleukin 6 family and granulocyte colony‐stimulating
factor (Zabeau et al., 2003). The members of the interleukin 6 family of
cytokines interact with their receptors through three diVerent binding sites—I, II and III. Leptin contains a single disulfide bond that links two
cysteines (Cys96 and Cys146) within the C and D helices, and this bond
has been proven critical for the structural integrity and stability of leptin
(Rock et al., 1996).
The inactive leptin polypeptide in ob/ob mice misses the wild‐type leptindomains distal to aa residue 104. This indicates that leptin activity may be
localized, at least in part, in these 104þ domains. To investigate this, Grasso
et al. (1997) tested six overlapping peptide amides corresponding to aa
residues 106–167 of mouse leptin [i.e., LEP‐(106–120), LEP‐(116–130),LEP‐(126–140), LEP‐(136–150), LEP‐(146–160), and LEP‐(156–167)]. Thesepeptide amides were tested for their eVects on body weight and feed intake in
female C57BL/6J mice after peripheral injection. The results indicated that
only the first three peptide amides were biologically active. This strongly
indicates that leptin activity is localized, at least in part, in domains between
aa residues 106 and 140. In an earlier study, Samson et al. (1996) found no
eVects on feeding in rats after intracerebroventricular injection of the
C‐terminal 52 aa fragment (residues 116–167). According to Grasso et al.
(1997), the discrepancy between their results and the results of Samson et al.
(1996) may be caused by the size of the peptide tested by Samson et al. (1996)
or the cyclization of the peptide used by Samson et al. (1996) to conforma-
tionally constrain the peptide. The latter may have aVected interaction with
the leptin receptor and masked the activity of a smaller region between aa
residues 116–140. Next to the aa residue 116–167 fragment of leptin, Samson

Leptin Gene Polymorphisms 377
et al. (1996) also tested the aa residue 22–56 and 57–92 fragments of leptin.
Significant, dose‐related and reversible inhibition of food intake was only
found following central administration of the aa residue 22–56 fragment.
According to the work of Imagawa et al. (1998), there are three leptin
structures that aVect the in vivo biological and in vitro receptor‐bindingactivities, being the N‐terminal aa sequence (residues 22–115), which is
essential for the biological and receptor binding activities; the C‐terminal
aa sequence (residues 116–166) with loop structure, which is important for
enhancing the activities of the N‐terminal region; and the C‐terminal disul-
fide bond, which is not needed for the activities of leptin. This conclusion
was drawn from experiments in which a mutant‐type human leptin (lacking
the C‐terminal disulfide bond), aa residues 22–115 and 115–166 were sepa-
rately injected intracerebroventricularly in C57BL/6J ob/ob mice or in vitro
incubated with coronal brain sections (autoradiography) and compared with
wild‐type leptin.Using site‐directed mutagenesis, Verploegen et al. (1997) and Peelman
et al. (2004a) studied the signaling and binding activity of diVerent leptinmutants to map the interactions between leptin and its receptor. Verploegen
et al. (1997) generated 37 human leptin mutants to study critical sites for
receptor binding and biological activity. All except four of the mutant leptins
showed similar receptor binding and biological activity as wild‐type leptin.
The Arg41Glu (designated R20Q by Verploegen et al., 1997) mutant showed
no receptor binding, whereas the Asp61Asn (D40N), Ser148Asp (S127D),
and Arg149Glu (R128Q) mutants did have normal receptor binding but
reduced, very weak, and no biological activity, respectively. These results
indicate that Arg41 (R20) is important for receptor binding and that Asp61
(D40), but especially Ser148 (S127) and Arg149 (R128), are involved in
biological activity once binding occurred. As far as Arg149Glu (R128Q) is
concerned, Brunner et al. (1999) and Raver et al. (2002) confirmed the
in vitro results of Verploegen et al. (1997). However, Brunner et al. (1999)
were unable to confirm the in vivo results of Verploegen et al. (1997). In fact,
in their study, Arg149Glu (R128Q) acted in vivo as an agonist rather than an
antagonist of leptin. In the second study, in which site‐directed mutagenesis
was used to study leptin‐receptor binding and activation, Peelman et al.
(2004a) generated and tested 31 leptin mutants. The mutations were located
within the areas of the leptin protein that resemble the binding sites I, II, and
III with which the interleukin 6 family of cytokines interact with their
receptors. Mutations in binding site I at the C‐terminus of helix D did not
aVect receptor binding but showed a modest eVect on signaling. Mutations
in binding site II at the surface of helices A and C impaired receptor binding
but had only a limited eVect on signaling. Site III mutations around the
N‐terminus of helix D impaired receptor activation without aVectingbinding to the receptor.

378 van der Lende et al.
III. POLYMORPHISMS IN THE HUMANLEPTIN GENE
The single‐nucleotide polymorphisms that have been found in the
exons and introns of the human leptin gene are summarized in Table I. Of
the 10 polymorphisms described, four showed in at least one study an
association with overweight or (early‐onset) obesity [i.e., G(19)A, Gln25Gln,
Arg105Trp, and �133].
The G(19)A polymorphism, located in the untranslated exon 1, was first
described by Hager et al. (1998). In only one of the six studies investigating
the association of this polymorphism with obesity or overweight, such an
association was actually found (Table I; Li et al., 1999). In two recent
studies, associations of this polymorphism with glucose homeostasis in
response to regular exercise and risk for non‐Hodgkin’s lymphoma have
been found (Lakka et al., 2004; and Skibola et al., 2004, respectively). Serum
leptin levels were available in three studies, but only Hager et al. (1998)
found an association with the G(19)A polymorphism. After correction for
body mass index (BMI), obese subjects homozygous for the G‐allele showedsignificantly lower leptin concentrations compared to obese subjects either
heterozygous or homozygous for the A‐allele.The Gln25Gln polymorphism, caused by a silent A‐to‐G mutation, was
first described by MaVei et al. (1996). It was found in one heterozygous
subject out of 105 mainly obese subjects with various ethnic backgrounds.
The very low frequency of the mutation was confirmed by Shigemoto et al.
(1997), who found only one heterozygous subject among 84 obese Japanese
subjects (60 NIDDM subjects and 24 subjects with impaired glucose toler-
ance). A significant association of this mutation with morbid obesity has
more recently been reported by Ohshiro et al. (2000). In 53 morbidly obese
Japanese subjects, the frequency of the G allele was 0.09, whereas in 132
nonobese control subjects, the frequency of this allele was only 0.01 (i.e.,
slightly higher than the frequency reported by MaVei et al. [1996] and
Shigemoto et al. [1997]). Of the eight obese subjects in which the mutation
was found, three men and four women were heterozygous, and one woman
was homozygous. The carriers of the mutation in the control group, three
women, were heterozygous. Because in this study no other mutations
were found in exons 2 and 3, this silent mutation could be a marker in
linkage disequilibrium with a polymorphism near the coding region of the
leptin gene that contributes to the pathogenesis of morbid obesity (Ohshiro
et al., 2000).
The Arg105Trp missense mutation was found in a highly consangui-
neous Turkish family (Strobel et al., 1998). This mutation is at the same
location as the mutation that leads to a premature stop codon in ob/ob mice.
Recently, Jiang et al. (2004) reported the absence of this mutation in 548
subjects belonging to 82 white families, selected from the National Heart,

TABLE I. Single‐Nucleotide Polymorphisms in the Exonic and Intronic Regions of the
Human Leptin Gene and Their Phenotypic Associations
Polymorphism and
Study Population
Allele
frequency Associationsa
G(19)A
Hager et al.,
1998
395 unrelated
morbidly obese
and 121 lean,
nondiabetic
control subjects
Obese: G: 0.67,
A: 0.33; lean
controls:
G: 0.64,
A: 0.36
Morbid obesity
(N); serum
leptin levels
(Y)
Mammes et al.,
1998
117 French
Caucasians with
overweight
G: 0.62, A: 0.38 Overweight (N);
serum leptin
levels (N);
weight loss
after diet (N);
change in
serum leptin
levels in
response to
diet (N)
Karvonen et al.,
1998
141 obese Finns
and 65 control
Finns
G: 0.33, A: 0.67 Obesity (N)
Li et al., 1999 125 unrelated obese
North American
(NA) women and
86 average weight
NA women
Obese: G: 0.63,
A: 0.37; normal
weight: G: 0.75,
A: 0.25
Extreme obesity
(Y); degree of
obesity (Y)
Lucantoni et al.,
2000
205 obese and 61
normal weight
Italians
Obese: G: 0.64,
A: 0.36; normal
weight: G: 0.62,
A: 0.38
Obesity (N);
serum leptin
levels (N)
Mattevi et al.,
2002
336 nondiabetic
Brazilians of
European descent
Overweight or
obese: G: 0.61,
A: 0.39; normal
weight: G: 0.63,
A: 0.37
Overweight plus
obesity (N)
Lakka et al.,
2004
397 nondiabetic
Whites and 143
nondiabetic Blacks
(HERITAGE family
study)
Whites: G: 0.58,
A: 0.42; Blacks:
G: 0.59, A: 0.41
Glucose
homeostasis in
response to
regular
exercise (Yb)
Skibola et al.,
2004
376 Non‐Hodgkin’s
lymphoma (NHL)
patients and 805
controls
NHL: G: 0.68,
A: 0.32; control:
G: 0.64, A: 0.36
Risk for non‐Hodgkin’s
lymphoma (Y)
(Continues )
Leptin Gene Polymorphisms 379

Phe17Leu [T(49)C]
Echwald et al.,
1997
156 Caucasians with
juvenile‐onsetobesity and 380
healthy young
Caucasians
Phe: 0.999;
Leu: 0.001
Juvenile‐onsetobesity (N)
Gln25Gln [A(75)G]
MaVei et al.,
1996
105 subjects
(majority obese)
with diverse ethnic
backgrounds
A: 0.995; G: 0.005 —
Shigemoto et al.,
1997
84 obese Japanese
[60 with non‐insulin‐dependent diabetes
mellitus (NIDDM)
and 24 with impaired
glucose tolerance]
A: 0.994; G: 0.006 —
Ohshiro et al.,
2000
53 morbidly obese
Japanese and 132
nonobese control
subjects
Morbidly obese:
A: 0.91, G: 0.09;
nonobese:
A: 0.99, G: 0.01
Morbid
obesity (Y)
C(102)A (Leu34Leu)
Mentioned by
Ohshiro et al., 2000
— — —
Ile45Val [A(133)G]
Onions et al., 1998 103 hypertensive
sibships from 73
families (167 African
American individuals)
Ile: 0.997;
Val: 0.003
Essential
hypertension
(N)
G(144)A (Thr48Thr)
Karvonen et al., 1998 200 obese Finns G: 0.997, A: 0.003 —
Val94Met [G(280)A]
Considine et al., 1996 68 obese and 38
lean subjects
Val: 0.995;
Met: 0.005
Obesity (N)
Arg105Trp [C(313)G]
Strobel et al., 1998 A highly
consanguineous
Turkish family
— Morbid obesity
(Y); gonad
development
(Y)
Val110Met [G(328)A]
Echwald et al.,
1997
156 Caucasians with
juvenile‐onsetobesity and 380
healthy young
Caucasians
Val: 0.9991;
Met: 0.0009
Juvenile‐onsetobesity (N)
TABLE I. (Continued )
Polymorphism and
Study Population
Allele
frequency Associationsa
380 van der Lende et al.

Karvonen et al.,
1998
200 obese Finns Val: 0.9991;
Met: 0,0009
Obesity (N)
�133 (deletion of
glycine of the
normal
codon 133)
Farooqi et al., 1998;
Montague et al.,
1997
Two severely obese
children and
unaVected family
members from a
highly
consanguineous
pedigree
— Severe early
onset obesity
(Y)
Basepair counting according to gi38174529whereATGat location 56 is noted as start site¼ 1.aAssociations studied; (Y) ¼ association was found, (N) ¼ association was not found.
bThe association was only found within carriers of a specific mutation in the leptin receptor
gene (see text).
TABLE I. (Continued )
Polymorphism and
Study Population
Allele
frequency Associationsa
Leptin Gene Polymorphisms 381
Lung and Blood Institute Family Heart Study. This strongly indicates that
the Arg105Trp mutation is exceedingly rare in the general population. The
members of the Turkish family who were homozygous for this mutation
were morbidly obese and markedly hyperphagic, and had lower serum leptin
levels than normal family members. The adult homozygous family mem-
bers all had clinical signs of hypogonadism (Ozata et al., 1999; Strobel
et al., 1998; for serum leptin levels, see also Lahlou et al., 2002), indicating
that leptin may be a necessary signal for initiation of human puberty
(Strobel et al., 1998). Within this family, four living family members were
found who were homozygous for this mutation (one adult man, two adult
women and one child). However, in total, 11 individuals with the obese
phenotype were born within this family, and even though they were all
brought up under essentially the same overall conditions and environ-
ment and received similar medical care, seven died in childhood during the
course of infections (Ozata et al., 1999). In vitro cell culture studies with
transfected COS cells have indicated a defective secretion of the mutant
leptin protein (Strobel et al., 1998). This was confirmed by Rau et al.
(1999), using transfected Chinese hamster ovary cells. The mutant leptin
accumulated intracellularly. The destiny of this accumulated leptin is still
unknown.
The �133 frameshift mutation (glycine deletion) was found in two sev-
erely obese children belonging to a highly consanguineous Pakistani family.
382 van der Lende et al.
Both children were homozygous for the mutation and had extremely low
serum leptin levels. Both had a normal birth weight but rapidly became
obese as a result of marked hyperphagia with impaired satiety (Montague
et al., 1997; see also Farooqi et al., 1998). In a study including 366 extremely
obese German children and adolescents (BMI > 99th BMI percentile; mean
BMI 32.5 � 5.9) Hinney et al. (1997) were unable to find a single carrier of
this mutation. The �133 frameshift mutation encodes a truncated leptin
polypeptide (�133 leptin) of 121 aa residues. Preliminary data indicated a
defect in the secretion of �133 leptin, explaining the very low serum leptin
levels in the children homozygous for this mutation (Montague et al., 1997).
In more elaborate transfection studies, using Chinese hamster ovary and
monkey kidney epithelium cells, Rau et al. (1999) established that only the
wild‐type leptin was secreted, but not �133 leptin. As a result of misfolding/
aggregation, �133 leptin accumulates intracellularly and is subsequently
degraded by the proteasome. Cotransfection experiments have shown that
the secretion of wild‐type leptin is not interfered with by �133 leptin (Rau
et al., 1999).
The polymorphisms that have been found in the promoter region of the
human leptin gene are summarized in Table II. Of the eight polymorphisms
described, four showed at least in one study an association with overweight
or (early‐onset) obesity [i.e., G(�2548)A, C(�1823)A/T, C(�633)T, and
C(�188)A]. The G(�2548)A mutation was first described by Mammes
et al. (1998), although at that time it was wrongly designated C(�2549)A
(see Mammes et al., 2000). The incorrect designation was also used by
Flehmig (1999), Le StunV et al. (2000) and Ren et al. (2004). As can be seen
from Table 2, this polymorphism has been included in 12 association studies
that included diverging traits. The frequency of the G allele in all studied
groups was approximately equal to or higher than that of the A allele (range,
0.49–0.75; Table II). An association of this polymorphism with overweight
or obesity has been found by Li et al. (1999), Mammes et al. (2000), and
Niet ers et al . (2000 ), but not by Ma mme s et al . (1998), Fleh mig (1999), Le
StunV et al. (2000), or Yiannakouris et al. (2003). Zhang et al. (2003) did not
find an association of this polymorphism with baseline weight indicators
(BMI, abdominal subcutaneous fat and intraabdominal fat), but they did
find associations with antipsychotic agent–induced weight gain and abdomi-
nal subcutaneous fat deposition during 10 weeks of treatment. In 6 of the 12
studies included in Table II (HoVstedt et al., 2002; Le StunV et al., 2000;
Mammes et al., 1998, 2000; Ren et al., 2004; Yiannakouris et al., 2003), the
association of circulating leptin levels and theG(�2548)A polymorphismwas
studied and actually found. It should be noted, however, that Mammes et al.
(2000) found this association only in men and that Yiannakouris et al. (2003),
who studied both total plasma leptin and free plasma leptin, only found an
association with free plasma leptin levels, and in this case only in women.
Until now, the association of the G(�2548)A polymorphism with NIDDM

TABLE II. Polymorphisms in the Promoter Region of the Human Leptin Gene and Their Phenotypic Associations
Polymorphism and Study Population Allele frequency Associationsa
G(�2548)Ab
Mammes et al., 1998 117 French Caucasians
with overweight
G: 0.56, A: 0.44 Overweight (N); serum leptin levels (Y);
weight loss after diet (Y in women);
change in serum leptin levels in response
to diet (N)
Li et al., 1999 125 unrelated extreme obese
North American (NA)
women and 86 average‐weightNA women
Obese: G: 0.65, A: 0.35;
normal weight: G: 0.49,
A: 0.51
Extreme obesity (Y); degree of obesity (N)
Flehmig, 1999 300 overweight subjects G: 0.55, A: 0.45 Weight (N); absolute and relative fat mass (N);
body mass index (N); diet‐induced changes in
weight, fat mass, and body mass index (N)
Mammes et al., 2000 109 overweight and 314
normal‐weight unrelatedsubjects from the Nancy
area in France
Overweight: G: 0.64,
A: 0.36; normal weight:
G: 0.54, A: 0.46
Overweight (Y); serum leptin levels (Y in men)
Le StunV et al., 2000 Cohort I: 140 Caucasian obese
girls; cohort II: 93 Caucasian
obese girls; controls: 116 lean
Caucasian adults
Cohort I: G: 0.51,
A: 0.49; cohort II:
G: 0.61, A: 0.39;
controls: G: 0.49,
A: 0.51
Obesity (N); serum leptin levels (Y); relationship
between serum leptin and BMI (Y)
HoVstedt et al., 2002 39 nonobese female subjects G: 0.49, A: 0.51 Serum leptin levels (Y); adipose tisuue leptin
secretion rate (Y); adipose tissue
leptin mRNA levels (Y)
Nieters et al., 2002 154 obese and 154 control subjects,
randomly selected from the
EPIC‐Heidelberg study
Obese: G: 0.49, A: 0.51;
controls: G: 0.57, A: 0.43
Obesity (Y)
(Continues )
383

Yiann ouris
et a 2003
118 healthy Greek high‐schoolstudents
G: 0.53, A: 0.47 Overweight (N); plasma leptin levels (N);
plasma free leptin levels (Y in women);
Zhan t al., 2003 128 Chinese Han untreated patients
with schizophrenia and 38 age‐and gender‐matched controls
Not given Baseline weight indicators (N); antipsychotic
agent–induced weight gain (Y); antipsychotic
agent–induced abdominal fat deposition (Y)
Ren e al., 2004 269 non‐insulin‐dependent diabetesmellitus (NIDDM) patients;
135 first‐degree relatives (nondiabetic);
85 healthy unrelated controls
NIDDM: G: 0.6 A: 0.35;
relatives: G: 0 1,
A: 0.29; Unre ted
controls: G: 0 5, A: 0.25
NIDDM (Y); fasting serum leptin levels (Y);
fasting insulin levels (Y); insulin
resistance (Y)
Ribei et al., 2004 150 prostate cancer (PC) patients and
118 healthy controls
PC patients G: 2, A: 0.48
Healthy contr s G: 0.64,
A: 0.36
Susceptibility to PC (Y); risk of advanced
disease (Y)
Skibo et al., 2004 376 non‐Hodgkin’s lymphoma (NHL)
patients and 805 controls
NHL: G: 0.54, 0.46;
control: G: 0. , A: 0.44
Risk for NHL (Yc )
T(�243
Mam `s et al., 1998 117 French Caucasians with
overweight
T: 0.99, G: 0.01 Overweight (N); serum leptin levels (N);
weight loss after diet (N); change in serum
leptin levels in response to diet (N)
T(�196
Li et , 1999 125 unrelated obese North
American (NA) women and
86 average‐weight NA women
Obese: T: 0.91, 0.09;
normal weigh T: 0.87,
C: 0.13
Extreme obesity (N); degree of obesity (N)
C(–1887
Mam `s et al., 1998 117 French Caucasians with
overweight
C: 0.91, T: 0.09 Overweight (N); serum leptin levels (N);
weight loss after diet (N); change in serum
leptin levels in response to diet (Y in men)
TABL II. (Continued )
Polymo hism and Study Population Allele frequency Associationsa
384
ak
l.,
g e
t
ro
la
7)G
me
3)C
al.
)T
me
E
rp
5,
.7
la
.7
0.5
ol
A:
56
C:
t:

C(�1823)A/T
Mammes et al., 1998 117 French Caucasians with
overweight
C: 0.86, A: 0.14 Overweight (N); serum leptin levels (N);
weight loss after diet (N); change in serum
leptin levels in response to diet (N)
Li et al., 1999 125 unrelated obese NA women and
86 average‐weight NA women
Obese: C: 0.83, T: 0.17;
average weight: C: 0.92,
T: 0.08
Extreme obesity (Y); degree of obesity (N)
G(�1387)A
Mammes et al., 1998 117 French Caucasians with
overweight
G: 0.59, A: 0.41 overweight (N); serum leptin levels (N);
weight loss after diet (N); change in
serum leptin levels in response to diet (N)
C(�633)T
Mammes et al., 1998 117 French Caucasians with
overweight
C: 0.93; T: 0.07 Overweight (N); serum leptin levels (N);
weight loss after diet (N); change in serum
leptin levels in response to diet (N)
Li et al., 1999 125 unrelated obese NA women and
86 average weight NA women
Obese: C: 0.94, T: 0.06;
normal weight: C: 0.94,
T: 0.06
Extreme obesity (N); degree of obesity (Y)
C(�188)A
Oksanen et al., 1997 249 morbidly obese and 141 lean
control Finns
Morbidly obese: C: 0.94,
A: 0.06; lean: C: 0.91,
A: 0.09
Obesity (N); serum leptin levels (N)
Mammes et al., 1998 117 French Caucasians with
overweight
C: 0.94, A: 0.06 Overweight (N); serum leptin levels (N);
weight loss after diet (N); change in serum
leptin levels in response to diet (N)
Li et al., 1999 125 unrelated obese NA women and
86 average‐weight NA women
Obese: C: 0.93, A: 0.07;
normal weight: C: 0.94,
A: 0.06
Extreme obesity (N); degree of obesity (Y)
Yiannakouris
et al., 2003
118 healthy Greek high‐schoolstudents
C: 0.96, A: 0.04 Overweight (N); plasma leptin levels (N)
aAssociations studied; (Y) ¼ association was found, (N) ¼ association was not found.
bIn Mammes et al. (1998) wrongly designated as C(�2549)A, as indicated by Mammes et al. (2000). Note that Flehmig (1999), Le StunV et al. (2000),
and Ren et al. (2004) studied the same polymorphism and also used the designation C(�2549)A.cThe association was only found within carriers of a specific mutation in the leptin receptor gene (see text).
385

386 van der Lende et al.
has only been studied by Ren et al. (2004). The frequency of the A allele was
found to be significantly higher in the NIDDM patients than in unrelated
normal control subjects (0.35 vs. 0.25, respectively). Next to an association
with fasting serum leptin levels, an association was also found with fasting
insulin levels and insulin resistance. With the increasing evidence that high
leptin levels are associated with immune dysfunction, the interest for associa-
tions between leptin gene polymorphisms and disease has increased. Recent
studies by Ribeiro et al. (2004) and Skibola et al. (2004) (Table II) have shown
an association between theG(-2548)A polymorphism and the susceptibility to
prostate cancer and the risk for non‐Hodgkin lymphoma, respectively. In the
study of Ribeiro et al. (2004), there was, moreover, an association with the
risk of developing advanced prostate cancer.
Association of each of the three polymorphisms C(�1823)A/T, C(�633)T,
and C(�188)A with extreme obesity has been found in a study by Li et al.
(1999). Their results are in contrast to the results of Mammes et al. (1998) (all
three polymorphisms) and Oksanen et al. (1997), as well as Yiannakouris
et al. (2003) [only C(�188)A], who found no associations with overweight or
obesity (Table II). Functional analysis of the C(�188)A polymorphism was
reported by Oksanen et al. (1998). Reporter‐gene constructs were used to
study the transcriptional activity of the leptin promoter driven by wild‐type(�188C) and variant (�188A) proximal promoter regions in 3T3‐L1 cells. No
diVerences were found for preadipocytes or for adipocytes. According to
these authors, their results do not exclude subtle eVects of this polymorphism
on leptin expression under more physiological conditions.
A few polymorphisms in the 3’ untranslated region of the human leptin
gene have been reported and were included in association studies. The results
of these studies are summarized in Table III. Of the three polymorphisms
included, only the tetranucleotide repeat showed an association with obesity
(in one out of the five studies that included this trait) and an association with
essential hypertension (only included in one study). This multiallelic tetra-
nucleotide repeat was first identified by Shinatani et al. (1996). In three of the
five studies in which the polymorphism was used, the 15 alleles found in each
of these studies had a length of either 121–145 base pairs (n ¼ 7) or 197–225
base pairs (n ¼ 8) and were referred to as class I and class II alleles,
respectively (De Silva et al., 1999; Shintani et al., 1996, 2002). In these
studies, individuals were grouped into three groups, depending on the length
of their alleles, with subjects homozygous for the shorter alleles designated
genotype I/I, subjects with both the shorter and the longer alleles designated
genotype I/II, and subjects homozygous for the longer alleles designated
genotype II/II. McGarvey et al. (2002) found 16 alleles, 5 with a length of
150–170 base pairs and 9 with a length of 218–250 base pairs. As can be seen
from Table III, McGarvey et al. (2002) found an association between this
polymorphism and obesity, this in contrast to Shintani et al. (1996), De Silva
et al. (1999), and Shintani et al. (2002). The frequency of individuals with

TABLE III. Polymorphisms in the 3’ Untranslated Region of the Human Leptin Gene and
Their Phenotypic Associations
Polymorphism and
Study Population Allele frequency Associationsa
C(538)T (33 bp
downstream from
stop codon)
Karvonen
et al., 1998
200 obese Finns
and 65 control
Finns
C: 0.98,
T: 0.02
Obesity (N)
A ! G (noncoding
region at base
number 9 downstream
from the stop codon)
Echwald et al., 1997 156 Caucasians
with juvenile‐onsetobesity and 380
healthy young
Caucasians
A: 0.9991;
G: 0.0009
Juvenile‐onsetobesity (N)
Tetranucleotide
repeat at the 3’
untranslated region
Shintani et al., 1996 69 unrelated Japanese
subjects with
non‐insulin‐dependentdiabetes mellitus
(NIDDM) and 84
control subjects
NIDDM:
Class I: 0.30,
Class II: 0.70;
Control: Class I:
0.26, Class II:
0.74
NIDDM (N);
obesity (N);
overweight (N)
Ohman et al., 1999 105 sib pairs
concordant for
obesity from
92 families
Not given Obesity (N)
De Silva et al., 1999 232 nondiabetic
Nauruan males
Class I: 0.10;
Class II: 0.90
Obesity (N);
insulin
resistance (N)
McGarvey et al., 2002 181 unrelated
Samoans
Obese: 226, 0.04;
others: 0.96;
normal weight:
226, 0.16;
others: 0.84
Obesity (Y)
Shintani et al., 2002 205 Japanese patients
with essential
hypertension and
117 normotensive
subjects
Hypertension:
Class I, 0.29;
Class II, 0.71;
normotension:
Class I, 0.24;
Class II, 0.76
Obesity (N);
essential
hypertension
(Y); insulin
resistance (N);
serum leptin
levels (N)
aAssociations studied; (Y) ¼ association was found, (N) ¼ association was not found.
Leptin Gene Polymorphisms 387
388 van der Lende et al.
allele 226 at the leptin locus was significantly higher in the low‐BMI group
than in the high‐BMI group (0.16 vs. 0.04). Although Shintani et al. (1996)
did not find an association of this polymorphism with BMI, the researchers
did report a tendency that is in agreement with this result. In their control
subjects (subjects without NIDDM), the authors observed a nonsignificant
trend in which class II alleles (long‐base‐pair alleles) are more prevalent in
nonobese than in obese subjects (75% vs. 65%; n ¼ 148 and n ¼ 20 subjects,
respectively).
Neither Shintani et al. (1996) nor Shintani et al. (2002) found an associa-
tion of this tetranucleotide repeat polymorphism with insulin resistance, but
Shintani et al. (2002) did find an association with hypertension. The frequen-
cy of the I/I genotype was markedly higher in hypertensive than in normo-
tensive control subjects. In the same subjects, no association was found
between the polymorphism and body weight, degree of obesity, insulin
resistance, or serum leptin levels, which indicates that the association of
the polymorphism with hypertension is independent of obesity, insulin
resistance, and circulating leptin levels (Shintani et al., 2002).
IV. POLYMORPHISMS IN THE BOVINELEPTIN GENE
The polymorphisms that have been found in the exons and introns of the
bovine leptin gene are summarized in Table IV. Of the nine polymorphisms
described, four were not included in any association study, two were includ-
ed in one or two association studies, and three were included in four to six
association studies. Overall, associations have been found with feed intake
(Tyr7Phe and LEPSau3AI), milk yield traits (Arg25Cys and LEPSau3AI),
carcass (fat‐related) traits (Arg25Cys and LEPSau3AI), and reproduction‐related traits (LEPSau3AI). Because of the relatively low number of
studies and the large diversity in both breeds used and traits studied, definite
conclusions can not yet been drawn. In the only study that included plasma
leptin levels (Liefers et al., 2003), associations were actually found (Arg25Cys,
LepSau3AI, and Ala80Val). These associations were found during late
gestation, but not during lactation.
Single‐nucleotide polymorphisms in the promoter region of the bovine
leptin gene have to date only been reported by Liefers (2004). In the �1600‐to 0‐bp region of the promoter, a total of as many as 18 single‐nucleotidepolymorphisms and two deletions were found (see Table V). Of these
polymorphisms, 14 were studied in more detail (shown bold in Table V) to
establish possible associations with live weight traits, milk yield traits, feed
intake traits, energy balance during early lactation, and commencement of
ovarian activity after calving, as well as plasma leptin levels before and after
calving. Despite the close proximity between the polymorphisms, only three

TABLE IV. Polymorphisms in the Exonic and Intronic Regions of the Bovine Leptin Gene and Their Associations with Production and
Reproduction Traits
Polymorphism and Study Population Allele frequency Associationsa
C(978)Tb
Lagonigro et al., 2003 169 Charolais � Holstein
crossbred bulls
C: 0.65, T: 0.35 —
C(1001)Gc
Lagonigro et al., 2003 169 Charolais � Holstein
crossbred bulls
C: 0.35, G: 0.65 —
Tyr7Phe [A(1127)T]
Lagonigro et al., 2003 169 Charolais � Holstein
crossbred bulls
Tyr: 0.86, Phe: 0.14 Feed intake (Y); carcass fat‐related traits (N)
Arg25Cysd [C(1180)T]
Buchanan et al., 2002 60 Angus bulls; 55 Charolais
bulls; 22 Hereford bulls;
17 Simmental bulls
Angus: Arg, 0.42;
Cys, 0.58; Charolais:
Arg, 0.66; Cys, 0.34;
Hereford: Arg, 0.45;
Cys, 0.55; Simmental:
Arg, 0.68; Cys, 0.32
Carcass fat content (Y); leptin mRNA
expression (Y)
Liefers et al., 2003 323 Holstein Friesian cows Arg: 0.67; Cys: 0.33 Serum leptin during late pregnancy (Y); serum
leptin during early lactation (N)
Lagonigro et al., 2003 169 Charolais � Holstein
crossbred bulls
Arg: 0.65, Cys: 0.35 Feed intake (N); carcass fat‐related traits (N)
Buchanan et al., 2003 416 Holstein cows Arg: 0.54, Cys: 0.46 Milk yield traits (Y); milk somatic cell count linear
score (Y)
Liefers, 2004 613 Holstein Friesian cows Arg: 0.65; Cys: 0.35 Milk yield traits (N)
(Continues)
389

Nkrumah et al., 2004 26–30 steers of each of five
genetic lines (M1–M4, TX)
M1: Arg: 0.29, Cys: 71;
M2: Arg: 0.45, Cy 0.55;
M3: Arg: 0.52, Cy 0.48;
M4: Arg: 0.53, Cy 0.47;
TX: Arg: 0.58, Cy 0.42
Growth (N); feed intake (N); feed eYciency (N);
fat deposition rate (Y); body fat reserves (Y);
lean meat yield (Y); marbling (N); intermuscular
fat (N); carcass fat (N)
RFLP1, LEPSau3AI
[C(2059)T]
Pomp et al., 1997 Unrelated cattle representing
a variety of breeds
Within breeds: A‐all :
0.00– 0.82, B‐allel0.18–1.00
—
Liefers et al., 2002 613 Holstein Friesian cows C: 0.90, T: 0.10 Live weight traits (N); milk yield traits (Y); feed
intake traits (N); energy balance (N);
commencement of ovarian activity
after calving (N)
Liefers et al., 2003 323 Holstein Friesian cows C: 0.90, T: 0.10 Serum leptin during late pregnancy (Y); serum leptin
during early lactation (N)
Almeida et al., 2003 96 composite beef cows (5/8
Aberdeen Angus � 3/8 Nelore)
A‐allele 0.63 B‐allele .37 Calving interval (N); weight at first calving (Y)
Almeida et al., 2003 149 composite beef cows (5/8
Aberdeen Angus � 3/8 Nelore)
þ Allele 0.06; � alle 0.94 Calving interval (Y); weight at first calving (Y)
Oprzadek et al., 2003 145 Black‐and‐White (Friesian)
bulls
A: 0.85, B: 0.07, C: 8 Growth (N); feed intake (Y); feed conversion (N);
carcass traits (Y)
LEPHinfI [C(2797)T/G]
Lien et al., 1997 6 bulls Not given —
LEPBsaAI [G(2857)A]
Lien et al., 1997 6 bulls Not given —
TABLE IV. (Continued )
Polymorphism and Study Population Allele frequency Associationsa
390
0.
s:
s:
s:
s:
ele
e:
0
le
0.0

Almeida et al., 2003 96 composite beef cows (5/8
Aberdeen Angus � 3/8
Nelore)
0.58, 0.42 Calving interval (N); weight at first calving (N)
Ala80Vald [C(3100)T]
Haegeman et al., 2000 18–56 animals from each of
nine breeds and Belgian
Blue crossbreds
Wild type: 0.518–0.887;
mutant type: 0.113–0 82
—
Liefers et al., 2002 613 Holstein Friesain cows Ala: 0.75, Val: 0.25 Live weight traits (N); milk yield traits (N); feed
intake traits (N); energy balance (N);
commencement of ovarian activity after
calving (N)
Almeida et al., 2003 100 composite beef cows (5/8
Aberdeen Angus � 3/8 Nelore)
0.85, 0.15 Calving interval (N); weight at first calving (N)
Liefers et al., 2003 323 Holstein Friesian cows Ala: 0.67, Val: 0.33 Serum leptin during late pregnancy (Y); serum leptin
during early lactation (N)
Lagonigro et al., 2003 169 Charolais � Holstein
crossbred bulls
Ala: 0.46, Val: 0.54 Feed intake (N); carcass fat‐related traits (N)
Gln83Arg [A(3109)G]
Haegeman et al., 2000 Two Belgian Blue crossbred
animals
— —
Location of base pairs refers to Accession Number U50365.aAssociations studied; (Y) ¼ association was found, (N) ¼ association was not found.
bDesignated C(103)T by Lagonigro et al. (2003).
cDesignated C(126)G by Lagonigro et al. (2003).dReferred to as Arg4Cys and Ala59Val because 4 and 59 are the amino acid positions in e leptin protein without the 21–amino acid signaling peptide.
391
.4
th
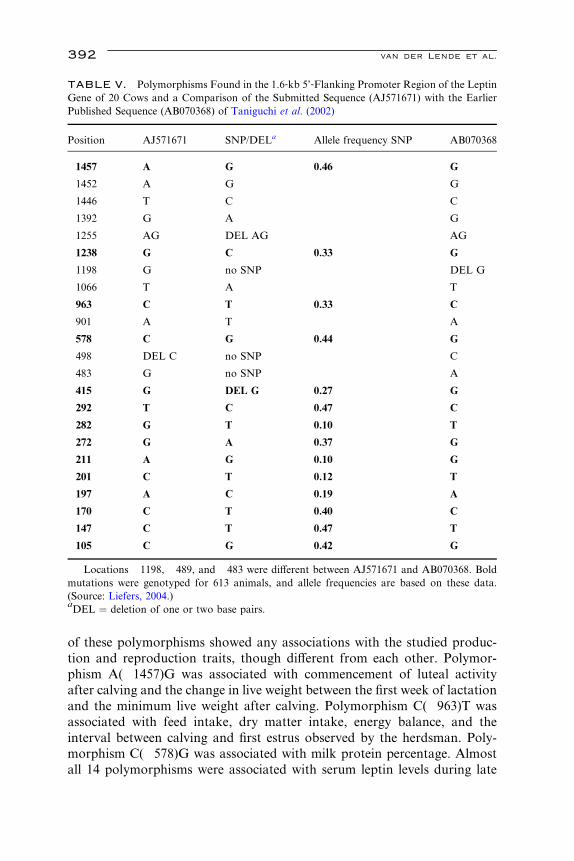
TABLE V. Polymorphisms Found in the 1.6‐kb 5’‐Flanking Promoter Region of the Leptin
Gene of 20 Cows and a Comparison of the Submitted Sequence (AJ571671) with the Earlier
Published Sequence (AB070368) of Taniguchi et al. (2002)
Position AJ571671 SNP/DELa Allele frequency SNP AB070368
�1457 A G 0.46 G
�1452 A G G
�1446 T C C
�1392 G A G
�1255 AG DEL AG AG
�1238 G C 0.33 G
�1198 G no SNP DEL G
�1066 T A T
�963 C T 0.33 C
�901 A T A
�578 C G 0.44 G
�498 DEL C no SNP C
�483 G no SNP A
�415 G DEL G 0.27 G
�292 T C 0.47 C
�282 G T 0.10 T
�272 G A 0.37 G
�211 A G 0.10 G
�201 C T 0.12 T
�197 A C 0.19 A
�170 C T 0.40 C
�147 C T 0.47 T
�105 C G 0.42 G
Locations �1198, �489, and �483 were diVerent between AJ571671 and AB070368. Bold
mutations were genotyped for 613 animals, and allele frequencies are based on these data.
(Source: Liefers, 2004.)aDEL ¼ deletion of one or two base pairs.
392 van der Lende et al.
of these polymorphisms showed any associations with the studied produc-
tion and reproduction traits, though diVerent from each other. Polymor-
phism A(�1457)G was associated with commencement of luteal activity
after calving and the change in live weight between the first week of lactation
and the minimum live weight after calving. Polymorphism C(�963)T was
associated with feed intake, dry matter intake, energy balance, and the
interval between calving and first estrus observed by the herdsman. Poly-
morphism C(�578)G was associated with milk protein percentage. Almost
all 14 polymorphisms were associated with serum leptin levels during late

Leptin Gene Polymorphisms 393
gestation. Only G(�282)T was associated with serum leptin levels during
late gestation and early lactation, whereas C(�201)T was only associated
with serum leptin levels during early lactation (Liefers, 2004).
An An(TA)m polymorphism in the 5’ untranslated region of the bovine
leptin gene, first described by Wilkins and Davey (1997), has to our knowl-
edge not been used in any published association study. Wilkins and Davey
(1997) found in Holstein Friesian and Jersey cows a total of 17 alleles, with
frequencies between 0.01 and 0.26, whereas Hale et al. (1998) found in
Angus cattle only six alleles, with frequencies between 0.02 and 0.55.
V. POLYMORPHISMS IN THE PORCINELEPTIN GENE
In the pig, polymorphisms in the leptin gene have been studied in exonic
and intronic regions, but not yet in the promoter region. In total, seven
polymorphisms have been described (Table VI). For most of these poly-
morphisms, and in most of the breeds studied, one of the two alleles per
locus had a low to very low frequency (Table VI). For the production and
reproduction traits studied, associations were only found for C(867)T, A
(2845)T, and T(3469)C (Table VI). C(867)T was included in two association
studies. Associations with litter size and backfat thickness were found in the
study by Chen et al. (2004) in Duroc but not in Landrace and Yorkshire
animals. In the study of Jiang and Gibson (1999), which only included
backfat thickness in four pig breeds (including Duroc), no associations were
found. A(2845)T was included in one study only and was shown to be
associated in Landrace pigs, but not in Duroc and Yorkshire pigs, with total
feed intake during the growing period (i.e., from 30 to 105 kg body weight)
and with the estimated breeding value (i.e., genetic merit) for age at 100 kg
body weight (Kennes et al., 2001). The T(3469)C polymorphism was includ-
ed in eight association studies. Associations were found, although they were
not always conclusive, with production traits (Chen et al., 2004; Jiang and
Gibson, 1999; Kennes et al., 2001; Kulig et al., 2001; Szydlowski et al., 2004;
Urban et al., 2002) and reproduction traits (Chen et al., 2004; Kmiec et al.,
2003; Korwin‐Kossakowska et al., 2002), as indicated in Table VI. Overall,
the results of these studies indicate that the T(3469)C polymorphism may be
associated with carcass traits (backfat/leanness), average daily gain, litter
size, and semen production, but not consistently in all breeds studied. For
the associations found, the C‐allele in comparison to the T‐allele reduced
backfat thickness (Jiang and Gibson, 1999; Urban et al., 2002), increased
lean meat percentage (Kulig et al., 2001; Urban et al., 2002), reduced
intramuscular fat (Szydlowski et al., 2004), and increased loin weight
(Szydlowski et al., 2004). For average daily weight gain, Kennes et al.
(2001) found a positive eVect of the C‐allele, but in contrast, Urban et al.

TABLE VI. Polymorphisms in the Exonic and Intronic Regions of the Porcine Leptin Gene and Their Associations with Production and
Reproduction Traits
Polymorphism and Study Population Allele frequency Associationsa
C(867)T
Jiang and Gibson, 1999 29 Duroc, 29 Hampshire,
30 Landrace, 32 Large White
Duroc: T: 0.55, C: 0.45;
Hampshire: T: 0.50,
C: 0.50; Landrace, T: 0.22,
C: 0.78; Large White,
T: 0.02, C: 0.98
Backfat at 100 kg (N)
Chen et al., 2004 170 Landrace sows and 455
Landrace boars, 62 Yorkshire
sows and 333 Yorkshire boars,
246 Duroc sows and 593 Duroc boars
Landrace: C: 0.77, T: 0.23;
Yorkshire: C: 0.74, T: 0.26;
Duroc: C: 0.65, T: 0.35
Litter size (Y in Duroc); average daily
gain (N); feed eYciency (N); backfat
thickness (Y in Duroc)
G(1112)A
Jiang and Gibson, 1999 29 Duroc, 29 Hampshire, 30 Landrace,
32 Large White
Duroc: G: 0.95, A: 0.05;
Hampshire: G: 0.90, A: 0.10;
Landrace: G: 0.93, A: 0.07;
Large White: G: 1.00, A: 0.00
Backfat at 100 kg (N)
A(2728)G
Kennes et al., 2001 86 Duroc, 160 Landrace,
118 Yorkshire
Duroc: G: 0.91, A: 0.09;
Landrace: G: 0.85,
A: 0.15; Yorkshire:
G: 1.00, A: 0.00
Average daily weight gain (N); feed
conversion (N); total feed intake (N);
average daily feed intake (N); backfat
at 100 kg (N); age at 100 kg (N);
EBV for backfat at 100 kg (N); EBV
for age at 100 kg (N)
A(2845)T
Kennes et al., 2001 86 Duroc, 160 Landrace,
118 Yorkshire
Duroc: A: 0.68, T: 0.32;
Landrace: A: 0.93,
T: 0.07; Yorkshire: A:
1.00, T: 0.00
Average daily weight gain (N); feed
conversion (N); total feed intake
(Y in Landrace); average daily feed
intake (N); backfat at 100 kg (N);
age at 100 kg (N); EBV for backfat
at 100 kg (N); EBV for age at 100 kg
(Y in Landrace)
394
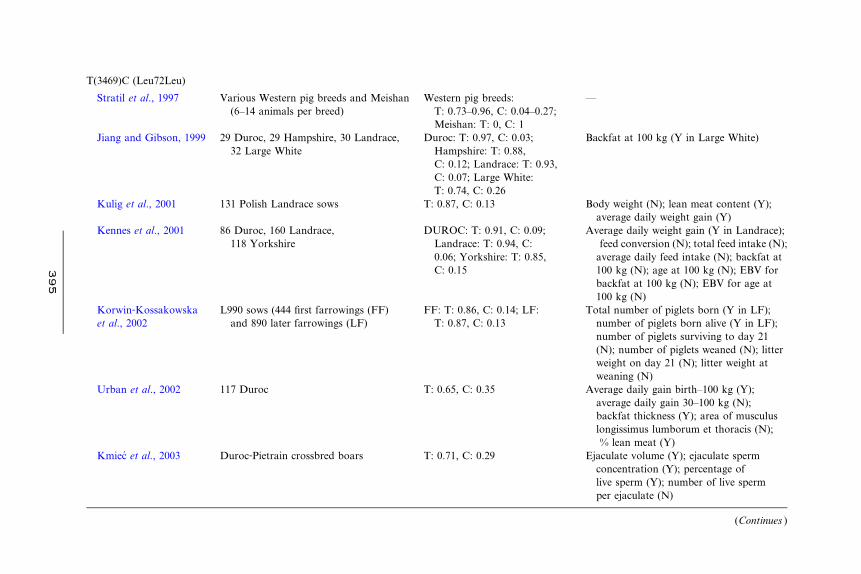
T(3469)C (Leu72Leu)
Stratil et al., 1997 Various Western pig breeds and Meishan
(6–14 animals per breed)
Western pig breeds:
T: 0.73–0.96, C: 0.04–0.27;
Meishan: T: 0, C: 1
—
Jiang and Gibson, 1999 29 Duroc, 29 Hampshire, 30 Landrace,
32 Large White
Duroc: T: 0.97, C: 0.03;
Hampshire: T: 0.88,
C: 0.12; Landrace: T: 0.93,
C: 0.07; Large White:
T: 0.74, C: 0.26
Backfat at 100 kg (Y in Large White)
Kulig et al., 2001 131 Polish Landrace sows T: 0.87, C: 0.13 Body weight (N); lean meat content (Y);
average daily weight gain (Y)
Kennes et al., 2001 86 Duroc, 160 Landrace,
118 Yorkshire
DUROC: T: 0.91, C: 0.09;
Landrace: T: 0.94, C:
0.06; Yorkshire: T: 0.85,
C: 0.15
Average daily weight gain (Y in Landrace);
feed conversion (N); total feed intake (N);
average daily feed intake (N); backfat at
100 kg (N); age at 100 kg (N); EBV for
backfat at 100 kg (N); EBV for age at
100 kg (N)
Korwin‐Kossakowska
et al., 2002
L990 sows (444 first farrowings (FF)
and 890 later farrowings (LF)
FF: T: 0.86, C: 0.14; LF:
T: 0.87, C: 0.13
Total number of piglets born (Y in LF);
number of piglets born alive (Y in LF);
number of piglets surviving to day 21
(N); number of piglets weaned (N); litter
weight on day 21 (N); litter weight at
weaning (N)
Urban et al., 2002 117 Duroc T: 0.65, C: 0.35 Average daily gain birth–100 kg (Y);
average daily gain 30–100 kg (N);
backfat thickness (Y); area of musculus
longissimus lumborum et thoracis (N);
% lean meat (Y)
Kmiec et al., 2003 Duroc‐Pietrain crossbred boars T: 0.71, C: 0.29 Ejaculate volume (Y); ejaculate sperm
concentration (Y); percentage of
live sperm (Y); number of live sperm
per ejaculate (N)
(Continues )
395
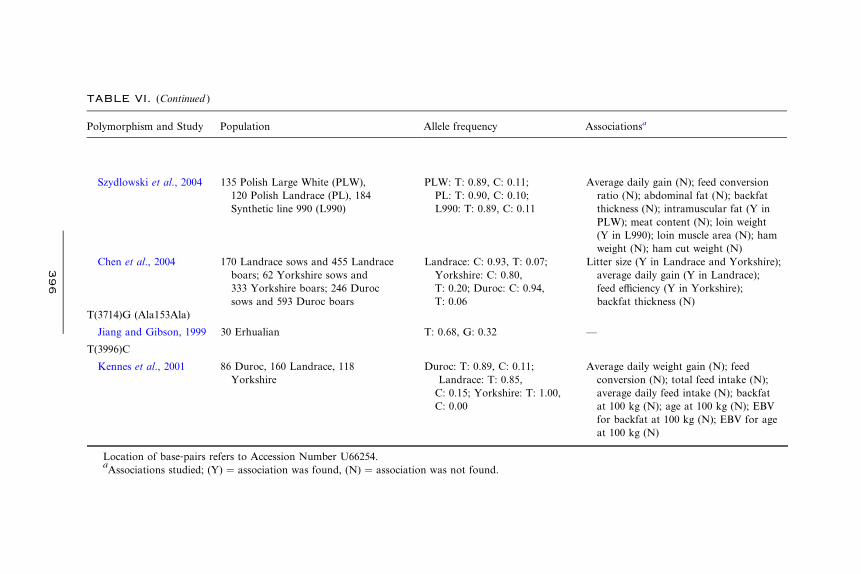
Szydlowski et al., 2004 135 Polish Large White (PLW),
120 Polish Landrace (PL), 184
Synthetic line 990 (L990)
PLW: T: 0.89, C: 0.11;
PL: T: 0.90, C: 0.10;
L990: T: 0.89, C: 0.11
Average daily gain (N); feed conversion
ratio (N); abdominal fat (N); backfat
thickness (N); intramuscular fat (Y in
PLW); meat content (N); loin weight
(Y in L990); loin muscle area (N); ham
weight (N); ham cut weight (N)
Chen et al., 2004 170 Landrace sows and 455 Landrace
boars; 62 Yorkshire sows and
333 Yorkshire boars; 246 Duroc
sows and 593 Duroc boars
Landrace: C: 0.93, T: 0.07;
Yorkshire: C: 0.80,
T: 0.20; Duroc: C: 0.94,
T: 0.06
Litter size (Y in Landrace and Yorkshire);
average daily gain (Y in Landrace);
feed eYciency (Y in Yorkshire);
backfat thickness (N)
T(3714)G (Ala153Ala)
Jiang and Gibson, 1999 30 Erhualian T: 0.68, G: 0.32 —
T(3996)C
Kennes et al., 2001 86 Duroc, 160 Landrace, 118
Yorkshire
Duroc: T: 0.89, C: 0.11;
Landrace: T: 0.85,
C: 0.15; Yorkshire: T: 1.00,
C: 0.00
Average daily weight gain (N); feed
conversion (N); total feed intake (N);
average daily feed intake (N); backfat
at 100 kg (N); age at 100 kg (N); EBV
for backfat at 100 kg (N); EBV for age
at 100 kg (N)
Location of base‐pairs refers to Accession Number U66254.aAssociations studied; (Y) ¼ association was found, (N) ¼ association was not found.
TABLE VI. (Continued )
Polymorphism and Study Population Allele frequency Associationsa
396
Leptin Gene Polymorphisms 397
(2002) found a positive eVect of the T‐allele. Both the latter studies included
backfat as a trait, but only Urban et al. (2002) found an association with
T(3469)C (see Table VI). The three association studies that included repro-
duction traits (Chen et al., 2004; Kmiec et al., 2003; Korwin‐Kossakowska
et al., 2002) suggest that the T‐allele rather than the C‐allele is favorable forreproduction.
VI. CONCLUDING REMARKS
Of the polymorphisms reported in the exonic, intronic, and promoter
regions of the leptin gene and included in this overview (18 in humans, 29
in cattle, and 7 in pigs), the majority was included in at least one association
study (i.e., 16 in humans, 19 in cattle, and 6 in pigs). Considering the large
range of physiological functions of leptin, it is not surprising that various
phenotypic associations have been found with, for example, overweight or
(late‐onset) obesity, non‐insulin‐dependent diabetes mellitus, prostate can-
cer, and non‐Hodgkin’s lymphoma in humans; feed intake, milk yield traits,
carcass traits, and reproduction‐related traits in cattle; and average daily
gain, carcass traits (backfat thickness/leanness), and reproduction perfor-
mance traits in pigs. Either many of the polymorphisms were only included
in a limited number of association studies, or the phenotypes studied varied
largely for a given polymorphism between studies. Therefore, many of the
associations found for these polymorphisms need to be confirmed in future
studies before firm conclusions can be drawn. DiVerences in phenotypic
associations of a given leptin polymorphism between studies involving com-
parable traits or characteristics may be a result of diVerences in linkage
disequilibrium (or the absence of linkage disequilibrium) with a functional
mutation in the leptin gene itself (including the promoter region) or in genes
upstream or downstream of the leptin locus. Even if the polymorphism
studied is a functional polymorphism, associations in diVerent human po-
pulations or breeds of livestock may vary largely. Various studies have
shown that the ob/ob genotype in diVerent genetic backgrounds may lead
to diVerent phenotypes (Ewart‐Toland et al., 1999; Haluzik et al., 2004; Qiu
et al., 2001). Stoehr et al. (2004) reported large, heritable diVerences in body
weight and food intake between BTBR‐ob/ob and B6‐ob/ob mice and were
able to identify two loci, called modifier of obese (Moo1 and Moo2), that
explain the majority of the heritable variance in (BTBR � B6) F2‐ob/obmice. Two of the human association studies included in this review (Lakka
et al., 2004; Skibola et al., 2004; see Table I and Table II, respectively)
provide illustrative evidence that phenotypic associations of leptin gene
polymorphisms may already be influenced by allelic variation at a single
other unlinked locus (i.e., in these studies, the leptin receptor locus). Lakka
et al. (2004) found an association of the G(19)A polymorphism in the leptin

398 van der Lende et al.
gene, with exercise‐induced change in fasting insulin blood level in carriers of
the Arg‐allele of the Lys109Arg polymorphism in the leptin receptor gene,
but not in subjects homozygous for the Lys‐allele. Likewise, Skibola et al.
(2004) found an association of the G(�2548)A polymorphism in the pro-
moter region of the leptin gene with the risk for non‐Hodgkin’s lymphoma in
subjects that were homozygous for the Arg‐allele of the Gln223Arg poly-
morphism in the leptin receptor gene, but not for carriers of the Gln‐allele. Acompletely diVerent phenomenon that may aVect the replication of associa-
tion studies was reported by Comings et al. (2001). The association of the
dinucleotide repeat D7S1875 (closely linked to the human leptin gene re-
ferred to as Lep1875) with the age of menarche depended on the age of the
mothers at the birth of the women studied. The Lep1875 by age of menarche
eVects were in opposite directions for subjects with a maternal age at birth of
less than 30 years compared to those with a maternal age at birth of 30 years
or more. The authors referred to this phenomenon as an ‘‘association
crossover eVect.’’
REFERENCES
Almeida, S. E. M., Almeida, E. A., Moraes, J. C. F., and Weimer, T. A. (2003). Molecular
markers in the LEP gene and reproductive performance of beef cattle. J. Anim. Breed.
Genet. 120, 106–113.
Ambrosini, G., Nath, A. K., Sierra‐Honigmann, M. R., and Flores‐Riveros, J. (2002).
Transcriptional activation of the human leptin gene in response to hypoxia: Involvement of
hypoxia‐inducible factor 1. J. Biol. Chem. 277, 34601–34609.
Bado, A., Levasseur, S., Attoub, S., Kermorgant, S., Laigneau, J.‐P., Bortoluzzi, M.‐N., Moizo,
L., Lehy, T., Guerre‐Millo, M., Le Marchand‐Brustel, Y., and Lewin, M. J. M. (1998). The
stomach is a source of leptin. Nature 394, 790–793.
Bi, S., Gavrilova, O., Gong, D.‐W., Mason, M. M., and Reitman, M. (1997). Identification of a
placental enhancer for the human leptin gene. J. Biol. Chem. 272, 30583–30588.
Brunner, L., Whitebread, S., Leconte, I., Stricker‐Krongrad, A., Cumin, F., Chiesi, M., and
Levens, N. (1999). A peptide leptin antagonist reduces food intake in rodents. Int. J. Obes.
23, 463–469.
Buchanan, F. C., Fitzsimmons, C. J., Van Kessel, A. G., Thue, T. D., Winkelman‐Sim, D. C.,
and Schmutz, S. M. (2002). Association of a missense mutation in the bovine leptin gene
with carcass fat content and leptin mRNA levels. Gen. Sel. Evol. 34, 105–116.
Buchanan, F. C., Van Kessel, A. G., Waldner, C., Christensen, D. A., Laarveld, B., and
Schmutz, S. M. (2003). Hot topic: An association between a leptin single nucleotide
polymorphism and milk and protein yield. J. Dairy Sci. 86, 3164–3166.
Chelikani, P. K., Glimm, D. R., and Kennelly, J. J. (2003). Short communication: Tissue
distribution of leptin and leptin receptor mRNA in the bovine. J. Dairy Sci. 86, 2369–2372.
Chen, C.‐C., Chang, T., and Su, H.‐Y. (2004). Genetic polymorphisms in porcine leptin gene
and their association with reproduction and production traits. Austr. J. Agric. Res. 55,
699–704.
Comings, D. E., Gade, R., Muhleman, D., Peters, W. R., and Mac Murray, J. P. (2001). The
LEP gene and age of menarche: Maternal age as a potential cause of hidden stratification in
association studies. Mol. Gen. Metabol. 73, 204–210.
Leptin Gene Polymorphisms 399
Considine, R. V. (2003). Endocrine regulation of leptin production. In ‘‘Leptin and
Reproduction’’ (M. C. Henson and V. D. Castracane, Eds.), pp. 39–51. Kluwer
Academic/Plenum, New York.
Considine, R. V., Considine, E. L., Williams, C. J., Nyce, M. R., Zhang, P., Opentanova, I.,
Ohannesian, J. P., Kolaczynski, J. W., Bauer, T. L., Moore, J. H., and Caro, J. F. (1996).
Mutation screening and identification of a sequence variation in the human OB gene coding
region. Bioch. Biophys. Res. Comm. 220, 735–739.
Cornish, J., Callon, K. E., Bava, U., Lin, C., Naot, D., Hill, B. L., Grey, A. B., Broom, N.,
Myers, D. E., Nicholson, G. C., and Reid, I. R. (2002). Leptin directly regulates bone cell
function in vitro and reduces bone fragility in vivo. J. Endocrinol. 175, 405–415.
Darlington, G. J., Wang, N., and Hanson, R. W. (1995). C/EBP alpha: A critical regulator of
genes governing integrative metabolic processes. Curr. Opin. Gen. Dev. 5, 565–570.
De Silva, A. M., Walder, K. R., Aitman, T. J., Gotoda, T., Goldstone, A. P., Hodge, A. M., De
Courten, M. P., Zimmet, P. Z., and Collier, G. R. (1999). Combination of polymorphisms in
OB‐R and the OB gene associated with insulin resistance in Nauruan males. Int. J. Obes. 23,
816–822.
Echwald, S. M., Rasmussen, S. B., Sorensen, T. I. A., Andersen, T., Tybjærg‐Hansen, A.,
Clausen, J. O., Hansen, L., Hansen, T., and Pedersen, O. (1997). Identification of two novel
missense mutations in the human OB gene. Int. J. Obes. 21, 321–326.
Ewart‐Toland, A., Mounzih, K., Qiu, J., and Chehab, F. F. (1999). EVect of the genetic
background on the reproduction of leptin‐deficient obese mice. Endocrinology 140, 732–738.
Farooqi, S., Rau, H., Whitehead, J., and O’Rahilly, S. (1998). ob Gene mutations and human
obesity. Proc. Nutr. Soc. 57, 471–475.
Flehmig, G. (1999). Einfluß von Lipoproteinlipase‐Gen‐ und Leptinpromotorgen‐Polymorphis-
men auf die Korperzusammensetzung von adiposen Frauen wahrend eines strukturierten
und bilanzierten Diatenprogrammes. Diplom Thesis University of Potsdam, Germany.
Fukuda, H., and Iritani, N. (1999). Transcriptional regulation of leptin gene promoter in rat.
FEBS Lett. 455, 165–169.
Gong, D.‐W., Bi, S., Pratley, R. E., and Weintraub, B. D. (1996). Genomic structure and
promoter analysis of the human obese gene. J. Biol. Chem. 271, 3971–3974.
Grasso, P., Leinung, M. C., Ingher, S. P., and Lee, D. W. (1997). In vivo eVects of leptin‐relatedsynthetic peptides on body weight and food intake in female ob/ob mice: Localization of
leptin activity to domains between amino acid residues 106–140. Endocrinology 138,
1413–1418.
Green, E. D., MaVei, M., Braden, V. V., Proenca, R., De Silva, U., Zhang, Y., Chua, S. C., Jr.,
Leibel, R. L., Weissenbach, J., and Friedman, J. M. (1995). The human obese (OB) gene:
RNA expression pattern and mapping on the physical, cytogenetic, and genetic maps of
chromosome 7. Genome Res. 5, 5–12.
Grosfeld, A., Andre, J., Hauguel‐de Mouzon, S., Berra, E., Pouyssegur, J., and Guerre‐Millo,
M. (2002). Hypoxia‐inducible factor 1 transactivates the human leptin gene promoter.
J. Biol. Chem. 277, 42953–42957.
Haegeman, A., Van Zeveren, A., and Peelman, L. J. (2000). New mutation in exon 2 of the
bovine leptin gene. Anim. Genet. 31, 79.
Hager, J., Clement, K., Francke, S., Dina, C., Raison, J., Lahlou, N., Rich, N., Pelloux, V.,
Basdevant, A., Guy‐Grand, B., North, M., and Froguel, P. (1998). A polymorphism in the
5’ untranslated region of the human ob gene is associated with low leptin levels. Int. J. Obes.
22, 200–205.
Hale, C. S., Herring, W. O., Johnson, G. S., Shibuya, H., Lubahn, D. B., and Keisler, D. H.
(1998). Evaluation of the leptin gene as a possible marker of carcass traits in Angus cattle.
1998 UMC Animal Sciences Departmental Report, pp. 25–27.
Haluzik, M., Colombo, C., Gavrilova, O., Chua, S., Wolf, N., Chen, M., Stannard, B., Dietz,
K. R., Le Roith, D., and Reitman, M. L. (2004). Genetic background (C57BL/6J versus

400 van der Lende et al.
FVB/N) strongly influences the severity of diabetes and insulin resistance in ob/ob mice.
Endocrinology 145, 3258–3264.
Hamrick, M. W., Pennington, C., Newton, D., Xie, D., and Isales, C. (2004). Leptin deficiency
produces contrasting phenotypes in bones of the limb and spine. Bone 34, 376–383.
Hassink, S. G., De Lancey, E., Sheslow, D. V., Smith‐Kirwin, S. M., O’Connor, D. M.,
Considine, R. V., Opentanova, I., Dostal, K., Spear, M. L., Leef, K., Ash, M., Spitzer,
A. R., and Funanage, V. L. (1997). Placental leptin: an important new growth factor in
intrauterine and neonatal development? Pediatrics 100, e1 (6 pp).
He, Y., Chen, H., Quon, M. J., and Reitman, M. (1995). The mouse obese gene. J. Biol. Chem.
270, 28887–28891.
Henson, M. C., and Castracane, V. D. (2003). ‘‘Leptin and Reproduction.’’ Kluwer Academic/
Plenum, New York.
Hinney, A., Bornscheuer, A., Depenbusch, M., Mierke, B., Tolle, A., Mayer, H., Siegfried, W.,
Remschmidt, H., and Hebebrand, J. (1997). Absence of leptin deficiency mutation in
extremely obese German children and adolescents. Int. J. Obes. 21, 1190.
HoVstedt, J., Eriksson, P., Mottagui‐Tabar, S., and Arner, P. (2002). A polymorphism in the
leptin promoter region (–2548 G/A) influences gene expression and adipose tissue secretion
of leptin. Horm. Metabol. Res. 34, 355–359.
Hollenberg, A. N., Susulic, V. S., Madura, J. P., Zhang, B., Moller, D. E., Tontonoz, P.,
Sarraf, P., Spiegelman, B. M., and Lowell, B. B. (1997). Functional antagonism between
CCAAT/Enhancer binding protein‐a and peroxisome proliferator‐activated receptor‐g on
the leptin promoter. J. Biol. Chem. 272, 5283–5290.
Hossner, K. L. (1998). Cellular, molecular and physiological aspects of leptin: Potential
application in animal production. Can. J. Anim. Sci. 78, 463–472.
Hwang, C.‐S., Mandrup, S., Mac Dougald, O. A., Geiman, D. E., and Lane, M. D. (1996).
Transcriptional activation of the mouse obese (ob) gene by CCAAT/enhancer binding
protein a. Proc. Natl. Acad. Sci. USA 93, 873–877.
Imagawa, K., Numata, Y., Katsuura, G., Sakaguchi, I., Morita, A., Kikuoka, S., Matumoto,
Y., Tsuji, T., Tamaki, M., Sasakura, K., Teraoka, H., Hosoda, K., Ogawa, Y., and Nakao,
K. (1998). Structure‐function studies of human leptin. J. Biol. Chem. 273, 35245–35249.
Isse, N., Ogawa, Y., Tamura, N., Masuzaki, H., Mori, K., Okazaki, T., Satoh, N., Shigemoto,
M., Yoshimasa, Y., Nishi, S., Hosoda, K., Inazawa, J., and Nakao, K. (1995). Structural
organization and chromosomal assignment of the human obese gene. J. Biol. Chem. 270,
27728–27733.
Jiang, Y., Wilk, J. B., Borecki, I., Williamson, S., De Stefano, A. L., Xu, G., Liu, J., Ellison,
R. C., Province, M., and Myers, R. H. (2004). Common variants in the 5’ region of the
leptin gene are associated with body mass index in men from the National Heart, Lung and
Blood Institute Family Heart Study. Am. J. Hum. Genet. 75, 220–230.
Jiang, Z.‐H., and Gibson, J. P. (1999). Genetic polymorphisms in the leptin gene and their
association with fatness in four pig breeds. Mamm. Genome 10, 191–193.
Jin, L., Zhang, S., Burguera, B. G., Couce, M. E., Osamura, R. Y., Kulig, E., and Lloyd, R. V.
(2000). Leptin and leptin receptor expression in rat and mouse pituitary cells. Endocrinology
141, 333–339.
Karvonen, M. K., Pesonen, U., Heinonen, P., Laakso, M., Rissanen, A., Naukkarinen, H.,
Valve, R., Uusitupa, M. I. J., and Koulu, M. (1998). Identification of new sequence variants
in the leptin gene. J. Clin. Endocrinol. Metabol. 83, 3239–3242.
Kennes, Y. M., Murphy, B. D., Pothier, F., and Palin, M.‐F. (2001). Characterization of swine
leptin (LEP) polymorphisms and their association with production traits. Anim. Genet. 32,
215–218.
Kim, J. B., Sarraf, P., Wright, M., Yao, K. M., Mueller, E., Solanes, G., Lowell, B. B., and
Spiegelman, B. M. (1998). Nutritional and insulin regulation of fatty acid synthetase and
leptin gene expression through ADD1/SREBP1. J. Clin. Invest. 101, 1–9.

Leptin Gene Polymorphisms 401
Kmiec, M., Kulig, H., and Konik, A. (2003). Preliminary results on associations between leptin
gene (LEP) and some reproduction performance traits of boars. Arch. Tierz. Dummerstorf
46, 63–70.
Korwin‐Kossakowska, A., Kamyczek, M., Cieslak, D., Pierzchala, M., and Kurył, J. (2002).
The eVect of the polymorphism of leptin (LEP), leptin receptor (LEPR) and osteopontin
(OPN) genes on selected reproduction traits of synthetic Line 990 sows. Anim. Sci. Pap. Rep.
20, 159–168.
Kulig, H., Grzesiak, W., and Szatkowska, I. (2001). EVect of leptin gene polymorphism on
growth and carcass traits in pigs. Arch. Tierz. Dummerstorf 44, 291–296.
Lagonigro, R., Wiener, P., Pilla, F., Woolliams, J. A., and Williams, J. L. (2003). A new
mutation in the coding region of the bovine leptin gene associated with feed intake. Anim.
Genet. 34, 371–374.
Lahlou, N., Issad, T., Lebouc, Y., Carel, J.‐C., Camoin, L., Roger, M., and Girard, J. (2002).
Mutations in the human leptin and leptin receptor genes as models of serum leptin receptor
regulation. Diabetes 51, 1980–1985.
Lakka, T. A., Rankinen, T., Weisnagel, S. J., Chagnon, Y. C., Lakka, H.‐M., Ukkola, O.,
Boule, N., Rice, T., Leon, A. S., Skinner, J. S., Wilmore, J. H., Rao, D. C., Bergman, R.,
and Bouchard, C. (2004). Leptin and leptin receptor gene polymorphisms and changes in
glucose homeostasis in response to regular exercise in nondiabetic individuals. The
HERITAGE family study. Diabetes 53, 1603–1608.
Le StunV, C., Le Bihan, C., Schork, N. J., and Bougneres, P. (2000). A common promoter
variant of the leptin gene is associated with changes in the relationship between serum leptin
and fat mass in obese girls. Diabetes 49, 2196–2200.
Li, W.‐D., Reed, D. R., Lee, J. H., Xu, W., Kilker, R. L., Sodam, B. R., and Price, R. A. (1999).
Sequence variants in the 5’ flanking region of the leptin gene are associated with obesity in
women. Ann. Hum. Genet. 63, 227–234.
Liefers, S. C. (2004). Physiology and genetics of leptin in periparturient dairy cows. Thesis,
Wageningen University, The Netherlands.
Liefers, S. C., Te Pas, M. F. W., Veerkamp, R. F., and Van der Lende, T. (2002). Associations
between leptin gene polymorphisms and production, live weight, energy balance, feed
intake, and fertility in Holstein heifers. J. Dairy Sci. 85, 1633–1638.
Liefers, S. C., Te Pas, M. F. W., Veerkamp, R. F., Chilliard, Y., Delavaud, C., Gerritsen, R.,
and Van der Lende, T. (2003). Association of leptin gene polymorphisms with serum leptin
concentration in dairy cows. Mamm. Genome 14, 657–663.
Lien, S., Sundvold, H., Klungland, H., and Vage, D. I. (1997). Two novel polymorphisms in the
bovine obesity gene (OBS). Anim. Genet. 28, 245.
Lord, G. M., Matarese, G., Howard, J. K., Baker, R. J., Bloom, S. R., and Lechler, R. I. (1998).
Leptin modulates the T‐cell immune response and reverses starvation‐induced immunosup-
pression. Nature 394, 897–901.
Lucantoni, R., Ponti, E., Berselli, M. E., Savia, G., Minocci, A., Calo, G., De Medici, C.,
Liuzzi, A., and Di Blasio, A. M. (2000). The A19G polymorphism in the 5’ untranslated
region of the human obese gene does not aVect leptin levels in severely obese patients.
J. Clin. Endocrinol. Metabol. 85, 3589–3591.
MaVei, M., StoVel, M., Barone, M., Moon, B., Dammerman, M., Ravussin, E., Bogardus, C.,
Ludwig, D. S., Flier, J. S., Talley, M., Auerbach, S., and Friedman, J. M. (1996). Absence of
mutations in the human OB gene in obese/diabetic subjects. Diabetes 45, 679–682.
Mammes, O., Betoulle, D., Aubert, R., Giraud, V., Tuzet, S., Petiet, A., Colas‐Linhart, N., and
Fumeron, F. (1998). Novel polymorphisms in the 5’ region of the LEP gene. Association
with leptin levels and response to low‐calorie diet in human obesity. Diabetes 47, 487–489.
Mammes, O., Betoulle, D., Aubert, R., Herbeth, B., Siest, G., and Fumeron, F. (2000).
Association of the G–2548A polymorphism in the 5’ region of the LEP gene with
overweight. Ann. Hum. Genet. 64, 391–394.

402 van der Lende et al.
Mason, M. M., He, Y., Chen, H., Quon, M. J., and Reitman, M. (1998). Regulation of leptin
promoter function by Sp1, C/EBP, and a novel factor. Endocrinology 139, 1013–1022.
Masuzaki, H., Ogawa, Y., Isse, N., Satoh, N., Okazaki, T., Shigemoto, M., Mori, K., Tamura,
N., Hosoda, K., Yoshimasa, Y., Jingami, H., Kawada, T., and Nakao, K. (1995). Human
obese gene expression Adipocyte‐specific expression and regional diVerences in the adipose
tissue. Diabetes 44, 855–858.
Masuzaki, H., Ogawa, Y., Sagawa, N., Hosoda, K., Matsumoto, T., Mise, H., Nishimura, H.,
Yoshimasa, Y., Tanaka, I., Mori, T., and Nakao, K. (1997). Nonadipose tissue production
of leptin: Leptin as a novel placenta‐derived hormone in humans. Nat. Med. 3, 1029–1033.
Mattevi, V. S., Zembrzuski, V. M., and Hutz, M. H. (2002). Association analysis of genes
involved in the leptin‐signaling pathway with obesity in Brazil. Int. J. Obes. 26, 1179–1185.
McGarvey, S. T., Forrest, W., Weeks, D. E., Sun, G., Smelser, D., Tufa, J., Viali, S., and Deka,
R. (2002). Human leptin locus (LEP) alleles and BMI in Samoans. Int. J. Obes. 26, 783–788.
Meißner, U., Ostreicher, I., Allabauer, I., Rascher, W., and Dotsch, J. (2003). Synergistic eVects
of hypoxia and insulin are regulated by diVerent transcriptional elements of the human
leptin promoter. Biochem. Biophys. Res. Comm. 303, 707–712.
Miller, S. G., De Vos, P., Guerre‐Millo, M., Wong, K., Hermann, T., Staels, B., Briggs, M. R.,
and Auwerx, J. (1996). The adipocyte specific transcription factor C/EBPa modulates
human ob gene expression. Proc. Natl. Acad. Sci. USA 93, 5507–5511.
Montague, C. T., Farooqi, I. S., Whitehead, J. P., Soos, M. A., Rau, H., Wareham, N. J.,
Sewter, C. P., Digby, J. E., Mohammed, S. N., Hurst, J. A., Cheetham, C. H., Earley, A. R.,
Barnett, A. H., Prins, J. B., and O’Rahilly, S. (1997). Congenital leptin deficiency is
associated with severe early‐onset obesity in humans. Nature 387, 903–908.
Moon, B. C., and Friedman, J. M. (1997). The molecular basis of the obese mutation in ob2J
mice. Genomics 42, 152–156.
Morash, B., Li, A., Murphy, P. R., Wilkinson, M., and Ur, E. (1999). Leptin gene expression in
the brain and pituitary gland. Endocrinolgy 140, 5995–5998.
Nieters, A., Becker, N., and Linseisen, J. (2002). Polymorphisms in candidate obesity genes and
their interaction with dietary intake of n–6 polyunsaturated fatty acids aVect obesity risk in
a sub‐sample of the EPIC‐Heidelberg cohort. Eur. J. Nutr. 41, 210–221.
Nkrumah, J. D., Li, C., Basarab, J. B., Guercio, S., Meng, Y., Murdoch, B., Hansen, C., and
Moore, S. S. (2004). Association of a single nucleotide polymorphism in the bovine leptin
gene with feed intake, feed eYciency, growth, feeding behaviour, carcass quality and body
composition. Can. J. Anim. Sci. 84, 211–219.
Oberkofler, H., Beer, A., Breban, D., Hell, E., Krempler, F., and Patsch, W. (1997). Human
obese gene expression: Alternative splicing of mRNA and relation to adipose tissue
localization. Obesity Surgery 7, 390–396.
Ohman, M., Oksanen, L., Kainulainen, K., Janne, O. A., Kaprio, J., Koskenvuo, M.,
Mustajoki, P., Kontula, K., and Peltonen, L. (1999). Testing of human homologues of
murine obesity genes as candidate regions in Finnish obese sib pairs. Eur. J. Hum. Gen. 7,
117–124.
Ohshiro, Y., Ueda, K., Nishi, M., Ishigame, M., Wakasaki, H., Kawashima, H., Furuta, H.,
Sasaki, H., Sanke, T., Takasu, N., and Nanjo, K. (2000). A polymorphic marker in the
leptin gene associated with Japanese morbid obesity. J. Mol. Med. 78, 516–520.
Oksanen, L., Kainulainen, K., Heiman, M., Mustajoki, P., Kauppinen‐Makelin, R., and
Kontula, K. (1997). Novel polymorphism of the human ob gene promoter in lean and
morbidly obese subjects. Int. J. Obes. 21, 489–494.
Oksanen, L., Palvimo, J. J., Janne, O. A., and Kontula, K. (1998). Functional analysis of the C
(–188)A polymorphism of the human leptin promoter. Hum. Genet. 103, 527–528.
Onions, K. L., Hunt, S. C., Rutkowski, M. P., Klanke, C. A., Su, Y. R., Reif, M., and Menon,
A. G. (1998). Genetic markers at the leptin (OB) locus are not significantly linked to
hypertension in African Americans. Hypertension 31, 1230–1234.

Leptin Gene Polymorphisms 403
Oprzadek, J., Flisikowski, K., Zwierzchowski, L., and Dymnicki, E. (2003). Polymorphisms at
loci of leptin (LEP), Pit1 and STAT5A and their association with growth, feed conversion
and carcass quality in Black‐and‐White bulls. Anim. Sci. Papers Rep. 21, 135–145.
Ozata, M., Ozdemir, I. C., and Licinio, J. (1999). Human leptin deficiency caused by a missense
mutation: Multiple endocrine defects, decreased sympathetic tone, and immune system
dysfunction indicate new targets for leptin action, greater central than peripheral resistance
to the eVects of leptin, and spontaneous correction of leptin‐mediated defects. J. Clin.
Endocrinol. Metabol. 84, 3686–3695.
Peelman, F., Van Beneden, K., Zabeau, L., Iserentant, H., Ulrichts, P., Defeau, D., Verhee, A.,
Catteeuw, D., Elewaut, D., and Tavernier, J. (2004a). Mapping of the leptin binding sites
and design of a leptin antagonist. J. Biol. Chem. 279, 41038–41046.
Peelman, F., Waelput, W., Iserentant, H., Lavens, D., Eyckerman, S., Zabeau, L., and
Tavernier, J. (2004b). Leptin: Linking adipocyte metabolism with cardiovascular and
autoimmune diseases. Prog. Lipid Res. 43, 283–301.
Pelleymounter, M. A., Cullen, M. J., Baker, M. B., Hecht, R., Winters, D., Boone, T., and
Collins, F. (1995). EVects of the obese gene product on body weight regulation in ob/ob
mice. Science 269, 540–543.
Pomp, D., Zou, T., Clutter, A. C., and Barendse, W. (1997). Rapid communication: Mapping
of leptin to bovine chromosome 4 by linkage analysis of a PCR‐based polymorphism. J.
Anim. Sci. 75, 1427.
Qiu, J., Ogus, S., Mounzih, K., Ewart‐Toland, A., and Chehab, F. F. (2001). Leptin‐deficientmice backcrossed to the BALB/cJ genetic background have reduced adiposity, enhanced
fertility, normal body temperature, and severe diabetes. Endocrinology 142, 3421–3425.
Rahmouni, K., and Haynes, W. G. (2004). Leptin and the cardiovascular system. Recent Prog.
Horm. Res. 59, 225–244.
Rau, H., Reaves, B. J., O’Rahilly, S., and Whitehead, J. P. (1999). Truncated human leptin
(�133) associated with extreme obesity undergoes proteasomal degradation after defective
intracellular transport. Endocrinology 140, 1718–1723.
Raver, N., Vardy, E., Livnah, O., Devos, R., and Gertler, A. (2002). Comparison of R128Q
mutations in human, ovine, and chicken leptins. Gen. Comp. Endocrinol. 126, 52–58.
Ren, W., Zhang, S‐H., Wu, J., and Ni, Y.‐X. (2004). Polymorphism of the leptin gene promoter
in pedigrees of type 2 diabetes mellitus in Chongqing, China. Chin. Med. J. 117, 558–561.
Ribeiro,R.,Vasconcelos,A.,Costa, S., Pinto,D.,Morais,A.,Oliveira, J., Lobo,F.,Lopes,C., and
Medeiros, R. (2004). Overexpressing leptin genetic polymorphism (–2548 G/A) is associated
with susceptibility to prostate cancer and risk of advanced disease. Prostate 59, 268–274.
Rock, F. L., Altmann, S. W., Van Heek, M., Kastelein, R. A., and Bazan, J. F. (1996). The
leptin haemopoietic cytokine fold is stabilized by an intrachain disulfide bond. Horm.
Metabol. Res. 28, 649–652.
Samson, W. K., Murphy, T. C., Robison, D., Vargas, T., Tau, E., and Chang, J.‐K. (1996). A
35 amino acid fragment of leptin inhibits feeding in the rat. Endocrinology 137, 5182–5185.
Senarıs, R., Garcia‐Caballero, T., Casabiell, X., Callego, R., Castro, R., Considine, R. V.,
Dieguez, C., and Casanueva, F. F. (1997). Synthesis of leptin in human placenta.
Endocrinology 138, 4501–4504.
Shigemoto, M., Nishi, S., Ogawa, Y., Isse, N., Matsuoka, N., Tanaka, T., Azuma, N.,
Masuzaki, H., Nishimura, H., Yoshimasa, Y., Hosoda, K., and Nakao, K. (1997).
Molecular screening of both the promoter and the protein coding regions in the human ob
gene in Japanese obese subjects with non‐insulin‐dependent diabetes mellitus. Eur. J.
Endocrinol. 137, 511–513.
Shintani, M., Ikegami, H., Yamato, E., Kawaguchi, Y., Fujisawa, T., Nakagawa, Y., Hamada,
Y., Ueda, H., Miki, T., and Ogihara, T. (1996). A novel microsatellite polymorphism in the
human OB gene: A highly polymorphic marker for linkage analysis. Diabetologia 39,
1398–1401.

404 van der Lende et al.
Shintani, M., Ikegami, H., Fujisawa, T., Kawaguchi, Y., Ohishi, M., Katsuya, T., Higaki, J.,
Shimamoto, K., and Ogihara, T. (2002). Leptin gene polymorphism is associated with
hypertension independent of obesity. J. Clin. Endocrinol. Metabol. 87, 2909–2912.
Skibola,C.F.,Holly,E.A.,Forrest,M.S.,Hubbard,A.,Bracci,P.M.,Skibola,D.R.,Hegedus,C.,
and Smith, M. T. (2004). Body mass index, leptin and leptin receptor polymorphisms, and
non‐Hodgkin lymphoma.Cancer Epidemiol. Biomarkers Prev. 13, 779–786.
Smith‐Kirwin, S. M., O’Connor, D. M., Johnston, J., De Lancey, E., Hassink, S. G., and
Funanage, V. L. (1998). Leptin expression in human mammary epithelial cells and breast
milk. J. Clin. Endocrinol. Metabol. 83, 1810–1813.
Steppan, C. M., Crawford, D. T., Chidsey‐Frink, K. L., Ke, H. Z., and Swick, A. G. (2000).
Leptin is a potent stimulator of bone growth in ob/ob mice. Regul. Pept. 92, 73–78.
Stoehr, J. P., Byers, J. E., Clee, S. M., Lan, H., Boronenkov, I. V., Schueler, K. L., Yandell,
B. S., and Attie, A. D. (2004). Identification of major quantitative trait loci controlling body
weight variation in ob/ob mice. Diabetes 53, 245–249.
Stratil, A., Peelman, L., Van Poucke, M., and Cepica, S. (1997). A HinfI PCR‐RFLP at the
porcine leptin (LEP) gene. Anim. Genet. 28, 371–372.
Strobel, A., Issad, T., Camoin, L., Ozata, M., and Strosberg, A. D. (1998). A leptin missense
mutation associated with hypogonadism and morbid obesity. Nat. Genet. 18, 213–215.
Szydlowski, M., Stachowiak, M., Mackowski, M., Kamyczek, M., Eckert, R., Rozycki, M., and
Switonski, M. (2004). No major eVect of the leptin gene polymorphism on porcine
production traits. J. Anim. Breed. Genet. 121, 149–155.
Taniguchi, Y., Itoh, T., Yamada, T., and Sasaki, Y. (2002). Genomic structure and promoter
analysis of the bovine leptin gene. IUBMB Life 53, 131–135.
Urban, T., Kuciel, J., and Mikolasova, R. (2002). Polymorphism of genes encoding for
ryanodine receptor, growth hormone, leptin and MYC protooncogene protein and meat
production in Duroc pigs. Czech J. Anim. Sci. 47, 411–417.
Verploegen, S. A. B. W., Plaetinck, G., Devos, R., Van der Heyden, J., and Guisez, Y. (1997). A
human leptin mutant induces weight gain in normal mice. FEBS Lett. 405, 237–240.
Wang, J., Liu, R., Hawkins, M., Barzilai, N., and Rosetti, L. (1998). A nutrient‐sensingpathway regulates leptin gene expresssion in muscle and fat. Nature 393, 684–688.
Wang,J.,Liu,R.,Liu,L.,Chowdhury,R.,Barzilai,N.,Tan,J.,andRossetti,L. (1999).TheeVectof
leptin on Lep expression is tissue‐specific and nutritionally regulated.Nat. Med. 5, 895–899.
Wiesner, G., Vaz, M., Collier, G., Seals, D., Kaye, D., Jennings, G., Lambert, G., Wilkinson,
D., and Esler, M. (1999). Leptin is released from the human brain: Influence of adiposity
and gender. J. Clin. Endocrinol. Metabol. 84, 2270–2274.
Wilkins, R. J., and Davey, H. W. (1997). A polymorphic microsatellite in the bovine leptin gene.
Anim. Genet. 28, 376.
Yiannakouris, N., Melistas, L., Yannakoulia, M., Mungal, K., and Mantzoros, C. S. (2003).
The –2548G/A polymorphism in the human leptin gene promoter region is associated with
plasma free leptin levels; interaction with adiposity and gender in healthy subjects.
Hormones 2, 229–236.
Zabeau, L., Lavens, D., Peelman, F., Eyckerman, S., Vandekerckhove, J., and Tavernier, J.
(2003). The ins and outs of leptin receptor activation. FEBS Lett. 546, 45–50.
Zhang, F., Basinski, M. B., Beals, J. M., Briggs, S. L., Churgay, L. M., Clawson, D. K.,
Di Marchi, R. D., Furman, T. C., Hale, J. E., Hsiung, H. M., Schoner, B. E., Smith, D. P.,
Zhang, X. Y., Wery, J.‐P., and Schevitz, R. W. (1997). Crystal structure of the obese protein
leptin‐E100. Nature 387, 206–209.
Zhang, Y., Proenca, R., MaVei, M., Barone, M., Leopold, L., and Friedman, J. M. (1994).
Positional cloning of the mouse obese gene and its human homologue. Nature 372, 425–432.
Zhang, Z. J., Yao, Z. J., Mou, X. D., Chen, J. F., Zhu, R. X., Liu, W., Zhang, X. R., Sun, J., and
Hou,G. (2003). Association of –2548G/A functional polymorphism in the promoter region of
leptin gene with antipsychotic agent‐induced weight gain.Chin. Med. J. 83, 2119–2123.
Related Documents