By Thomas H. Cohen, J.D., Ph.D. BJS Statistician Totals and trends • During 2001 an estimated 3,698 contract cases were disposed of by trial in State courts of general jurisdiction in the Nation’s 75 largest counties. Contract cases represented nearly a third of all civil trials in these counties. • Judges adjudicated 56% of contract cases, while juries decided the remaining 44%. • The 3,698 contract trials disposed of in 2001 repre- sented a 24% decline from the 4,850 contract trials disposed of in these counties in 1996. • About half (54%) of the contract cases disposed of by trial in the Nation's 75 largest counties in 2001 involved failed agreements between buyers and sellers. In most contract trials, the litigants were either individuals suing businesses (33%) or non-individuals such as businesses, hospitals, or governments suing businesses (26%). Plaintiff winners • Plaintiffs won in 65% of contract trials. Plaintiffs were more likely to prevail in contract trials decided by a judge (68%) than by a jury (62%). • The overall plaintiff win rate in contract trials remained relatively unchanged from 1996. Plaintiff win rates in contract jury trials, however, increased from 56% in 1996 to 62% in 2001. Damage awards • In 2001 the overall median damage award, which includes both compensatory and punitive damages, for plaintiff winners in contract trials was $45,000. • Plaintiff winners garnered higher median damage awards in contract jury trials ($81,000) compared to contract bench trials ($30,000). • Nearly 11% of plaintiff winners in contract jury trials received awards of $1 million or more, while about 2% of plaintiff winners in contract bench trials won damages totaling $1 million. • No significant changes were found in the median damage awards in contract jury or bench trials disposed of in the Nation’s 75 largest counties from 1996 to 2001. Punitive damages • In 2001 punitive damages were awarded to 6% of plaintiff winners in contract trials. In cases with plain- tiff winners, judges imposed punitive damages in 3% of contract trials, while juries awarded punitive damages in 10% of contract trials. • Punitive damages were awarded most frequently in contract trials involving fraud, employment discrimina- tion, or partnership dispute claims. • The median punitive damage award for plaintiff winners in contract trials was $83,000 (not shown in a table). Bureau of Justice Statistics Selected Findings Civil Justice Survey of State Courts, 2001 Contract Trials and Verdicts in Large Counties, 2001 January 2005, NCJ 207388 U.S. Department of Justice Office of Justice Programs

Legal Finance Journal Contract Trials Bureau of Justice Statistics
Mar 23, 2016
This is a Bureau of Justice Statistics selected finding of contract tirals and verdicts in large counties from 2001.
Welcome message from author
This document is posted to help you gain knowledge. Please leave a comment to let me know what you think about it! Share it to your friends and learn new things together.
Transcript

By Thomas H. Cohen, J.D., Ph.D.BJS Statistician
Totals and trends
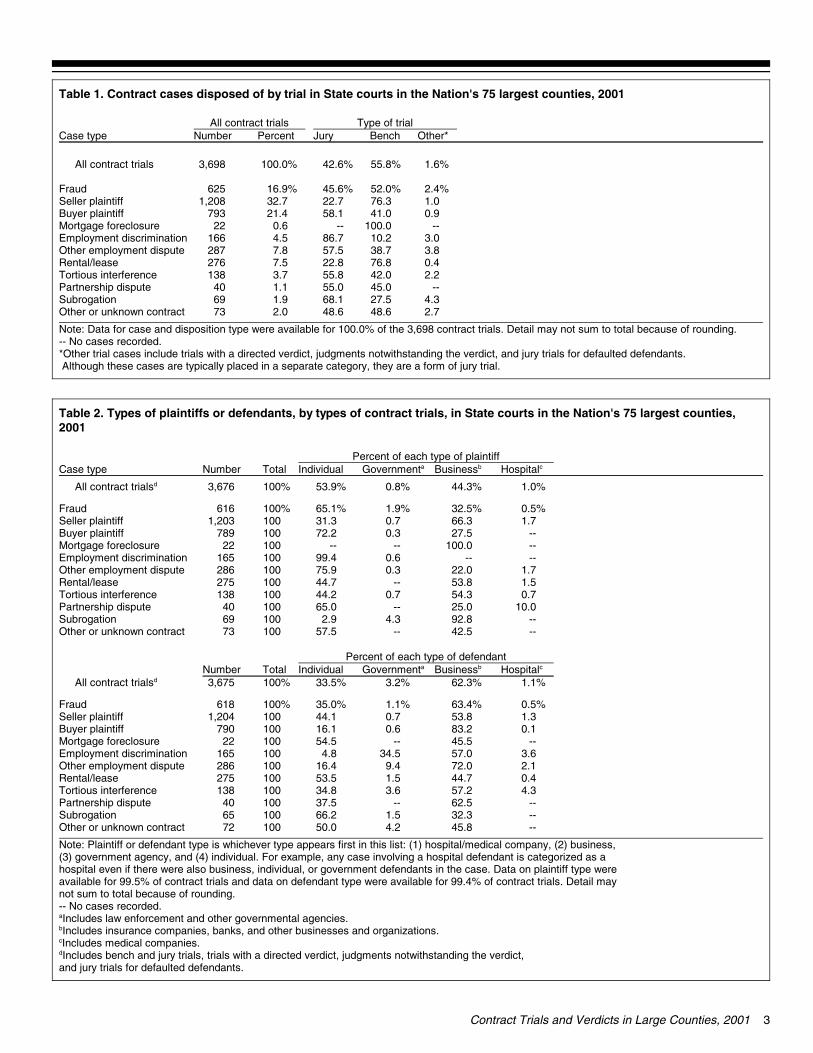
• During 2001 an estimated 3,698 contract caseswere disposed of by trial in State courts of generaljurisdiction in the Nation’s 75 largest counties.Contract cases represented nearly a third of all civiltrials in these counties.
• Judges adjudicated 56% of contract cases, whilejuries decided the remaining 44%.
• The 3,698 contract trials disposed of in 2001 repre-sented a 24% decline from the 4,850 contract trialsdisposed of in these counties in 1996.
• About half (54%) of the contract cases disposed ofby trial in the Nation's 75 largest counties in 2001involved failed agreements between buyers andsellers. In most contract trials, the litigants were eitherindividuals suing businesses (33%) or non-individualssuch as businesses, hospitals, or governments suingbusinesses (26%).
Plaintiff winners
• Plaintiffs won in 65% of contract trials. Plaintiffswere more likely to prevail in contract trials decidedby a judge (68%) than by a jury (62%).
• The overall plaintiff win rate in contract trialsremained relatively unchanged from 1996. Plaintiffwin rates in contract jury trials, however, increasedfrom 56% in 1996 to 62% in 2001.
Damage awards
• In 2001 the overall median damage award, whichincludes both compensatory and punitive damages,for plaintiff winners in contract trials was $45,000.
• Plaintiff winners garnered higher median damageawards in contract jury trials ($81,000) compared tocontract bench trials ($30,000).
• Nearly 11% of plaintiff winners in contract jury trialsreceived awards of $1 million or more, while about2% of plaintiff winners in contract bench trials wondamages totaling $1 million.
• No significant changes were found in the mediandamage awards in contract jury or bench trialsdisposed of in the Nation’s 75 largest counties from1996 to 2001.
Punitive damages
• In 2001 punitive damages were awarded to 6% ofplaintiff winners in contract trials. In cases with plain-tiff winners, judges imposed punitive damages in 3%of contract trials, while juries awarded punitivedamages in 10% of contract trials.
• Punitive damages were awarded most frequently incontract trials involving fraud, employment discrimina-tion, or partnership dispute claims.
• The median punitive damage award for plaintiffwinners in contract trials was $83,000 (not shown in a table).
Bureau of Justice StatisticsSelected Findings
Civil Justice Survey of State Courts, 2001
Contract Trials and Verdicts in LargeCounties, 2001
January 2005, NCJ 207388
U.S. Department of JusticeOffice of Justice Programs
middletp
Note
This report is one in a series. More recent editions may be available. To view a list of all in the series go to http://www.ojp.usdoj.gov/bjs/pubalp2.htm#ctvlc
• The median punitive damage award for plaintiffwinners in contract trials was $83,000 (not shown in a table).
Time to disposition
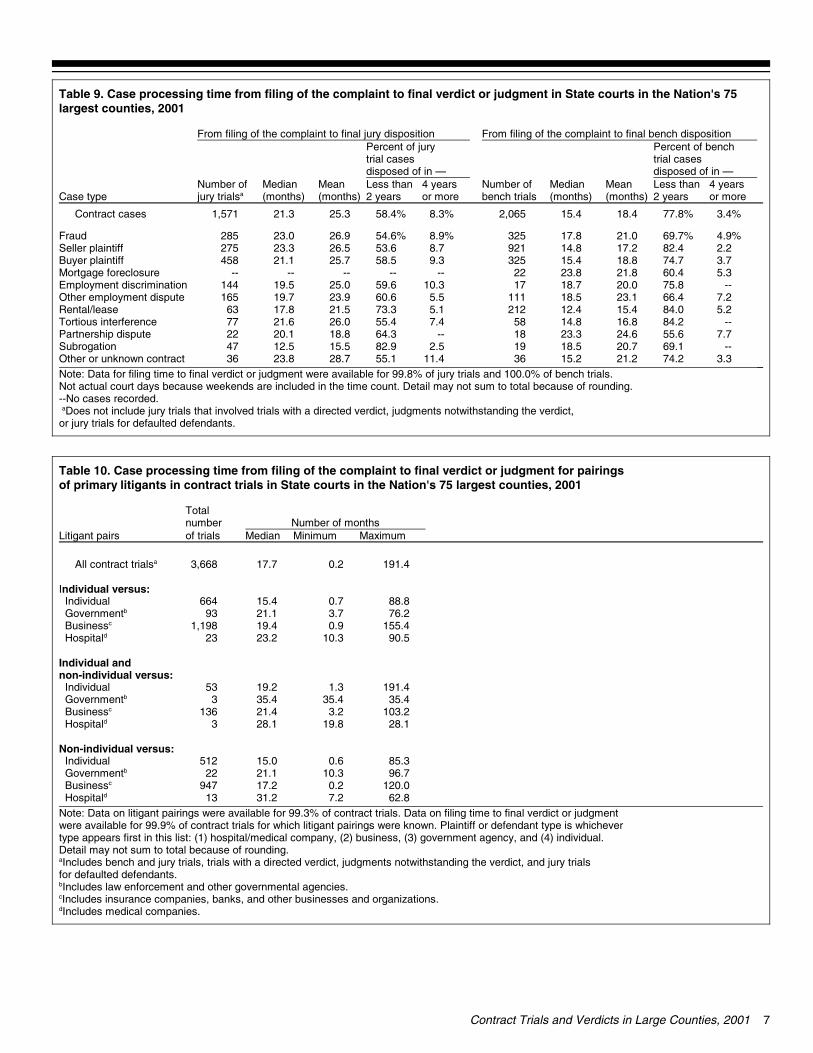
• Contract cases tried before a jury took slightly over2 years (25 months) on average to proceed from filingto disposition. Contract bench trials, in comparison,were disposed within an average of 18 months.
Post verdict relief • Plaintiffs filed motions for post verdict relief in 12%of contract trials that they won, while defendantsrequested post verdict relief in 26% of contract trialswith a plaintiff winner.
• Motions for new trials or award modifications wereamong the most common types of post verdict reliefsought by plaintiff winners. Defendants maderequests for new trials in about 60% of contract trialsin which they sought post verdict relief.
• Plaintiffs filed motions for post verdict relief in 18%of contract trials that they lost. Defendants engagedin post verdict activity in less than 10% of contracttrials without a plaintiff winner.
• The courts granted post verdict relief to 57% ofplaintiff winners seeking to have their verdictmodified. The most common type of post verdict reliefgranted to these plaintiffs was an award modification.Among contract trials in which the plaintiff lost, postverdict relief was granted to 12% of plaintiffs whosought some form of post trial relief.
• Post verdict relief was granted to about a third ofdefendants who sought to modify a favorable plaintiffverdict or judgment. In almost half of these cases, the relief granted was in the form of an awardmodification.
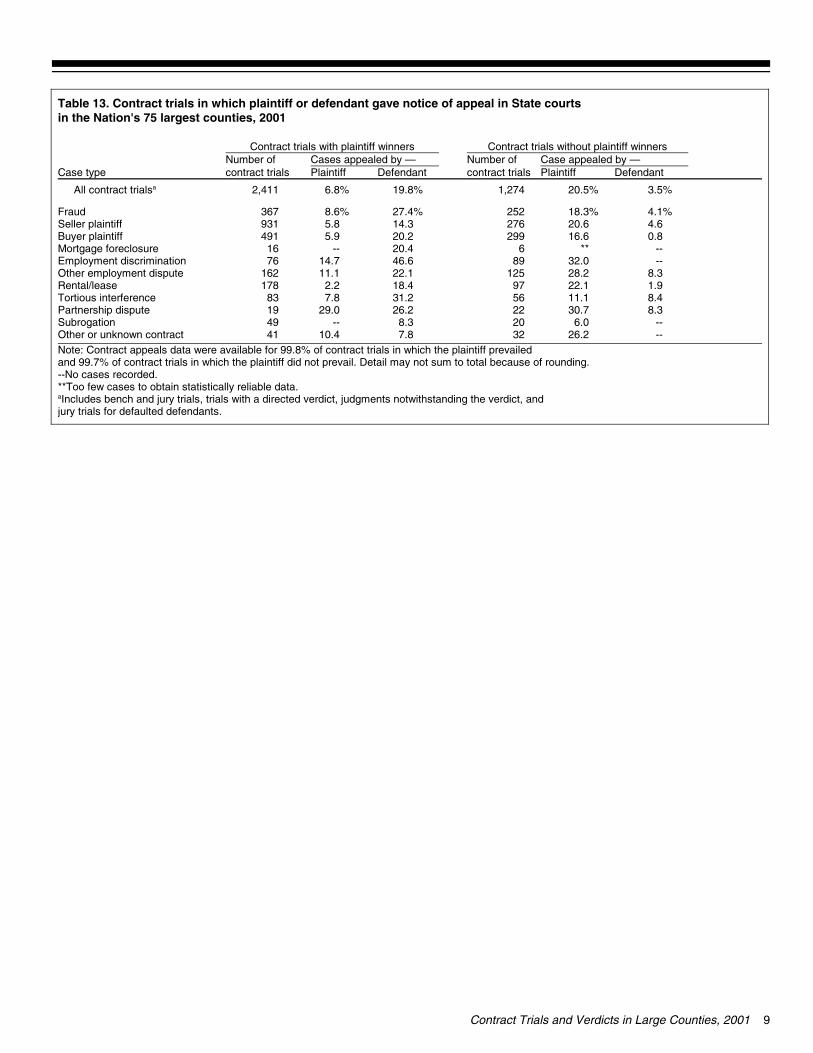
• Plaintiffs filed appeals in 7% of contract trials in which they prevailed and 21% of contract trials in which they lost. Defendants gave notice of appealin 20% of contract trials with a plaintiff winner and 4%of contract trials where the plaintiff did not receive afavorable verdict.
Types of litigants
• In 54% of contract trials, the primary plaintiff litigantwas an individual. Businesses were plaintiffs in 44%of contract trials, while government agencies andhospitals represented fewer than 5% of plaintiffs incontract trials.
• Businesses were defendants in nearly two-thirds(62%) of contract trials disposed of in the Nation’s 75largest counties, while individuals were defendants inabout a third (34%) of contract trials. Governmentsand hospitals represented less than 5% of defendantsin contract trials.
Litigant pairings and case outcomes
• Individual plaintiffs prevailed in an estimated three-fifths of contract trials where they sued an individual(59%) or business (60%) defendant. The total mediandamage awards individual plaintiff winners received inthese contract trials was $31,000 and $50,000,respectively.
• Non-individual plaintiffs (businesses, governments,and hospitals) prevailed in nearly three-fourths ofcontract trials in which the defendant was an individ-ual (71%) or business (74%). The total mediandamage award for non-individual plaintiff winners was$60,000 in contract trials involving a business defen-dant and $20,000 in trials with an individual asdefendant.
2 Contract Trials and Verdicts in Large Counties, 2001
Contract Trials and Verdicts in Large Counties, 2001 3
Note: Data for case and disposition type were available for 100.0% of the 3,698 contract trials. Detail may not sum to total because of rounding. -- No cases recorded.*Other trial cases include trials with a directed verdict, judgments notwithstanding the verdict, and jury trials for defaulted defendants. Although these cases are typically placed in a separate category, they are a form of jury trial.
2.748.648.62.073Other or unknown contract4.327.568.11.969Subrogation --45.055.01.140Partnership dispute
2.242.055.83.7138Tortious interference0.476.822.87.5276Rental/lease3.838.757.57.8287Other employment dispute3.010.286.74.5166Employment discrimination --100.0 --0.622Mortgage foreclosure
0.941.058.121.4793Buyer plaintiff1.076.322.732.71,208Seller plaintiff2.4%52.0%45.6%16.9%625Fraud
1.6%55.8%42.6%100.0%3,698All contract trials
Other*BenchJury PercentNumberCase typeType of trialAll contract trials
Table 1. Contract cases disposed of by trial in State courts in the Nation's 75 largest counties, 2001
Note: Plaintiff or defendant type is whichever type appears first in this list: (1) hospital/medical company, (2) business, (3) government agency, and (4) individual. For example, any case involving a hospital defendant is categorized as a hospital even if there were also business, individual, or government defendants in the case. Data on plaintiff type were available for 99.5% of contract trials and data on defendant type were available for 99.4% of contract trials. Detail may not sum to total because of rounding.-- No cases recorded. aIncludes law enforcement and other governmental agencies. bIncludes insurance companies, banks, and other businesses and organizations. cIncludes medical companies. dIncludes bench and jury trials, trials with a directed verdict, judgments notwithstanding the verdict, and jury trials for defaulted defendants.
--45.84.250.010072Other or unknown contract --32.31.566.210065Subrogation --62.5 --37.510040Partnership dispute
4.357.23.634.8100138Tortious interference0.444.71.553.5100275Rental/lease2.172.09.416.4100286Other employment dispute3.657.034.54.8100165Employment discrimination --45.5 --54.510022Mortgage foreclosure
0.183.20.616.1100790Buyer plaintiff1.353.80.744.11001,204Seller plaintiff0.5%63.4%1.1%35.0%100%618Fraud
1.1%62.3%3.2%33.5%100%3,675All contract trialsdHospitalcBusinessbGovernmentaIndividualTotalNumber
Percent of each type of defendant
--42.5 --57.510073Other or unknown contract --92.84.32.910069Subrogation
10.025.0 --65.010040Partnership dispute0.754.30.744.2100138Tortious interference1.553.8 --44.7100275Rental/lease1.722.00.375.9100286Other employment dispute -- --0.699.4100165Employment discrimination --100.0 -- --10022Mortgage foreclosure --27.50.372.2100789Buyer plaintiff
1.766.30.731.31001,203Seller plaintiff0.5%32.5%1.9%65.1%100%616Fraud
1.0%44.3%0.8%53.9%100%3,676All contract trialsd
HospitalcBusinessbGovernmentaIndividualTotalNumberCase typePercent of each type of plaintiff
Table 2. Types of plaintiffs or defendants, by types of contract trials, in State courts in the Nation's 75 largest counties,2001

4 Contract Trials and Verdicts in Large Counties, 2001
Note: Plaintiff or defendant type is whichever type appears first in this list: (1) hospital/medical company, (2) business, (3) government agency, and (4) individual. For example, any case involving a hospital defendant is categorized as a hospital even if there were also business, individual, or government defendants in the case. Data on litigant pairings were available for 99.3% of all contract trials, 98.2% of fraud trials, 99.7% of seller plaintiff trials, and 99.6% of buyer plaintiff trials. Detail may not sum to total because of rounding. --No cases recorded. aIncludes bench and jury trials, trials with a directed verdict, judgments notwithstanding the verdict, and jury trials for defaulted defendants. bIncludes law enforcement and other governmental agencies. cIncludes insurance companies, banks, and other businesses and organizations. dIncludes medical companies.eIncludes pairings where both an individual and non-individual plaintiff sued an individual, government, hospital, or business defendant.
5.1%403.9%487.5%465.3%195Other litigant pairingse
-- --0.78 -- --0.413Hospitald19.015040.348520.712725.8948Businessc0.540.670.530.622Governmentb3.2%2623.2%2796.2%3814.0%512Individual
Non-individual versus:
0.110.560.320.623Hospitald59.246811.313637.723232.71,201Businessc0.110.220.642.593Governmentb
12.7%10019.4%23326.3%16118.1%664IndividualIndividual versus:
100.0%790100.0%1,204100.0%614100.0%3,672All contract trialsa
Percentof trialsPercentof trialsPercentof trialsPercentof trialsprimary defendantNumberNumberNumberNumberPlaintiff versus
Buyer plaintiffSeller plaintiffFraudAll contract trials
Table 3. Pairings of primary litigants in selected types of contract trials in State courts in the Nation's 75 largest counties, 2001
Note: Data on plaintiff winners were available for 99.9% of all contract trials. Detail may not sum to total because of rounding. --No cases recorded. aIncludes bench and jury trials, trials with a directed verdict, judgments notwithstanding the verdict, and jury trials for defaulted defendants. bDoes not include jury trials that involved trials with a directed verdict, judgments notwithstanding the verdict, and jury trials for defaulted defendants. cExcludes bifurcated trials where the plaintiff litigated only the damage claim.
55.63654.33556.273Other or unknown contract100.01950.04067.261Subrogation16.71868.22246.341Partnership dispute56.95857.77157.9133Tortious interference65.621263.56364.9276Rental/lease47.210863.216355.7282Other employment dispute41.21745.713843.8160Employment discrimination72.722-- --72.722Mortgage foreclosure60.932062.645261.5779Buyer plaintiff78.991370.127176.81,196Seller plaintiff56.7%31461.5%27358.3%602Fraud
67.8%2,03761.6%1,52864.8%3,625Contract cases
winnerscNumberwinnerscNumberwinnerscNumberCase typePlaintiffPlaintiffPlaintiff
Bench trialsJury trialsbAll contract trialsa
Table 4. Contract trial plaintiff winners in State courts in the Nation's 75 largest counties, 2001

Contract Trials and Verdicts in Large Counties, 2001 5
Note: Data for final awards were available for 98.9% of all sampled contract trials. Final amount awarded includes both compensatory (reduced for contributory negligence) and punitive damage awards. Detail may not sum to total because of rounding. Award data were rounded to the nearest thousand.*The number of plaintiffs awarded damages may differ from the number calculated from the percentage of plaintiffs who successfully litigated the case (table 4). Missing award data, the fact that in some cases plaintiff winners receive nothing because of award reductions, and the inclusion of plaintiff winners in bifurcated damage trials (a group excluded from table 4) account for some of this difference.-- No cases recorded. aExcludes bifurcated trials where the plaintiff won on only the liability claim. Bifurcated trials involving only damage Claims, however, have been included. bIncludes bench and jury trials, trials with a directed verdict, judgments notwithstanding the verdict, and jury trials for defaulted defendants.
7.113.922,0006,369,00041Other or unknown contract --4.18,0002,047,00044Subrogation
12.841.897,00052,462,00019Partnership dispute6.930.794,000580,211,00083Tortious interference2.611.920,00024,112,000176Rental/lease4.823.878,000265,939,000162Other employment dispute
14.439.4166,00044,913,00073Employment discrimination13.613.670,0002,731,00013Mortgage foreclosure4.817.745,000130,585,000477Buyer plaintiff2.910.534,000165,336,000925Seller plaintiff
12.0%30.2%$81,000$768,506,000358Fraud
5.4%17.7%$45,000$2,043,211,0002,369*All contract trialsb
$1 million or moreOver $250,000MedianTotal to plaintiff winnersaCase type
Percent of plaintiff winners with final awards —
Final amount awarded to plaintiff winners
Contract trials withdamages awarded
Table 5. Final damage awards for contract trials with plaintiff winners in State courts in the Nation's 75 largest counties, 2001
Note: Data for final awards in jury contract trials were available for 99.1% of all jury plaintiff winners. Data for final awards in bench contract trials were available for 99.0% of all bench plaintiff winners. Final amount awarded includes both compensatory (reduced for contributory negligence), fees and costs, and punitive damage awards. Award data were rounded to the nearest thousand.--No cases recorded. **Too few cases to obtain statistically reliable data.aDoes not include jury trials that involved trials with a directed verdict, judgments notwithstanding the verdict, and jury trials for defaulted defendants.
--6.65,000977,00020Other or unknown contract --12.328,000786,00015Subrogation --**191,000851,0003Partnership dispute --8.744,0004,274,00033Tortious interference
0.79.014,00010,737,000136Rental/lease --15.458,0007,754,00054Other employment dispute -- --40,000297,0007Employment discrimination
13.613.670,0002,731,00013Mortgage foreclosure1.46.916,00031,772,000198Buyer plaintiff1.67.829,00096,873,000724Seller plaintiff4.6%28.0%$61,000$115,173,000179Fraud
1.9%10.9%$30,000$272,226,0001,381Bench trials
14.922.577,0005,370,00019Other or unknown contract -- --8,0001,248,00026Subrogation
15.741.690,00051,610,00015Partnership dispute12.348.1117,000575,307,00047Tortious interference9.021.581,00013,375,00040Rental/lease7.428.883,000257,999,000105Other employment dispute
16.043.6218,00044,616,00066Employment discrimination -- -- -- -- --Mortgage foreclosure
7.325.162,00098,538,000278Buyer plaintiff7.920.968,00067,816,000194Seller plaintiff
20.1%33.3%$87,000$653,154,000174Fraud
10.7%27.9%$81,000$1,769,033,000964Jury trialsa
$1 million or moreOver $250,000MedianTotal NumberCase typePercent of trials with final awards --Final amount awarded to plaintiff winners
Table 6. Final award amounts for civil jury and bench contract trials with plaintiff winners in State courts in the Nation's 75 largest counties, 2001

6 Contract Trials and Verdicts in Large Counties, 2001
Note: Data for punitive damage awards in jury contract trials were available for 99.5% of all jury plaintiff winners. Data for punitive damage awards in bench contract trials were available for 100.0% of all bench plaintiff winners. Not shown are jury trials that involve trials with a directed verdict, judgments notwithstanding the verdict, and jury trials for defaulted defendants. These cases accounted for 1 punitive damage verdict with a plaintiff winner. In this study, cases are classified by the primary case type, though many cases involve multiple claims (that is, contract and tort). Under laws in almost all States, only tort claims qualify for punitive damages. If contract cases involved punitive damages, it involved a related tort claim.Detail may not sum to total because of rounding. --No cases recorded.*Not median but the actual amount awarded.
-- --1,000*500*11Other or unknown contract -- -- -- -- -- --Subrogation --1 --186,000 --4Partnership dispute --110,000*92,00018Tortious interference --2 --15,000 --9Rental/lease --1 --151,000 --16Other employment dispute --5 --606,000--13Employment discrimination -- -- -- -- -- --Mortgage foreclosure --382,000*275,000115Buyer plaintiff ----5,0004,00045Seller plaintiff --5$52,000$100,0003227Fraud
--18$46,000$111,0003998Contract cases
BenchJuryBenchJury damagesdamagesCase type
Number of trials with punitive damages of $1 million or more —Median damages awarded
awarded punitive
awardedpunitive
Bench trialsJury trialsPunitive damages awarded to plaintiff winners in jury and bench contract trials
Table 7. Punitive damages awarded to plaintiff winners in contract jury and bench trials in the Nation's 75 largest counties, 2001
Note: Data on litigant pairings were available for 99.3% of plaintiff award winners. Plaintiff or defendant type is whichever type appears first in this list: (1) hospital/medical company, (2) business, (3) government agency, and (4) individual. *The number of plaintiffs awarded damages may differ from the number calculated from the percentage of plaintiffs who successfully litigated thecase. Missing award data, the fact that in some cases plaintiff winners receive nothing because of award reductions, and the inclusion of plaintiffwinners in bifurcated damage trials (a group excluded from the plaintiff winner calculation) account for some of this difference. Award data wererounded to the nearest thousand. Detail may not sum to total because of rounding.--No cases recorded. **Too few cases to obtain statistically reliable data.aIncludes bench and jury trials, trials with a directed verdict, judgments notwithstanding the verdict, and jury trials for defaulted defendants. bIncludes law enforcement and other governmental agencies. cIncludes insurance companies, banks, and other businesses and organizations. dIncludes medical companies.
-- -- --212,0008,533,0001076.913 Hospitald75,000795,528,0002460,0001,209,075,00069474.2938 Businessc
-- -- --364,00022,283,0001881.822 Governmentb$30,000$784,00013$20,000$62,912,00036171.0%503 Individual
Non-individual versus:
-- -- --5,730,00013,115,0003**3 Hospitald263,0001,341,000554,000107,283,0008158.8131 Businessc
-- -- -- -- -- --**3 Governmentb$83,000$2,400,0005$57,000$39,658,0004076.5%51 Individual
non-individual versus:Individual and
4,000240,0004342,0003,198,000939.123 Hospitald150,00044,745,0004950,000498,793,00070659.51,175 Businessc995,0005,993,0006223,00025,275,0003941.689 Governmentb$46,000$3,506,00028$31,000$51,744,00039159.4%650 Individual
Individual versus:
$100,000$854,536,000133$45,000$2,041,869,0002,354*64.7%3,601All contract trialsa
MedianTotalof trialsMedianTotalof trialswinnersof trialsLitigant pairsNumberNumberplaintiffnumber
Punitive damages awarded to plaintiff winners
Final amount awarded to plaintiff winnersPercentTotal
Table 8. Pairings of primary types of litigants in contract trials in State courts in the Nation's 75 largest counties, 2001
Contract Trials and Verdicts in Large Counties, 2001 7
Note: Data for filing time to final verdict or judgment were available for 99.8% of jury trials and 100.0% of bench trials. Not actual court days because weekends are included in the time count. Detail may not sum to total because of rounding.--No cases recorded. aDoes not include jury trials that involved trials with a directed verdict, judgments notwithstanding the verdict, or jury trials for defaulted defendants.
3.374.221.215.23611.455.128.723.836Other or unknown contract --69.120.718.5192.582.915.512.547Subrogation
7.755.624.623.318 --64.318.820.122Partnership dispute --84.216.814.8587.455.426.021.677Tortious interference
5.284.015.412.42125.173.321.517.863Rental/lease7.266.423.118.51115.560.623.919.7165Other employment dispute --75.820.018.71710.359.625.019.5144Employment discrimination
5.360.421.823.822 -- -- -- -- --Mortgage foreclosure3.774.718.815.43259.358.525.721.1458Buyer plaintiff2.282.417.214.89218.753.626.523.3275Seller plaintiff4.9%69.7%21.017.83258.9%54.6%26.923.0285Fraud
3.4%77.8%18.415.42,0658.3%58.4%25.321.31,571Contract cases
or more2 years(months)(months)bench trialsor more2 years(months)(months)jury trialsaCase type4 yearsLess thanMeanMedianNumber of4 yearsLess thanMeanMedianNumber of
Percent of bench trial cases disposed of in —
Percent of jury trial cases disposed of in —
From filing of the complaint to final bench dispositionFrom filing of the complaint to final jury disposition
Table 9. Case processing time from filing of the complaint to final verdict or judgment in State courts in the Nation's 75largest counties, 2001
Note: Data on litigant pairings were available for 99.3% of contract trials. Data on filing time to final verdict or judgment were available for 99.9% of contract trials for which litigant pairings were known. Plaintiff or defendant type is whichever type appears first in this list: (1) hospital/medical company, (2) business, (3) government agency, and (4) individual. Detail may not sum to total because of rounding. aIncludes bench and jury trials, trials with a directed verdict, judgments notwithstanding the verdict, and jury trials for defaulted defendants. bIncludes law enforcement and other governmental agencies. cIncludes insurance companies, banks, and other businesses and organizations. dIncludes medical companies.
62.87.231.213 Hospitald120.00.217.2947 Businessc96.710.321.122 Governmentb85.30.615.0512 Individual
Non-individual versus:
28.119.828.13 Hospitald103.23.221.4136 Businessc35.435.435.43 Governmentb
191.41.319.253 Individualnon-individual versus:Individual and
90.510.323.223 Hospitald155.40.919.41,198 Businessc76.23.721.193 Governmentb88.80.715.4664 Individual
Individual versus:
191.40.217.73,668All contract trialsa
MaximumMinimumMedianof trialsLitigant pairsNumber of monthsnumber
Total
Table 10. Case processing time from filing of the complaint to final verdict or judgment for pairings of primary litigants in contract trials in State courts in the Nation's 75 largest counties, 2001

8 Contract Trials and Verdicts in Large Counties, 2001
Note: Post verdict motions filed by plaintiffs or defendants include motions for judgments notwithstanding the verdict (JNOV), amended judgments, new trials, award modifications, and other relief. aThe type of post verdict relief sought will not sum to 100% because the post verdict relief categories are not mutually exclusive. bFor contract trials in which plaintiffs prevailed, data on plaintiff and defendant post verdict activity were available for 99.6% of trials.cFor contract trials in which plaintiffs did not prevail, data on plaintiff post verdict activity were available for 98.8% of trials and data on defendant post verdict activity were available for 98.9% of trials.
35.519.125.626.81018.0 Defendants 8.6%7.5%65.2%35.5%23218.4% Plaintiffs
Plaintiff did not prevailc8.719.860.446.362826.1 Defendants
21.4%51.3%24.5%16.8%27711.5% Plaintiffs Plaintiff prevailedb
reliefmodificationtrialjudgmentNumberof all trialssought by —Other Award New JNOV or amendedPercentPost verdict relief
Percent of trials in which litigants sought post verdict reliefa
Contract trials in which post verdict relief was sought
Table 11. Type of post verdict relief sought by plaintiffs or defendants in contract trials in State courts in the Nation's 75 largest counties, 2001
Note: Post verdict motions filed by plaintiffs or defendants include motions for judgments notwithstanding the verdict, amended judgments, new trials, award modifications, and other relief.*The number of litigants seeking post verdict relief in table 12 differs from the number posted in table 11 because of missing or incomplete post verdict relief granted data. aThe type of post verdict relief granted will not sum to 100% because the post verdict relief categories are not mutually exclusive.bAmong trials where plaintiffs prevailed, data on the granting of post verdict relief were available for 95.9% of the 277 trials in which the plaintiff sought post verdict relief and 97.3% of the 628 trials in which the defendant sought post verdict relief. cAmong trials where plaintiffs did not prevail, data on the granting of post verdict relief were available for 95.1% of the 232 trials in which the plaintiff sought post verdict relief and 93.5% of the 101 trials in which the defendant sought post verdict relief.
53.929.07.49.647.895Defendants26.4%28.4%12.6%32.6%11.5%220Plaintiffs
Plaintiff did not prevailc
21.747.018.319.430.5611Defendants23.0%67.7%5.4%11.8%57.1%266Plaintiffs
Plaintiff prevailedb
reliefmodificationtrialjudgmentwas grantedsought*granted to --Other Award New
JNOV oramended
Percent inwhich reliefNumberPost verdict relief
Percent of contract trials in which litigants soughtand were granted reliefa
Post verdict relief in contract trials
Table 12. Type of post verdict relief granted to plaintiffs or defendants in contract trialsin State courts in the Nation's 75 largest counties, 2001
Contract Trials and Verdicts in Large Counties, 2001 9
Note: Contract appeals data were available for 99.8% of contract trials in which the plaintiff prevailed and 99.7% of contract trials in which the plaintiff did not prevail. Detail may not sum to total because of rounding.--No cases recorded. **Too few cases to obtain statistically reliable data.aIncludes bench and jury trials, trials with a directed verdict, judgments notwithstanding the verdict, and jury trials for defaulted defendants.
--26.2327.810.441Other or unknown contract --6.0208.3 --49Subrogation
8.330.72226.229.019Partnership dispute8.411.15631.27.883Tortious interference1.922.19718.42.2178Rental/lease8.328.212522.111.1162Other employment dispute --32.08946.614.776Employment discrimination --**620.4 --16Mortgage foreclosure
0.816.629920.25.9491Buyer plaintiff4.620.627614.35.8931Seller plaintiff4.1%18.3%25227.4%8.6%367Fraud
3.5%20.5%1,27419.8%6.8%2,411All contract trialsa
DefendantPlaintiff contract trialsDefendantPlaintiff contract trialsCase typeCase appealed by —Number of Cases appealed by —Number of
Contract trials without plaintiff winnersContract trials with plaintiff winners
Table 13. Contract trials in which plaintiff or defendant gave notice of appeal in State courts in the Nation's 75 largest counties, 2001

Note: The number of contract trials includes bench and jury trials, trials with a directed verdict, judgments notwithstanding the verdict, and jury trials for defaulted defendants adjudicated in 1996 and 2001. *1996 - 2001 difference is significant at the 95%-confidence interval. aData on plaintiff winners were available for 99.9% of contract trials in 1996 and 99.9% of contract trials in 2001. bData on plaintiff final awards were available for 98.1% of contract trials with plaintiff winners in 1996 and 98.9% of contract trials with plaintiff winners in 2001. cData on punitive damages awarded to plaintiff winners were available for 99.9% of contract trials with plaintiff winners in 1996 and 98.3% of contract trials with plaintiff winners in 2001. dData on time to disposition were available for 92.1% of contract trials in 1996 and 99.9% of contract trials in 2001.
Data sources: Civil Justice Survey of State Courts, 1996 (ICPSR 2883) and 2001 (ICPSR 3957). Data can be obtained from the National Archive of Criminal Justice Data, University of Michigan Inter-university Consortium for Political and Social Research (ICPSR) at <http://www.icpsr.umich.edu/>.
15.415.8Contract bench trials21.322.5Contract jury trials17.7 mo18.4 moAll contract trials
(Median case processing time)of contract trials take?dHow long did disposition
2.83.6Contract bench trials10.110.8Contract jury trials5.8%6.3%All contract trials
What percentage of plaintiffs won punitive damages?c
30,00028,000Contract bench trials81,00090,000Contract jury trials
$45,000$42,000All contract trials(adjusted for inflation) inOverall median award amounts plaintiffs win?bHow much did prevailing
67.867.8Contract bench trials61.6*55.6Contract jury trials64.8%62.4%All contract trials
plaintiffs won?aWhat percentage of
3,698*4,850disposed of by trial?How many contract cases were
20011996
Table 14. Comparing contract trials in State courts in theNation's 75 largest counties, 1996 to 2001
10 Contract Trials and Verdicts in Large Counties, 2001
Contract Trials and Verdicts in Large Counties, 2001 11
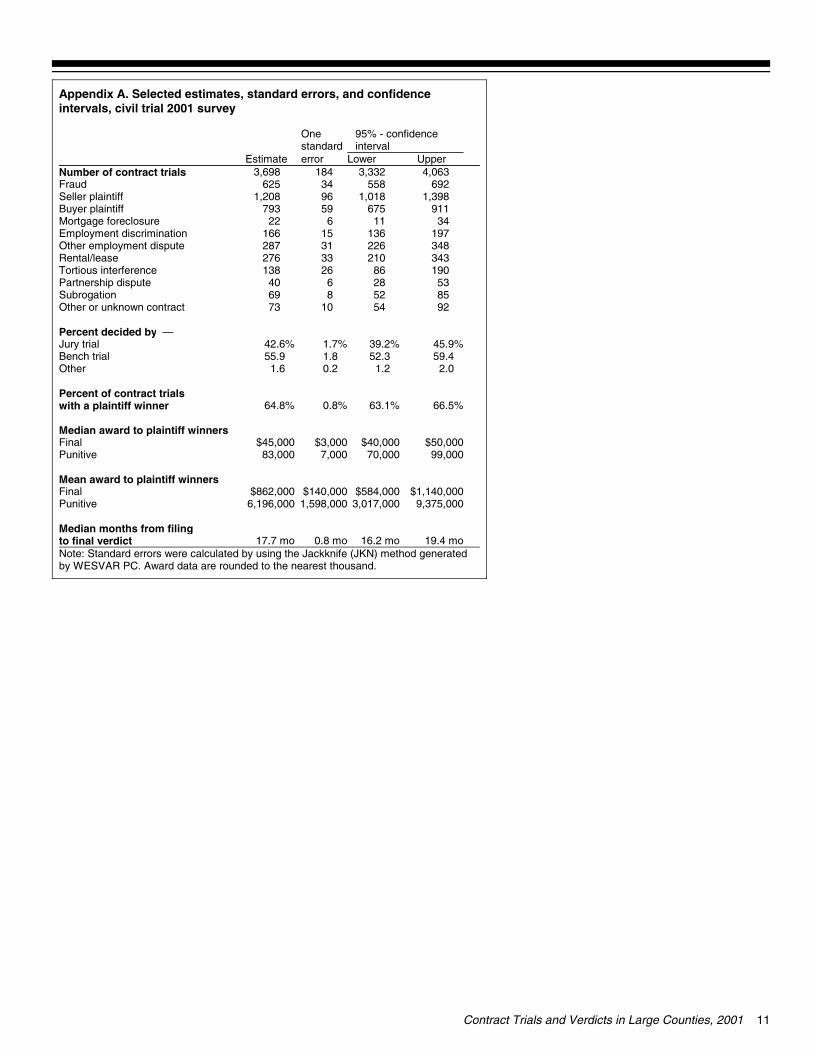
Note: Standard errors were calculated by using the Jackknife (JKN) method generatedby WESVAR PC. Award data are rounded to the nearest thousand.
19.4 mo16.2 mo0.8 mo17.7 moto final verdictMedian months from filing
9,375,0003,017,0001,598,0006,196,000Punitive$1,140,000$584,000$140,000$862,000Final
Mean award to plaintiff winners
99,00070,0007,00083,000Punitive$50,000$40,000$3,000$45,000Final
Median award to plaintiff winners
66.5%63.1%0.8%64.8%with a plaintiff winnerPercent of contract trials
2.01.20.21.6Other59.452.31.855.9Bench trial45.9%39.2%1.7%42.6%Jury trial
Percent decided by —
92541073Other or unknown contract8552869Subrogation5328640Partnership dispute
1908626138Tortious interference34321033276Rental/lease34822631287Other employment dispute19713615166Employment discrimination3411622Mortgage foreclosure
91167559793Buyer plaintiff1,3981,018961,208Seller plaintiff
69255834625Fraud4,0633,3321843,698Number of contract trials
UpperLowererrorEstimate
95% - confidenceinterval
Onestandard
Appendix A. Selected estimates, standard errors, and confidence intervals, civil trial 2001 survey

12 Contract Trials and Verdicts in Large Counties, 2001
**Too few cases to obtain statistically reliable data.aIncludes bench and jury trials, trials with a directed verdict, judgments notwithstanding the verdict, and jury trials fordefaulted defendants. bLos Angeles County suburban courts were not included.
43.330San Bernardino, CA**8Worcester, MA
50.024Middlesex, MA**4Essex, MA
52.853Wayne, MI54.5%22Mecklenburg, NC
55.627Milwaukee, WI55.843Alameda, CA56.1173Orange, CA56.676King, WA58.2177Harris, TX58.817Contra Costa, CA60.045Jefferson, KY60.453New York, NY60.576Hennepin, MN61.0%82Dallas, TX
61.526Middlesex, NJ61.539Marion, IN61.963Palm Beach, FL62.274Cuyahoga, OH62.767St. Louis, MO63.073Maricopa, AZ63.165San Francisco, CA63.611Hartford, CT63.858Bergen, NJ63.8%58Cook, IL
64.445Bexar, TX66.2148Los Angeles, CA b67.671Oakland, MI68.457Franklin, OH69.733Ventura, CA70.010Fairfield, CT70.020Fresno, CA70.020Pima, AZ73.315Honolulu, HI73.3%15Orange, FL
73.494Fairfax, VA74.297Philadelphia, PA74.335Fulton, GA74.551Du Page, IL75.8124Allegheny, PA76.146El Paso, TX77.827Essex, NJ78.041Santa Clara, CA80.010Suffolk, MA83.9%62Dade, FL
winnersNumberCountyplaintiffPercent
All contract trialsa
Appendix B. Contract trial winners in State courts, by sampled counties, 2001
Contract Trials and Verdicts in Large Counties, 2001 13
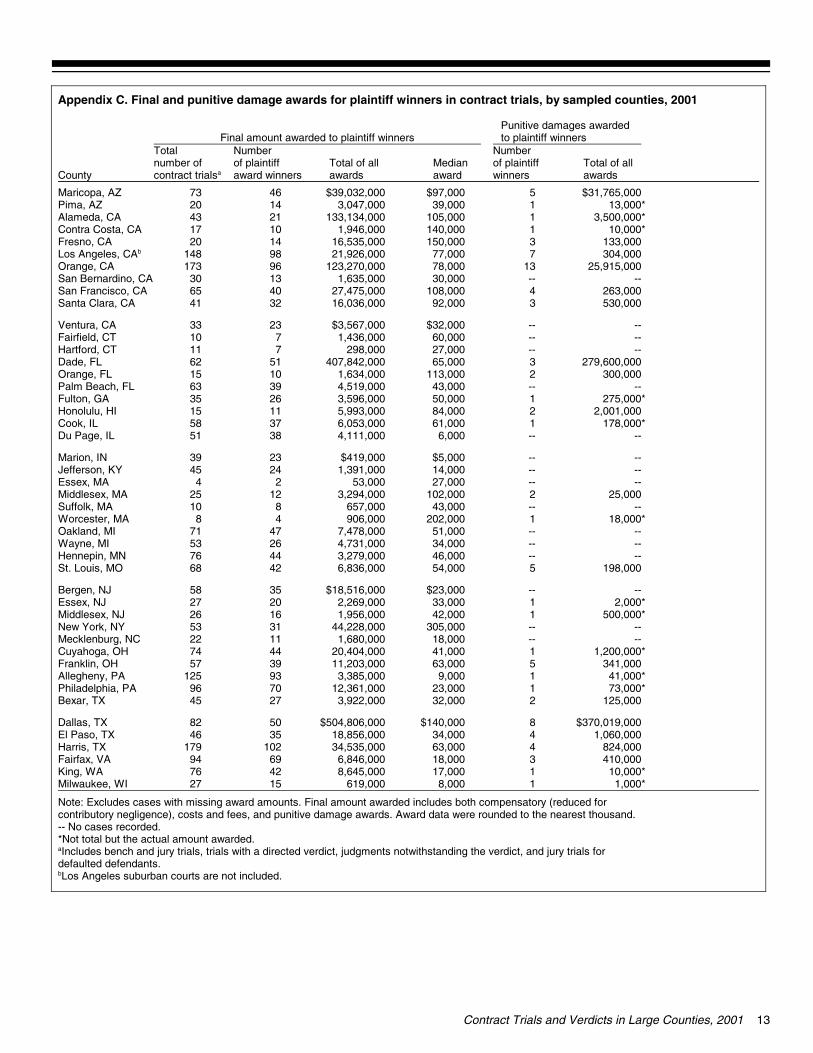
Note: Excludes cases with missing award amounts. Final amount awarded includes both compensatory (reduced for contributory negligence), costs and fees, and punitive damage awards. Award data were rounded to the nearest thousand.-- No cases recorded.*Not total but the actual amount awarded. aIncludes bench and jury trials, trials with a directed verdict, judgments notwithstanding the verdict, and jury trials for defaulted defendants.bLos Angeles suburban courts are not included.
*1,00018,000619,0001527Milwaukee, WI*10,000117,0008,645,0004276King, WA
410,000318,0006,846,0006994Fairfax, VA824,000463,00034,535,000102179Harris, TX
1,060,000434,00018,856,0003546El Paso, TX$370,019,0008$140,000$504,806,0005082Dallas, TX
125,000232,0003,922,0002745Bexar, TX*73,000123,00012,361,0007096Philadelphia, PA*41,00019,0003,385,00093125Allegheny, PA
341,000563,00011,203,0003957Franklin, OH*1,200,000141,00020,404,0004474Cuyahoga, OH
-- --18,0001,680,0001122Mecklenburg, NC -- --305,00044,228,0003153New York, NY
*500,000142,0001,956,0001626Middlesex, NJ*2,000133,0002,269,0002027Essex, NJ
-- --$23,000$18,516,0003558Bergen, NJ
198,000554,0006,836,0004268St. Louis, MO -- --46,0003,279,0004476Hennepin, MN -- --34,0004,731,0002653Wayne, MI -- --51,0007,478,0004771Oakland, MI
*18,0001202,000906,00048Worcester, MA -- --43,000657,000810Suffolk, MA
25,0002102,0003,294,0001225Middlesex, MA -- --27,00053,00024Essex, MA -- --14,0001,391,0002445Jefferson, KY -- --$5,000$419,0002339Marion, IN
----6,0004,111,0003851Du Page, IL*178,000161,0006,053,0003758Cook, IL
2,001,000284,0005,993,0001115Honolulu, HI*275,000150,0003,596,0002635Fulton, GA
-- --43,0004,519,0003963Palm Beach, FL300,0002113,0001,634,0001015Orange, FL
279,600,000365,000407,842,0005162Dade, FL -- --27,000298,000711Hartford, CT -- --60,0001,436,000710Fairfield, CT -- --$32,000$3,567,0002333Ventura, CA
530,000392,00016,036,0003241Santa Clara, CA263,0004108,00027,475,0004065San Francisco, CA
-- --30,0001,635,0001330San Bernardino, CA25,915,0001378,000123,270,00096173Orange, CA
304,000777,00021,926,00098148Los Angeles, CAb133,0003150,00016,535,0001420Fresno, CA
*10,0001140,0001,946,0001017Contra Costa, CA*3,500,0001105,000133,134,0002143Alameda, CA*13,000139,0003,047,0001420Pima, AZ
$31,765,0005$97,000$39,032,0004673Maricopa, AZ
awardswinnersawardawardsaward winnerscontract trialsaCountyTotal of all of plaintiffMedianTotal of allof plaintiffnumber of
NumberNumberTotal
Punitive damages awarded to plaintiff winnersFinal amount awarded to plaintiff winners
Appendix C. Final and punitive damage awards for plaintiff winners in contract trials, by sampled counties, 2001
Related Documents