Left-Ventricle Boundary Detection from Nuclear Medicine Images Xiaolong Dai, Wesley E. Snyder, Griff L. Bilbro, Rodney Williams, and Robert Cowan We present here a new algorithm for segmentation of nuclear medicine images to detect the left-ventricle (LV) boundary. In this article, other image segmenta- tion techniques, such as edge detection and region growing, are also compared and evaluated. In the edge detection approach, we explored the relation- ship between the LV boundary characteristics in nuclear medicine images and their radial orientations: we observed that no single brightness function (eg, maximum of first or second derivative) is sufficient to identify the boundary in every direction. In the region growing approach, several criteria, including intensity change, gradient magnitude change, gradient direc- tion change, and running mean differences, were tested. We found that none of these criteria alone was sufficient to successfully detect the LV boundary. Then we proposed a simple but successful region growing method~Contour-Modified Region Growing (CMRG). CMRG is an easy-to-use, robust, and rapid image segmentation procedure. Based on our experiments, this method seems to perform quite well in compari- son to other automated methods that we have tested because of its ability to handle the problems of both Iow signal-to-noise ratios (SNR) as well as Iow image contrast without any assumptions about the shape of the left ventricle. Copyright 9 1998by W.B. Saunders Company KEY WORDS: cardiac nuclear medicine, ejection frac- tion, image segmentation, left ventricle, boundary detection, automated D ETERMINATION of left ventricular (LV) function is part of a comprehensive cardiac evaluation. Computation of ventricular volume and the diagnostic quantities like ejection-fraction and cardiac output require detection of myocardial From the Computer Graphics Center at North Carolina State University, Raleigh, NC; the Department of Electrical and Computer Engineering, North Carolina State University, and the Department of Radiology, Bowman Gray School of Medi- cine, Raleigh, NC; the Department of Electrical and Computer Engineering, North Carolina State University, Raleigh, NC; the Department of Radiology, Bowman Gray School of Medicine, Winston Salem, NC; and the Department of Radiology, Nuclear Medicine Section, Bowman Gray School of Medicine, Winston Salem, NC. Address reprint requests to Wesley E. Snyder, PhD, Center for Advanced Computing and Communication, North Carolina State University, Raleigh, NC 27695-7914. Copyright 9 1998 by W.B. Saunders Company 0897-1889/98/11 O1-000258. 00/0 bounda¡ 1-3 Correct and reproducible measure- ments of LV function, in terms of parameters such as the global and regional ejection fraction, require an accurate and reproducible algorithm to delineate the LV. 4 6 Delineation can be accomplished manu- ally or automatically using an edge detection algorithm. Manual algorithms usually suffer from low reproducibility, whereas automatic algo¡ suffer from low precision because of nonuniform background, low signal-to-noise ratios (SNR) and the complicated structure of the heart. 6 In most clinical applications, manual tracking or semiauto- mated boundary description is conducted in each 2D nuclear medicine image by a trained clinician to extract the LV contour. Although the reliability of the edited contour can be enhanced by introducing more skilled operators anda priori knowledge (such as location, shape, and intensity), manual tracking has two major drawbacks. First, the ob- tained LV boundaries are biased (the tracked bound- aries vary from individual to individual). Second, manual tracking is extremely time-consuming. 3 To resolve the two disadvantages of manual tracking, various automated or semiautomated tech- niques of varying complexity and precision previ- ously have been proposed. 2,s-6 A comparison of three major commercially available semiautomatic methods was provided by Bingham et al. 7 A comprehensive review of the computer methods for quantitative analysis of LV function from equilib- rium gated blood pool scintigrams was given by Reiber et al. 8 The most commonly used edge detection algorithm is based on the assumption that the LV border coincides with the zero crossing of the second-order derivative in a radial search with its origin in the LV, according to Reiber et al. 8 To limit the search, the method is often combined with threshotding. 7 A linear combination of first- and second-order derivatives had also been sug- gested. 7,8Also, Reiber et al used an algorithm based on a minimal cost function. 8 Assuming that the LV border can be defined as the maximum, normalized, closed-line integral of a closed curve in a vector field derived by image differentiation and that the closed curve can be described by a Fourier expansion with limited 10 Journal of Digital Irnaging, Vol 11, No 1 (February), 1998: pp 10-20

Welcome message from author
This document is posted to help you gain knowledge. Please leave a comment to let me know what you think about it! Share it to your friends and learn new things together.
Transcript
Left-Ventricle Boundary Detection from Nuclear Medicine Images
Xiaolong Dai, Wesley E. Snyder, Griff L. Bilbro, Rodney Williams, and Robert Cowan
We present here a new algorithm for segmentation of nuclear medicine images to detect the left-ventricle (LV) boundary. In this article, other image segmenta- tion techniques, such as edge detection and region growing, are also compared and evaluated. In the edge detection approach, we explored the relat ion- ship between the LV boundary characteristics in nuclear medicine images and their radial orientations: we observed that no single brightness function (eg, maximum of first or second derivative) is sufficient to identify the boundary in every direction. In the region growing approach, several criteria, including intensity change, gradient magnitude change, gradient direc- tion change, and running mean differences, were tested. We found that none of these criteria alone was sufficient to successfully detect the LV boundary. Then we proposed a simple but successful region growing method~Contour-Modified Region Growing (CMRG). CMRG is an easy-to-use, robust, and rapid image segmentation procedure. Based on our experiments, this method seems to perform quite well in compari- son to other automated methods that we have tested because of its ability to handle the problems of both Iow signal-to-noise ratios (SNR) as well as Iow image contrast without any assumptions about the shape of the left ventricle. Copyright �9 1998by W.B. Saunders Company
KEY WORDS: cardiac nuclear medicine, ejection frac- tion, image segmentation, left ventricle, boundary detection, automated
D ETERMINATION of left ventricular (LV) function is part of a comprehensive cardiac
evaluation. Computation of ventricular volume and the diagnostic quantities like ejection-fraction and cardiac output require detection of myocardial
From the Computer Graphics Center at North Carolina State University, Raleigh, NC; the Department of Electrical and Computer Engineering, North Carolina State University, and the Department of Radiology, Bowman Gray School of Medi- cine, Raleigh, NC; the Department of Electrical and Computer Engineering, North Carolina State University, Raleigh, NC; the Department of Radiology, Bowman Gray School of Medicine, Winston Salem, NC; and the Department of Radiology, Nuclear Medicine Section, Bowman Gray School of Medicine, Winston Salem, NC.
Address reprint requests to Wesley E. Snyder, PhD, Center for Advanced Computing and Communication, North Carolina State University, Raleigh, NC 27695-7914.
Copyright �9 1998 by W.B. Saunders Company 0897-1889/98/11 O1-000258. 00/0
bounda¡ 1-3 Correct and reproducible measure- ments of LV function, in terms of parameters such as the global and regional ejection fraction, require an accurate and reproducible algorithm to delineate the LV. 4 6 Delineation can be accomplished manu- ally or automatically using an edge detection algorithm. Manual algorithms usually suffer from low reproducibility, whereas automatic algo¡ suffer from low precision because of nonuniform background, low signal-to-noise ratios (SNR) and the complicated structure of the heart. 6 In most clinical applications, manual tracking or semiauto- mated boundary description is conducted in each 2D nuclear medicine image by a trained clinician to extract the LV contour. Although the reliability of the edited contour can be enhanced by introducing more skilled operators a n d a priori knowledge (such as location, shape, and intensity), manual tracking has two major drawbacks. First, the ob- tained LV boundaries are biased (the tracked bound- aries vary from individual to individual). Second, manual tracking is extremely time-consuming. 3
To resolve the two disadvantages of manual tracking, various automated or semiautomated tech- niques of varying complexity and precision previ- ously have been proposed. 2,s-6 A comparison of three major commercially available semiautomatic methods was provided by Bingham et al. 7 A comprehensive review of the computer methods for quantitative analysis of LV function from equilib- rium gated blood pool scintigrams was given by Reiber et al. 8 The most commonly used edge detection algorithm is based on the assumption that the LV border coincides with the zero crossing of the second-order derivative in a radial search with its origin in the LV, according to Reiber et al. 8 To limit the search, the method is often combined with threshotding. 7 A linear combination of first- and second-order derivatives had also been sug- gested. 7,8 Also, Reiber et al used an algorithm based on a minimal cost function. 8
Assuming that the LV border can be defined as the maximum, normalized, closed-line integral of a closed curve in a vector field derived by image differentiation and that the closed curve can be described by a Fourier expansion with limited
10 Journal of Digital Irnaging, Vol 11, No 1 (February), 1998: pp 10-20
LV BOUNDARY DETECTION 11
number of harmonics, an edge detection algorithm was developed by Ekman et al to handle the problems of low SNR and overlapping structures in the images. 6 A preprocessing filter was also used to improve the SNR and the image contrast was enhanced before an edge detection algorithm was applied to the images. 2 With this method, 64 radial profiles were generated (polar transform) from the center of the LV in the end-diastolic image and edge points were identified using first- or second- order derivative information. Contextual knowl- edge was used to guide a search of the LV boundary, l~ Some methods used dynamic pro- gramming techniques to search for the LV con- tour. 12 Fuzzy ISODATA clustering and Fourier analysis were applied to automatically detect LV contours without any assumptions about the heart shape to guide the process. 5 These available algo- rithms generally are notas precise as one might like owing to low SNR and overlapping structures such as the left atrium. 6 In summary, research on auto- mated LV boundary tracking reached its peak in the middle 1980s and gradually decreased in the early 1990s in terms of the number of articles published in the Journal of Nuclear Medicine, Medical Phys- ics, and IEEE Transactions on Medical Imaging. A search of these journals and the Annual Interna- tional Conference of the IEEE Engineering in Medicine and Biology Proceedings indicates that
there are no other pertinent papers in the last 2 to 3 years.
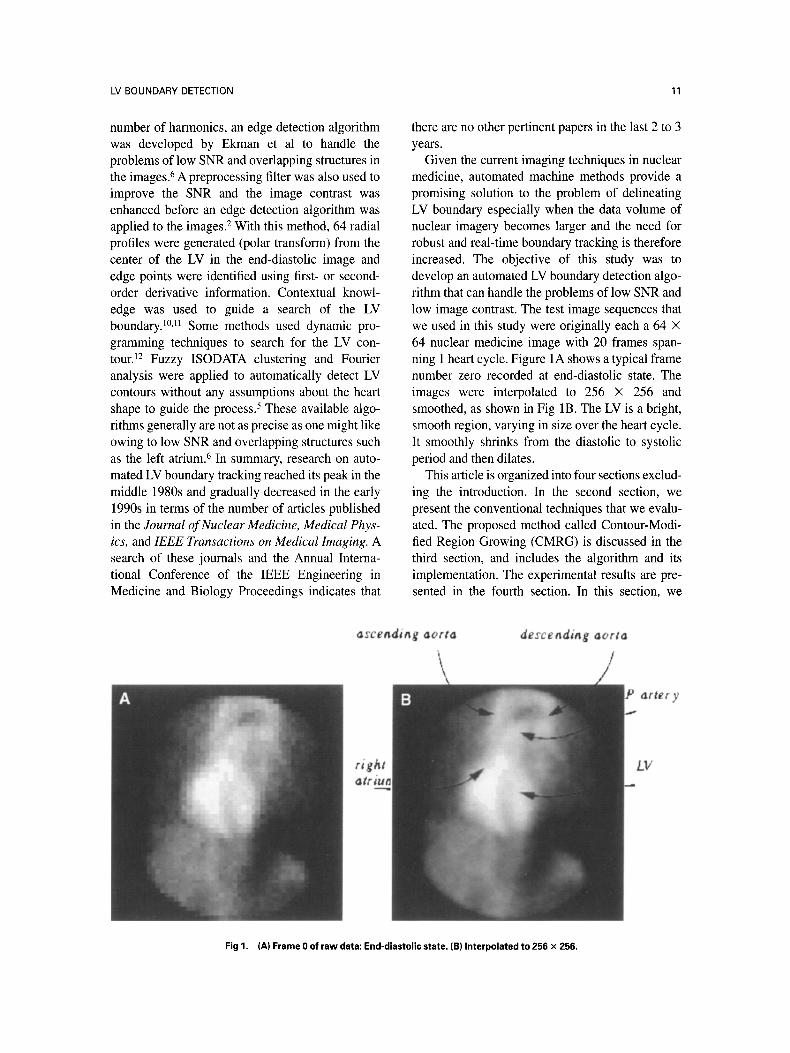
Given the current imaging techniques in nuclear medicine, automated machine methods provide a promising solution to the problem of delineating LV boundary especially when the data volume of nuclear imagery becomes larger and the need for robust and real-time boundary tracking is therefore increased. The objective of this study was to develop an automated LV boundary detection algo- rithm that can handle the problems of low SNR and low image contrast. The test image sequences that we used in this study were originally each a 64 • 64 nuclear medicine image with 20 frames span- ning 1 heart cycle. Figure lA shows a typical frame number zero recorded at end-diastolic state. The images were interpolated to 256 • 256 and smoothed, as shown in Fig 1B. The LV is a bright, smooth region, varying in size over the heart cycle. It smoothly shrinks from the diastolic to systolic period and then dilates.
This article is organized into four sections exclud- ing the introduction. In the second section, we present the conventional techniques that we evalu- ated. The proposed method called Contour-Modi- fied Region Growing (CMRG) is discussed in the third section, and includes the algorithm and its implementation. The experimental results ate pre- sented in the fourth section. In this section, we
asceadiag aorta descending aorta
arter y
LV
Fig 1. (A) Frame 0 of raw data: End-diastolic state. (B) Interpolated to 256 • 256.
12 DAI ET AL
focus on the estimation of LV ejection fraction, and its comparison with clinician's data and the results frorn the algorithm used in the ADAC semiauto- mated system. Finally in the last Section, we present discussions and conclusions.
CONVENTIONAL TECHNIQUES EVALUATED
Edge Detection
For the segmentation of intensity images, there are three main approaches: threshold techniques, 13 boundary-based methods, 14 and region-based meth- ods. 15'16 Threshold techniques assign all pixels whose values lie within a certain brightness range to one class. Such methods neglect all of the spatial information of the image and cope poorly with noise or blurring at boundaries. Boundary-based methods use the postulate that the pixel values change rapidly at the boundary between two re- gions.
In this study, we evaluated Sobel, Isotropic, Smoothed, Stochastic, and Laplacian gradient op- erators. In agreement with other researchers, v we found that different thresholds were required for different parts of the image. To improve the bound- ary-based results, we applied first- and second- order edge operators in the radial direction at a variety of different angles in the region of interest (ROI), and used different criteria at each angle to detect the boundary point along that radial line. The image was sampled radially every 20 degrees in the LV region to forma 30-pixel 1D image for each of 18 different radial orientations. Derivative-of- Gaussian edge operators were then applied to the 1D data. A 1D Gaussian has the following form:
1 g(x) = ~ e (x - la)2/2~r2 (1) ,/2~~
Because we want a Gaussian centered at the origin, which will be the center pixel, we choose la = 0. The first and second derivatives of the Gaussian are as follows respectively:
--X e_(X2/2~r2 ) (2) g'(x)- 2~g~3
,(x~) g"(X)- 2~O. 3 ~-~- 1 e -(x2/2~r2) (3)
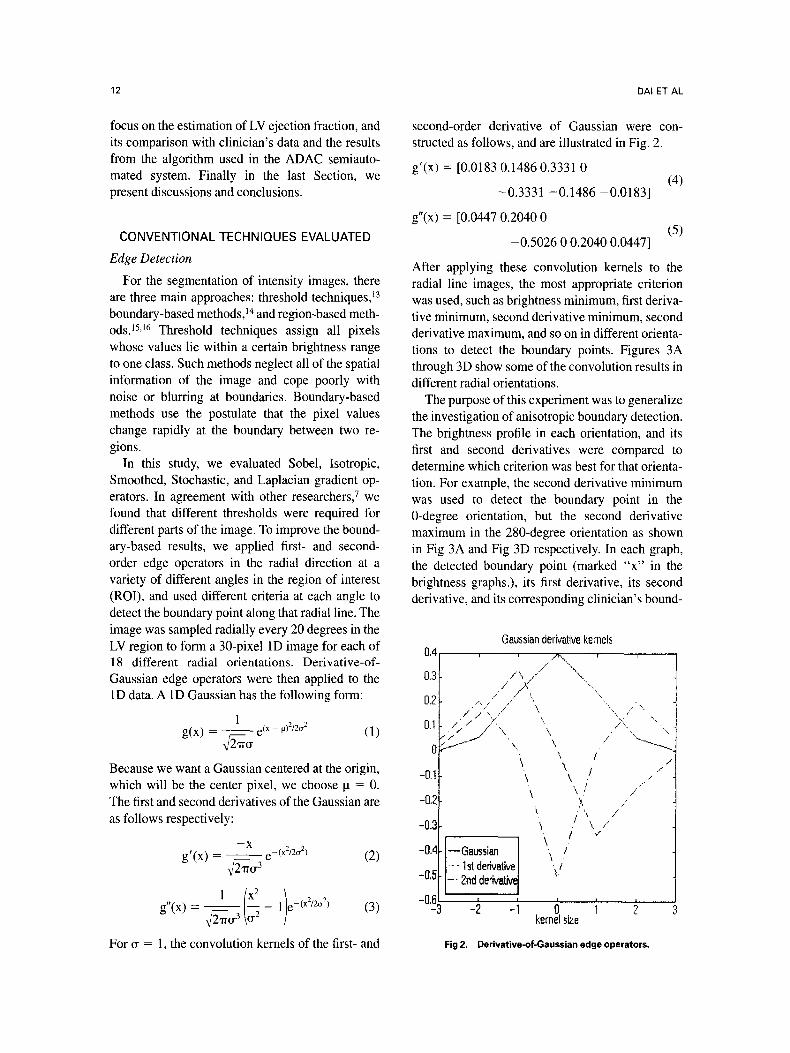
For ~r = 1, the convolution kernels of the first- and
second-order derivative of Gaussian were con- structed as follows, and are illustrated in Fig. 2.
g'(x) = [0.0183 0.1486 0.3331 0 (4)
-0.333 t -0.1486 -0.0183]
g"(x) = [0.0447 0.2040 0 (5)
-0.5026 0 0.2040 0.0447]
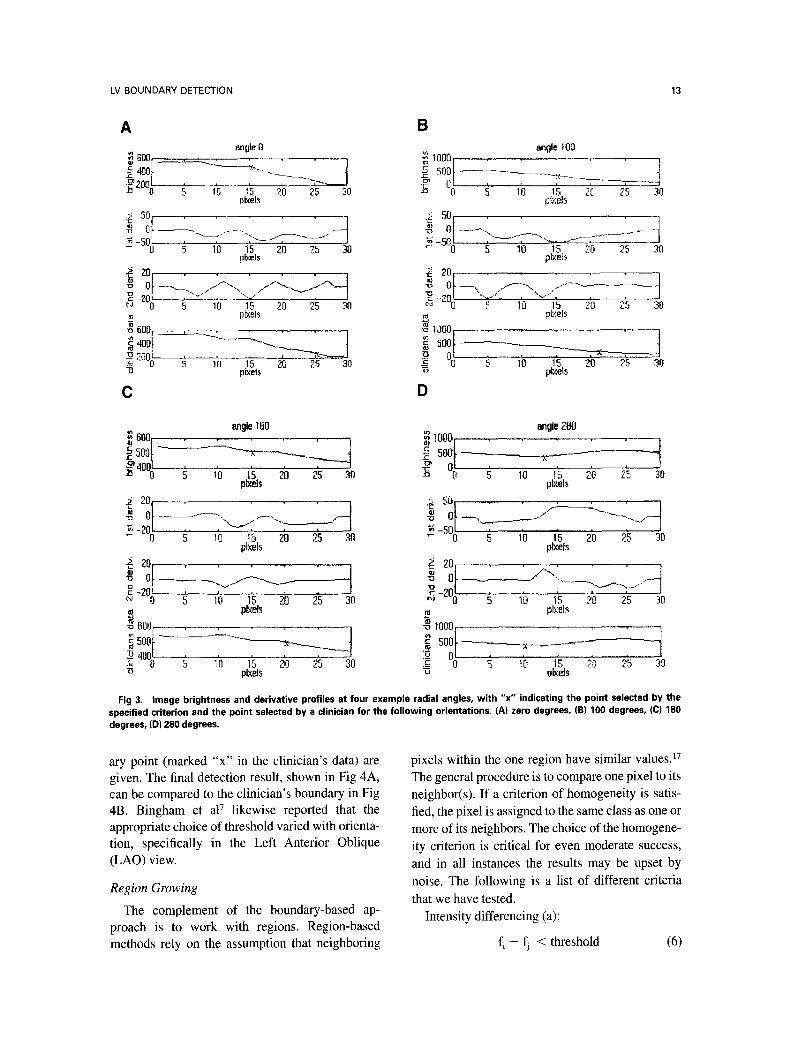
After applying these convolution kernels to the radial line images, the most appropriate criterion was used, such as brightness minimum, first deriva- tive minimum, second derivative minimum, second derivative maximum, and so on in different orienta- tions to detect the boundary points. Figures 3A through 3D show some of the convolution results in different radial orientations.
The purpose of this experiment was to generalize the investigation of anisotropic boundary detection. The brightness profile in each orientation, and its first and second derivatives were compared to determine which criterion was best for that orienta- tion. For example, the second derivative minimum was used to detect the boundary point in the 0-degree orientation, but the second derivative maximum in the 280-degree orientation as shown in Fig 3A and Fig 3D respectively. In each graph, the detected boundary point (marked "x" in the brightness graphs.), its first derivative, its second derivative, and its corresponding clinician's bound-
Gaussian derivative kemels 0 , 4 , ~ -r r
0.3 i /\/- ..... \ /" ,,kŸ "\.
0.7 / / .........
o, , r / i
"\ / .,.
-0.1 \ / ..- '"
-0.', " ),. ,,- t k /
-0.', ! \ / / ,,, ]
-0.4 --Gaussian ./ \ ./ - - 1st derivative I
-0,5 _. 2nd derivativeJ t i
: 2 kernel size
Fig 2. Derivative-of-Gaussian edgeoperators.
LV BOUNDARY DETECTION 13
B angla 100
�9 ~ I0001 . . . . , ., .
c n ~ f~ s.ol- I -~ of , , , 4
0 5 1'ª ~5 zo 25 30 plxels
A ~~gle 0
.~ 4oo t o 5 ~b ~'s ~o 2s ~o
plxel~
O 5 10 15 20 ~5 90 5 10 15 20 25 30 t]lxels plxels
"~ . . . . " ~ - ~ 0 / ' % / , " . . . . , , , -~ �91 ~o ~5 2ª z5 ~o o, " o 5 1o 15 zo ~.s 3o
pIxels ~ pI:<els ~oo. , ~ ~ooor--
"o pixels "~ pi~els
C D
angle 180 t~
~~~:l- -~---~ -~--- '4 f4oo�91 ~ -,'o i'5 ~ 2~ 3o plxel~
~~ -I plxels
an~e Z80 1000 i , , ,
Z ~ .~ 1o Ig ?b z~ 3o pixels
~ 501 ,, �9 /..4_____.L~... ' 4
~ -50 , n �91 ~b Is 2'o ,~s ~o plxels
~ ---~.....~___._ ~, o~ . . . . /~" ........ --.-.----._ ........
w plxels ~ plxels -~ 600 . . . . . ~ ,ooo. ,
"~ -m-,~_ ----,- .~ 500 - ' - - - - - - ' - - x ª 4001 , , , ~,
~3 pkets z~ vl~eJs
Fig 3. Image brightness and derivative profiles at four example radial angles, with "x" indicating the point selected by the specified criterion and the point selected by a clinician for the following orientations. (A) zero degrees, (B) 100 degrees, (C) 180 degrees, (D) 280 degrees.
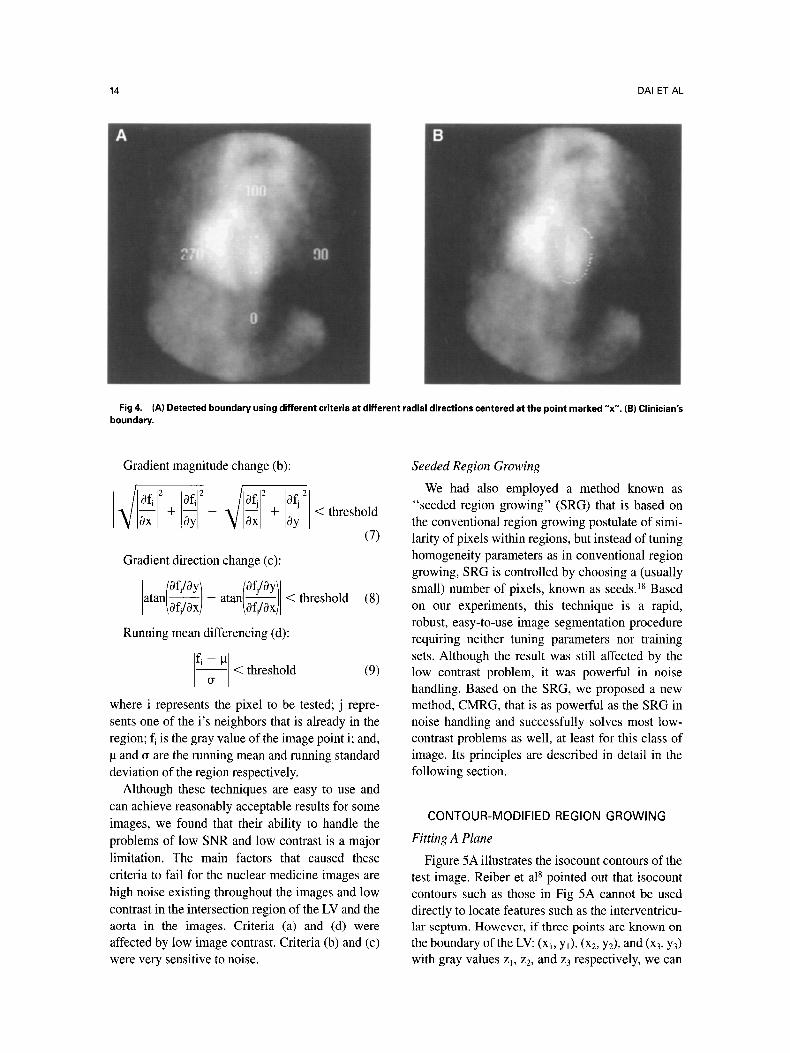
ary point (marked "x" in the clinician's data) are given. The final detection result, shown in Fig 4A, can be compared to the clinician's boundary in Fig 4B. Bingham et al 7 likewise reported that the appropriate choice of threshold varied with orienta- tion, specifically in the Left Anterior Oblique (LAO) view.
Region Growing The complement of the boundary-based ap-
proach is to work with regions. Region-based methods rely on the assumption that neighboring
pixels within the one region have similar values. 17 The general procedure is to compare one pixel to its neighbor(s). If a crite¡ of homogeneity is satis- fied, the pixel is assigned to the same class as one or more of its neighbors. The choice of the homogene- ity criterion is cfitical for even moderate success, and in all instances the results may be upset by noise. The following is a list of different criteria that we have tested.
Intensity differencing (a):
I fi -- fil < threshold (6)
14 DAI ET AL
Fig 4. (A) Detected boundary using different criteria at different radial directions centered at the point marked "x". (B) Clinician's boundary.
Gradient magnitude change (b):
• / 0 f • ~ 0f~ ~ , / 0 f ~ ~ 0f~ ~
10x I + Oy - ~/1~1 +
Gradient direction change (c):
[ofJOyl [of/Oytl a t a n / ~ ) - a t a n - - /Of/Ox)
< threshold
(7)
< threshold (8)
Running mean differencing (d):
- - ~ < threshold (9)
where i represents the pixel to be tested; j repre- sents one of the i's neighbors that is already in the region; fi is the gray value of the image point i; and,
and ~ are the running mean and running standard deviation of the region respectively.
Although these techniques are easy to use and can achieve reasonably acceptable results for some images, we found that their ability to handle the problems of low SNR and low contrast is a major limitation. The main factors that caused these criteria to rail for the nuclear medicine images are high noise existing throughout the images and low contrast in the intersection region of the LV and the aorta in the images. Criteria (a) and (d) were affected by low image contrast. Criteria (b) and (c) were very sensitive to noise.
Seeded Region Growing
We had also employed a method known as "seeded region growing" (SRG) that is based on the conventional region growing postulate of simi- larity of pixels within regions, but instead of tuning homogeneity parameters as in conventional region growing, SRG is controlled by choosing a (usually small) number of pixels, known as seeds. 18 Based on our experiments, this technique is a rapid, robust, easy-to-use image segmentation procedure requiring neither tuning parameters nor training sets. Although the result was still affected by the low contrast problem, it was powerful in noise handling. Based on the SRG, we proposed a new method, CMRG, that is as powerful as the SRG in noise handling and successfully solves most low- contrast problems as well, at least for this class of image. Its principles are described in detail in the following section.
CONTOUR-MODIFIED REGION GROWlNG
Fitting A Plane
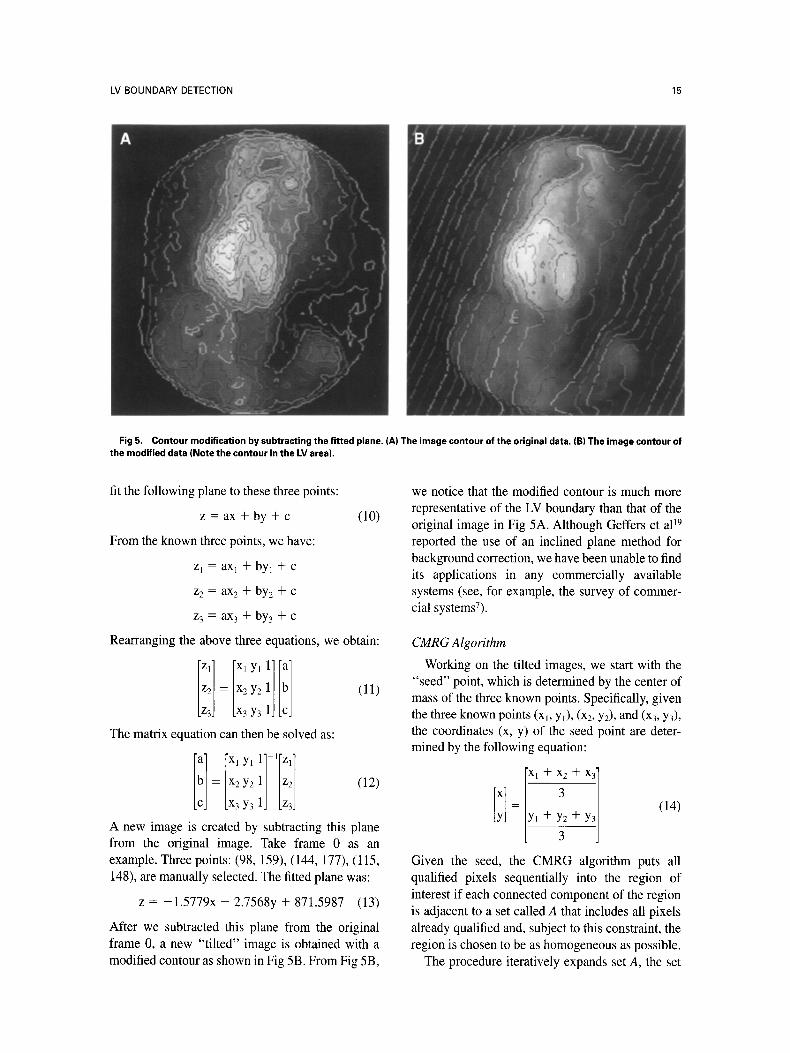
Figure 5A illustrates the isocount contours of the test image. Reiber et al 8 pointed out that isocount contours such as those in Fig 5A cannot be used directly to locate features such as the interventricu- lar septum. However, if three points are known on the boundary of the LV: (xb Y0, (x2, Y2), and (x3, Y3) with gray values Zl, z2, and z3 respectively, we can
LV BOUNDARY DETECTION 15
Fig5. Contour modification by subtracting the fitted plane. (A) The image contour of the original data. (B) The image contour of the modified data (Note the contour in the LV area).
fit the following plane to these three points:
z = ax + by + c (10)
From the known three points, we have:
z l = a X l + b y l + c
z2 = ax2 + by2 + c
z 3 = ax 3 + by 3 + c
Rearranging the above three equations, we obtain:
Iz I [Xly !1[! ] z2 = x2y2 (11)
z3 X3 Y3 The matrix equation can then be solved as:
I!l [ xI yl 1] l[Zl] -- x2Y2 11 /z~ / <12~
x3y3 1] [z3]
A new image is created by subtracting this plane from the original image. Take frame 0 as an example. Three points: (98, 159), (144, 177), (115, 148), are manually selected. The fitted plane was:
z = -1.5779x - 2.7568y + 871.5987 (13)
After we subtracted this plane from the original frame 0, a new "tilted" image is obtained with a modified contour as shown in Fig 5B. From Fig 5B,
we notice that the modified contour is much more representative of the LV boundary than that of the o¡ image in Fig 5A. Although Geffers et al 19 reported the use of an inclined plane method for background correction, we have been unable to find its applications in any commercially available systems (see, for example, the survey of commer- cial systemsT).
CMRG Algorithm
Working on the tilted images, we start with the "seed" point, which is determined by the center of mass of the three known points. Specifically, given the three known points (xi, Y0, (x2, Y2), and (x3, Y3), the coordinates (x, y) of the seed point are deter- mined by the following equation: ix~+x +x~l
= + Y2 + (14)
3
Given the seed, the CMRG algorithm puts all qualified pixels sequentially into the region of interest if each connected component of the region is adjacent to a set called A that includes all pixels already qualified and, subject to this constraint, the region is chosen to be as homogeneous as possible.
The procedure iteratively expands set A, the set

16 DAI ET AL
of pixels in the ROI, and evolves from the seed, namely, the initial element of the set A. Each step of the algorithm adds all qualified pixels to the above set. We now consider the state of the set A after n steps. Let I be the set of all unallocated pixels which border the RO1.
I = {x ~ Al(I(x) N A # 0)} (15) where l(x) is the set of immediate neighbors of the pixel x. In this study, we used a rectangular grid with immediate neighbors defined as those which are 8-connected to the pixel x. For every pixel (i,j), the set P~i,:) of possible predecessors (8-connected neighborhood) is
P ( i 4 ) = {(ip, Jp)} = {(i - 1,J - 1); (i - 1,j);
(i - 1,j + 1); (i,j - 1); (i,j + 1);
(i + 1 , j - 1); (i + 1,j); (i + 1,j + 1)}
I fx E / , we have that x is adjacent to the ROI, then we define �91 to be a measure of how different x is from the region it adjoins. One simple definition for �91 is the running mean differencing between the point of interest x and the mean of set A:
�91 = li(x) - mean• [yEA] (16)
where f(x) is the gray value of the image point x. We compare �91 to the predefined threshold. We then classify this point into set A if the threshold requirement is satisfied. Otherwise, we flag x a sa boundary pixel. The algorithm thus checks all x's E I, such that
�91 < threshold (17)
and append all such x's to set A. This completes step n + 1. The process is
repeated until no element of I satisfies the threshold requirement in a single iteration. Given the connec- tivity constraint, the homogeneity of the ROl is ensured by the above two definitions.
CMRG Implementation
In the CMRG implementation, we use a data structure that we will term a Potential Grow List (PGL). The PGL stores the data of I, the set of all unallocated pixels that are adjacent to the ROI. In each iteration, we search the entire PGL and pick the points in the list which satisfy the constraint.
Algorithm CMRG: 1. Choose three leading points. 2. Fit a plane to these three points.
3. Subtract the fitted plane from the original image.
4. Label the seed point. 5. Put neighbors of the seed point (the initial I)
in the PGL. 6. Search PGL and test the constraint. 7. While any points in the PGL satisfy the
constraint: Remove these points from PGL. Add these points to set A. Update running mean of the region corre- sponding to the set A. Test the neighbors of these points: ir neighbors of these points are not already in set A. Add neighbors of these points to the PGL. Search PGL and test the constraint.
8. Flag all points in PGL with boundary labels. From the implementation above, we notice that
each pixel is visited just once, although at each visit we also test each of its neighbors and search in PGL for the candidate pixels. Hence, this algorithm may be implemented in software which runs quickly.
R E S U L T S
Experiments
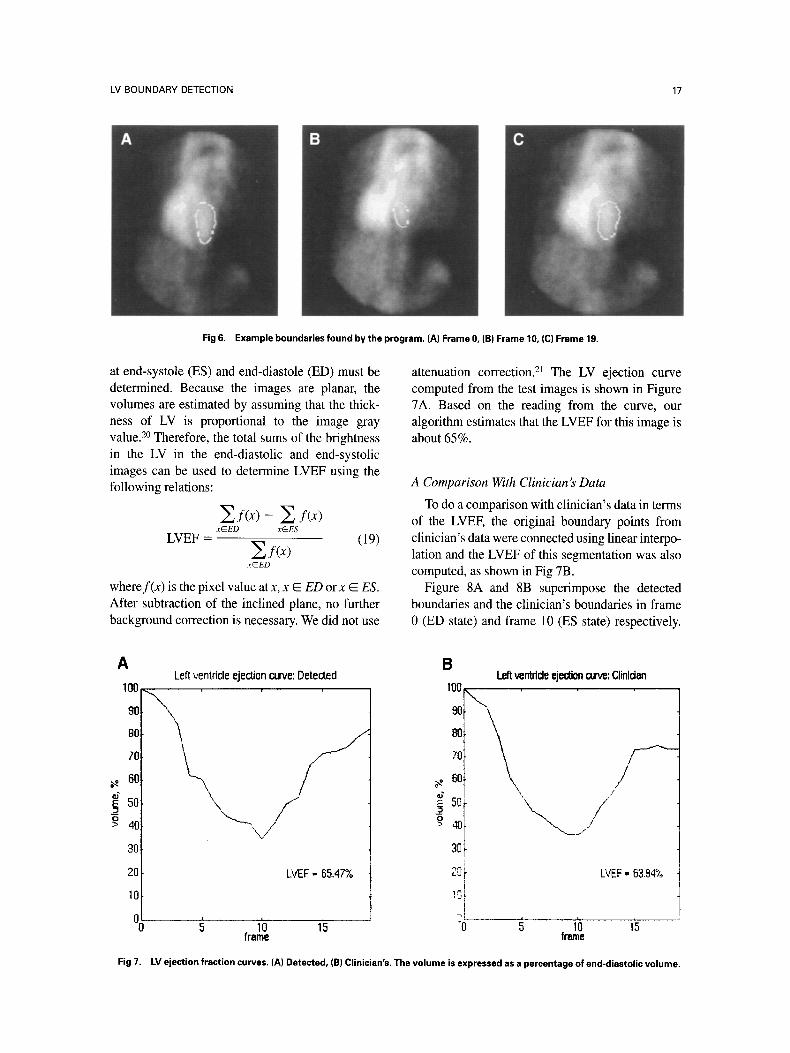
We implemented the CMRG algorithm and ap- plied it to the test images. Figure 6A through 6C show three example boundaries found by the program and give a visual demonstration of the final segmentation results. For each frame, the only input was the three leading points that ate needed to fit a plane.
Lefi Ventricle Ejection Fraction
The left ventricle ejection fraction (LVEF) is a measure of the mechanical performance of the left ventricle of the heart. It is defined as the fraction of the end-diastolic volume ejected during a cardiac cycle:
VEa--VEs LVEF - (18)
VED
where VEa is the end-diastolic volume and VEs is the end-systolic volume of the ventricle. In nuclear medicine, it is usually determined from a gated blood pool image sequence acquired from the LAO projection, with a camera positioned at the angle demonstrating the best separation of the two ven- tricles. To calculate an LVEE the cardiac volumes
LV BOUNDARY DETECTION 17
Fig 6. Example boundaries found by the program. (A) Frame 0, (B) Frame 10, (C) Frame 19.
at end-systole (ES) and end-diastole (ED) must be determined. Because the images are planar, the volumes are estimated by assuming that the thick- ness of LV is proportional to the image gray value. 2o Therefore, the total sums of the brightness in the LV in the end-diastolic and end-systolic images can be used to determine LVEF using the following relations:
Zi(x)- Z I~x) xEED x@ES
LVEF = ~ f ( x ) (19)
x@ED
wheref(x) is the pixel value at x, x E ED or x E ES. After subtraction of the inclined plane, no further background correction is necessary. We did not use
attenuation correction. 21 The LV ejection curve computed from the test images is shown in Figure 7A. Based on the reading from the curve, our algorithm estimates that the LVEF for this image is about 65%.
A Comparison With Clinician's Data
To do a comparison with clinician's data in terms of the LVEE the original boundary points from clinician's data were connected using linear interpo- lation and the LVEF of this segmentation was also computed, as shown in Fig 7B.
Figure 8A and 8B superimpose the detected boundaries and the clinician's boundaries in frame 0 (ED state) and frame 10 (ES state) respectively.
A
100
9O
80
70
60
_~ 5o O > 40
3O
2O
10
o�91
Left ventricle ejection curve: Detected
" x i '
EVEF = 65.47%
Left ventrtde ejection curve: Clinldan B I00
90
8O
70
60
5o I
t
"0
/
/ /
LVEF = 6394%
1'0 15 ~ 1'0 15 frame fname
Fig 7. LV ejection fraction curves. (A) Detected, (B) Clinician's. The volume is expressed asa percentage of end-diastolic volume.
18 DAI ET AL
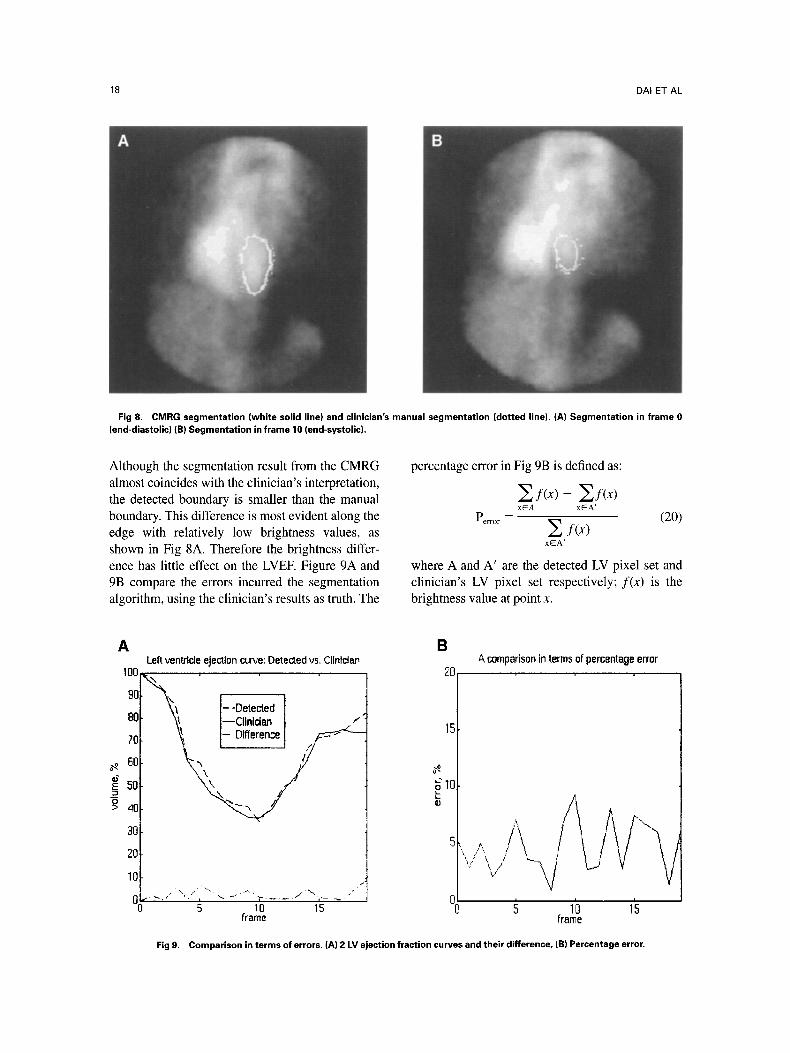
Fig 8. CMRG segmentation (white solid line) and clinician's manual segmentation (dotted line). (A) Segmentation in frame 0 (end-diastolic) (B) Segmentation in frame 10 (end-systolic).
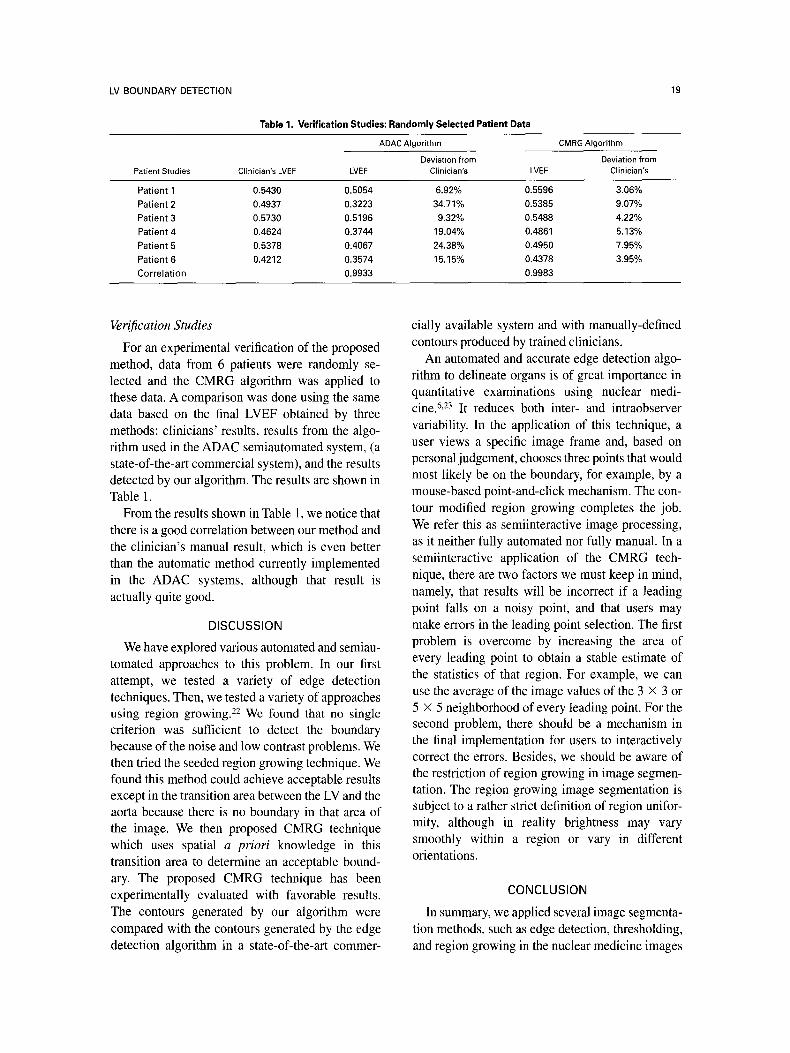
Although the segmentation result from the CMRG almost coincides with the clinician's interpretation, the detected boundary is smaller than the manual boundary. This difference is most evident along the edge with relatively low brightness values, as shown in Fig 8A. Therefore the brightness differ- ence has little effect on the LVEE Figure 9A and 9B compare the errors incurred the segmentation algorithm, using the clinician's results as truth. The
percentage error in Fig 9B is defined as:
~f (x ) - ~f(x) xEA xEA'
P . . . . = s f(x) (20) xEA'
where A and A' are the detected LV pixel set and clinician's LV pixel set respectively; f(x) is the brightness value at point x.
A
1OO
90
80
70
50
E 50
P~ 40
a0
20
Left ventrlcle ejectlon curve: Detected vs. Clinfclan
"~ I--Doto~od \~ I--Clinidan I"
B
E0
15
~m O
1O
�91 1o 15
frame
& comparison in terms of percentage error
g lb l's frame
Fig 9. Comparison in terms of errors. (A) 2 LV ejection fraction curves and their difference, (B) Percentage error.
LV BOUNDARY DETECTION 19
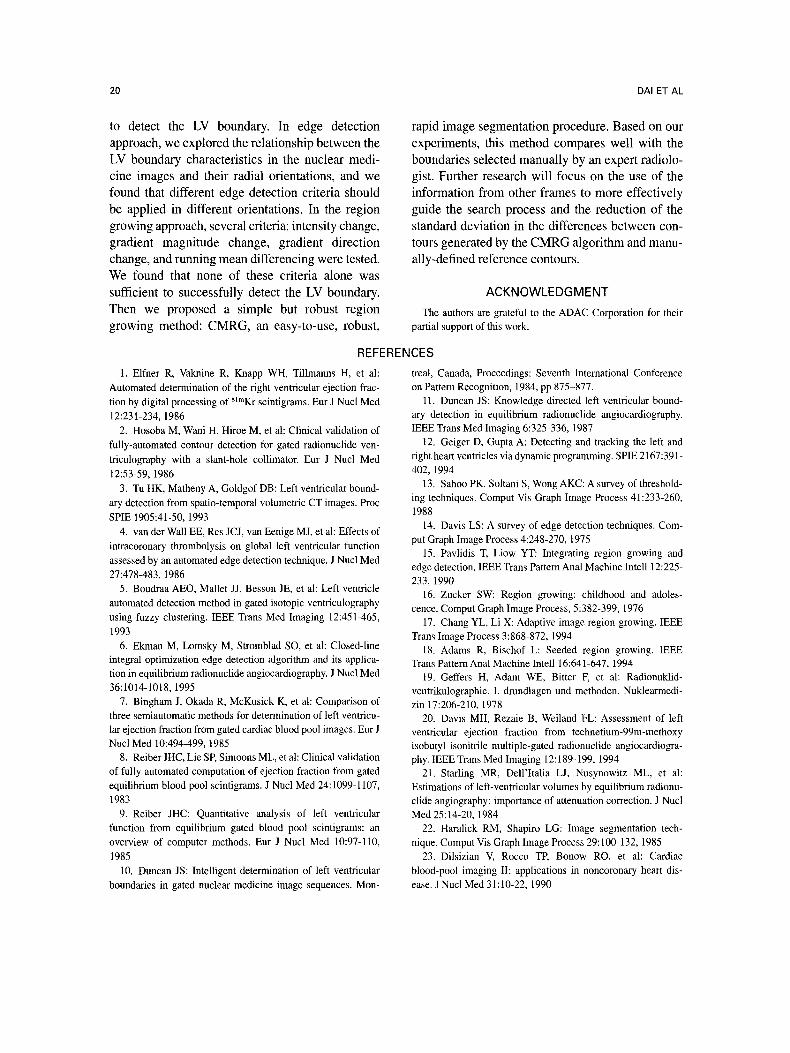
Table 1. Verification Studies: Randomly Selected Patient Data
Patient Studies Clinician's LVEF LVEF
ADAC AIgorithm CMRG Algorithm
Deviation from Deviation from Clinician's LVEF Clinician's
Patient 1 0.5430 0.5064 6.92% 0.5596 3.06% Patient 2 0.4937 0.3223 34.71% 0.5385 9.07% Patient 3 0.5730 0.5196 9.32% 0,5488 4.22% Patient 4 0.4624 0.3744 19.04% 0.4861 5.13% Patient 5 0,5378 0.4067 24.38% 0.4950 7.95% Patient 6 0.4212 0.3574 15.15% 0.4378 3.95% Correlation 0.9933 0.9983
Verification Studies
For ah experimental verification of the proposed method, data from 6 patients were randomly se- lected and the CMRG algo¡ was applied to these data. A comparison was done using the same data based on the final LVEF obtained by three methods: clinicians' results, results from the algo- rithm used in the ADAC semiautomated system, (a state-of-the-art commercial system), and the results detected by our algorithm. The results are shown in Table 1.
From the results shown in Table 1, we notice that there is a good correlation between our method and the clinician's manual result, which is even better than the automatic method currently implemented in the ADAC systems, although that result is actually quite good.
DISCUSSION
We have explored various automated and semiau- tomated approaches to this problem. In our first attempt, we tested a variety of edge detection techniques. Then, we tested a variety of approaches using region growing. 22 We found that no single criterion was sufficient to detect the boundary because of the noise and low contrast problems. We then tried the seeded region growing technique. We found this method could achieve acceptable results except in the transition area between the LV and the aorta because there is no boundary in that area of the image. We then proposed CMRG technique which uses spatial a priori knowledge in this transition area to determine an acceptable bound- ary. The proposed CMRG technique has been experimentally evaluated with favorable results. The contours generated by our algorithm were compared with the contours generated by the edge detection algorithm in a state-of-the-art commer-
cially available system and with manually-defined contours produced by trained clinicians.
An automated and accurate edge detection algo- rithm to delineate organs is of great importance in quantitative examinations using nuclear medi- cine. 6,23 It reduces both inter- and intraobserver variability. In the application of this technique, a user views a speci¡ image frame and, based on personal judgement, chooses three points that would most likely be on the boundary, for example, by a mouse-based point-and-click mechanism. The con- tour modified region growing completes the job. We refer this as semiinteractive image processing, as it neither fully automated nor fully manual. In a semiinteractive application of the CMRG tech- nique, there are two factors we must keep in mind, namely, that results will be incorrect if a leading point falls on a noisy point, and that users may make errors in the leading point selection. The first problem is overcome by increasing the area of every leading point to obtain a stable estimate of the statistics of that region. For example, we can use the average of the image values of the 3 X 3 or 5 x 5 neighborhood of every leading point. For the second problem, there should be a mechanism in the final implementation for users to interactively correct the errors. Besides, we should be aware of the restriction of region growing in image segmen- tation. The region growing image segmentation is subject to a rather strict definition of region unifor- mity, although in reality brightness may vary smoothly within a region or vary in different orientations.
CONCLUSlON
In summary, we applied several image segmenta- tion methods, such as edge detection, thresholding, and region growing in the nuclear medicine images
20 DAI ET AL
to detect the LV boundary. In edge detection approach, we explored the relationship between the LV boundary characteristics in the nuclear medi- cine images and their radial orientations, and we found that different edge detection crite¡ should be applied in different orientations. In the region growing approach, several criteria: intensity change, gradient magnitude change, gradient direction change, and running mean differencing were tested. We found that none of these criteria alone was sufficient to successfully detect the LV boundary. Then we proposed a simple but robust region growing method: CMRG, an easy-to-use, robust,
rapid image segmentation procedure. Based on our experiments, this method compares well with the boundaries selected manually by an expert radiolo- gist. Further research will focus on the use of the information from other frames to more effectively guide the search process and the reduction of the standard deviation in the differences between con- tours generated by the CMRG algorithm and manu- ally-defined reference contours.
ACKNOWLEDGMENT
The authors are grateful to the ADAC Corporation for their partial support of this work.
REFERENCES
1. Elfner R, Vaknine R, Knapp WH, Tillmanns H, et al: Automated determination of the right ventricular ejection frac- tion by digital processing of 81mKr scintigrams. Eur J Nucl Med 12:231-234, 1986
2. Hosoba M, Wani H, Hiroe M, et al: Clinical validation of fully-automated contour detection for gated radionuclide ven- tficulography with a stant-hole collimator. Eur J Nucl Med 12:53-59, 1986
3. Tu HK, Matheny A, Goldgof DB: Left vent¡ bound- ary detection from spatio-temporal volumetric CT images. Proc SPIE 1905:41-50, 1993
4. van der Wall EE, Res JCJ, van Eenige MJ, et al: Effects of intracoronary thrombolysis on global left ventricular function assessed by ah automated edge detection technique. J Nucl Med 27:478-483, 1986
5. Boudraa AEO, Mallet JJ, Besson JE, et al: Left ventricle automated detection method in gated isotopic ventriculography using fuzzy clustering. IEEE Trans Med Imaging 12:451-465, 1993
6. Ekman M, Lomsky M, Stromblad SO, et al: Closed-line integral optimization edge detection algorithm and its applica- tion in equilibrium radionuclide angiocardiography. J Nucl Med 36:1014-1018, 1995
7. Bingham J, Okada R, McKusick K, et al: Comparison of three semiautomatic methods for determination of left ventricu- lar ejection fraction from gated cardiac blood pool images. Eur J Nucl Med 10:494-499, 1985
8. Reiber JHC, Lie SE Simoons ML, et al: Clinical validation of fully automated computation of ejection fraction from gated equilib¡ blood pool scintigrams. J Nucl Med 24:1099-1107, 1983
9. Reiber JHC: Quantitative analysis of left ventricular function from equilibrium gated blood pool scintigrams: an overview of computer methods. Eur J Nucl Med 10:97-110, 1985
10. Duncan JS: Intelligent determination of left ventricular boundaries in gated nuclear medicine image sequences. Mon-
treal, Canada, Proceedings: Seventh International Conference on Pattern Recognition, 1984, pp 875-877.
11. Duncan JS: Knowledge directed left ventricular bound- ary detection in equilibrium radionuclide angiocardiography. IEEE Trans Med Imaging 6:325-336, 1987
12. Geiger D, Gupta A: Detecting and tracking the left and right heart ventricles vŸ dynamic programming. SPIE 2167:391- 402, 1994
13. Sahoo PK, Soltani S, Wong AKC: A survey of threshold- ing techniques. Comput Vis Graph Image Process 41:233-260, 1988
14. Davis LS: A survey of edge detection techniques. Com- put Graph Image Process 4:248-270, 1975
15. Pavlidis T, Liow YT: Integrating region growing and edge detection. IEEE Trans Pattern Anal Machine Intell 12:225- 233, 1990
16. Zucker SW: Region growing: childhood and adoles- cence. Comput Graph lmage Process, 5:382-399, 1976
17. Chang YL, Li X: Adaptive image region-growing. IEEE Trans Image Process 3:868-872, 1994
18. Adams R, Bisehof L: Seeded region growing. IEEE Trans Pattern Anal Machine Intell 16:641-647, 1994
19. Geffers H, Adam WE, Bitter F, et al: Radionuklid- ventrikulographie. I. drundlagen und methoden. Nuklearmedi- zin 17:206-210, 1978
20. Davis MH, Rezaie B, Weiland FL: Assessment of left ventricular ejection fraction from technetium-99m-methoxy isobutyl isonitrile multiple-gated radionuclide angiocardiogra- phy. IEEE Trans Med lmaging 12:189-199, 1994
21. Starling MR, Dell'Italia LJ, Nusynowitz ML, et al: Estimations of left-ventricular volumes by equilibrium radionu- clide angiography: importance of attenuation correction. J Nucl Med 25:14-20, 1984
22. Haralick RM, Shapiro LG: Image segmentation tech- nique. Comput Vis Graph Image Process 29:100-132, 1985
23. Dilsizian V, Rocco TP, Bonow RO, et al: Cardiac blood-pool imaging II: applications in noncoronary heart dis- ease. J Nucl Med 31:10-22, 1990
Related Documents