NBSIR 87- STANDARD ROOM FIRE TEST RESEARCH AT THE NATIONAL BUREAU OF STANDARDS B.T. Lee J.S. Steel U.S. DEPARTMENT OF COMMERCE National Bureau of Standards National Engineering Laboratory Center for Fire Research Gaithersburg, MD 20899 June 1987 U.S. DEPARTMENT OF COMMERCE, Malcolm Baldrige, Secretary NATIONAL BUREAU OF STANDARDS, Ernest Ambler, Director

Welcome message from author
This document is posted to help you gain knowledge. Please leave a comment to let me know what you think about it! Share it to your friends and learn new things together.
Transcript
NBSIR 87-
STANDARD ROOM FIRE TEST RESEARCH AT THE NATIONAL BUREAU OF STANDARDS
B.T. Lee J.S. Steel
U.S. DEPARTMENT OF COMMERCE National Bureau of Standards National Engineering Laboratory Center for Fire Research Gaithersburg, MD 20899
June 1987
U.S. DEPARTMENT OF COMMERCE, Malcolm Baldrige, Secretary
NATIONAL BUREAU OF STANDARDS, Ernest Ambler, Director
TABLE OF CONTENTS
LIST OF FIGURES . . . . . . . . . . . . . . . . . . . . . . . . . . . . . . . . . . . . . . . . . . . . . . . . . . . . . iv
LIST OF TABLES . . . . . . . . . . . . . . . . . . . . . . . . . . . . . . . . . . . . . . . . . . . . . . . . . . . . . . vi
Abstract . . . . . . . . . . . . . . . . . . . . . . . . . . . . . . . . . . . . . . . . . . . . . . . . . . . . . . . . . . . . 1
1.
2.
INTRODUCTION 2
EXPERIMENTAL 5
2.1 Test Room and Exhaust Hood................................. 5 2. 2 Test Materials . . . . . . . . . . . . . . . . . . . . . . . . . . . . . . . . . . . . . . . . . . . . . 6 2. 3 Test Program . . . . . . . . . . . . . . . . . . . . . . . . . . . . . . . . . . . . . . . . . . . . . . . 7 2.4 Test Procedure and Measurements .. ... . ... . . . . . . ..... ........ 8
3. RESULTS AND DISCUSSION . . . . . . . . . . . . . . . . . . . . . . . . . . . . . . . . . . . . . . . . . . 12
3.1 Effect of Ignition Source History on Fire Development ...... 12 3.2 Comparison of Results with University of California Test . . . 14 3.3 Comparison of Various Methods for Determining Flashover . . . . 15 3. 4 Fire Growth Data . . . . . . . . . . . . . . . . . . . . . . . . . . . . . . . . . . . . . . . . . . . 17 3. 5 Heat Release Measurements . . . . . . . . . . . . . . . . . . . . . . . . . . . . . . . . . . 18 3.6 Comparison with Cone Calorimeter Data ...................... 21 3.7 General Remarks and Recommended Changes in the Proposed
ASTM Test Procedure . . . . . . . . . . . . . . . . . . . . . . . . . . . . . . . . . . . . . . . . 23
4. CONCLUDING REMARKS . . . . . . . . . . . . . . . . . . . . . . . . . . . . . . . . . . . . . . . . . . . . . . 24
5. ACKNOWLEDGEMENTS . . . . . . . . . . . . . . . . . . . . . . . . . . . . . . . . . . . . . . . . . . . . . . . . 26
6 . REFERENCES . . . . . . . . . . . . . . . . . . . . . . . . . . . . . . . . . . . . . . . . . . . . . . . . . . . . . . 2 7
LIST OF FIGURES
Figure 1. Schematic of test room and exhaust hood ................ .
Figure 2. Ignition exposure conditions ............................ .
Figure 3. Test program ............................................ .
Figure 4. Calibration curve for heat release rate ................. .
Figure 5. Rate of heat release histories for tests 8 and C-213 .....
Figure 6. Flame spread profiles for test lB (gypsum board, exposure A) .............................. .
Figure 7. Flame spread profiles for test 15 (fire retarded plywood, exposure A) .................................... .
Figure 8. Flame spread profiles for test 10 (polystyrene, foam exposure A) ............................................. .
Figure 9. Flame spread profiles for test 9 (polyisocyanurate foam, exposure A) ....................................... .
Figure 10. Flame spread profiles for test 19 (plywood 2, exposure A) ............................................. .
Figure 11. Flame spread profiles for test 17 (plywood 2 walls, calcium silicate ceiling, exposure A) ................... .
Figure 12. Flame spread profiles for test 18 (plywood 2 walls, gypsum boar ceiling, exposure A) ........................ .
Figure 13. Oxygen concentration in room for test 19 (plywood 2, exposure A) ................................. .
Figure 14. Oxygen concentration in room for test 17 (plywood 2 walls, exposure A) ........................... .
Figure 15. Oxygen concentration in room for test 18 (plywood 2 walls, exposure A) ........................... .
Figure 16. Flux levels in room for test 19 (plywood 2, exposure A)
Figure 17. Flux levels.i~ rnom for t2st 1] {~yw~arl 2 ~2ll~, exposure A) ............................................. .
Figure 18. Flux levels in room for test 18 (plywood 2 walls, exposure A)
LIST OF FIGURES (continued)
Figure 19. Rate of heat release histories for test 8 (plywood 1, exposure B) and test 15 (fire-retarded plywood, exposure A) ............................................ .
Figure 20. Comparison of rate of heat release histories for plywood 2 (tests 7 and 19) ............................. .
Figure 21. Comparison of rate of heat release histories for plywood 2 (tests 16, 17, and 18 ........................ .
Figure 22. Comparison of rate of heat release histories for plywood 2 (tests 18, 19, and 27) ....................... .
Figure 23. Comparison of rate of heat release histories for polystyrene foam (tests 10, 11, and 12) ................ .
Figure 24. Comparison of rate of heat release histories for polystyrene foam (tests 20, 21, and 23) ................ .
Figure 25. Comparison of rate of heat release histories for polystyrene foam (tests 10, 20, and 26) ................ .
Figure 26. Comparison of rate of heat release histories for polyisocyanurate foam (tests 9, 13, and 14) ............ .
Figure 27. Comparison of rate of heat release histories for polyisocyanurate foam (tests 9, 22, and 25) ............ .
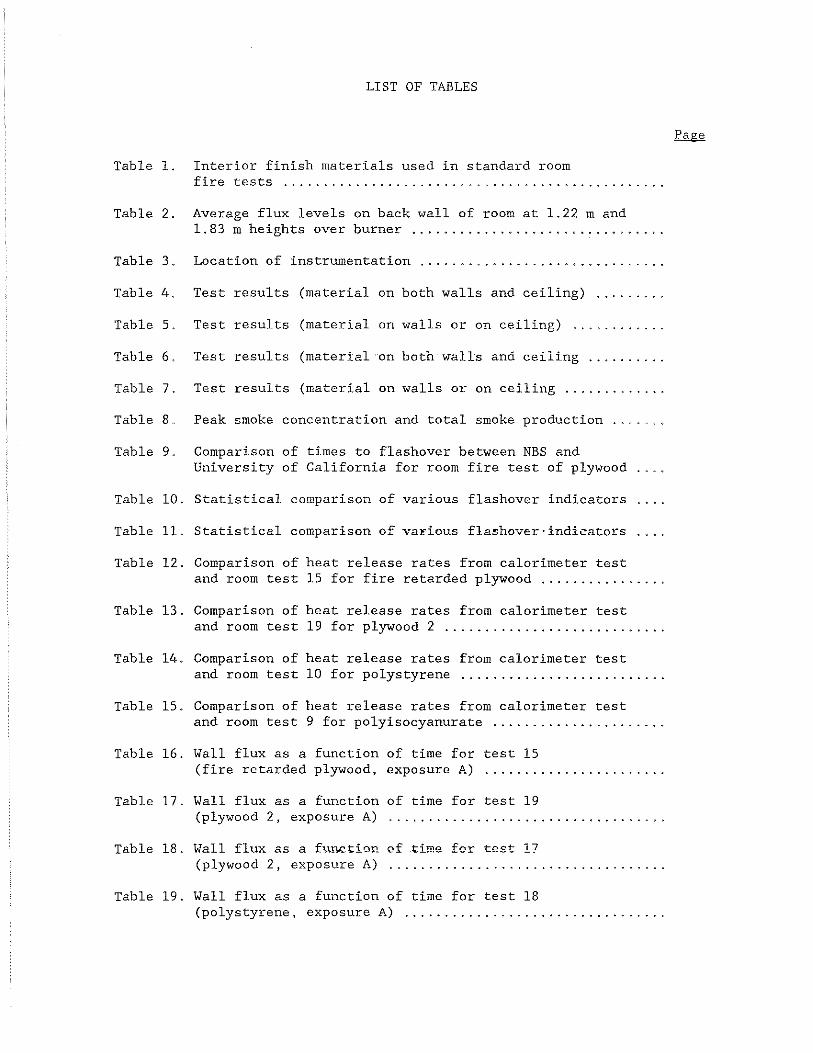
LIST OF TABLES
Table 1. Interior finish materials used in standard room fire tests ............................................... .
Table 2. Average flux levels on back wall of room at 1.22 m and 1. 83 m heights over burner ............................... .
Table 3. Location of instrumentation .............................. .
Table 4. Test results (material on both walls and ceiling) . . . . . . . . .
Table 5. Test results (material on walls or on ceiling) . . . . . . . . . . . .
Table 6. Test results (material ··on both walls and ceiling ..........
Table 7. Test results (material on walls or on ceiling .............
Table 8. Peak smoke concentration and total smoke production .......
Table 9. Comparison of times to flashover between NBS and University of California for room fire test of plywood
Table 10. Statistical comparison of various flashover indicators
Table 11. Statistical comparison of va~ious flashover·indicators
Table 12. Comparison of heat release rates from calorimeter test and room test 15 for fire retarded plywood ............... .
Table 13. Comparison of heat release rates from calorimeter test and room test 19 for plywood 2 ........................... .
Table 14. Comparison of heat release rates and room test 10 for polystyrene
from calorimeter test
Table 15. Comparison of heat release rates from calorimeter test and room test 9 for polyisocyanurate ..................... .
Table 16. Wall flux as a function (fire retarded plywood,
Table 17.
Table 18.
Wall flux as a function (plywood 2, exposure A)
Wall flux as a f>.m.ction (plywood 2, exposure A)
of time for test 15 exposure A)
of time for test 19
of time f0r test l?
Table 19. Wall flux as a function of time for test 18 (polystyrene, exposure A) ................................ .
LIST OF TABLES (continued)
Table 20. Wall flux as a function of time for test 10 (polystyrene, exposure A) ............................... .
Table 21. Wall flux as a function of time for test 09 (polyisocyanurate, exposure A) .......................... .
Table 22. Combustion efficiency of test materials in room fire tests ................................................... .
STANDARD ROOM FIRE TEST RESEARCH AT THE NATIONAL BUREAU OF STANDARDS
B.T. Lee and J.S. Steel
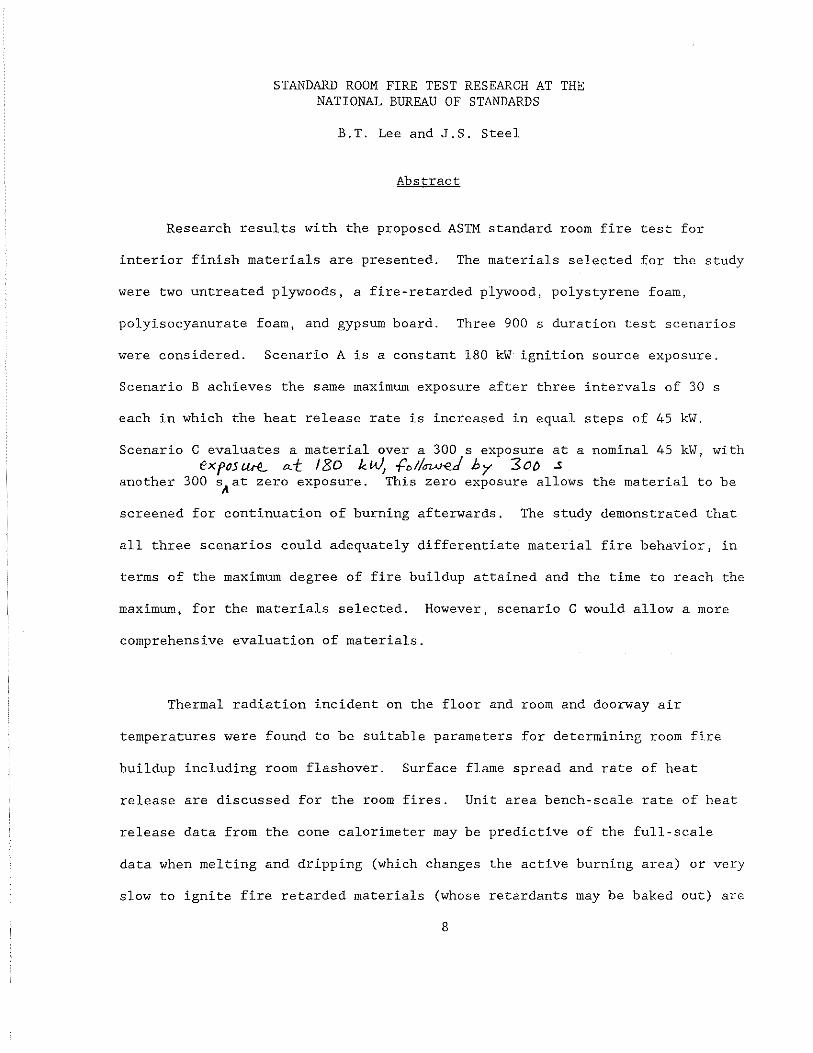
Abstract
Research results with the proposed ASTM standard room fire test for
interior finish materials are presented. The materials selected for the study
were two untreated plywoods, a fire-retarded plywood, polystyrene foam,
polyisocyanurate foam, and gypsum board. Three 900 s duration test scenarios
were considered. Scenario A is a constant 180 kW ignition source exposure.
Scenario B achieves the same maximum exposure after three intervals of 30 s
each in which the heat release rate is increased in equal steps of 45 kW.
Scenario C evaluates a material over a 300 s exposure at a nominal 45 kW, with €Xf05Ure_. a.{ /80 k.~ ~ol/awe.J h7 SOD .S
another 300 sAat zero exposure. This zero exposure allows the material to be
screened for continuation of burning afterwards. The study demonstrated that
all three scenarios could adequately differentiate material fire behavior, in
terms of the maximum degree of fire buildup attained and the time to reach the
maximum, for the materials selected. However 1 scenario C would allow a more
comprehensive evaluation of materials.
Thermal radiation incident on the floor and room and doorway air
temperatures were found to be suitable parameters for determining room fire
buildup including room flashover. Surface flame spread and rate of heat
release are discussed for the room fires. Unit area bench-scale rate of heat
release data from the cone calorimeter may be predictive of the full-scale
data when melting and dripping (which changes the active burning area) or very
slow to ignite fire retarded materials (whose retardants may be baked out) are
8
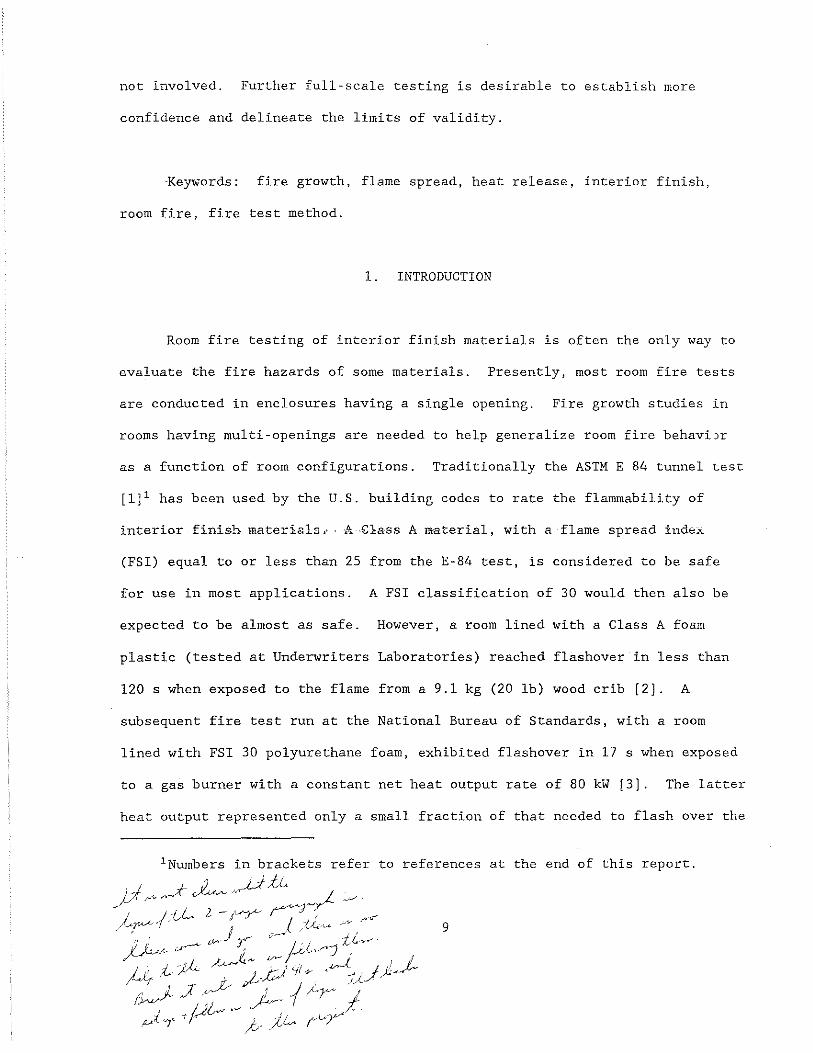
not involved. Further full-scale testing is desirable to establish more
confidence and delineate the limits of validity.
·Keywords: fire growth, flame spread, heat release, interior finish,
room fire, fire test method.
1. INTRODUCTION
Room fire testing of interior finish materials is often the only way to
evaluate the fire hazards of some materials. Presently, most room fire tests
are conducted in enclosures having a single opening. Fire growth studies in
rooms having multi-openings are needed to help generalize room fire behaviJr
as a function of room configurations. Traditionally the ASTM E 84 tunnel test
[1] 1 has been used by the U.S. building codes to rate the flammability of
interior finish materials,, , A .f;:hass A material, with a flame spread index
(FSI) equal to or less than 25 from the E-84 test, is considered to be safe
for use in most applications. A FSI classification of 30 would then also be
expected to be almost as safe. However, a room lined with a Class A foam
plastic (tested at Underwriters Laboratories) reached flashover in less than
120 s when exposed to the flame from a 9.1 kg (20 lb) wood crib [2]. A
subsequent fire test run at the National Bureau of Standards, with a room
lined with FSI 30 polyurethane foam, exhibited flashover in 17 s when exposed
to a gas burner with a constant net heat output rate of 80 kW [3]. The latter
heat output represented only a small fraction of that needed to flash over the
space. Previous studies [4] indicated that at least 300 kW was required for a
similar sized, well insulated test room to reach flashover in under 600 s.
The avoidance of flashover is particularly important as the event represents a
transition from a fire in which the flame spread can normally be confined to
the room of fire origin to a fire which could readily involve the active
burning of adjoining spaces and, eventually, of the entire structure. Once
flashover has occurred, the fire can spread outside of the room of fire origin
by two mechanisms other than by heat conduction through the walls and ceiling.
One is the ignition of combustibles by direct contact with flames and hot
combustion products leaving the room. The other is ignition by thermal
radiation levels of 20 kW/m2 or more through the room opening. Time to
flashover has been defined in a proposed method for room fire testing [5] as
either the time when the radiant flux onto the floor reaches 20 kW/m2 or the
temperature of the air near the ceiling (hence, also in the doorway) reaches
600°C. The proposed method "rec:ommerrdecr·t:hat the spontaneous ignition of a
crumpled up single sheet of newspaper on the floor would provide a visual
indication of flashover as would be the flame extension beyond the doorway
v.StA.a.//b which~rselly ccur at about the time of flashover. Of these above events
indicative of flashover, the value of 20 kW/m2 on the floor is the most
critical. At this flux level, spontaneous ignition of light combustibles
occur in the room of fire origin and the fire will very rapidly grow to
involve virtually all combustibles in the room. For the above two foam
materials, a "safe 11 E-84 rating was, in fact,not "safe'' at all. Indeed,
evidence shows that room fire testing offers the only current means for
accurately measuring some·of ~he fire ha~a~ds·~f S)~~hcti~-~oarn material3
") 7 [2,6,7]. In studies with painted and unpainted insulation materials [)'.~]. no
10

correlations were found between their room fire test behavior and their
performance on laboratory tests which measure ignitability, flammability, heat
release rate, and smoke generation.
The potential fire hazards of such foam plastfc.s leci. cu building code
requirements that foam plastic materials must have an E-84 rating of 75 or
less and be covered with a thermal barrier layer equivalent to 12.7 mm thick
gypsum board; however, if they are to be exposed, their 1re safetx ust be
e demonstrated by a full-scale room fire bst [8,9,10]. In the Uniform
I
Code of the International Conference of Building Officials (ICBO), a
particular room fire test, with a wood crib as the ignition source, was
specified for this purpose [8]. A task group was then set up to develop a
modified version of this ICBO test which would be acceptable as an ASTM
standard test method. This modified test used a propane burner instead of a
release rate from the fire. A proposed method has been published in the grey
pages of the 1982 ASTM Annual Book of Standards [5] for information purposes.
At the present time, Task Group 1 of ASTM subcommittee E 5.13 is actively
working on the improvement of this proposed standard. This test method has
been used in the United States at the University of California at Berkeley,
the Weyerhaeuser Company in Longview, Washington, and the National Bureau of
Standards. The results from the University of California and the National
Bureau of Standards have been published [11,12,13]. In addition to
requirements regarding the room and ignition exposure, the method specifies a
hood outside the doorway to collect all of the exhaust-ga~ss ir. order tc
provide information on the rates of heat, smoke and toxic gas production.
11
Before the test method can be accepted as an ASTM standard, a suitable heat
release rate scenario for the ignition source has to be agreed upon and
interlaboratory evaluations of repeatability and reproducibility should be
conducted. It is necessary to be able to apply this standard room fire test
method to all materials not just foam plastics.
Eventually, room fire tests could be replaced with a mathematical model
which could predict fire development for other room sizes and configurations
and ignition conditions, based on information from bench-scale tests and
material property measurements. Prerequisite to this approach are (a) the
need for an improved understanding of surface flame spread and its relation to
the thermal environment in the room and (b) a well-documented data base from a
variety of room fires.
With all these considerations in mind," ·the, objectives of the presenL
project and of this report are: i?y
!_JJ1/~ r/J
~'""· /) ______!;,· to investigate the effects of three different heat release rate
). j}v J exposures for the ignition source on the room fire behavior of a r·. variety of interior finish materials having a broad range of fire
properties,
o-t.r ,f" )---~~ 2. to evaluate the various methods used for determining room flashover 1
to provide surface flame spread data from rs.o"&:. €i~res as ·a func.tic~
of the degree of fire development in the room, and
12
f }£~"~-<./~ ~ . ~. i/.J./V"- __,..__..;;;G·..--A.--
J"' J/< ,c ct. cc,
' to examine the practicality of the operational procedure recommended
in the proposed standard.
2. EXPERIMENTAL
The inside dimensions of the test enclosure are 2.54 x 3.71 x 2.49 m.
The two side walls and rear wall ar constructed of concrete masonry block.
The front wall (containing the door) and the ceiling are constructed of 6.4 mm
calcium silicate board. The doorway has dimensions of 0.76 x 2.03 m and was
located at the center of the wall. Furring strips of either wood or metal are
used on the concrete masonry block walls to adjust the finished interior
dimensions of the burn room to 2.44 x 3.66 m. Similar strips are used on the 4-4-
ceiling to adjust the finish height of 2.~ m. The floor is reinforced
concrete, protected by a layer of gypsum wallboard.
Figure l is a schematic of the test room and exhaust hood. This hood
has horizontal dimensions of 3.7 x 4.9 m and discharges into a 1.2 m square
duct. The ducting is comprised of an initial upward section, then a downward
portion, and finally another upward section.
2.2 Test Materials
In the assessment of the fire test_ftethod, six materials having /
··,
significantly(~ifferent flame spread behavior or heats of combustion were used
in this study. These materials are indicated in Table 1. Gypsum b~ard io
fire resistant and is used extensively in residential occupancies and thus was
13

chosen as a reference material. Polystyrene and polyisocyanurate foams are,
in practice, used only when protected with a fire resistant barrier such as
12.7 mm thick gypsum board. In this study, these foams were used fully
exposed to exemplify interior finish materials having widely different flame
spread characteristics. In addition, polystyrene was chosen for its tendency
to melt and drip when exposed to a fire. One plywood was selected as
representative of wood paneling having no fire retardant treatment. A
thickness of 12.8 rnrn was selected to assure a sufficiently long involvement
without burnthrough for the assessment of the different fire exposure
scenarios which last as long as 900 s. The 5.6 rnrn plywood was similar to that
used in the room fire test at the University of California [12] and was used
to assess the reproducibility between the two facilities for this material.
Fire retarded plywood is becoming commonplace in the horne and therefore a
A' .f_..-r-:.J' representative sample was included._ 7/ vr~/
· "' ,,.,1~ I ;L-/ ft"-'1 Y/ 7 ft ,.~·
X-·0_ / f1t)' f.•/~ Y(~L I ~- :f:C:)/_/.~ / ~ v· -u 7 /J-<--ft. a o 1_ a___~, il.
j/V"J~~~~ :P ,Y 2.3 Test Program /-f ;_,~ )~JIJ;:.r;-,,;; ,/"' /""('"'"
In the selection1
of ignition exposures, the expoJure should be large
. . / -----..._ enough to ade~uately assess the fire hazard potential of materials, but should -------------- /- --~~-not be so large as to _€verwhelrn the materials being evaluate~) At the Swedish
National Testing Institute [14], full-scale room fire tests have been
conducted using a propane burner, positioned in a back corner, operating at
100 kW for the first 600 s and at 300 kW for another 600 s. An ~------- ""---.__- --~-
earlier study <._________ ___ _
[4] indicated that 300 kW could result in flashover conditions in a non
flammable, well- in--:::.:1-t.erl- -Eest room. - "1'-hu.s, - "tb-i::J B~"'P'-8s~r-.::.: -was considered to !
too severe. A rnaxirnuk exposure of 160 kW, proposed in 1982 by Task Group 1
14
of
ASTM subcommittee E 5.13, was chosen for this study. However, an error in
calibration resulted in a value of 180 kW for the maximum exposure.
A~ iv Three ignition exposures, each eventually producing a maximum value of
180 kW net rate of heat release, were used and are shown in Figure 2. This
maximum rate corresponded to a nominal propane gas flow rate of 2.06 ijs at
20°C and 100 kPa. Exposure A was a constant 180 kW maintained for 900 s and
was chosen to evaluate the effect of a severe sudden thermal insult on
materials. Exposure B, proposed by Task Group 1 of ASTM E 5.13, started at
0.25 of its maximum value, increased to 0.50 of its maximum at 30 s, to 0.75
of its maximum at 60 s, to its maximum in 90 s and was maintained at that
level to 900 s. This exposure was chosen to evaluate the effect of having an
~~' '"""""''"''' ''""" CCoo "''"'"'" oo moceo<o'•· >xmoom<• C <Co<CoO •<CO "-'' 1/ of its maximum value, maintained for 300 s, increased to the maximum for
-f/~,_J :Soo s another 300 s, and the ignition source was then turned off for the1period.
Exposure C was selected to evaluate the effect of a longerJlow fire exposure
on materials, particularly charforming materials such as rigid foams and wood,
and to examine their subsequent behavior under a severe fire exposure. This
exposure also allowed an evaluation of the self-sustained fire spread
characteristics of materials.
e.. The ~st program is summarized in Figure 3. For tests 1-15, 19 and 24,
the test specimen fully covered the back wall, the two side walls, and the
ceiling. The remaining tests had either the ceiling or the three (side ffif~J
back) walls covered with the test specimen. The 5.6 l\ll!J--thick plywood 1 ·was
National Bureau of Standards and at the University of California [12] using
ignition exposure B. Exposures A and C were used for the plywood 2 to bracket
the material's behavior under the least and most severe of the three
exposures.
2.4 Test Procedure and Measurements
With the specimen material in place, the interior dimensions of the test
room were in conformance with the recommended standard room size of 2.44 rn ±
25 mrn by 3.66 m ± 25 mrn by 2.44 m ± 13 mrn high. The interior finish material
to be tested was mounted over 13 mrn gypsum board. For the foam plastics, the
specimen was glued to the gypsum board using 3M-2226 adhesive made by the 3M
Corporation~ For the 5.6 mrn plywood, the room construction replicated that
used in the University of California test. When the specimen lined only the
wall surface or the ceiling surface; the remaining ceiling· 'Or wall surface was
the gypsum board substrate.
The relative humidity in the fire room was maintained with a humidifier
between 42 and 55 percent for at least 24 hours prior to the test. The
temperature of the laboratory was controlled such that the test room was
maintained within the proposed test value of 21 ± 3°C.
2 Note: Certain cornmerc~a-1- mate:rials and equipment ··aLe i:dentified in this report for completeness. Such identification does not imply recommendation or endorsement by the National Bureau of Standards, nor does it imply that the materials or equipment are necessarily the best available for the purpose.
16
2
A 305 rnm by 305 rnm by 305 rnm high propane gas diffusion flame burner in
one back corner served as the ignition source. In this series of tests, C.P.
grade propane was used in lieu of the less pure commercial grade to avoid
possible fractionation problems. In each test, the fire was allowed to
continue past peak fire intensity before extinguishment. The flux levels on
the back wall over the burner, at the 1.22 m and 1.83 m heights above the
floor and 0.15 m away from the corner, are given in Table 2 for the burner
operating at the 180 kW setting in the room lined with exposed gypsum board.
The flux levels in Table 2 can be used as a check on the reproducibility of
the ignition source intensity when such tests are repeated at other
facilities. The data in the table also showed that there was no significant . .. ·-···- -~~?,_ ________ _ the coolant water~to the fluxmeter was varied.fr~~ ' .
. C</<.J.. ;L J.,:. u~"~..J: /V'... . ....::::::.:_.----
Locations of the instrumentation used for the room fire tests are shown
in Figure 1 and listed in Table 3. The output of each transducer was recorded
every 2 to 3 seconds. The rate of heat release was calculated from
measurements which were made in the ducting leading to the smoke abatement
equipment for the building. These measurements were taken in a section of the
duct where the gases are flowing downward; the gases a:::~~~~t<>_b6~'7J -
uniformly mixed at such a location. The heat release rate was determined
using the oxygen consumption method [17] which depends on measurements of mass
flow and the oxygen concentration. The mass flow was measured with an array
of nine pitot-static tubes, each with its own pressure transducer, and
array of nine thermocouples. The oxygen concentration was measured at
center of the duct using a paramagnetic gas analyzer. The pressure
17
transducers has unsteady output signals reflecting turbulence in the ~ ~"--'~
airstream, and these signals were smoothed using active filters with ten /I
second time constants. (Each filter used a 10 microfarad capacitor, two one
megohm resistors and a chopper-stabilized operational amplifier to time-
average the signal from one transducer.)
The heat release rate measurement was calibrated at 250 kW using a square
diffusion burner, 0.305 m on each side 1 installed under the hood. The propane
flow to the burner was determined both by the mass loss rate of the propane
and by the volumetric measurement of propane flow with a rotameter. The
calibration factor which had to be applied to the heat release rate
calibration was determined by this procedure to be 0.70. For calibration
between 250 kW and 4 MW, natural gas was used. An orifice meter
and ASME specifications and the dry gas displacement meter~ed made to AGA
for metering
the· natural gas to 'the building, were used to measure the gas flow to the
burner in this case. The calibration factor of 0.70 was found to hold for the
higher heat release rates. This calibration factor was substantially below
unity because true straightened streamline flow had not been achieved in the
measurement section. The calibration curve for the heat release rate is given
. f" '11, ~n 1.gure I .
There is a response delay for the oxygen concentration measurement which
is a composite of the transport time for the effluent to reach the gas
sampling location, the transport time within the gas sampling system itself, of
and the response time ·a=ally requirod b:r>the oxygen ·analyzer. (In this
instance, the time required by the gases to reach the sampling point is much
18
larger than the other two components.) The measurement of the flow velocity
also has a response time due to the filtered output of the pressure
transducers which monitor the pitot-static tubes. Babrauskas [18] gives a
discussion of various methods of correcting for the time delays in this hood
before choosing a delay of 30 seconds as a reasonable approximation. Based on
t:hat discussion the data on heat release rate presented in this report have
been adjusted by subtracting 30 seconds to correct for the system response
time.
l> : ,)-' /~/- 1)/ The hood was also used to quantify smoke from the room fires in terms of
i/ ' -1 /
I '; a critical cross section which is based on optical density and mass flow ~~----~-~-~
\ measurements in the hood duct [19].r The optical density across the exhaust
duct was measured with a laser photometer and is given by
O.D. 100
loglO T
log eKpL 10 0.434 KpL
where T is the percent transmission measured with the photometer, K is
the specific extinction coefficient in m2 jkg, p is the smoke density in kgjm3
and L is the path length in m across the exhaust duct. The critical cross
section is given by
2.3 L
f ttO.D.) Vdt 0
where Vis the volume flow in m3 /s in the duct referred to the stream
temperature and tT is the duration of the test in seconds.
Prior to room flashover, fire growth was followed using the maximum ajr
temperatures reached near the ceiling and near the top of the doorway and by
the thermal flux incident on the floor.
19
temperatures reached near the ceiling and near the top of the doorway and by
~hermal flux incident on ~tl1e __ f1por.~---~~~J 1~-J./
~j)-v-< /' r»
In the determination of room flashover, the times were recorded at which each
of five criteria were met:
'u/ •1 5 f' 1v lrV/' o& ~-~/ ~~/
1 ~ ~ 1. flameover, defined here as the emergence of visual flames
~b j y~Y;'~ "~ f'~ t ~ from the doorway (tF),
~ J' ~ k I;,/ J'-' ..tA/ /)..!. \~v
2. the visual ignition of crumpled newspaper on the floor (tF 0 ),
3. the attainment of a heat flux of 20 kW/m2 on the floor (tFloor),
4. the attainment of an average air temperature of 600oC or
higher near the ceiling (t1 }, and
5. the attainment of an average air temperature of 600oC or
higher near the top of the doorway (tn).
In tests lB to 19, vertical and horizontal grid lines were drawn on the
walls and ceiling, at 0.305 m intervals away from the corner where the burner
was situated, to help follow the surface flame spread. In tests 17 to 19,
thirty-three surface thermocouples were P~t>e~ on the walls at locations
shown in Fig. 10.
20
Still photography and continuous video coverage of the burner flame and ··h· .fvCV\ ! ., ....• --r
adjacent walls and ceiling were taken to allow mapping of the surface flame
spread as a function of time. Only the flame spread along portions of the
back wall and ceiling could be viewed through the doorway. The flame spread
profiles for the remaining portions of the room had to be estimated based on
past experience with room fire testing of interior finish. The estimated
profiles along the left and back walls were assumed to be extensions of what
were observed along those surfaces and were assumed to connect with the
observed spread along the ceiling. Estimated profiles along the right wall
were drawn to be consistent with the projected ceiling profiles and assumed to
have~~ those for the left wall.
The operational procedure followed that described in the proposed room
fire test method [5], except that purer, C.P. grade propane, instead of
commercial grade, was used and·that thermocouples pehetrating through the
ceiling, instead of being mounted on supports inside the room, were used for
recording the air temperatures near the ceiling.
3. "RESULTS AND DISCUSSION
Uncertainties must be estimated for the various measurements before a
meaningful comparison of the data can be made. Temperature measurements with
type K thermocouples used in-this
d 0.75 percent, whichever is greater [20]. Garton type
21
fluxmeters, in these room fire tests, are accurate to ± 3 percent [21]. From
our r•e1 i e11ce, the heat release rate measurements could be accurate to ± 0. 05
MW for rates up to 1 MW and± 5 percent for higher rates. Smoke measurement,
expressed in terms of an extinction cross section could be measurable to ~cJ r: within ± 20 percent, although this estimate is somewhat crude. With the
newspaper flashover indicators, there is evidence [22] that variation in the
thermal and physical properties of newspaper could result in the crumpled
newspaper igniting over a range of fluxes between 17 and 25 kW/m2 .
Test reproducibility could pose a problem. Unfortunately, this is
difficult to deduce because only one test with the fire-retardant-treated
plywood and another test with the polyisocyanurate were repeated. There were
problems with the conditioning and uniformity of the treated plywood, and
these will be discussed later. As
test 96~e practically identical
for the polyisocyanurate, the data from
with the· limited data from its repeat test
24. In tests 17 and 18 with the plywood lining the walls, only the ceiling
materials were different. Test 17 had an inert calcium silicate board
ceiling, while test 18 used a gypsum board ceiling which had a fairly low
combustibility. Much longer times were needed to achieve 600 to 650°C in the
doorway in test 18 than those in test 17. This might have been a consequence
of the larger thermal losses to the ceiling in test 18 due to the higher
thermal conductivity of gypsum board. ~is apparently did not affect the
interior temperatures, because the interior thermocouples were located (0.10 m
below the ceiling) below the cooler layer adjacent the ceiling. The funneling
of this cooler air out the doorway might have brought· the ·cooler air down past.
r)_, -;C:-<"' the doorway thermocouples in test 18. Aside from the doorway data, ~tests
22
/]
LJ. \A
gave(lresults which were within 15 percent of each other. This was consistent
with findings from a series of quarter-scale room fire tests of interior
finish materials [23] that reproducibilities of about ± 20 percent in
occurrence times were possible for each of these same flashover indicators.
3.1 .,f ,
H 1 s fo "':j a}l Fir--e Sb e.v e/ e f !MY' uu
/ ~ ri::cc/In this series of tests, one would expect that as the ignition exposure '' (. "j
?t)J/./ 1 'l .-./I
U-r 1 ,_...VJ yincreases in severity from exposure C to A, the values of pre-flashover
'" _;. !'~-" ~ 'I L" v A ~--': .. J ,,;, :\.,..1 parameters (peak values of heat release rate , air temperatures, and thermal
,v ''jY -.; >/- \_l, ~-
·/ .. -/~~.'!-:.;' radiation)·-·-~o~ with decreasing times of their occurrence,
~;tr Vif· }Y ( ~ providing the resulting
I~ , ,j" ~..::1:~
fires are s~~ enough such that the measurement
' uncertainties would not mask such effects. An examination of Tabl~s ~ ~o 8
1 flu r
shows that the uncertainties in measurement masked any effects of ~gnltlon
exposure in tests lB to 3B with the gypsum board. In tests 7 and 19 with
plywood 2 and tests 9 to 14 involving the polystyrene and polyisocyanurate,
the times to reach flashover, based on all five criteria ·discussed in seccion
2.4, were considerably shortened as the ignition exposures changed from C to _J;:;,, ......
A. For the polyisocyanurate in test 14, exposure C initially had little "
effect on the material. When the burner level was increased to that of
exposure A at 300 s into the test, the fire development in test 14 then
proceeded to behave much like that for test 9 with the scenario A ignition -Fo a.ms
exposure. Smoke production at exposure A for both~ was considerably
grater than those at exposures B and C. In tests 16 to 18 and 20 to 23, where
the test material was used only on the walls, similar changes in the room fire
development occurred with increasing severity of the ignition exposure.
3~te system, and any burning
that thus in a
these values are determined by measurements include both the heat being released within fire plume outside the door.
23
in the exhaust the test room and

The different ignition exposures gave erratic results for the fire
retarded plywood. This was attributed to two factors: (1) nonuniformity of
material properties in the batch of treated plywood,(A second batch of fire
retardant treated plywood received from the same supplier appeared
significantly different in color, suggesting that some differences in wood or
in treatment may have occurred even through the plywood was stamped with the
same treatment identification. This new batch was not used in the present
study.) fond (2) difficulty in conditioning the material over a reasonable
period of time. An electrical resistance moisture gage was periodically
inserted into the material to ascertain whether steady state conditions had
been achieved. The gage could not be used to quantify the moisture content as
the measurement was affected by the fire retardant additive. However~ after
fo (, two weeks, the gage readings indicated steady values and tests 4Awere
performed. With exposure A, no ignition of the newspaper flashover indicators
occurred and a flux of only 13.8 'kWjrn2 ·was measUred on -cn:e··, floor. Subsequent
tests 5 and 6, with exposures C and B, respectively, resulted in ignition of
one or both newspaper indicators in each test with higher fluxes incident on
the floor. Test 15 was a repeat of test 4, using the remaining panels, which
had been conditioned at about 22•c and 50 ± 5 percent relative humidity for
several months. Test 15 resulted in ignition of the newspaper flashover
indicators and reached 20 kW/m2 on the floor at 847 s. It can be concluded
e that materials having probablt differences in composition or nonuniformity in
fire retarded treatments should be conditio~ed over a range of times and fire-
tested periodically to check on their consistency in fire performance. . u - v; cJ>-L {.LI- /'~ i:;:t
flt-v-•' I j-
24
The data in Tables 4 and 5 show that the three ignition exposure
conditions could result in different fire behavior when the test material
covered only the walls and when
-----ceiling. Heueve.r, fhe relative
the material covered both the walls and 77
--~,,
fire fuzard ranking~ of these materials
depended on the exposure condition used and on whether the material lined both
walls and ceiling. For example, when the room was fully lined with the test
material, exposure A ranked the materials in the following order of increasing
hazard, based on times to reach room flashover (20 kWjm2 on the floor, except
for test 10, where the newspaper indicator was used in lieu of no flux datum):
gypsum board, fire retarded plywood, plywood 2, polystyrene foam, and
polyisocyanurate foam. However, when exposure C was used with a fully-lined
room or when exposure A was used in a room where the material lined only the
walls, the polyisocyanurate material resulted in longer times to flashover
than those for the plywood 2 and polystyrene. Exposure A was chosen for the
case where the test material lined only the ceiling because tests 2 and 3B
showed that the burner flames for the initial parts of exposures B and C did
not reach the ceiling. With the test material on the ceiling under exposure
A, the polyisocyanurate also resulted in longer times to reach flashover than
did those for the 7
plywood 2 and polystyrene.; . U ;J ,&u- cr"- £- ~~
• II 7/ J .i:'_/"f ? /-2--'~.
3.2 Comparison of Results with University of California Test
The conditions in test 8 with the 5.6 mm grade AD plywood were planned
to be the same as in test C-213 conducted at the University of California
(12]. A comparison of results from the two tests is given in Table 9.
rate of heat release curves are shown in Figure 5. These indicate a
25
substantial difference between the two tests. Test 8 resulted in a more rapid
fire buildup than C-213, in part because the ignition exposure in test 8 was
found to be 12 percent higher than that used in test C-213. In addition, the
plywood specimens used in the two tests were each purchased locally and might
not have been identical. Third, the specimen conditioning prior to test might
not have been the same. Despite those factors, it is interesting that all of
the five flashover indicators occurred at times within the experimental~
repeatability expected between similar runs . "/. .j u. · · · ' "1 -~' v I j_..,!"
3.3 Comparison of Various Methods for Determining Flashover
The occurrence times for the five criteria discussed in section 2.4 are
shown in Tables 4 and 5 under headings of tF, tFO, tFl:.o_r·~--:~· an~~
c::=l of the- t"'S"tS, · a:~---fiv~-~=o·::· parante<:ers for each <:es<:
gave times which were close to each other for severe room fires (e.g., fires
having a flux of 20 kW/m2 or more on the floor, or newspaper flashover as in
test 10 when the flux was not available). Table 10 compares statistically the
data from the five methods for determining room flashover for each test. The
high coefficients of variation for runs 9 and 15 were not surprising as some
of the data for run 9 were estimated values (interpolated between data values
10 s apart when the fire was growing rapidly) and localized heating at the
ceiling in test 15 resulted in tr values that were much too fast. Table 11
used the same data excluding the values for tr and t 0 for 6oo•c. This lowered
the coefficient of variation for most of the runs meaning that tr and t 0 based
on the higher temperatures of 70o•c and 650•c, respectively, resulted in
26
better agreement with the rest of the flashover parameters. Table ll
indicated that, aside from tests 9 and 15, the flashover indicators had
coefficients of variation of less than 14 percent. For less severe fires, one
or more flashover criteria we-re not satisfied. Since the range of the five
times was narrow, one can use the most comfortable or practical criteria. The
following discussion helps with which to use.
Flarneover did not always occur for the situation where there was
sufficient thermal radiation to ignite combustible items in the lower part of
the room. Test 6 illustrates this case. In that test, both newspaper
flashover indicators ignited and both interior and doorway air temperatures
exceeded 6oo•c. Yet no flameover occurred.
In the case of the newspaper indicators and fluxmeters, burning material
falling from the ceiling could affec<: <:heir reliatiility. For example, test lo
0 had its newspaper indicator at the back of the ~om ignited by falling embers.
For rapidly-developing fires, it is sometimes difficult to determine whether
this is the case. Material falling over the flux meters could either obscure
or transfer additional heat to the fluxmeters.
Air temperatures measured near the ceiling could be affected by local
heating and flame contact, resulting in readings that are higher than average
with consequent premature times for flashover. For example, in tests 15 and
18, the times for tr based on the attainment of 600°C were too soon compared
with the times for tF, tFO, tF loor, -and Tn -. Tables 4 and 5 show that having
ti correspond to an interior air temperature of 700°C resulted in closer
27
agreements with the other flashover indicator times for test 18. However, the
value for t 1 was still too short for test 15 and the t 1 for test 4 indicated
flashover at 240 s, which was inconsistent with a floor flux of 13.8 kWjm2 and
no ignition of the newspaper flashover indicator.
The peak doorway air temperature may be a more reliable indicator of the
fire buildup than is the interior air temperature. The hot air inside the
M room usually becomes well mixed by the ti¢e it is exhausted through the
doorway. However, inconsistencies still occurred with the use of doorway air
temperatures. For example, Table 4 indicates that a t 0 based on 600°C gave a
flashover time of 300 s for test 4, which was \V%~q~{ste;~>F. with a no flashover
indication from the floor flux and newspaper ignition indicators. A t 0 based
on 650°C resulted in a no flashover indication for tests 4. However, a t 0
based on 650°C resulted in a no flashover indication for test 26 in Table 5 in
contrast to the other indicators ·showing Elashover.
In summary, there are problems which can arise in determining flashover
by each method. Thus, it is necessary to have more than one reliable method
for indicating flashover:· Analysis of Tables 4 and 5 indicates that
flameover, a 20 kW/m2 flux incident on the floor, flaming ignition of crumpled
newspaper, an interior upper layer air temperature of 700°C and a doorway
upper layer temperature air temperature of 650°C comprise a reasonable list
from which to choose. For following fire buildup
flameover and the newspaper indicator are useful.
3.4 Fire Growth Data
28
Figures 6 to 10 show the flame spread patterns at selected times for the
five test materials which were evaluated under test conditions of exposure A
and where the test specimen covered both the walls and the ceiling (tests lB,
9, 10, 15, and 19). These five tests were chosen as the easiest cases for
mathematical simulation of the room fire growth due to their constant ignition
exposures and uniformity of materials on both the walls and the ceiling. The
room surface areas covered by flames at selected times for these tests (except
for test lB) are given in Tables 12 to 15. Test lB was lined with gypsum
board. There was little or no flame spread with just the flame impingement
zone darkened by the burner flame. In test 19 with the plywood 2, the exposed
surface was instrumented with surface thermocouples as shown in Figure 10.
b The times of arrival of the flame front at specific locations on the jack wall
agreed with those estimated from isotherms based on an ignition temperature of
350"C for wood.
This same procedure was repeated for tests 17 and 18 with the plywood
2 lining just the walls of the room. The flame spread results are given in
Figures 11 and 12.
As an aid for future understanding of surface flame spread and itS
dependence on the environment, oxygen concentrations in the room were
monitored for tests 17 to 19. The data are given in Figures 13 to 15.
Ceiling fluxes were also measured in tests 17 to 19, and these are shown with
fluxes taken at other locations in the room in Figures 16 to 18.
29
Wall flux data at two locations on the back wall are given for all of
the above tests in Tables 16 to 21. Times were also indicated in these tables
for the arrival of the flame front over each fluxmeter, for room flashover,
and for complete coverage of the room linings.
3.5 Heat Release Measurements
The rate of heat release histories for tests 7 to 27 are shown in
Figures 19 to 27. For the gypsum board tests, these curves were the same as
those for the propane burner within the measurement scatter of± 50 kW. Thus
they were not included. For the fire retarded plywood, the peak rates in
tests 4 to 6 were an order of magnitude lower than that for test 15. The heat
release histories for tests 4 to 6 look similar, but with lower peak values,
to the first 600 s of that for test 15. Only tho •·,~::st case for the rate of
ht:>.::l't:' r:.E?lea.se. l.:d-s.t0ry-is g~iven, i .. e. __ ,test 15,.,and is shown in Figure 19 along
with the history for test 8 with plywood 1. Figure 2C compares the results
for plywood 2 under exposures A and C. Figure 21 shows the heat release rate
histories for plywood 2 lining just the walls under similar exposures. The
same figure shows ·the differences in the rate history when the gypsum board
ceiling was replaced with calcium silicate board. Figure 22 compares the case
where the plywood 2 lined just the ceiling with those where the plywood lineg/
the walls alone and lined both walls and ceiling. Figures 23 to 25 give the
heat release rate behavior for the room partially and fully lineJwith the
polystyrene under different ignition exposures. Similar rate histories for
the polyisocyanurate are given in Figures 26 and 27.
30
Peak rates of heat release and the rates occurring at the time, when 20
kW/m2 was measured at the floor (tFloor), are presented in Tables 6 and 7.
For the plywood materials covering the walls and ceiling, the rates at time
tFloor ranged from 1.7 to 1.9 MW. This was consistent with a value of 2.1 ill'
found for plywood tested at the University of California [12]. When
polystyrene was used on the walls and ceiling, the rates at time tFloor ranged
from 3.1 to 4.2 MW. Tests with polyisocyanurate resulted in heat release
rates of 2.2 to 3.2 MW at time t>, The data on heat release as a function of 1~tr0
time had been adjusted by subtracting an estimated measurement system response
time of 30 s, as discussed in section 2.4. In the tests of the polystyrene
and polyisocyanurate foams, the heat release rates were rapidly increasing at
the time of tFloar· A small uncertainty in the system response time could r)l' fo,..,jCV-?
thus result in apparently significantly smalle~~rates at time tFloor·
These measured values can be compared with those predicted with a rough
analytical procedure [24] which assumes that only the fuel heat release rate
and the available air supply, expressed in terms of the room ventilation
factor WH3 ' 2 (where Wand H were the width and height of the opening), are
needed to estimate the room flashover potential. Use -!AM f'H '~ ,j!V-<.__.
of~analytical~resUlted
J P /3 in the prediction of a typical rate of about 1.3 MW required for flashover in I I
~ the tests conducted in this study. This is in reasonable agreement with the
V Y · range of 1. 0 to 1. 6 MW for the walls-only tests. Flashover for the fasterv
developing fires, as represented by the walls-and-ceiling tests, occurred at
higher than predicted heat release rates, making the estimate conservative for
these purposes. As for minimum rates needed for room flashover, evidence
showed that for long duration fires and fires in highly-insulated rooms, rates
31

as low as 300 kW could suffice [4]. A more exacting procedure, which takes
into account the physical properties of the interior finish, room size, and
doorway openings, is also available for estimating room temperature, and hence
the potential for flashover, as a function of heat production rate [25].
However, it can not accommodate rapidly varying fires.
Integrating the rates of heat release shown in Figures 19 to 27 over
time gives the total heat produced in each fire test. In Table 22, this total
heat was compared with that calculated from the total weight loss of the test
material multiplied by the net heat of combustion to determine the combustion
efficiency for the material. (The net heat is equal to the gross heat minus
the heat of vaporization of the water produced.) In all of these tests, it
\) /,
"I. was assumed t.hat .. the net. he').t o.f combustion of the .res. idue was the .s.ame as ... /..... 11 ,-r~J~. M-t ~ ..• fc,,,,}.w:.f:o; .(._,--fG. p}y~ l~~z.. :>----.d fL.t.. fJ~-~ttN"i.ed f'll~ <1-J::
)that for the virgin material. A For the plywoods, the combustion efficiency was tS:l
about 0.90 when the material lined both the walls and ceiling. When the
plywood lined just the walls or the ceiling alone, the combustion efficiencies
were about 0.73 and 1.0, respectively. These two latter values were too high
because the combustion of the gypsum board paper surface was included in their
calculation. The combustion efficiency was about 0.4 for the fire retarded
plywood. Representative net heat of combustion values of 38 MJjkg and 26
MJ/kg for the polystyrene and polyisocyanurate [16], respectively)were used.
i The combustion efficiency for the polystyrene, covering both walls and I I 1 ceiling, was 0.53. This compared with a value of 0.59 from laboratory
I material property tests [26]. Similarly, the combustion efficiency for the
polyisocyanurate averaged about 0.57 compared with O.SJ !rom laboratory tests
[26]. With the material lining just the walls, the combustion efficiency for
32
(t.s
the polystyrene was less than 0.13 and was uncertain for the polyisocyanurate
due to uncertainties in measuring the small mass loss and heat release.
3.6 Comparison with Cone Calorimeter Data
The same materials tested in full-scale were tested in bench-scale in
the cone calorimeter [27]. This test method also used oxygen consumption as ~ ~
its measurement principle for determining rate of heat release and was
published by ASTM as a grey-pages proposal [28]. The materials were tested at
25, 50, and 75 kW/m2 irradiances, using a spark ignitor as the ignition
source. With the exception of the room tests with the polystyrene and
possibly with the polyisocyanurate, Tables 16 to 21 showed that the flux
incident on the back wall surface fluxmeters away from the burner flame, at
about the time of flame passage, varied roughly over the same range as from
the exposure levels of 25 to 75 kW/m2 used in the cone calorimeter. With the
exception of these same tests with the polystyrene, the fluxes to the back
wall in the upper part of the room generally exceeded 40 kW/m2 several seconds
following flashover. In the tests of the polystyrene, the wall fluxmeters
measured relatively low flux levels at the time of flame passage and at times
shortly following flashover. This could have been due to some obscuration and
cooling of the fluxmeters by the melting and dripping foam plastic. In all of
the tests, these fluxes to the wall reached between 50 and 140 kW/m2 shortly
after full flame involvement of the room lining. Thus, the calorimeter
exposure levels were representative over much of the room thermal environment
when fire spread and involvement were present.
33

Dividing the instantaneous heat release rate from a room fire by
corresponding area of room surface flame involvement results in ratios
can be compared with those obtained from the cone calorimeter. Tables 12 to - -
15 show some of these comparisons. For plywood 2, the ratios of the rate of
heat release to the surface area covered by flames agreed with the average 60
s values from the calorimeter. In room test 15 with the fire retarded
plywood, the pre-flashover ratios were much lower than the calorimeter data_;
with the post-flashover ratios looking like the calorimeter data for the
untreated plywood 2. This post-flashover behavior could have been due to the
volatilization of the fire-retardant chemicals resulting from the prolonged
low room fire exposure of the fire retarded plywood. In test 10 with the
polystyrene, the volumetric flow of combustion products from the fire exceeded
the exhaust capability of the hood system, and a small part of the exhaust
spilled into the laboratory. .e..
Consequently, the peak room unit area ~t
release rates we~R. There was also the possibility that the area
behind the flame front was not fully involved with flames. If part of the
surface had melted and dripped away, or if vitiated air had prevented the
upper surfaces from sustaining flames, a smaller surface area would be
releasing the heat. This would mean much higher values of heat release rate
per unit area of flame-covered surface more like those from the calorimeter.
For the polyisocyanurate in room test 9, the flame spread was very rapid such J
that the peak values, rather than the 60 s average values, were more
appropriate for comparison with the room ratios. The data in Table 15
indicate that the peak values from the calorimeter did indeed bracket the unit
area heat release rate values from the room fire.
34
3.7 General Remarks and Recommended Changes in the
Proposed ASTM Test Procedure
1. The study demonstrated that all three exposure conditions could
result in different fire behavior for the materials evaluated when
the test material covers only the walls or both the walls and
ceiling of the room. Consequently, each condition could be used to
help indicate the fire safety level for room interior finish
materials. However, ignition exposure C has advantages over
exposures A and B in that materials can be evaluated and rated
over a reasonable length of time (300 s) at a low exposure of
about 40 kW/m2 , 300 sat an high exposure of about 160 kW/m2 , and
then over another 300 s period for continuation of burning without
enhancement from the burner source. Exposure A cannot evaluate
interior finish materials at low exposures nor sustained flame
spread with no external irradiance. Exposure B included four
successive exposure levels, but the period of change from lowest
to highest exposures lasted only 90 s. This may not be adequate
time to evaluate some materials at the lower exposures. Further-
more, no evaluation of sustained flame in the absence of
external irradiance was included.
2. In determining the fire severity, including room flashover,
measurements of the incident flux on the center of the floor
and of the air temperatures near the ceiling and near the top of
the doorway are recommended. Flameover times and newspaper
35

indicators cannot characterize the fire severity short of room
flashover.
3. Materials having probable differences in composition or non-
uniformity in fire retarded treatment should be conditioned over
a range of times and fire-tested periodically to check on their
consistency in fire performance.
4. The present proposed standard room fire test method called for
thermocouples, mounted on supports, to be located 100 mm down
from the center of the ceiling and from the center of each of the
four ceiling quadrants and from the ceiling directly over the
center of the ignition burner. The method cautioned against
attachments to the test specimens. However, for the tests
conducted in this study, 6.4 mm holes were drilled through the
ceiling at these positions for the thermocouples and then resealed
with gypsum spackling compound. No adverse effects on the fire
development due to these penetrations in the ceiling were observed.
5. The proposed test method suggested either photographic coverage or
video taping to record the fire spread in the room. Both methods
were used in this study. When still photographic coverage, such
as with 35 mm color slides, was used, the flame spread and even
the ignition of the newspaper flashover indicators could not be
determined in sOme instances due t:o obscuration from the smoke
and glare of the fire. Continuous coverage made such determin-
36
ations much easier. If still photographic coverage is used,
VAL shorter intervals of l or 2 s~ recommended during the rapid
fire growth period. Either still photographic coverage with a
wide angle (e.g., 18 mm) lens through the floor or side wall would
be helpful when used in conjunction with the photographic coverage
through the doorway. [For research tests, these could be supple-
mented by surface thermocouples on the walls and ceiling to indicate
the pyrolyzing area as a function of time. This procedure is more
tedious, but provides a better indication of the limits of the
actual surface involvement than a visual accounting of the
front.]
'· A '+. \1 CONCLUDING REMARKS
flame
~h~s study, the combustion efficiencies of the material in
the room fires were obtained with some of the values being close
to the published combustion efficiencies obtained from laboratory
t.ests"
2. Unit-area-benchscale rate of heat release data from the cone
calorimeter may be predictive of the full-scale data when melting
and dripping (which changes the actual burning area) or very slow
to ignite fire retardant materials (whose retardants may be baked
out) were not involved. Additional studies are needed to ascertain
possible·correlations and further limitations.
37
3. The degree~ of repeatability with~in a laboratory and reproduciv
bility among laboratories need to be established for full-scale
tests of interior finish materials before correlations with bench
scale tests could be developed with confidence.
4. Fire growth studies in rooms having multi-openings are needed to
help generalize room fire behavior for other room configurations.
5. ACKNOWLEDGEMENTS
Appreciation is expressed to Mr. W.J. Parker for reviewing this work; to
Messrs. C. Veirtz, 0. OwensJ and M. Womble, who bUilt the test rooms and
performed the actual testing; and to Mr. J.N. Breese for the data reduction
and preparation of many of the figures in the report.
6. REFERENCES
1. Standard Test Method for Surface Burning Characteristics of Building Materials. ASTM E 84. Philadelphia, PA: American Society for Testing and Materials; 1981.
2. Castino, T.G.; Beyreis, J.R.; Metes, W.S.; Flammability Studies of Cellular Plastics and Other Building Materials Used for Interior Finishes, Subject 723. Underwriters Laboratories, Inc. Northbrook, IL. 1975 June.
3. Parker, W.J., Private communication.
4. Lee, B.T., Quarter-Scale Modeling of Room Fire Tests of Interior Finish. Nat. Bur. Stand. (U.S.) NBSIR 81-2453; 1982 March.
5. Proposed Standard Method for Room Fire Test of Wall and Ceiling Materials and Assemblies. 1982 Annual Book of Standards, Part 18. Philadelphia, PA: American Society of Testing and Materials; 1982.
38
6. Lee. B.T.; Breese, J.N.; Submarine Compartment Fire Study-- Fire Performance Evaluation of Hull Insulation. Nat. Bur. Stand. (U.S.) NBSIR 78-1584; 1979 May.
7. Lee, B.T., Fire Hazard Evaluation of Shipboard Hull Insulation and Documentation of a Quarter-Scale Room Fire Test Protocol. Nat. Bur. Stand. (U.S.) NBSIR 83-2642; 1983 August.
8. Uniform Building Code. International Conference of Building Officials. Whittier, CA. 1982 Edition.
9. The BOCA Basic Building Code. Building Officials and Code Administrators International, Inc. Homewood, IL. 1981.
10. Standard Building Code. Southern Building Code Congress International, Inc. Birmingham, AL. 1985.
F;sh~ 11. Williamson, R.B.;~F.L.; Fire Growth Experiments- Toward a Standard Room
Fire Test. Western States Section of the Combustion Institute; 1979 October.
12. Fisher, F.L.; Williamson, R.B.; Intralaboratory Evaluation of a Room Fire Test Method. University of California (Berkeley) UCB FRG 82-1; 1982 August.
13. Lee, B.T., Standard Room Fire Test Development at the National Bureau of Standards. Fire Safety Science and Engineering ASTM STP 882;
14.
1984 June.
WickstrOm, Full-Scale 1983.
.. U.; Sundstrom, B.; and Holrnstedt. G.; Room Fire Test. Fire Safety Journal,
The Development of a Vol. 5, pp. 191-197;
15. Parker, W.J.; Lee, B.T.; A Small-Scale Enclosure for Characterizing the Fire Buildup Potential of a Room. Nat. Bur. Stand. (U.S.) NBSIR 75-710; 1975 June.
16. Materials Bank Compendium of Fire Property Data. Products Research Committee. 1980 February.
Parker, W.J., Calculations of the Heat Consumption for Various Applications. 81-2427-1; 1982 March.
Release Rate by Oxygen Nat. Bur. Stand. (U.S.) NBSIR
18. Babrauskas, V., Upholstered Furniture Heat Release Rates Measured with a Furniture Calorimeter. Nat. Bur. Stand. (U.S.) NBSIR 82-2604; 1982 December.
19. Lee, B.T., Effect of Ventilation on the Rates of Heat, Smoke, and Carbon Monoxide Production in a Typical Jail Cell Fire. Nat. Bur. Stand. (U.S.) NBSIR 82-2469; 1982 March.
39

v 20. Temperature Measurement§{ Thermocouples. American National Standards
Institute ANSI MC 96.1; 1982.
21. Heat Flux Transducers for The Direct Measurement of Heat Transfer Rates, Bulletin 118, Medtherrn Corporation, Huntsville, AL; 1981.
22. Fang, J.B., Fire Buildup in a Room and the Role of Interior Finish Materials. Nat. Bur. Stand. (U.S.) Technical Note 879; 1975 June.
23. Huang, D., Evaluation of Quarter-Scale Compartment Fire Modeling for Constant and Stepped ~t Inputs. Fire and Materials. Publication
24.
pending. le
Babrauskas, V., Estimating Room Flashover Potential. 1980 May.
Fire Technology.
25. McCaffrey, B.J.; Quintiere, J.G.; Harkleroad, M.F.; Estimating Room Temperatures and the Likelihood of Flashover Using Fire Data Correlations. Fire Technology. 1981 May.
26. Tewarson, A., Physico-Chemical and Combustion/Pyrolysis Properties of Polymeric Materials. Factory Mutual Research FMRC J.l OEON6.RC; 1980 November.
27. Babrauskas, V., Development of the Cone Calorimeter-- A Bench•Scale Heat Release Rate Apparatus Based on Oxygen Consumption. Nat. Bur. Stand. (U.S.) NBSIR 82-2611; 1982 November.
28. Proposed Test Method for Heat and Visible Smoke Release Rates for Materials and Products Using an Oxygen Consumption Calorimeter, ASTM Vol. 04.07; 1986 November.
40
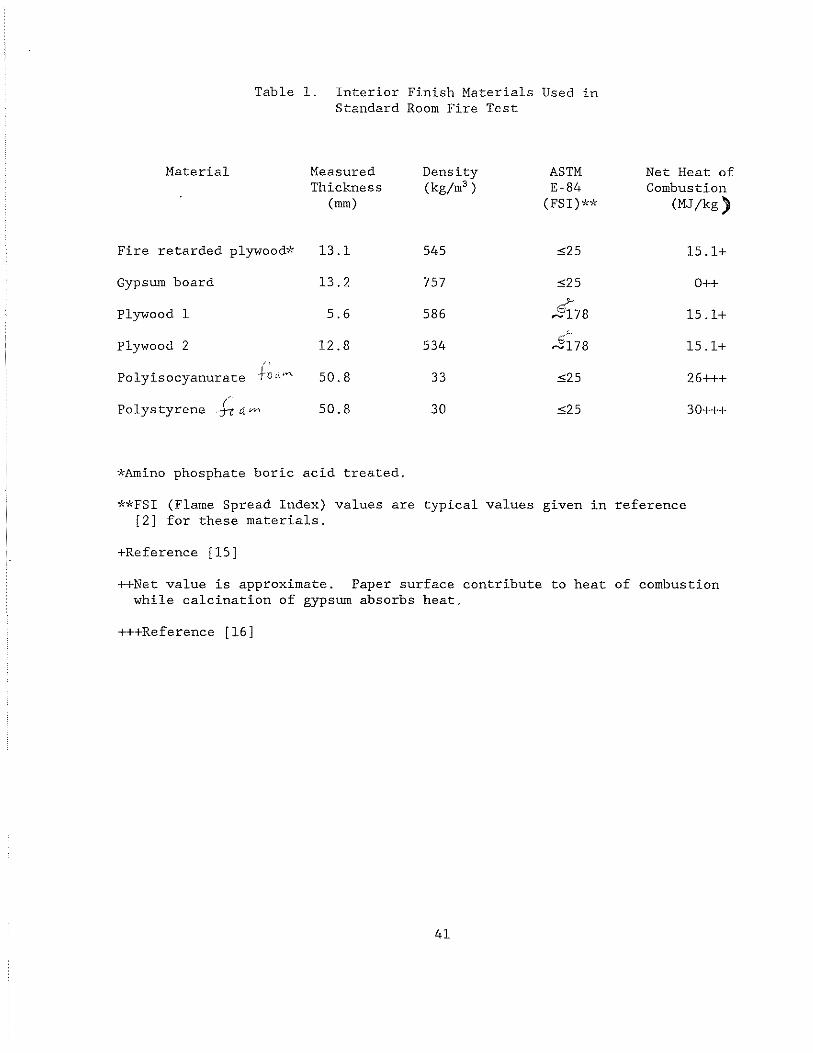
Table l. Interior Finish Materials Used in Standard Room Fire Test
Material Measured Density ASTM Thickness (kg/m3 ) E-84
(mm) (FSI)**
Fire retarded plywood* 13.1 545 :525
Gypsum board 13.2 757 :525
Plywood 1 5.6 586 ~78 Plywood 2 12.8 534 ..§i 7 8
,, Polyisocyanurate +ocV"' 50.8 33 :525
Polystyrene ~a:~ 50.8 30 :525
*Amino phosphate boric acid treated.
Net Heat of Combustion
(MJ/kg)
15.1+
0++
15.1+
15.1+
26+++
30+++
**FSI (Flame Spread Index) values are typical values given in reference [2] for these materials.
+Reference [15]
++Net value is approximate. Paper surface contribute to heat of combustion while calcination of gypsum absorbs heat.
+++Reference [16]
41
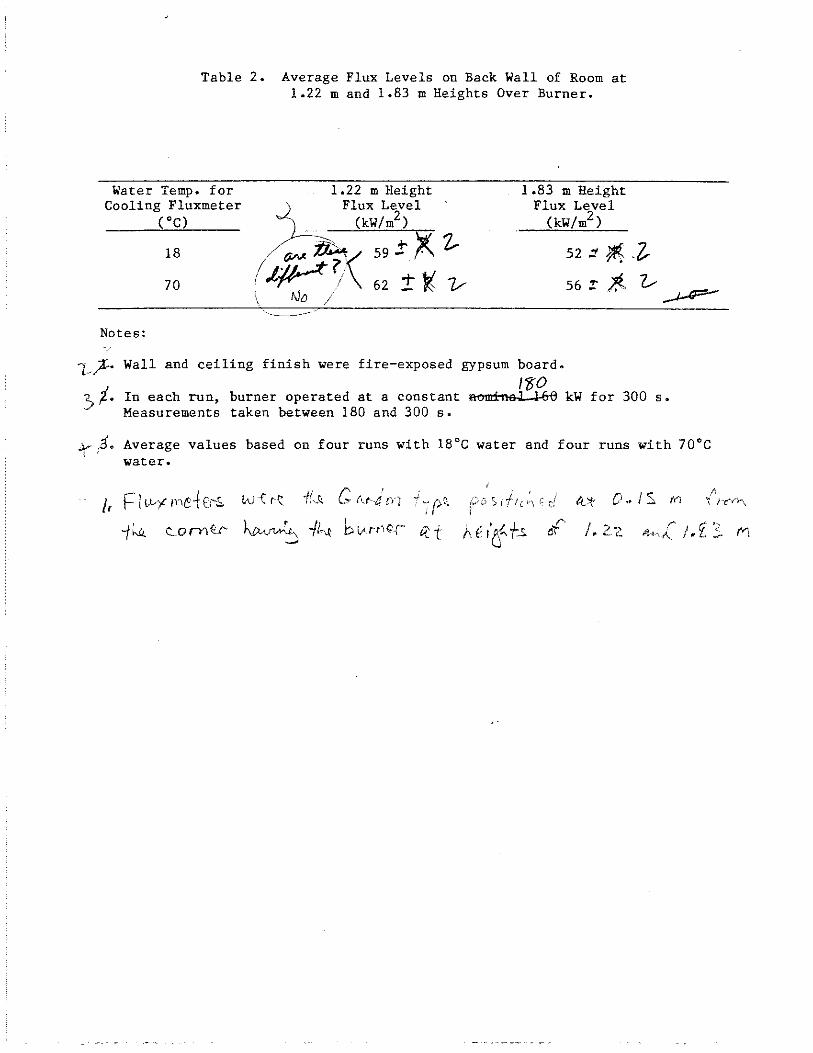
Table 2. Average Flux Levels on Back Wall of Room at 1.22 m and 1.83 m Heights Over Burner.
Water Temp. for Cooling Fluxmeter
(oC)
18
70
Notes:
1.22 m Height ) Flux Level " ~ (kW/m2)
1.83 m Height Flux Level
(kW/m2 )
52 .;!
56 :!:
Wall and ceiling finish were fire-exposed gypsum board.
ItO In each run, burner operated at a constant~ kW for 300 s. Measurements taken between 180 and 300 s.
~ j. Average values based on four runs with 18°C water and four runs with 70°C water.
o .. Js IY1
of /. 2·z.
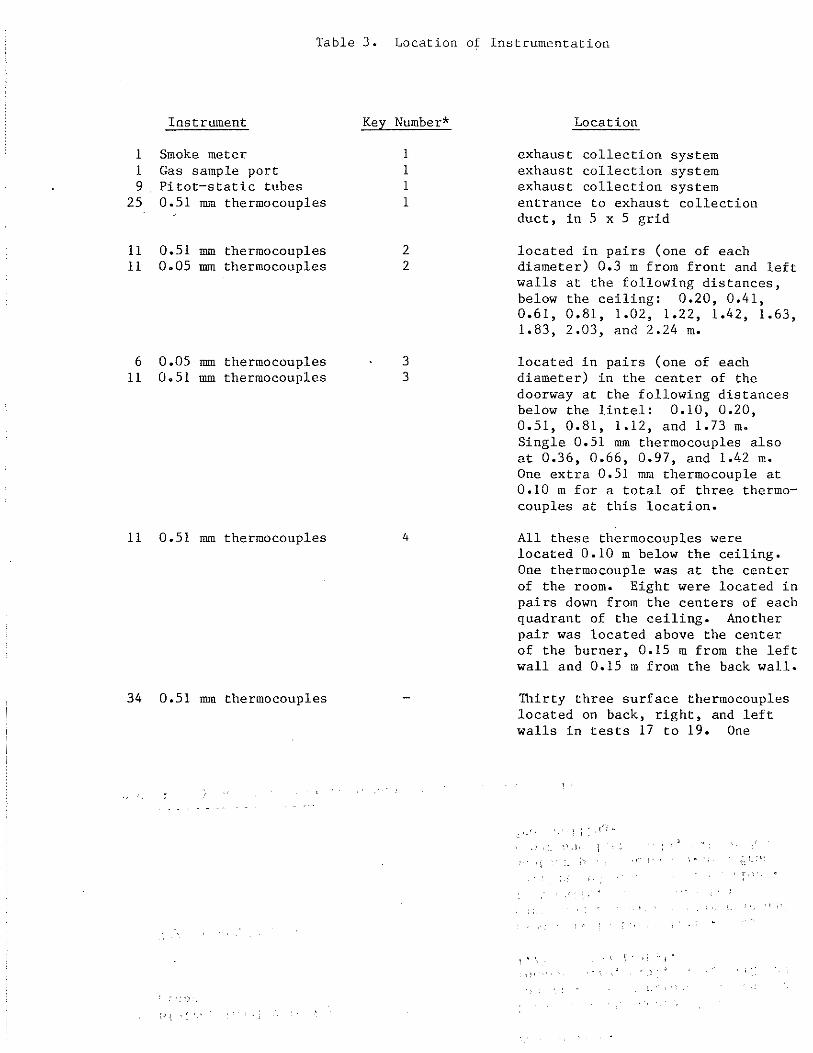
Table 3. Location of Instrumentation
Instrument
1 Smoke meter 1 Gas sample port 9 Pitot-static tubes
25 0.51 mm thermocouples
11 0.51 mm thermocouples 11 0.05 mm thermocouples
6 0.05 mm thermocouples 11 0.51 mm thermocouples
11 0.51 mm thermocouples
34 0.51 mm thermocouples
. • : !) '
Key Number*
1 1 1 1
2 2
3 3
4
Location
exhaust collection system exhaust collection system exhaust collection system entrance to exhaust collection duct, in 5 x 5 grid
located in pairs (one of each diameter) 0.3 m from front and left walls at the following distances, below the ceiling: 0.20, 0.41, 0.61, 0.81, 1.02, 1.22, 1.42, 1.63, 1.83, 2.03, and 2.24 m.
located in pairs (one of each diameter) in the center of the doorway at the following distances below the lintel: 0.10, 0.20, 0.51, 0.81, 1.12, and 1.73 m. Single 0.51 mm thermocouples also at 0.36, 0.66, 0.97, and 1.42 m. One extra 0.51 mm thermocouple at 0.10 m for a total of three thermocouples at this location.
All these thermocouples were located 0.10 m below the ceiling. One thermocouple was at the center of the room. Eight were located in pairs down from the centers of each quadrant of the ceiling. Another pair was located above the center of the burner, 0.15 m from the left wall and 0.15 m from the back wall.
Thirty three surface thermocouples located on back, right, and left walls in tests 17 to 19. One
. ,-·' ' ..
' .
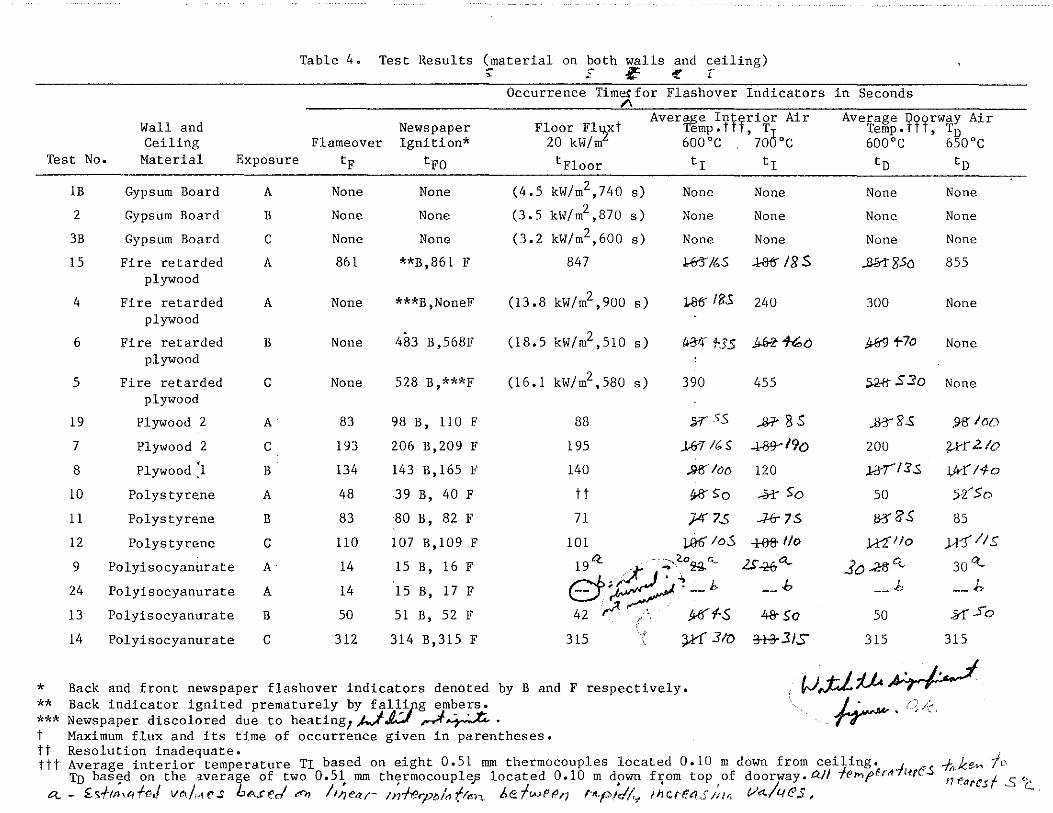
Table 4. Test Results (material on both walls and ceiling) >: -:- E e•· - -
Occurrence Time!for Flashover Indicators
"" Aver~e Inffrior Air Wall and Newspaper Floor Fl'2xt emp, t , TO Ceiling Flameover Ignition* 20 kW/m 600°C . 70 °C
Test No. Material Exposure tF tFo tFloor ti ti
1B Gypsum Board A None None ( 4. 5 kW/m2,740 s) None None
2 Gypsum Board B None None (3.5 kW/m2 ,870 s) None None
3B Gypsum Board c None None (3.2 kW/m2,6oo s) None None
15 Fire retarded A 861 **B,861 F 847 ~/65 .}8t' ISS plywood
4 Fire retarded A None ***B,NoneF (13 .8 kW/m2 ,900 s) 1$185 240 plywood
6 Fire retarded B None 483 B,568F (18.5 kW/m2 ,S10 s) t.a-tr 1-35 llM~o plywood
5 Fire retarded c None 528 B,***F (16 .1 kW/m2 , 580 s) 390 455 plywood
19 Plywood 2 A 83 98 B, 110 F 88 ;nss ..&i" 8 s 7 Plywood 2 c 193 206 B,209 F 195 _1..6--T IC:.S -<-89-·19o
8 Plywood '1 B 134 143 B, 165 F 140 »8'' loo 120
10 Polystyrene A 48 39 B, 40 F tt !r8' 5o g5o
11 Polystyrene B 83 80 B, 82 l' 71 }4'7-S .:7-fr 7 5
!2 Polystyrene c 110 107 B,109 F 101 J2() loS +eft 1/o
9 Polyisocyanurate A 14 15 B, !6 F 19Q -· . -~-~OSG. 2.S.:}:f1a,_
e~~--b -- b 24 Polyisocyanurate A 14 15 B, 17 F
13 Polyisocyanurate B 50 51 B, 52 F 42 r1- ,' · Wf-5 4&5o
14 Polyisocyanurate c 3!2 314 B,315 F 3!5 ' ~3/() 3-8-3/S
* Back and front newspaper flashover indicators denoted by B and F respectively. ** Back indicator ignited prematurely by fa~~ipg em~e~s. *** Newspaper discolored due to heating1 )...)-.rt.:J ~.::.y.:.;t;- ·
in Seconds
Average ~~~rway Air Temp. , T0 600°C 650°C to to
None None
None None
None None
~zso 855
300 None
%9 t-7o None
5-2-!t .s 3 0 None
,.ll-3' g .s .98' /(J()
200 ?-l:1" 2./o
;,a-/1 :1:; Jjy( 11-o
50 52:' 5o
J>3' 8' .s 85
,]...-l't"llo JA-fl!s
Jo 23' cc 30~
-- .b / --""
50 ;.yrSo
315 315
t Maximum flux and its time of occurrence given in parentheses. tt Resolution inadequate. ttt Average interior temperature TI based on eight 0.51 mm thermocouples located 0.10 m down from ceiling-,. ·-1 ('.S
To bas<;!d on the avera&e of two 0.51, mm th<;rmocouple)3 located 0.10 m dj:>wn fJiom top ,of doorway. CIJI -fe,.,fu~ '-•r t:t - f.s.f-t,.,af-<>.1 VC>J~ P.S b«<.t:ed d'» !tl)ea.r· m-1-erpt>/,., frM,, he twPI";J t-<p.Jd/.1 lhCr-f't'/S m.1 1/"-/1-11!:'$,
-h. k e.-. I o
n <'ares f S 'C.
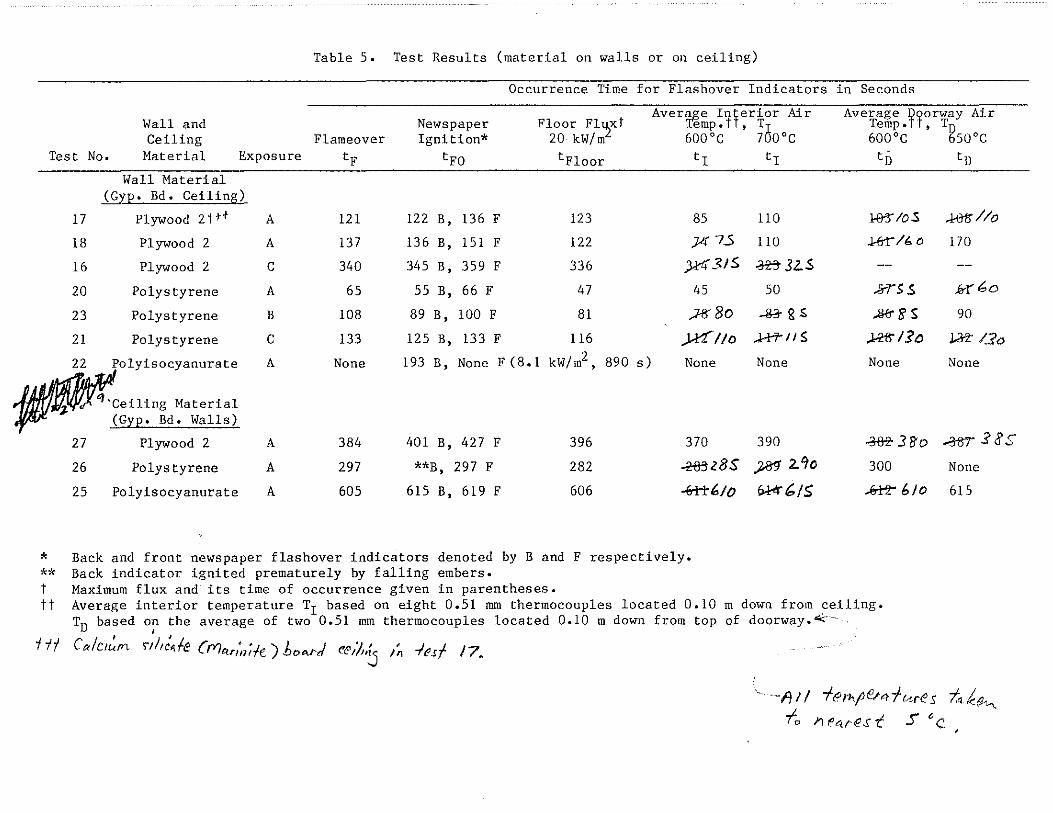
Table 5. Test Results (material on walls or on ceiling)
Occurrence Time for Flashover Indicators in Seconds
Floor Fl'2xt Aver~e Inferior Air Average v~orway Air
Wall and Newspaper emp. t , TO Temp. , Tg Ceiling Flameover Ignition* 20 kW/m 600°C 7 0°C 600°C 50°C
Test No. Material Exposure tp tFo tFloor tr ti tiJ to
* ** t tt
Wall Material (GYE• Bd. Ceiling)
17 Plywood 2 tt+ A 121 122 B, 136 F 123 85
18 Plywood 2 A 137 136 B, 151 F 122 }If 75
16 Plywood 2 c 340 345 B, 359 F 336 )k431S
20 Polystyrene A 65 55 B, 66 F 47 45
23 Polystyrene ll 108 89 B, 100 F 81 ;lf':8o
21 Polystyrene c 133 125 B, 133 F 116 %1/o
22 Polyisocyanurate A None 193 B, None F ( 8. 1 kW/m2 , 890 s) None
q.Ceiling Material (GYE• Bd. Walls)
27 Plywood 2 A 384 401 B, 427 F 396 370
26 Polystyrene A 297 **B, 297 F 282 ~z8S
25 Polyisocyanurate A 605 615 B, 619 F 606 ~Mo
Back and front newspaper flashover indicators denoted by B and F respectively. Back indicator ignited prematurely by falling embers. Maximum flux and its time of occurrence given in parentheses.
110 ~loS .wtr I/o
110 .urr lb 0 170
~32..5
50 MSS .&rbo
-&a- g s ..ll<r 8 s 90
..Hr/1$ .Mfi' l.?a ~ 12o
None None None
390 -3-fJT 3 8' 0 .-3'81 3 g:;
)M 2.'10 300 None
f*fr6/$ kt't" {, /0 615
Average interior temperature TI based on eight 0.51 mm thermocouples located 0.10 m down from ceiling. T0 based o~ the average of two 0.51 mm thermocouples located 0.10 m down from top of doorway • .:::··
C alc'~'n. ,,;,J4te (Mttn;,;;c) l:,,evd <'<?th~ ~~ -lesf 17.
·-f/1 I -ferv>eM-fr.,re 5 t. .{g"'fo ne,vO'st .S "c
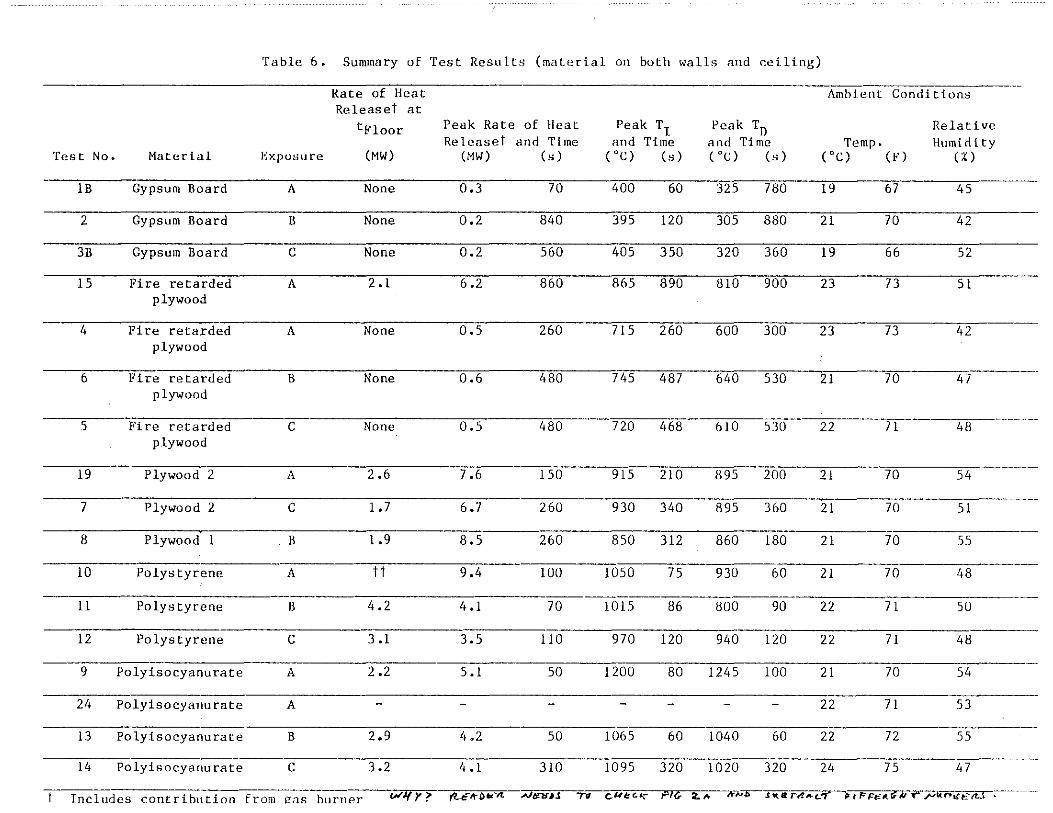
Table 6. Summary of Test Results (material on both walls and ceiling)
Rate of Heat Ambient Conditions Releaset at
tFloor Peak Rate of Heat Peak TI Peak TD Relative Releaset and Time and Ti.me and Time Temp. Humidity
Test No. Material l·:xposure (MW) (MW) (s) ("C) (s) <"c) (s) (oC) (F) (%)
1B Gypsum Board A None 0.3 70 400 60 325 780 19 67 45
2 Gypsum Board B None 0.2 840 395 120 305 880 21 70 42
3B Gypsum Board c None 0.2 560 405 350 320 360 19 66 52
15 Fire retarded A 2 .1 6.2 860 865 890 810 900 23 73 51 plywood
4 Fire retarded A None 0. 5 260 715 260 600 300 23 73 42 plywood
6 Fire retarded B None 0.6 480 745 487 640 530 21 70 47 plywood
5 Fire retarded c None 0.5 480 720 468 610 530 22 71 48 plywood
19 Plywood 2 A 2.6 7.6 150 915 210 895 200 21 70 54
7 Plywood 2 c 1.7 6.7 260 930 340 895 360 21 70 51
8 Plywood 1 B 1.9 8.5 260 850 312 860 180 21 70 55
10 Polystyrene A tt 9.4 100 1050 75 930 60 21 70 48
11 Polystyrene B 4.2 4 .1 70 l 015 86 800 90 22 71 50
12 Polystyrene c 3 .1 3.5 110 970 120 940 120 22 71 48
9 Polyisocyanurate A 2.2 5.1 50 1200 80 1245 100 21 70 54
24 Polyisocyanurate A 22 71 53
l3 Polyisocyanurate B 2.9 4.2 50 1065 60 1040 60 22 72 55
14 Polyisocyanurate c 3.2 4 .1 310 1095 320 1020 320 24 75 47
t Includes contribution from ~as hurner wlfr? (LCitbttt.-tt ;;.)enr.u. .,... e-Ht:Ll.\ PitT 2..~--s .S't« ;-rt~), Ff:t;;_tti:ll r -"'k""ttfto:(t....t
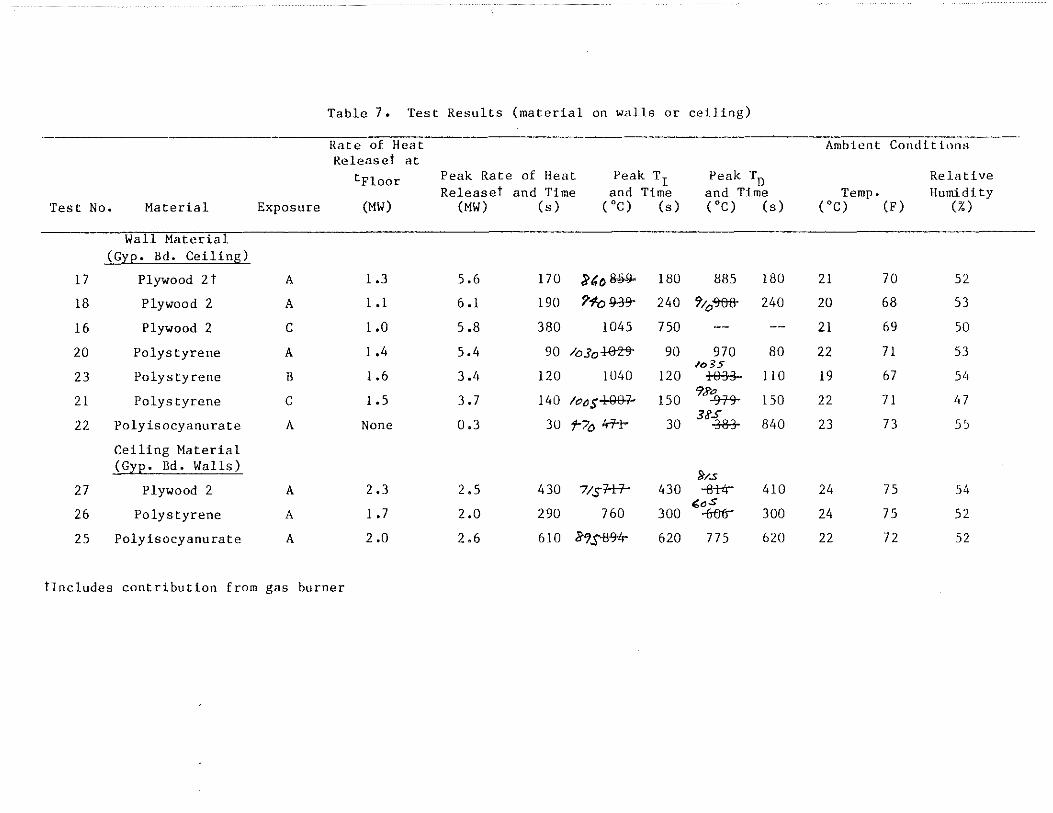
Table 7. Test Results (material on walls or ceiling)
Rate of Heat Ambient Conditions Releaset at
tFloor Peak Rate of Heat Peak T1 Peak TD Relative Releaset and Time and Time and Time Temp. Humidity
Test No. Material Exposure (MW) (MW) (s) ( oc) (s) ( oc) (s) (oC) (F) (%)
Wall Material (GYJ:>· Bd. Ceiling)
17 Plywood 2t A 1.3 5.6 170 ~'r; 8-5JJ. 180 885 180 21 70 52
18 Plywood 2 A 1.1 6 .1 190 'No !1-39- 240 9;0'%6- 240 20 68 53
16 Plywood 2 c 1.0 5 .8 380 1045 750 21 69 50
20 Polystyrene A 1.4 5.4 90 loJ0~ 90 970 80 22 71 53 /o35
23 Polystyrene B 1.6 3.4 120 !040 120 ~ 110 19 67 54
21 Polystyrene c 1.5 3.7 140 lo~s~ 150 9J'm 150 22 71 47
22 Polyisocyanurate A None 0.3 30 f-?o 4-i'i:- 30 3K.S
-3B 840 23 73 55
Ceiling Material (Gyp. Bd. Walls)
Sl/.s 27 Plywood 2 A 2.3 2.5 430 71sl+f- 430 -8-tir 410 24 75 51,
26 Polystyrene A 1.7 2.0 290 760 ~a.S
300 -rroo- 300 24 75 52
25 Polyisocyanurate A 2 .0 2.6 610 d"? S-8-9-ir 620 775 620 22 72 52
tlncludes contribution from gas burner
\
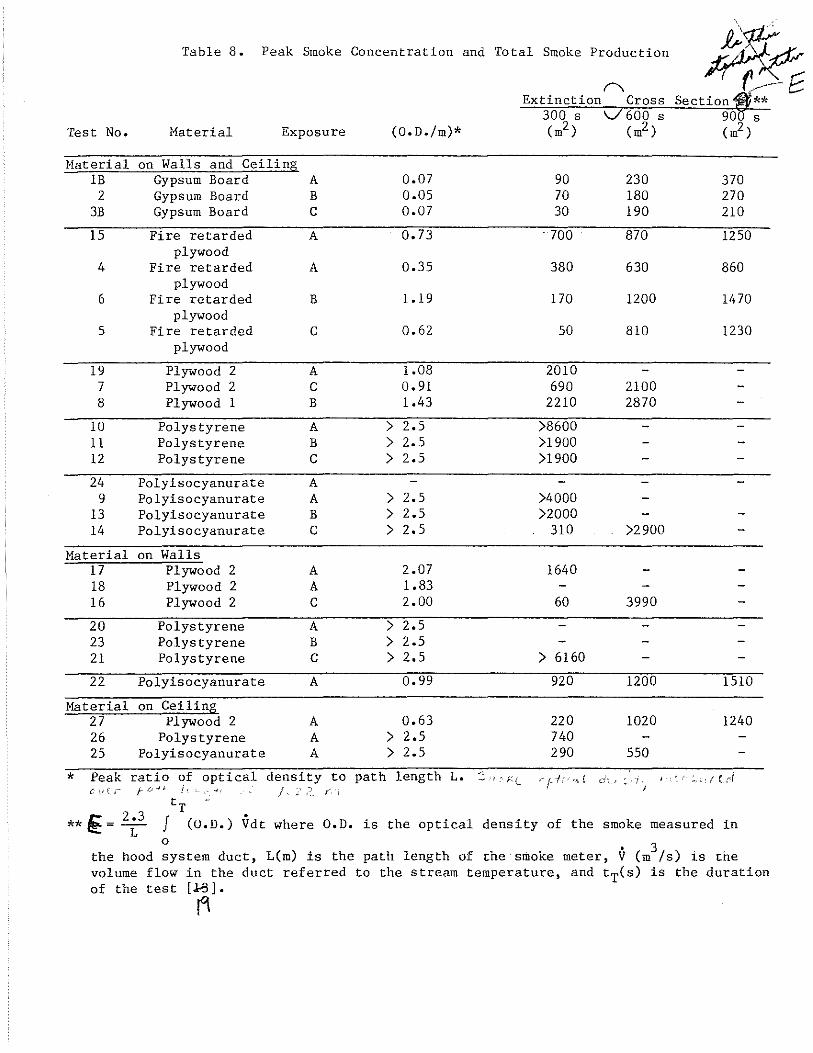
Table 8. Peak Smoke Concentration and Total Smoke Production ~ Test No.
Material 1B
2 3B
15
4
6
5
19 7 8
10 11 12
24 9
13 14
Material 17 18 16
20 23 21
22
Material 27 26 25
Material Exposure
on Walls and Ceiling Gypsum Board Gypsum Board Gypsum Board
Fire retarded plywood
Fire retarded plywood
Fire retarded plywood
Fire retarded plywood
Plywood 2 Plywood 2 Plywood 1
Polystyrene Polystyrene Polystyrene
Polyisocyanurate Polyisocyanurate Polyisocyanurate Polyisocyanurate
on Walls Plywood 2 Plywood 2 Plywood 2
Polystyrene Polystyrene Polystyrene
Polyisocyanurate
on Ceiling Plywood 2
Polystyrene Polyisocyanurate
A B c A
A
B
c
A c B
A B c A A B c
A A c A B c A
A A A
(O.D./m)*
0.07 o.os 0.07
0.73
0.35
1.19
0.62
1.08 0.91 1.43
> 2.5 > 2.5 > 2.5
> 2. 5 > 2.5 > 2.5
2.07 1.83 2.00
> 2.5 > 2.5 > 2.5
0.99
0.63 > 2.5 > 2.5
* Peak ratio of optical density to path length L. eve,~ f~""' f,
t
Extinction
90 70 30
700
380
170
50
2010 690
2210
)8600 )1900 )1900
)4000 )2000
310
1640
60
> 6160
920
220 740 290
Cross
230 180 190
870
630
1200
810
2100 2870
)2900
3990
1200
1020
550
f t:. Section **
370 270 210
1250
860
1470
1230
1510
1240
r f- --! r' '"" { <-7 _, ' -r I': f ~, · I C ,/ I
2.3 T ** {i = L J (O.D.) Vdt where O.D. is the optical density of the smoke measured in 0
the hood system duct, L(m) is the path length of the smoke meter, V (m3/s) is the
volume flow in the duct referred to the stream temperature, and tT(s) is the duration of the test [.1-3].
(1
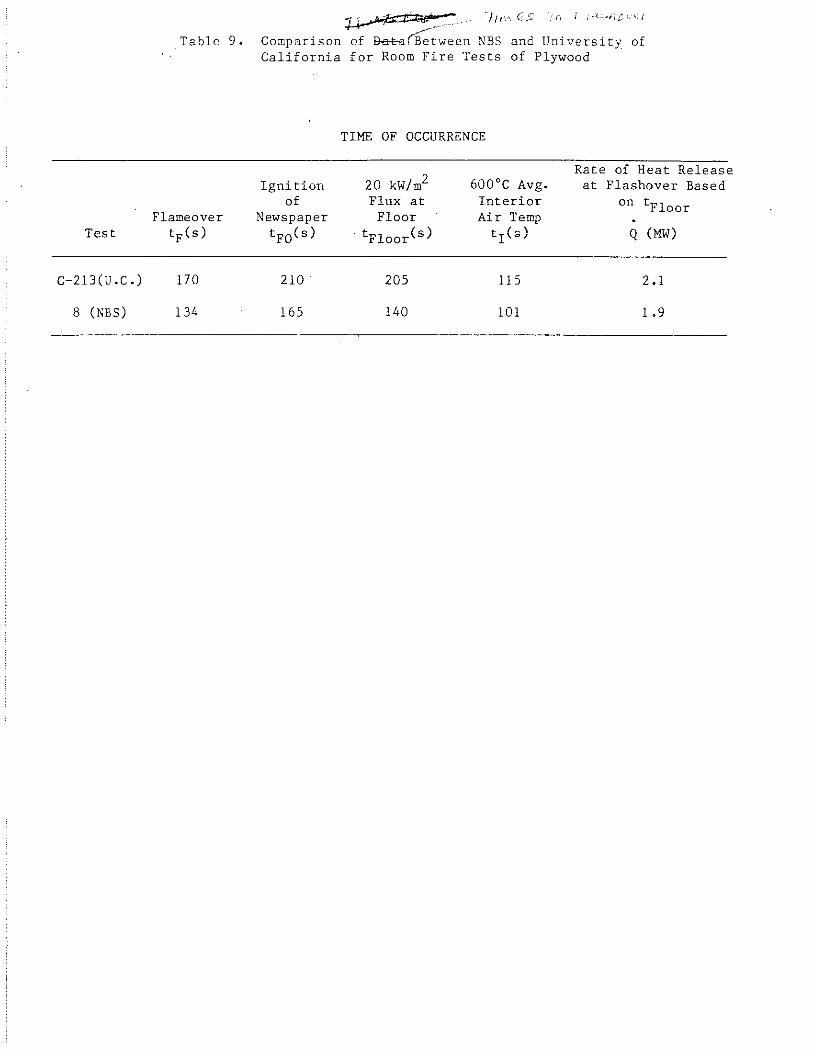
Table 9.
Flameover Test tF(s)
C-213(U.C.) 170
8 (NBS) 134
~ Comparison of B-a+afBetween NBS and University of California for Room Fire Tests of Plywood
TIME OF OCCURRENCE
20 kW/m2 Rate of Heat Release
Ignition 600°C Avg. at Flashover Based of Flux at Interior on tFloor
Newspaper Floor Air Temp tF0 (s) tFloor(s) t 1 (s) Q (MW)
210 205 115 2.1
165 140 101 1.9
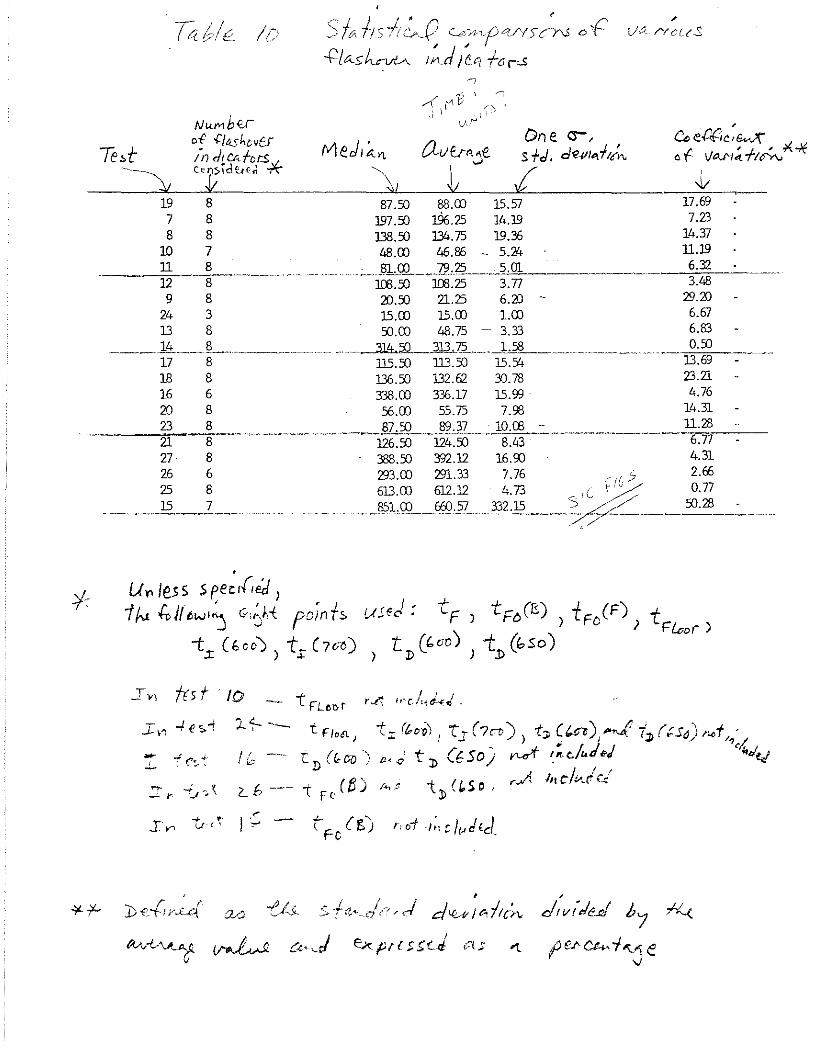
/
f!A /;c;/: (~"'j) G??tc~p vY 5 ;N o {:'
-t:ko;h_,-vc/c 1~JI~ct fcr-.S
L)ct rrc(t-.S
One cr-, s +d . .de-VI,..t;/.,.
19 8 87.50 88.CD 15.57 7 8 197.50 196.25 14.19 8 8 138.50 134.75 19.36
1D 7 48.CD 46.86 5.24 ll 8 ·--... .. ... . . _J)l. CQ_ __ 7.9~25 5. 01 ~ 8 ll£.50 ll£.25 3.n 9 8 20.50 21.25 6.20 -
24 3 15.CD 15.CD LCD 13 8 50.CD 48.75 ~ 3.33
____ 14.~_8 ______ ...... ·- .... ~~l:L'l'L ... _l.SS --··-··- ----"·. 17 8 115.50 ll3.50 15.54 18 8 136.50 132.62 30.78 ~ 6 m.ro m.u 15.~
20 8 56.CD 55.75 7.98
---~23:i'--7>8-············-··. ···-~-·87.50 __ §2.JL_ 1o.re - ··-----·-----21 8 ~6.50 ~4.50 8.43 27 8 388.50 392.~ ~.90 26 6 293.CD 291.33 7.76 •. · 5
-'~o:;_,_c_~. • ~:~ _::~ ,}3~:~----~
I,, tnt ·to f ! I
r~ '''C.lt-td~~ ,
1.1-- -·- t f' /oOL !
I 0 -·· 'CD (&ov)
2.. b --- i F c( {3)
.;.. { ' 'Fe t)
~ '
' '
6, eX, e; 19-W\ e f. 1/N't:.._ ftM .;<-It
~ 17.f£J 7.23
14.37 ll.l9 6.32 3.48
29.20 6.67 6.83 0.50
13.69 23.21 4.76
14.31 ll.28 6.n 4.31 2.66 o.n
50.28
Cl./.) -&'...c. s.f.,c,,/t-,"J d~;t:..ttc~ ... dtv!Je.d b; fl..<.
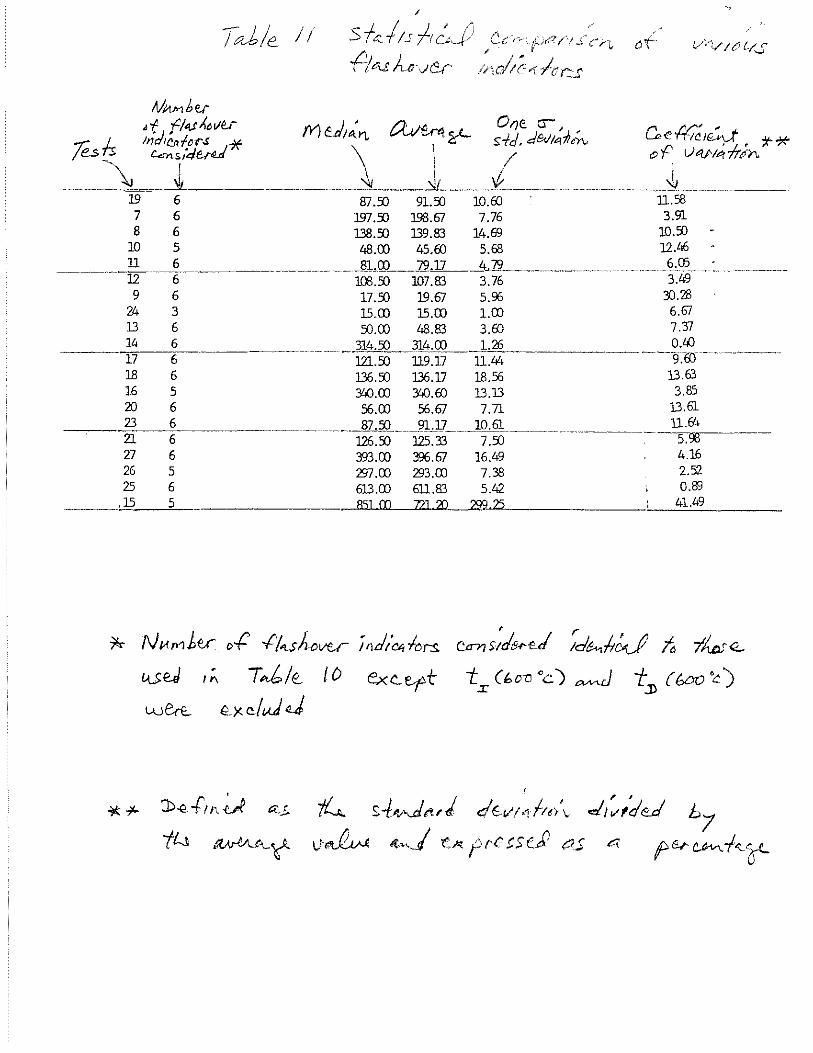
T al:,/e_ I I
IV!N<16er d ,c;41l.~ver 1 ' /1. "' . 011e a-, ,.,., 1 'd' 1 fY) ea/~11- <Y\...Vt.n!~ sfd. dN;,:rlt/,-._ Cae-h;~,bJ ..._*
Tesh. ~'!;:;,7::;~* 1 oF Lhy,;,);f,M"
~~-~--~-~ I \ l_ ____ (~------~----~~~- --- -~-~~~----------19 6 87.:0 91.:0 10.EO ll.58 7 6 197.:0 1.98.67 7.76 3.91 8 6 138.:0 139.83 14.69 10.:0
10 5 48.00 45.EO 5.68 12.46
----·- ~ -{----·-----------~:~ ~:~ ~-~ ---------{%--- ----9 6 17.:0 19.67 5.% 3).28
24 3 15.00 15.00 1.00 6.67 13 6 50.00 48.83 3.EO 7.'SI
---·~i~.;.--;:~ ----~-------- - ::~ -::~ J:! ---~:~- .. -·---~~ 18 6 136.50 136.17 18.56 13.63 16 5 340.00 340.EO 13.13 3.85 20 6 56.00 56.67 7. 71 13.61 23 6 87.50 91.17 10.61 ll.64
--- 2l 6 --· 126.~ --:i25~33----7.s:l ______ -·-----~~-27 6 393.00 396.67 16.49 4.1£ 26 5 m.oo 293.00 7.38 2.52 25 6 613.00 6ll.83 5.42 0.89 15 5 as1 m n1 20 299 41.49
7<- NVtf'1ttr o.f -f/'tShovu-f
Jtldt'cs,lcrs C<rnstci&..,..J ~6<-.!t;J ~ 7'k:<L
U.SeJ 1;._ T~/e I D exc.er-t t.r (b. en cc) ~ -t:D (boo 'c)
wtr€... exc.JvJ J
~ s-I:~ .. JI'tnf dE-vt.dtt}''- d,~/ded b7
1,.~~ """".J 'C"'"frctse~ t:!S '"" fe.r-~-/-c_(f-
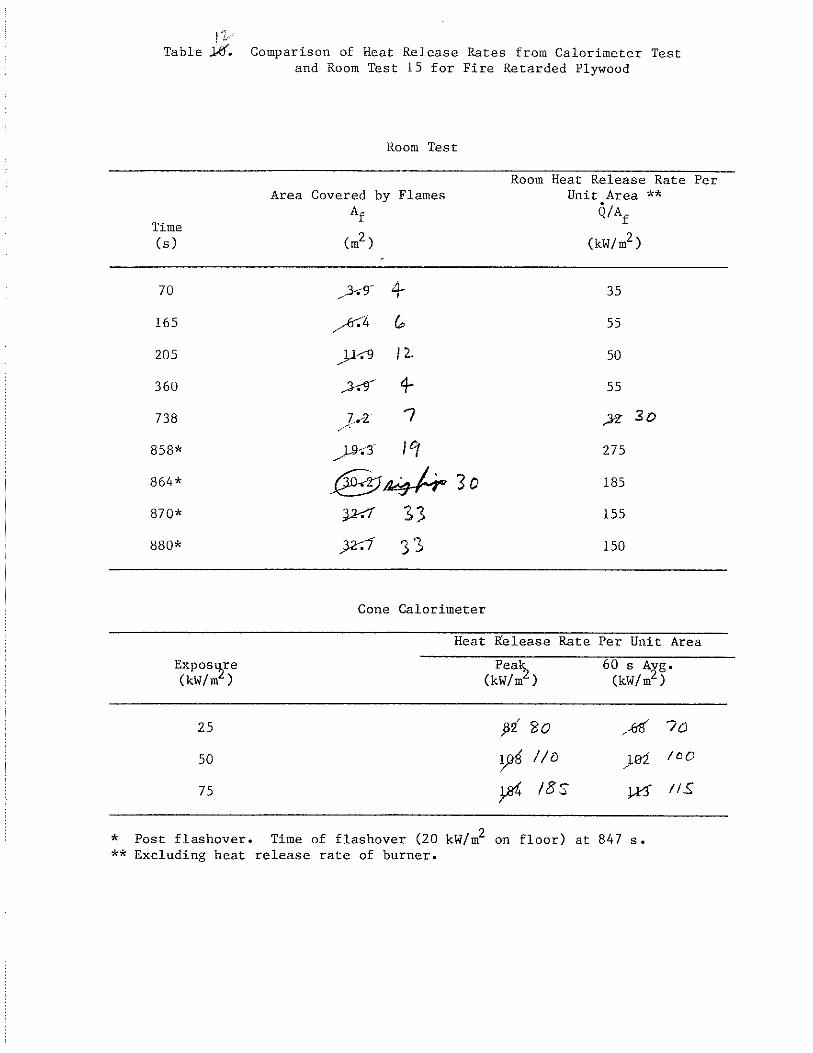
! Table J<f. Comparison of Heat Release Rates from Calorimeter Test
and Room Test 15 for Fire Retarded Plywood
Room Test
Room Heat Release Rate Area Covered by Flames Unit Area **
Af Q/Af Time (s) (m2) (kW/m2 )
70 _..-3-.-9- .a.. 35 I
165 /-4 ~ 55
205 )Y.9 I '2. 50
360 ..3-5 + 55
738 7.-r"2 7 ..n 3o /
858* JJ.J-;3 _..- /C, 275
864* ~~ 3o 185
870* V-:1 1-:S 155
880* )2':1 33 150
Cone Calorimeter
Per
Heat ~elease Rate Per Unit Area
Expos '!Ire (kW/m )
Pea~ (kW/m )
60 s A2g. (kW/m )
25 ;>i ?So /61(
50 ~ //D }oi
75 ~ !8S ¢
* Post flashover. Time of flashover (20 kW/m2 on floor) at 847 s. ** Excluding heat release rate of burner.
70
!DO
II!;
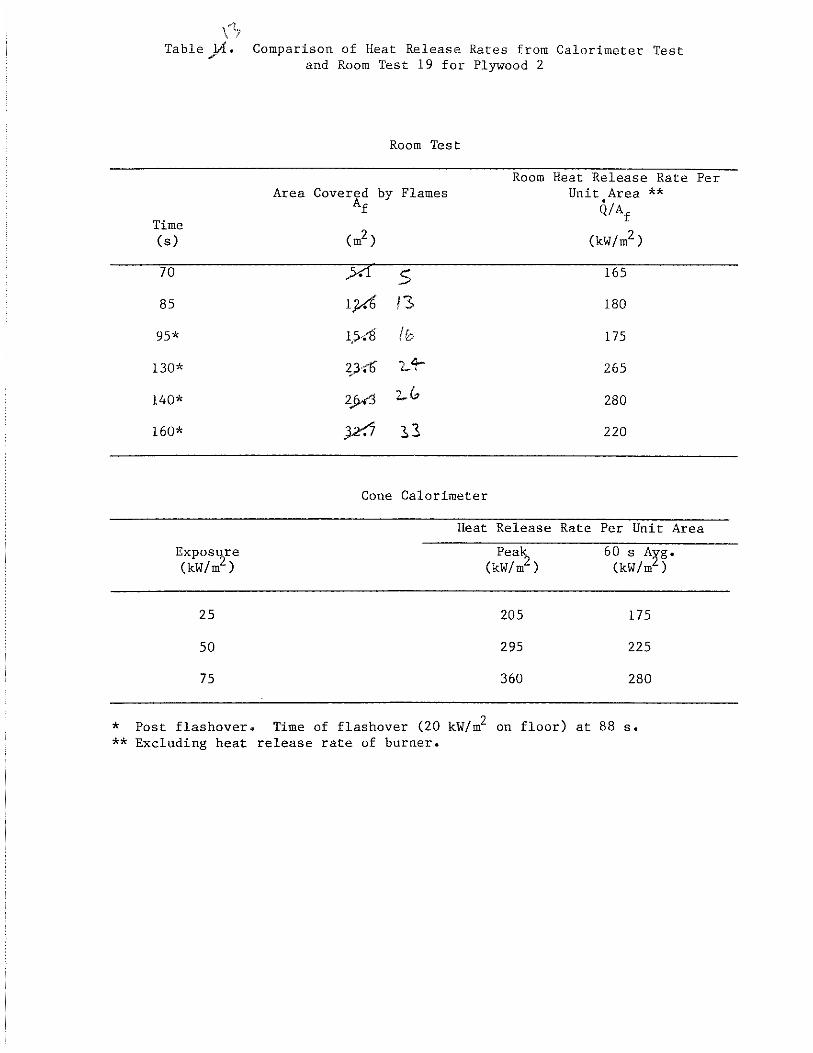
(~ Table lA. ,
Time (s)
70
85
95*
130*
140*
160*
Comparison of Heat Release Rates from Calorimeter Test and Room Test 19 for Plywood 2
Room Test
Room Heat Release Rate Area Covered by Flames Unit Area **
Af Q/Af
(m2) (kW/m2 )
5 165
1y.b 13 180
1,5-:8 ,,
175 n.:>
:s:>~ ~4-'-' 265
2j>A ?..J, 280
_0 13 220
Cone Calorimeter
Per
Heat Release Rate Per Unit Area
Exposure (kW/m2 )
25
50
75
Pea~ (kW/m )
205
295
360
175
225
280
* Post flashover. Time of flashover (20 kW/m2 on floor) at 88 s. ** Excluding heat release rate of burner.
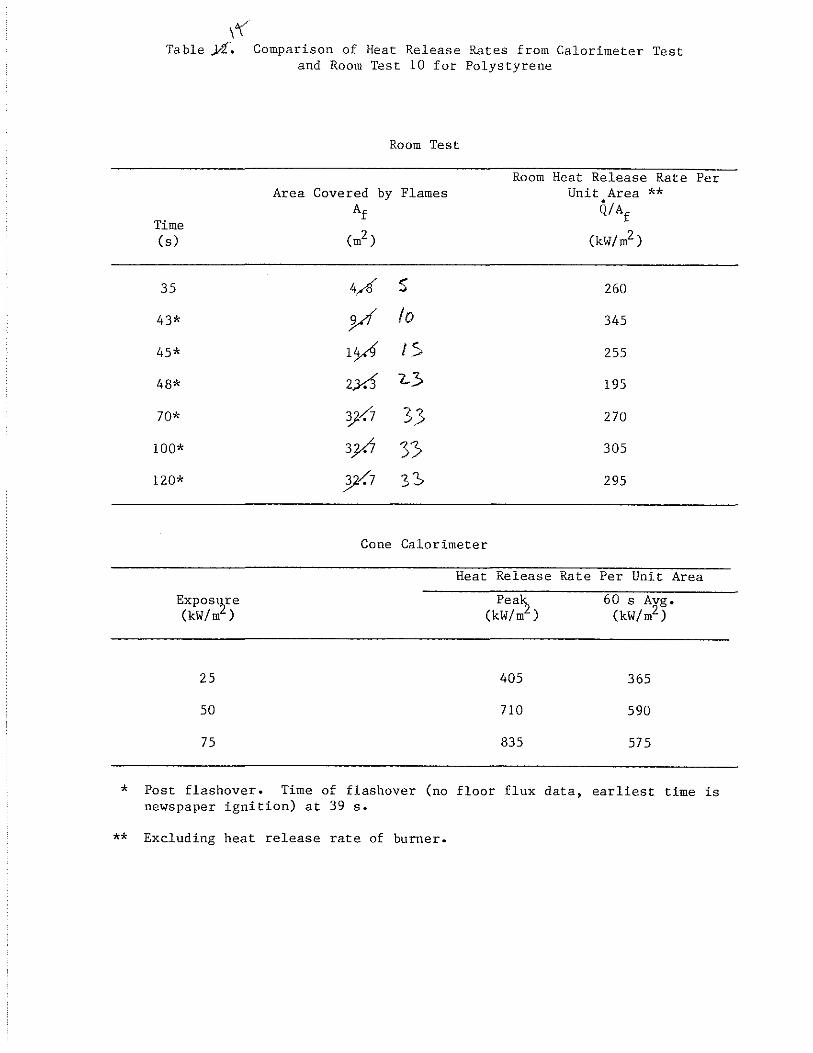
\~ Table ;),[. Comparison of Heat Release Rates from Calorimeter Test
and Room Test 10 for Polystyrene
Room Test
Room Heat Release Rate Area Covered by Flames Unit Area **
Af Q/Af Time (s) (m2) (kW/m2 )
35 4,A' < 260 J
43* yf lo 345
45* 10 t> 255
48* 2;36 "Z-3> 195
70* ~7 3.> 270
100* 3;/.1 33 305
120* y/.7 :s-:> 295
Cone Calorimeter
Per
Heat Release Rate Per Unit Area
Expos'2re (kW/m )
25
50
75
405
710
835
60 s Avg. (kW/m2)
365
590
575
* Post flashover. Time of flashover (no floor flux data, earliest time is newspaper ignition) at 39 s.
** Excluding heat release rate of burner.
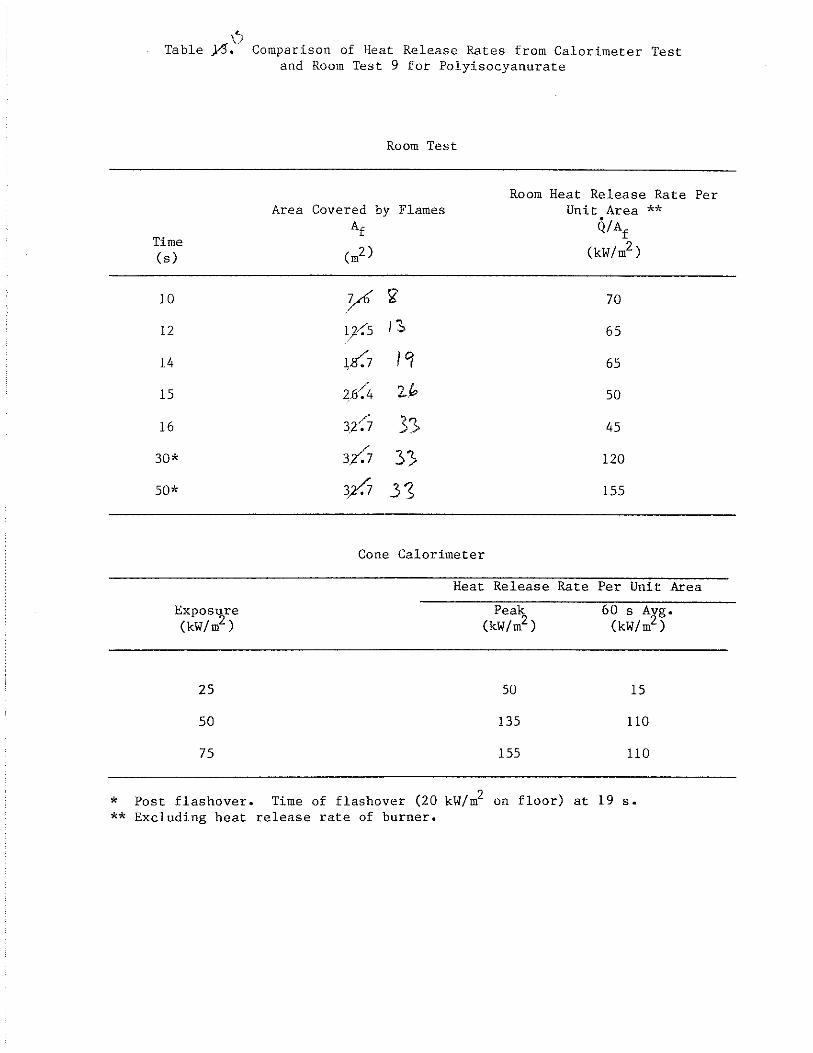
\'-, Table }1.' Comparison of Heat Release Rates from Calorimeter Test
and Room Test 9 for Polyisocyanurate
Room Test
Room Heat Release Rate Area Covered by Flames Unit Area **
A£ Q/Af Time
(kW/m2 ) (s) (m2)
10 y6 \? 70
12 12'~5 13. 65 /
14 ~s-:7 lq 65
15 4S:4 2..& 50
/ 3> 16 3.2'· 7 45
30* 3:/.7 3> 120
50* 3-/.7 / 3'S 1SS
Cone Calorimeter
Per
Heat Release Rate Per Unit Area
Exposure (kW/m2 )
2S
so
7S
so
13S
1SS
60 s Avg. (kW/m2 )
1S
110
110
* Post flashover. Time of flashover (20 kW/m2 on floor) at 19 s. ** Excluding heat release rate of burner.
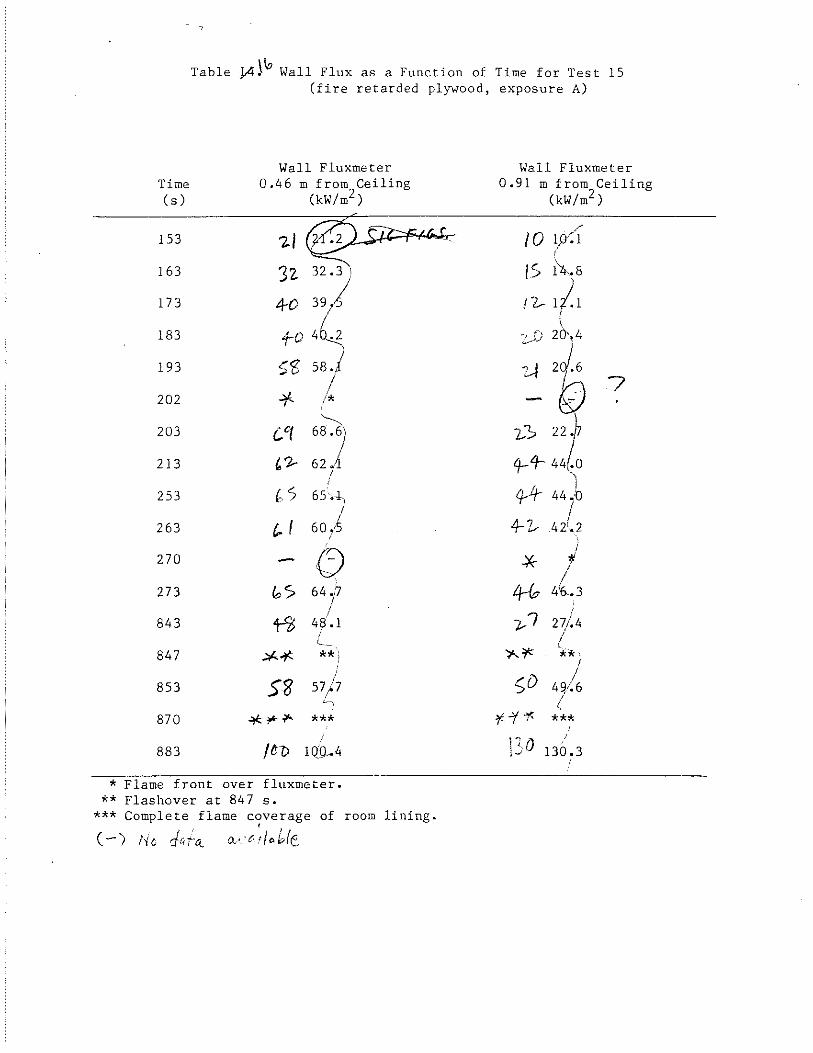
Table }4}~ Wall Flux as a Function of Time for Test 15 (fire retarded plywood, exposure A)
Time (s)
153
163
173
183
193
202
203
213
253
263
270
273
843
847
853
870
883
Wall Fluxmeter 0.46 m from Ceiling
(kW/m2 )
C/1 6~ I
'')... 62.1 I
t,S 65.~
(... I 6ol (-) - -
0S 64f
¥b ' 4S .1 I L._
_:,1..-'fC **l
S?f 57)7 'I
*'~*"" *** 1 ~7) 1 QJl-. 4
* Flame front over fluxmeter. ** Flashover at 847 s.
*** Complete flame coverage of room lining . •
(-/ r{D dei-o.. lh·Jri~Ue
Wall Fluxmeter 0.91 m from Ceiling
(kW/m2 )
/ f 0 1,0~1
•
j
~ 1/ I
# 4(.3
t.-7 27/.4 I
'~--* . **''
~D / 4?1.6 !
¥7"'~" *** no ' ,_, 130.3
•
7
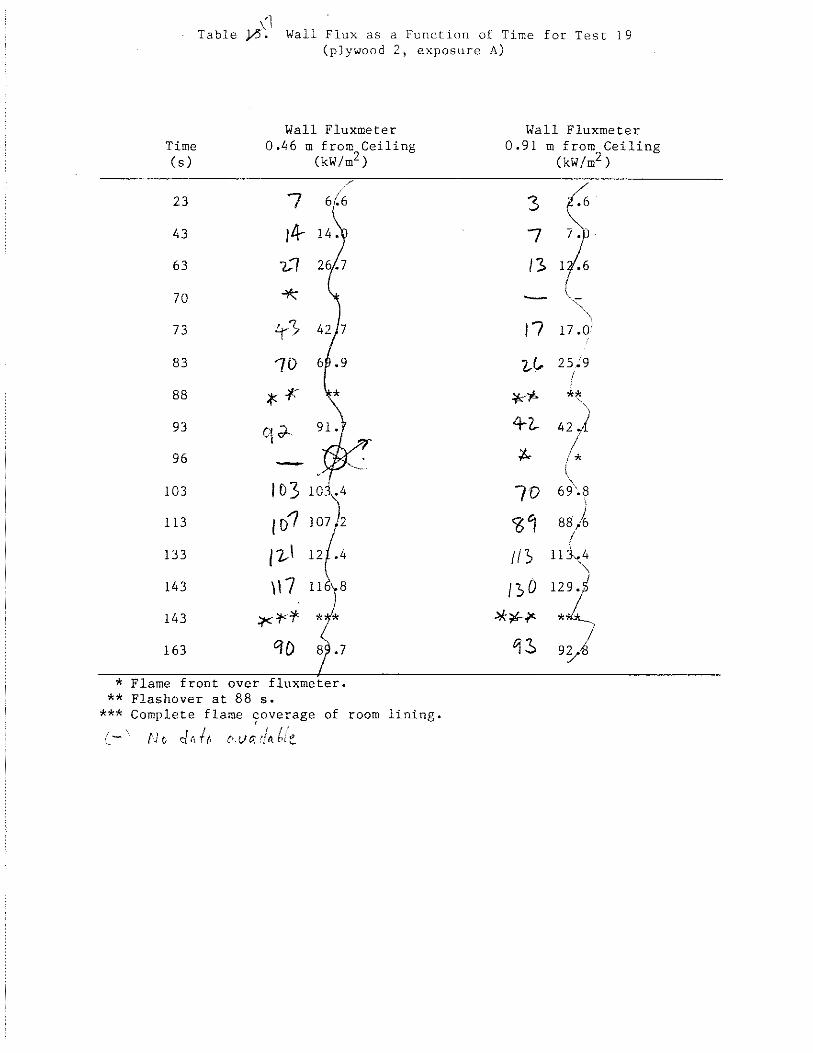
'1 Table }5\ Wall Flux as a Function of Time for Test 19
(plywood 2, exposure A)
Time (s)
23
43
63
70
73
83
88
93
96
103
113
133
143
143
163
Wall Fluxmeter 0.46 m from Ceiling
(kW/m2)
7 6.6
)4-7.;1
*
-I o 3
(D1
p.J
'17 :,<: 'f' f
qo * Flame front over fluxmeter.
** Flashover at 88 s. *** Complete flame coverage of room lining.
' I I I u /- t-Jc cu\ r, e>.lJ(:t
\'b Table J.$. Wall Flux as a Function of Time for Test 17
Time (s)
53
93
103
113
120
123
133
153
171
173
183
(plywood 2, exposure A)
Wall Fluxmeter 0.46 m from Ceiling
(kW/m2 )
24f4 5 .3
73 7
9 .s
-ro7~<* 107 · 104-
!10 :t-17t
Wall Fluxmeter 0.91 m from Ceiling
(kW/m2 )
3> ~-1 '
*
*Flame front over fluxmeter; not observable for 0.46 m location. ** Flashover at 123 s.
***Complete flame coverage of room-lining.
(- ) No ci d-~ ""'J~r/Ai-/e

{\ Table vr: Wall Flux as a Function of Time for Test 18
(plywood 2, exposure A)
Wall Fluxmeter Wall Fluxmeter Time 0.46 m from Ceiling 0.91 rn from Ceiling (s) (kW/rn2) (kW/m2 )
60 19 19 )1 .3
93 4~ t4- 1 ;9
99 * 103 Sl 51 .3 II 113 70 7 .1 2..~
122 -1"'-* * {'-"!'- *
123 84- 83 8 3S 35 .4
1 31 * 133 to/ 100 6 (-;1
143 IDD 10 .1 72-
163 I;...\ 12 '.4 qr,
183 11-7 12 .5 130 .3
188 ¥-::f<.:f.. * * 'i,-:i-'1<
193 q~ 9 .3 II?, .9
* Flame front over fluxmeter.
** Flashover at 122 s.
*** Complete flame coverage of room lining. '. (- ',
' I lh -.'.t y_;(J'·r~i
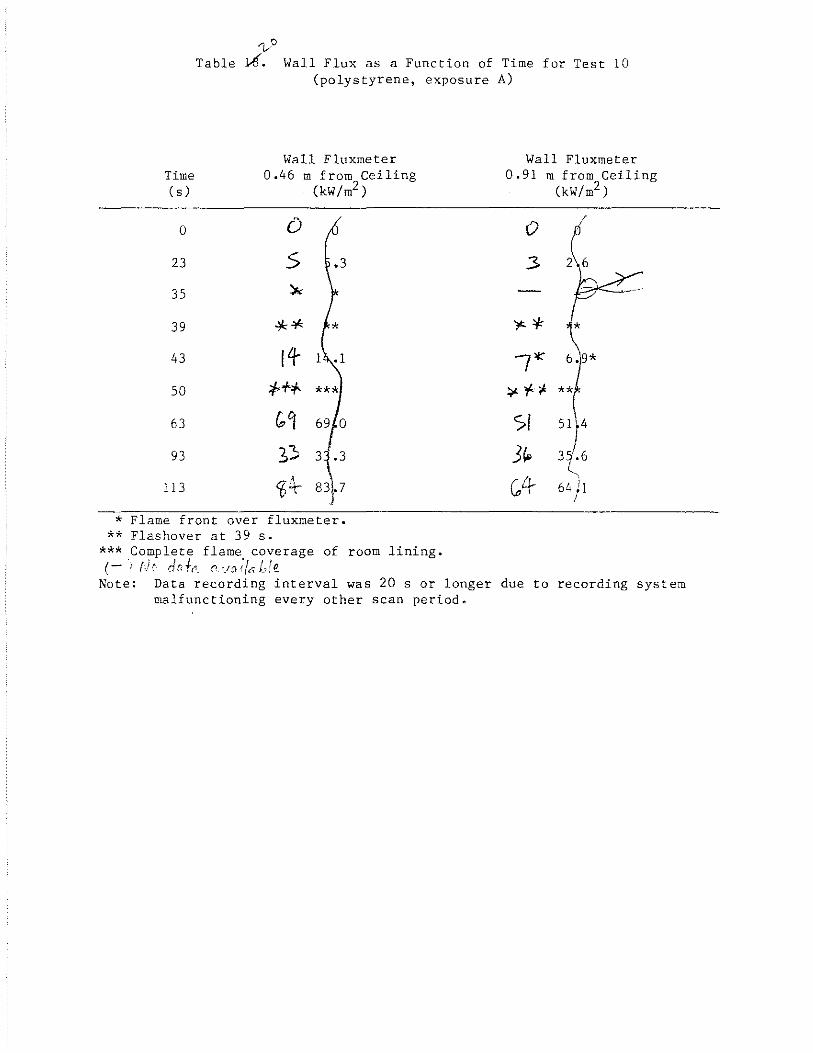
Table Wall Flux as a Function of Time for Test 10 (polystyrene, exposure A)
Wall Fluxmeter Time 0.46 m from Ceiling (s) (kW/rn2 )
0 0
23 5 35 :;...
39 ** 43 14- 1
50 ;f,f:r. ***
63 G. c1 69 0
93 :s;; 3~3
i 13 ~4- 83 7
* Flame front over fluxmeter. ** Flashover at 39 s.
*** Complete flame coverage of room lining. r- ,1 th chf,.i, (l 'j(} ;lc L)e-
Wall Fluxmeter 0.91 rn from Ceiling
(kW/m2 )
0
3
'~"*
I>K 6.9*
~ 'f~ **
Sl 51 4
3~ 3(6
cA- 6411 I
Note: Data recording interval was 20 s or longer due to recording system malfunctioning every other scan period.
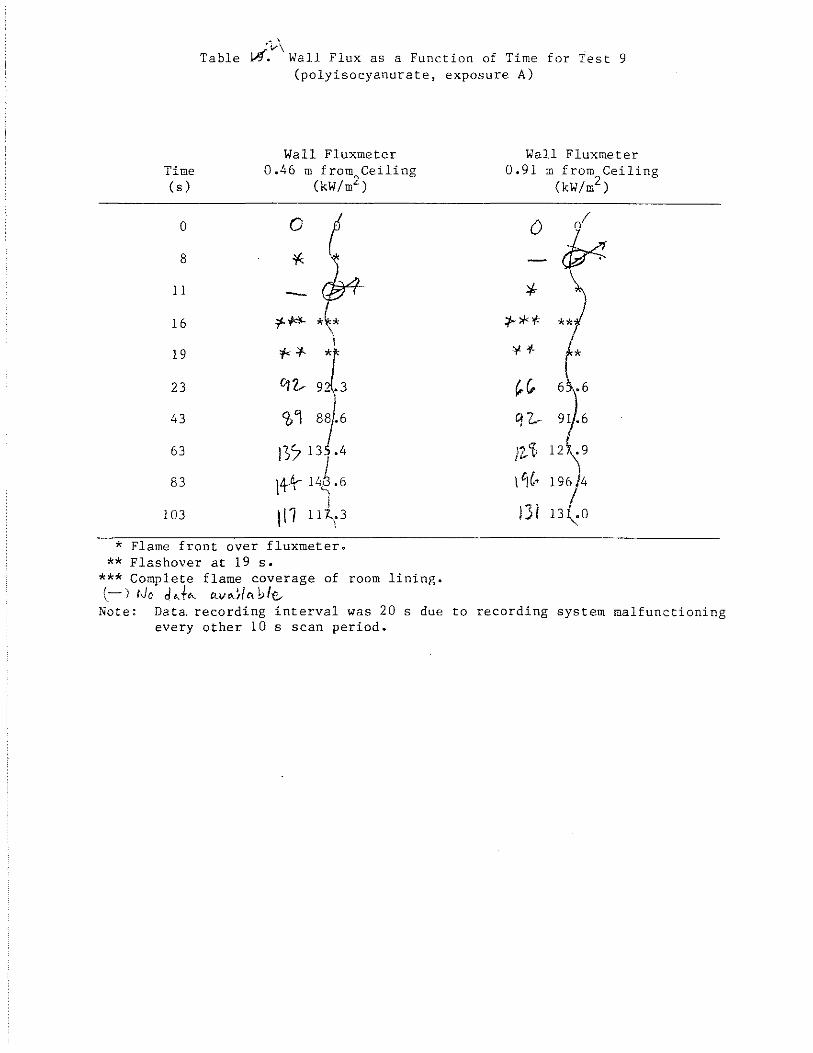
~-v\ Table )..1(. Wall Flux as a Function of Time for Test 9
(polyisocyanurate, exposure A)
Wall Fluxmeter Time 0.46 m from..,Ceiling (s) (kW/m£)
0 0
8 * 11 -16 'f#- *~*
\ 19 'I<+ *
23 crz.,
43 't,~
63 1)713 .4
. I 83 14-~ 14~ .6
111 i
103 117-\3
* Flame front over fluxmeter. **Flashover at 19 s.
*** Complete flame coverage of room lining. (-l tJo ddec o..v<c/lcd;/c,
Wall Fluxmeter 0.91 m from Ceiling
(kW/m2 )
0
* :;. *"' ¥'f.
~c. 6
q-z.,..
I~ 'f, 127..9
196)4 \ ~(,
!31 l3(o
Note: Data. recording interval was 20 s due to recording system malfunctioning every other 10 s scan period.
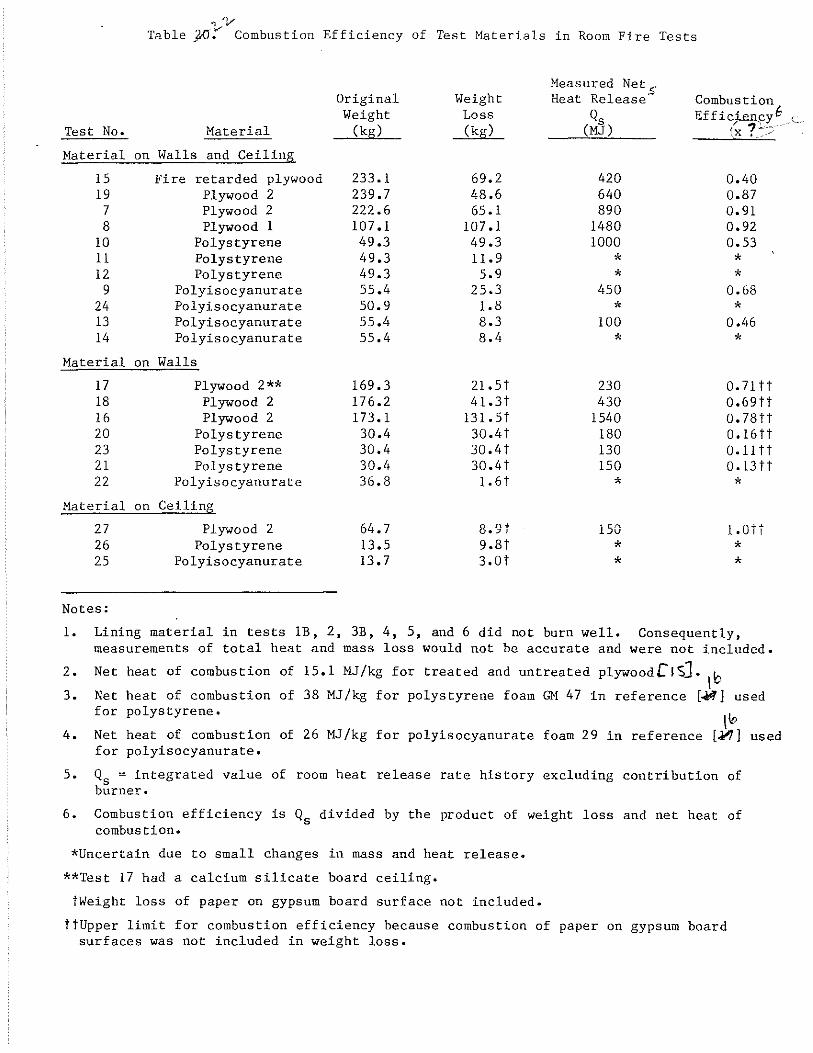
o'V Table }(5:' Combustion Efficiency of Test Materials in Room Fire Tests
Original Weight Measured Net
5 Heat Release Combustion
Weight Loss Qs Eff i cj-enf:y 6 '--Test No. Material (kg) (kg) (MJ) (X ?_--> Material on Walls and Ceiling
15 Fire retarded plywood 233.1 69.2 420 0.40 19 Plywood 2 239.7 48.6 640 0.87
7 Plywood 2 222.6 65.1 890 0.91 8 Plywood 1 107.1 107.1 1480 0.92
10 Polystyrene 49.3 49.3 1000 0.53 ll Polystyrene 49.3 11.9 * * 12 Polystyrene 49.3 5.9 * *
9 Polyisocyanurate 55.4 25.3 450 0.68 24 Polyisocyanurate so. 9 1. 8 * * 13 Polyisocyanurate 55.4 8.3 100 0.46 14 Polyisocyanurate 55.4 8.4 * *
Material on Walls
17 Plywood 2** 169.3 2l.5t 230 0.71 tt 18 Plywood 2 176.2 41.3t 430 0.69tt 16 Plywood 2 173.1 131. 5t 1540 0. 78 tt 20 Polystyrene 30.4 30.4t 180 o.16tt 23 Polystyrene 30.4 30.4t 130 Q.ll tt 21 Polystyrene 30.4 30.4t 150 o.utt 22 Polyisocyanurate 36.8 1. 6t * *
Material on Ceiling
27 Plywood 2 64.7 8.9t 150 l.Ott 26 Polystyrene 13.5 9.8t * * 25 Polyisocyanurate 13.7 3.0t * *
Notes:
1. Lining material in tests 1B, 2, 3B, 4, 5, and 6 did not burn well. Consequently, measurements of total heat and mass loss would not be accurate and were not included.
2. Net heat of combustion of 15.1 MJ/kg for treated and untreated plywood[JS]. tb Net heat of combustion of 38 MJ/kg for polystyrene foam GM 47 in reference [~] used 3. for polystyrene.
4. \\o
Net heat of combustion of 26 MJ/kg for polyisocyanurate foam 29 in reference [~] used for polyisocyanurate.
5. Qs = integrated value of room heat release rate history excluding contribution of burner.
6. Combustion efficiency is Qs divided by the product of weight loss and net heat of combustion.
*Uncertain due to small changes in mass and heat release.
**Test 17 had a calcium silicate board ceiling.
tWeight loss of paper on gypsum board surface not included.
ttUpper limit for combustion efficiency because combustion of paper on gypsum board surfaces was not included in weight loss.
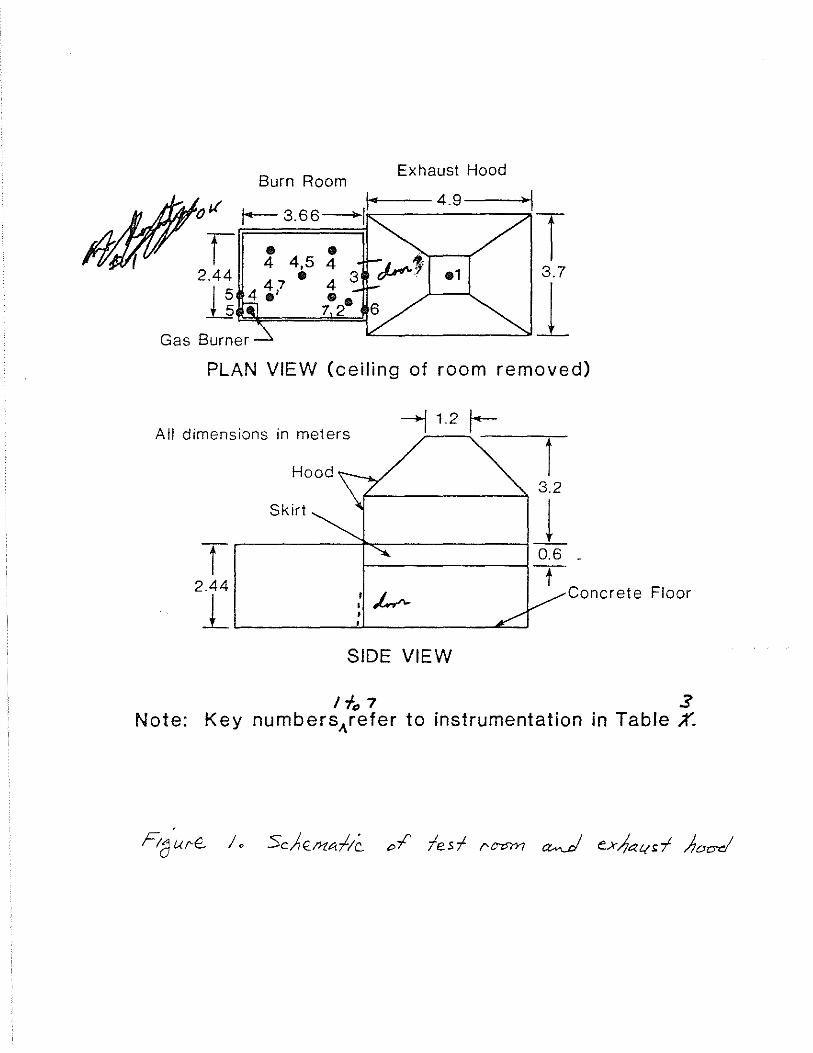
Burn Room Exhaust Hood
PLAN VIEW (ceiling of room removed)
All dimensions in meters __, 1.2 1-
------.---t Hood
f--------4 3.2 Skirt I
,----~----;-+ -t !---------! 0.6 --t 2.44 : ,1_,.. Concrete Floor 1 L-----l.J...._. _ _____.e:___j
SIDE VIEW
lf,7 3 Note: Key numbers,..refer to instrumentation in Table %.
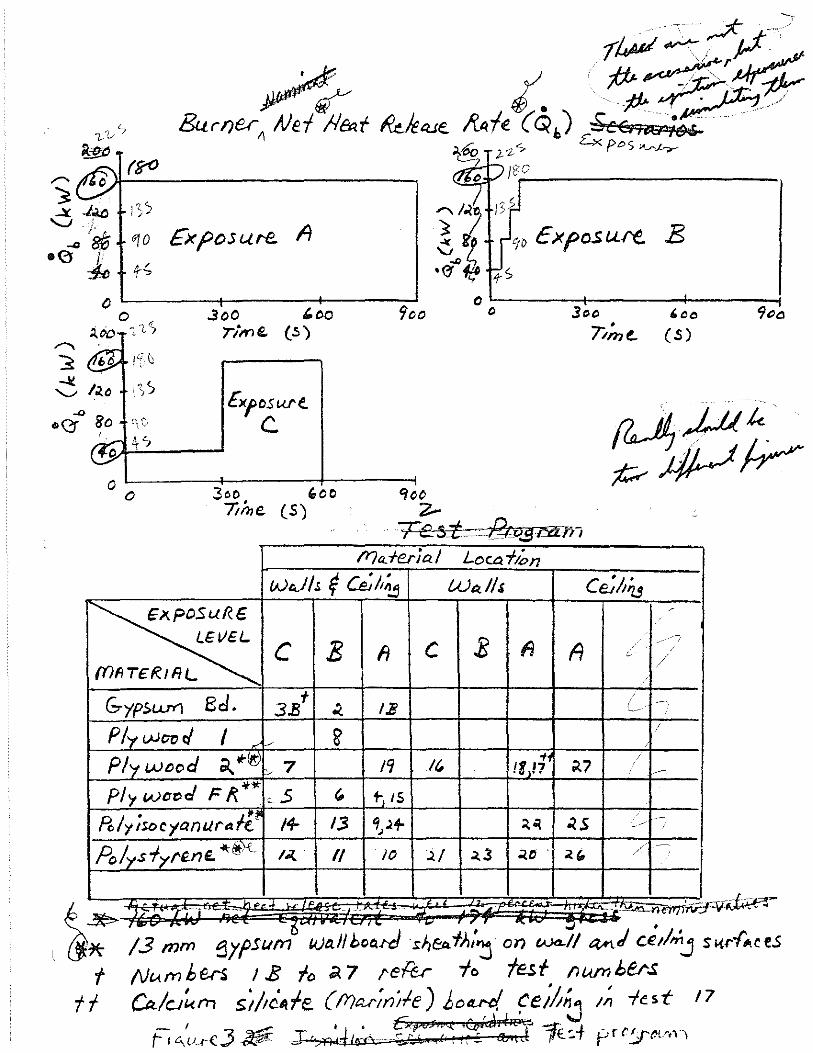
.3oo l.oo o~----~~------4-----~
o 3oo 'oo 9t:CJ 'Titn€. (S) 7/:ne... (S) _.......
:S I"~
,·~)
oL-------1--------+------i o 3oo (ooo Cfoo
7ih,e (S) ;z... . Te sZ . l3t>.J3 f"iityj
~· ~
l??a:ferial Loca-f1~n
w~/!. f chk!~ Wedls c~~~~ Expos u ru;. '
LEVEL c E .E f1 ~///
11 c A c. / /
({)FtTeRIRL /
/
&yp>u.rt1 Bd. 3.Bt ~ I.B ( -· p /y WOO t/ I ~
I
~ . Pl't wcod ;..~~ .7 /9 ./~
11 :i<7 / !!p ~
;~:·~ P/y Wa'Cd F /( ::5 ' t, IS
Po /y isoc yanura ft~ 14- 13 q;~+- -<S . .-
:l-0! ~ /
Po/ys-f.,re.ne. *~}C /i{ II /0 j_f ~3 ~c . ~" /
-~ '· :,... --*""~ -r· ... ··•""···•~>k••t ·~
I 6'" ... 77 I ~· ;; ' '-~* t
tf
, • !3 mm ~ypsum wa.llboo.rd shC:Af)u;j on W<L-1/ t:l.RtJ ce,/mj SKrf'~tce.s NtA m b e.rs I .8 ro .PI 7 ref'er io test /) wn bet'.S
Ca.!CJ~frl si/,cra'·e {l>?ar;ni.fe) ~o~, ~eihtj ~~ -lest 17 - I ,.. 'J . 6p;J;, <e ,q,;<zL 1 It ''" -:;(;. -t . r IC...,U.rC.J ~ J:";ol1 kin\ .... ·':~'' l 1 L ' B>otJ /1"-';. f;f(.:J"t.V•'I
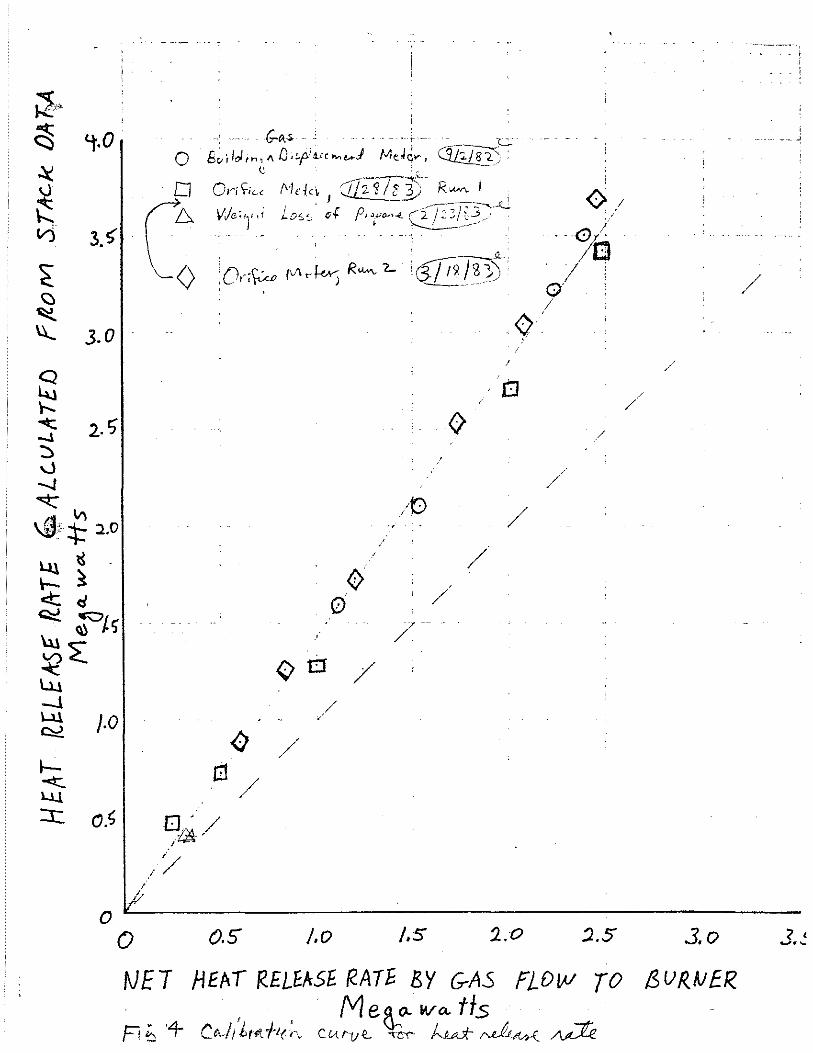
'
9'·0
3.~
3.0
0
0
[]
c:
(:) / .Gl /
r:~./ ;/
/
/
/
·0 / /
/
/
/P /
/
0 0.5" /.0 /.5 2.0 ::2..5 3. 0 .3 • .!.
N£1 !-lEAl RELEASE RATE BY G-AS fLDI)J TO f3VR.)J£R. · · M e9-. o.. wa.. tfs Fi ~ '4- C,c,_j/lt111.:/·t(;c. Cl-tf"IJe_ ':t"'C1'"" ~~MR. ~
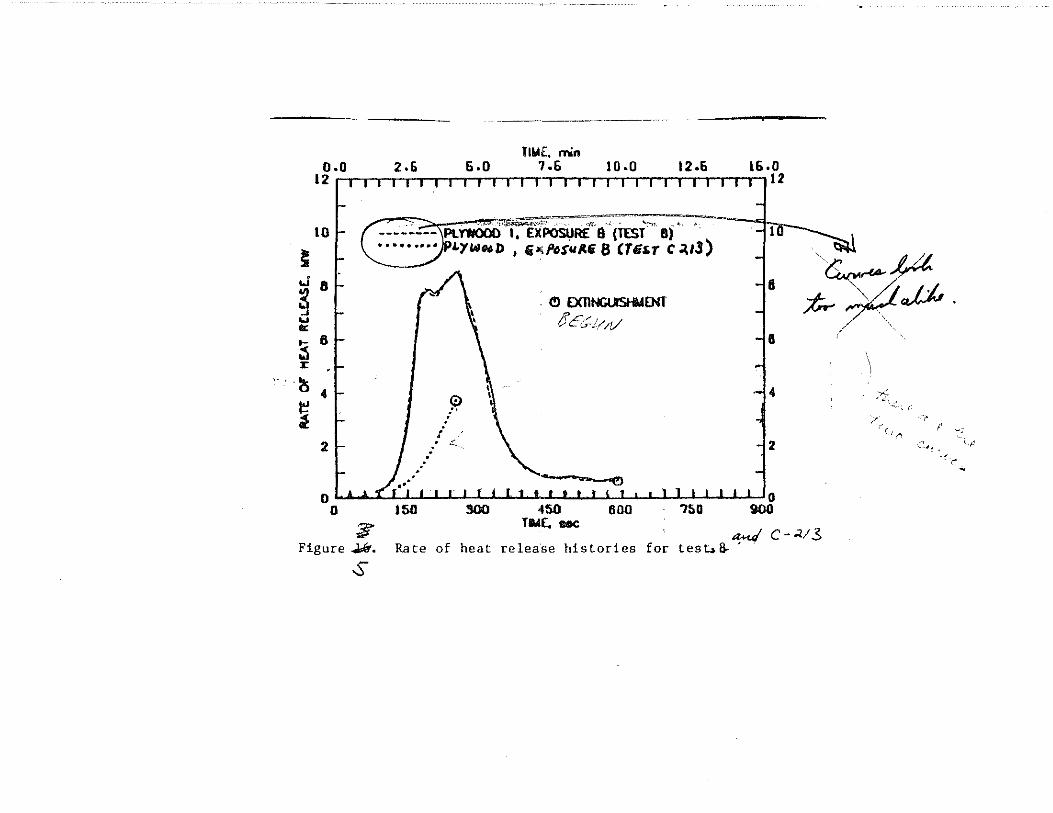
~ .J
~ ... Ill:
3 :r
. ~
~ ~
TIW£, min o.o 2.6 6.0 7.6 10-0 12.6 16.0
12 I I 1 1 I I I I I I I I I I I I I I I I I I I I I I I I I I 112
10 . ' ".<,--~--~~"~::- ' ~: . ,, . ~:::=~ ;, 9 t'"X---___ .; ____ PLYWOOD I, EXPOSI,JR£ 8 (TEST 8) . . •
8
8
4
2
• •••• •••• LYWNJ) ' €•1Pci.S'11~6 8 CTii~T c ~tl)
. i
9?
. (!) EXllNGUSI-NENl
t'C&-!(/V
a
a
4
2
0 L 4 ,A "I I I I I I I I I I J I I I I I \ 1 1 I I I I I I I I 'Q
0 150 !100 ~50 600 750 900
if' TIM(. aec
·-~~
;~;r~J;J.,
\ -,.(
/ .;:,\.-:
.,-?
"'· (. ~ r < \.,(
~
Figure .J,Ir. a..ul c- -<13
Rate of heat release histories for tes~~' ·
s
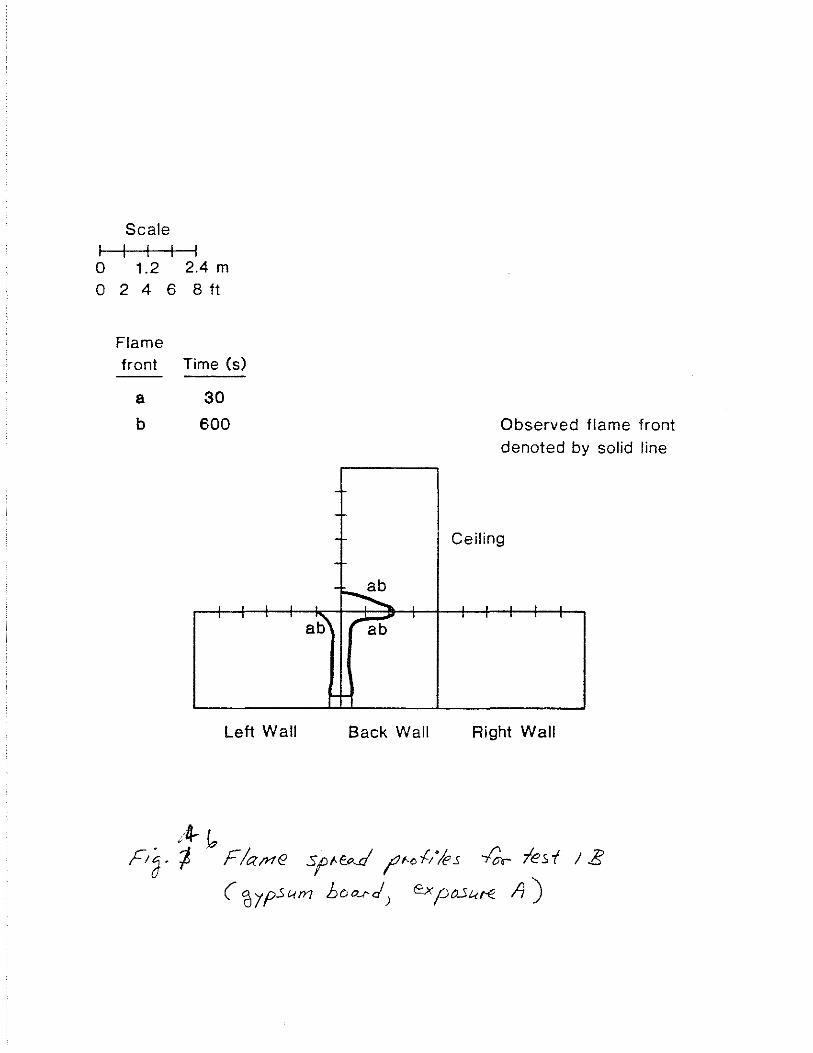
Scale
I I I I 0 1.2 2.4 m 02468ft
Flame front Time (s)
a 30
b 600
' .
Left Wall
--
.
.
ab' ~ ' • r ab
Back Wall
Observed flame front
denoted by solid line
Ceiling
' ' • • . •
Right Wall
/~ ~ F1j. '/> . F/c:une sr-EArl ~,."{//es -l'er lesi I g
( ~~p.Sl.itrl boo_.r-d; Expo.51.{f'E It)
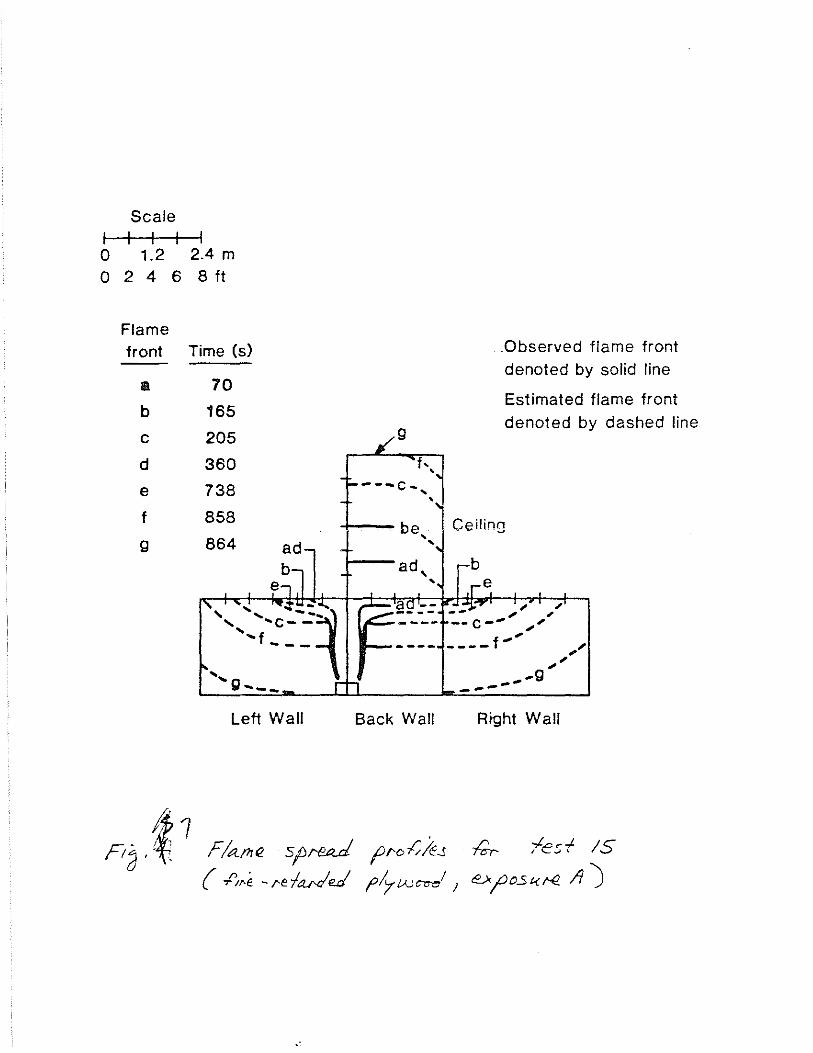
Scale
I I I I 0 1.2
0 2 4 6
Flame front
e b
c
d
e
f
g
2.4 m
8ft
Time (s)
70
165
205
360
738
858
864
....... g __ _
Left Wall
F/a111e s~rea..d ( -1/,."e - /'efaxied
g
f, • ---c .... , •
. be ... ... ad,
...
Back Wall
Observed flame front
denoted by solid line
Estimated flame front
denoted by dashed line
Ceiling
e ~ ~ , ,
-- c -- , ..... ' ____ f
----... ... g
,, , ..
Right Wall
f/'();; k.J f'/7/AJ~)
.;;,.. fe:; f / S
e.,x,j)O.S!<KZ /1 J
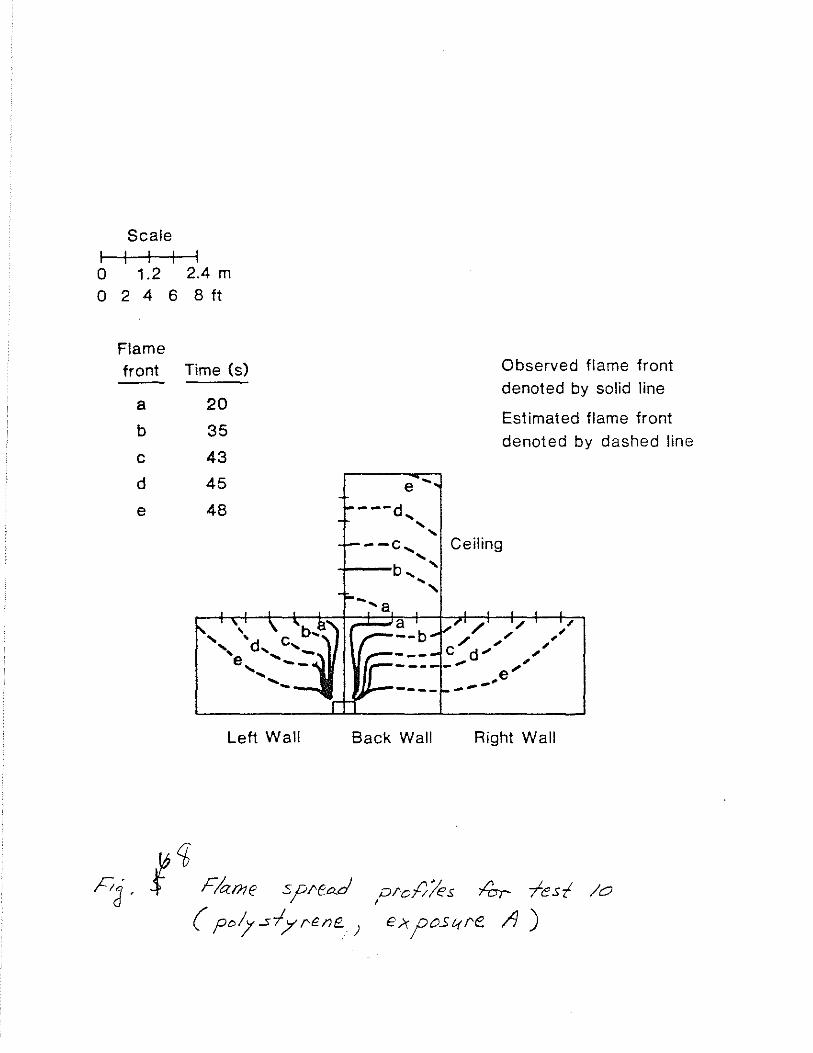
I 0 0
Scale
I I I I 1.2 2.4 m
2 4 6 8 ft
Flame front Time (s)
a 20
b 35
c 43
d 45
e 48
Left Wall
e ... ,
1- ---d ... - ... ... ~--c, ... +---b ... ' ... ,
Observed flame front
denoted by solid line
Estimated flame front
denoted by dashed line
Ceiling
-~-- '8 .
Back Wall Right Wall
! C£ Flame s;)/'ea.d
( po~.slyrene. )
Pl'o/J/es lbr- -lesl /o I
e;.:po.sqre. A )
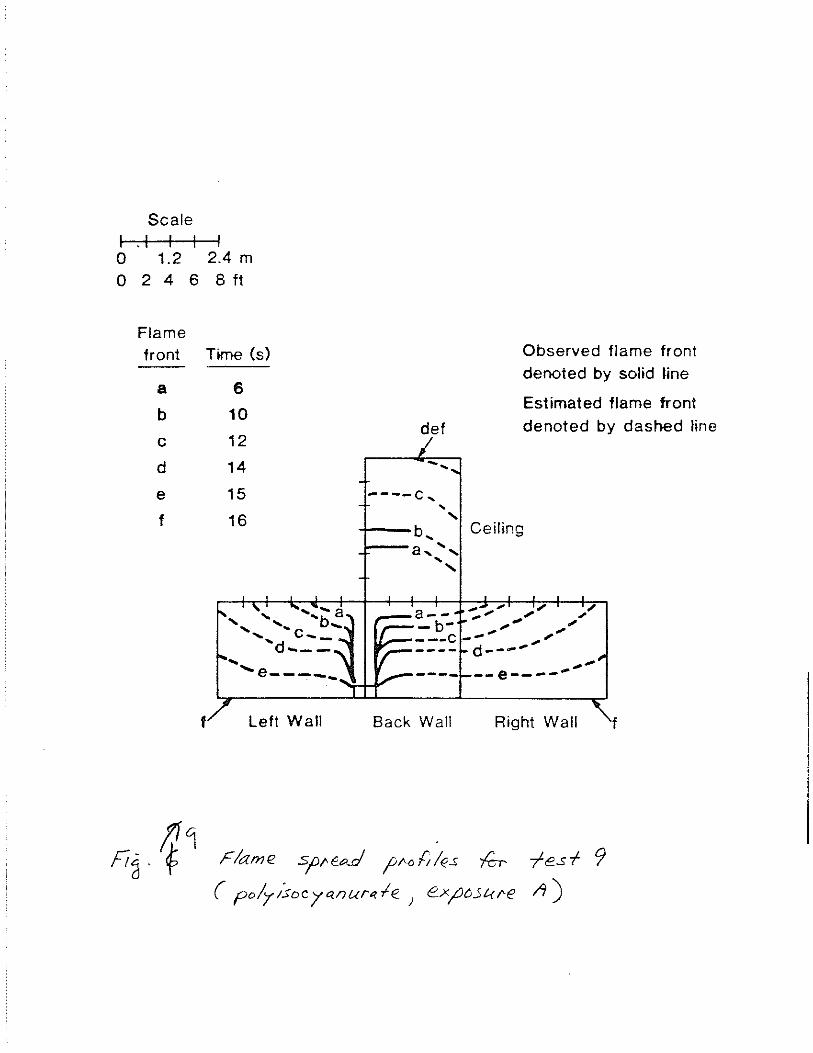
Scale
I .I I I 0 1.2
0 2 4 6
Flame front
a
b
c
d
e
f
f
I 2.4 m
8ft
Time (s)
6
10
12
14
15
16
' ' '-b~ ' ' .... c ....... .... --"""d---
''e-----
Left Wall
Observed flame front
denoted by solid line
Estimated flame front
def denoted by dashed line
----c .... ... .....
+---b... Ceiling 1---a, ... ,
... ,
a-- -;. .... ... ," -b- ... .... ---c
_ ... ,"' - ... d---'
" , "'
... ...... ---- --e----Back Wall Right Wall f
Flame s;;recd fN!'tles b ( po/7/soc/o.nur"~IE J exj5CJ5L{t'e
-1-e.sf 9 17)
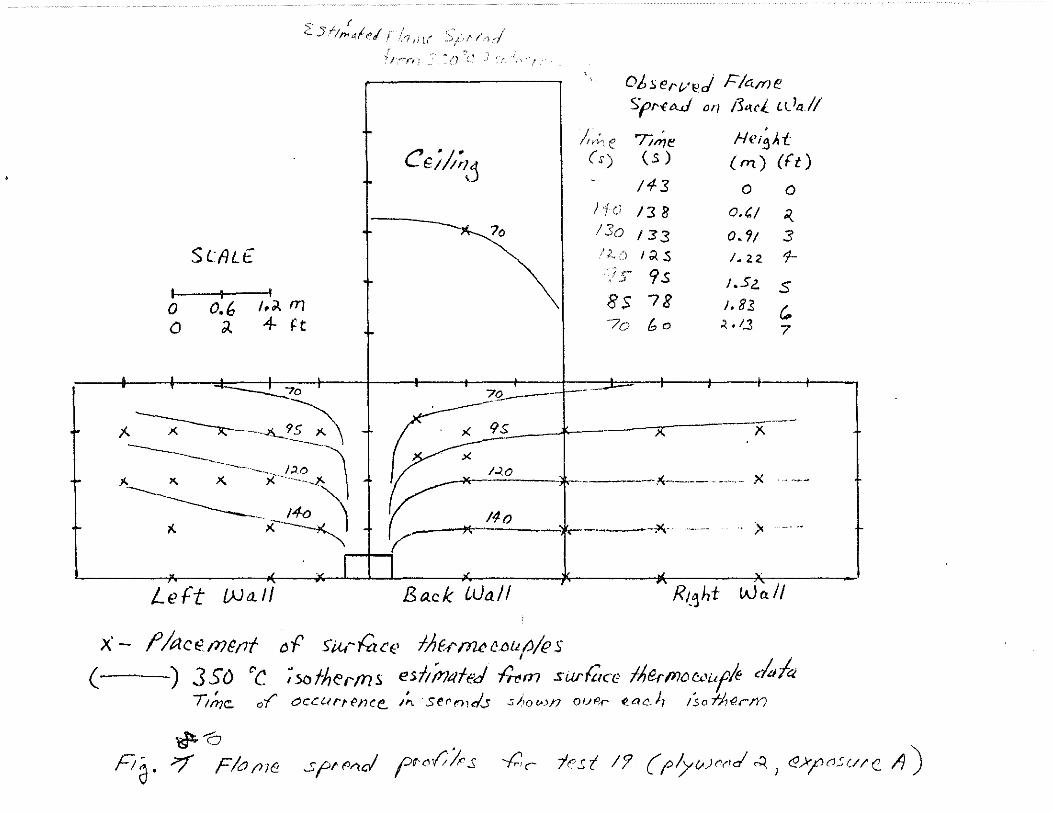
~, ,: r I ~ 5. 11>14f~l r ,; l( ·~ r>;(
/' .,. ~· I ", >' / ', '!" t:""'fr] 0 (,_ .I t. r' f
Oi>::;el'l/ej F/cvoe SpNru.f on i5a.cl LL1a//
!u;, e 'Ti~e He;g),t (s) (s) (m.) (Ft)
143 0 0
~
CEi/;;~j
) .-1 t'l 1 c.J /3 8 o.c; .:(
7o I I 3o 133 0. 'il 3 SCfiLE II, c) I ;;l_ S !. Z2. 1-
/S" 9s J.5z_ s 8$ 78 /, 8],
~ 7o f:,o .l.. 1_.3 7
0 0.6 !.~ fT)
0 J. 4-H ~
• --r ?Q------1---- ·---r
1-
____,___~ .x f.. ~--~~--!:J \ y: • '<o ;t.-. _,._ __ .• ---------------.. _' /:1.0. r=: - -)<
><· ··~ "· x. x. ~ 14-o '1. ----y..------- ~-- J4o -
-)(-'~ /-1(.
~9.5 t X ~--
+
Left {)Ja.l/ 13 a.c k itJa I I R1-1ht Wall
j//act?mMf of
( ) 3SO ' T;f11r:;.
X- s:ur- face Ille-r~ t:Du!J/t' s I
"C ;<x:Jfht:rtn5:. esl/frklfed f'llJm sudZce IIJG.rtn~~'ufle clalct 0 -(' tJccurt{'nce. ~~ s~cnu:l..s s~;o'-'>17 our:<r f_ate.4 /:,or/,<2rro
~-a Fi a. ?/ Fla f/712 Sf'!' Mel ?~''-'.('; ll" s --;;,, l(' s t I? { f>/;YvYrkl ~ ) <2.X;"(J5t;// c. I})
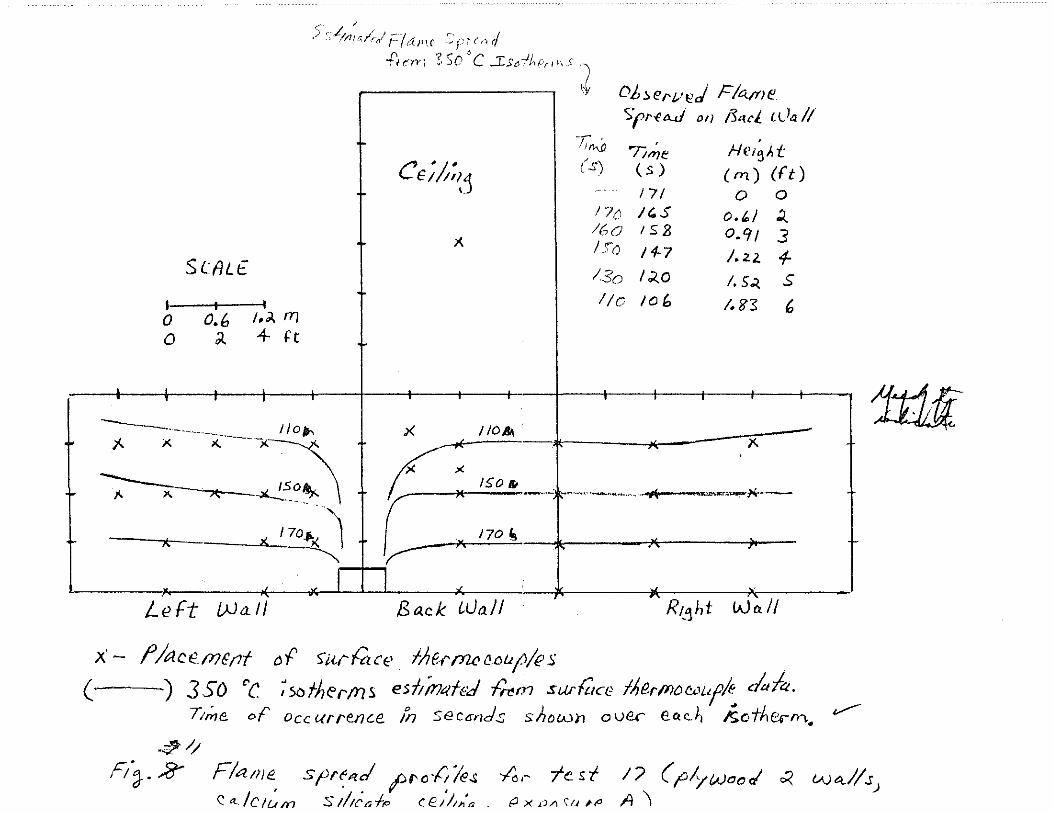
1-
~· / s c./., / I -·r <· .. • I ,_ ~'· tll!t;.l"rcr 1 t{Jt·1"( .... ;_)r c ,"{ r.
I' ? ~ 'c -If . r "t-f·C)''Y! ,,_-.JQ Jso.- ,~'rlr\ .. • -~
\)! Di>::.ervf!.J Flcvne ":::pr-ett.d on i3a.~l LL)a //
--0~ 7/~t: H{';g;.{
Ce;,l;;~') (s) (s) (rrt) ((t) t I?/ 0 0
171.~ I(.S o.,; ~ /6o IS 2 0.9/ 3 X l I s·o 14-7 /. 2.2. 1-StfJLE I 13o l;zo I. S;J. s
I I 1/o ;of. /. 8?. (, I 0 0.6 ;.~ fTj
0 02. + H
& I i
' - ,------ J '
1/o~r. ~-,-~\ -- A; ~--- ~ \ ;<. ><. \
17o.r." I xm ,..---
-x /10~ + :1<. X
')(' >< /!>O tr. -
.. ,
I "' Left {)Ja.l/ B a.ck ~tJa./1 R;_"JM Wall
X- !'/act2m~t1f of <:u1{;rce. f),f-1"/YU'~oujJ/(!S
; St:Jfhf!r/Y?S esl/incded f'~m surfttce f~Jermo&'uflt cia£. occ urrenc.e ln sectrnd.s shown ove.~ eo.~~ h.othe.-rn.
( ) 3SO "c T,',;'Je_ 0 f'
• .. ~//
11JJi'
........-
F!~.-8-- Flame, S(Jr~"lc! ~"oi(Ie.s. ~ tt/Cit.nn S tftcafp ce;/n,'a
/o,- fest I'? ( (Jiywaod' A\
c:< wa../lsJ P x v/\ \I<,.,
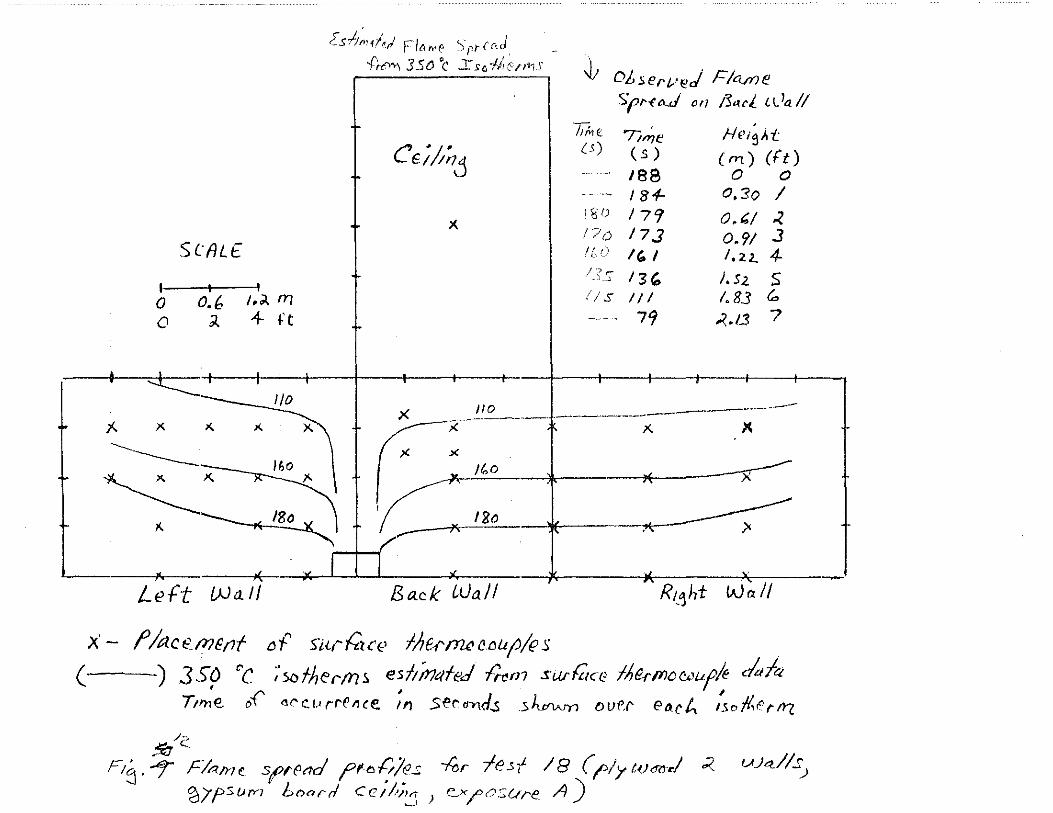
) j' I . I
<'.S-1mq,j Flt.n·e .'>prU•d _
fr""'' 350 'c r so i-/.rcn•1S ,J;
1!
cE;f;~ '
)(
SCALE
I 0 0.6 1.~ rr)
0 ;1. 4- H 1-
I 4::::: . I/O
/10 --x -- ---------- ---------·--------"-~ j. X >(. "' )<. " x X
---------- )f. .>< /60
·r:=: ::: ~ J(. r J'- -"
~ ;_ ~~ -
_, " ~ ~
Left {)Ja. I/ B a.ck LI..Ja/ I Rt.1ht Wall
X- (J/act?mBflf ol' S'iu-r:~ce IAEr~r:ou(J/~s .
( ) 3S9 "c ;s;,fhertn5> e:lt"m4fed f'~m swiZtc:e fiJermo6:Juf1 clalc:t Ttrne o{' "-~'t:t•rri'llce. tn ser-<IYI.d.s :;~ oui'.l' e~ch t;,ol/..&rtrz
/-, 5t!c.
Ft~.-1" F/.-:>,me s~I'Md ;:>ro!':J?.s -!'or ffesf 18 ((Jiyt{J<flt~J .;( t.AJ,q//s.J '67f>"'VfY7 bonrrl Ce;/;,'.5 ) e_x/'osure A)
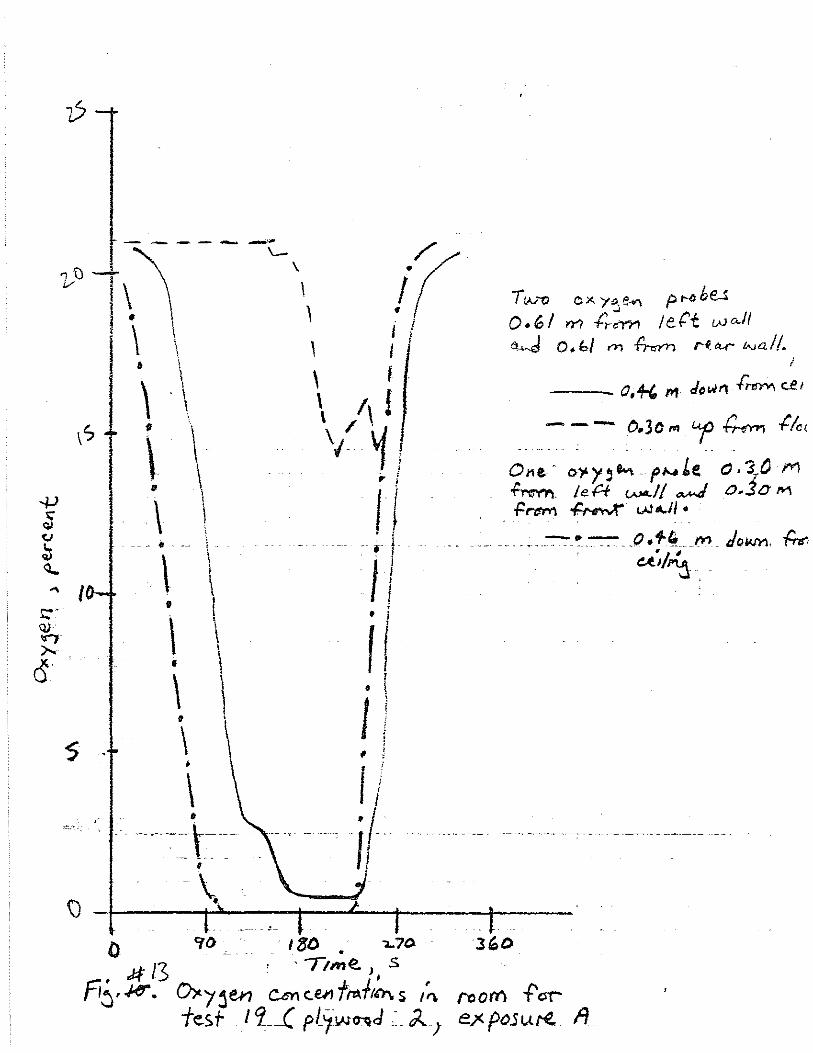
-------2-"-t\\ '-\
l • 1 '
! \ \ I . \ TIN "f) ox y~ e""' p r-c be_:. o.M m -hern Jer't wa.ll I f
I ' -\ \" .\ \ \ "
11 \
\ -- -. ,\ • \ •
\ • \ • s ' \
' ' l. -- -
\
\ ! \ I
\
\
,- . " -- ----~= t -~-
•
\ I '
\ I
\ /,, ! \' ~- t
c;,..J 0. &I r'>'1 f'r.,y,-, f"( M"" i.<.Ja./1. I
-- o,+<, n1 dcwf'l .(nfYV\ c.£!
- ----. -
One- o.,.y,~ p~o.~le. o.-.s,O M .ff'TN"f\. ieP+ ~11 ,..,...J o.so M ~rt1M ~- w'-'1 • [/ i I .. . . . . ..... c- • = ~t~"' do>m. {,.
;
i I . \ I J , J
i I il-l!
\, Q ~----~·~--~--L-~----~-----
- ~-
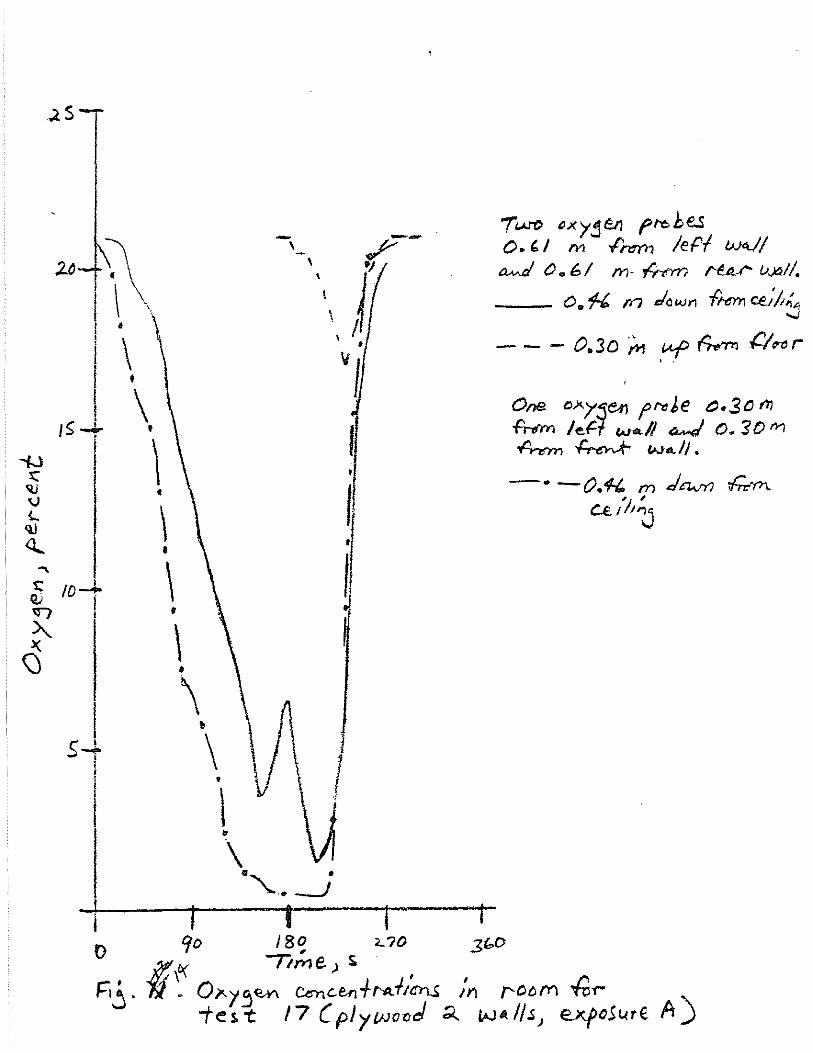
I !; I Q) /0_.. n I A.. .l(
(j
I 54
I
I
-\
\ • \ '
\ •
\ • \ ' \ •
\ A \ \ j \ I . \ \ {
\ \) \ {
\ \A ~._;
(we .:~x)"jetl trebe.s o. '' m ..f'nn-n /ePI- wv/ a-v.d 0. 6/ m- ~m H-A--l' u.xd.
-- o. f{, m down frern ce;'/;'!,j
-- - 0.3o ~'1-t .¥ ~ ,C/ror
One ox75~ ff'tj);e "·30 t11
f+..m1 le?f we. II ~ 0. '3 () 1'>1 -A-,m, ~ Wd.//,
- • -0. -H. m d CWr? ,f;.,rm
c.v tliJ
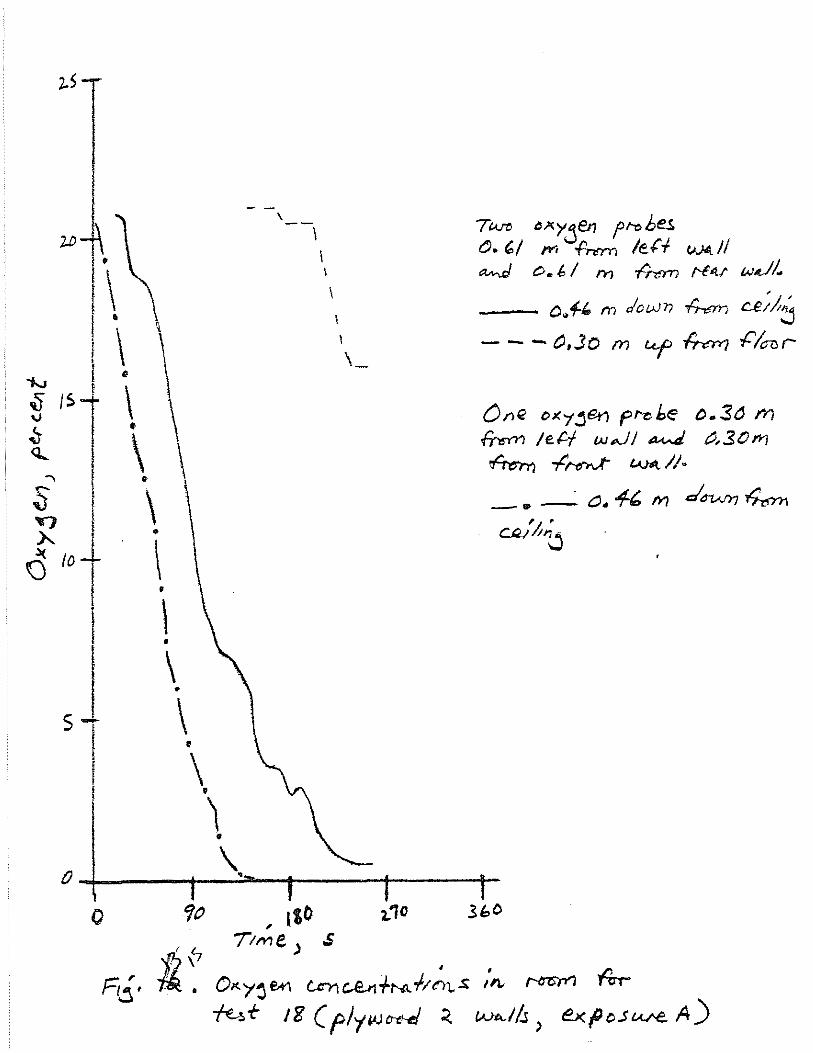
;z..S
;wi\ I ~ I \
I \ \ "N I " § /5i \ t I \ " I • ~ I \ .>-. ' •
G to+ \ ! . . \ I .
\ •
s- \ ! . I \
\
\_
Two Myj€rl ft-che!. o. M fYi ~ /eif W4.11 ~ c-. 1> I m .f'rtrm t'btr w,J/..
-- o.1-t. m down ~ C£;;?6 --- t),Jo m ¥ ~ -l'ltmr-
One ox'1j€ri pr-ebe o.3a m ~ /eN w.J/ ~ tJ,30!'11 ~ -~~ t..J..#t/1·
- _A/ d ,._, ' "" ./' - .. - o. 'Tit:> fYI -~·J '7'6n1
~/h'G
•
\ \ • 0
Q 90 , 1so 2.1o 3£>0
ft'~ F!-5· •
/lm e ) .s
O;c. y~ W t.c"r; ~ fM f/~ :4 ;,_ ~ fbr ~f IE (plrwcrtJ--d ~ Wt-.-1/s > ex:po.st-ve. A)
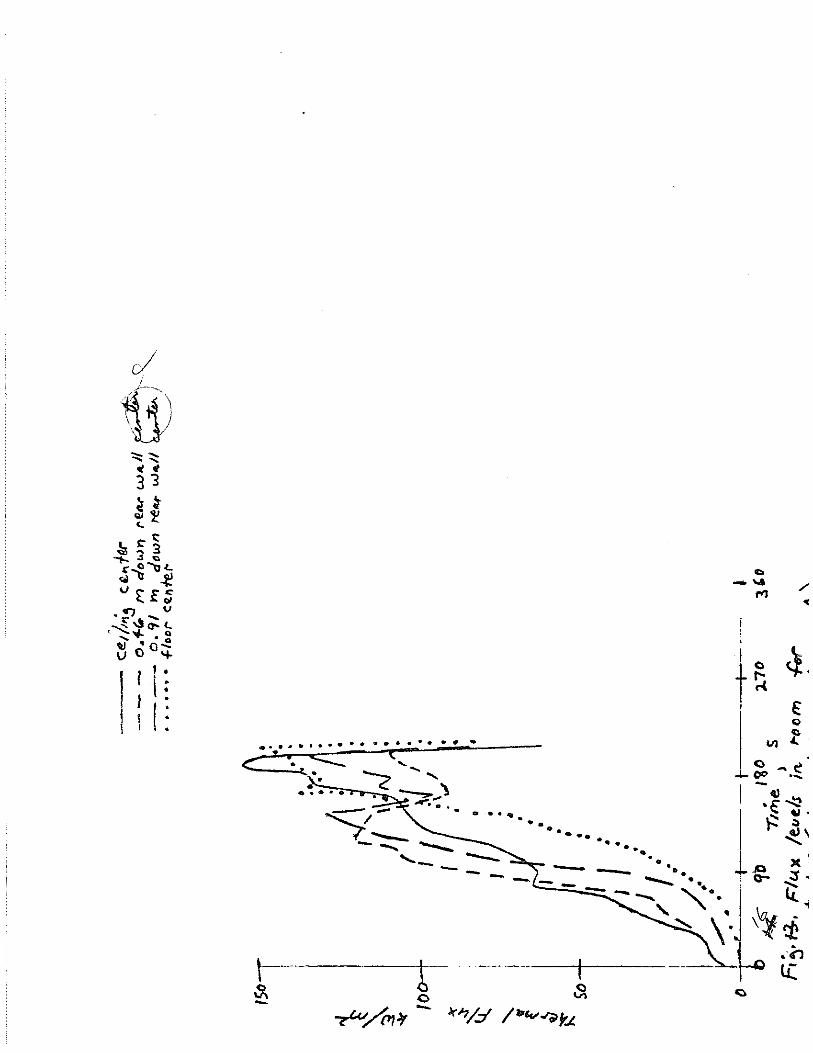
cl
\{1)
... -'-A /
t"' ~
lo
t~ ~.
j € 0
• • • Vl ~
~~ ~.~
I~~~ . . . .. . . . 1 ~ ~. ... .. ~' . " . . "' •·. I ,_ . . )(
--- ------ •• jl:)..., ................ . C'-..;:!'"
--- ~·· J. li~ '~ , .. \~~
.-<"3 lC
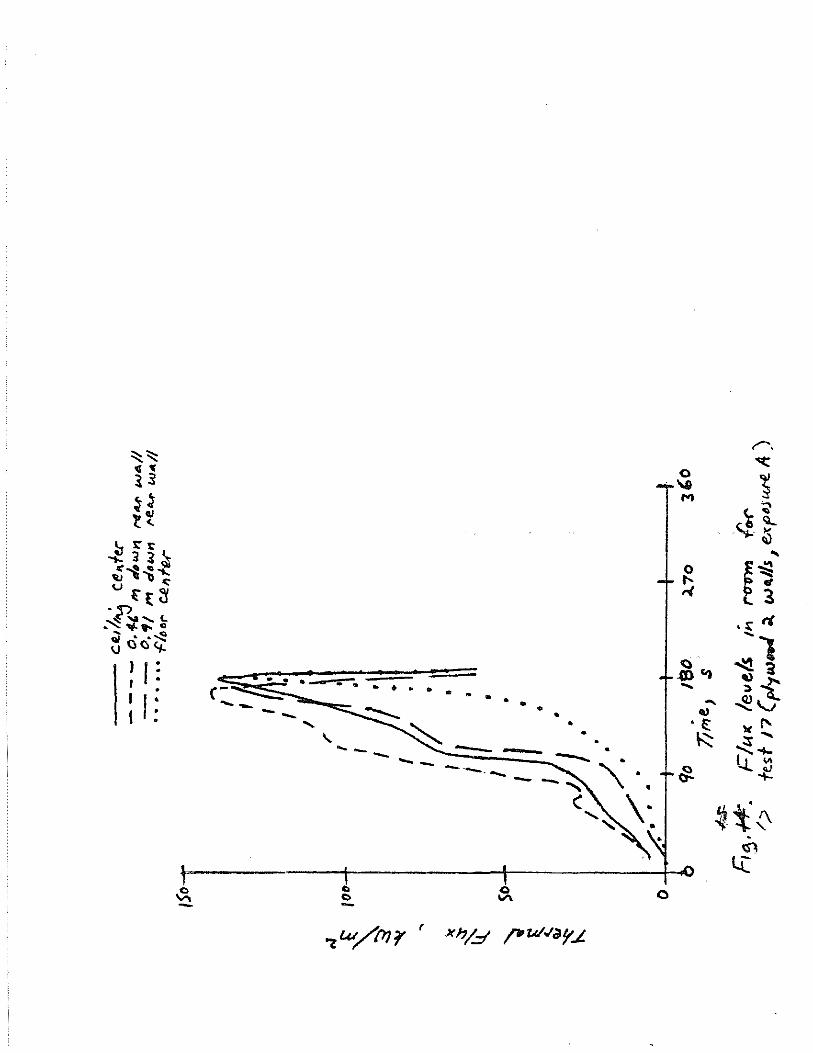
~~ <I 'I' ~3
~~ ~~
~ s: s: ~ 3 ~~ ""'i~ 'IU .,
u {" l: ::1 :{'~ .... '-• II- .. ~ .. .. ~ IJ(J()~
I I : I •
I I : I :
... -c-~ ..... _ - ....
\.
- .
.... _
.. C)
• • • • • • •
- ---• • ..
-
0 V\
• • • •
0 '\$
M
0 t-
"' () .G)~ .....
..... _, ·t ~
~
0
{""',
"(:
~ .... ;~ ·~~
...
E1 • ~ rt
'1 ~i ~{: ~" w~' ::t' !' ...... l.J..."' ~
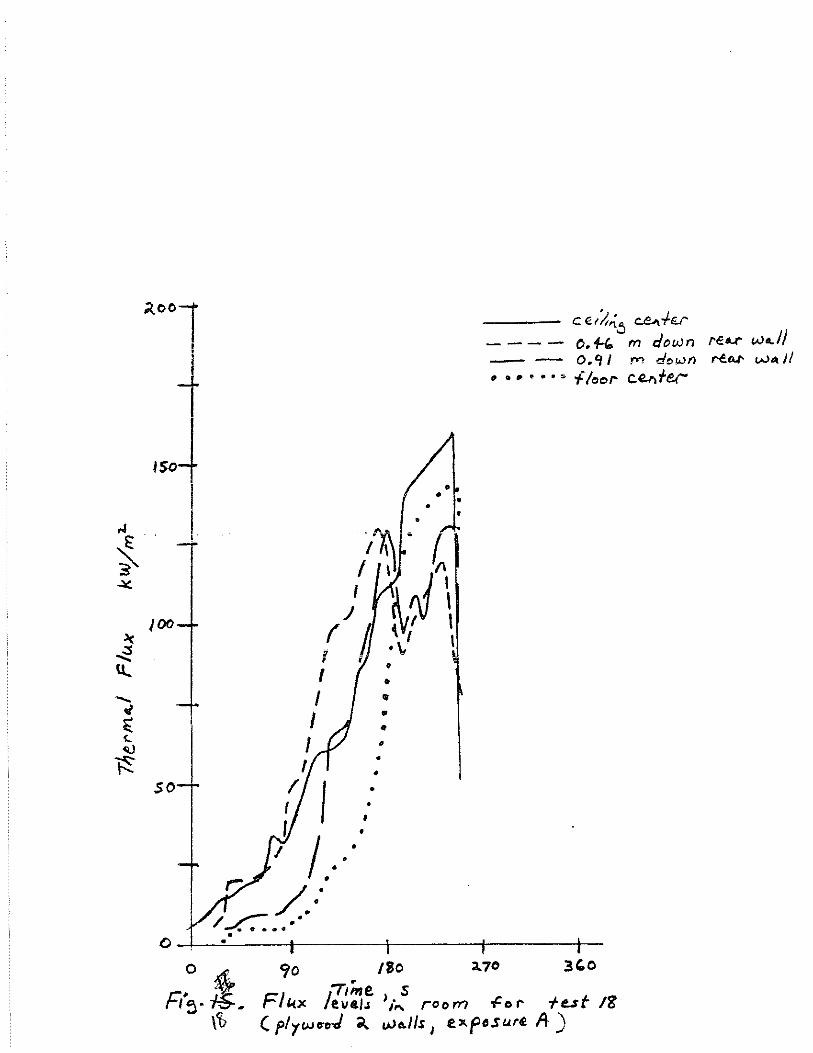
c e '/,,;j c.e~:hr ---- o.4-f. m down re.u wa..ll - - O."tl "' down t-e.~ w .. JI ••••••
0 +'loor ce., fer-
• •
~~~ . f. I I Jf\ I ~ I J I
r A .\/ \ i i l
I
/00
I • •
I • I •
• I • I •
• so / •
• '
r; /.:
/-C'.,·· •
0~~-~--~r-------+-------+-------~-
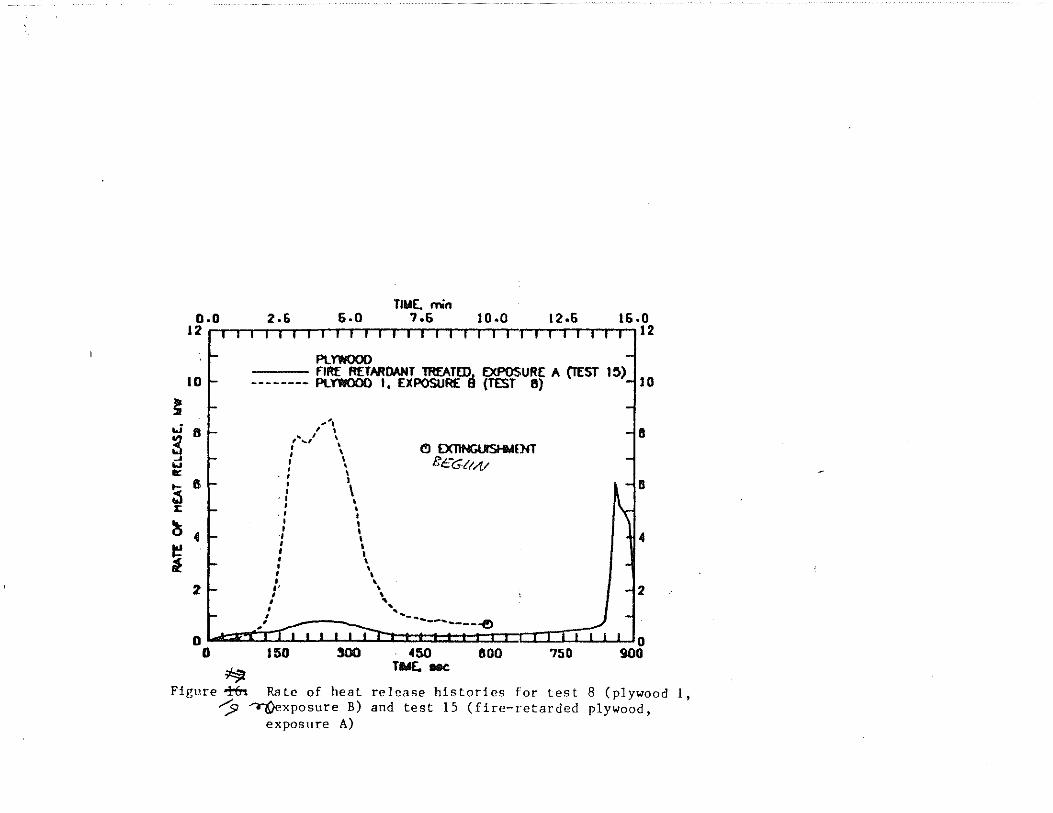
~
TIM(, min o.o 2.6 6-0 ?.6 1o.o 12.6 16.o
12 [I I I I I I I I I I I I I I I I I I I I I I I I I I I I 1]12
. ~~ -fiRf RfTN!DANT lREATID EXPOSURE A (lEST 1 !>)
10 t -------- ~YWOOO I, EXPOSURE B (TEST II) ~10
.J II 1-
~ --·
' I ' -18 . •
... II:
r-I _, I I I
• • (!) EX11NGUISI-Id£:NT \
' e~:::-c;tt/1./ • \
5 61-• I • \ I
' • I
i
>::
~ 4 r-
2t
r- • . . I
' ' I I ·I I I I I I I \ I • • \ • \ I' • , \
t ; ----· Q AzJ ("1 r::;::; I ,:w:=r, I 4 I I I I I I
, ' ' ! • -- -----i!)
t I I I I I 0 --- --- ---1:00 ::IUU 400 800
~ TIM£. IlK
-
F' -\14
J -12
-I I I I I i .JO ?50 900
Figure of'trl Rate of heat release histories for test 8 (plywood I, -:;9 ~xposure B) and test 15 (fire-retarded plywood,
exposure A)
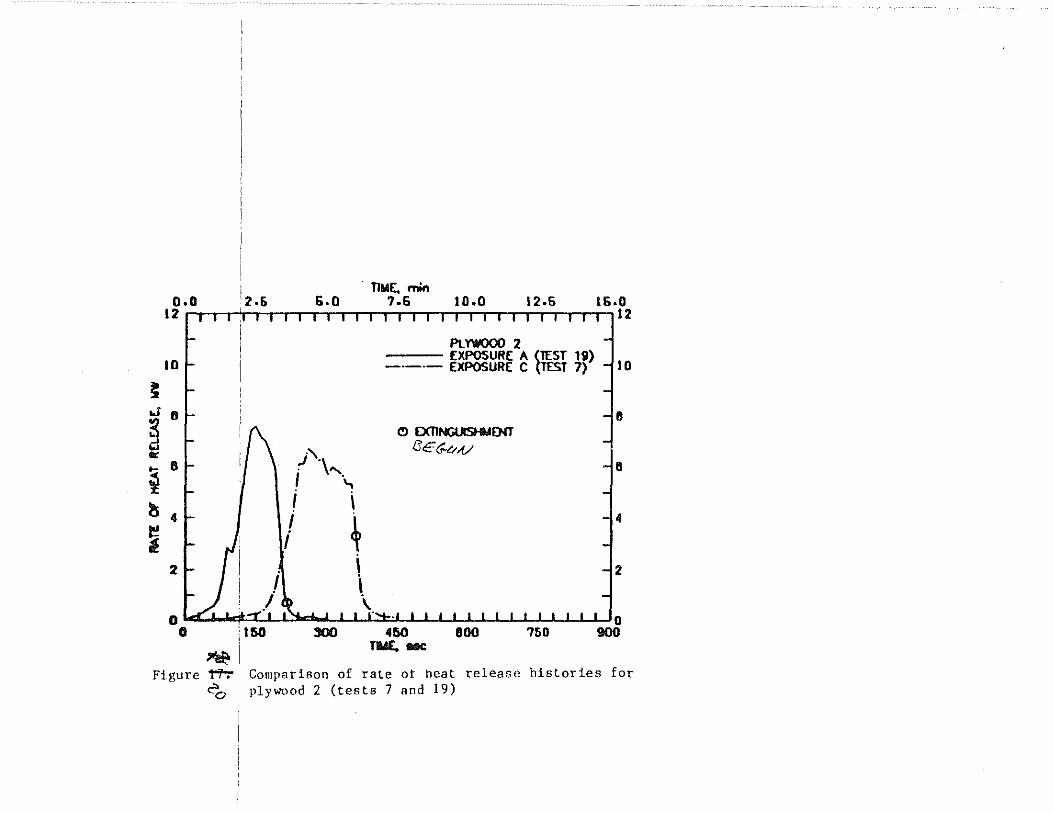
i · nwr. """ o.o :2.6 6.0 7.6 10.0 12.6 16.0
12 I I I I 1
1 I I I I I I I I I I I I I I I I I I I I I I I I I I J 2
PLYWOOO 2
10 r I EXPOSURE A ~~T 19)
-·-·- EXPOSURE C T 7) -l I 0
~
~ B ! -lll
Cl IXIlNGlJSit.IENT
i j'\ 66GtM/
... 8 . ...... -l8
¥ I -...,
~ 4 ; i
/ ' -l4
i 2 I 2
\ \
0 0 0 i 150 !100 450 800 750 900
~I Ta.e£. II8C
Figure '1"'1'":- Comparison of rate ot neat release histories for c"o plywood 2 (tests 7 and 19)
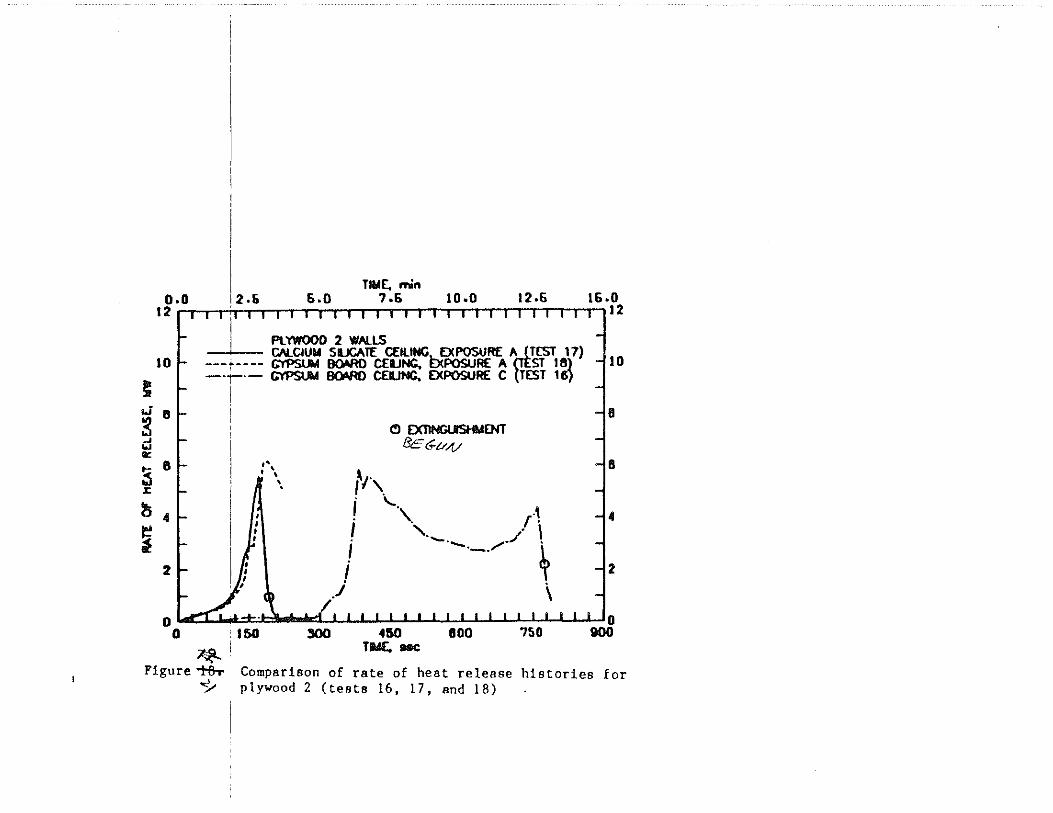
TIM[. min o.o i 2.s s.o 7.6 to.o 12.6 t6.o
12 I I 1 I Ia 1 I I I I I I I I I I I I I I I I I I I I I I I I tl2
10
~ ..r II
~ d co:
5 II J:
~ 4
~ 2
I I Pl YWOOO 2 WALLS L- CN..CIVM SUCATE CflliMG EXPOSURE AmTE:ST 17)
--- ~---- CYPSlAI BOW> CEUNG. E:Xiii:iSUR£ A ST Ill) -!I 0 -·~·- CYPSIM BOW> CEUNG. El<POSUR£ C TEST 15)
I
' ' I I
•', . \ \
(!) EXTINGU'SHMENT 13EGv/(/
v, I . ~ i '-.,, 'i I. '·--. ,.-./ i.
-·-· 'i' I . i \ ..1
8
8
4
2
L.rr"'J b,A=±·t) t ' :f I I I I I I I I I I I I I I I I I I i 'O I 150 :500 450 1100 750 900
~ I Tlt.l£. IlK
Figure~ Comparison of rate of heat release histories for ~ plywood 2 (tests 16, 17, and 18)
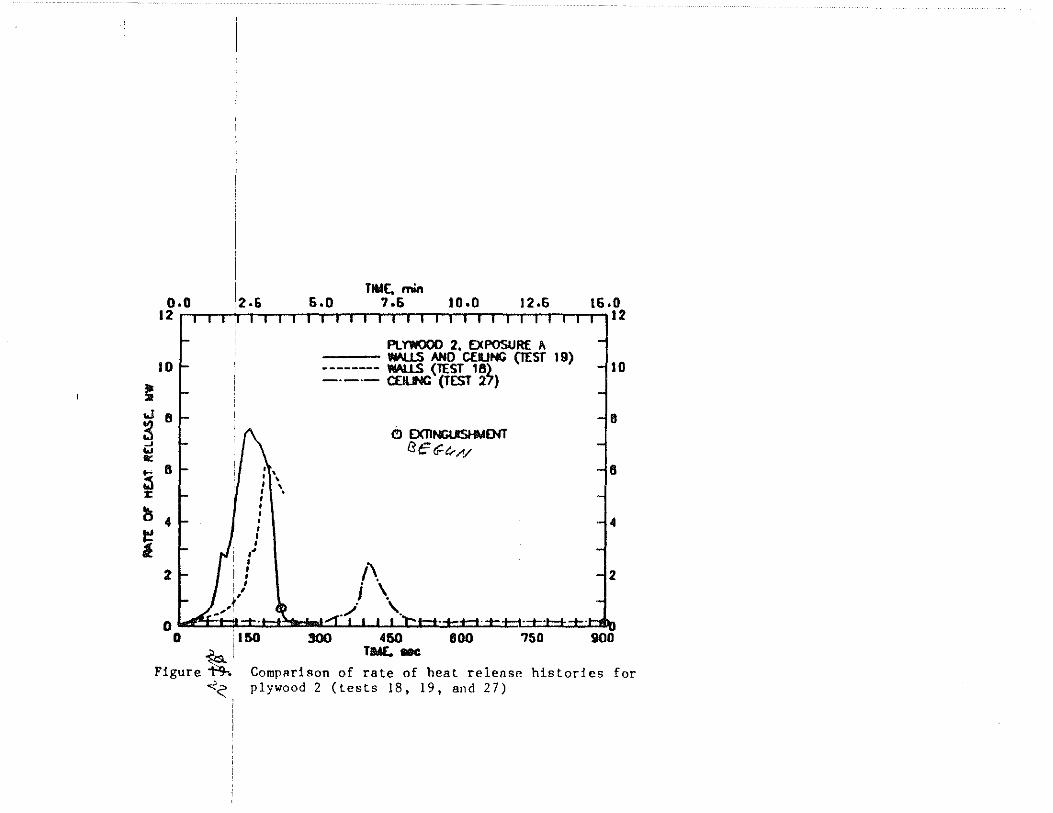
TIY(, min o.o 2·6 s.o 7.6 10.0 (2.6 16.0
12 I I I I I I I I I I I I I I I I I I I I I I I I I I I I I I 112
PlYWOOD 2. EXPOSURE A
101 WAlLS AND CfiUNG (TEST 19) -110 -------- YW.LS (TEST 18~
! -·-·- CEII.Ml (TEST 2 ) t tJ 8 ~
-Ill C!l OOINGUSHI.IOO
.J rse G-4-.-v ... "' ... 8 i . ' -16 i . ' :1 I ' :a: I •
I
~ 4 I
; ' -14
i 2 2
0 l...tf!lEt=lf:t·t-t~::=f·-1 I I I ):.H·±t=j·-t=t=j·±·H+~ 0 i 150 !100 450 800 750 900 ~ 1 ra.u:.-
Figure~ Comparison of rate of heat release histories for -<.;::: plywood 2 (tests 18, 19, and 27)
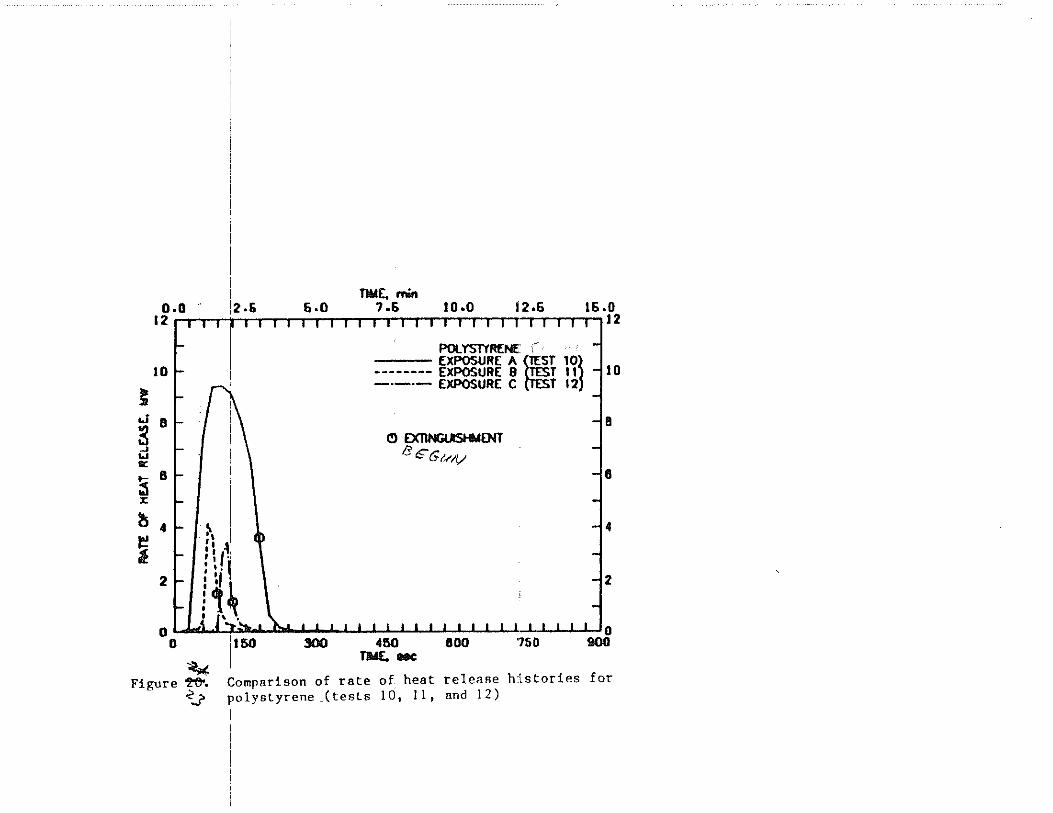
~
o.o 12
10
aJ 8
~ .... IC
t- 8 :i X
~ 4
i 2
2.6 s.o TIU[.rnin
7.& 10.0 i 2.&
POLYSTYRENE: ( ___ EXPOSURE: "' Uir 10l -------- EXPOSURE 8 T II -·-·-EXPOSURE C T 12
0 EXTINGUISHMENT 13 t!f' Gt.>t/,1
1&.0 ,-,12
10
8
II
4
2
0 I J..,j f 'l!l. I N I I I I I I I I I I I I I I I I I I I I I I 0 0 1
1 150 lOll 450 800 '750 900 ~ TN£. IIIIC
Comparison of rate of heat release h:lstories for polystyrene (tests 10, II, and 12)
Figure 't'&. <...?
I
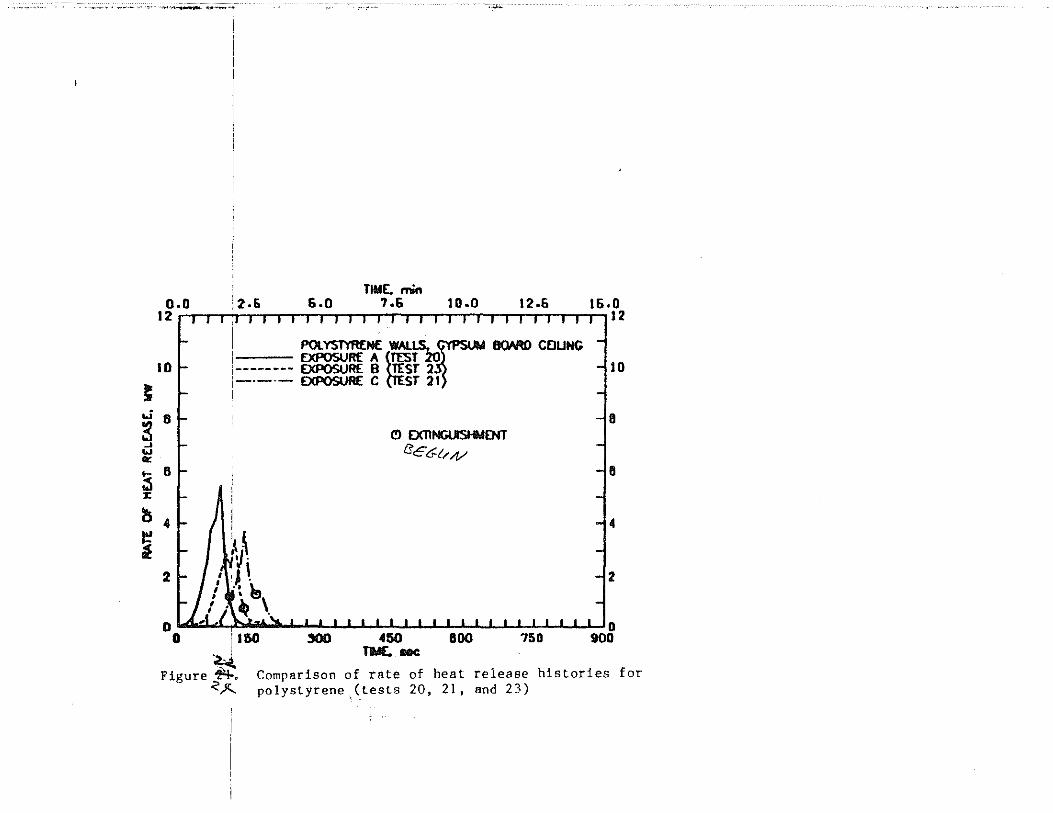
-.. ·~·,.-~. ·~---. "'~'' ,....~ ---- --~ .. - ·~
TIM£. min o.o 12-li 6.0 7.6 10.0 12.6 16.0
J2a I I 11:11 I I I I I I I I I I I I I I I I I I I II II I 112
I ""'"""""' ~r ...... cou"' 10
i EXPOSURE A TEST -liD 1-------- EXPOSURE 8 ~ST 2
~ i-·-·- EXPOSURE C ST 21 I
..; II -lll ~ (!) EXTINGUISHMENT ..1
tScfr-tov ... Ill: ,_ II ~
-lfl
J:
~ 4 1- IIi -l4 r! ~
2 2
0 Lct.,J .. ( 1).. !z! 'f I I I I I I I I I I I I I I I I I I I I I I I Q
0 J' 1110 ~ 4110 BOO 750 900 . . TM:.-.,
Figure~. Comparison of rate of heat release histories for <}<... polystyrene (tests 20, 21, and 23)
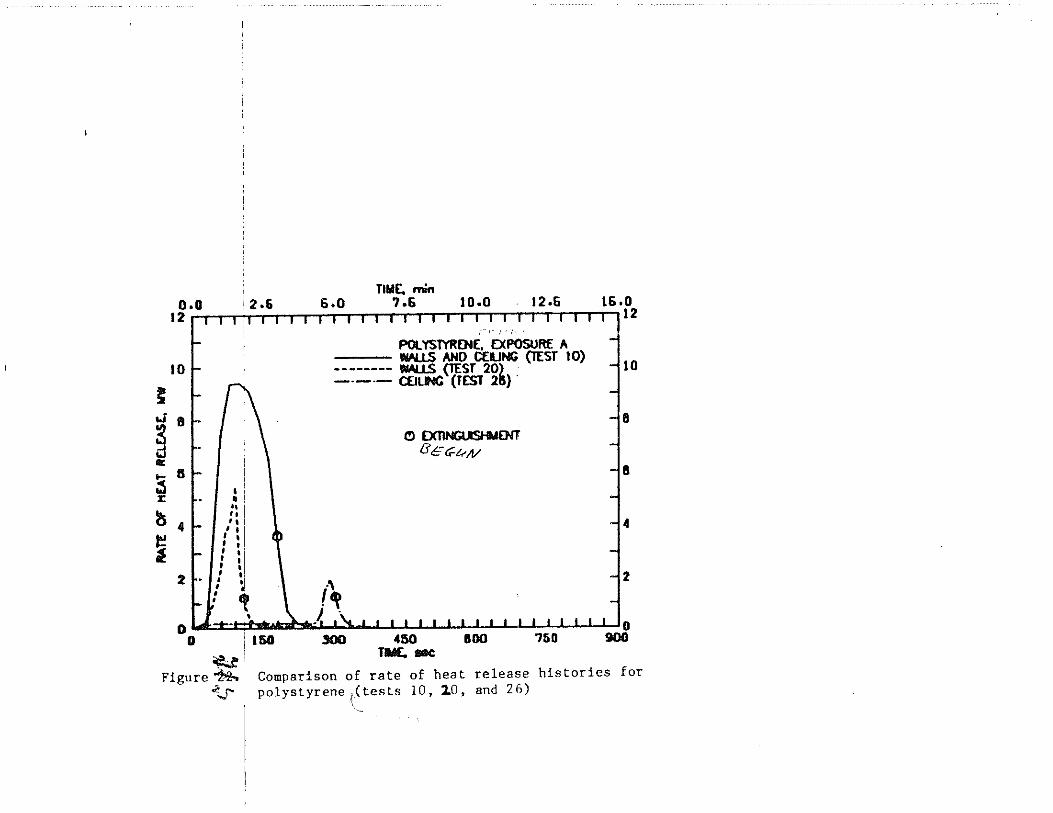
~
I ~~ o.o !2.6 6.0 7.6 10.0 12.6 16.0
121 I I I ,1 1 I I I I I I I I I I I I I I I I I I I I I I I I 112
10
POLYSTYRENE, EXPOSURE A WUS AHO CfUNG {TEST 1 O)
--------~ ~ST 20) ----- C£1....C (TEST 21!}.
10
oJ 8
~ 8
10: ... 6 ~ ;r:
~ 4
i 2 ••
i ' . ;
• ! ,, I I I
' I I I I I
I I I • • : : I' I 1
, I,
: ~ : '!
C!l EXTlNGUSI-NENT fJ C:: c;:u A/
8
4
2
0 l.J=t-t:f........:>.....·'o I \s. .J I I I I I I I I I I I I I I I I I I 0 D 1150 300 450 1100 750 900 ~ ' 1'1«, 8IIC
Figure~ Comparison of rate of heat release histories for polystyrene
1(tests 10, l.O, and 26) "'-.J' \~
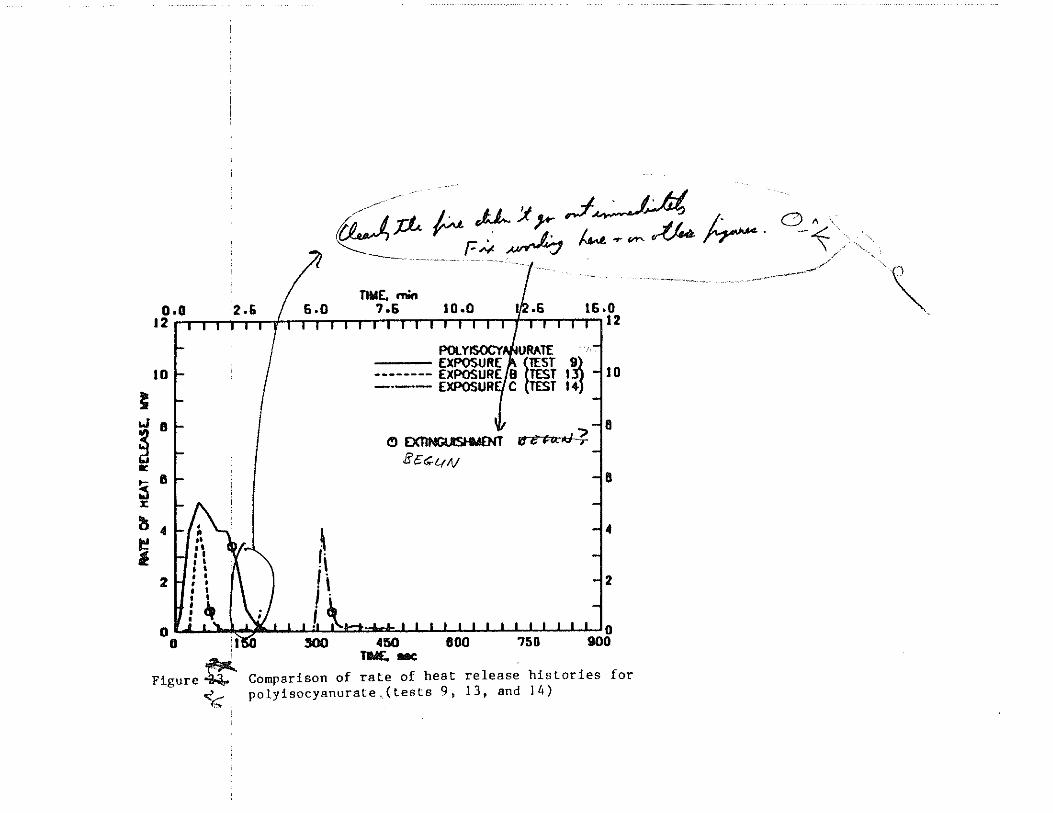
{!,~ f.. /f !::k ~ lr- 0-~~ --· '"''"""""-·--·-· . --~-···---_../"'
TIM[, min o.o 12.6 1 6.o 7.6 1o.o ~·6 ts.o
12 I I I I I I I f I I I I I I I I I I I I I I I II I I I I jl2
10
t w 8
~ ... 8 ~ X
~ 4
i 2
(!) E:lCTINGUIStlo4 8 <S,;.qlij
1~ -liD 14j
rJt ?u~? ·8
II
0: .I I ). ~~ I I I •I 1'-H· ' ' I I I I 1 I I I I I I 1 I I I
Figure~ <2 <
Comparison of rate of heat release histories for polyisocyanurate (tests 9, 13, and 14)
\
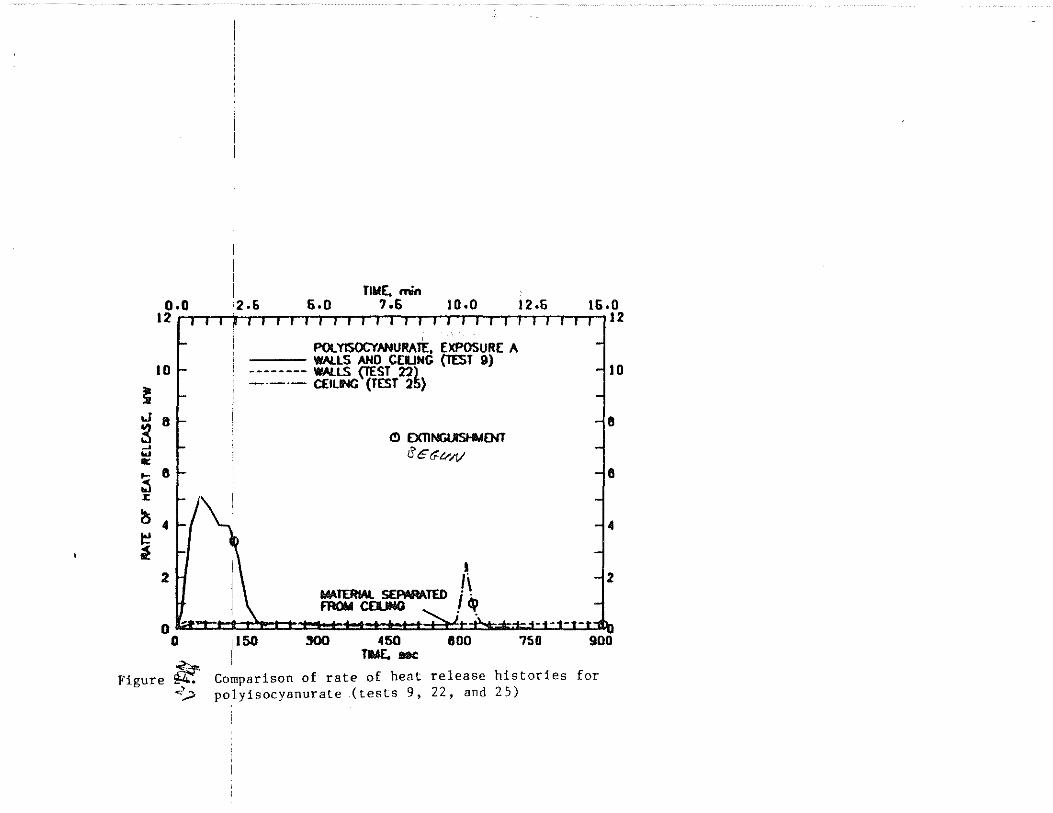
~
o.o 12
10 I
rf ,_ 8 ~ J:
l'5 41--/
i 2
'----
I I TIME. min 12 ,fi 6.0 7.6 to.o
I I
POLYISOCY~URATE, EXPOSURE A WAlLS AND CEUNG {TEST 9)
-------- WAlLS ~ST 22~ -·-·- CEILING (TEST 2 )
<!l EXllNGIJISHI,IENT eer;vN
..-.TERIAL S£PII.RAT£1) FROM CEI.lNO
l . \
12.6 16.0 .-.12
-ll 0
-ll!
-l6
-l4
2
Iii? 0 fa=tt I 1\f I I I I I 1-t-t I t-+..f:::tJ-H,#±;t-1-1-1-t~
Figure
0
te <~ _...-
1150
I !100 450
TN£. lli8C 800 750 900
Comparison of rate of heat release histories for polyisocyanurate (tests 9, 22, and 25)
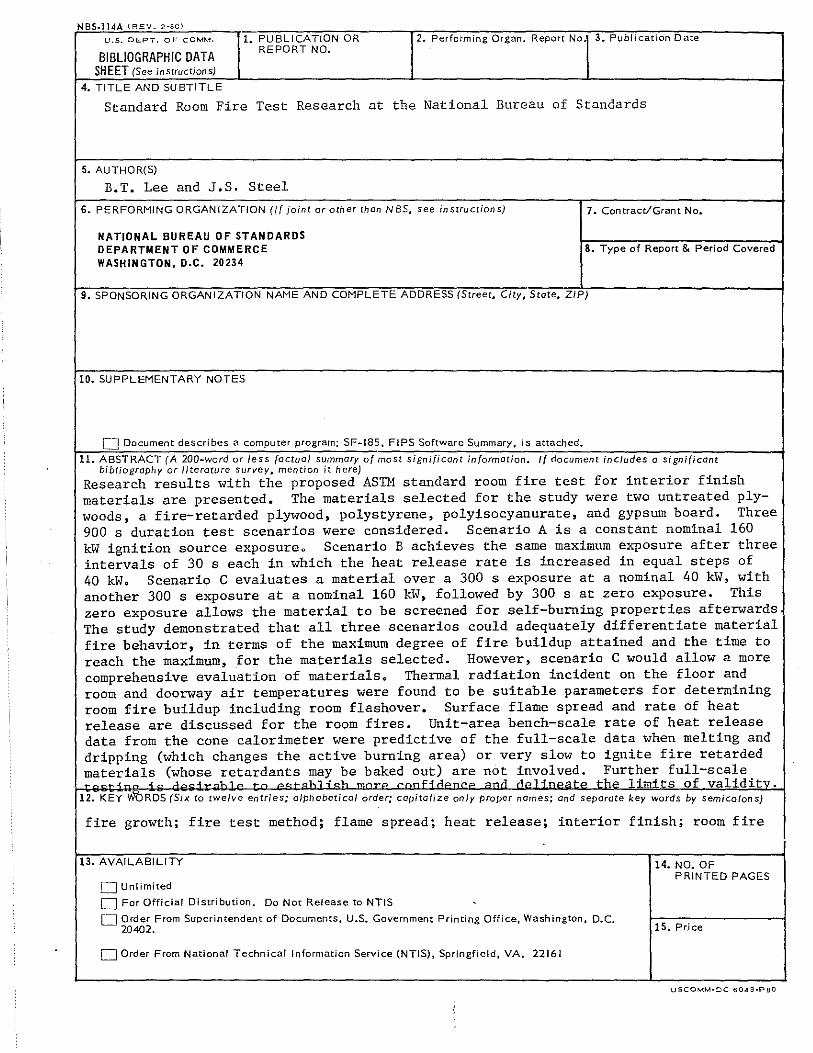
NBS ll4A (RE . V. 2·8C
U.S. DEPT. OF COMM. 1. PUBLICATION OR 2. Performing Organ. Report No 3. Publication Date
BIBLIOGRAPHIC DATA REPORT NO.
SHEET (See instructions)
4. TITLE AND SUBTITLE
Standard Room Fire Test Research at the National Bureau of Standards
5. AUTHOR(S)
B.T. Lee and J.S. Steel
6. PERFORMING ORGANIZATION (I{ joint or other than NBS, see instructions) 7. Con trace/Grant No.
NATIONAL BUREAU OF STANDARDS DEPARTMENT OF COMMERCE 8. Type of Report & Period Covered
WASHINGTON, D.C. 20234
9. SPONSORING ORGANIZATION NAME AND COMPLETE ADDRESS (Street, City, State, ZIP)
10. SUPPLEMENTARY NOTES
D Document describes a computer program; SFwl85, F!PS Software Summary, is attached.
11. ABSTRACT (A 200wword or less factual summary of most significant information. I{ document includes a significant bibliography or literature survey, mention it here)
Research results with the proposed ASTM standard room fire test for interior finish materials are presented, The materials selected for the study were two untreated ply-woods, a fire-retarded plywood, polystyrene, polyisocyanurate, and gypsum board. Three 900 s duration test scenarios were considered. Scenario A is a constant nominal 160 kW ignition source exposureo Scenario B achieves the same maximum exposure after three intervals of 30 s each in which the heat release rate is increased in equal steps of 40 kWo Scenario C evaluates a material over a 300 s exposure at a nominal 40 kW, with another 300 s exposure at a nominal 160 kW, followed by 300 s at zero exposure. This zero exposure allows the material to be screened for self-burning properties afterwards The study demonstrated that all three scenarios could adequately differentiate material fire behavior, in terms of the maximum degree of fire buildup attained and the time to reach the maximum, . for the materials selected. However, scenario C would allow a more comprehensive evaluation of materialso Thermal radiation incident on the floor and room and doorway air temperatures were found to be suitable parameters for determining room fire buildup including room flashover. Surface flame spread and rate of heat release are discussed for the room fires. Unit-area bench-scale rate of heat release data from the cone calorimeter were predictive of the full-scale data when melting and dripping (which changes the active burning area) or very slow to ignite fire retarded materials (whose retardant~o~~y be baked out) are not involved. r~~r7~~r full-scale
or< < A.,~<~o>-1a rn a~r "o> ,HAn •n ~nil AaHnaora 1 mits of validitv. 12. KEY W"ORDS (Six to twelve entries; alphabetical ord_er; capitalize only proper names; and separate k,ey words by semicolons)
fire growth; fire test method; flame spread; heat release; interior finish; room fire
13. AVAILABILITY 14. NO. OF PRINTED PAGES
D Unlimited
0 For Official Distribution. Do Not Release to NTIS . D Order From Superintendent of Documents, U.S. Government Printing Office Washington 0 C
20402. • • • • 15. Price
D Order From National Technical Information Service (NTIS). Springfield, VA, 22161