ASU Health Services Expansion and Renovations Tempe, Arizona LEED-NC v3 Energy Analysis Report . Provided by May 2013

Welcome message from author
This document is posted to help you gain knowledge. Please leave a comment to let me know what you think about it! Share it to your friends and learn new things together.
Transcript
ASU Health Services Expansion and Renovations
Tempe, Arizona
LEED-NC v3
Energy Analysis Report
.
Provided by
May 2013
hholdridge
Rectangle
ii ASU Health Services Expansion and Renovation
LEED-NC 3 Energy Analysis Report May 2013
Contents I. Introduction .......................................................................................................................................... 3
II. Background ........................................................................................................................................... 3
III. Methodology ......................................................................................................................................... 3
IV. Building Description .............................................................................................................................. 4
A. Operation .......................................................................................................................................... 6 B. Envelope ............................................................................................................................................ 6
1. Exterior Walls ................................................................................................................................ 6 2. Roofs ............................................................................................................................................. 6 3. Glass .............................................................................................................................................. 6
C. Interior Lighting ................................................................................................................................. 7 D. Exterior Lighting ................................................................................................................................ 8 E. HVAC ................................................................................................................................................. 8 F. Renewable Energy Sources ............................................................................................................... 9 G. Utility Rates ....................................................................................................................................... 9
V. Modeling Summary ............................................................................................................................. 10
VI. Analysis Results ................................................................................................................................... 12
VII. LEED Calculations ................................................................................................................................ 13
VIII. Appendices .......................................................................................................................................... 14
A. Envelope Requirements .................................................................................................................. 14 B. Lighting Calculations ....................................................................................................................... 15 C. Output Summary Reports ............................................................................................................... 18
1. Baseline – BEPS ........................................................................................................................... 18 2. Baseline – BEPU .......................................................................................................................... 19 3. Baseline – ES-D ............................................................................................................................ 19 4. Proposed – BEPS ......................................................................................................................... 20 5. Proposed – BEPU ......................................................................................................................... 21 6. Proposed – ES-D .......................................................................................................................... 21
hholdridge
Rectangle
3 ASU Health Services Expansion and Renovation
LEED-NC 3 Energy Analysis Report May 2013
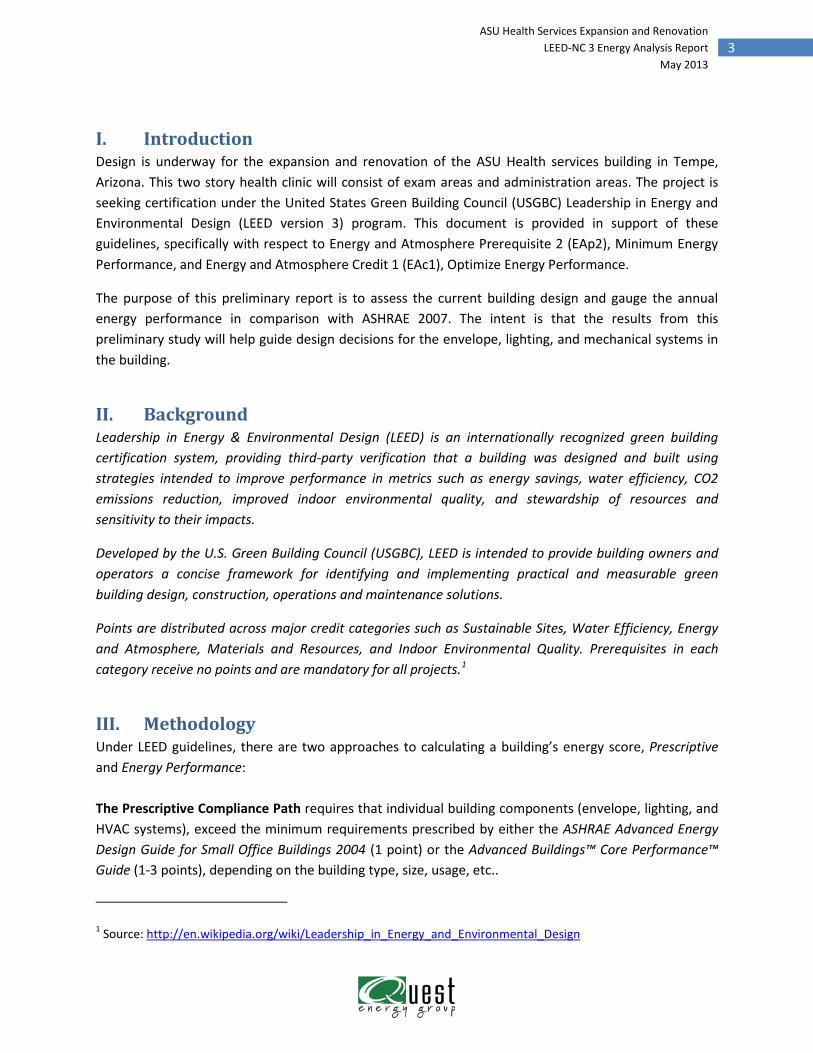
I. Introduction Design is underway for the expansion and renovation of the ASU Health services building in Tempe, Arizona. This two story health clinic will consist of exam areas and administration areas. The project is seeking certification under the United States Green Building Council (USGBC) Leadership in Energy and Environmental Design (LEED version 3) program. This document is provided in support of these guidelines, specifically with respect to Energy and Atmosphere Prerequisite 2 (EAp2), Minimum Energy Performance, and Energy and Atmosphere Credit 1 (EAc1), Optimize Energy Performance.
The purpose of this preliminary report is to assess the current building design and gauge the annual energy performance in comparison with ASHRAE 2007. The intent is that the results from this preliminary study will help guide design decisions for the envelope, lighting, and mechanical systems in the building.
II. Background Leadership in Energy & Environmental Design (LEED) is an internationally recognized green building certification system, providing third-party verification that a building was designed and built using strategies intended to improve performance in metrics such as energy savings, water efficiency, CO2 emissions reduction, improved indoor environmental quality, and stewardship of resources and sensitivity to their impacts.
Developed by the U.S. Green Building Council (USGBC), LEED is intended to provide building owners and operators a concise framework for identifying and implementing practical and measurable green building design, construction, operations and maintenance solutions.
Points are distributed across major credit categories such as Sustainable Sites, Water Efficiency, Energy and Atmosphere, Materials and Resources, and Indoor Environmental Quality. Prerequisites in each category receive no points and are mandatory for all projects.1
III. Methodology
Under LEED guidelines, there are two approaches to calculating a building’s energy score, Prescriptive and Energy Performance: The Prescriptive Compliance Path requires that individual building components (envelope, lighting, and HVAC systems), exceed the minimum requirements prescribed by either the ASHRAE Advanced Energy Design Guide for Small Office Buildings 2004 (1 point) or the Advanced Buildings™ Core Performance™ Guide (1-3 points), depending on the building type, size, usage, etc..
1 Source: http://en.wikipedia.org/wiki/Leadership_in_Energy_and_Environmental_Design
hholdridge
Rectangle
4 ASU Health Services Expansion and Renovation
LEED-NC 3 Energy Analysis Report May 2013
The Energy Performance Path (Whole Building Energy Simulation) requires an improvement in energy usage be demonstrated with an energy model of the building that follows the Building Performance Rating Method found in Appendix G of ASHRAE 90.1-2007. Using the Energy Performance Path, an hourly building simulation model was developed using the eQUEST (DOE2.2) computer software. The features of the baseline building model are minimally compliant with ASHRAE 90.1-2007 Appendix G. Improvements to this model are then made to reflect design improvements to the building’s envelope, lighting, and HVAC systems that have been incorporated into the as-proposed building. The energy cost savings between the ASHRAE 90.1 benchmark building and the as-designed building are then used to determine the number of Energy Optimization Credits. Long term hourly weather data (TMY 3) was used for the analysis.
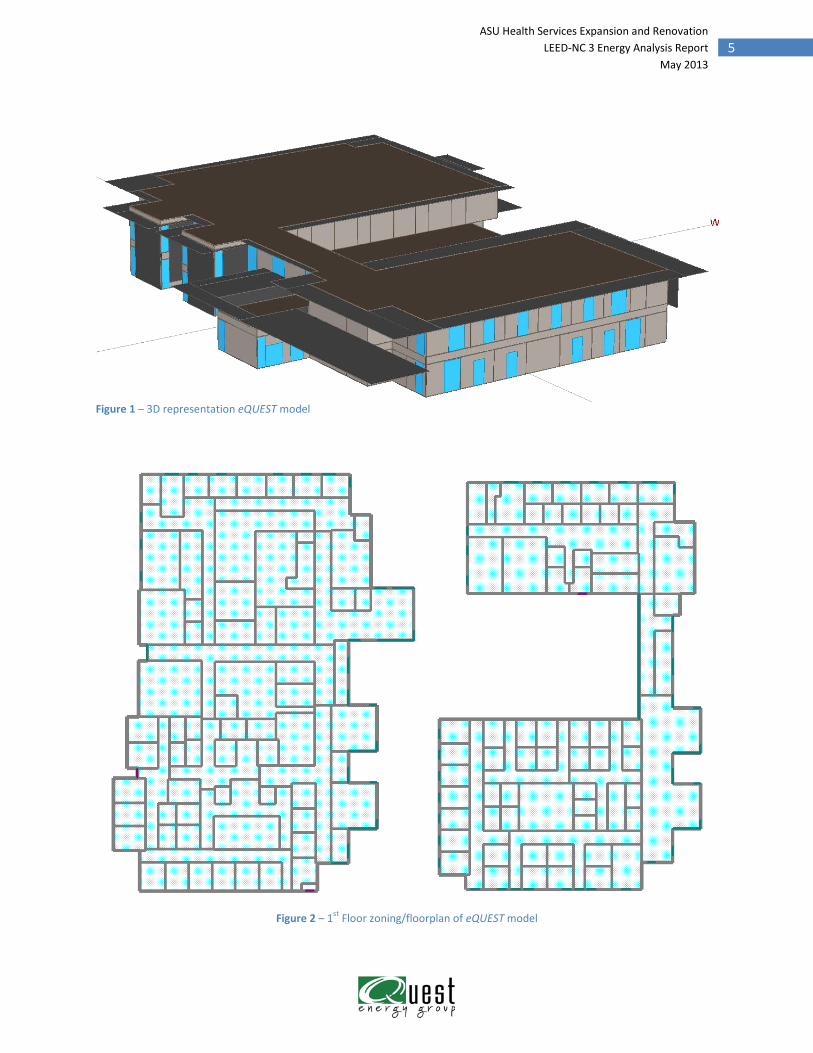
IV. Building Description The ASU Health Services building is a two-story facility consisting primarily of exam rooms and administration areas. The project totals approximately 34,300 sqft.
Figure 1 below shows the 3D schematic of the model, while the zoning/floorplan can be seen in Figure 2. Additional building information is found in the following sections.
hholdridge
Rectangle
5 ASU Health Services Expansion and Renovation
LEED-NC 3 Energy Analysis Report May 2013
Figure 1 – 3D representation eQUEST model
Figure 2 – 1st Floor zoning/floorplan of eQUEST model
hholdridge
Rectangle
6 ASU Health Services Expansion and Renovation
LEED-NC 3 Energy Analysis Report May 2013
A. Operation This building is operated on a year round basis, 7am to 6pm Monday through Friday, except federal holidays.
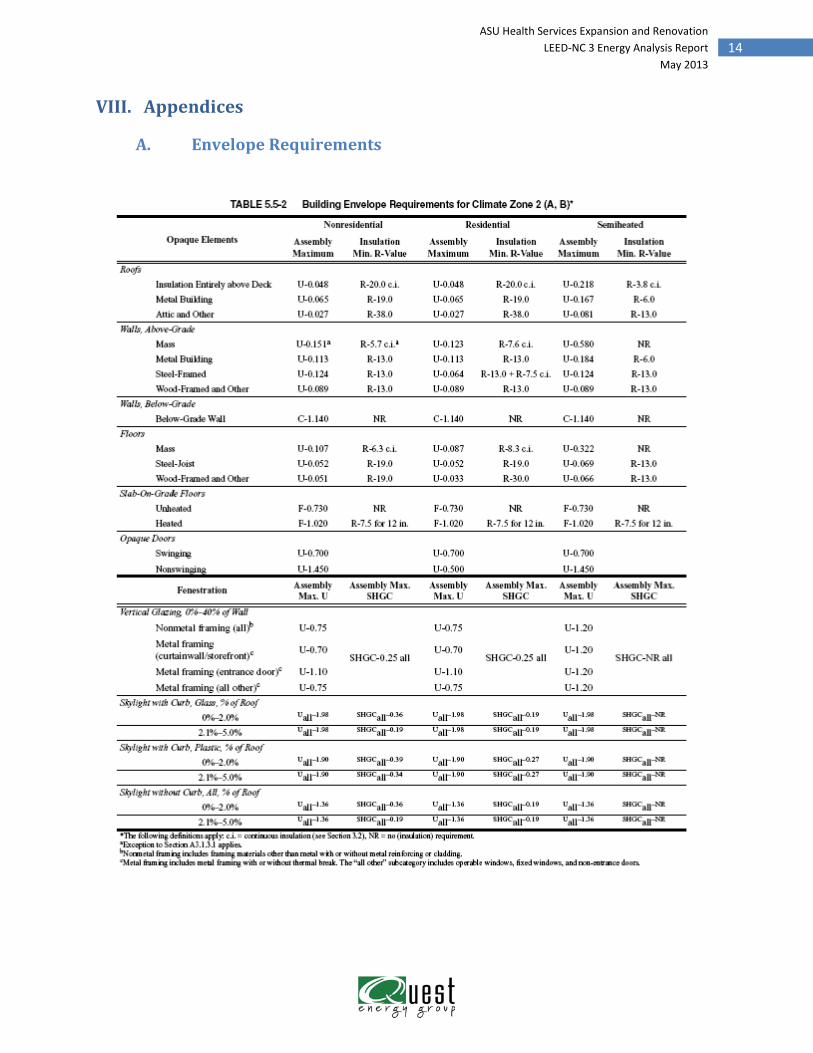
B. Envelope The building is located in Tempe, Arizona, which is in ASHRAE Climate Zone 2B. The ASHRAE climate zone dictates which envelope table is used, and subsequently the minimum insulation required. A summary of all the envelope components of the Proposed and Baseline buildings is provided below:
1. Exterior Walls
The baseline Appendix G construction is a steel-framed exterior wall with R-13 batt insulation (U-0.124 Btu/h-ft2-°F).
Baseline
The proposed exterior wall construction utilizes 1.5” rigid insulation on steel studs 16” on center with R-19 batt insulation, and finished with gyp board (U-value 0.074). On existing areas of the building the walls will be block furred out with R-13 batt insulation (U-value 0.115).
Proposed
2. Roofs
The baseline Appendix G LEED Construction is built-up roof with R-20 continuous insulation above deck (U-0.048 Btu/h-ft2-°F).
Baseline
The proposed roof construction utilizes a build up roof with R-30 insulation (U-0.037 Btu/h-ft2-°F).
Proposed
3. Glass
The baseline Appendix G LEED glazing has an assembly U-value of 0.75 and a SHGC of 0.25.
Baseline
A high performance Low-E glass is utilized in the proposed glazing system. This glazing has center of glass (CoG) U-value of 0.29 and a solar heat gain coefficient (SHGC) of 0.31. The overall window-to-wall ratio for the building is approximately 18%. Frames were modeled explicitly in eQUEST.
Proposed
hholdridge
Rectangle
7 ASU Health Services Expansion and Renovation
LEED-NC 3 Energy Analysis Report May 2013
C. Interior Lighting
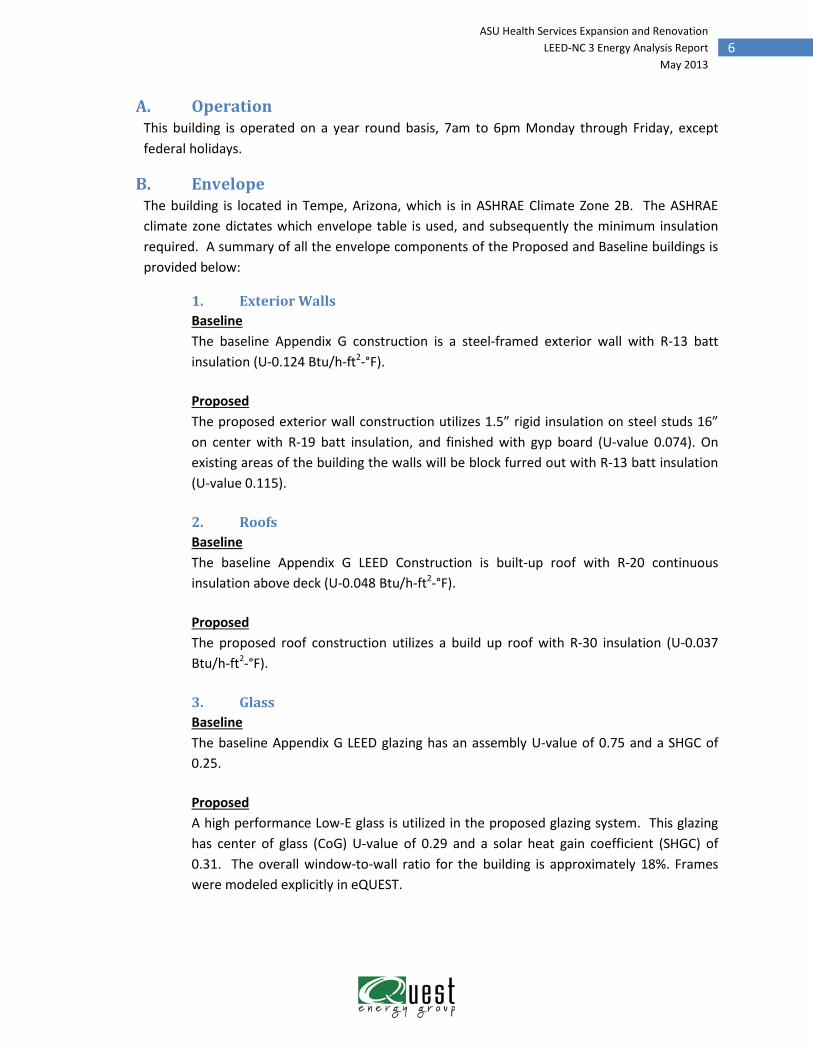
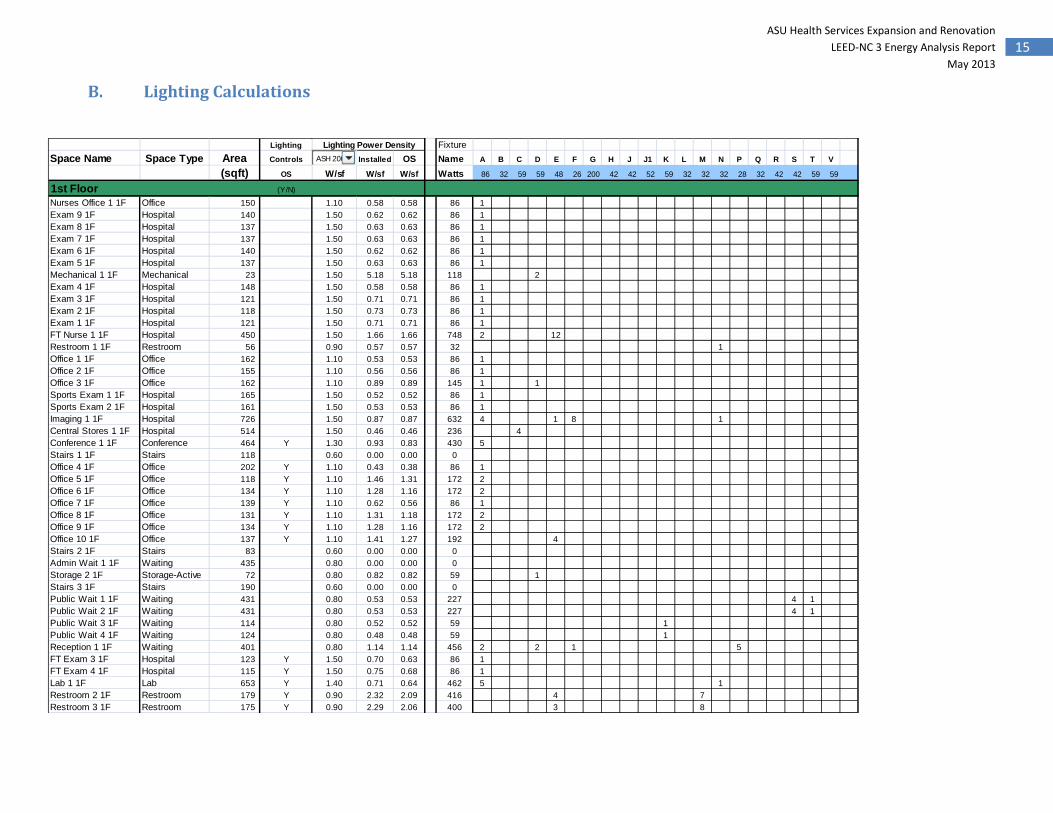
The ASHRAE 90.-2007 lighting budget was determined using the “Space-by-Space” method which assigns a maximum allowable lighting power density (LPD) based on the space type or function. The overall baseline LPD is 1.12 W/sqft.
Baseline
The proposed lighting design utilizes high efficiency T-8 fixtures in an optimized layout, yielding an overall building LPD of 0.88 W/sqft (a 21% improvement over ASHRAE 90.1-2007).
Proposed
The proposed lighting design also includes occupancy sensors. For these sensors, a ten percent lighting power credit is allowed by Appendix G and applied to all lighting connected to occupancy sensors. Occupancy sensors are required in all conference rooms and must be modeled with occupancy sensors in both the baseline and as design models.
Figure below shows the comparison of the Baseline and Proposed lighting power densities.
1.12 0.92 0.88
-
0.20
0.40
0.60
0.80
1.00
1.20
ASH 2007 Installed OS
Ove
rall
Bui
ldin
g Li
ghtin
g (W
/sf)
Figure 3 – Baseline vs. Proposed lighting power density
hholdridge
Rectangle
8 ASU Health Services Expansion and Renovation
LEED-NC 3 Energy Analysis Report May 2013
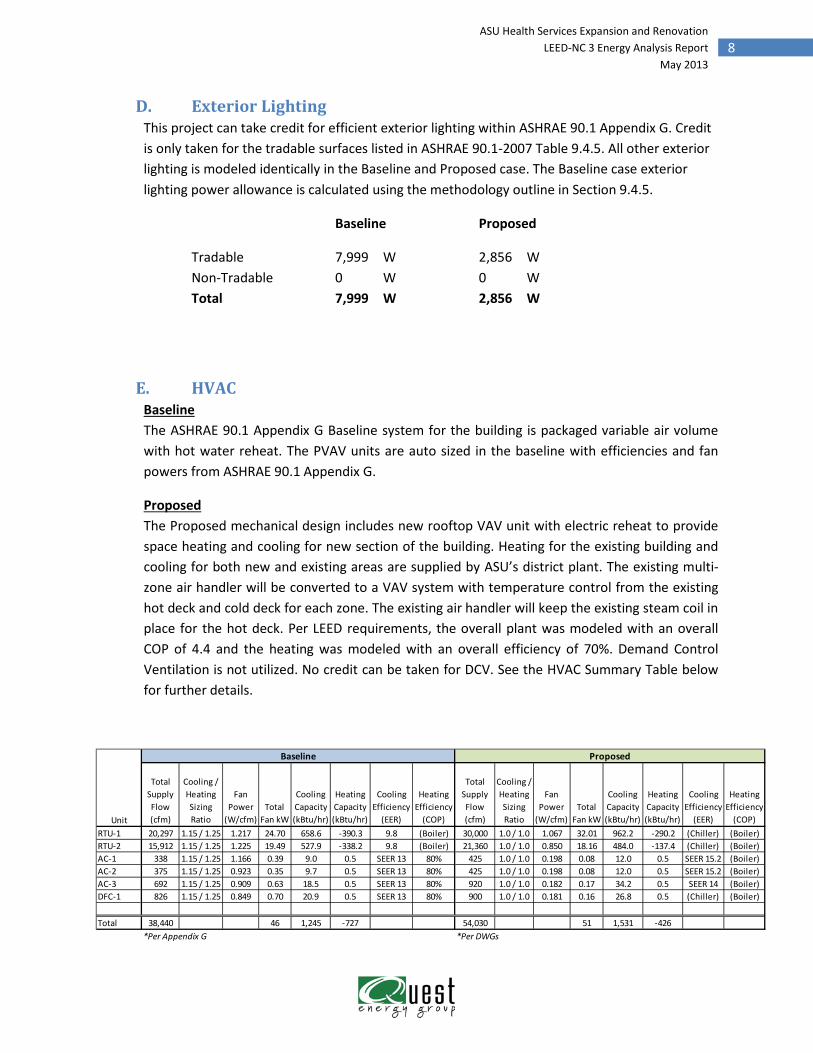
D. Exterior Lighting This project can take credit for efficient exterior lighting within ASHRAE 90.1 Appendix G. Credit is only taken for the tradable surfaces listed in ASHRAE 90.1-2007 Table 9.4.5. All other exterior lighting is modeled identically in the Baseline and Proposed case. The Baseline case exterior lighting power allowance is calculated using the methodology outline in Section 9.4.5.
Baseline Proposed
Tradable 7,999 W 2,856 W Non-Tradable 0 W 0 W Total 7,999 W 2,856 W
E. HVAC
The ASHRAE 90.1 Appendix G Baseline system for the building is packaged variable air volume with hot water reheat. The PVAV units are auto sized in the baseline with efficiencies and fan powers from ASHRAE 90.1 Appendix G.
Baseline
The Proposed mechanical design includes new rooftop VAV unit with electric reheat to provide space heating and cooling for new section of the building. Heating for the existing building and cooling for both new and existing areas are supplied by ASU’s district plant. The existing multi-zone air handler will be converted to a VAV system with temperature control from the existing hot deck and cold deck for each zone. The existing air handler will keep the existing steam coil in place for the hot deck. Per LEED requirements, the overall plant was modeled with an overall COP of 4.4 and the heating was modeled with an overall efficiency of 70%. Demand Control Ventilation is not utilized. No credit can be taken for DCV. See the HVAC Summary Table below for further details.
Proposed
Total Supply Flow (cfm)
Cooling / Heating Sizing Ratio
Fan Power
(W/cfm)Total
Fan kW
Cooling Capacity (kBtu/hr)
Heating Capacity (kBtu/hr)
Cooling Efficiency
(EER)
Heating Efficiency
(COP)
Total Supply Flow (cfm)
Cooling / Heating Sizing Ratio
Fan Power
(W/cfm)Total
Fan kW
Cooling Capacity (kBtu/hr)
Heating Capacity (kBtu/hr)
Cooling Efficiency
(EER)
Heating Efficiency
(COP)RTU-1 20,297 1.15 / 1.25 1.217 24.70 658.6 -390.3 9.8 (Boiler) 30,000 1.0 / 1.0 1.067 32.01 962.2 -290.2 (Chiller) (Boiler)RTU-2 15,912 1.15 / 1.25 1.225 19.49 527.9 -338.2 9.8 (Boiler) 21,360 1.0 / 1.0 0.850 18.16 484.0 -137.4 (Chiller) (Boiler)AC-1 338 1.15 / 1.25 1.166 0.39 9.0 0.5 SEER 13 80% 425 1.0 / 1.0 0.198 0.08 12.0 0.5 SEER 15.2 (Boiler)AC-2 375 1.15 / 1.25 0.923 0.35 9.7 0.5 SEER 13 80% 425 1.0 / 1.0 0.198 0.08 12.0 0.5 SEER 15.2 (Boiler)AC-3 692 1.15 / 1.25 0.909 0.63 18.5 0.5 SEER 13 80% 920 1.0 / 1.0 0.182 0.17 34.2 0.5 SEER 14 (Boiler)DFC-1 826 1.15 / 1.25 0.849 0.70 20.9 0.5 SEER 13 80% 900 1.0 / 1.0 0.181 0.16 26.8 0.5 (Chiller) (Boiler)
Total 38,440 46 1,245 -727 54,030 51 1,531 -426*Per Appendix G *Per DWGs
Proposed
Unit
Baseline
hholdridge
Rectangle
9 ASU Health Services Expansion and Renovation
LEED-NC 3 Energy Analysis Report May 2013
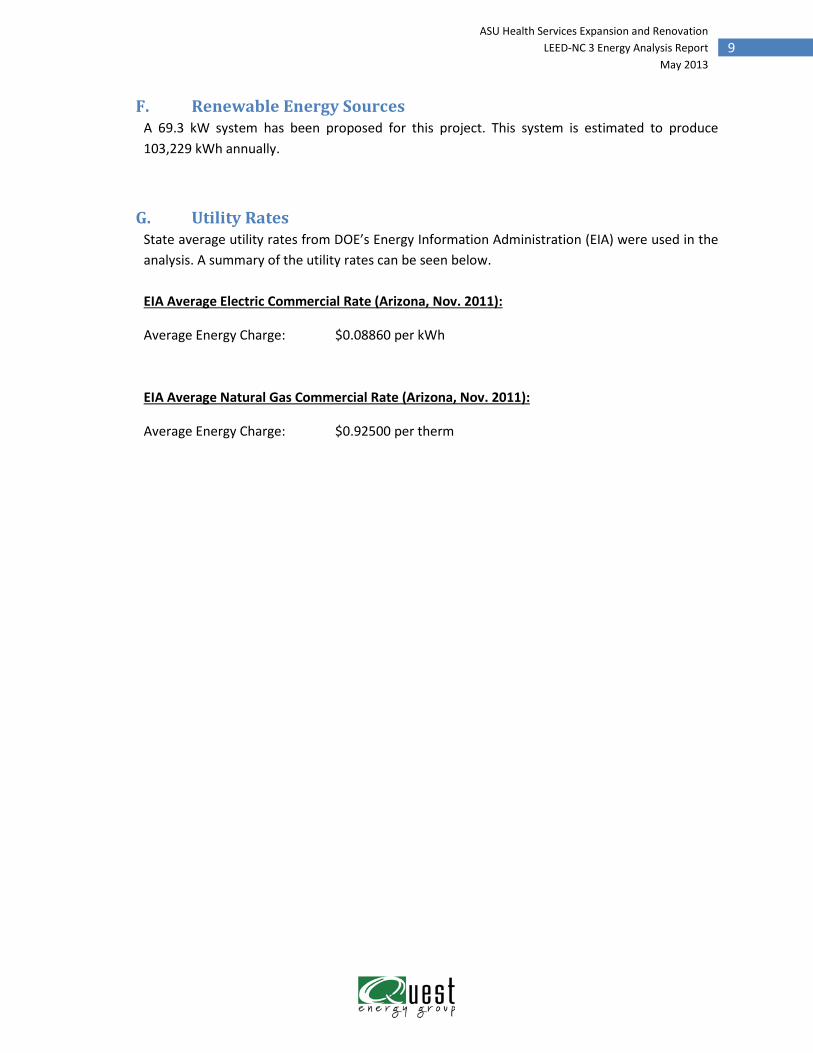
F. Renewable Energy Sources A 69.3 kW system has been proposed for this project. This system is estimated to produce 103,229 kWh annually.
G. Utility Rates State average utility rates from DOE’s Energy Information Administration (EIA) were used in the analysis. A summary of the utility rates can be seen below.
Average Energy Charge: $0.08860 per kWh
EIA Average Electric Commercial Rate (Arizona, Nov. 2011):
Average Energy Charge: $0.92500 per therm
EIA Average Natural Gas Commercial Rate (Arizona, Nov. 2011):
hholdridge
Rectangle
10 ASU Health Services Expansion and Renovation
LEED-NC 3 Energy Analysis Report May 2013
V. Modeling Summary
A total of five simulations were done beginning with the minimum ASHRAE 90.1-2007 baseline model (blue background). Each run was done incrementally incorporating the features of the previous run. The final run (green background) represents the as-designed building. Note that the intermediate runs are provided for information purposes to assess the relative impact of each building system. LEED credit calculations are done only between the ASHRAE base and the final HVAC run.
The inputs and assumptions of the simulation order described below can be found in Table 2:
ASHRAE: Minimum ASHRAE 90.1-2007 model E-1: ASHRAE 90.1 plus Envelope
L-1: E-1 plus Lighting M-1: L-1 plus Mechanical R-1: M-1 plus PV System
hholdridge
Rectangle
11 ASU Health Services Expansion and Renovation
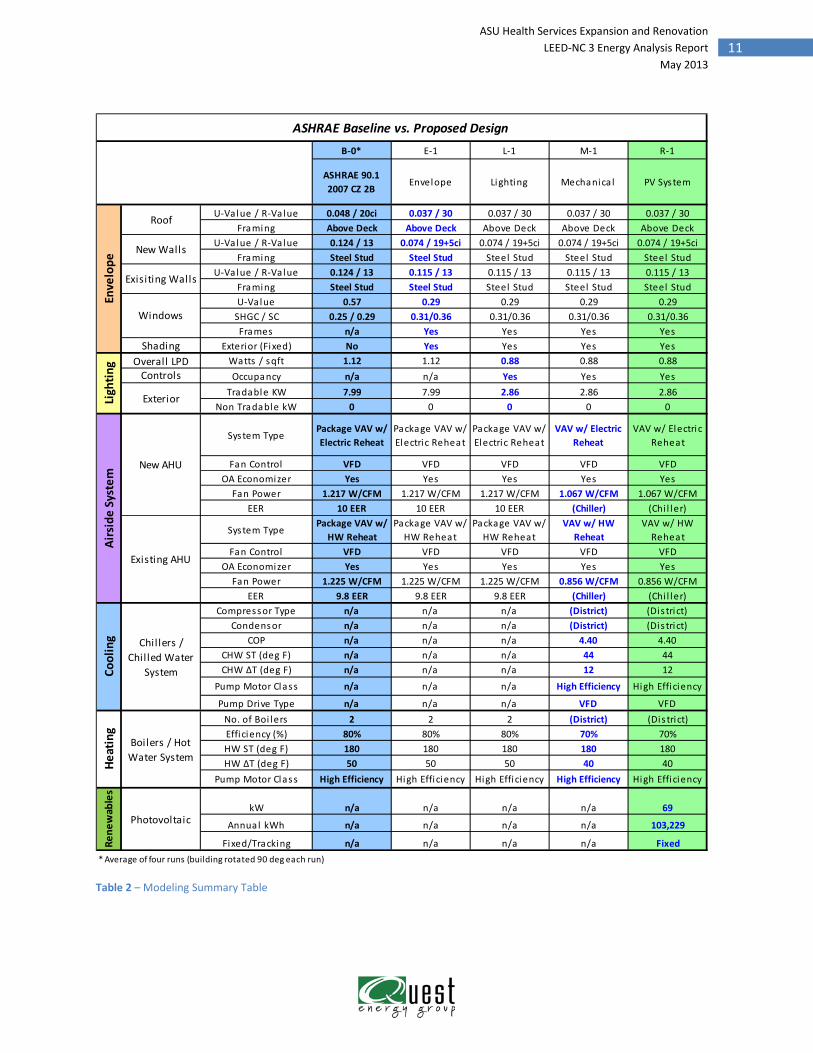
LEED-NC 3 Energy Analysis Report May 2013
B-0* E-1 L-1 M-1 R-1
ASHRAE 90.1 2007 CZ 2B
Envelope Lighting Mechanica l PV System
U-Value / R-Value 0.048 / 20ci 0.037 / 30 0.037 / 30 0.037 / 30 0.037 / 30Framing Above Deck Above Deck Above Deck Above Deck Above Deck
U-Value / R-Value 0.124 / 13 0.074 / 19+5ci 0.074 / 19+5ci 0.074 / 19+5ci 0.074 / 19+5ciFraming Steel Stud Steel Stud Steel Stud Steel Stud Steel Stud
U-Value / R-Value 0.124 / 13 0.115 / 13 0.115 / 13 0.115 / 13 0.115 / 13Framing Steel Stud Steel Stud Steel Stud Steel Stud Steel StudU-Value 0.57 0.29 0.29 0.29 0.29
SHGC / SC 0.25 / 0.29 0.31/0.36 0.31/0.36 0.31/0.36 0.31/0.36Frames n/a Yes Yes Yes Yes
Shading Exterior (Fixed) No Yes Yes Yes YesOverall LPD Watts / sqft 1.12 1.12 0.88 0.88 0.88
Occupancy n/a n/a Yes Yes YesTradable KW 7.99 7.99 2.86 2.86 2.86
Non Tradable kW 0 0 0 0 0
System TypePackage VAV w/ Electric Reheat
Package VAV w/ Electric Reheat
Package VAV w/ Electric Reheat
VAV w/ Electric Reheat
VAV w/ Electric Reheat
Fan Control VFD VFD VFD VFD VFDOA Economizer Yes Yes Yes Yes Yes
Fan Power 1.217 W/CFM 1.217 W/CFM 1.217 W/CFM 1.067 W/CFM 1.067 W/CFMEER 10 EER 10 EER 10 EER (Chiller) (Chi l ler)
System TypePackage VAV w/
HW ReheatPackage VAV w/
HW ReheatPackage VAV w/
HW ReheatVAV w/ HW
ReheatVAV w/ HW
ReheatFan Control VFD VFD VFD VFD VFD
OA Economizer Yes Yes Yes Yes YesFan Power 1.225 W/CFM 1.225 W/CFM 1.225 W/CFM 0.856 W/CFM 0.856 W/CFM
EER 9.8 EER 9.8 EER 9.8 EER (Chiller) (Chi l ler)Compressor Type n/a n/a n/a (District) (Dis trict)
Condensor n/a n/a n/a (District) (Dis trict)COP n/a n/a n/a 4.40 4.40
CHW ST (deg F) n/a n/a n/a 44 44CHW ΔT (deg F) n/a n/a n/a 12 12
Pump Motor Class n/a n/a n/a High Efficiency High Efficiency
Pump Drive Type n/a n/a n/a VFD VFDNo. of Boi lers 2 2 2 (District) (Dis trict)Efficiency (%) 80% 80% 80% 70% 70%HW ST (deg F) 180 180 180 180 180HW ΔT (deg F) 50 50 50 40 40
Pump Motor Class High Efficiency High Efficiency High Efficiency High Efficiency High Efficiency
kW n/a n/a n/a n/a 69
Annual kWh n/a n/a n/a n/a 103,229
Fixed/Tracking n/a n/a n/a n/a Fixed* Average of four runs (building rotated 90 deg each run)
Cool
ing Chillers /
Chil led Water System
Heat
ing
Boilers / Hot Water System
ASHRAE Baseline vs. Proposed DesignRe
new
able
s
Photovoltaic
Ligh
ting
Controls
Exterior
Airs
ide
Syst
em
New AHU
Existing AHU
Enve
lope
Roof
New Walls
Exisiting Walls
Windows
Table 2 – Modeling Summary Table
hholdridge
Rectangle
12 ASU Health Services Expansion and Renovation
LEED-NC 3 Energy Analysis Report May 2013
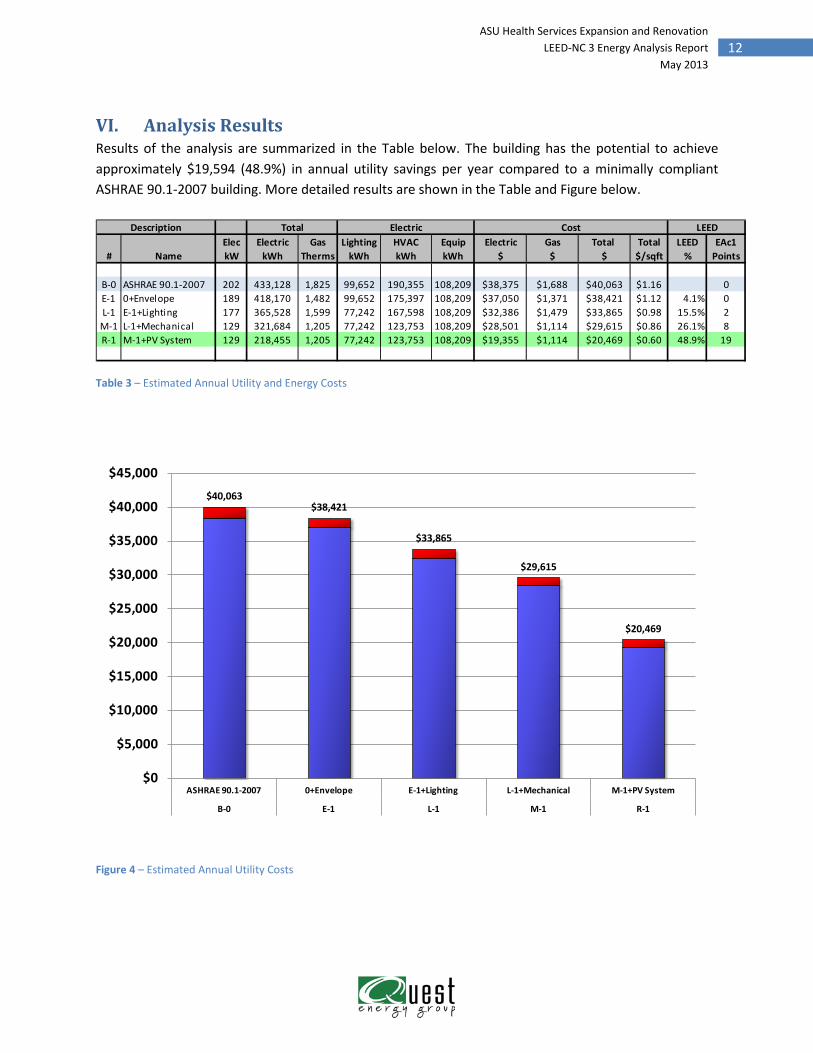
VI. Analysis Results Results of the analysis are summarized in the Table below. The building has the potential to achieve approximately $19,594 (48.9%) in annual utility savings per year compared to a minimally compliant ASHRAE 90.1-2007 building. More detailed results are shown in the Table and Figure below.
Elec Electric Gas Lighting HVAC Equip Electric Gas Total Total LEED EAc1# Name kW kWh Therms kWh kWh kWh $ $ $ $/sqft % Points
B-0 ASHRAE 90.1-2007 202 433,128 1,825 99,652 190,355 108,209 $38,375 $1,688 $40,063 $1.16 0E-1 0+Envelope 189 418,170 1,482 99,652 175,397 108,209 $37,050 $1,371 $38,421 $1.12 4.1% 0L-1 E-1+Lighting 177 365,528 1,599 77,242 167,598 108,209 $32,386 $1,479 $33,865 $0.98 15.5% 2
M-1 L-1+Mechanical 129 321,684 1,205 77,242 123,753 108,209 $28,501 $1,114 $29,615 $0.86 26.1% 8R-1 M-1+PV System 129 218,455 1,205 77,242 123,753 108,209 $19,355 $1,114 $20,469 $0.60 48.9% 19
LEEDDescription Total Electric Cost
Table 3 – Estimated Annual Utility and Energy Costs
$40,063$38,421
$33,865
$29,615
$20,469
$0
$5,000
$10,000
$15,000
$20,000
$25,000
$30,000
$35,000
$40,000
$45,000
ASHRAE 90.1-2007 0+Envelope E-1+Lighting L-1+Mechanical M-1+PV System
B-0 E-1 L-1 M-1 R-1
Figure 4 – Estimated Annual Utility Costs
hholdridge
Rectangle
13 ASU Health Services Expansion and Renovation
LEED-NC 3 Energy Analysis Report May 2013
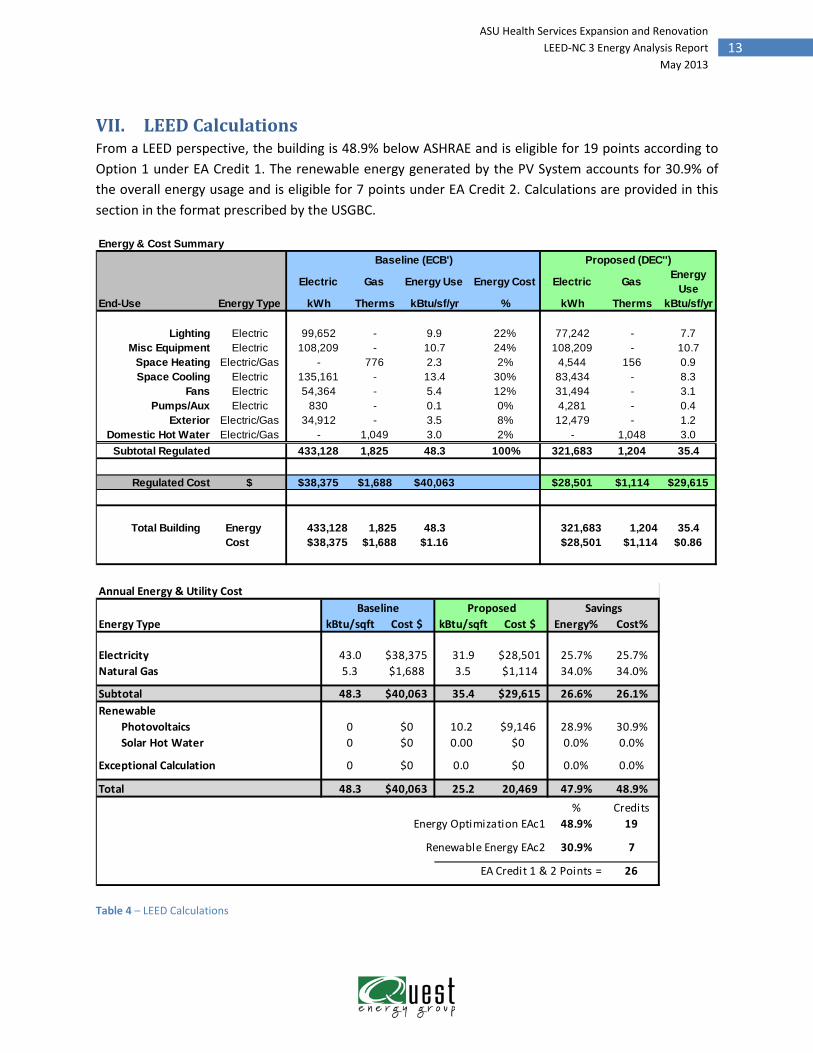
VII. LEED Calculations From a LEED perspective, the building is 48.9% below ASHRAE and is eligible for 19 points according to Option 1 under EA Credit 1. The renewable energy generated by the PV System accounts for 30.9% of the overall energy usage and is eligible for 7 points under EA Credit 2. Calculations are provided in this section in the format prescribed by the USGBC.
Energy & Cost Summary
Electric Gas Energy Use Energy Cost Electric Gas Energy Use
End-Use Energy Type kWh Therms kBtu/sf/yr % kWh Therms kBtu/sf/yr
Lighting Electric 99,652 - 9.9 22% 77,242 - 7.7Misc Equipment Electric 108,209 - 10.7 24% 108,209 - 10.7
Space Heating Electric/Gas - 776 2.3 2% 4,544 156 0.9Space Cooling Electric 135,161 - 13.4 30% 83,434 - 8.3
Fans Electric 54,364 - 5.4 12% 31,494 - 3.1Pumps/Aux Electric 830 - 0.1 0% 4,281 - 0.4
Exterior Electric/Gas 34,912 - 3.5 8% 12,479 - 1.2Domestic Hot Water Electric/Gas - 1,049 3.0 2% - 1,048 3.0
Subtotal Regulated 433,128 1,825 48.3 100% 321,683 1,204 35.4
Regulated Cost $ $38,375 $1,688 $40,063 $28,501 $1,114 $29,615
Total Building Energy 433,128 1,825 48.3 321,683 1,204 35.4Cost $38,375 $1,688 $1.16 $28,501 $1,114 $0.86
Baseline (ECB') Proposed (DEC'')
Annual Energy & Utility Cost
Energy Type kBtu/sqft Cost $ kBtu/sqft Cost $ Energy% Cost%
Electricity 43.0 $38,375 31.9 $28,501 25.7% 25.7%Natural Gas 5.3 $1,688 3.5 $1,114 34.0% 34.0%
Subtotal 48.3 $40,063 35.4 $29,615 26.6% 26.1%Renewable Photovoltaics 0 $0 10.2 $9,146 28.9% 30.9% Solar Hot Water 0 $0 0.00 $0 0.0% 0.0%
Exceptional Calculation 0 $0 0.0 $0 0.0% 0.0%
Total 48.3 $40,063 25.2 20,469 47.9% 48.9%% Credits
48.9% 19
30.9% 7
26
Energy Optimization EAc1
Renewable Energy EAc2
SavingsBaseline Proposed
EA Credit 1 & 2 Points =
Table 4 – LEED Calculations
hholdridge
Rectangle
14 ASU Health Services Expansion and Renovation
LEED-NC 3 Energy Analysis Report May 2013
VIII. Appendices
A. Envelope Requirements
hholdridge
Rectangle
15 ASU Health Services Expansion and Renovation
LEED-NC 3 Energy Analysis Report May 2013
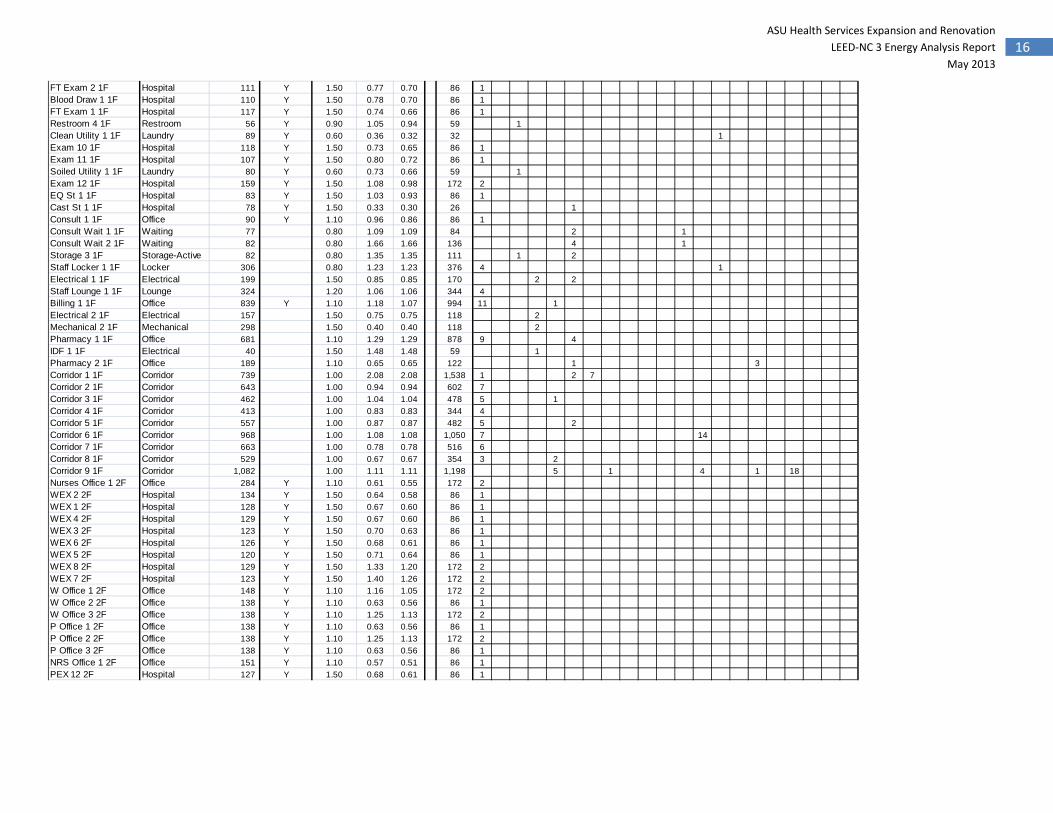
B. Lighting Calculations
FixtureSpace Name Space Type Area 2 Installed OS Name A B C D E F G H J J1 K L M N P Q R S T V
(sqft) OS W/sf W/sf W/sf Watts 86 32 59 59 48 26 200 42 42 52 59 32 32 32 28 32 42 42 59 59
1st Floor (Y/N)
Nurses Office 1 1F Office 150 1.10 0.58 0.58 86 1Exam 9 1F Hospital 140 1.50 0.62 0.62 86 1Exam 8 1F Hospital 137 1.50 0.63 0.63 86 1Exam 7 1F Hospital 137 1.50 0.63 0.63 86 1Exam 6 1F Hospital 140 1.50 0.62 0.62 86 1Exam 5 1F Hospital 137 1.50 0.63 0.63 86 1Mechanical 1 1F Mechanical 23 1.50 5.18 5.18 118 2Exam 4 1F Hospital 148 1.50 0.58 0.58 86 1Exam 3 1F Hospital 121 1.50 0.71 0.71 86 1Exam 2 1F Hospital 118 1.50 0.73 0.73 86 1Exam 1 1F Hospital 121 1.50 0.71 0.71 86 1FT Nurse 1 1F Hospital 450 1.50 1.66 1.66 748 2 12Restroom 1 1F Restroom 56 0.90 0.57 0.57 32 1Office 1 1F Office 162 1.10 0.53 0.53 86 1Office 2 1F Office 155 1.10 0.56 0.56 86 1Office 3 1F Office 162 1.10 0.89 0.89 145 1 1Sports Exam 1 1F Hospital 165 1.50 0.52 0.52 86 1Sports Exam 2 1F Hospital 161 1.50 0.53 0.53 86 1Imaging 1 1F Hospital 726 1.50 0.87 0.87 632 4 1 8 1Central Stores 1 1F Hospital 514 1.50 0.46 0.46 236 4Conference 1 1F Conference 464 Y 1.30 0.93 0.83 430 5Stairs 1 1F Stairs 118 0.60 0.00 0.00 0Office 4 1F Office 202 Y 1.10 0.43 0.38 86 1Office 5 1F Office 118 Y 1.10 1.46 1.31 172 2Office 6 1F Office 134 Y 1.10 1.28 1.16 172 2Office 7 1F Office 139 Y 1.10 0.62 0.56 86 1Office 8 1F Office 131 Y 1.10 1.31 1.18 172 2Office 9 1F Office 134 Y 1.10 1.28 1.16 172 2Office 10 1F Office 137 Y 1.10 1.41 1.27 192 4Stairs 2 1F Stairs 83 0.60 0.00 0.00 0Admin Wait 1 1F Waiting 435 0.80 0.00 0.00 0Storage 2 1F Storage-Active 72 0.80 0.82 0.82 59 1Stairs 3 1F Stairs 190 0.60 0.00 0.00 0Public Wait 1 1F Waiting 431 0.80 0.53 0.53 227 4 1Public Wait 2 1F Waiting 431 0.80 0.53 0.53 227 4 1Public Wait 3 1F Waiting 114 0.80 0.52 0.52 59 1Public Wait 4 1F Waiting 124 0.80 0.48 0.48 59 1Reception 1 1F Waiting 401 0.80 1.14 1.14 456 2 2 1 5FT Exam 3 1F Hospital 123 Y 1.50 0.70 0.63 86 1FT Exam 4 1F Hospital 115 Y 1.50 0.75 0.68 86 1Lab 1 1F Lab 653 Y 1.40 0.71 0.64 462 5 1Restroom 2 1F Restroom 179 Y 0.90 2.32 2.09 416 4 7Restroom 3 1F Restroom 175 Y 0.90 2.29 2.06 400 3 8
Lighting Power DensityControls
LightingASH 2004
16 ASU Health Services Expansion and Renovation
LEED-NC 3 Energy Analysis Report May 2013
FT Exam 2 1F Hospital 111 Y 1.50 0.77 0.70 86 1Blood Draw 1 1F Hospital 110 Y 1.50 0.78 0.70 86 1FT Exam 1 1F Hospital 117 Y 1.50 0.74 0.66 86 1Restroom 4 1F Restroom 56 Y 0.90 1.05 0.94 59 1Clean Utility 1 1F Laundry 89 Y 0.60 0.36 0.32 32 1Exam 10 1F Hospital 118 Y 1.50 0.73 0.65 86 1Exam 11 1F Hospital 107 Y 1.50 0.80 0.72 86 1Soiled Utility 1 1F Laundry 80 Y 0.60 0.73 0.66 59 1Exam 12 1F Hospital 159 Y 1.50 1.08 0.98 172 2EQ St 1 1F Hospital 83 Y 1.50 1.03 0.93 86 1Cast St 1 1F Hospital 78 Y 1.50 0.33 0.30 26 1Consult 1 1F Office 90 Y 1.10 0.96 0.86 86 1Consult Wait 1 1F Waiting 77 0.80 1.09 1.09 84 2 1Consult Wait 2 1F Waiting 82 0.80 1.66 1.66 136 4 1Storage 3 1F Storage-Active 82 0.80 1.35 1.35 111 1 2Staff Locker 1 1F Locker 306 0.80 1.23 1.23 376 4 1Electrical 1 1F Electrical 199 1.50 0.85 0.85 170 2 2Staff Lounge 1 1F Lounge 324 1.20 1.06 1.06 344 4Billing 1 1F Office 839 Y 1.10 1.18 1.07 994 11 1Electrical 2 1F Electrical 157 1.50 0.75 0.75 118 2Mechanical 2 1F Mechanical 298 1.50 0.40 0.40 118 2Pharmacy 1 1F Office 681 1.10 1.29 1.29 878 9 4IDF 1 1F Electrical 40 1.50 1.48 1.48 59 1Pharmacy 2 1F Office 189 1.10 0.65 0.65 122 1 3Corridor 1 1F Corridor 739 1.00 2.08 2.08 1,538 1 2 7Corridor 2 1F Corridor 643 1.00 0.94 0.94 602 7Corridor 3 1F Corridor 462 1.00 1.04 1.04 478 5 1Corridor 4 1F Corridor 413 1.00 0.83 0.83 344 4Corridor 5 1F Corridor 557 1.00 0.87 0.87 482 5 2Corridor 6 1F Corridor 968 1.00 1.08 1.08 1,050 7 14Corridor 7 1F Corridor 663 1.00 0.78 0.78 516 6Corridor 8 1F Corridor 529 1.00 0.67 0.67 354 3 2Corridor 9 1F Corridor 1,082 1.00 1.11 1.11 1,198 5 1 4 1 18Nurses Office 1 2F Office 284 Y 1.10 0.61 0.55 172 2WEX 2 2F Hospital 134 Y 1.50 0.64 0.58 86 1WEX 1 2F Hospital 128 Y 1.50 0.67 0.60 86 1WEX 4 2F Hospital 129 Y 1.50 0.67 0.60 86 1WEX 3 2F Hospital 123 Y 1.50 0.70 0.63 86 1WEX 6 2F Hospital 126 Y 1.50 0.68 0.61 86 1WEX 5 2F Hospital 120 Y 1.50 0.71 0.64 86 1WEX 8 2F Hospital 129 Y 1.50 1.33 1.20 172 2WEX 7 2F Hospital 123 Y 1.50 1.40 1.26 172 2W Office 1 2F Office 148 Y 1.10 1.16 1.05 172 2W Office 2 2F Office 138 Y 1.10 0.63 0.56 86 1W Office 3 2F Office 138 Y 1.10 1.25 1.13 172 2P Office 1 2F Office 138 Y 1.10 0.63 0.56 86 1P Office 2 2F Office 138 Y 1.10 1.25 1.13 172 2P Office 3 2F Office 138 Y 1.10 0.63 0.56 86 1NRS Office 1 2F Office 151 Y 1.10 0.57 0.51 86 1PEX 12 2F Hospital 127 Y 1.50 0.68 0.61 86 1
17 ASU Health Services Expansion and Renovation
LEED-NC 3 Energy Analysis Report May 2013
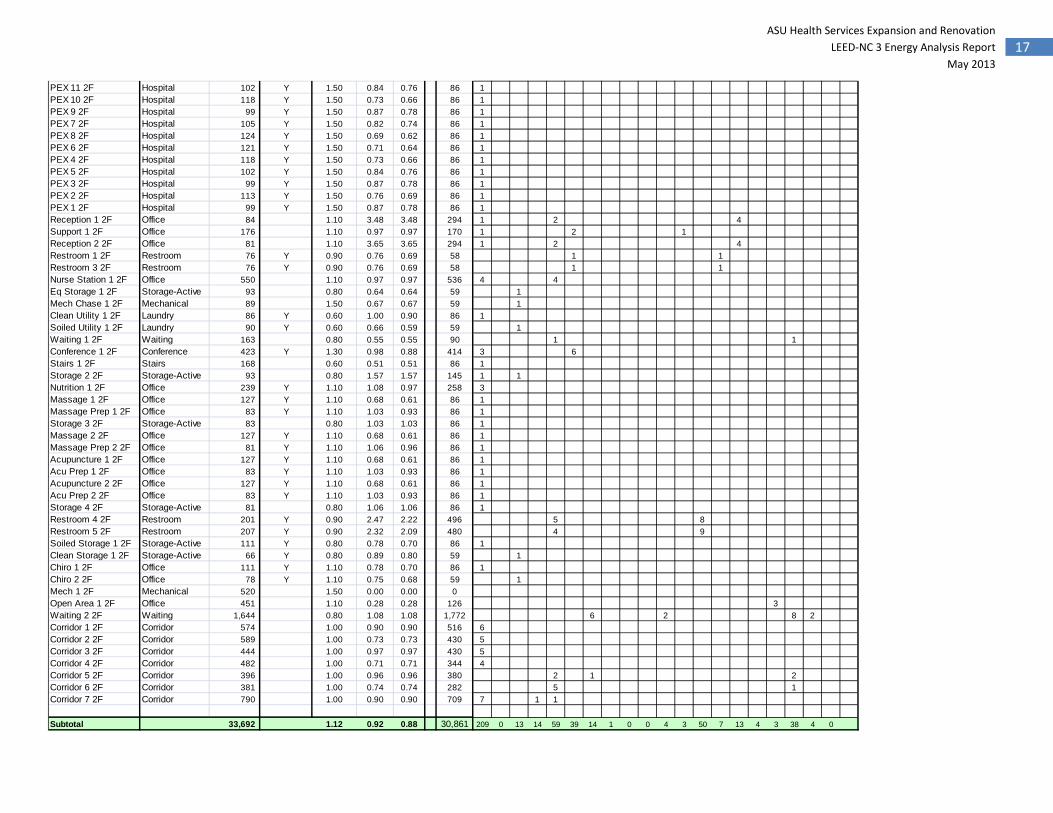
PEX 11 2F Hospital 102 Y 1.50 0.84 0.76 86 1PEX 10 2F Hospital 118 Y 1.50 0.73 0.66 86 1PEX 9 2F Hospital 99 Y 1.50 0.87 0.78 86 1PEX 7 2F Hospital 105 Y 1.50 0.82 0.74 86 1PEX 8 2F Hospital 124 Y 1.50 0.69 0.62 86 1PEX 6 2F Hospital 121 Y 1.50 0.71 0.64 86 1PEX 4 2F Hospital 118 Y 1.50 0.73 0.66 86 1PEX 5 2F Hospital 102 Y 1.50 0.84 0.76 86 1PEX 3 2F Hospital 99 Y 1.50 0.87 0.78 86 1PEX 2 2F Hospital 113 Y 1.50 0.76 0.69 86 1PEX 1 2F Hospital 99 Y 1.50 0.87 0.78 86 1Reception 1 2F Office 84 1.10 3.48 3.48 294 1 2 4Support 1 2F Office 176 1.10 0.97 0.97 170 1 2 1Reception 2 2F Office 81 1.10 3.65 3.65 294 1 2 4Restroom 1 2F Restroom 76 Y 0.90 0.76 0.69 58 1 1Restroom 3 2F Restroom 76 Y 0.90 0.76 0.69 58 1 1Nurse Station 1 2F Office 550 1.10 0.97 0.97 536 4 4Eq Storage 1 2F Storage-Active 93 0.80 0.64 0.64 59 1Mech Chase 1 2F Mechanical 89 1.50 0.67 0.67 59 1Clean Utility 1 2F Laundry 86 Y 0.60 1.00 0.90 86 1Soiled Utility 1 2F Laundry 90 Y 0.60 0.66 0.59 59 1Waiting 1 2F Waiting 163 0.80 0.55 0.55 90 1 1Conference 1 2F Conference 423 Y 1.30 0.98 0.88 414 3 6Stairs 1 2F Stairs 168 0.60 0.51 0.51 86 1Storage 2 2F Storage-Active 93 0.80 1.57 1.57 145 1 1Nutrition 1 2F Office 239 Y 1.10 1.08 0.97 258 3Massage 1 2F Office 127 Y 1.10 0.68 0.61 86 1Massage Prep 1 2F Office 83 Y 1.10 1.03 0.93 86 1Storage 3 2F Storage-Active 83 0.80 1.03 1.03 86 1Massage 2 2F Office 127 Y 1.10 0.68 0.61 86 1Massage Prep 2 2F Office 81 Y 1.10 1.06 0.96 86 1Acupuncture 1 2F Office 127 Y 1.10 0.68 0.61 86 1Acu Prep 1 2F Office 83 Y 1.10 1.03 0.93 86 1Acupuncture 2 2F Office 127 Y 1.10 0.68 0.61 86 1Acu Prep 2 2F Office 83 Y 1.10 1.03 0.93 86 1Storage 4 2F Storage-Active 81 0.80 1.06 1.06 86 1Restroom 4 2F Restroom 201 Y 0.90 2.47 2.22 496 5 8Restroom 5 2F Restroom 207 Y 0.90 2.32 2.09 480 4 9Soiled Storage 1 2F Storage-Active 111 Y 0.80 0.78 0.70 86 1Clean Storage 1 2F Storage-Active 66 Y 0.80 0.89 0.80 59 1Chiro 1 2F Office 111 Y 1.10 0.78 0.70 86 1Chiro 2 2F Office 78 Y 1.10 0.75 0.68 59 1Mech 1 2F Mechanical 520 1.50 0.00 0.00 0Open Area 1 2F Office 451 1.10 0.28 0.28 126 3Waiting 2 2F Waiting 1,644 0.80 1.08 1.08 1,772 6 2 8 2Corridor 1 2F Corridor 574 1.00 0.90 0.90 516 6Corridor 2 2F Corridor 589 1.00 0.73 0.73 430 5Corridor 3 2F Corridor 444 1.00 0.97 0.97 430 5Corridor 4 2F Corridor 482 1.00 0.71 0.71 344 4Corridor 5 2F Corridor 396 1.00 0.96 0.96 380 2 1 2Corridor 6 2F Corridor 381 1.00 0.74 0.74 282 5 1Corridor 7 2F Corridor 790 1.00 0.90 0.90 709 7 1 1
Subtotal 33,692 1.12 0.92 0.88 30,861 209 0 13 14 59 39 14 1 0 0 4 3 50 7 13 4 3 38 4 0
18 ASU Health Services Expansion and Renovation
LEED-NC 3 Energy Analysis Report May 2013
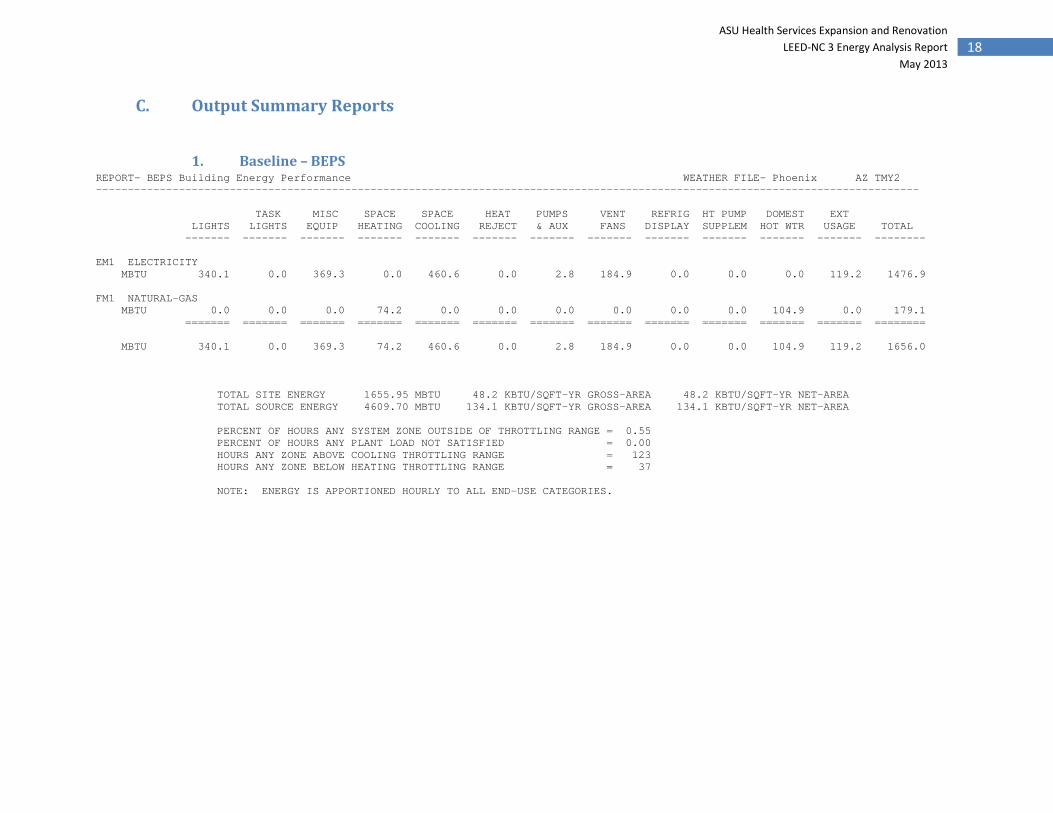
C. Output Summary Reports
1. Baseline – BEPS REPORT- BEPS Building Energy Performance WEATHER FILE- Phoenix AZ TMY2 --------------------------------------------------------------------------------------------------------------------------------- TASK MISC SPACE SPACE HEAT PUMPS VENT REFRIG HT PUMP DOMEST EXT LIGHTS LIGHTS EQUIP HEATING COOLING REJECT & AUX FANS DISPLAY SUPPLEM HOT WTR USAGE TOTAL ------- ------- ------- ------- ------- ------- ------- ------- ------- ------- ------- ------- -------- EM1 ELECTRICITY MBTU 340.1 0.0 369.3 0.0 460.6 0.0 2.8 184.9 0.0 0.0 0.0 119.2 1476.9 FM1 NATURAL-GAS MBTU 0.0 0.0 0.0 74.2 0.0 0.0 0.0 0.0 0.0 0.0 104.9 0.0 179.1 ======= ======= ======= ======= ======= ======= ======= ======= ======= ======= ======= ======= ======== MBTU 340.1 0.0 369.3 74.2 460.6 0.0 2.8 184.9 0.0 0.0 104.9 119.2 1656.0 TOTAL SITE ENERGY 1655.95 MBTU 48.2 KBTU/SQFT-YR GROSS-AREA 48.2 KBTU/SQFT-YR NET-AREA TOTAL SOURCE ENERGY 4609.70 MBTU 134.1 KBTU/SQFT-YR GROSS-AREA 134.1 KBTU/SQFT-YR NET-AREA PERCENT OF HOURS ANY SYSTEM ZONE OUTSIDE OF THROTTLING RANGE = 0.55 PERCENT OF HOURS ANY PLANT LOAD NOT SATISFIED = 0.00 HOURS ANY ZONE ABOVE COOLING THROTTLING RANGE = 123 HOURS ANY ZONE BELOW HEATING THROTTLING RANGE = 37 NOTE: ENERGY IS APPORTIONED HOURLY TO ALL END-USE CATEGORIES.
19 ASU Health Services Expansion and Renovation
LEED-NC 3 Energy Analysis Report May 2013
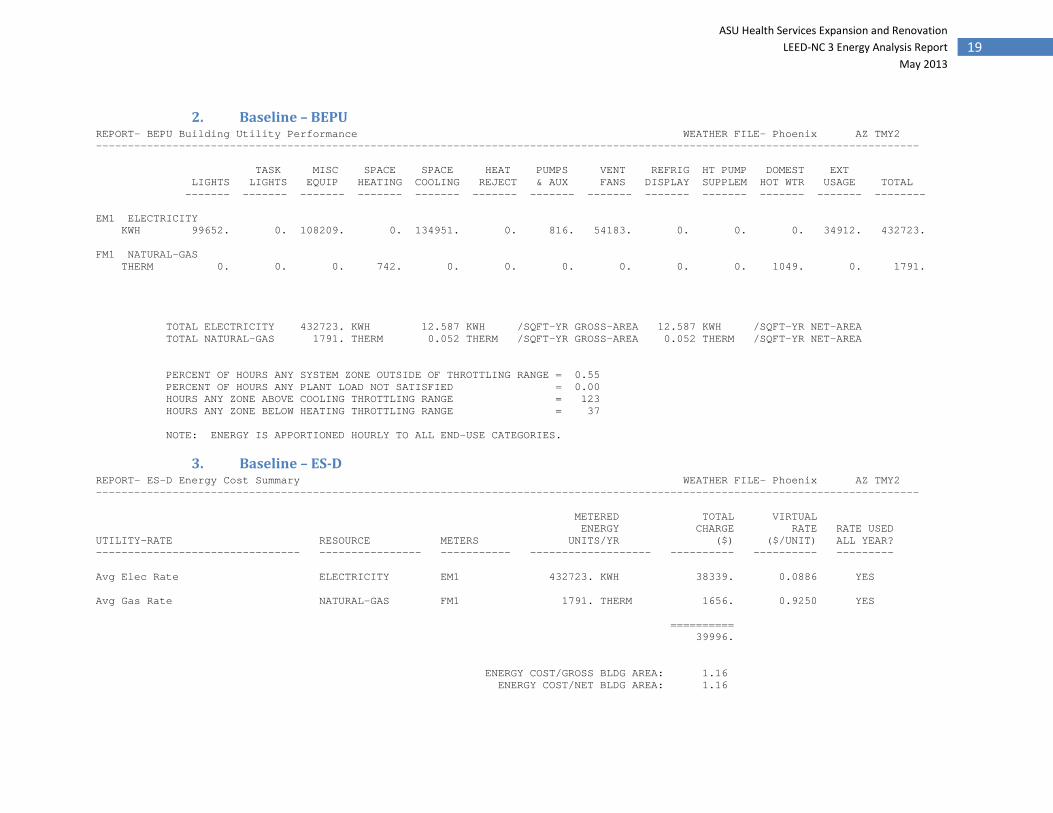
2. Baseline – BEPU REPORT- BEPU Building Utility Performance WEATHER FILE- Phoenix AZ TMY2 --------------------------------------------------------------------------------------------------------------------------------- TASK MISC SPACE SPACE HEAT PUMPS VENT REFRIG HT PUMP DOMEST EXT LIGHTS LIGHTS EQUIP HEATING COOLING REJECT & AUX FANS DISPLAY SUPPLEM HOT WTR USAGE TOTAL ------- ------- ------- ------- ------- ------- ------- ------- ------- ------- ------- ------- -------- EM1 ELECTRICITY KWH 99652. 0. 108209. 0. 134951. 0. 816. 54183. 0. 0. 0. 34912. 432723. FM1 NATURAL-GAS THERM 0. 0. 0. 742. 0. 0. 0. 0. 0. 0. 1049. 0. 1791. TOTAL ELECTRICITY 432723. KWH 12.587 KWH /SQFT-YR GROSS-AREA 12.587 KWH /SQFT-YR NET-AREA TOTAL NATURAL-GAS 1791. THERM 0.052 THERM /SQFT-YR GROSS-AREA 0.052 THERM /SQFT-YR NET-AREA PERCENT OF HOURS ANY SYSTEM ZONE OUTSIDE OF THROTTLING RANGE = 0.55 PERCENT OF HOURS ANY PLANT LOAD NOT SATISFIED = 0.00 HOURS ANY ZONE ABOVE COOLING THROTTLING RANGE = 123 HOURS ANY ZONE BELOW HEATING THROTTLING RANGE = 37 NOTE: ENERGY IS APPORTIONED HOURLY TO ALL END-USE CATEGORIES.
3. Baseline – ES-D REPORT- ES-D Energy Cost Summary WEATHER FILE- Phoenix AZ TMY2 --------------------------------------------------------------------------------------------------------------------------------- METERED TOTAL VIRTUAL ENERGY CHARGE RATE RATE USED UTILITY-RATE RESOURCE METERS UNITS/YR ($) ($/UNIT) ALL YEAR? -------------------------------- ---------------- ----------- ------------------- ---------- ---------- --------- Avg Elec Rate ELECTRICITY EM1 432723. KWH 38339. 0.0886 YES Avg Gas Rate NATURAL-GAS FM1 1791. THERM 1656. 0.9250 YES ========== 39996. ENERGY COST/GROSS BLDG AREA: 1.16 ENERGY COST/NET BLDG AREA: 1.16
20 ASU Health Services Expansion and Renovation
LEED-NC 3 Energy Analysis Report May 2013
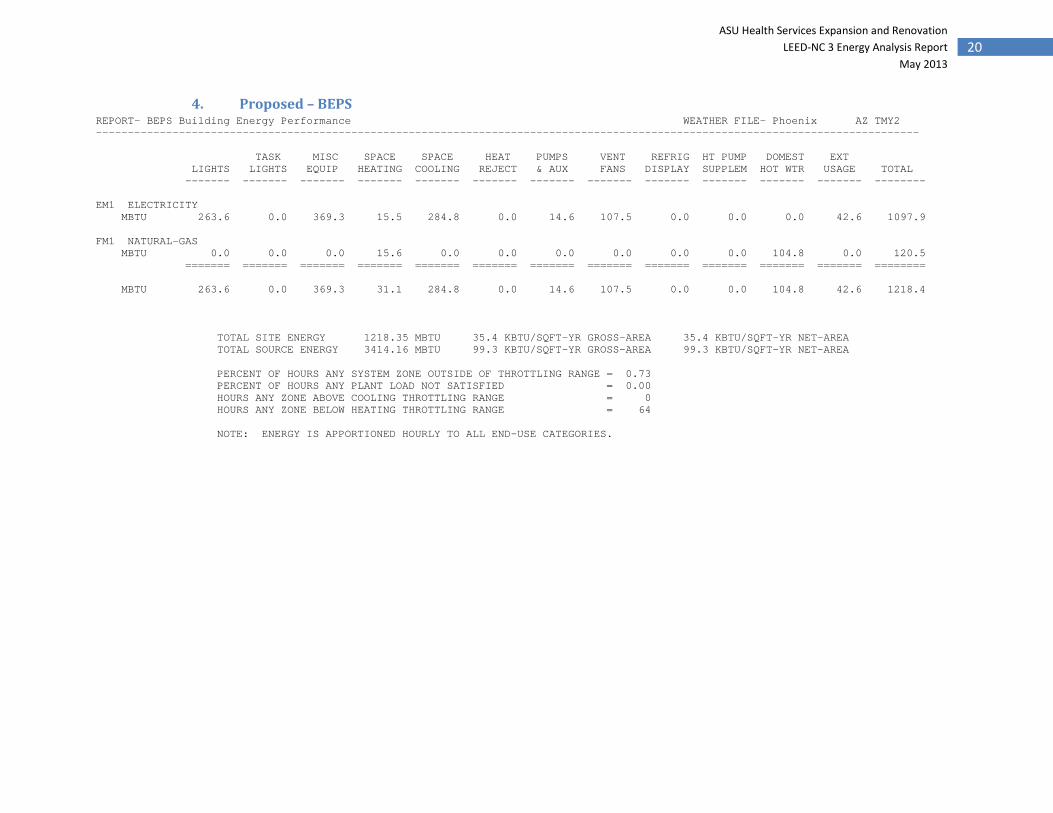
4. Proposed – BEPS REPORT- BEPS Building Energy Performance WEATHER FILE- Phoenix AZ TMY2 --------------------------------------------------------------------------------------------------------------------------------- TASK MISC SPACE SPACE HEAT PUMPS VENT REFRIG HT PUMP DOMEST EXT LIGHTS LIGHTS EQUIP HEATING COOLING REJECT & AUX FANS DISPLAY SUPPLEM HOT WTR USAGE TOTAL ------- ------- ------- ------- ------- ------- ------- ------- ------- ------- ------- ------- -------- EM1 ELECTRICITY MBTU 263.6 0.0 369.3 15.5 284.8 0.0 14.6 107.5 0.0 0.0 0.0 42.6 1097.9 FM1 NATURAL-GAS MBTU 0.0 0.0 0.0 15.6 0.0 0.0 0.0 0.0 0.0 0.0 104.8 0.0 120.5 ======= ======= ======= ======= ======= ======= ======= ======= ======= ======= ======= ======= ======== MBTU 263.6 0.0 369.3 31.1 284.8 0.0 14.6 107.5 0.0 0.0 104.8 42.6 1218.4 TOTAL SITE ENERGY 1218.35 MBTU 35.4 KBTU/SQFT-YR GROSS-AREA 35.4 KBTU/SQFT-YR NET-AREA TOTAL SOURCE ENERGY 3414.16 MBTU 99.3 KBTU/SQFT-YR GROSS-AREA 99.3 KBTU/SQFT-YR NET-AREA PERCENT OF HOURS ANY SYSTEM ZONE OUTSIDE OF THROTTLING RANGE = 0.73 PERCENT OF HOURS ANY PLANT LOAD NOT SATISFIED = 0.00 HOURS ANY ZONE ABOVE COOLING THROTTLING RANGE = 0 HOURS ANY ZONE BELOW HEATING THROTTLING RANGE = 64 NOTE: ENERGY IS APPORTIONED HOURLY TO ALL END-USE CATEGORIES.

21 ASU Health Services Expansion and Renovation
LEED-NC 3 Energy Analysis Report May 2013
5. Proposed – BEPU REPORT- BEPU Building Utility Performance WEATHER FILE- Phoenix AZ TMY2 --------------------------------------------------------------------------------------------------------------------------------- TASK MISC SPACE SPACE HEAT PUMPS VENT REFRIG HT PUMP DOMEST EXT LIGHTS LIGHTS EQUIP HEATING COOLING REJECT & AUX FANS DISPLAY SUPPLEM HOT WTR USAGE TOTAL ------- ------- ------- ------- ------- ------- ------- ------- ------- ------- ------- ------- -------- EM1 ELECTRICITY KWH 77242. 0. 108209. 4544. 83434. 0. 4281. 31494. 0. 0. 0. 12479. 321684. FM1 NATURAL-GAS THERM 0. 0. 0. 156. 0. 0. 0. 0. 0. 0. 1048. 0. 1205. TOTAL ELECTRICITY 321684. KWH 9.357 KWH /SQFT-YR GROSS-AREA 9.357 KWH /SQFT-YR NET-AREA TOTAL NATURAL-GAS 1205. THERM 0.035 THERM /SQFT-YR GROSS-AREA 0.035 THERM /SQFT-YR NET-AREA PERCENT OF HOURS ANY SYSTEM ZONE OUTSIDE OF THROTTLING RANGE = 0.73 PERCENT OF HOURS ANY PLANT LOAD NOT SATISFIED = 0.00 HOURS ANY ZONE ABOVE COOLING THROTTLING RANGE = 0 HOURS ANY ZONE BELOW HEATING THROTTLING RANGE = 64 NOTE: ENERGY IS APPORTIONED HOURLY TO ALL END-USE CATEGORIES.
6. Proposed – ES-D REPORT- ES-D Energy Cost Summary WEATHER FILE- Phoenix AZ TMY2 --------------------------------------------------------------------------------------------------------------------------------- METERED TOTAL VIRTUAL ENERGY CHARGE RATE RATE USED UTILITY-RATE RESOURCE METERS UNITS/YR ($) ($/UNIT) ALL YEAR? -------------------------------- ---------------- ----------- ------------------- ---------- ---------- --------- Avg Elec Rate ELECTRICITY EM1 321684. KWH 28501. 0.0886 YES Avg Gas Rate NATURAL-GAS FM1 1205. THERM 1114. 0.9250 YES ========== 29615. ENERGY COST/GROSS BLDG AREA: 0.86 ENERGY COST/NET BLDG AREA: 0.86
Related Documents