Lecture notes on gender and development Rajeev Dehejia

Welcome message from author
This document is posted to help you gain knowledge. Please leave a comment to let me know what you think about it! Share it to your friends and learn new things together.
Transcript

Lecturenotesongenderanddevelopment
RajeevDehejia

HalftheSky
“The best way to fight poverty and extremism is to educate and empower women and girls”

Genderinthecourse
Genderfitsintomanyplaces¨Growth¨Childlabor¨Populationissues¨Poverty¨Health¨Financeandmicrofinance

Today:8issuesInherent
1. “Missingwomen” (Sen)2. Gapsinhealth,education,labormarketopportunities3. Siblingrivalry4. Childlaborandmarriagemarkets.
Instrumental5. Mothersasconduittochildren(Thomas)6. Femalepoliticiansfavor“social” publicgoods(Dufloand
Chattopadhyay)7. Socialattitudesandgenderbias(televisionbreakingthe
barriers).8. Efficientmicrofinance,e.g.,ROSCAs(Morduch)

AnOptimisticStartingpoint:DecliningFertilityandFemaleIlliteracyRates,1960-2000

GrowthandGenderDisparities
n EconomicGrowth(DollarandGatti)¨Genderdisparitiesinsecondaryeducationareassociatedwithslowergrowth– forhigherincomecountriesonly.
¨Reinforcement:Increasesinpercapitaincomereducegenderinequality(afteralevelofabout$2000,PPP-adjusted).

1.Missingwomenn Populationsexratiosaresoskewed(inAsiaespecially)thatAmartyaSen
(1992)haswrittenofacrisisof“missingwomen”.
n Whileindevelopedcountriesthereareapproximately105.9femalesforevery100males,theratiosarelowerinSouthAsia,theMiddleEastandNorthAfrica,duetoexceedinglyhighfemalemortalityrates.
n Theverylargefemale/maledeathratioinsuchregionsisattributedtoparents’ neglectfortheirfemaleinfantsand,insomecases,toselectiveabortionoffemalefetuses.
n Sen(1992)estimatesthatthenumberof“missingwomen” (thosewhodiedprematurelyorwhowereselectivelyaborted)intheearly1990swasover100millionpeople.
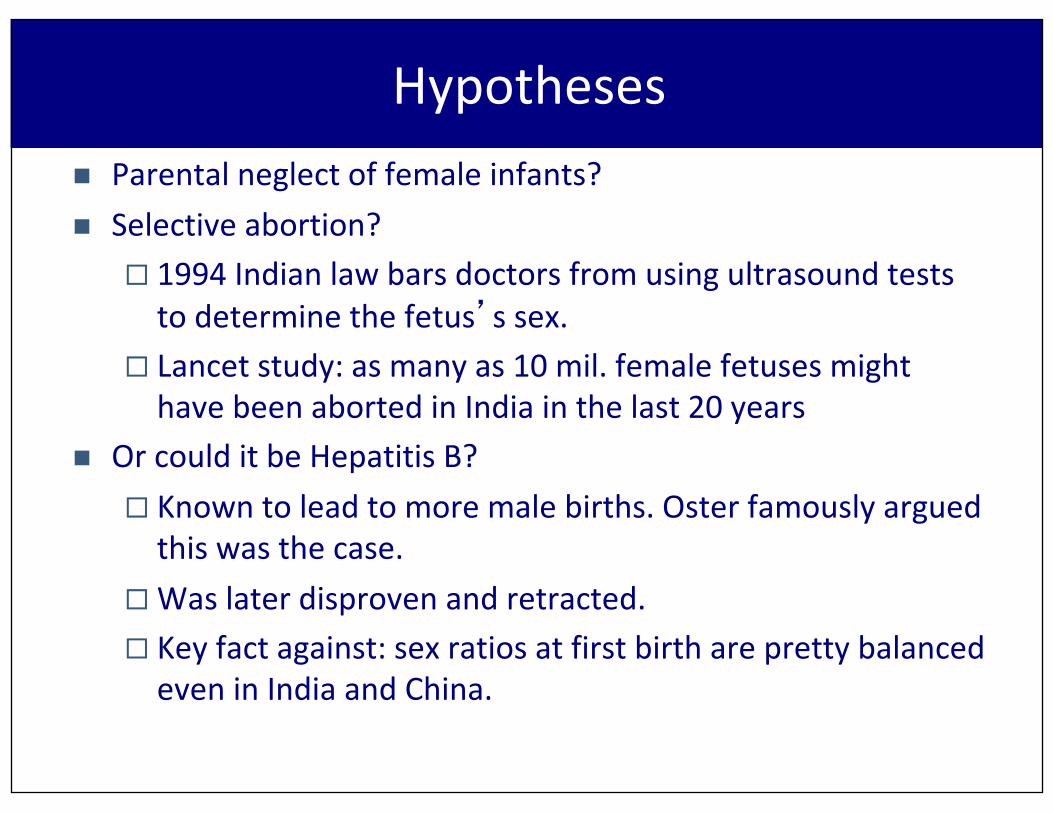
Hypothesesn Parentalneglectoffemaleinfants?n Selectiveabortion?
¨ 1994Indianlawbarsdoctorsfromusingultrasoundteststodeterminethefetus’ssex.
¨ Lancetstudy:asmanyas10mil.femalefetusesmighthavebeenabortedinIndiainthelast20years
n OrcoulditbeHepatitisB?¨ Knowntoleadtomoremalebirths.Osterfamouslyarguedthiswasthecase.
¨Waslaterdisprovenandretracted.¨ Keyfactagainst:sexratiosatfirstbirthareprettybalancedeveninIndiaandChina.

MissinggirlsinChinaEbenstein JHR92 The Journal of Human Resources
Table 1Fertility Patterns in China by Sex of Existing Children
Percent who haveanother child
Fraction Male(of next birth)
Parity Sex Combination 1982 1990 2000 1982 1990 2000
Overall 0.516 0.520 0.5331st None 0.511 0.510 0.5152nd One boy 0.71 0.54 0.35 0.51 0.50 0.50
One girl 0.75 0.60 0.49 0.52 0.55 0.623rd Two boys 0.53 0.30 0.18 0.50 0.43 0.39
One girl, one boy 0.54 0.29 0.16 0.52 0.52 0.53Two girls 0.68 0.55 0.46 0.54 0.61 0.70
4th Three boys 0.40 0.24 0.17 0.48 0.40 0.37One girl, two boys 0.36 0.17 0.11 0.51 0.49 0.52Two girls, one boy 0.44 0.23 0.14 0.52 0.55 0.58Three girls 0.62 0.54 0.50 0.56 0.64 0.72
Source: China Census 1% sample (1982), 1% sample (1990), .10% sample (2000). Married women ages21–40 and their matched children ages 0–18.Notes: Data in thousands. Sex ratio (boys/girls) at birth is calculated by assigning weights to each maleand female that account for differential mortality rates by age, sex, and year. China life tables taken fromBanister (2004).
clearly responsible for the high overall sex ratio in China. 10 Sons represent over 60percent of births to mothers with one daughter, and over 70 percent of births tomothers with two daughters. In the 2000 China census, mothers of two daughtersare nearly three times as likely to have a third child as mothers of two sons (46percent versus 18 percent). Since mothers are less likely to have another child fol-lowing sons, the high sex ratios following daughters have a pronounced impact onthe overall sex ratio and explain the high overall sex ratio despite the relative lackof sex selection at the first parity.In Table 2, I attempt to account for the overall female deficit by examining the
share of missing girls (or boys) following each observed sex combination. Using abaseline estimate that the natural sex ratio at birth is 1.059 (implying a natural share
10. Researchers have cautioned that Chinese census data following stricter enforcement of the One ChildPolicy may not accurately reflect the number of females in the population. Mothers who give birth to adaughter and subsequently give birth to a son may choose to hide the earlier female birth in censusresponses. Banister (2004) finds that the deficit of daughters is real: the high sex ratios in PRC (People’sRepublic of China) demographic data are approximately true, not merely an artifact of faulty data. Cai andLavely (2005) confirm this finding, suggesting that 71 percent of the missing girls in the 1990 census arenot enumerated in the 2000 census. Most experts on China suggest that girls are registered when they areenrolled in school (age seven), and the problem of unregistered births is less severe among girls age sixor older, and will have a smaller effect on the results presented here using living children observed in thematched sample.

Abortion:TheCaseofTaiwanFigure 1: Fraction of Males at Birth by Parity over Time in T aiwan (1980-1998)
Abortions legalized in 1986
Lin-Liu-Qian, More Missing Women, Fewer Girls Dying: The Impact of Abortion on Sex Ratios at Birth and Excess Female Mortality in Taiwan

EconomicexplanationsofmortalitypatternsinIndia
n Investmentsinchildrenoughttoreflectdifferentreturnstoeducationandlabormarketpossibilities.
n MarkRosenzweig andPaulSchultz(1982):Canasymmetricmortalitypatternsresultbecauseparentsareforcedtoinvestinchildrenwiththegreatestearningpotential?
n TheyfindthatsurvivalprobabilitiesforfemaleinfantsinruralIndiaare¨ Higherinareaswhereopportunitiesforfemaleemploymentare
greater.¨ Bardhan:PatternsinIndiaasyoumovetowardmorericeregions
(correlateswithhighersurvivalratesofgirls).

Cross-culturalexplanationsDasGuptaetal:India,China,andSKorea
Strong cultural factors lead to valuing of boys:• Kinship / family groups through male descent.• Inheritance of property.• Marriage.
Economic factors:• Old-age security.• Labor force participation.

DistinguishingeconomicsandcultureAlmondandEdlund
n AlmondandEdlund lookatChinese,Korean,andSouthAsianparentsintheUS.
n Fortheseparentsculturalfactorsmaywelllinger,butweknoweconomicfactorschangewithmigration.

AlmondandEdlund

2.Genderdisparitiesinhealth,education,wages

Genderdisparityinliteracyandlifeexpectancy
The World’s Women 201020
reproductive health and the health of children. It should be noted that sometimes the geographi-cal regions employed in this chapter are different from those used elsewhere in this report due to the groupings used in the sources of data. This is indicated in the text where relevant.
A. Life expectancy at birth
1. Levels of and trends in life expectancy at birth
As discussed briefly in Chapter 1 – Population and families, the world witnessed remarkable declines in mortality in the latter half of the twentieth century. This was due to a number of interrelated factors. Overall improvements in living conditions and nutrition, together with advances in medicine and medical treatments, accounted for the reduc-tion everywhere. In addition, improvements in public health in developing countries meant that fewer people died of infectious and parasitic dis-eases. Expanded immunization programmes also protected a growing number of children from childhood diseases, contributing to significant reductions in infant and child mortality.4
4 United Nations, 2001.
Life expectancy at birth denotes the average number of years a newborn child can expect to live given the current levels of mortality in a country. Derived from age-specific mortality rates, it is an indicator that can provide a picture of the overall health sta-tus of populations and also allows for investigat-ing the longevity of women and men separately.
It is well known that women live longer than men. This biological advantage for women begins at birth. However, societal, cultural and economic factors can affect the natural advantage females have over males. Studies show that “the gender gap in mortality is smaller in developing countries…because in many of these countries, women have much lower social status than men” and are exposed to risks associated with childbirth, factors that can equalize life expectancies.5 In developed countries, the gap in life expectancy at birth may decrease as women adopt unhealthy behaviours similar to those of men,6 such as smoking and drinking.
Women live longer than men in all regions
Table 2.1 shows the life expectancy at birth for women and men since 1990–1995 to quantify
5 Yin, 2007.6 Ibid.
Table 2.1Life expectancy at birth by region and sex, 1990–1995, 2000–2005 and 2005–2010
Women Men
1990–1995 2000–2005 2005–2010 1990–1995 2000–2005 2005–2010
Africa
Northern Africa 68 72 73 64 68 69
Southern Africa 64 51 52 59 49 51
Eastern, Middle and Western Africa 54 55 57 50 52 54
Asia
Eastern Asia 74 76 77 69 71 72
South-Eastern Asia 66 70 72 62 66 67
Southern Asia 59 65 67 57 62 64
Central Asia 68 70 70 61 61 62
Western Asia 72 75 76 67 71 72
Latin America and the Caribbean
Caribbean 75 76 77 69 71 72
Central America 73 76 77 67 70 71
South America 72 75 76 66 69 70
Oceania 68 71 73 64 67 68
More developed regions
Eastern Europe 75 76 77 66 68 69
Western Europe 80 82 83 74 76 78
Other more developed regions 80 83 83 74 77 78
Source: Computed by the United Nations Statistics Division based on data from United Nations, World Population Prospects: The 2008 Revision (2009).Note: Unweighted averages.
Trends in male and female adult literacy rates, 1990–2009
Source: UNESCO Institute for Statistics
01990 2000
South andWest Asia
Sub-SaharanAfrica
Arab States Latin Americaand the
Caribbean
East Asia andthe Pacific
Central andEastern Europe
North Americaand Western
Europe
2009 1990 2000 2009 1990 2000 2009 1990 2000 2009 1990 2000 2009 1990 2000 2009 1990 2000 2009 1990 2000 2009
10
20
30
40
50
60
80
70
100
90
Adul
t lite
racy
rate
(%)
Central Asia
Male Female
Figure 7.1.1 Despite gains, women still account for substantial majority of adult illiterates
Women account for a substantial majority of self-reported adult illiterates, even though the gap has narrowed from 12.9 in 1990 to 9.1 percent in 2009. Figure 7.1.1 shows that women made particularly significant gains in South and West Asia, the Arab States, and East Asia and the Pacific between 1990 and 2009. Nevertheless, the overall proportion of adult female literates in 2009 remains well below what the rate was for men in 1990.Adult literacy rates continue to be higher for men than for women in all eight regions. The male advantage is minimal in North America and Western Europe but remains striking in South and West Asia and in sub-Saharan Africa, where the gaps favouring males are 22 and 17 percentage points respectively.Consistent with these trends in adult literacy, the global gender parity index for adult literacy has increased from 0.84 in 1990 to 0.90 in 2009, which is still well below the 0.97 threshold for parity.As shown in Figure 7.1.2, the GPI in three regions of the world – the Arab States, South and West Asia, and sub-Saharan Africa – remains less than 0.80. There are no regions in which women have an edge in adult literacy rates, although parity has been reached in Central and Eastern Europe, Central Asia, Latin America and the Caribbean, and North America and Western Europe.
The greatest gains for women have been among regions that had the furthest to go, notably the Arab States, sub-Saharan Africa and South and West Asia.Rates and patterns of adult literacy differ widely among individual countries, as do their rates of progress. Figure 7.1.3 presents the situation for six selected countries that account for much of the illiterate adult populations and documents the progress that they made between 1990 and 2009. By far the largest number of self-reported adult illiterates live in India, where 99 million males and 184 million females are unable to read and write. They account for one-quarter of the male population and half of females in India. Bangladesh is home to 22 million self-reported adult illiterate males and 27 million self-reported adult illiterate females – accounting for 40 percent of the overall male population and half of all females in that country.The largest numerical gains in reducing adult illiteracy have been observed in China. Since 1990 the number of male illiterates has fallen from 55 to 17 million while the male literacy rate jumped from 87 to 97 percent. Likewise, the number of female illiterates dropped from 127 to 47 million, while the female literacy rate rose from 68 to 91 percent.
CHAPTER 7 Gender trends: adult and youth literacy
94

Gendergapinwages
n BlauandKahn(2003):¨Thegapinlogearningscorrectedfordifferencesinweeklyworkhoursbetweenmenandwomenaveraged.307logpointsoverthe1985-94period(22countriesstudied)
n Whatcausesthis?¨ Isitsimplythatwomenarelesswell-educatedand,generally,havelesshumancapital?n No– womenhavemoreeducationincreasinglyandalsogiveneducationgapspersist.
¨ Isitthatwomentendtohavegapsinlaborforceparticipation?

3.Whatexplainsdiscrimination?n Culture?n Economicforcesandstructures?n Chickensandeggs?n Butatleastusefultoknowwhetherexistingpricesandopportunitiescorrelatewithdiscrimination.
n Mightbeabletotelluswhetherchangeswilloccurovertime,orwhichpolicyleverstopull.

Beckerapproach
n Thinkofinvestingintwochildren,oneboyandonegirl.
n Optimalinvestmentwillequatemarginalreturnsacrosskids.
n Solessinvestmentingirlsiftheirmarginalreturnsarelower– butoppositeistrue.¨Thailand(1980-81) F:20%vs.M:11%¨ Coted’Ivoire(85) F:29%vs.M:17%
n Perhapseffectivereturnsarelowerduetomarriagecustoms,labormarketpatterns.

Implication:“siblingrivalry”
n Whenconstraintsbind,kidsareincompetitionwitheachother.
n Theory:anygivenkidwillbebetteroffwhentheyarewithotherkidswhoareless“competitive”
n Doallkidsbenefitbyhavingmoresisters(controllingfortotalnumberofsiblings)?

Evidence:Indiavs SSAFigure 2: Child height in India and Africa, by child’s birth order
-1.39-1.34
-1.37
-1.48 -1.47
-1.83
-2-1
.8-1
.6-1
.4-1
.2M
ean
heig
ht-fo
r-age
z-s
core
Birth order 1 Birth order 2 Birth order 3+
Africa India
The figure depicts the mean child height-for-age z-scores for Sub-Saharan Africa and India, by thebirth order of the child. The mean is calculated over all children less than 60 months old withanthropometric data.
23

4.Womenandwork(Tanzania)
n WeexaminetheimpactofchildlaborinruralTanzaniaonmarriageoutcomesforboysversusgirls.
n Alongthewaywealsolearnsomeinterestingfactsonthepatternsofchildlaborforboysversusgirls.


Thedata
n Baseline:KageraHealthandDevelopmentSurvey(1991-1994)¨919households,acrossKageraregion¨4roundsbetween1991/94
n Followup:2700householdsinterviewedin2004(frombaseline~900).¨ For93%ofthebaselinehouseholds,atleast1householdmemberwasre-interviewedin2004.
¨ TheKHDS2004trackedrespondentsoutsideofthevillage(withinKagera,DaresSalaam,Mwanza,Uganda…).Trackingmoverswascritical.Withouteffortstotrackchildrenwhomovedoutofthevillage,therecontactrateswouldhavefallenfrom81%to49%.

Table2:Theeffectofacropshockonchildlaborhours
Sex Male Male Female Female Male Male
Age 7 14 7 14 10 10
Logpcland Mean Mean Mean Mean 25th%ile
75th %ile
Extrahoursworked
2.85 2.25 -2.4 6.3 1.5 -0.26
Difference 0.6 8.8 1.75

Table2:Theeffectofacropshockonchildlaborhours
Econhours
Econhours
Chorehours
Chorehours
Econhours
Econhours
Chorehours
Chorehours
Male/Female
M M M M F F F F
Age 7 14 7 14 7 14 7 14
Logpcland Mean Mean Mean Mean Mean Mean Mean Mean
Extrahoursworked
0.60 2.4 -0.3 0.25 -1.1 0.49 -1.1 3.6
Difference 1.8 0.28 1.59 4.7

Table:Theeffectofchildlaboronmarriagematches

Table:Theeffectofchildlaboronbrideprices

5.Womenasconduitstochildrenn Policymakershavelongbeenawareofthepotentialimpact
ofdeliveringaidfordisadvantagedhouseholdmemberstowomen.
n FoodstampsintheUnitedKingdomandSriLanka,forexample,andstaplefoodandcashdeliveriesunderthePROGRESA(nowcalledOPORTUNIDADES)programinMexicoweredirectedtowomenratherthantheirhusbands.
n Fear:menmorelikelytosellthefoodstampsandmis-spendtheresources,possiblywastingmoneyongambling,tobacco,andalcohol.

Womenasconduitsn Bytargetingfundstowomen,EmmanuelSkoufias(2001)
reportsthatOPORTUNIDADESinruralMexicoledtosharpsocialimprovements:
¨ poverty:fellby10%,
¨ schoolenrollment:upby4%,
¨ foodexpenditures:upby11%
¨ adults’ health(asmeasuredbythenumberofunproductivedaysduetoillness)improvedconsiderably.

IFPRIstudiesMalnutrition=f(educationofwife,educationofhusband,food
availability,women’sstatusregion,education,etc.)
n Q:Whatexplains15%dropinmalnutritionindevelopingworld,1970-95?¨ Women’seducation:43%¨ Foodavailability:26%¨ Women’sstatusimprovement:12%
n Q: Butiscoefficientonwomen’seducationinsteadpickingupbroadersocialchanges?Canwereadthisasacausal link?¨ Needmorecarefulworkhere– difficultbutclearlytheunitarymodel
doesn’twork.

DuncanThomas(JHR,1990)55,000urbanhouseholdsBrazil1974/75
Impactof$1inthehandsofawomanversus$1inthehandsofaman:¨Calories:3x,butnosignificant difference¨Protein:4x,significant¨Childreneverborn:- 4+x,significant¨Survivalrate:20x,sig
Bottomline:¨Rejectionof“unitary”model.¨Doesn’tsaythatit’sinefficient,butitgivesasuspicion.

Udry
n LooksatagricultureinCoted’Ivoire,wherewomenandmenhavetheirownplots.
n Ifthehouseholdwere“unitary” youwouldfindsimilarcropyieldsonbothmen’sandwomen’splots.
n Butinfactmen’splotshavehigheryieldsbecauseofgreaterlaborandfertilizer.
n Suggestshouseholdisnotunitary.

Galasso
n LooksatIndonesia,wherewomenretainpropertyrightsoverthedowryassetstheybringintothemarriage.
n Improvesawoman’s“outsideoption” incaseofdivorce/breakdowninhouseholdbargaining.
n Childrendobetterwhenmotherenterswithalargerdowry.

6.Genderandpolitics
n Womenunder-representedinpoliticaloffice¨Discrimination,choice,otherbarriers(education,etc)
n Whydowecare?¨BargainingversusunitaryModels
n Therehavebeensomeboldexperimentsrequiringwomen’srepresentationatvariouslevels,e.g.,localpoliticsinIndia,corporateboardsinNorway.

PoliticsinIndian “Reservations” inPoliticalLife
¨ ThePanchayatisasystemofvillage,blockanddistrictlevelcouncilswhosemembersareelectedandresponsiblefortheadministrationoflocalpublicgoods
n 1992:73rd AmendmentoftheConstitution:1/3ofseatsmustbeheldforwomen+1/3ofthePradhanpositions
n Reservationsleadtoshiftintheallocationofpublicexpenditures¨ Shiftappearstobeinthedirectionofthepreferencesexpressedbythememberofthegroupthatbenefitsfromthereservation

EvidencefromIndia
n WestBengalandRajasthan:CollecteddataonissuesraisedtoPradhan (localleadership)
n WestBengal:¨ In31%ofvillages,awomenaskedaboutdrinkingwater(in17%ofvillages,mendid)
¨Womenmorelikelytoaskaboutroadthanmen
n Rajasthan:womencaredaboutwater,butnotroads

All-Indiareplication
n Overall,villagesreservedforwomenleadershavemorepublicgoods.¨Measuredqualityofthesegoodsisatleastashighasinnon-reservedvillages.
¨Moreover,villagersarelesslikelytopaybribesinvillagesreservedforwomen.
n Butresidentsofvillagesheadedbywomenarelesssatisfiedwiththepublicgoods,includinggoodsthatarebeyondthejurisdictionofthePanchayat.

7.ChangingNorms“ThePowerofTV:CableTelevisionandWomen’sStatusinIndia.”
From blog.goingtoschool.com

Changinggendernormsn Economiststypicallytakepreferencesandnormsasgiven.
n Theyusuallyask:¨Whathappenswhenapricechanges?
n Moneylender→microcredit.Femalewageincrease.
¨ Contractualinnovation?n Rainfallinsurance
¨ Newtechnologythatcutscosts?n Mobilephones
¨ Supplychangen TextilefactoriesinBangladesh

Changinggendernorms
n Buttechnologycanbringchangesinpreferences,attitudes,aspirations¨Telephones¨Televisions¨Movies

JensenandOster“ThePowerofTV:CableTelevisionandWomen’sStatusinIndia.”
n 1959:State-runblackandwhiteTVintroduced.Slowstart.n By1977:onlyaround600,000setssold.n 1982:ColorTV!
¨ “Evenwithcolor,however,mostprogrammingremainedeithergovernment-sponsorednewsorinformationabouteconomicdevelopment.” [andboring…]
n Early1990s:CNNandSTARTV¨ Small-scaleentrepreneurswouldbuyadishandchargenearbyhomes
toconnecttoit.Especiallyinvillages.n Dramaticdeclinesinpricesduetolowertariffsandmorecompetition.n Between2001and2006:about30millionhouseholds(≈150million
people)addedcable.Addfamilyandfriendsandgetanevenbiggerjump.

TelevisionprogressinIndia
n 112millionhouseholdsinIndiaownatelevision.¨TamilNadu:61%ofhomeswithTVhavecable,eventhoughaverageincome<$2perpersonperday.
n 2001-2006:30millionhouseholds(≈150millionindividuals)addedcableservice.
n Mainthemesandplotsofmanyshowsoftenrevolvearoundissuesoffamilyandgender.


Causality? -- Gender norms:Norms versus media
Norms for equality
Cable TVJensen and Oster follow timing carefully and use longitudinal data

TV’simpactonruralareas
n WomendepictedincableTVshowsaremodern,urbanwomen¨Workoutsidethehome,runbusinesses,controlmoney
¨Moreeducated,havefewerchildrenthanwomeninruralareas
¨ Internationalshowsnowalsoavailable
n CableTVhasstrongereffectthanstate-runTV¨Moreentertainment(particularlysoapoperas)¨Moreurbanshows


Who’swatchingTV?Averageshareofpeoplewhoreportwatchingtelevisionatleastonceinthepastweek.

FemaleautonomyFirstprincipalcomponentof6measuresoffemaleautonomy

Spousalbeating?Fig.3:Averagenumberofsituationsinwhichwomenfeelthatspousalbeatingis
acceptable(max=6)

Sonbias?Fig.4:Shareofwomenwhowantaboyastheirnextchild

FromJensenandOster.Caveats:n “Fromthepolicyperspective,however,therearepotentialconcernsabout
whetherthechangesinreportedautonomy,beatingattitudes,andsonpreferenceactuallyrepresentchangesinbehaviors,orjustinreporting.Forexample,wemaybeconcernedthatexposuretotelevisiononlychangeswhattherespondentthinkstheinterviewerwantstohearabouttheacceptabilityofbeating,butdoesnotactuallychangehowmuchbeatingisoccurring.
n “Thisconcernislikelytobelessrelevantinthecaseoffertilityoreducation;theformerisdirectlyverifiablebasedonthepresenceofababyinthehousehold,andthelatterislistedaspartofahouseholdroster.
n “Thefactthatwefindeffectsonthesevariablesprovidessupportfortheargumentthatourresultsrepresentrealchangesinoutcomes.
n “Withoutdirectlyobservingpeopleintheirhomes,however,itisdifficulttoconclusivelyseparatechangesinreportingfromchangesinbehavior.
n “However,evenifcableonlychangeswhatisreported,itstillmayrepresentprogress:changingtheperceived“correct"attitudeseemslikeanecessary,ifnotsufficient,steptowardchangingoutcomes.”

SummaryCableTVintroduceslargechanges
n 45%to70%ofthedifferenceinattitudesandbehaviorsbetweenurbanandruralareasdisappearswithin2yearsofcableintroductioninthissample
n Effectislargerelativetoeducation¨ IntroducingcableTVroughly≈5yearsoffemaleeducation

Policyimpact
n UnderlyingcausesofdiscriminationagainstwomeninIndia?¨Literaturehighlightsthedowrysystem,lowlevelsoffemaleeducation,andothersocioeconomicfactorsascentralfactors
n Changingtheseunderlyingfactorsisdifficult;introducingtelevision,orreducinganybarrierstoitsspread,maybelessso.

8.Microfinance:womenaremorereliablen Khandker,etal.,(1995)findthat15.3percentofmale
borrowerswere“struggling” in1991(thatis,missingsomepaymentsbeforethefinalduedate),whileonly1.3percentofwomenwerehavingdifficulties,andthefindingisechoedinstudieselsewhereinAsia.
n ThefieldexperienceofGrameenreplicationsinsouthernMexicoindicatesasimilarpattern,andevidencefromcreditscoringregressionsusingdatafromLatinAmericanmicrolendersconfirmsthistendencytoo(thesearestudiesofrepaymentrates,inwhichgenderisanexplanatoryvariable).

Microfinance:womenaremorereliable
n Whiletheadvantageofwomeninthecreditscoringstudiesfallsaftercontrollingforage,income,region,andothercovariates,itisthesimplecorrelationthatismostimportantindeterminingtheattractivenessofwomenascustomers.
n MichaelKevane andBruceWydick (2001):atagrouplendinginstitutioninGuatemala,femaleborrowinggroupsmisusedfundsleastoften,andasaresultoutperformedmaleborrowinggroups.

Conclusions

Genderlecture- Conclusionn Gettinginsidefamilyhelpsusseeconstraints,challengesandpossibilities.
n Understandinginequalitieshaspublicpolicyimplications.
n Alsohelpsusunderstandthenatureofdecision-makingitself.

Concludingthoughts
n Inmanyways,thisisageneralconclusionforthecourse:¨Lookinsideinstitutions,families.¨Buildbetterpolicybasedonmechanismstoovercomeconstraintsandseizeopportunities:n Health(Healthinsurance?Betterinfoonprivatesectordoctors?)
n Education(Combatabsenteeism)n Finance(Commitmentsavings,microcredit)n Poverty(Progresa)
Related Documents