1 Sivaselvi K

Lecture 6 Population
Feb 15, 2016
population study materials
Welcome message from author
This document is posted to help you gain knowledge. Please leave a comment to let me know what you think about it! Share it to your friends and learn new things together.
Transcript

1
Sivaselvi K

2
Position In SyllabusGlobal Environmental Crisis, Biogeochemical Cycles, Climate
Change, Ozone Hole, Overpopulation, Energy Crisis, Water CrisisPeriodical 1
Ecology, Biodiversity Loss, Deforestation and Land Degradation, Food Crisis, Pollution (Water, Air, Land, Thermal, Noise), Sewage
Domestic and Industrial and Effluent treatmentPeriodical 2
Solid waste (municipal, medical, e-waste, nuclear), Environmental Management, Conventions, Regulations and Impact Assessment,
Sustainable Development.Final Exam
3
Outline
• Introduction• Population Facts• Population Growth• Population Forecasting• Population Pyramids• Effect of Population on
Environment

4
Introduction
• A population is all the organisms that both belong to the same species & live in the same geographical area
• Demography is a social science which entails the statistical study of human populations
5
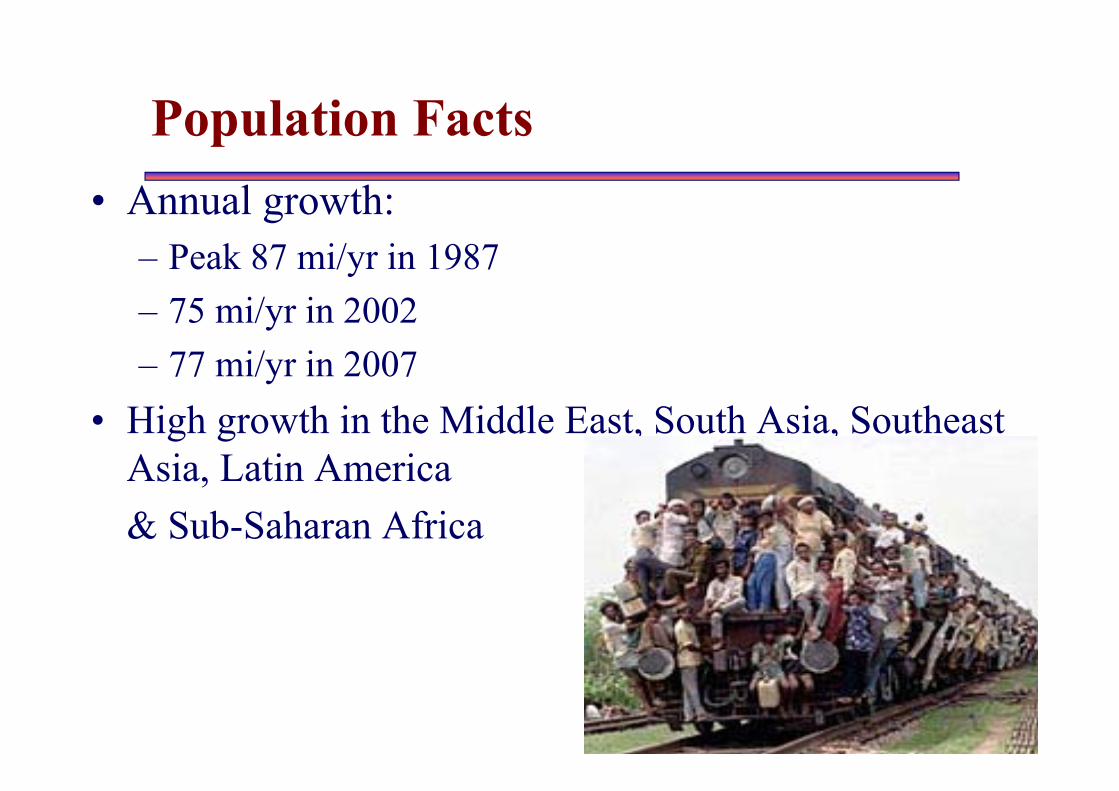
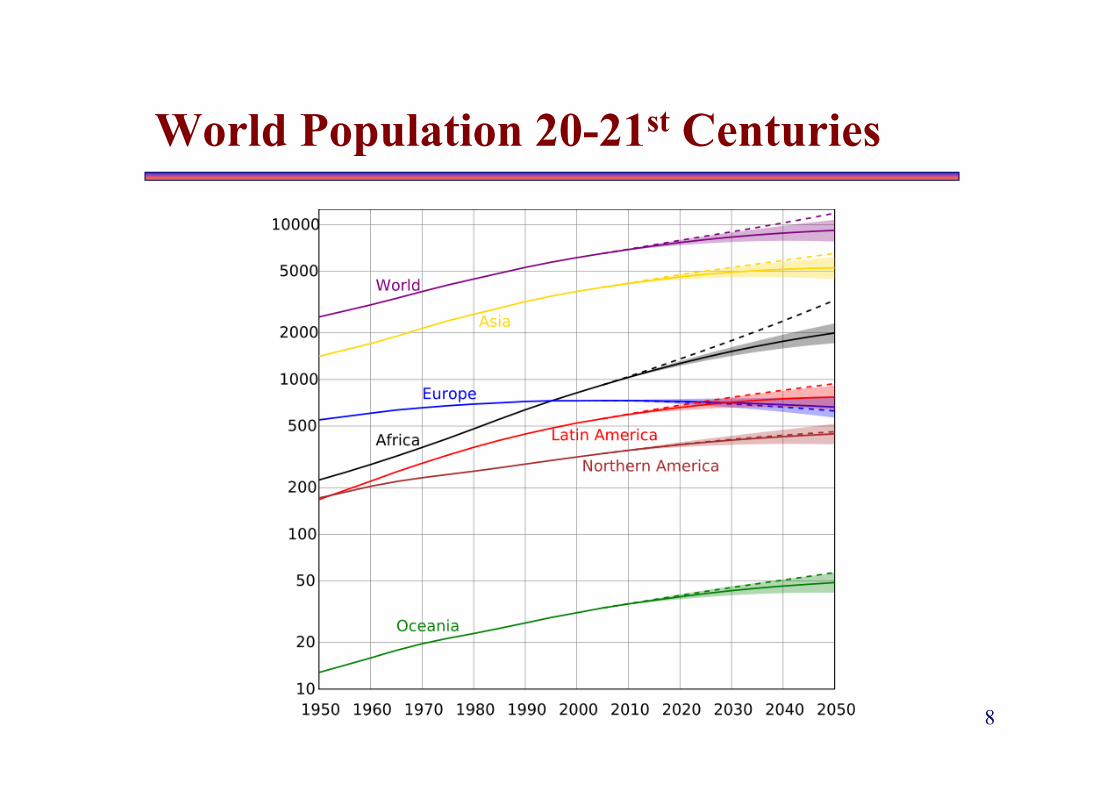
Population Facts• Annual growth:
– Peak 87 mi/yr in 1987– 75 mi/yr in 2002 – 77 mi/yr in 2007
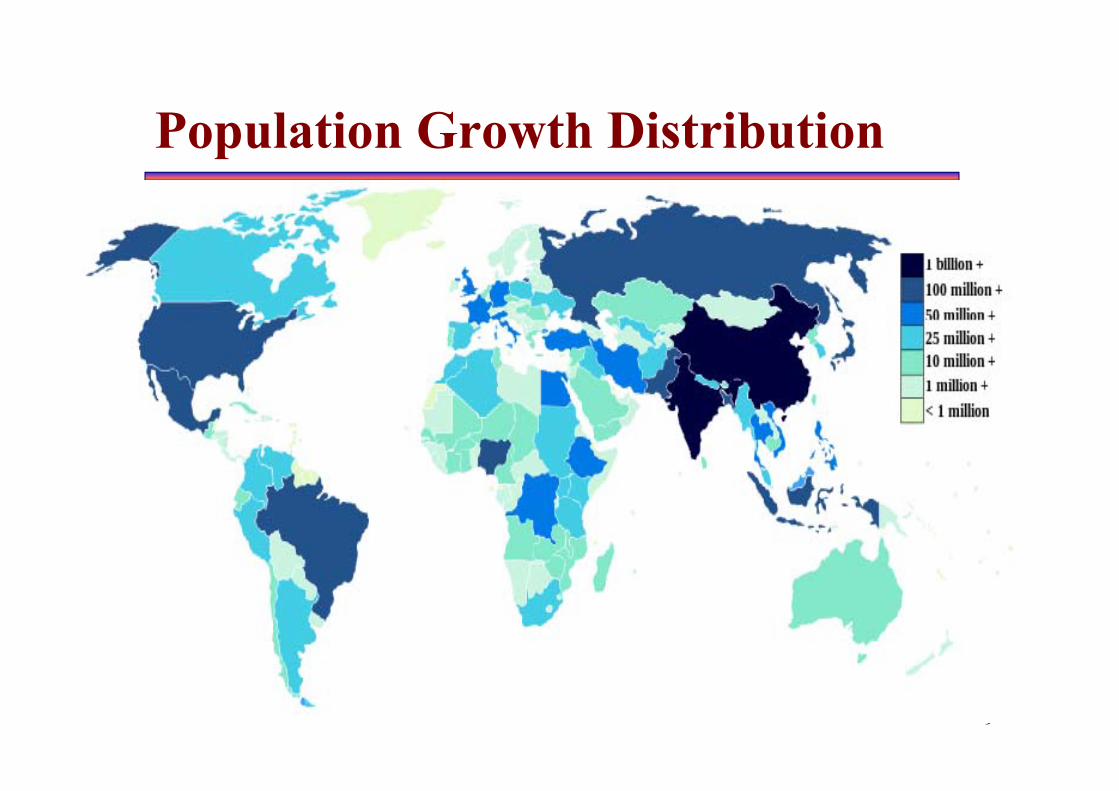
• High growth in the Middle East, South Asia, Southeast Asia, Latin America& Sub-Saharan Africa

6
Current Level of Overpopulation• To avert disaster, population must be reduced:
– US by at least one-third, – World: by two-thirds
• The Planet-documentary: We already consume five times more than that the planet can supply
• In 2006, WWF's "Living Planet" report: Current world population living with European luxury would need 3 Earths
Sources: http://en.wikipedia.org/wiki/Overpopulation#Effects_of_overpopulation. David Pimentel, Cornell University, and Mario Giampietro.

7
Population Explosion
8
World Population 20-21st Centuries
9
Population Growth Distribution
10
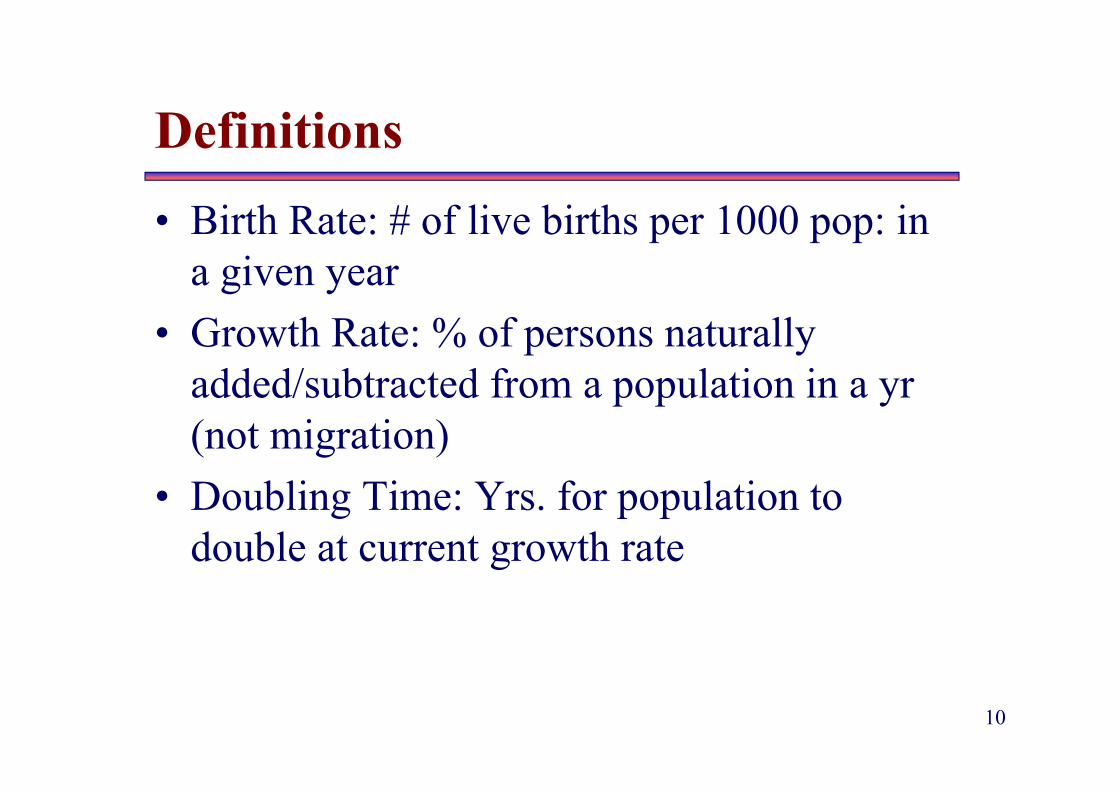
Definitions• Birth Rate: # of live births per 1000 pop: in
a given year• Growth Rate: % of persons naturally
added/subtracted from a population in a yr (not migration)
• Doubling Time: Yrs. for population to double at current growth rate

11
Why is growth high in underdeveloped countries?
• Low women literacy• Less knowledge, availability & social acceptance
of family planning• Children looked upon as more hands to work & a
pension plan (instead of an additional expense & impediment to womens’ careers in urban areas)
• Child marriage• High mortality rate prompts high birth rates• Stable families based on traditional values for
more children. Increased instability in urban areas due to divorce and separation limits the number of children
12
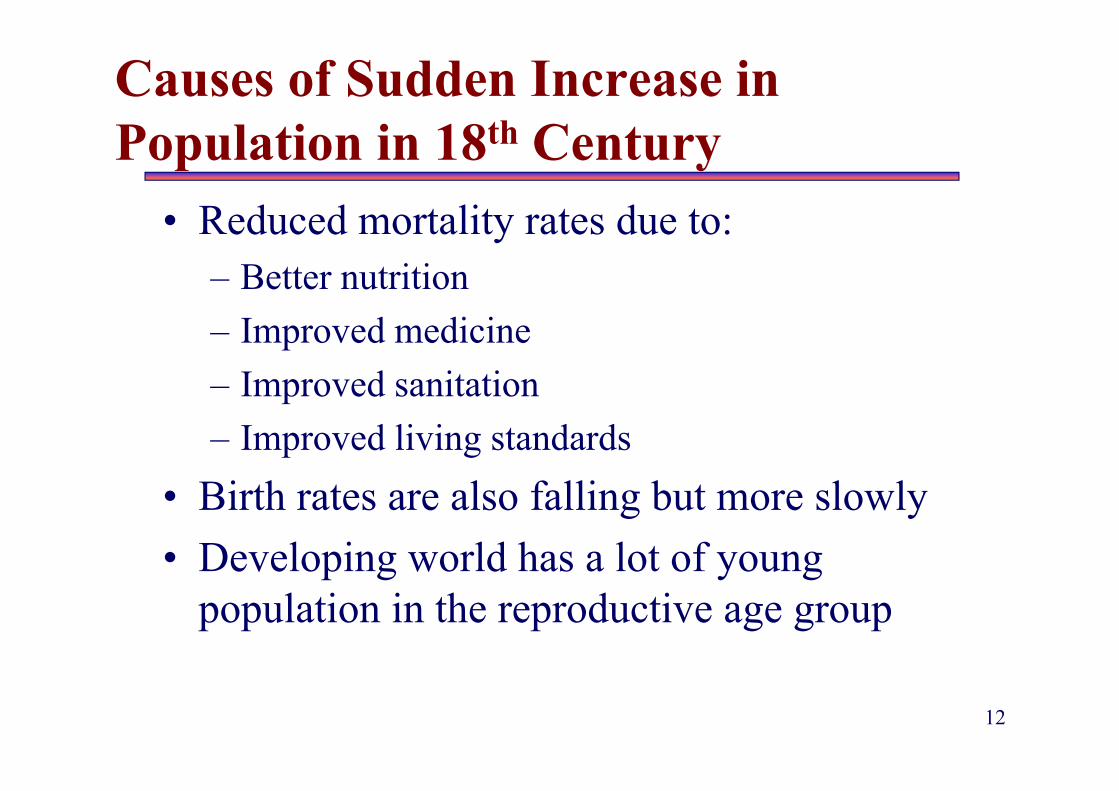
Causes of Sudden Increase in Population in 18th Century
• Reduced mortality rates due to:– Better nutrition– Improved medicine– Improved sanitation– Improved living standards
• Birth rates are also falling but more slowly• Developing world has a lot of young
population in the reproductive age group

13
Population forecasting
• Arithmetic increase method• Geometric Increase Method• Incremental Increase method• Logistic Curve Method

14
Arithmetic Increase Method• Assume, population increases linearly:
dP/dt = kPn = P0 + nxˉ
Pn = Population after n years/periodsP0 = Starting populationn = # of years or periodsxˉ = average of population increase
= [(P1-P0) + (P2-P1) +…]/n
* A period may be a decade, or century for instance

15
Geometric Increase Method• Percentage of Population increase is
constantPn = P0 (1+ r/100)n
Pn = Population after n years/periodsP0 = Starting populationn = # of years or periodsr = % growth rate
• r1 = 100(P1-P0)/P0; r2 = 100(P2-P3)/P2, …• r = (r1*r2*r3*…rn)1/n

16
Incremental Increase Method
Pn = P0 + nxˉ + n(n+1)/2 yˉ
Pn = Population after n years/periodsP0 = Starting populationn = # of years or periodsxˉ = average of population increase
= [(P2-P1) + (P3-P2) +…]/(n)yˉ = Average of incremental increase
= {[(P2-P1) - (P1-P0)] + [(P3-P2) - (P2-P1)]… }/(n-1)

17
Verhulst’s Logistic Curve Method
y’ = (ay) – (by2 ) or dN/dt = rN (1-N/k)
• y = N = population; y’ = dN/dt• a = r rate of growth• b = r/k• k = carrying capacity: Maximum population
that can be supported by the environment…achieved at t = ∞
Exponentional Term: causes steep increase
Breaking/ Limiting Term: Causes leveling off.
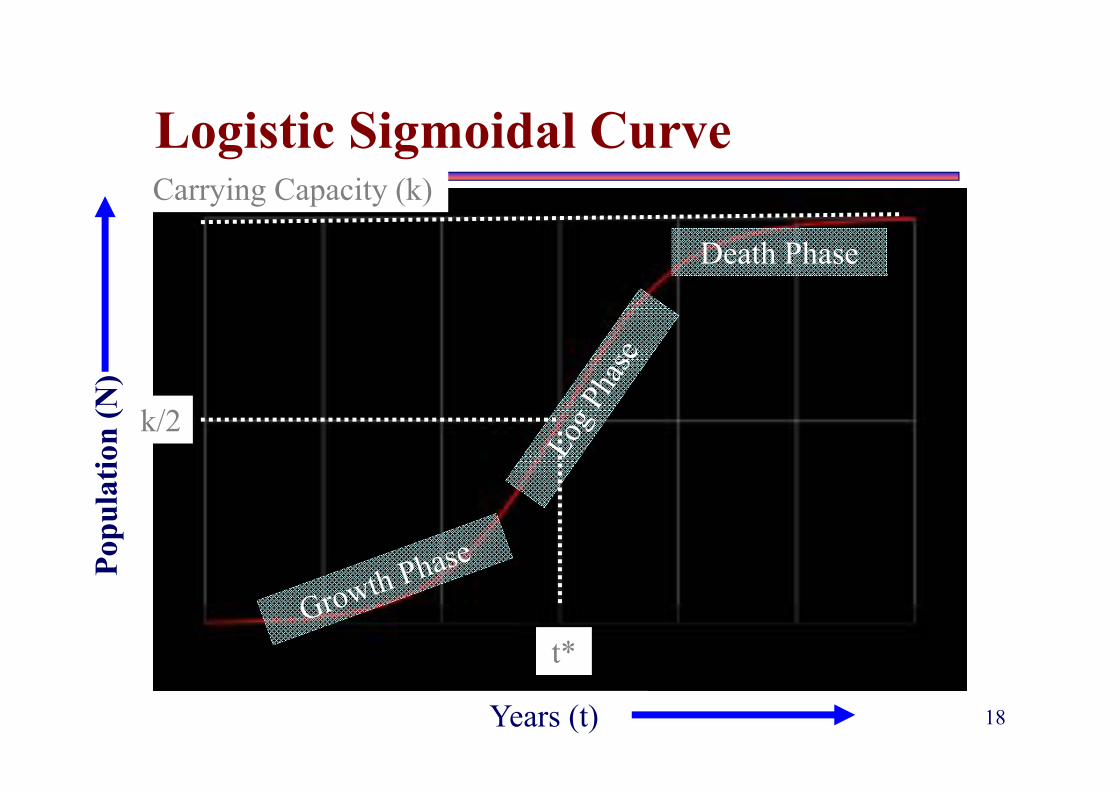
18
Logistic Sigmoidal Curve
Years (t)
Popu
latio
n (N
)
Carrying Capacity (k)
Death Phase
t*
k/2

19
FormulaeN = ert k /(c1 + ert)
– c1 = e rt*– t* = time taken for reaching half the carrying
capacity…N = k/2.
N = k/[1+ e–r(t-t*)]t = t* - (1/r) ln[(k/N) -1]t* = (1/r) {ln[(k/N0) – 1]}
r = r0/(1-N0/k)
– r0 = growth rate at start– N0 = Starting population
20
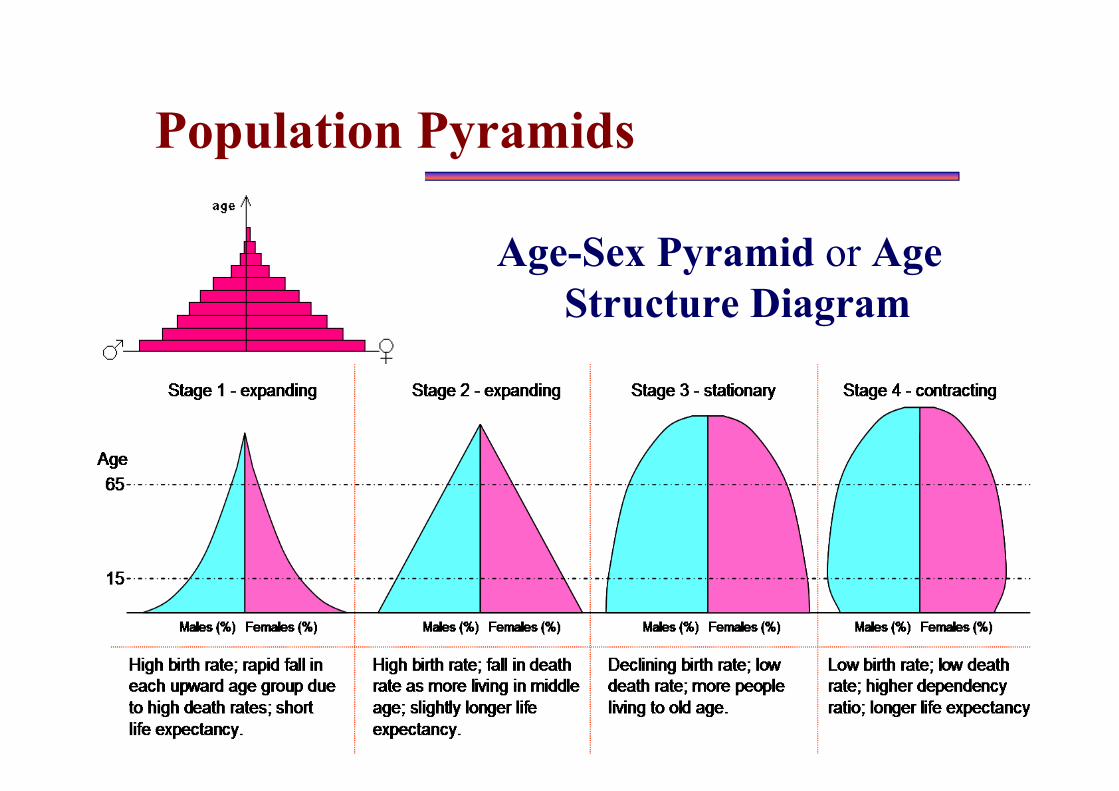
Population Pyramids
Age-Sex Pyramid or Age Structure Diagram
21
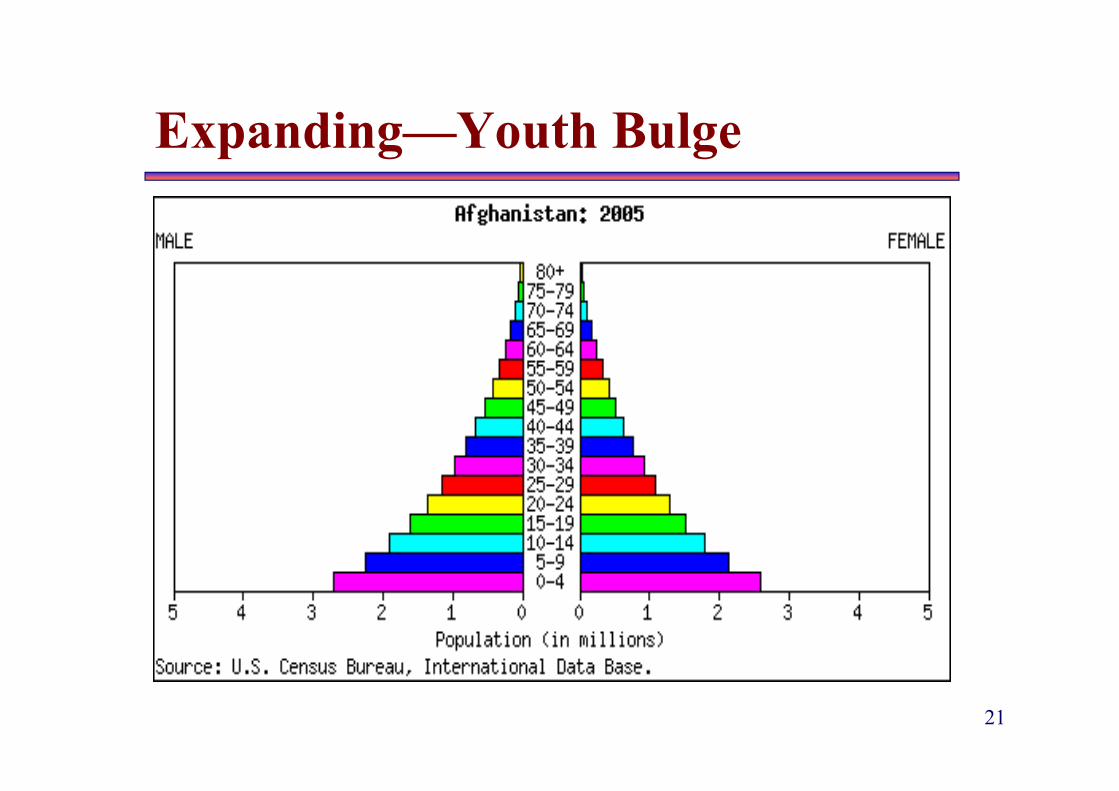
Expanding—Youth Bulge
22
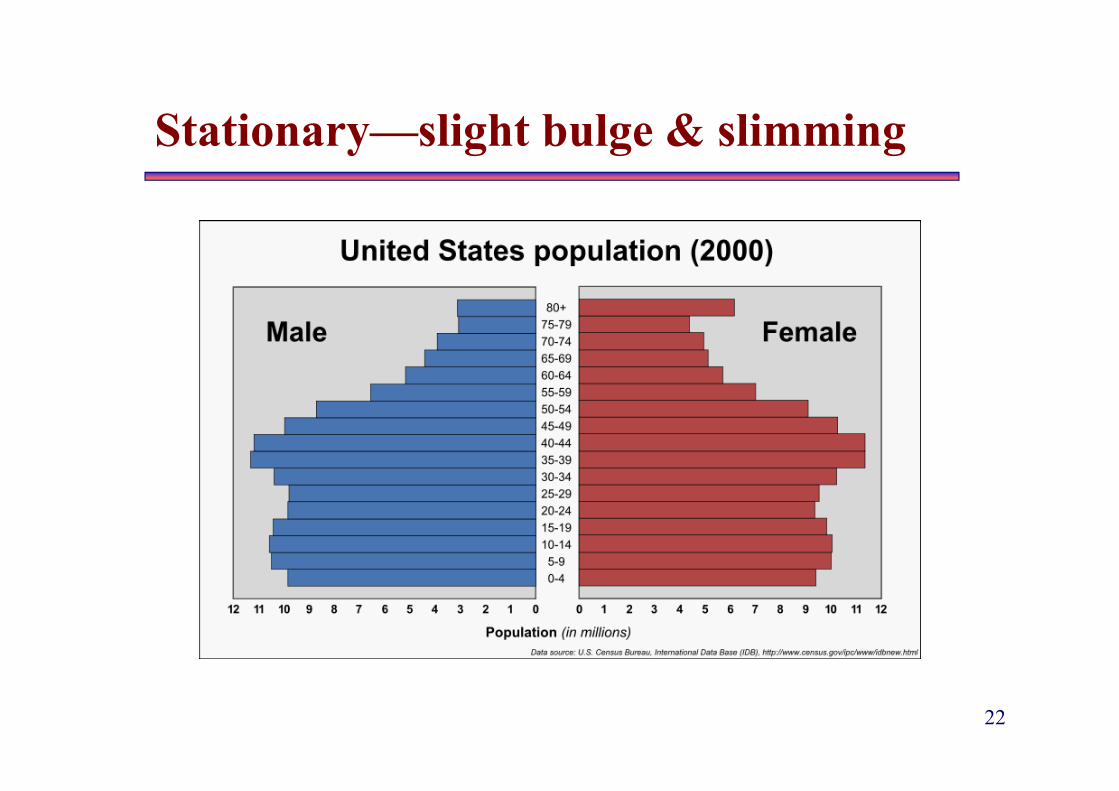
Stationary—slight bulge & slimming
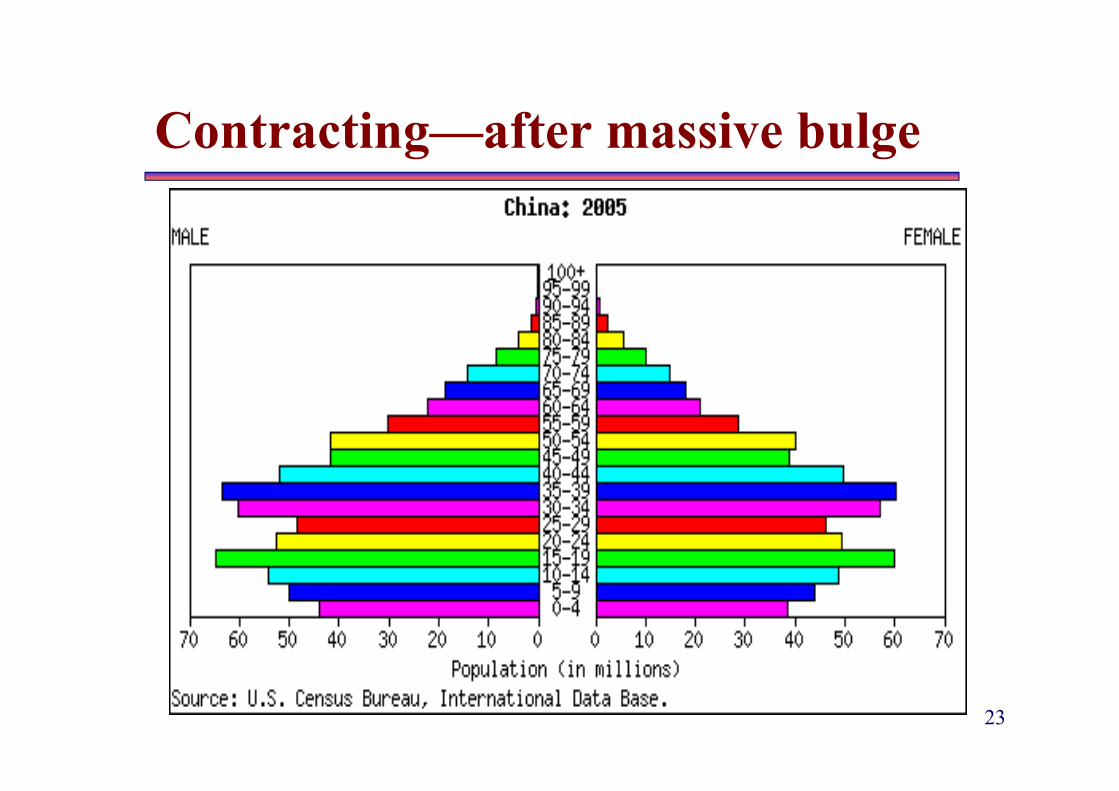
23
Contracting—after massive bulge
24
Effects of Population on Environment
• Tremendous strain on the environment• Intensifying factor for all environmental
problems• Inertial factor for all remedies• Deplete all natural resources
– Non-renewable resources depleted rapidly– Renewable resources depleted beyond
replenishment capacity• Risks catastrophic collapse
25
Socioeconomic Effects of Overpopulation• Famine, Starvation, Malnutrition• Poverty, low standards of living• Low life expectancy• Exploitation, degradation of moral and
ethical standards• Increased crime• Epidemics• Conflict and war
26
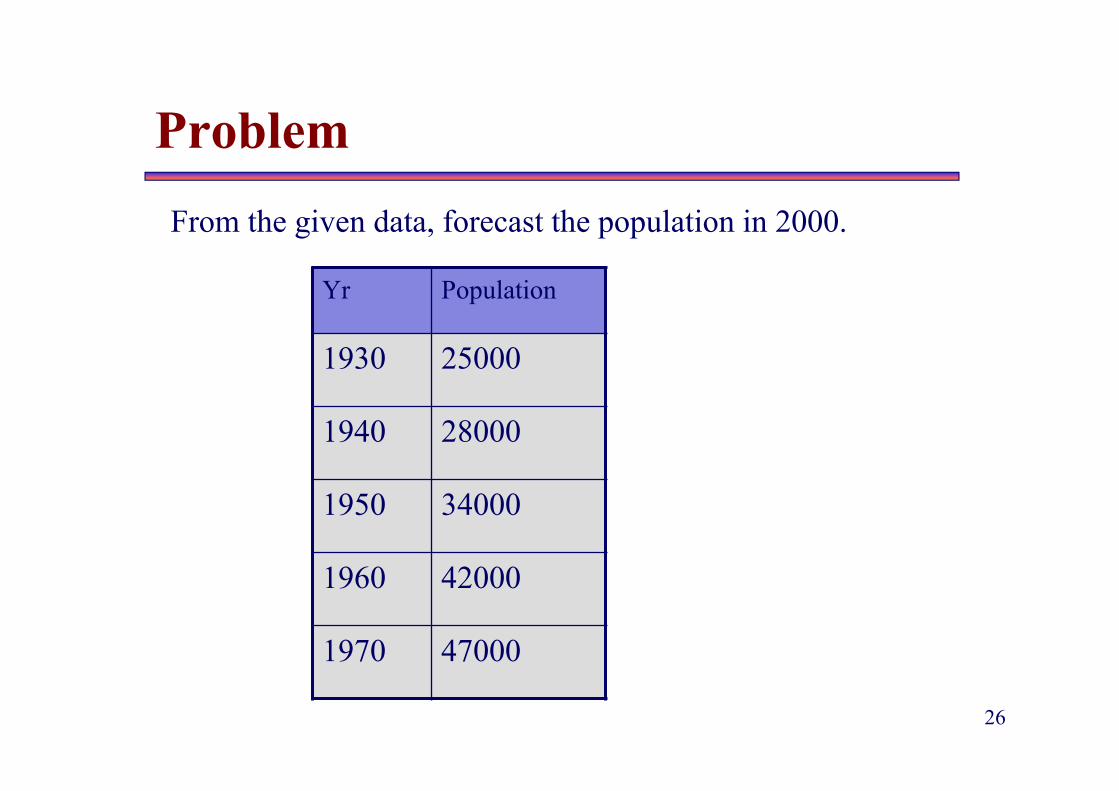
Problem
Yr Population
1930 25000
1940 28000
1950 34000
1960 42000
1970 47000
From the given data, forecast the population in 2000.

27
Preliminary Calculations
Yr Population
Increase/ decade % increase Incremental Increase
1930 25000 28000-25000 =3000
100* (3000/25000) = 12
6000-3000 =3000
1940 28000 34000-28000 =6000
100* (6000/28000) = 21.4
8000-6000 =2000
1950 34000 42000-34000 =8000
100* (8000/34000) = 23.5
5000-8000 =-3000
1960 42000 47000-42000 =5000
100* (5000/42000) = 11.9
1970 47000
First make the calculations in the 3 unshaded columns

28
Intermediate ResultsUse a decade as the time period. n = 4...(1930 to 1970)• Average Increase/decade (x—):
x— = [(P1-P0) + (P2-P1) +…]/n= (3000+6000+8000+5000)/4 = 5500
• Growth rate (r):r = (r1*r2*r3*…rn)1/n = (12*21.4*23.5*11.9)1/4 = 16.37%Note it’s the nth root of the product of the individual percentages.
• Avg. of Incremental Increase (y—):y— = (3000+2000-3000)/3 = 667
29
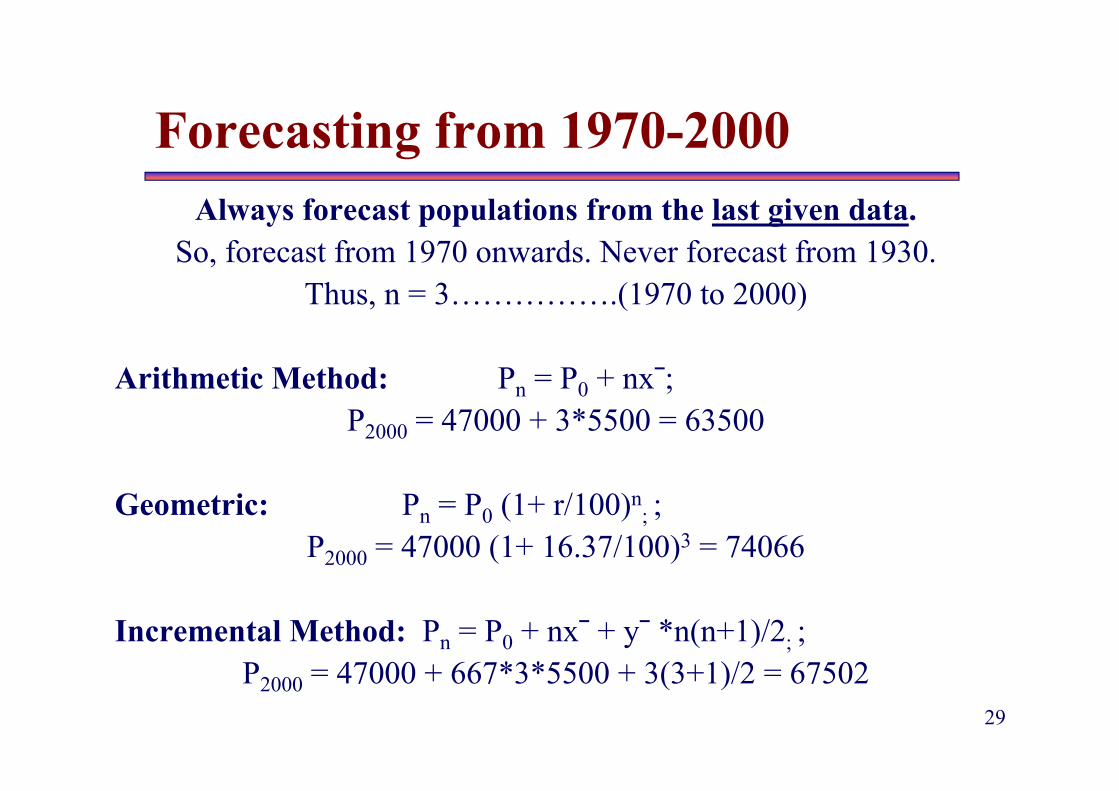
Forecasting from 1970-2000Always forecast populations from the last given data.
So, forecast from 1970 onwards. Never forecast from 1930. Thus, n = 3…………….(1970 to 2000)
Arithmetic Method: Pn = P0 + nxˉ; P2000 = 47000 + 3*5500 = 63500
Geometric: Pn = P0 (1+ r/100)n; ;
P2000 = 47000 (1+ 16.37/100)3 = 74066
Incremental Method: Pn = P0 + nxˉ + yˉ *n(n+1)/2; ; P2000 = 47000 + 667*3*5500 + 3(3+1)/2 = 67502

30
Problem: Logistic Growth Population stabilizes at 15 billion. In 1986,
population was 5 billion; Growth rate was 1.7%. When would N be 7.5 billion and 14 billion respectively?
• k = 15 billion = carrying capacity = max .population that can be supported
• N0 = 5 billion• r0 = 1.7% = 1.7/100 = 0.017• t* = ?• When N = 14 billion, t = ?
31
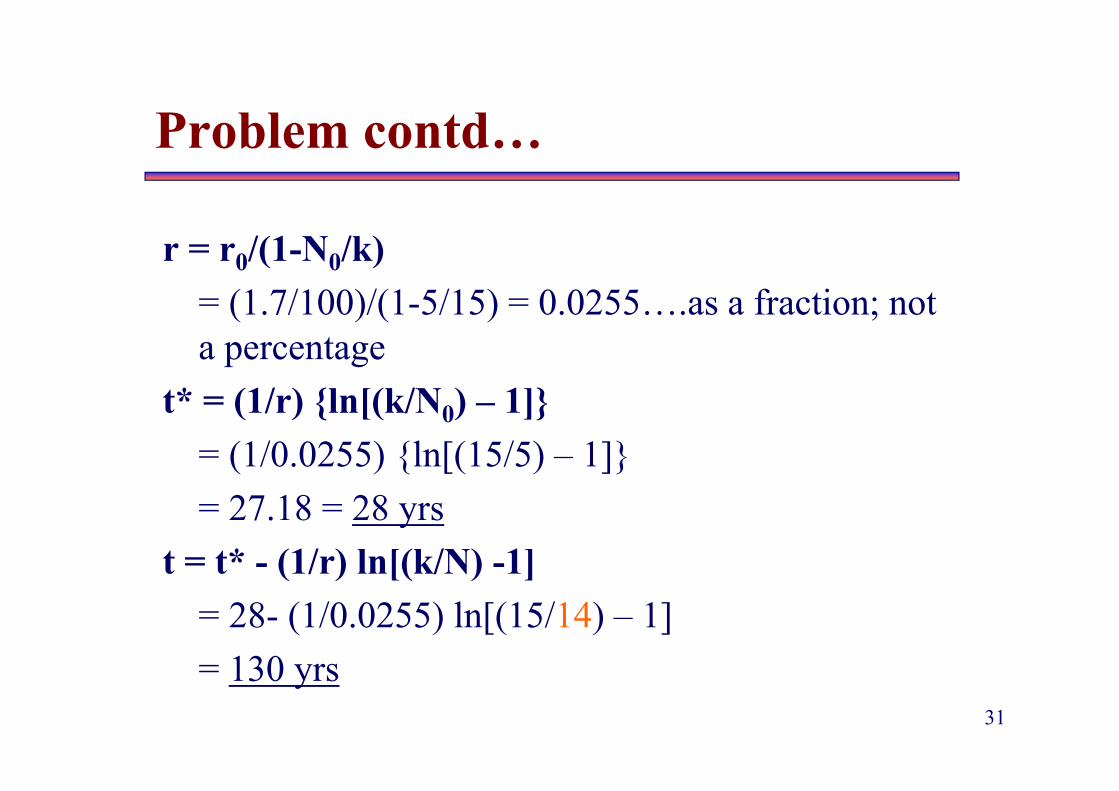
Problem contd…
r = r0/(1-N0/k)= (1.7/100)/(1-5/15) = 0.0255….as a fraction; not a percentage
t* = (1/r) {ln[(k/N0) – 1]}= (1/0.0255) {ln[(15/5) – 1]}= 27.18 = 28 yrs
t = t* - (1/r) ln[(k/N) -1]= 28- (1/0.0255) ln[(15/14) – 1]= 130 yrs

32
Thank You
Related Documents