Lecture 5 Hypothesis testing

Lecture 5 Hypothesis testing. What should you know?
Dec 17, 2015
Welcome message from author
This document is posted to help you gain knowledge. Please leave a comment to let me know what you think about it! Share it to your friends and learn new things together.
Transcript

Lecture 5Hypothesis testing

What should you know?
• Confidence intervals (Wald and bootstrap)• p-value• how to find a normal probability (relates to a p-value)• how to find a normal quantile (relates to the confidence interval)• Central limit theorem (i.e. the standard deviation of the mean is and the distribution is
approximately normal• histogram (good for looking at data, assessing skeweness)• quantile plot (good for assessing normality)• box plot (good for comparing samples)• two sample t-test and its assumptions• power of a test• Type 1 and type 2 error

Examplet-test and confidence interval

Example
• Load SomeData1.sav• Do the test• Observe the confidence interval• Do a box plot

Confidence interval
• 95 % Confidence interval for the difference between the means,
• is the 0.975 quantile of a t distribution with degrees of freedom.• This is a Wald interval: estimate plus/minus quantile x std.err.

Return to the example SomeData1.sav• How would you calculate the pooled standard deviation from this
output?1. Take the standard error for the difference and divide by 2. Or, use the standard deviations from each sample and do:

Why do we care?
• When doing a sample size calculation or a meta-analysis, you sometimes need to be able to retrieve the standard deviation from output that displays different information.

Recall classic hypothesis testing framework• State the hypotheses• Get the test statistic• Calculate the p-value• If p-value is less than the significance level (say 0.05) reject the null• Otherwise Do not reject the null

Technical point
• If p-value is less than , say “there is sufficient evidence to reject the null hypothesis.”• If p-value is greater than , say “there is insufficient evidence to reject
the null”, because:• Either the null is true• Or the sample size was not large enough to detect the alternative• Or the alternative is very close to the null (so we could not detect it)• Or we got unlucky

SignificanceWhat is the probability that we reject the null when the null is true? (i.e. probability of a type 1 error)

PowerIs the sample size large enough to reject the Null when the null is false?


Everbody, roll a D20 for an implausibility check
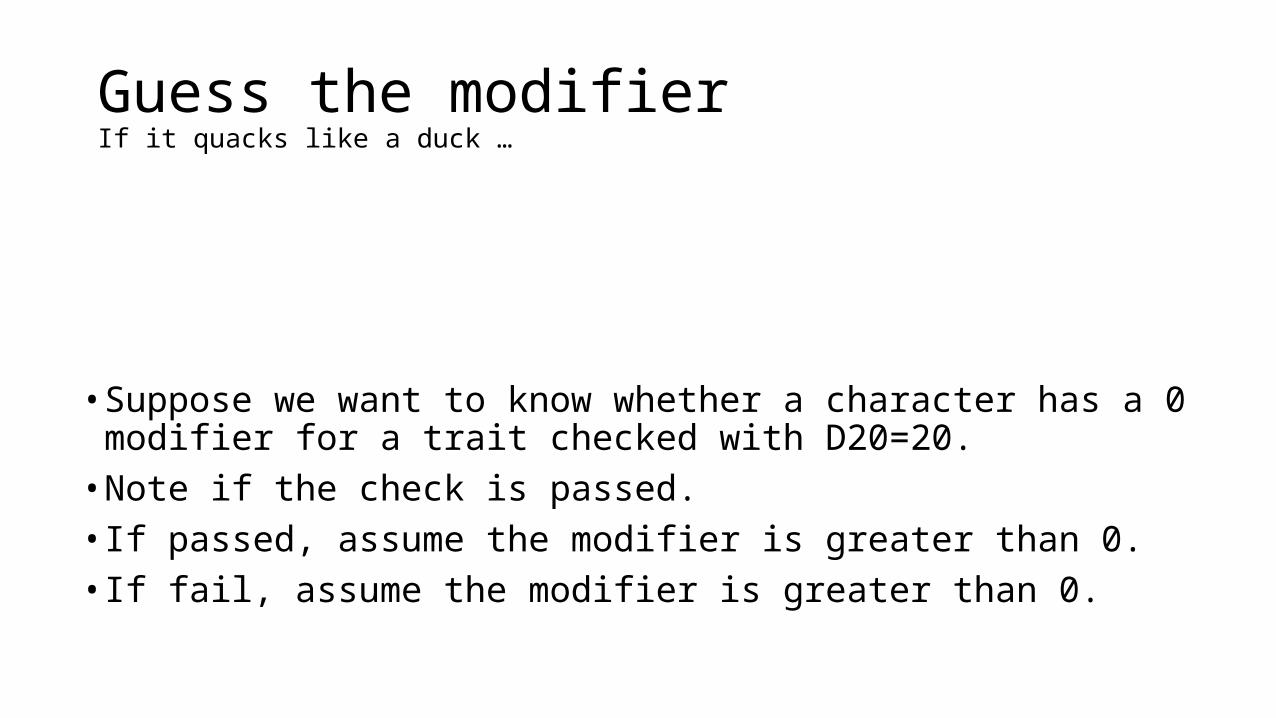
Guess the modifierIf it quacks like a duck …
• Suppose we want to know whether a character has a 0 modifier for a trait checked with D20=20.• Note if the check is passed.• If passed, assume the modifier is greater than 0.• If fail, assume the modifier is greater than 0.

Modifier Must roll Probability of passing the implausibility check
0 20 0.05
4 16 or better 0.25
10 10 or better 0.55
14 6 or better 0.75
15 5 or better 0.80
16 4 or better 0.85
Modifier + dice roll > 19

A problem
• Note that characters with very small modifiers will probably fail the test. This is called a Type 2 error.• So the test works best if the character has a large modifier.• A non-significant result does not “prove” that the character has a 0
modifier.

Power
• The power of a test is the probability of rejecting the null when the null is false.• Power is defined against particular alternatives.• The modifier test is powerful against the alternative that the modifier is 16• The modifier test is weak against the alternative that the modifier is 4.

Gaining power
• Increase the sample size• Use a powerful test (technical stats issue)• Refine the study design to reduce variance
Theses are the same techniques used to reduce the confidence interval.

Some problems with NHSTMultiple testing

Multiple testing
• If I roll the dice often enough, I will pass the implausibility check• This applies to hypothesis testing• Repeated tests on the same data set, within the same study, may
yield a spurious “significant” result• This is called a type 1 error

ExampleSomeData1.sav

When the null is true
• Open SPSS• Go to Transform -> random number generators -> set active generator
-> Mersenne Twister
• -> Set starting points -> random start• Load SomeData1.sav• Add a column of random normal (all mean 0, sd 1)• Go to Analysis -> compare means -> independent samples• At least one person in the class should get a significant result (p < 0.05)
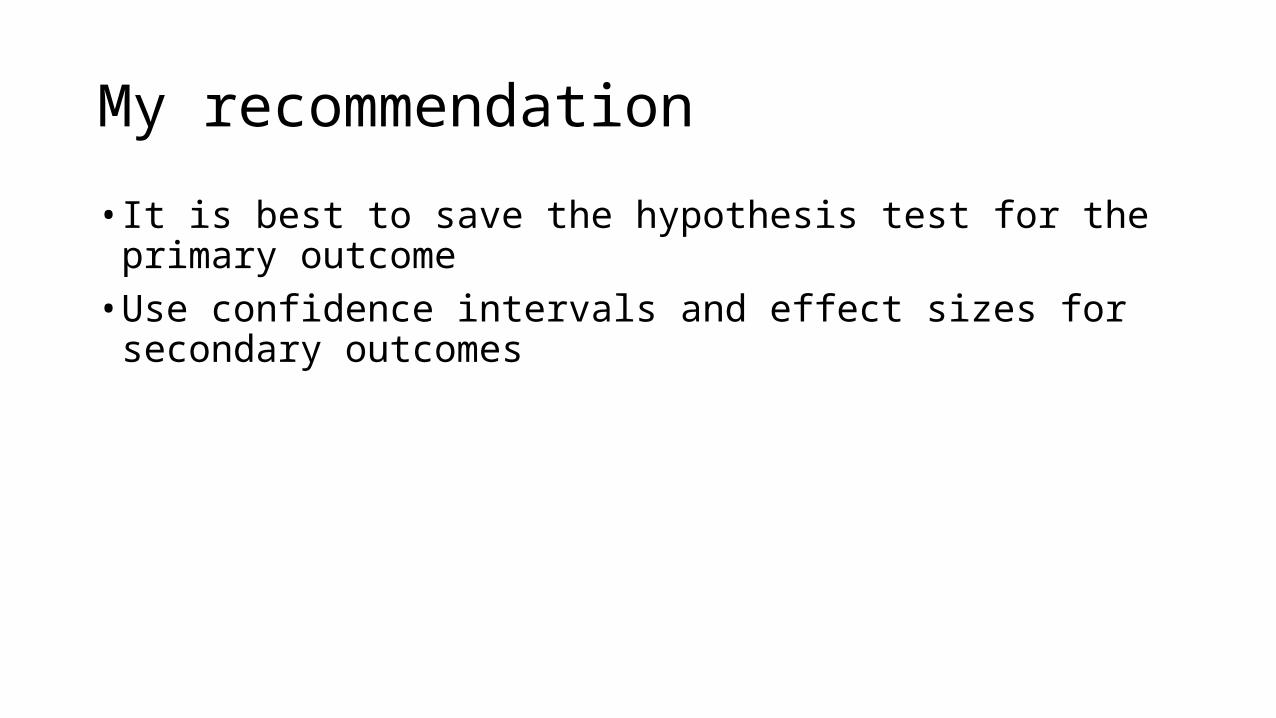
My recommendation
• It is best to save the hypothesis test for the primary outcome• Use confidence intervals and effect sizes for secondary outcomes

What does the p-value tell me?The p-value is not as informative as one might think

What is p (the p-value)?

The correct answer
• The correct answer is c)• The p-value is the probability of getting something at least as extreme
as what one got, assuming that the null hypothesis is true.

p-value and sample size
• The p-value is a function of the sample size• If the null is false (even by a small amount) a large sample size will
yield a small p-value• A large study will almost undoubtedly yield a significant result, even
when nothing interesting is happening.• A small study will almost undoubtedly yield a non-significant result,
even when the intervention is effective.

How many subjects do I need?
• A sample size calculation is an essential part of the design of any study.• The number of subjects you need depends on• variance of the data• the design of the study• the clinically meaningful effect that you want to be able to detect• MCID (minimal clinically important difference) The smallest change that a
patient (or other subject) would view as personally important.
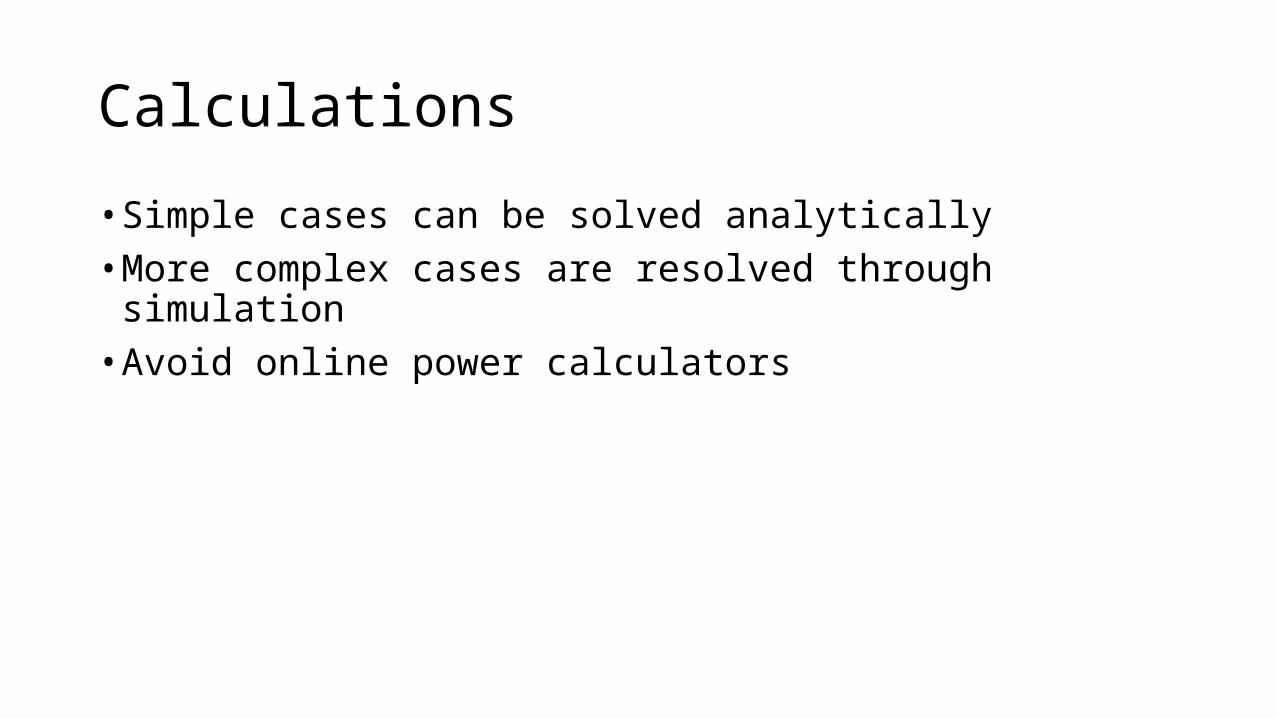
Calculations
• Simple cases can be solved analytically• More complex cases are resolved through simulation• Avoid online power calculators

NHSTA history of abuse

Abuses of NHST
• Fishing expeditions (NHST used as an exploratory technique)• Many measurements of interest (leads to multiple testing)• Measurements with high degree of variability, uncertain distributions (normality
assumption violated, so p-values not accurate)• Convenience samples (violates assumptions of randomness, independence)• Cult-like adherence to • In the presence of electronic computers, very large data bases are available for
analysis; everything is significant• Alternatively, underpowered studies; nothing is significant• Relying on the statistician to come up with the research question (no clear hypothesis)• RESULT: We are a long way from the scientific method

Possible solutions
• Quote estimate and confidence interval and/or• Quote an effect size.• Never only quote the decision (reject/accept); quote the p-value

What is an effect size?
• A measure of the effect (difference between groups) that does not depend on the sample size.• Cohen’s d:
• Alternate suggested effect size:
This statistic falls between 0 and 1. There are rules of thumb for what constitute large, medium and small effect.

SPSS alert
• SPSS does not give you a Cohen’s d or the other effect size for the two-sample comparison.• It does give the mean difference and the confidence interval.

Problems with the effect size
• The effect size is sometimes taken to represent some sort of absolute measure of meaningfulness• Measures of meaningfulness need to come from the subject matter• Quote the p-value, not the decisions (SPSS does this)

Advantages of the p-value
• The p-value measures the strength of the evidence that you have against the null hypothesis.• The p-value is a pure number (no unit of measurement)• A common standard across all experiments using that methodology• Sometimes we need to make a decision: do we introduce the new treatment or not?
Hypothesis testing gives an objective criterion.
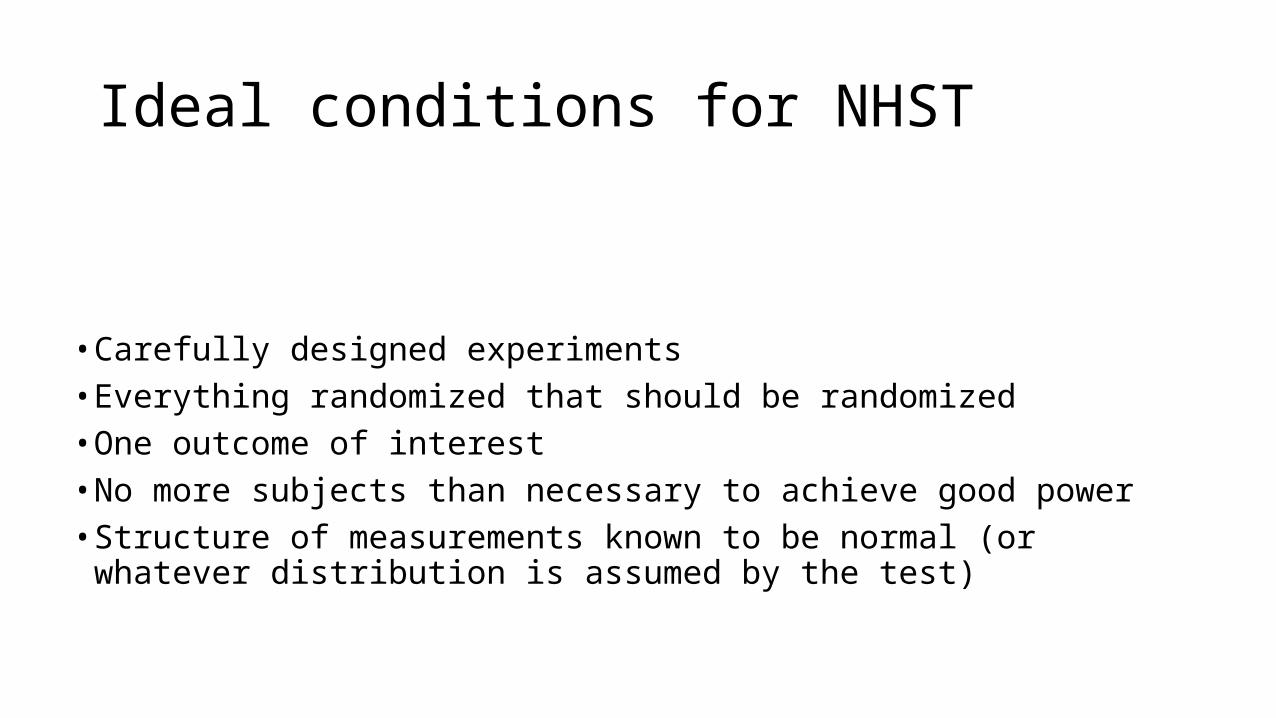
Ideal conditions for NHST
• Carefully designed experiments• Everything randomized that should be randomized• One outcome of interest• No more subjects than necessary to achieve good power• Structure of measurements known to be normal (or whatever distribution is
assumed by the test)

vocabulary
The following are equivalent• The significance level • The probability of a type 1 errorThe following are related• The probability of a type 2 error • The power of the test, Difference between and :• is set by the experimenter• is a consequence of the design.

Pop quiz
•What is the difference between the significance level of a test and the p-value of that test?

Answer
• The significance level (0.05, say) determines whether the null hypothesis is rejected or not.• The p-value (or observed significance level) measures the degree of
evidence against the null hypothesis in the data.


The two-sample testAssumptions

Assumptions
1. The sample means are normally distribution (or almost)2. Variances are equal3. Everything is independent

Normality
• The t-test is usually robust with respect to this conditions. • If the sample is large enough, this condition will hold.• As a reality check, a bootstrap test is possible or a non-parametric
test.

Bootstrap two-sample test
• This is a resampling test.• The computer repeatedly permutes group membership labels
amongst the cases and calculates the T-statistic with the new groups.• If the null hypothesis is true, group membership is irrelevant.• What proportion of the bootstrapped T statistics are more extreme
that the “real” one?• This proportion is the p-value of the test.

Transforming the data
• Sometimes a transformation of the data will produce something more normal like• Take logs• Take square roots• Other transformations are possible
• My experience: this rarely works, but sometimes it does.

Example: the cloud seeding data
• Load clouds.csv into SPSS• Do a t-test of seeded vs unseeded data• Transform with logarithms• Repeat• Notice that there is a significant difference when the data have been
transformed.• Questions: Does it matter whether you use natural or base 10
logarithms?

Check for normality
• Quantile plot on each of the two samples (SPSS does not do this easily)• Boxplot (at least gives an idea of symmetry)• Check the residuals (SPSS does not do this easily)

HeteroscedasticityWhen the variances are unequal

Unequal variances
• The two-sample t test assumes both samples have the same variance (resp. standard deviation)• Violation of this assumption can be bad, especially when the sample
sizes are unequal.

Welch version of the t-test
• Supplied automatically in SPSS under “unequal variances assumption”• Replaces the pooled estimate with a different estimate of the
standard deviation.• Reduces the degrees of freedom• This inflates the quantile of the t distribution.• Makes a more conservative test

Test for equality of variances
• Levene test• SPSS does this automatically• The statistic is always positive• large values suggest different variances• SPSS calculates a p-value and supplies this.

Example
• Load SomeData2.sav• Run the test• Check Levene• Do a boxplot• Compare to SomeData1.sav
• A boxplot is a good way to determine graphically if the samples have different variances.

Lack of independenceA show stopper

Example
• Load invisibility.sav• Load invisibility RM.sav
• These files have the same numbers in the same groups• invisibility.sav assume two independent groups• invisibility RM.sav a repeated measures design

Does a cloak of invisibility increase mischief?
1. Select a group of students. Randomly assign a cloak of invisibility to half the members. Record number of mischievous actions within the time frame of the study.
2. Select a group of students. Give each person a cloak of invisibility. Record the number of mischievous actions within the time frame. Remove the cloaks. Record number of mischievous actions within the time frame. Compare pre vs post.

Matched pairs design
• Select n pairs. Members of each pair should be similar in some way.• Randomly assign the treatment to one member of each pair; the
other gets the control.• Record what happens.• Compare the difference.• The “pair” might be the same individual at different time points (pre-
post analysis).
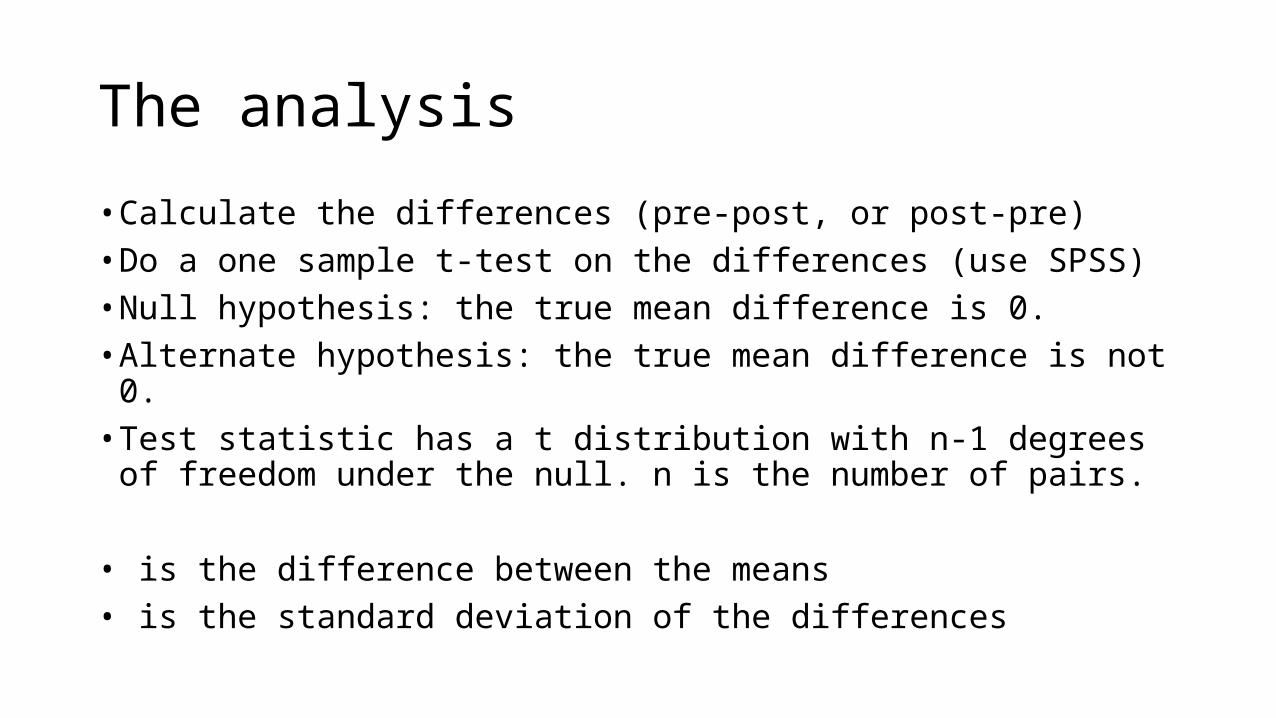
The analysis
• Calculate the differences (pre-post, or post-pre)• Do a one sample t-test on the differences (use SPSS)• Null hypothesis: the true mean difference is 0.• Alternate hypothesis: the true mean difference is not 0.• Test statistic has a t distribution with n-1 degrees of freedom under
the null. n is the number of pairs.
• is the difference between the means• is the standard deviation of the differences
Example
• Look at the output in SPSS• Can you see where everything comes from?• Is there a levene test for the paired t-test?• What assumptions do you think need to hold for the paired t-test?• Create a variable for the pre-post differences. Test for normality.

Assumptions
• We have matched intelligently (i.e. pairs share common features)• The differences are normal with common mean and variance• The differences are independent

The one-sided testSeldom seen in medical research papers

Independent two sample test
• Different alternate hypothesis:
• Or, we might consider:

Implementation
• Not done explicitly in SPSS• Perform the standard two-sample test• Halve the p-value of what you get• Use this value to make a decision (accept vs reject)

What is going on?
• The rejection region favours values that “trend” towards the alternate hypothesis• Suppose the alternate hypothesis
is that the group 2 mean is greater than the group 1 mean, with 3 observations in each group. We observe 1.5
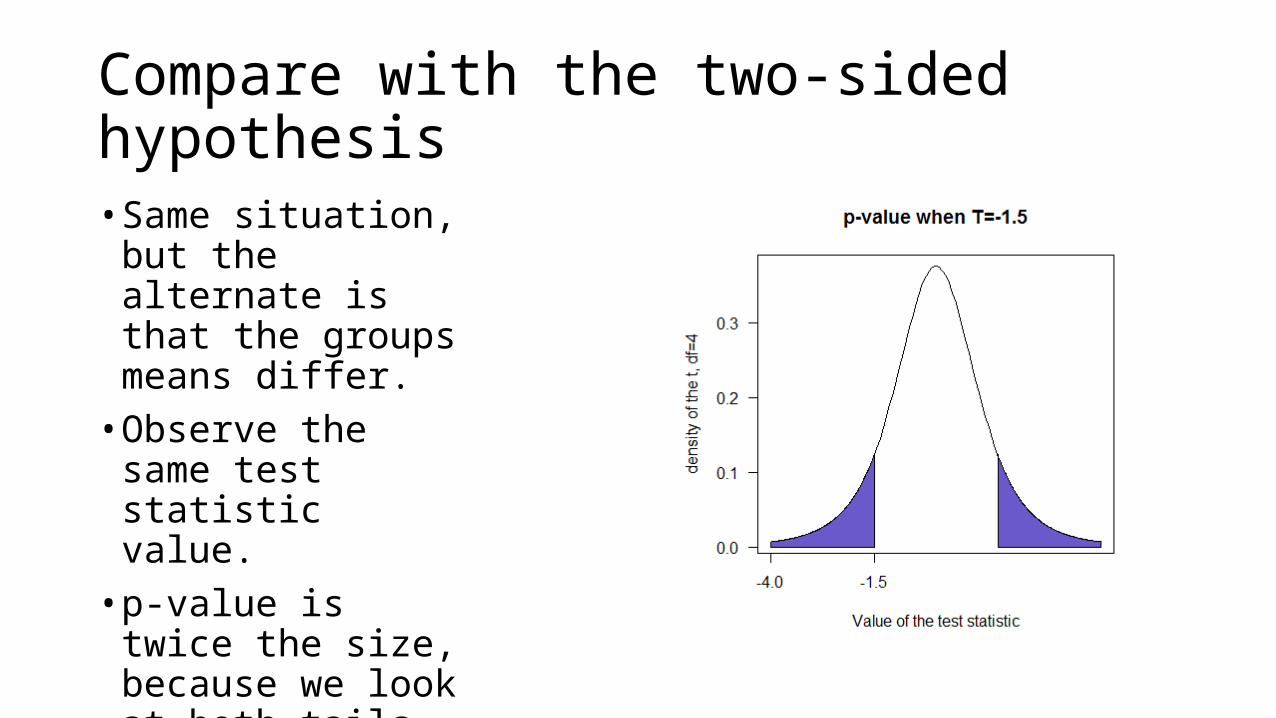
Compare with the two-sided hypothesis• Same situation, but the
alternate is that the groups means differ.• Observe the same test
statistic value.• p-value is twice the
size, because we look at both tails.

What happens in practice
• Editors of medical journals hate one-sided hypothesis tests.• However, they (the tests, not the editors) can be legitimate.• If you only care about one possibility (say that the new treatment
gives a bigger response than the old treatment), the one-sided test has greater power.• You are more likely to reject the null when the null is false. This is
good.

Comparing 3 or more meansANOVA (Analysis of Variance)

Run example
• Open SPSS file Viagra.sav• Note the structure of the file• One variable denotes group membership• One variable denotes the response
• Run Analysis -> Compare means -> One-way ANOVA

Assumptions and goals
• The response is normally distributed• The data are independent• Each subject belongs to exactly one group• All responses have the same variance• We want to determine if the group means differ or not

Look at the test statistic
• The test statistic (called F) is a ratio of variance estimates.• Numerator: a variance estimate built from the group means and
grand mean.• Denominator. the pooled variance estimate• The ratio of two independent estimates of the same variance has an F
distribution.• Under H0, the test statistic has an F distribution.• If the group means differ, the F statistic will be large.

The Formula
• between groups sum of squares (k groups)• within groups sum of squares (n observations)• • F has an F distribution with k-1 and n-k degrees of freedom.

Degrees of freedom
• Yes, there are degrees of freedom here• The F has 2 numbers associated with it:• the DF of the numerator = number of groups – 1• the DF of the denominator = n – number of groups

Procedure
• Set up the data file (one variable for groups, one for responses)• Look at the boxplot• Run the analysis• Note the p-value• Note the value of R-squared• Look at the residual with a quantile plot to check for normality• If significant, look at post-hoc tests to determine which means differ from
the rest.• Alternatively, can plan “contrasts” and test these when the data are
balanced.
Related Documents