©2011 Brooks/Cole, Cengage Learning Elementary Statistics: Looking at the Big Picture 1 Lecture 4: Chapter 3, Section 4 Designing Studies (Focus on Experiments) Definitions Randomization Control Blind Experiment Pitfalls Specific Experimental Designs

Welcome message from author
This document is posted to help you gain knowledge. Please leave a comment to let me know what you think about it! Share it to your friends and learn new things together.
Transcript
©2011 Brooks/Cole, CengageLearning
Elementary Statistics: Looking at the Big Picture 1
Lecture 4: Chapter 3, Section 4Designing Studies(Focus on Experiments)DefinitionsRandomizationControlBlind ExperimentPitfallsSpecific Experimental Designs

©2011 Brooks/Cole,Cengage Learning
Elementary Statistics: Looking at the Big Picture L4.2
Looking Back: Review
4 Stages of Statistics Data Production Displaying and Summarizing Probability Statistical Inference
©2011 Brooks/Cole,Cengage Learning
Elementary Statistics: Looking at the Big Picture L4.3
Looking Back: Review
2 Types of Study Design Observational study: record variables’ values
as they naturally occur Drawback: confounding variables due to self-
assignment to explanatory values Example: Men who drink beer are more prone to
lung cancer than those who drink red wine(what is the confounding variable here?)
Experiment: researchers control values ofexplanatory variable If well-designed, provides more convincing evidence
of causation.
©2011 Brooks/Cole,Cengage Learning
Elementary Statistics: Looking at the Big Picture L4.4
Definitions Factor: an explanatory variable in an
experiment. Treatment: value of explanatory variable
imposed by researchers in an experiment.A control group (individuals receiving notreatment or base-line treatment) may beincluded for comparison.If individuals are human, we call themsubjects.

©2011 Brooks/Cole,Cengage Learning
Elementary Statistics: Looking at the Big Picture L4.6
Example: Randomized Controlled Experiment
Background: To test if sugar causes hyperactivity,researchers randomly assign some children to low and othersto high levels of sugar consumption…
Question: Why are random assignments best? Response: Randomization helps rule out
_________________________________________________
X
X
X
X
X
X
X
XX
X
Sample
L
Population
H
X HX L
H
L
©2011 Brooks/Cole,Cengage Learning
Elementary Statistics: Looking at the Big Picture L4.7
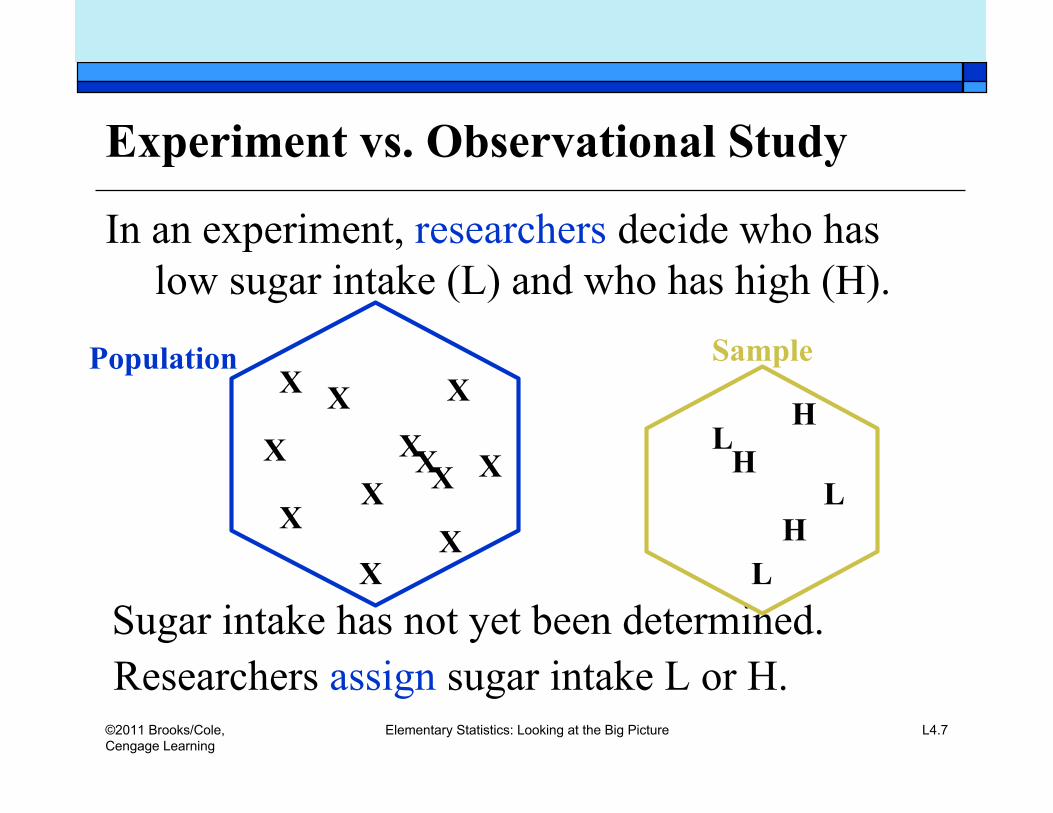
Experiment vs. Observational Study
In an experiment, researchers decide who haslow sugar intake (L) and who has high (H).
X
X
X
X
X
X
X
XX
X
Sample
L
Population
H
X HX L
H
LSugar intake has not yet been determined.Researchers assign sugar intake L or H.

©2011 Brooks/Cole,Cengage Learning
Elementary Statistics: Looking at the Big Picture L4.9
Experiment vs. Observational StudyIn observational study, individuals have already chosen
low (L) or high (H) sugar intake.
Researchers make no changes to sugar intake.
L
L
H
L
L
H
L
LH
H
SamplePopulation
HL
HH
L
LH
L

©2011 Brooks/Cole,Cengage Learning
Elementary Statistics: Looking at the Big Picture L4.11
Example: Randomize at 1st or 2nd Stage? Background: Consider two selection issues in our
sugar-hyperactivity experiment: What individuals are included in the study? Who consumes low and high amounts of sugar?
Question: At which stage is randomizationimportant?
Response: 1st stage: Individuals studied __________________
(Otherwise___________________ may be an issue.) 2nd stage:Assignment to sugar (L or H) _____________
Volunteering which treatment to get is __________
nancyp
Text Box
Practice: 3.48c p.61
©2011 Brooks/Cole,Cengage Learning
Elementary Statistics: Looking at the Big Picture L4.12
Must an experiment have a control group?Recall our definition: Experiment: researchers manipulate
explanatory variable, observe responseThus, experiment may have no control group… if all subjects must be treated if simulated treatment is risky if the experiment is poorly designedAs long as researchers have taken control of the
explanatory variable, it is an experiment.
©2011 Brooks/Cole,Cengage Learning
Elementary Statistics: Looking at the Big Picture L4.13
Definitions: Three Meanings of “Control” We control for a confounding variable in an
observational study by separating it out. Researchers control who gets what treatment
in an experiment by making the assignmentthemselves, ideally at random.
The control group in an experiment consistsof individuals who do not receive a treatmentper se, or who are assigned a baseline value ofthe explanatory variable.
©2011 Brooks/Cole,Cengage Learning
Elementary Statistics: Looking at the Big Picture L4.14
Double-blind ExperimentsTwo pitfalls may prevent us from drawing a
conclusion of causation when results of anexperiment show a relationship between theso-called explanatory and response variables.
If subjects are aware of treatment assignment If researchers are aware of treatment
assignment
©2011 Brooks/Cole,Cengage Learning
Elementary Statistics: Looking at the Big Picture L4.15
Definitions The placebo effect is when subjects respond to the
idea of treatment, not the treatment itself. A placebo is a “dummy” treatment. A blind subject is unaware of which treatment
he/she is receiving. The experimenter effect is biased assessment of (or
attempt to influence) response due to knowledge oftreatment assignment.
A blind experimenter is unaware of which treatmenta subject has received.

©2011 Brooks/Cole,Cengage Learning
Elementary Statistics: Looking at the Big Picture L4.17
Example: Subjects Not Blind
Background: Suppose after children are randomlyassigned to consume either low or high amounts ofsugar, researchers find proportion hyperactive isgreater for those who consumed higher amounts.
Question: Can we conclude sugar causeshyperactivity?
Response:
Improvement:
nancyp
Text Box
Practice: 1.2 p.11
nancyp
Text Box
Practice: 1.2 p.11
nancyp
Text Box
Practice: 1.2 p.11
nancyp
Text Box
Practice: 3.36a p.59
©2011 Brooks/Cole,Cengage Learning
Elementary Statistics: Looking at the Big Picture L4.19
Example: Experimenters Not Blind
Background: Suppose after children are randomlyassigned to diets sweetened either artificially or withsugar, researchers find proportion hyperactive isgreater for those who consumed sugar.
Question: Can we conclude sugar causeshyperactivity?
Response:
More problematic if responses are assessed______________
Improvement:
nancyp
Text Box
Practice: 3.37 p.59

©2011 Brooks/Cole,Cengage Learning
Elementary Statistics: Looking at the Big Picture L4.20
Best Evidence of CausationIn general, conclusions of causation are most
convincing if a relationship has beenestablished in a randomized controlleddouble-blind experiment.
A Closer Look: In the original studies reporting a relationshipbetween sugar and hyperactivity, conducted in the 1970’s,experimenters may have been aware of the children’s diet whenthey assessed behavior (randomized controlled single-blind).Many studies since then have failed to establish a relationship.

©2011 Brooks/Cole,Cengage Learning
Elementary Statistics: Looking at the Big Picture L4.21
Other Pitfalls in Experimentation Lack of realism (lack of ecological validity) Hawthorne effect (people’s performance is
improved due to awareness of being observed) Non-compliance Treatments unethical Treatments impractical/impossible to impose

©2011 Brooks/Cole,Cengage Learning
Elementary Statistics: Looking at the Big Picture L4.23
Example: Hawthorne Effect, Lack of Realism Background: Suppose researchers want to determine
if TV makes people snack more. While study participantsare presumably waiting to be interviewed, half are assigned to aroom with a TV on (and snacks), the other half to a room withno TV (and snacks). See if those in the room with TV consumemore snacks.
Question: If participants in the room with TV snackmore, can we conclude that, in general, people snackmore when they watch TV?
Response: No: _________________(TV & snacking habits different in contrived setting);______________ (if people suspect they’re observed).
nancyp
Text Box
Practice: 3.38 p.59

©2011 Brooks/Cole,Cengage Learning
Elementary Statistics: Looking at the Big Picture L4.25
Example: Non-Compliance in Experiment
Background: To test if sugar causes hyperactivity,researchers randomly assign 50 children to low and50 to high levels of sugar consumption; 20 drop outof each group. For remaining children (30 in eachgroup), suppose proportion hyperactive issubstantially greater in the high-sugar group.
Question: Can we conclude sugar causeshyperactivity?
Response: ____ ______________makes treatmentand control groups different in ways that may affectresponse.
nancyp
Text Box
Practice: 3.39 p.60

©2011 Brooks/Cole,Cengage Learning
Elementary Statistics: Looking at the Big Picture L4.27
Example: Another Flawed Experiment
Background: To test if stuttering is a learned (ratherthan inborn) trait, a researcher in Iowa in 1939randomly assigned subjects to… Control: 11 orphans in ordinary speech therapy Treatment: 11 orphans badgered and interrupted
in sessions with speech therapist Of the 11 in treatment group, 8 became stutterers. Question: What’s wrong with this experiment? Response: _____________
nancyp
Text Box
Practice: 3.40e p.60

©2011 Brooks/Cole,Cengage Learning
Elementary Statistics: Looking at the Big Picture L4.28
Examples: Treatments Impossible/Impractical
Taller men get married sooner, promotedquicker, and earn higher wages…
There is a link between obesity and lowsocio-economic status in women…
Height is impossible to control.Weight is difficult to control.Socio-economic status is too costly to control.
©2011 Brooks/Cole,Cengage Learning
Elementary Statistics: Looking at the Big Picture L4.29
Modifications to randomized experiment Blocking: Divide first into groups of
individuals who are similar with respect to anoutside variable that may be important inrelationship studied.
Paired design: Randomly assign one of eachpair to receive treatment, the other control.(Before-and-after is a common paired design.)
Looking Back: blocking is to experimentationas stratification is to sampling.
©2011 Brooks/Cole,Cengage Learning
Elementary Statistics: Looking at the Big Picture L4.31
Example: Blocked Experiment Background: Study tested theory that use of
stronger sunscreen causes more time in sun. Beforevacation, 40+ students given weak sunscreen, 40+given strong. Students recorded time spent in suneach day.
Question: How to incorporate blocking, ifresearchers suspect location plays a role inrelationship between type of sunscreen and amountof time spent in sun?
Response:
nancyp
Text Box
Practice: 3.40f p.60
©2011 Brooks/Cole,Cengage Learning
Elementary Statistics: Looking at the Big Picture L4.33
Example: Paired Experiment Background: Study tested theory that use of
stronger sunscreen causes more time in sun. Beforevacation, 40+ students given weak sunscreen, 40+given strong. Students recorded time spent in suneach day.
Question: How to incorporate paired design, ifresearchers suspect location plays a role inrelationship between type of sunscreen and amountof time spent in sun?
Response:
nancyp
Text Box
Practice: 3.40g p.60

©2011 Brooks/Cole,Cengage Learning
Elementary Statistics: Looking at the Big Picture L4.34
Advantage of Paired Design
The paired design helps to ensure that treatmentand control groups are as similar as possiblein all other respects, so that if their responsesdiffer, we have evidence that the treatment isresponsible.
Discussion Question: Why do not just twins, butalso researchers, flock to the annual festivalin Twinsburg, Ohio?
©2011 Brooks/Cole,Cengage Learning
Elementary Statistics: Looking at the Big Picture L4.37
Example: Combining Paired and Two-SampleDesigns Background: Studies often randomly assign one
group to a placebo and the other to a drug.Responses to the variable of interest are assessedbefore and after a period of time, then compared tosee benefits or side effects.
Question: What aspect of the design is two-sample,and what aspect is paired?
Response:two-sample:paired:
nancyp
Text Box
Practice: 3.47 p.61
©2011 Brooks/Cole,Cengage Learning
Elementary Statistics: Looking at the Big Picture L4.38
Lecture Summary (Experiments)
Definitions Randomization; 2 stages of selection Control group “Blind” study design
Subjects blind to avoid placebo effect Researchers blind to avoid experimenter effect
Other pitfalls of experiments: lack of realism, Hawthorneeffect, non-compliance, unethical or impractical treatment
Specific experimental designs Blocked Paired or two-sample
Related Documents