Lecture 3: Research Questions

Welcome message from author
This document is posted to help you gain knowledge. Please leave a comment to let me know what you think about it! Share it to your friends and learn new things together.
Transcript

Lecture 3: Research Questions

Scientific Reasoning

Research Connects Theory and Real World
Theory
Real World
SubjectsMeasures
ProceduresProblem Analysis
Research Question
Field of InquiryArea of Interest
Problem-IdeaTheory
Hypothesis
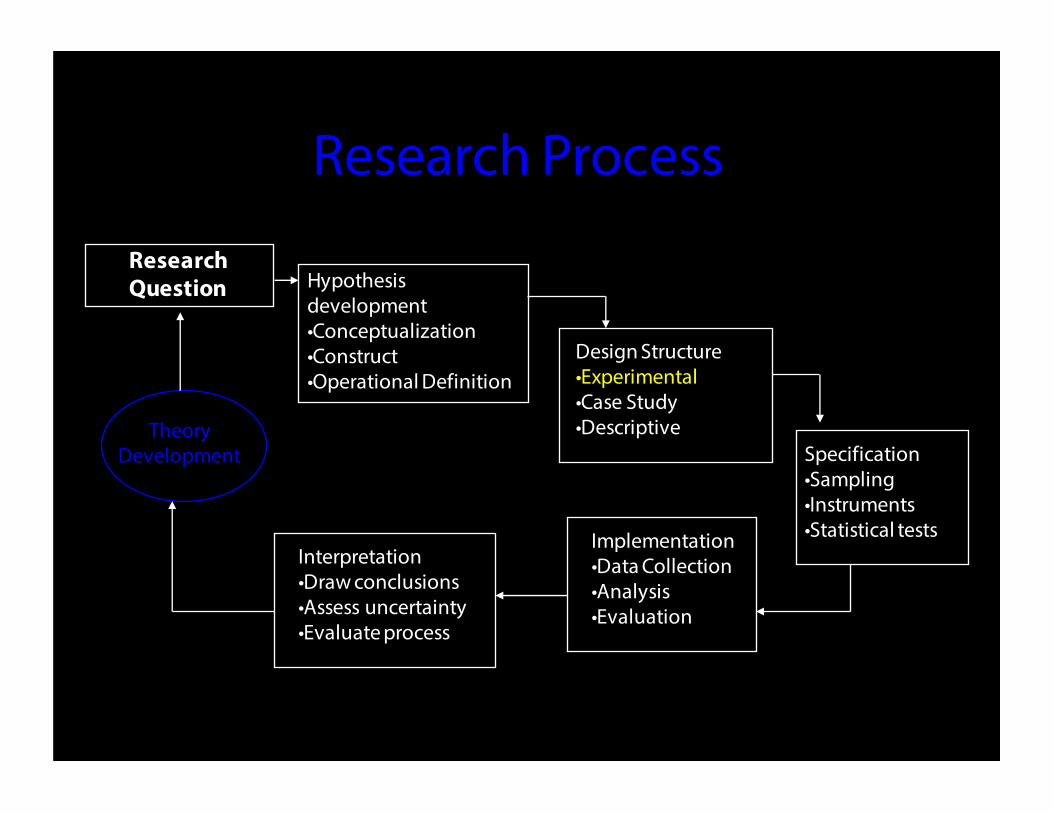
Research Process
Hypothesis development•Conceptualization•Construct•Operational Definition
Design Structure•Experimental•Case Study•Descriptive
Specification•Sampling•Instruments•Statistical testsImplementation
•Data Collection•Analysis•Evaluation
Research Question
TheoryDevelopment
Interpretation•Draw conclusions•Assess uncertainty •Evaluate process

Types of Research Projects
1. Theory building: Explanting a phenomenon2. Fact-finding/filling gaps in knowledge 3. Testing hypotheses with empirical observations4. Establishing a relationship between variables 5. Examining adequacy of models or theories6. Evaluation of a policy intervention 7. Critical analysis of theoretical positions8. Contributing to an understanding of a concept

Good Research Questions• Grounded in theoretical and empirical literature
• Testable by empirical methods
• Stated clearly and simply
• Not too abstract
• Not too complex

Some Advice from Experience• Develop a research problem that matches your
interests, training, and skills you are willing to learn.• Base research on current evidence.• The research question should logically present each
step from what is known to filling a gaps.• Do not follow a trend but focus on your scientific
curiosity. What you want to find out and how it will add to the knowledge base.
• Avoid topics. Look at clearly defined research problems and questions instead.
• Stay focused. You will find many things of interest along the path, but ask yourself: ‘Is this related to what I want to uncover or just a point of interest?’
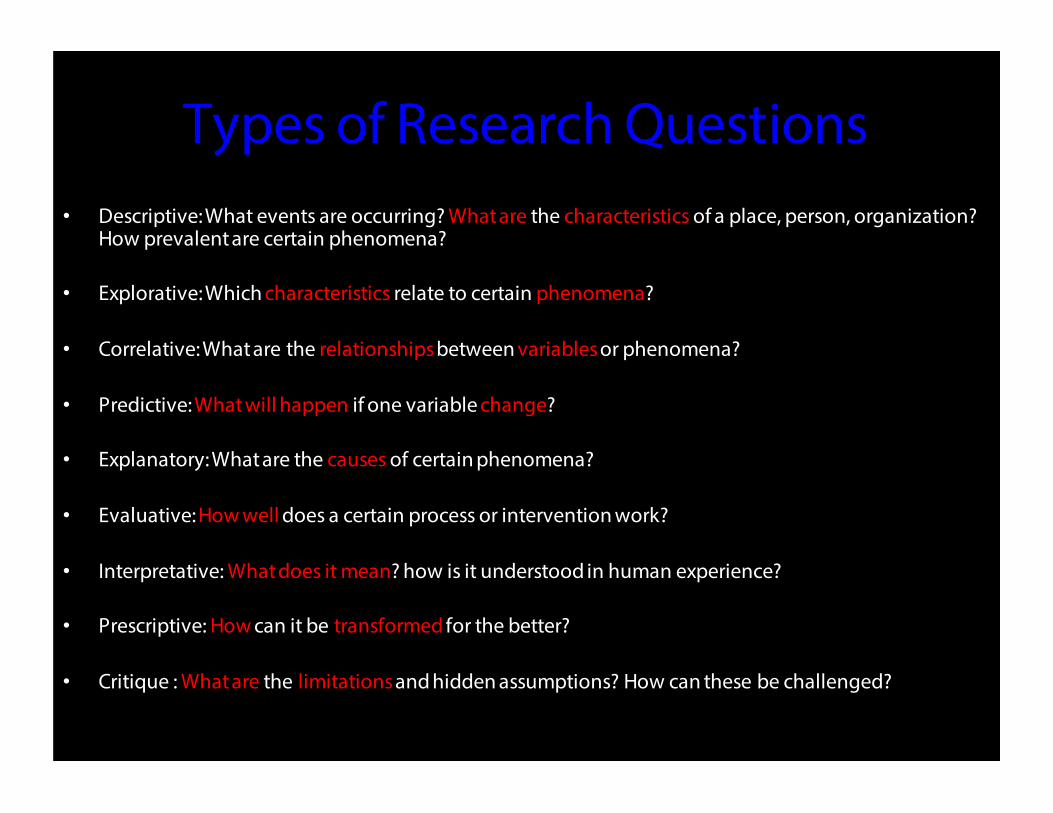
Types of Research Questions• Descriptive: What events are occurring? What are the characteristics of a place, person, organization?
How prevalent are certain phenomena?
• Explorative: Which characteristics relate to certain phenomena?
• Correlative: What are the relationshipsbetween variablesor phenomena?
• Predictive: What will happen if one variable change?
• Explanatory: What are the causes of certain phenomena?
• Evaluative: How well does a certain process or intervention work?
• Interpretative: What does it mean? how is it understood in human experience?
• Prescriptive: How can it be transformed for the better?
• Critique : What are the limitations and hidden assumptions? How can these be challenged?

Sample Research Questions• Descriptive: How prevalent is the use of private cars for commuting to
work in Seattle?
• Explorative: Do households with more cars have higher vehicle miles traveled (VMT) per capita?
• Correlative: Is there a relationship between development patterns and travel behavior measured in VMT per capita by car?
• Predictive: Will increase in mixed-used development reduce VMT per capita by car?
• Explanatory: Does gasoline price affects VMT per capita by car?
• Evaluative: Which policy is more effective in reducing VMT per capita by car?

Does increase in mixed-used development reduce vehicle miles traveled (VMT) per capita by car?
Independent Construct
Dependent Construct
Relationship
DevelopmentPattern
VMT per capitaby car
Causality
OPERATIONALIZE

Building Blocks of a TheoryDavid Whetten (1989) suggests that there are four building blocks of a theory: constructs, propositions, logic, and boundary conditions/assumptions.
Constructs capture the “what” of theories (i.e., what concepts are important for explaining a phenomenon).
Propositions capture the “how” (i.e., how are these concepts related to each other).
Logic represents the “why” (i.e., why are these concepts related).
Boundary conditions/assumptions examines the “who, when, and where” (i.e., under what circumstances will these concepts and relationships work).

Properties of Theory
• Testable/Falsifiable• Logically sound (deductive validity) • Explanatory & Accurate (inductive validity) • Parsimonious: Necessary and Sufficient
conditions

ParsimonyParsimony examines how much of a phenomenon is explained with how few variables.
Ockham’s razor principle states that among competing explanations that sufficiently explain the observed evidence, the simplest theory (i.e., one that uses the smallest number of variables or makes the fewest assumptions) is the best.
Parsimonious theories have higher degrees of freedom, which allow them to be more easily generalized to other contexts, settings, and populations.

Hypothesis
A hypothesis is a tentative statement, subject to empirical testing, of the expected relationship between variables. A hypothesis is grounded in preliminary observations, yet sometimes in practice it is little more than "an educated guess."
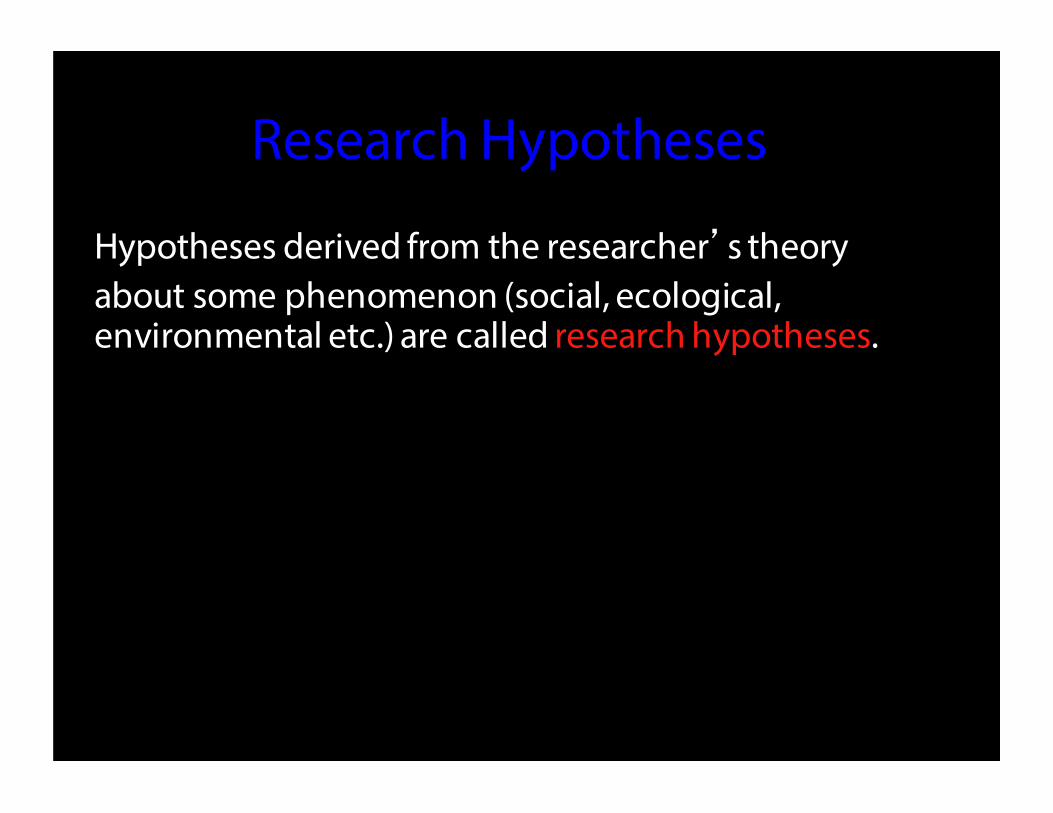
Research Hypotheses
Hypotheses derived from the researcher’s theoryabout some phenomenon (social, ecological, environmental etc.) are called research hypotheses.

Research Hypotheses
Hypotheses derived from the researcher’s theoryabout some phenomenon (social, ecological, environmental etc.) are called research hypotheses.
Null hypotheses serve to refute or deny what is explicitly indicated in the research hypothesis.They are also statements about the reality of things.

Statistical hypothesesResearch hypotheses and null hypotheses transformed into numerical
quantities = statistical hypotheses.
For example, statistical hypotheses concerning the differences in average ages between groups A and B:
Ho: Xa = Xb (null hypothesis); Ha: Xa ≠ Xb (research hypothesis).
To test the research hypothesis that group A is older than group B:
Ho: Xa < Xb (null hypothesis); Ha: Xa > Xb (research hypothesis).
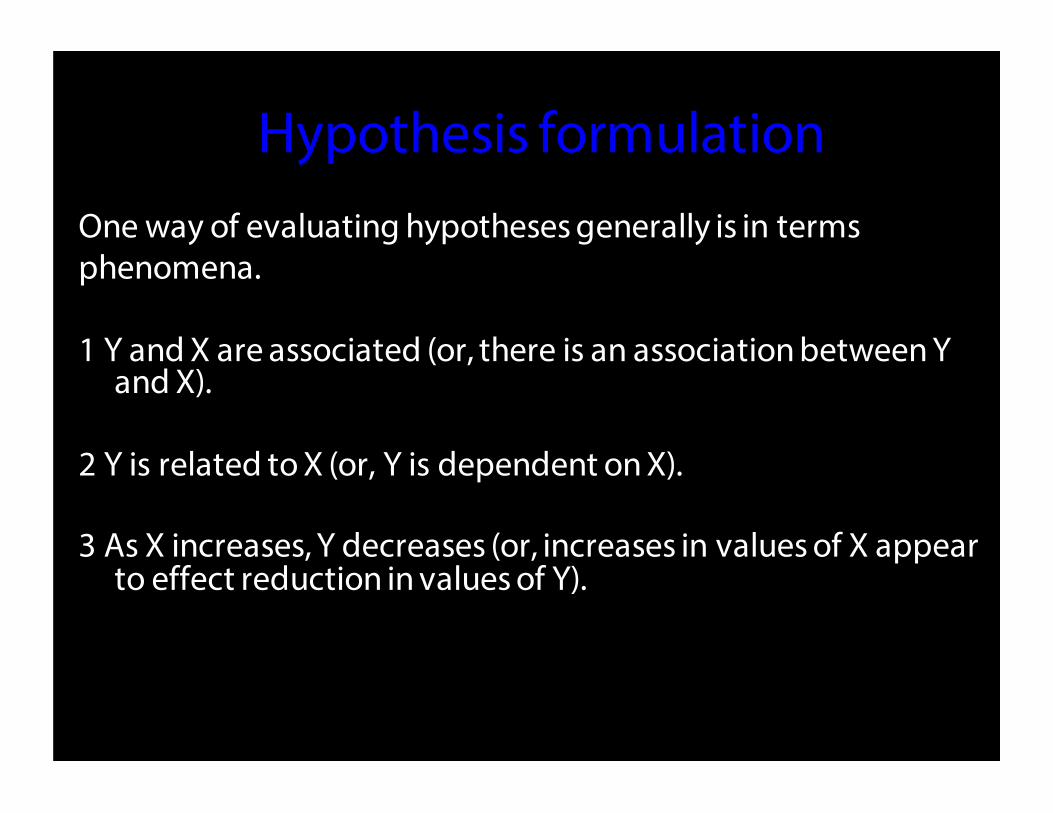
Hypothesis formulationOne way of evaluating hypotheses generally is in termsphenomena.
1 Y and X are associated (or, there is an association between Y and X).
2 Y is related to X (or, Y is dependent on X).
3 As X increases, Y decreases (or, increases in values of X appear to effect reduction in values of Y).

VariablesWhat are variables?
• Properties of objects and events that can take on different values.
Kinds of variables:
• Discrete & Continuous
• Independent, Dependent, & Confounding

OperationalizationA procedure by which one selects observable indicators (variables) to
represent theoretical concepts.
A variable is a theoretically relevant concept which may beobserved to take different values in different cases
1. Independent variable (explanatory variable) - taken as a given, used to explain other phenomena.
2. Dependent variable (outcome, response variable) - values we try to explain by looking at other variables.

Operationalization of a variableOperationalization of a variable defines how the variables we have identified and defined will be measured with real (available) data.
Obstacles to operationalizing variables 1. Conceptual 2. Practical
a. Reliability: a reliable measure yields the same values for a particular case in repeated measurements
b. Validity: a valid measure is an appropriate measure of the concept in which you are interested

Problem VariablesThe fundamental research design problem of social science: lurking variables:
a. Lurking variable ("omitted variable"): a variable which has an important effect on the relationship among variables in the study but is not included in the study.
b. Confounding variables: two variables whose effects cannot be distinguished from each other

Types of RelationRelation between variables can be described in avariety of ways:
• No relationship (Null hypothesis)
• Direction of Relation: Positive or Negative
• Magnitude of Relation: Strong, weak, unrelated. • Causal, Predictive, Association

Testing hypothesesTesting hypotheses means subjecting them to empirical
scrutiny to determine if they are supported or refuted by observations.
Decision rules specify conditions under whichthe researcher will decide to refute or support thehypothesis.
Decision rules relate to• the level of significance, and• the specification of the sampling distribution.

Hypothesis testing
• Step 1: Set up hypothesis– determine whether it is 1-tailed or 2-tailed test
• Step 2: Compute test statistics• Step 3: Determine p-value of the test statistic
– for a pre-determined alpha, you can find the corresponding critical limit
• Step 4: Draw conclusion
– reject H0 if p-value < alpha (ie greater than the critical limit)
– accept H0 if p-value > alpha (ie less than the critical limit)

A statistical hypothesis is a statement about the parameters of a probability distribution.
Null hypothesis Ho: µ1 = µ2
Alternative hypothesis Ha: µ1 ¹ µ2
µ1 µ2
µ is the mean ofa distribution

Level of significance
• When a difference in characteristics (e.g., median income, VMT, land value etc. ) between two groups is observed, at what point do we conclude that the difference is significant?
• To answer this, probability theory defines the likelihood that one’s observations or results are expected.

Statistical Significance• If we set a probability level or significance level
at <0.05
• the difference is statistically significant if the probability of the difference occurring by chance is less than 5 times out of a hundred (i.e., something else other than chance has affected the outcome).

Type I and Type II errors We use the level of significance to help us to decidewhether to accept or reject the null hypothesis.
• If we reject the null hypothesis when it is true and should not be rejected, we have committed a Type I error.
• If we accept the null hypothesis as true when it is false and should be rejected, we have committed a Type II error.

Experiments to control Type I error: Significance test
• The P-value calculated in most familiar statistical tests indicates the probability of obtaining a test statistic at least as extreme as the one calculated from the data, if H O were true.
• The significance level is a critical value of alpha --the maximum probability of Type I error (rejecting H O when it is true) that the scientist is willing to tolerate.

Experiments to control Type II error: Power Analysis
Power analysis is used to estimate Beta, the probability of Type II error, and its complement,
statistical power (1- beta), the probability of detecting a specified treatment effect when it is present.
Statistical power is a function of several variables:- sample size, N;- variance of the observed quantities;- effect size (the treatment effect the experimenter wants to
be able to detect); and- alpha (the maximum rate of Type I error tolerated).

Confidence Intervals and Power
H0 (null hypothesis) trueH1 (alternative hypothesis) false
H0 (null hypothesis) falseH1 (alternative hypothesis) True
1- alpha (e.g., .95) THE CONFIDENCE LEVEL
The probability we say there is no relationship when there is not
alpha (e.g., .05)Type I ErrorThe probability we say there is a relationship when there is not
1- beta (e.g., 80)THE POWER
The probability we say there is a relationship when there is one
We accept H0We reject H1
We reject H0We accept H1
In RealityWe Conclude
beta (e.g., 20)Type II ErrorThe probability we say there is no relationship when there is one
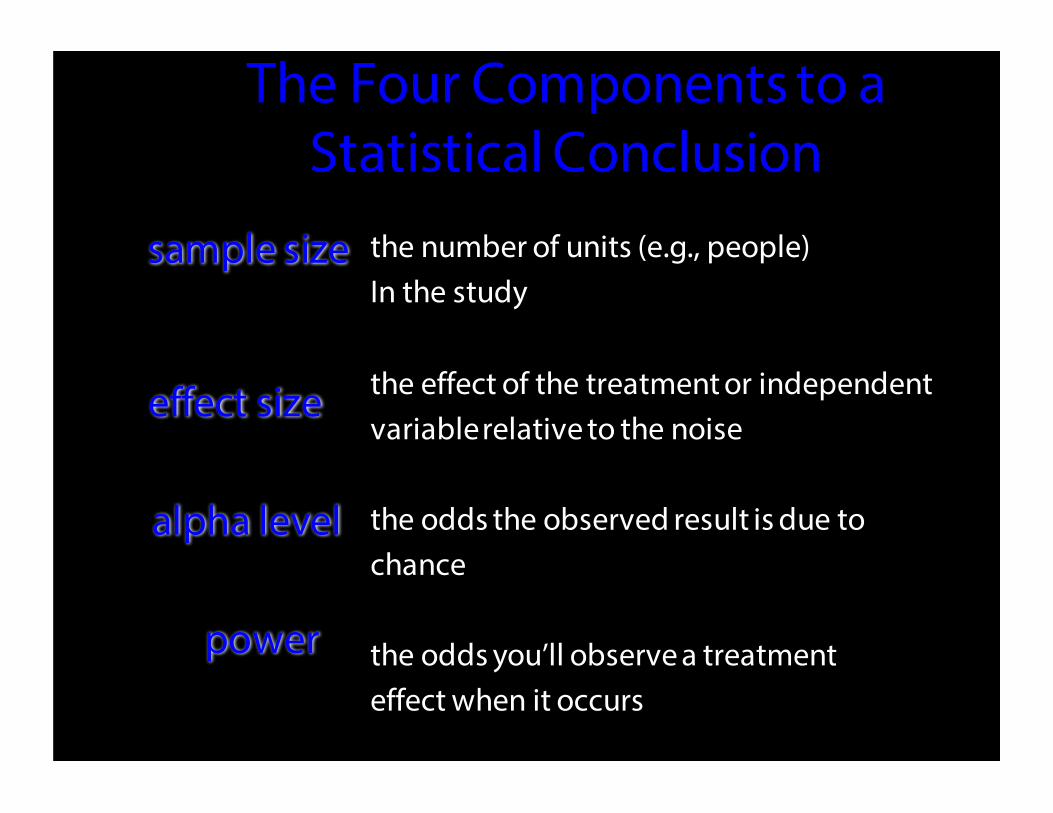
The Four Components to a Statistical Conclusion
the number of units (e.g., people) In the study
the effect of the treatment or independent variable relative to the noise
the odds the observed result is due to chance
the odds you’ll observe a treatmenteffect when it occurs
sample size
effect size
alpha level
power
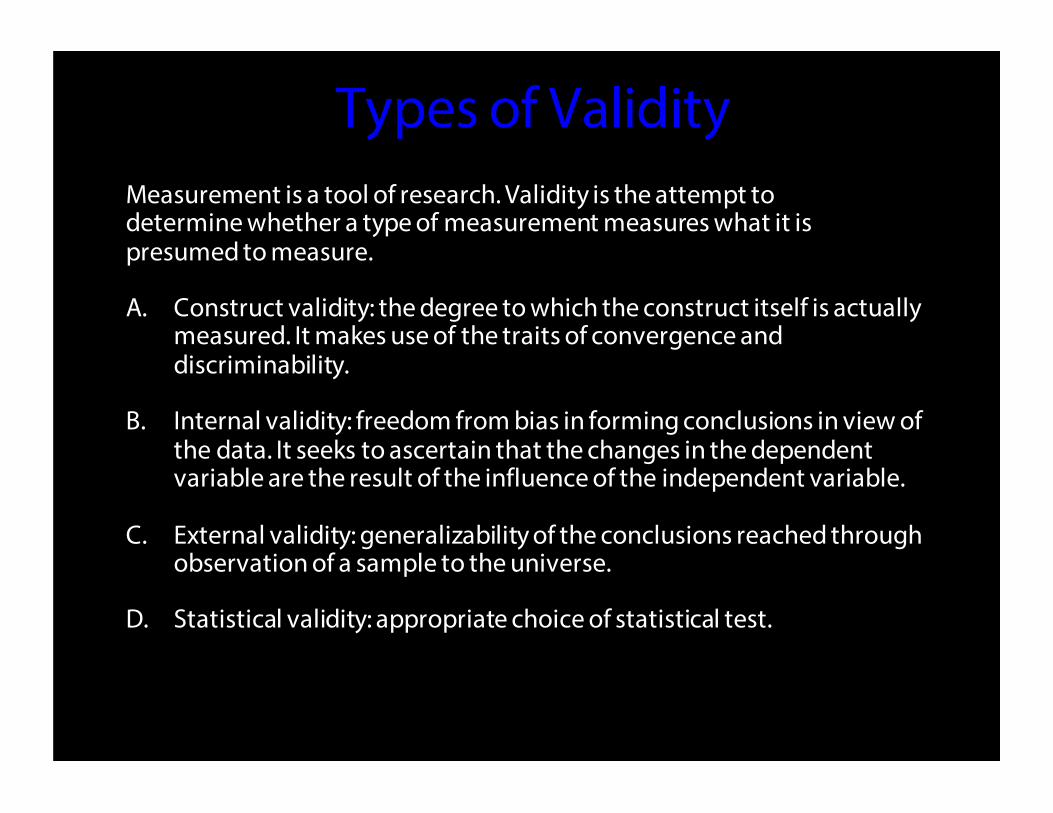
Types of ValidityMeasurement is a tool of research. Validity is the attempt to determine whether a type of measurement measures what it is presumed to measure.
A. Construct validity: the degree to which the construct itself is actually measured. It makes use of the traits of convergence and discriminability.
B. Internal validity: freedom from bias in forming conclusions in view of the data. It seeks to ascertain that the changes in the dependent variable are the result of the influence of the independent variable.
C. External validity: generalizability of the conclusions reached through observation of a sample to the universe.
D. Statistical validity: appropriate choice of statistical test.

Reliability
Reliability: the extent to which a measurement procedure yields the same answer however andwhenever it is carried out.
1. Quixotic reliability: Refers to the circumstances in which a single method of observation continually yields an unvarying answer.
2. Diachronic reliability: Refers to the stability of an observation over time. This type of reliability is only appropriate when the phenomenon observed is not assumed to change over time.
3. Synchronic reliability: Refers to the similarity of results from the use of multiple measures within the same time period.

Reliability
Validity
The extent to which the variables are free from random error, usually determined by measuring the variables more than once.
The extent to which a measured variable actually measures the conceptual variables that it is designed to assess.
Measurement Reliability and Validity

• Reliability (=precision): the extent to which measurement is consistent or reproducible
• Validity (=accuracy): the extent to which what is measured is what the investigator wants to measure
The Classical Theory of Measurement

What is Reliability
• the “repeatability” of a measure• the “consistency” of a measure• the “dependability” of a measure

Components of an Observed Score
• The best approximation to the true score is obtained by making multiple independent observations and averaging the results
• Reliability of measurement is increased (and error decreased) by increasing the number of observations
• Note that the true score is not all its name implies
ObservedScore
= TrueScore
+ MeasurementError

When a measure is VALID, ES + ER = 0, and X0 = Xt
When a measure is RELIABLE, ER = 0, and X0 = XT + ES
RELIABILITY is a necessary but not a sufficient condition for VALIDITY
Reliability and Validity

Relationships between Validity and the Research Process
State QuestionsDefine HypothesesIdentify Variables
DetermineDesignStructure
IdentifyPopulationAnd Sample
Design InstrumentsAnd ClassifyOperationalDefinitions
SelectStatisticalTests
CollectData
AnalyzeData
InternalValidity

State QuestionsDefine HypothesesIdentify Variables
DetermineDesignStructure
IdentifyPopulationAnd Sample
Design InstrumentsAnd ClassifyOperationalDefinitions
SelectStatisticalTests
CollectData
AnalyzeData
ExternalValidity
Relationships between Validity and the Research Process

State QuestionsDefine HypothesesIdentify Variables
DetermineDesignStructure
IdentifyPopulationAnd Sample
Design InstrumentsAnd ClassifyOperationalDefinitions
SelectStatisticalTests
CollectData
AnalyzeData
StatisticalValidity
Relationships between Validity and the Research Process

State QuestionsDefine HypothesesIdentify Variables
DetermineDesignStructure
IdentifyPopulationAnd Sample
Design InstrumentsAnd ClassifyOperationalDefinitions
SelectStatisticalTests
CollectData
AnalyzeData
ConstructValidity
Relationships between Validity and the Research Process

Research Approaches
General Purpose Explore relationships between variables Describe variables
General Approach Experimental Non-Experimental Descriptive
SpecificApproach
RandomizedExperimental
Quasi-Experimental
Comparative Associational Descriptive
Specific Purpose DetermineCause
ExamineCause
Compare Groups Find Associations Summarize Data
Type of HypothesisDifference
Relate variables Descriptive
Statistics Difference Inferential Statisticse.g. ANOVA
AssociationalInferentialStatistics(eg. Correlation,Multiregression
Descriptive StatisticsEg, Histograms,Means etc.

Selecting a research method for data collection
Experiment, Quasi-Experiment, Cross-Section, Longitudinal, Case study
Selecting a methods depends on: • the research question/purpose • the operational definition of the construct of
interest (difference/associational) • the required protocols for reliability and validity• a balance between redundancy and the tendency to
overdesign

Qualitative/Quantitative Research Continuum
Inductive Inquiry Deductive InquiryUnderstanding Social Phenomena Establishing RelationshipsGrounded-theory Theory-BasedHolistic Inquiry Focused on ComponentsContext-specific Context-FreeObserver-Participant Detached Role of ResearcherNarrative Description Statistical Analysis
QUALITATIVE QUANTITATIVE
Ethnographic ExperimentalHistorical Quasi-experimental
Phenomenological SurveySource: Newman & Benz 1998

Mixed-Method
• Triangulation: tests the consistency of findings obtained through different instruments.
• Complementarity: clarifies and illustrates results from one method with the use of another method.
• Development: results from one method shape subsequent methods or steps in the research process.
• Initiation: stimulates new research questions or challenges results obtained through one method.
• Expansion: provides richness and detail to the study exploring specific features of each method.

Early detection of problems inthe study design
Adequate number of subjects Comprehensive and detailed theory frame work but impractical Estimation of sample size in order to answer to your questions. Realistic estimate of number of subjects likely to be available.
Adequate technical expertise Skills, equipment and experience
Affordable in time and money Available resources
Manageable in scope Too ambitious, too many measurements, too many questions

Research Curiosity and Distractions(How to use them to make progress)
Literature: Thousands of papers are published daily that relate to your research question.
Data tools: Learning new data tools and methods to study your topic and conduct data analysis.
Great talk: Attending a fascinating talk on the big picture of the topic you are studying.
Field work: In your field work things are more complex and messy and do not fit your framework.
Travel abroad: A coincidental trip to different country uncover your cultural bias in your approach.

The Nature of Good Design
1. Theory-Grounded. Good research strategies reflect the theories which are being investigated.
2. Situational. Good research designs reflect the settings of the investigation.
3. Feasible. Good designs can be implemented. 4. Redundant. Good research designs have some
flexibility built into them. Often, this flexibility results from duplication of essential design features
5. Efficient. Good designs strike a balance between redundancy and the tendency to overdesign.

Why Review the Literature• Become familiar with previous research • Understand how your idea fits existing theory • Determine the existing knowledge base • Relates your study to a larger body of knowledge• Shows importance of your study• Traces the history of the topic• Identify studies to replicate• Use tested instruments and methods• Identify testable hypotheses

Why citations are used in a scientific paper
• Substantiate statements that are not your ideas, and give credit.
• Allow the reader to verify your interpretations.• Substantiate facts or data of others’ research.• Refer to previous related studies, to compare.• Provide detailed justification of methods.• Give the reader material to go deeper into a topic.

What is a Literature Review
A systematic, explicit, and reproducible method foridentifying, evaluating and interpreting an existing body of research.
Literature review should• lead to comprehension of your research area• position your study in a broader research effort• indicate how your study provides a logical extension of the
existing knowledge
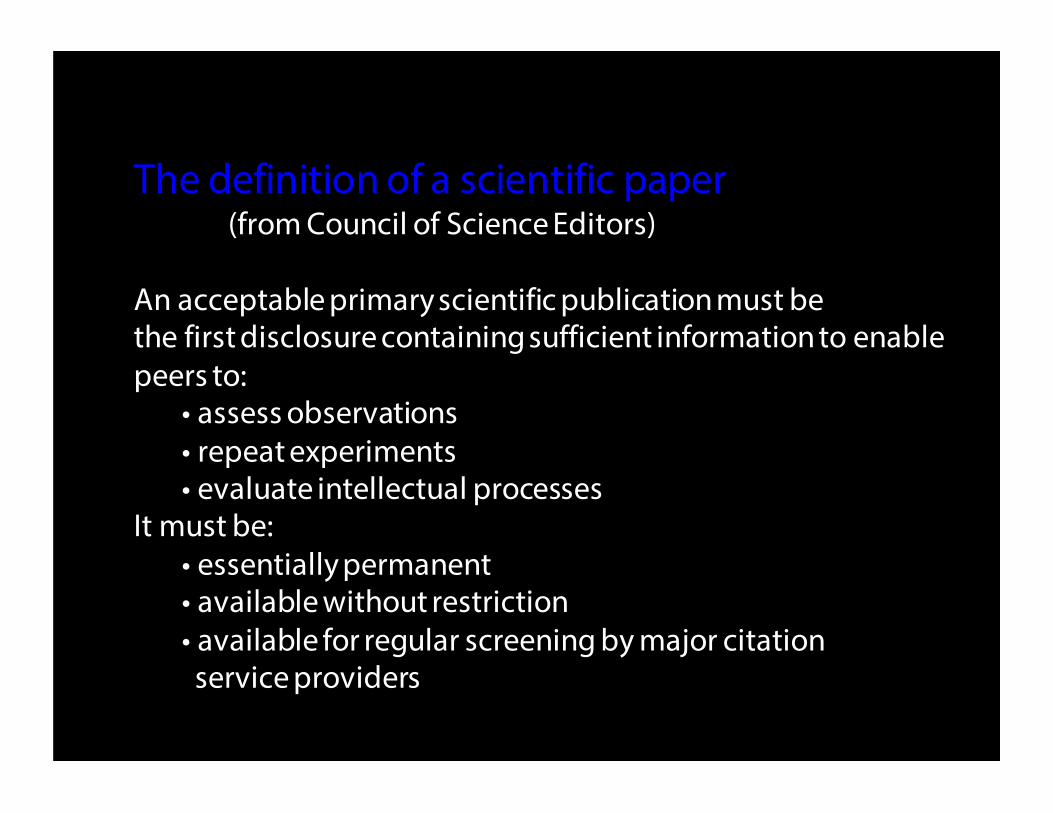
The definition of a scientific paper(from Council of Science Editors)
An acceptable primary scientific publication must bethe first disclosure containing sufficient information to enablepeers to:
• assess observations• repeat experiments• evaluate intellectual processes
It must be:• essentially permanent• available without restriction• available for regular screening by major citation service providers

Structure of Literature Review - State your research question: specify variables, define conceptual model
- What other researchers have asked- How other researchers approached
their questions- What methods/techniques other researchers have used
- What results other researchershave found

PRIMARY SOURCES
SECONDARY SOURCES
TERTIARY SOURCES
JournalsDissertationsThesesBooks
NewspapersConference papersPatents & StandardsReports
Indexes Abstracts
CataloguesBibliographies
Research Sources

• Articles on the latest news, trends and research
• Primary research
• Authors and sources of data identified
• Refereed, peer reviewed
• Specialized topics
• Notice of work in progress
Why use Journals?

Literature Resources
- Library Catalogues- Databases, Abstracts and Indices- On-line Journals- Governmental Publications- US Census- Datasets
Web Resources - Library

Conducting a literature review• Step 1 after selecting an idea • Limit the search to certain key words, years, research areas • Access information, including one or two good review articles
Social Science Citation Index General Science Index Current ContentsExtended Academic IndexLEXIS-NEXIS academic universeProQuest
• Read & organize the results of your search • Critique your literature• Summarize the results
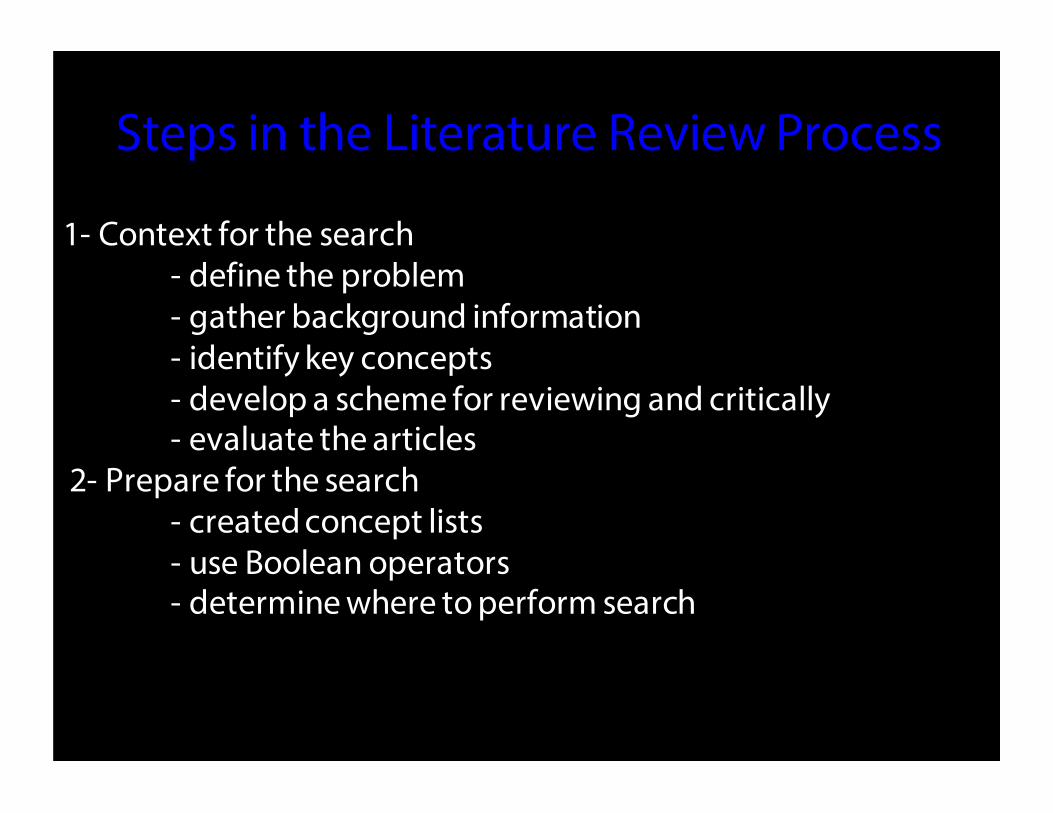
Steps in the Literature Review Process
1- Context for the search- define the problem- gather background information- identify key concepts - develop a scheme for reviewing and critically - evaluate the articles
2- Prepare for the search- created concept lists- use Boolean operators- determine where to perform search

Steps in the Literature Review Process
3- Perform the searchlearn conventions of the databasessearch databasesstart with most general sources
4- Summarize the resultscreate a summary chart compare & contrast the findings

Important Information
PublicationLanguageJournalAuthorSetting of studyParticipantsProgram
Research designSampling method
Date of publicationDate of data collection
Duration of data collectionSource of support

Urban patterns and environmental performance:What do we know?
Marina Alberti
Journal of Planning Education and Research. Vol. 19(2): 151-163.

Form is the degree of centralization/decentralization of the urban structure.
Density is the ratio of population or jobs to the area.
Grain indicates the diversity of functional land uses such as residential, commercial, industrial and institutional.
Connectivity measures the interrelation and mode of circulation of people and goods across the location of fixed activities.
Urban Patterns

Sources include natural resources stocks and flows.
Sinks are the capacity of ecosystems to absorb pollution and waste.
Ecological support systems are life support services ranging from climate regulation and nutrient recycling to the maintainanceof biodiversity.
Impacts on human health and well-being are the direct effects on human population through polluted air, water, food etc.
Environmental Performance

EnvironmentalPerformance
UrbanPatterns
Sources Sinks Support Systems Human-Well-being
Form Energy is the only sourcestudied in relation to form. Posited that urban form
affect energy flows by:-redistributing solar radiation;-influencing energy use ofurban activities;-determining energy supplyand distribution systems. Studies disagree as
regards to how monocentric,polycentric, or dispersedform affect transportationenergy use. Trade-offs between
measures of travel patterns.
The urban heat island,which in turns serves as atrap for atmospheric pollutantsis a well known example ofclimate modification causedby altering the nature of thesurface and generation ofheat. Well known also the ability
of green areas and waterbodied to mitigate the urbanheat island and absorbemissions. While urban form may have
impact on these processes,not systematically studied.
The urban heat islandaffects climate and airpollution throughout theurban airshed. Since urban form rearrange
the biophysical elements andmodifies the hydrologicalcycle it can reduce the abilityof ecological systems tocontrol flooding and increaserunoff, but its impact dependson the local conditions of thesite. Urban form influences
habitat fragmentation in urbanareas which is correlated toextinction of native birds.
Relationships extrapolatedfrom the study of populationexposure to major pollutant inurban environment.
Density Population and job densityare the most studied inrelation to transportation-related energy use. Density is found to
decrease the number of tripsand use of private vehicles,but the results as regardstotal travel and energy usesare contradictory; Methodological problems
in using aggregated density.
The direction of impactsvaries across air pollutants. High density areas
generate greater urban heatisland effects and are lessable to capture air pollutants,however it depends on thesize of the area. Density is also related to
impacts on hydrologicalregimes, runoff, and waterquality.
Density may intensify theurban heat island effects, thehydrological effects, andhabitat fragmentation; but itmay depend on the urbanform Methodological problem with
using aggregated measuresof density.
Relationships extrapolatedfrom the study of populationexposure to major pollutant inurban environment.
Grain Posited to account fordifference in travel relatedenergy use; Effect depends on other
factors.
Land use patterns affect airpollution (a) directly by thelocation of activities and (b)indirectly through travelpatterns. Direction of impacts varies
across air pollutants.
No systematic studies onthe relationship between landuse mix and ecologicalsupport systems.
No systematic studies on therelationship between grain andwell-being.
Connectivity Transportationinfrastructure explain travelmode; Unclear direction of
causality.
Connectivity may affects airemission patterns, but nosystematic studied.
No systematic studies onthe relationship betweenconnectivity & supportsystems.
No systematic studies on therelationship betweenconnectivity and well-being.

Environmental Performance
Urban Patterns
Sources Sinks Support Systems Human-Well-being
Centralization Solar radiation
Energy use
Energy supply
Number of trips by auto
Trip length
Urban heat island
Atmospheric pollution
Water pollution
Climate & air pollution
Flooding
Pollutants runoff
Habitat fragmentation
No systematic studies
Density Solar radiation
Energy use
Number of tripsand VMT by auto
Total travel
Urban heat island
Atmospheric pollution
Water pollution
Climate & air pollution
Flooding
Pollutants runoff
Habitat fragmentation
Population exposure to airpollutants
Grain Travel patterns Urban Heat Island
Atmospheric pollution
No systematic studies No systematic studies
Connectivity Energy use byprivate transportation
Atmospheric pollution Habitat fragmentation No systematic studies


Table 1 Urban ModelsModel Sub-systems Theory /Approach Population/Sectors Time Space Environmental factors Source
CLARKE Land use/cover Complex systemsCellular automataMonteCarlo simulation
Aggregated Dynamic DynamicGrid-cell
Land coverTopographyHydrography
Clarke et al. 1996.
CUFII PopulationEmploymentHousingLand use
Random utilityMultinomial Logit
Aggregated Static Static100x100 m gird-cell
Percent slope Landis and Zhang1998a 1998b.
IRPUD PopulationEmploymentHousingLand use
Random utilityNetwork EquilibriumLand use EquilibriumMonteCarlomicrosimulation
PartiallyDisaggregated
Quasi-dynamic StaticZone
Zone space constraintsCO2 emissions bytransport
Wegener 1986;1995.
ITLUP PopulationEmploymentLand useTravel
Random utilityMaximizationNetwork equilibrium
PartiallyDisaggregated
Static StaticZone
Zone space constraintsMobile source emissions
Putnam 1983;1991.
KIM PopulationEmploymentTransportTravel
Random utilityGeneral equilibriumInput-Output
Aggregated Static StaticZone
Zone space constraints Kim 1989.
MASTER PopulationEmploymentHousingLand useTravel
Random utilityMaximizationMonteCarlomicrosimulation
Disaggregated Quasi-dynamic StaticZone
Zone space constraints Mackett 1990
MEPLAN PopulationEmploymentHousingLand useTransportTravel
Random utilityMaximizationMarket clearingInput-Output
Aggregated Static StaticZone
Zone space constraints Echenique et al.1985.
POLIS PopulationEmploymentHousingLand useTravel
Random utilityOptimization
Aggregated Static StaticZone
Zone space constraints Prastacos 1986.
TRANUS PopulationEmploymentHousingLand useTransportTravel
Random utilityNetework equilibriumLand use equilibriumInput-Output
Aggregated Static StaticZone
Zone space constraints de la Barra 1989.
URBANSIM PopulationEmploymentHousingLand use
Random utilityPartial equilibriumMultinomial logit
Partiallydisaggregated
Quasi-dynamic StaticParcels
TopographyStream buffersWetlands100 floodplain area
Waddell 1995.

Table 2. Environmental ModelsModel Class Media/Sub-systems Scale Time Space Human factors SourceNCAR Ocean-Climate
General CirculationModel
Climate-Ocean Global DynamicMinutes100 years
Dynamic4.5 x 7.59 layers
CO2 concentrationscenarios
Washington and Meehl1996
CMAQ Atmospheric Model Meteorological-Emissions, Chemistry-Transport
Local/Regional Dynamic8- to 72- hour period
DynamicVariable 3-D grid
Emissions ofatmospheric pollutants
Novak et al. 1995.
UAM Atmospheric Model Photochemicalprocesses
Local/Regional Dynamic8- to 72- hour period
DynamicVariable 3-D grid
Emissions ofphotochemicalpollutants
EPA 1990.
OBM Biogeochemical Model Terrestrial biosphere Global DynamicOne year
Dynamic2.5 x2.5
Land useCO2 concentrationscenarios
Esser 1991.
HRBM Biogeochemical Model Terrestrial biosphere Regional DynamicSix days
Dynamic0.5x.05
Land useCO2 concentrationscenarios
Esser et al. 1994.
DHSVM Distributed HydrologySoil Vegetation Model
Hydrology Regional DynamicHours
Dynamic30-100 m
Land cover Wigmosta 1994.
JABOWA/FORET Population/CommunityDynamic Model
Trees Local DynamicUp to 500 yearsOne year
Dynamic10x10 m grid
Land cover Botkin 1993
CENTURY BiogeochemicalModel
Nutrient cycles Local DynamicOne monthThousands years
Dynamic1x1 m grid cell
Land coverCO2 concentration
Parton et a. 1992.
GEM Process-OrientedEcological Model
Ecosystems Local Dynamic12 hours
Dynamic1 km cell
Land cover Fitz et al.
PLM Process-OrientedLandscape Model
Terrestrial landscape Regional DynamicOne week
Dynamic200 m grid1 km grid
Land cover Costanza et al. 1995
IMAGE2 Process-OrientedIntegrated SimulationModel
Energy-IndustryTerrestrialEnvironmentAtmosphere-Ocean.
Global, 13 regions. DynamicOne day to five years
DynamicVariable from 0.5 x 0.5degree grid to region.
CO2 emissionsLand use
Alcamo et al. 1994.
ICAM-2 Optimization/Simulation Model
ClimateEconomyPolicy
Global, 7 regions DynamicFive-year
StaticLatitude bands
Explicit treatment ofuncertainties
Dowlatabadi and Ball1994.
RAINS Optimization/Simulation Model
EmissionsAtmospheric transportSoil acidification
Continental, Europe DynamicOne year
Static150x150 km indeposition sub-modeland 0.5 lat. x 1.0 long.impact sub-model
Energy useSulphur emissions
Alcamo, Shaw, andHordijk 1990.
TARGETS Integrated SimulationModel
Population/HealthEnergy/EconomicsBiophysics/Land/Soils/Water
Global, 6 regions DynamicOne year
StaticRegions
Energy useWater useEmissionsLand cover
Rotmans et al. 1994.
Related Documents