Lecture # 17 Solar Thermal Energy Ahmed Ghoniem April 6, 2020 Renewables: Some characteristics and specifics. Historical Trends … Solar Thermals: Concentrators and Plants

Welcome message from author
This document is posted to help you gain knowledge. Please leave a comment to let me know what you think about it! Share it to your friends and learn new things together.
Transcript
Lecture # 17 Solar Thermal Energy
Ahmed Ghoniem April 6, 2020
Renewables: Some characteristics and specifics. Historical Trends … Solar Thermals: Concentrators and Plants

Renewable Sources and Their Utilization
Solar Wind/Wave Biomass Geothermal
Chemical Thermal Kinetic photo
Windmills Combustion heat T+ Photovoltaics Wave machine
Gasification fuel
Biological
T+
Rankine/thermomechanical cycle electric
2© Ahmed F. Ghoniem T+

Solucar, Outside Seville, 2007, 600 mirrors generate 11 MWe,
Designed for 10 MW, central receiver, to deliver 20-25 GWh/y (25-30% capacity)Located in Sanlucar La Mayor (best area in Spainfor solar), built and operated by Abengoa.
© Solucar. All rights reserved. This content is excluded from our Creative Commonslicense. For more information, see https://ocw.mit.edu/fairuse.
1. The solar tower is 115m (377ft) tall and surrounded by 600 steelreflectors (heliostats). They track the sun and direct its rays to aheat exchanger (receiver) at the top of the tower2. The receiver converts concentrated solar energy from the www.solucar.es heliostats into steam 3. Steam is stored in tanks and used to drive turbines that, Cost estimated to be 3X higher eventually, will produce enough electricity for up to 6,000 homes Capital cost: E3000/KWe © Getty Images. All rights reserved. This content is excluded from our CreativeCommons license. For more information, see https://ocw.mit.edu/fairuse. 3

Saturated steam is generated at the receiver tower, fed directly to the turbine, or some stored in hot water tank for extending the hours of operation. The receiver is a forced circulation radiant boiler receiving ~ 55 MWt of concentrated solar radiation. Storage capacity is 20 MWht, sufficient to operate the turbines for 50 minutes at 50% capacity.
4
© Solucar. All rights reserved. This content is excluded from our Creative Commonslicense. For more information, see https://ocw.mit.edu/fairuse.
Image courtesy of DOE.

General characteristics of Renewable Sources (does not apply to hydropower and some geothermal):
1. Ubiquitous, certainly with solar, less so with wind (more wind off-shore).
2. Low energy density, mostly surface area dependent, lower grade heatand low heating value for biomass.
3. Mostly intermittent, especially for solar, wind and wave, less so forhydropower and biomass (which has seasonal intermittency instead ofdaily).
4. Fuel cost is negligible (except for biomass and geothermal), but capitalcost to collect the energy can be significant.
5. Carbon neutral (if all is kept renewable).
© Ahmed F. Ghoniem 5

Solar Energy is “Everywhere”, But Opportunities Vary Distribution networks may have to look different
Average daily total irradiance on a horizontal surface in a clear day Source: US DOE
Image courtesy of DOE.
© Source unknown. All rights reserved. This content is excluded from our Creative Commons license. For more information, see https://ocw.mit.edu/fairuse.
© Ahmed F. Ghoniem 6

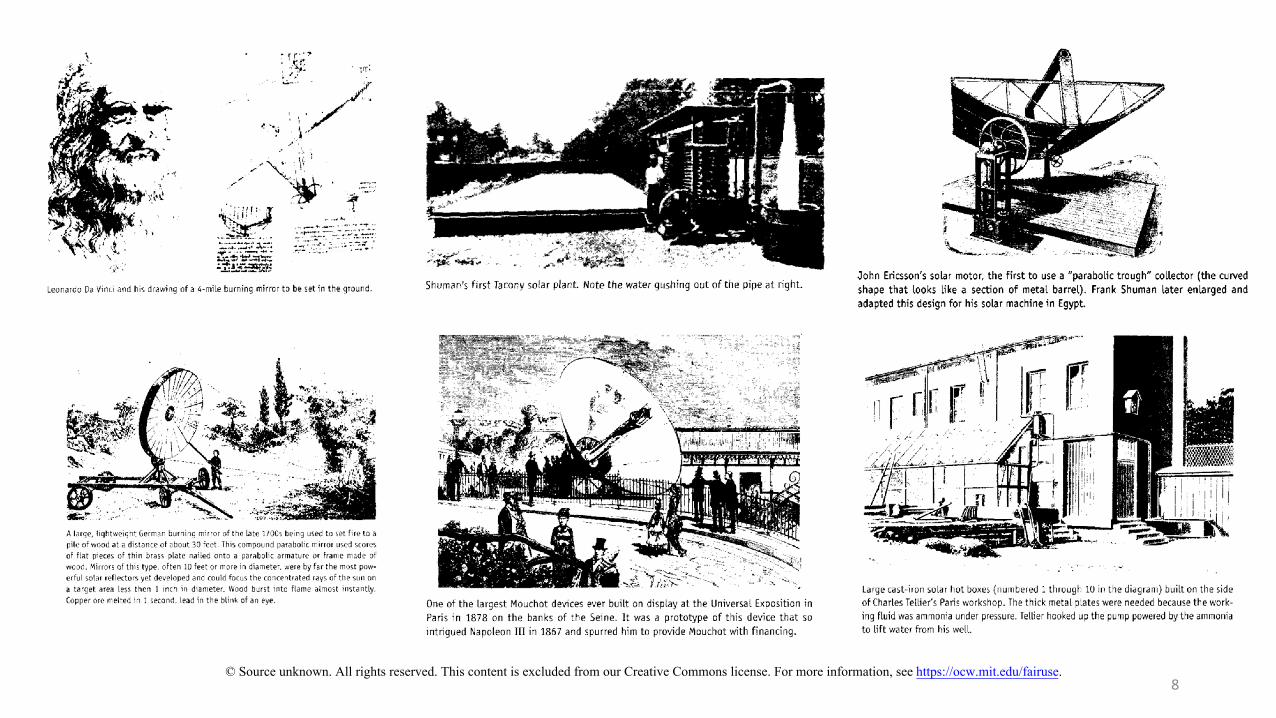
Historical Notes
In 1780, 95% of total power used in commercial applications was from natural sources (wind and water). By 1911, all but 2% of power was generated from burning coal and harnessing steam. “Within a few generations at most, some other energy than that of combustion of fuel must be relied upon to do a fair share of the work of the civilized world.” Robert H. Thurston - 1901, the Smithsonian Institution annual report.
“… the human race must finally utilize direct sun power or revert to barbarism because eventually all coal and oil will be used up. I would recommend all far-sighted engineers and inventors to work in this direction to their own profit, and the eternal welfare of the human race” Frank Shuman – 1914
The conversion of solar energy into mechanical power was attempted as a commercial venture by the Sun Power Company in Pennsylvania by Frank Shuman, 1910. “The fact that … no fuel is required is such an enormous advantage as to entirely offset the increased initial cost, and in addition cause great profits.” Frank Shuman - 1911.
Source: The power of Light by Frank T. Kryza, McGraw Hill, 2003
© Ahmed F. Ghoniem 7
© Source unknown. All rights reserved. This content is excluded from our Creative Commons license. For more information, see https://ocw.mit.edu/fairuse. 8
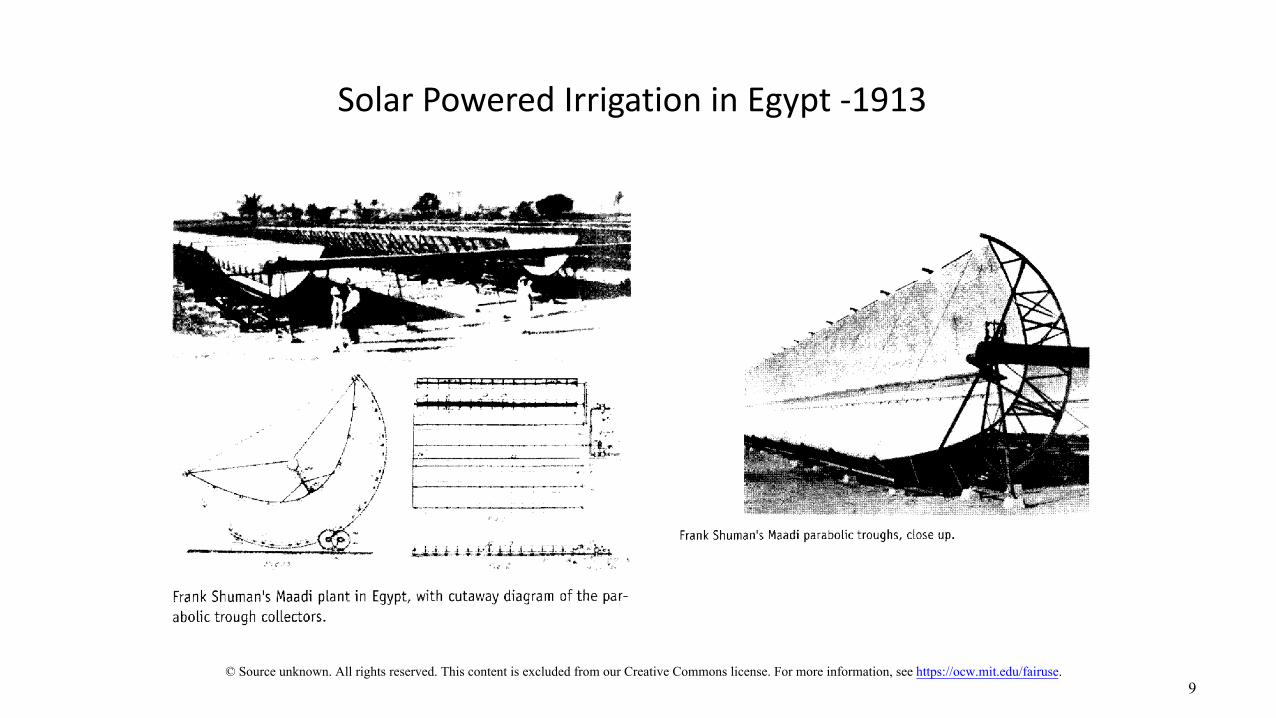
Solar Powered Irrigation in Egypt -1913
© Source unknown. All rights reserved. This content is excluded from our Creative Commons license. For more information, see https://ocw.mit.edu/fairuse. 9
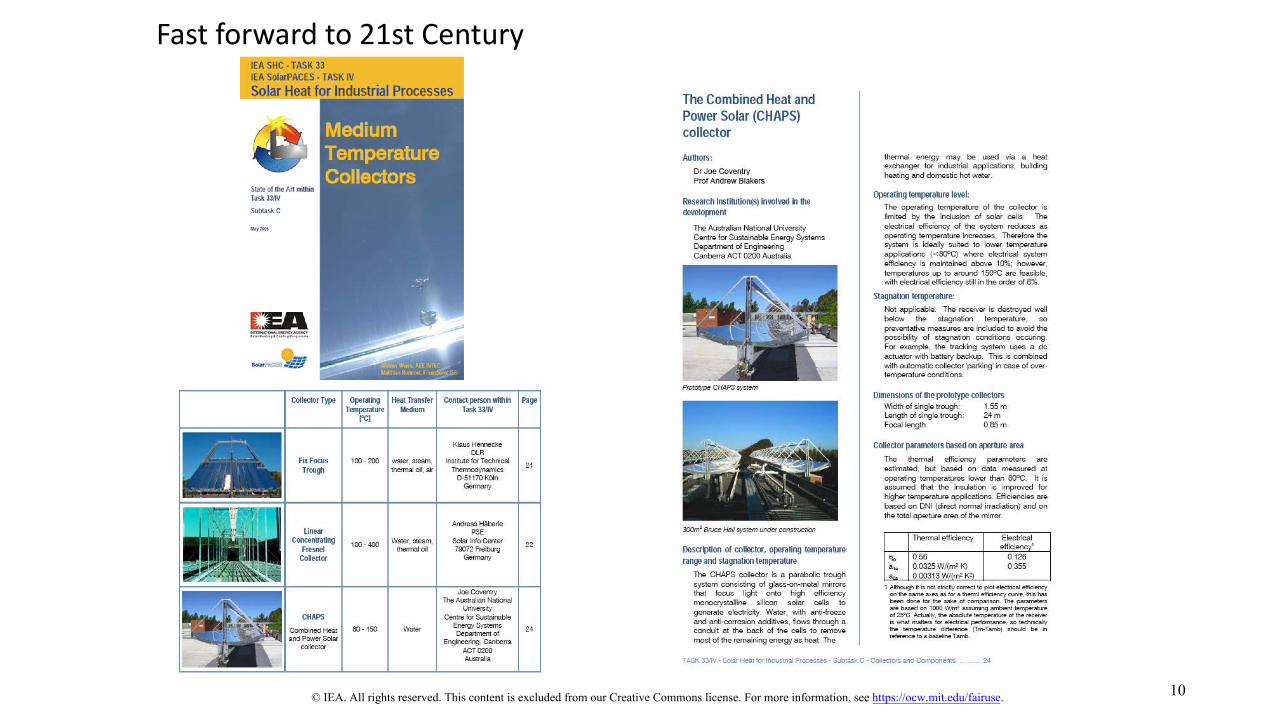
Fast forward to 21st Century
© IEA. All rights reserved. This content is excluded from our Creative Commons license. For more information, see https://ocw.mit.edu/fairuse. 10
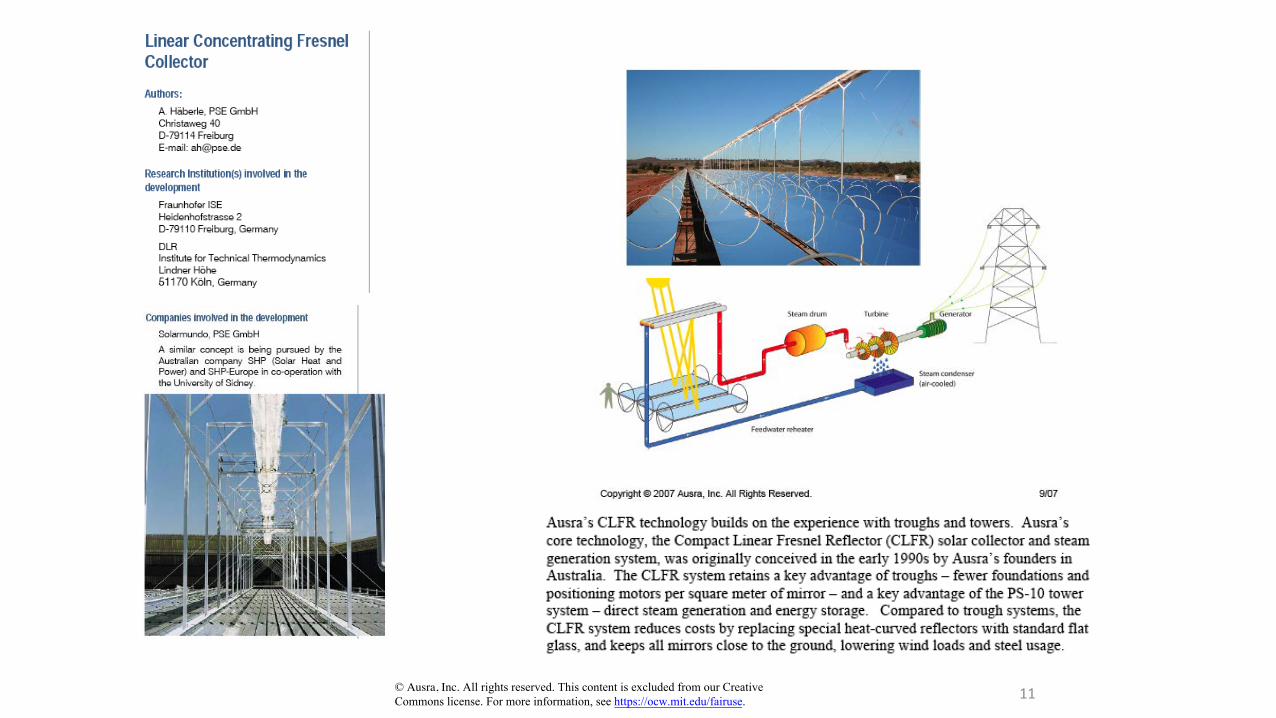
11© Ausra, Inc. All rights reserved. This content is excluded from our CreativeCommons license. For more information, see https://ocw.mit.edu/fairuse.

US DOE
Solar Thermal Electric Generation Stations (SEGS) 1985-2002 Modern plants 2006-2014
Nine SEGS Plants in the Mojave Desert (350MW)
• In 2006, Nevada Solar 1 was commissioned, 64 MWe, built over 250 acres (1.3 sq km), using 760 troughs.Expected power 130 million kWh/y, capacity factor ~ 25%). Cost $250M (~$110M for IGCC and ~$35M for NGCC).
• Ivanpah solar plant (2014), Dry Lake, CA, world largest CSP, 392 MW, capacity factor 28.72% . 4000 acres, 173,500heliostats, $2.2 B ($1.6 B loan guarantees, total cost $2.2B), doubles US solar electricity
© Source unknown. All rights reserved. This content is excluded from our Creative Commons license. For more information, see https://ocw.mit.edu/fairuse. 12
Image courtesy of NREL.
m
© Source unknown. This content is excluded from our Creative Commons license.For more information, see https://ocw.mit.edu/fairuse.
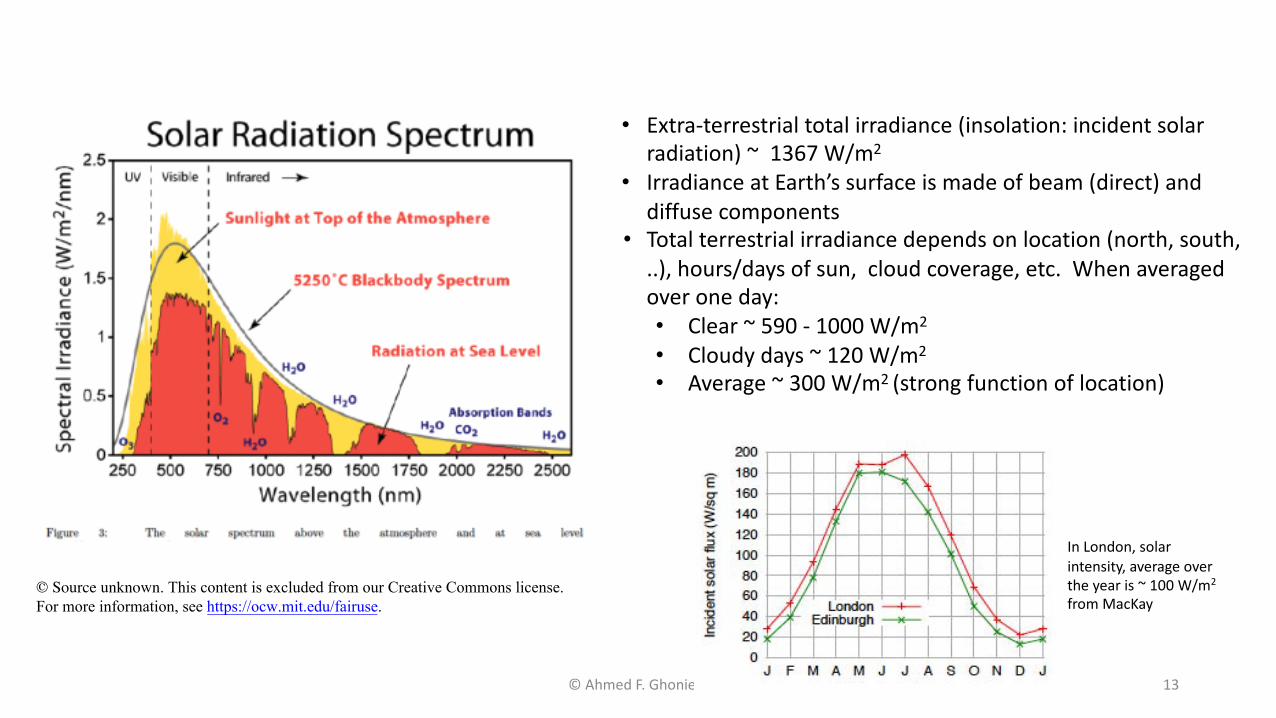
• Extra-terrestrial total irradiance (insolation: incident solarradiation) ~ 1367 W/m2
• Irradiance at Earth’s surface is made of beam (direct) anddiffuse components
• Total terrestrial irradiance depends on location (north, south,..), hours/days of sun, cloud coverage, etc. When averagedover one day:• Clear ~ 590 - 1000 W/m2
• Cloudy days ~ 120 W/m2
• Average ~ 300 W/m2 (strong function of location)
© Ahmed F. Ghonie
In London, solar intensity, average over the year is ~ 100 W/m2
from MacKay
13
© ITACA. All rights reserved. This content is excluded from our CreativeCommons license. For more information, see https://ocw.mit.edu/fairuse.
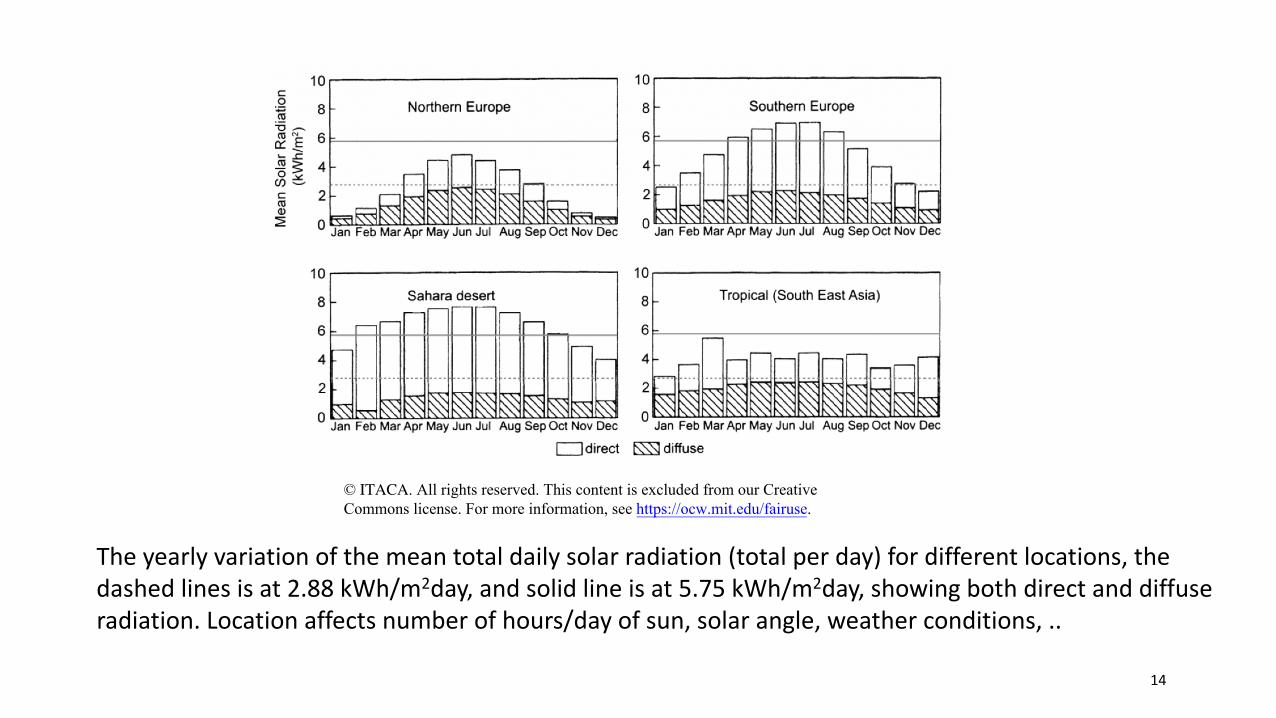
The yearly variation of the mean total daily solar radiation (total per day) for different locations, the dashed lines is at 2.88 kWh/m2day, and solid line is at 5.75 kWh/m2day, showing both direct and diffuse radiation. Location affects number of hours/day of sun, solar angle, weather conditions, ..
14

How Much? On average 2.7 MWh/m2/y total incident radiation
~ 7 kWh/m2/day total ~ 0.3 kW/m2 total
@ ~ 15% conversion efficiency, ~ 0.05 kW/m2, therefore for a house using ½ kW, you need ~ 10 m2.
@ 20% (overall: field x cycle) efficiency (CSP), generate 60 MW/km2, for a power plant)
Intermittency is tricky! Role of storage, backup and multiple sources/technologies
Clear day
Cloudy day
© Source unknown. All rights reserved. This content is excluded from our Creative Commons license. For more information, see https://ocw.mit.edu/fairuse.
15

Energy Balance of collectors and their fluid temperature
(1) Flat Collectors:
h Tcq = β I − ˆ( − Ta ) q net fluxcollected by a fluid passing through the collector I Irradiance < 1 kW / m2
β fractionabsobed, depends on orientation & transmissivity < 0.8
h overallheat transfer coefficientTc collector T Ta environment T
β Iat q = 0 (Tc )max = Ta + hfor high (Tc )max , h must be very low (insulation < 0.1 kW/m2K) Flat collectors:
limit heat transfer fluid tempertaure. Typical value Tc ~ 80 C Typical values of β, is 80%, ˆq h T( c − Ta )ηcol = = β − ≤ β Collection efficiency at Tc ~ 60 C, ~ 50%.
I I goes down linearly with temperature! must limit heat loss
© Ahmed F. Ghoniem
© Source unknown. All rights reserved. This content is excluded from our Creative Commons license. For more information, see https://ocw.mit.edu/fairuse.
16

Concentrating Collectors: 1. Trough2. Tower3. Cone
© Source unknown. All rights reserved. This content is excluded from our Creative Commons license. For more information, see https://ocw.mit.edu/fairuse.
(a) Flat collector, (b) with local curved mirrors, (c) concave, (d) parabolic,(e) Fresnel reflector (f) Array of heliostats with central receiverGoal: Increasing the flux of radiation on receivers
© Ahmed F. Ghoniem 17

Focusing Collectors : increases the collector temperature and collection efficiency: • Project the collected energy onto a small area (from Sun to mirror/reflector to collector)
to increase T.• Energy is collected from the large area of the concentrator, and lost from the small area
of the collector only.• Concentration Ratio CR is the ratio between irradiance on the collector (at the focal point
of the concentrator) and incident irradiance, I, is (also the area ratio):
DmCR = 107.5 for cylindrical F
2Dm= 11560 for spherical F⎜ ⎟
Dm : mirror dimension, F : focal length
⎞⎠
⎛⎝
© Ahmed F. Ghoniem 18

Concentrating Collectors
• Thermal energy at T higher than thosepossible with flat-plate collector; using aconcentrator and a receiver.
• Increasing the concentration ratio: the ratioof collector area to absorber area, raises T atwhich energy is delivered.
• Spherical (3D) collectors deliver higher T thancylindrical (2) collectors.
T requirements for different engines and the corresponding concentration ratio
net absorbed flux: qAcol = β A conc I − hAˆ col (Tc − Ta )define: CR = Aconc / Acolthen: q = βC RI − ˆ( − Ta )h Tc β depends on reflective and transmissive properies
of glass cover and absorbative properties of collector surface ~ 80% (best) maximum collector/fluid temperature is when q = 0,
β ICR(Tc )max = Ta + h
collector efficiency: ˆqAcol q h T( c − Ta )ηcol = = = β −
IAconc ICR I CR
note how it increses with the concentration ratio © Ahmed F. Ghoniem 19

From Winter “Solar Power Plants” Greenhunt,M.Sc. Thesis, p. 35
Solar field efficiency:
HT Alloys HT Steels
HT Oils
Upper temperature limits of
C = 2500
C = 200
C = 700
C = 80 C = 40
C = 1
C = 3
C = 1
Trough
C = 1 Flat
Vacuum
Heliostat
Dish C: concentration ratio
C = 1000
20


Optimizing the Solar Field-Power Block System
Using oil as a heat transfer fluid.Or direct steam generation in thecollectors.
By X.G. Casala, Jan 2000, “Modeling and Optimizing the use of Parabolic Trough Technology with Rankine Cycles for Electricity Productions” Escela Tecnica Superior de Ingeniera, Madrid.
DSG: direct steam generation
ˆq h T( c − Ta )ηcol = = β − ≤ βI I CR
© ETSI. All rights reserved. This content is excluded from our Creative Commons license. For more information, see https://ocw.mit.edu/fairuse. 22

Credit: James Darwin, 2006
RadiationLosses toEnvironment
ConvectionLosses toEnvironment
Reflected Radiation fromParabolic Mirror
HCEShield
AbsorberPipe
Heat-TransferFluid
EvacuatedAnnulus
Heat-Collection Element (HCE) Space between absorber pipe and glass shield is evacuated • Reduces convective losses
Glass shield has a spectrally selective coating • Lets solar radiation in• Blocks thermal radiation
Radiation Losses From Pipe
Convection Losses From Pipe
© Ahmed F. Ghoniem 23
Source: US DOE
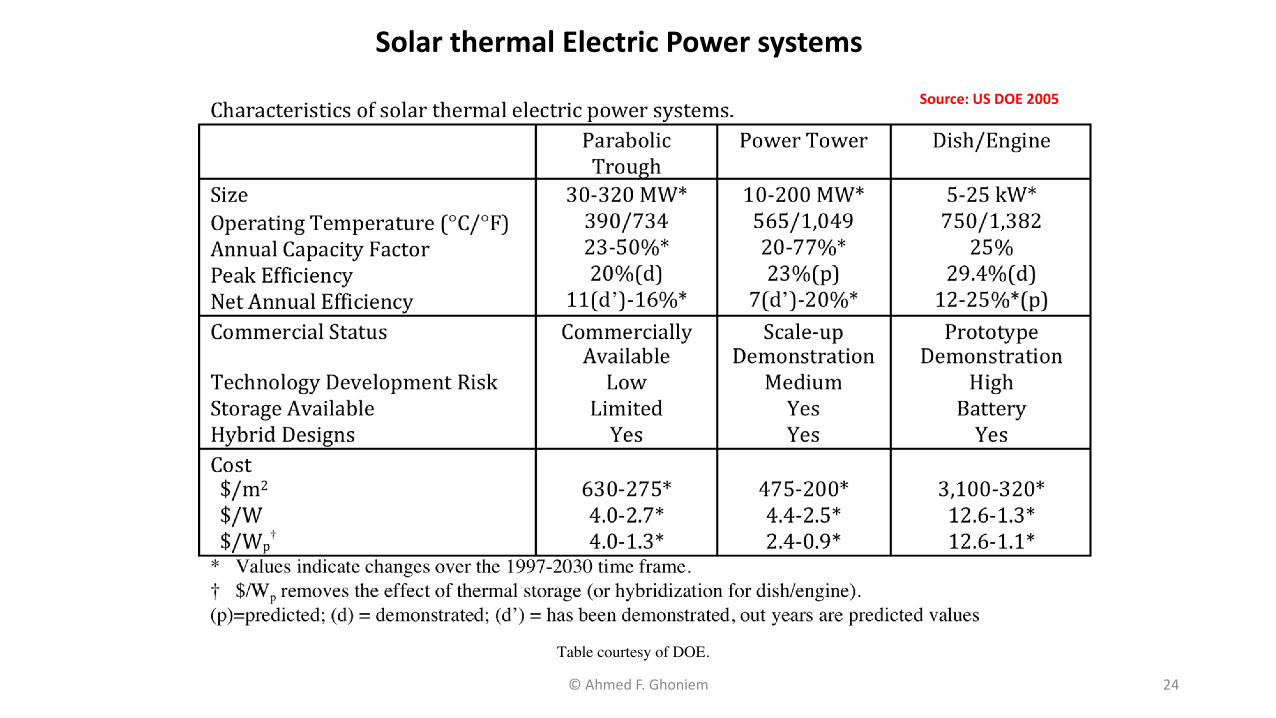
Solar thermal Electric Power systems Source: US DOE 2005
Table courtesy of DOE.
© Ahmed F. Ghoniem 24
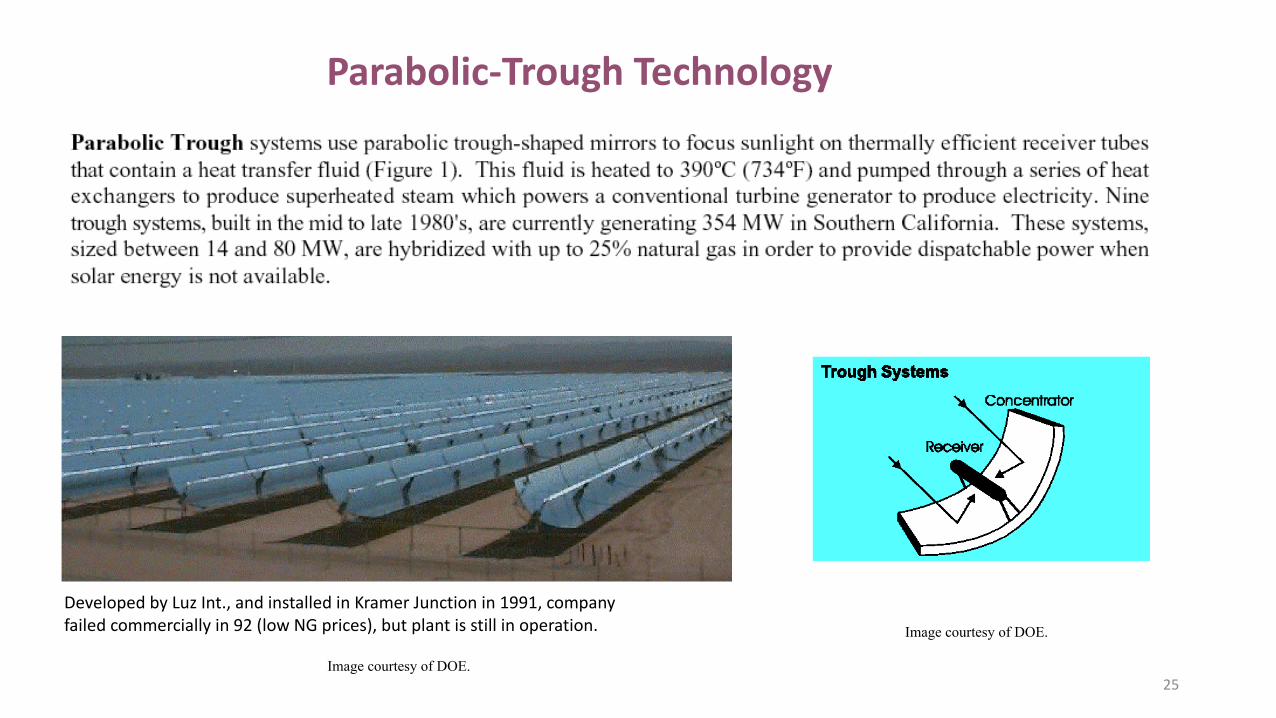
Parabolic-Trough Technology
Developed by Luz Int., and installed in Kramer Junction in 1991, company failed commercially in 92 (low NG prices), but plant is still in operation.
25
Image courtesy of DOE.
Image courtesy of DOE.
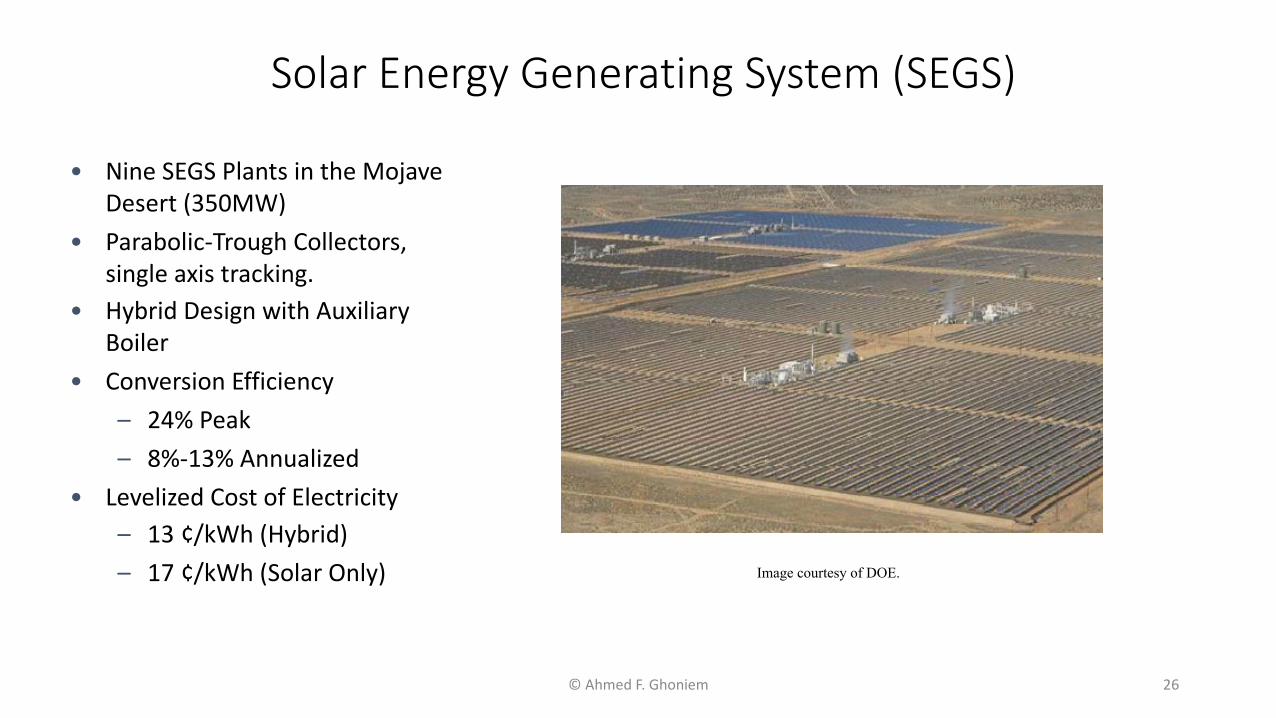
Solar Energy Generating System (SEGS)
• Nine SEGS Plants in the MojaveDesert (350MW)
• Parabolic-Trough Collectors,single axis tracking.
• Hybrid Design with AuxiliaryBoiler
• Conversion Efficiency– 24% Peak– 8%-13% Annualized
• Levelized Cost of Electricity– 13 ¢/kWh (Hybrid)– 17 ¢/kWh (Solar Only)
© Ahmed F. Ghoniem 26
Image courtesy of DOE.

Hybrid Combined Cycle SEGS Plant
• Would boost thermal efficiency to54-58%
• Total annual average solar-to-electric efficiency at 10-14%.
• Plants use conventionalequipment and are “hybridized”for dispatchability (25%) Image courtesy of NREL.
•Total reflective area > 2.3 M. m2
•More than 117,000 Heat Collecting Elements•30 MW increment based on regulated powerblock size
27

Source: US DOE
Hybridized Parabolic-Trough System
© Ahmed F. Ghoniem 28
Image courtesy of DOE.

Critical to keep the reflectors clean ……
© Sandia Lab. All rights reserved. This content is excluded from our Creative Commons license. For more information, see https://ocw.mit.edu/fairuse.
29
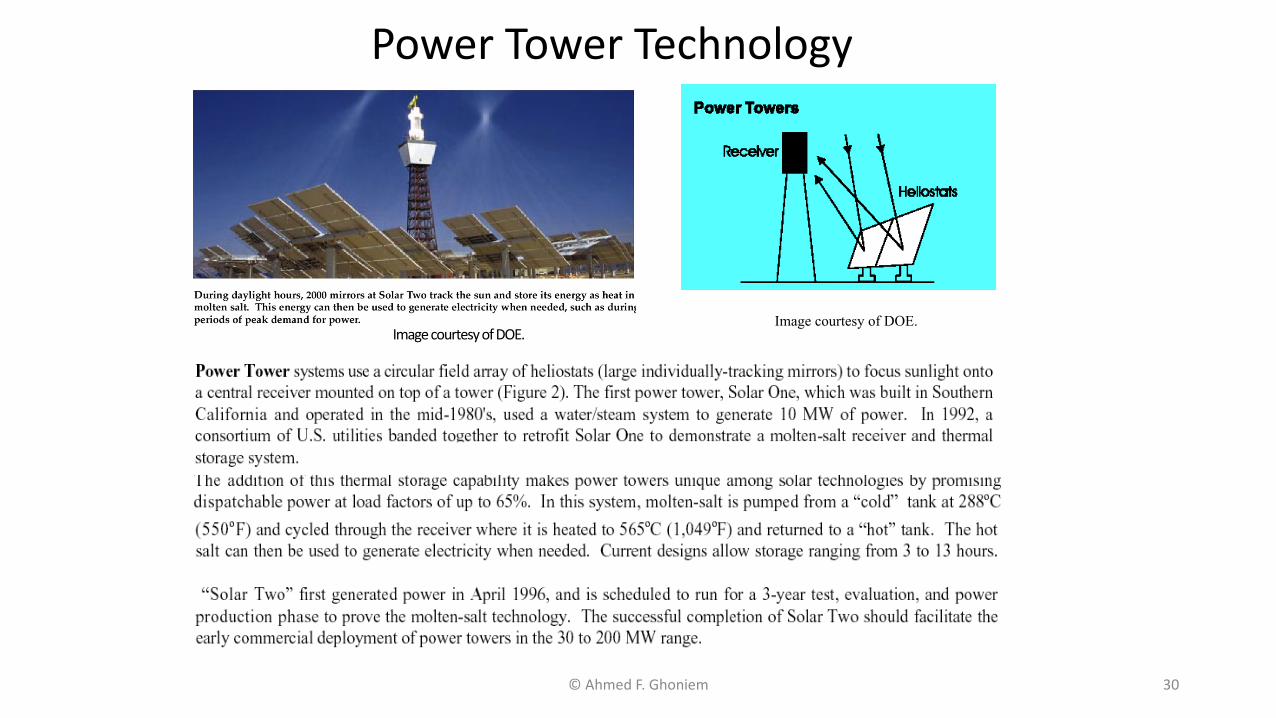
Power Tower Technology
Image courtesy of DOE.
© Ahmed F. Ghoniem 30
Image courtesy of DOE.
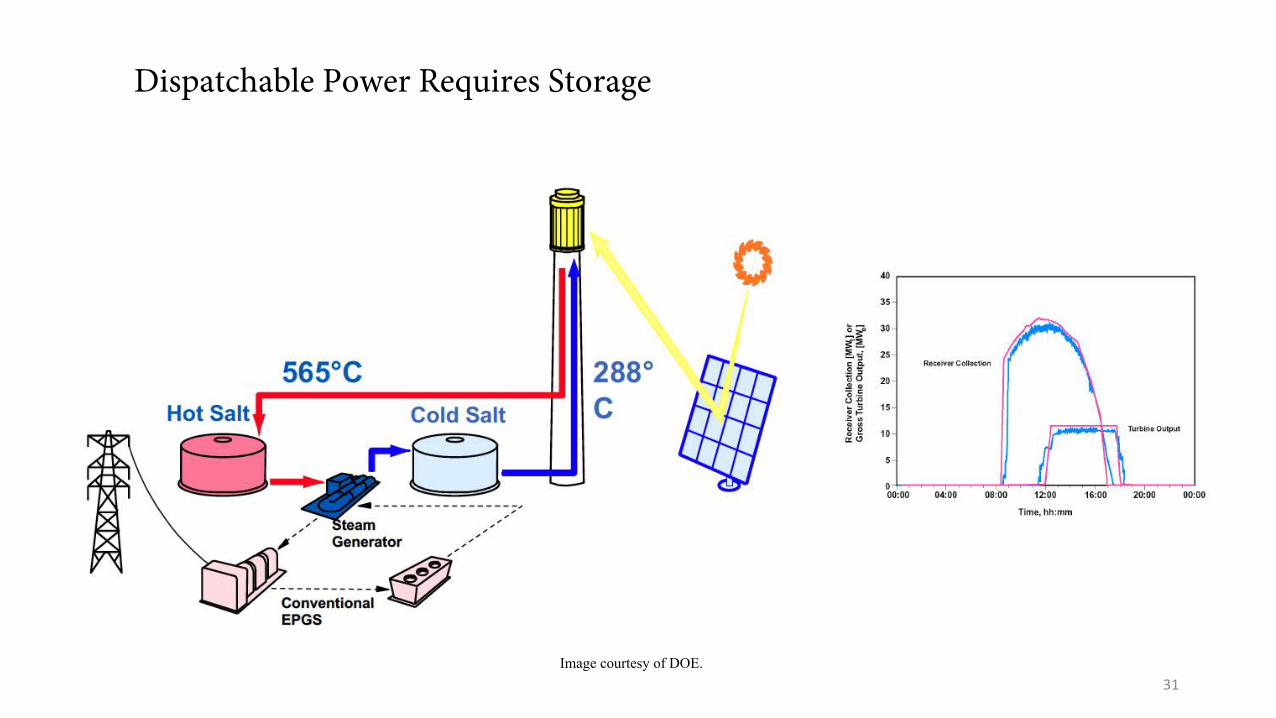
Dispatchable Power Requires Storage
31 Image courtesy of DOE.
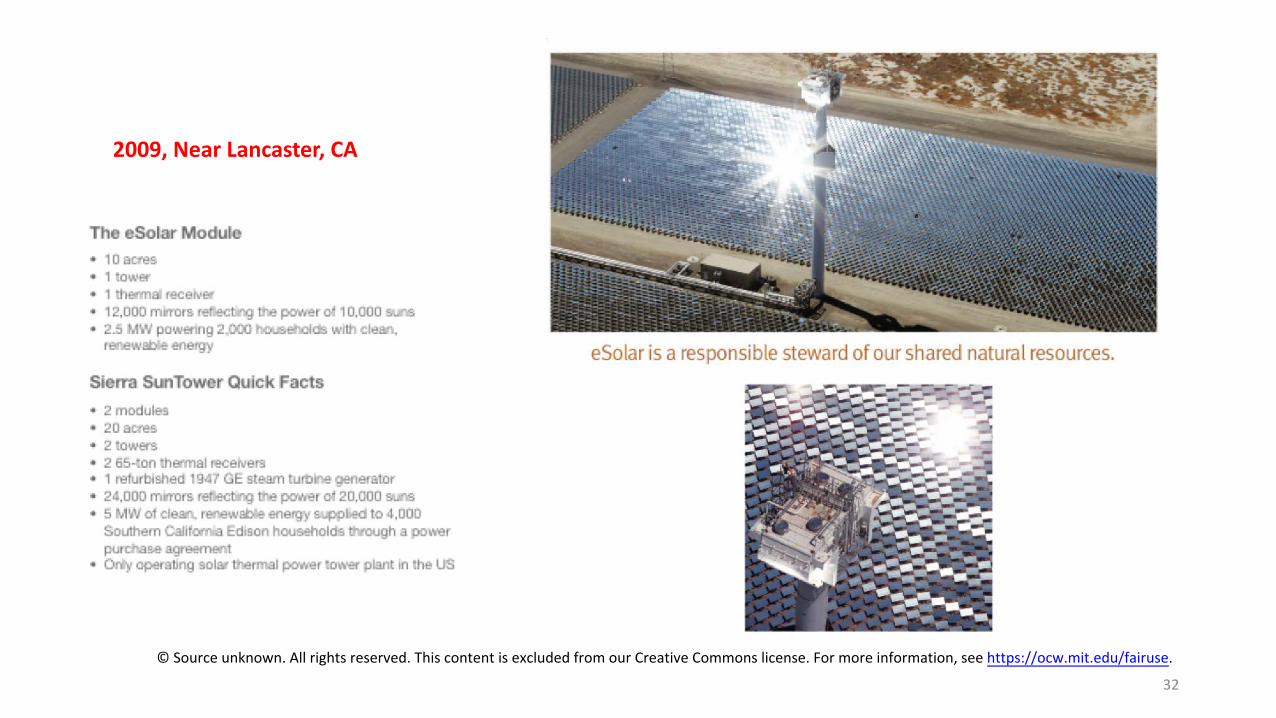
2009, Near Lancaster, CA
© Source unknown. All rights reserved. This content is excluded from our Creative Commons license. For more information, see https://ocw.mit.edu/fairuse.
32

Solar Dish + Stirling Engine/Micro turbine
© Source unknown. All rights reserved. This content is excluded from our Creative Commons license. For more information, see https://ocw.mit.edu/fairuse.
A parabolic dish mirror concentrates the energy onto the engine hot side. T ~ 750 C is achievable. Stirling engines or micro gas turbine could be used with 10-25 kW. Overall efficiency close to 30%
© Ahmed F. Ghoniem 33
Image courtesy of DOE.

CSP Dish/Converter Systems • Technology Features:
– High efficiency (Peak > 30% net solar-to-electric)– Modularity (10, 25kW)– Autonomous operation– Hybrid capabilities (no storage)– Stirling and, in future, Brayton engines and CPV
© Source unknown. All rights reserved. This content is excluded from our Creative Commons license. For more information, see https://ocw.mit.edu/fairuse. 34

© Siemens AG. All rights reserved. This content is excluded from our Creative Commons license. For more information, see https://ocw.mit.edu/fairuse. 35
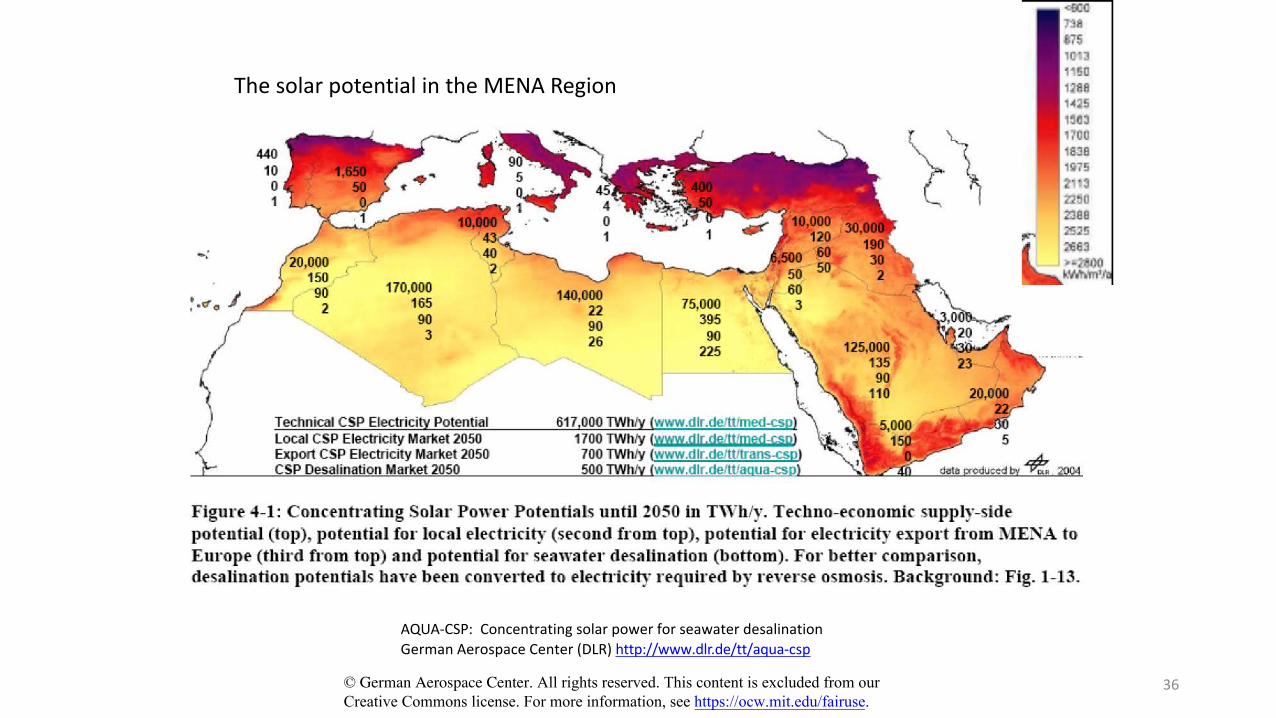
The solar potential in the MENA Region
AQUA-CSP: Concentrating solar power for seawater desalination German Aerospace Center (DLR) http://www.dlr.de/tt/aqua-csp
© German Aerospace Center. All rights reserved. This content is excluded from our Creative Commons license. For more information, see https://ocw.mit.edu/fairuse.
36

Operating Hybrid Combined Cycle Solar Plant
© DCSP. All rights reserved. This content is excluded from our Creative Commons license. For more information, see https://ocw.mit.edu/fairuse.
37
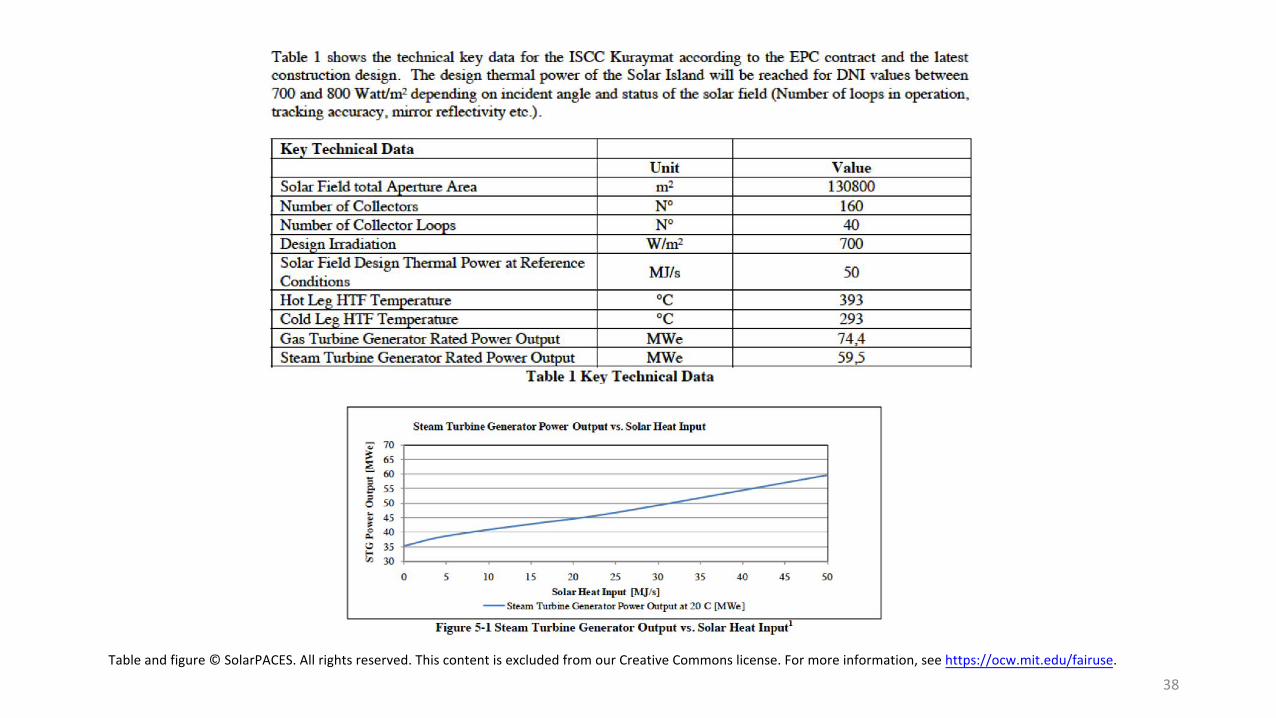
Table and figure © SolarPACES. All rights reserved. This content is excluded from our Creative Commons license. For more information, see https://ocw.mit.edu/fairuse.
38

Bossel, Towards a Sustainable Energy Future, Oct 2004
Israel
No longer operating, problems with the concentrator and heliostat
© Source unknown. All rights reserved. This content is excluded from our Creative Commons license. For more information, see https://ocw.mit.edu/fairuse.
© Ahmed F. Ghoniem 39

© Source unknown. All rights reserved. This content is excluded from our Creative Commons license. For more information, see https://ocw.mit.edu/fairuse.
Located in the Western Region of Abu Dhabi, the 100-megawatt, grid connected power plant generates clean energy to power 20,000 homes in the UAE (2012).
Shams 1 was designed and developed by Shams Power Company, a joint venture between Masdar (60 percent), Total (20 percent) and Abengoa Solar (20 percent).
Covering an area of 2.5 km² – or 285 football fields – Shams 1 incorporates the latest in parabolic trough technology and features more than 258,000 mirrors mounted on 768 tracking parabolic trough collectors.
The CSP project reduces the UAE’s carbon emissions, displacing approximately 175,000 tonnes of CO₂ per year, an equivalent to planting 1.5 million trees, or taking 15,000 cars off the road.
40

r the desert”Solar Chimneythe Hydroelectric Power for the desert”
ΔTVch = 2gHch T Courtesy Elsevier, Inc., http://www.sciencedirect.com. Used with permission.
Operated in Spain, 1982-89 From Encyclopedia of Physical Science and Technology, 2000 Article by J Schlaich and W Schiel
Figures 1 and 2 © Source unknown. All rights reserved. This content is excluded from our Creative Commons license. For more information, see https://ocw.mit.edu/fairuse.
© Ahmed F. Ghoniem 41

Figures 3 and 9 © Source unknown. All rights reserved. This content is excluded from our Creative Commons license. For more information, see https://ocw.mit.edu/fairuse.
© Ahmed F. Ghoniem 42

Many trends in Solar Chemical Hybrid Systems
Water splitting using solar heat, or steam reforming, cracking or gasification of fuels (gas, liquid and solids).
“Solar fuels” is a very active research area in many leading institutions and the subject on newly awarded large centers in the US>
Potential: Low temperature solar thermal chemical process 43
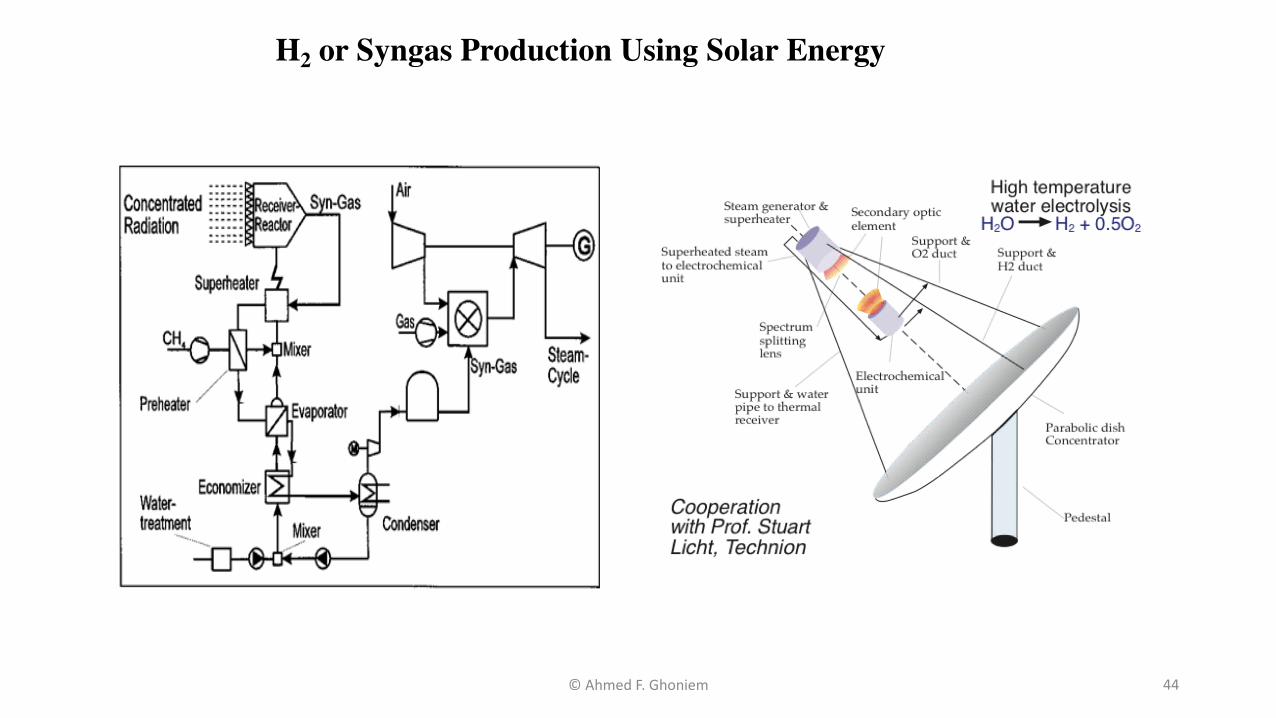
H2 or Syngas Production Using Solar Energy
© Ahmed F. Ghoniem 44

Three Hybridization Schemes
1 – Solarized GT 2 – STM Integration 3 – Solar Reforming
Courtesy Elsevier, Inc., http://www.sciencedirect.com. Used with permission.
J. Sheu and A. F. Ghoniem. International Journal of Hydrogen Energy, 39(27): 14817-14833, 2014 E. J. Sheu, E. M. A. Mokheimer, and A. F. Ghoniem, Journal of Hydrogen Energy, 40(7): 2939-2949, 2015
45

Solar Fuels?
Novel, looping based reformer
Solar Radiation Solar Window
Parabolic Solar Collector Receiver Reactor
Solar Radiation
Courtesy Elsevier, Inc., http://www.sciencedirect.com. Used with permission.
E. J. Sheu, E. M. A. Mokheimer, and A. F. Ghoniem. International Journal of Hydrogen Energy, 40(38): 12929-12955, 2015 E. J. Sheu and A. F. GhoniemSolar Energy, 125 (2016) 339-359. and 134 (2016), pp. 23-31. 46
MIT OpenCourseWare https://ocw.mit.edu/
2.60J Fundamentals of Advanced Energy Conversion Spring 2020
For information about citing these materials or our Terms of Use, visit: https://ocw.mit.edu/terms.
Related Documents