• L12 - Introduction to Protein Structure; Structure Comparison & Classification • L13 - Predicting protein structure • L14 - Predicting protein interactions • L15 - Gene Regulatory Networks • L16 - Protein Interaction Networks • L17 - Computable Network Models

Welcome message from author
This document is posted to help you gain knowledge. Please leave a comment to let me know what you think about it! Share it to your friends and learn new things together.
Transcript
• L12 - Introduction to Protein Structure; Structure Comparison & Classification • L13 - Predicting protein structure • L14 - Predicting protein interactions • L15 - Gene Regulatory Networks • L16 - Protein Interaction Networks • L17 - Computable Network Models


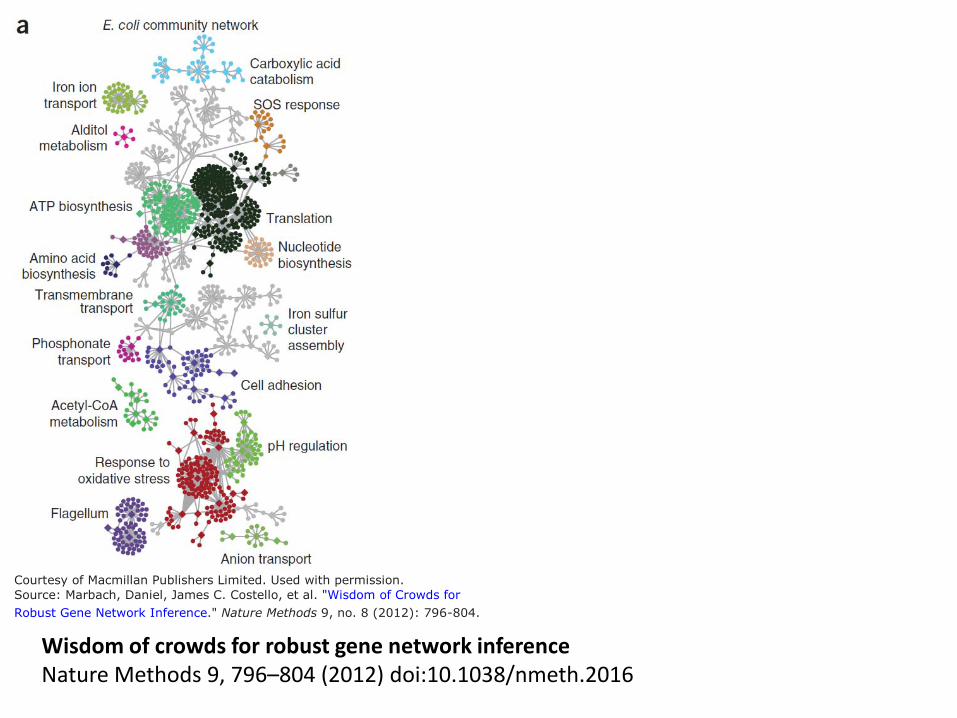
Courtesy of Macmillan Publishers Limited. Used with permission.
Source: Marbach, Daniel, James C. Costello, et al. "Wisdom of Crowds for
Robust Gene Network Inference." Nature Methods 9, no. 8 (2012): 796-804.
Wisdom of crowds for robust gene network inference Nature Methods 9, 796–804 (2012) doi:10.1038/nmeth.2016

Wisdom of crowds for robust gene network inference Nature Methods 9, 796–804 (2012) doi:10.1038/nmeth.2016
Courtesy of Macmillan Publishers Limited. Used with permission.
Source: Marbach, Daniel, James C. Costello, et al. "Wisdom of Crowds for
Robust Gene Network Inference." Nature Methods 9, no. 8 (2012): 796-804.

AUPR = area under precision-recall curve Ar
ea u
nder
pre
cisi
on-r
ecal
l cur
ve
Courtesy of Macmillan Publishers Limited. Used with permission.
Source: Marbach, Daniel, James C. Costello, et al. "Wisdom of Crowds for
Robust Gene Network Inference." Nature Methods 9, no. 8 (2012): 796-804.
Wisdom of crowds for robust gene network inference Nature Methods 9, 796–804 (2012) doi:10.1038/nmeth.2016

AUPR = area under precision-recall curve Ar
ea u
nder
pre
cisi
on-r
ecal
l cur
ve
Note change of scale!
Courtesy of Macmillan Publishers Limited. Used with permission.
Source: Marbach, Daniel, James C. Costello, et al. "Wisdom of Crowds for
Robust Gene Network Inference." Nature Methods 9, no. 8 (2012): 796-804.
Wisdom of crowds for robust gene network inference Nature Methods 9, 796–804 (2012) doi:10.1038/nmeth.2016

Area
und
er p
reci
sion
-rec
all c
urve
AUPR = area under precision-recall curve
Courtesy of Macmillan Publishers Limited. Used with permission.
Source: Marbach, Daniel, James C. Costello, et al. "Wisdom of Crowds for
Robust Gene Network Inference." Nature Methods 9, no. 8 (2012): 796-804.
Wisdom of crowds for robust gene network inference Nature Methods 9, 796–804 (2012) doi:10.1038/nmeth.2016
Thoughts on Gene Expression Data
• Useful for classification and clustering • Not sufficient for reconstructing regulatory
networks in yeast • Can we infer levels of proteins from gene
expression?

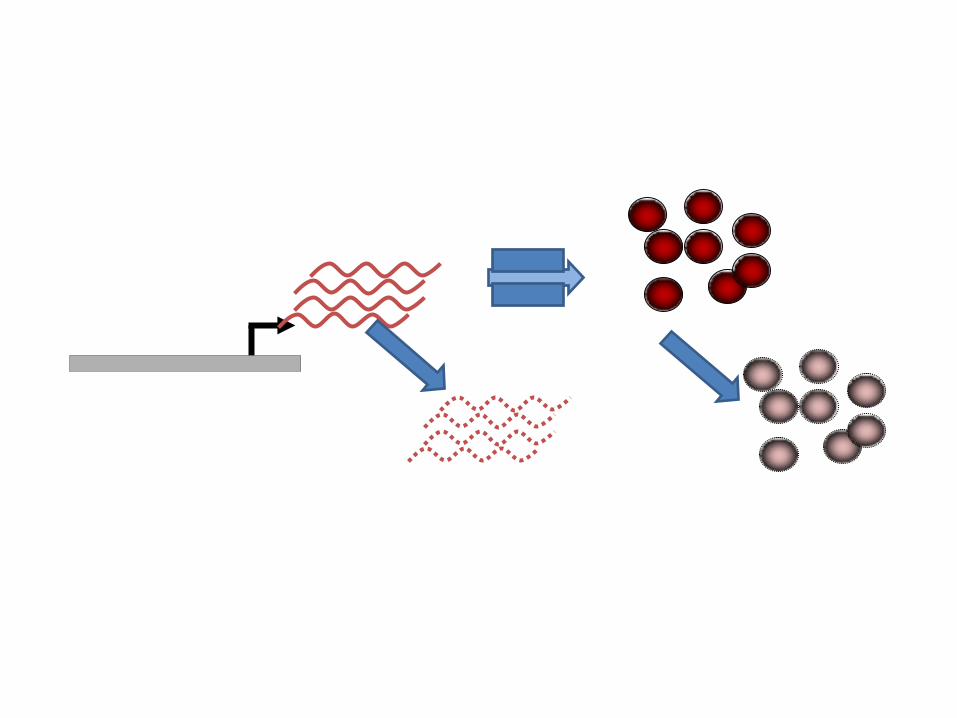
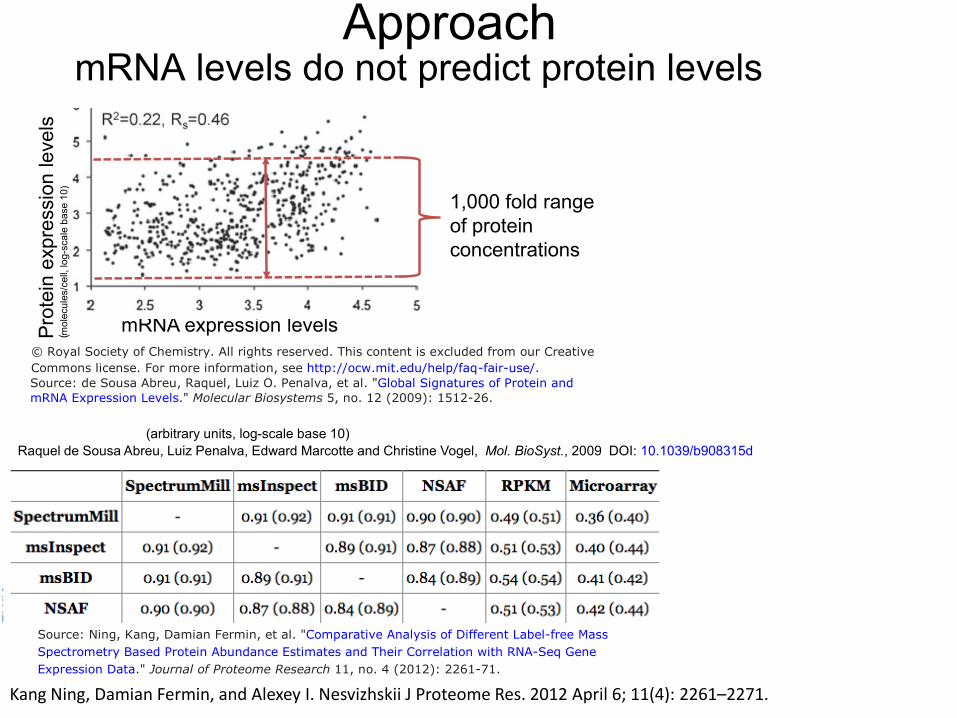
Approach mRNA levels do not predict protein levels
1,000 fold range of protein concentrations
mRNA expression levels
(arbitrary units, log-scale base 10) Raquel de Sousa Abreu, Luiz Penalva, Edward Marcotte and Christine Vogel, Mol. BioSyst., 2009 DOI: 10.1039/b908315d
Prot
ein
expr
essi
on le
vels
( mol
ecul
es/c
ell,
log-
scal
e ba
se 1
0)
© Royal Society of Chemistry. All rights reserved. This content is excluded from our Creative
Commons license. For more information, see http://ocw.mit.edu/help/faq-fair-use/.Source: de Sousa Abreu, Raquel, Luiz O. Penalva, et al. "Global Signatures of Protein and
mRNA Expression Levels." Molecular Biosystems 5, no. 12 (2009): 1512-26.
Source: Ning, Kang, Damian Fermin, et al. "Comparative Analysis of Different Label-free Mass
Spectrometry Based Protein Abundance Estimates and Their Correlation with RNA-Seq Gene
Expression Data." Journal of Proteome Research 11, no. 4 (2012): 2261-71.
Kang Ning, Damian Fermin, and Alexey I. Nesvizhskii J Proteome Res. 2012 April 6; 11(4): 2261–2271.

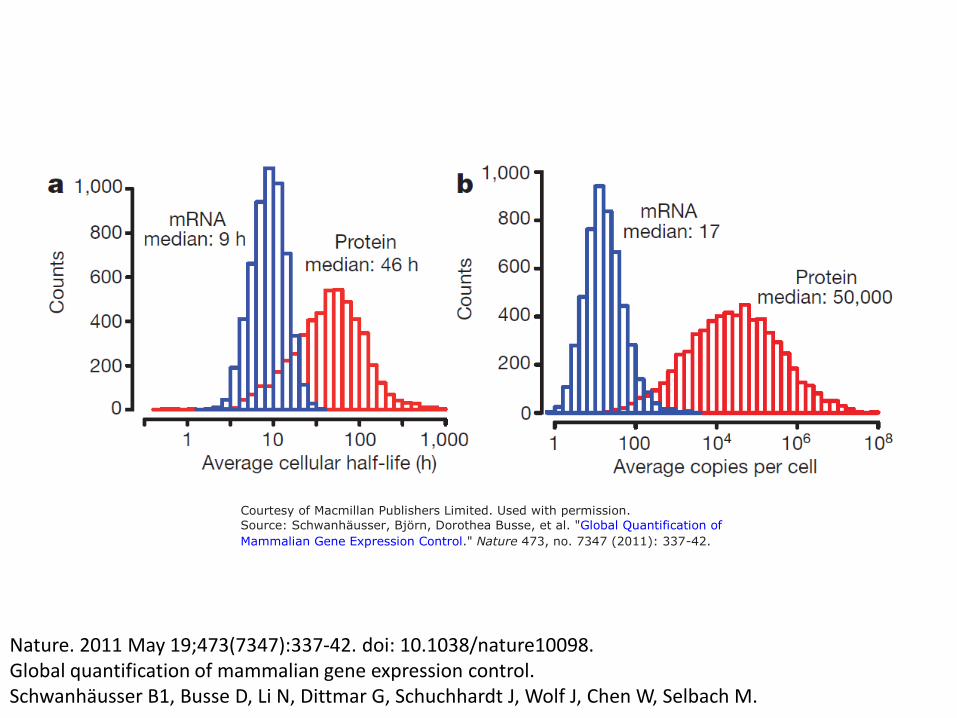
Courtesy of Macmillan Publishers Limited. Used with permission.
Source: Schwanhäusser, Björn, Dorothea Busse, et al. "Global Quantification of
Mammalian Gene Expression Control." Nature 473, no. 7347 (2011): 337-42.
Nature. 2011 May 19;473(7347):337-42. doi: 10.1038/nature10098. Global quantification of mammalian gene expression control. Schwanhäusser B1, Busse D, Li N, Dittmar G, Schuchhardt J, Wolf J, Chen W, Selbach M.
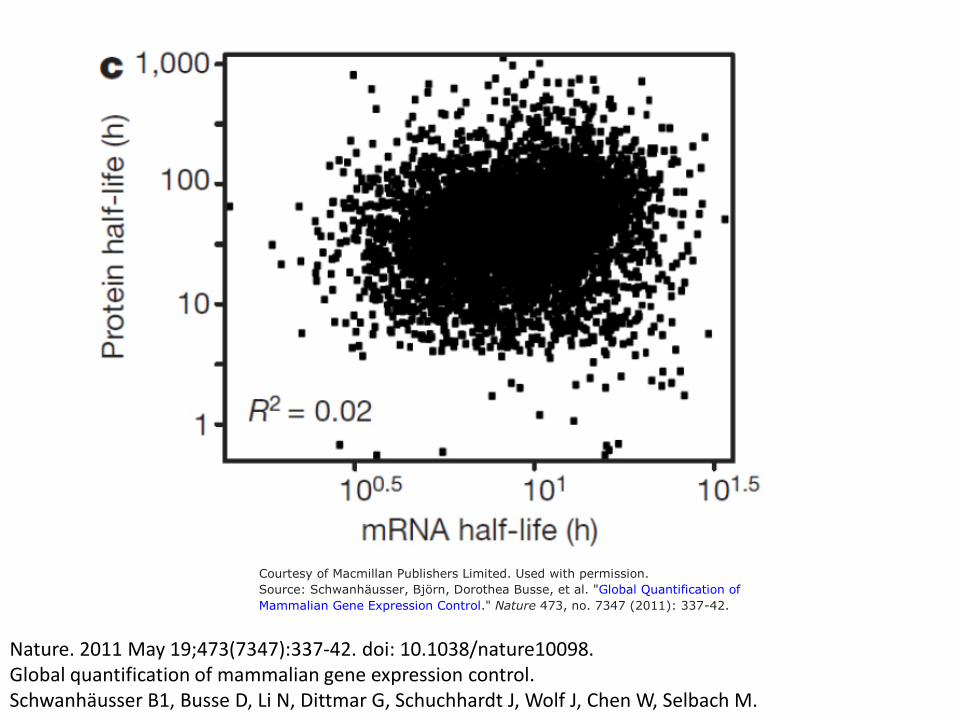
Nature. 2011 May 19;473(7347):337-42. doi: 10.1038/nature10098. Global quantification of mammalian gene expression control. Schwanhäusser B1, Busse D, Li N, Dittmar G, Schuchhardt J, Wolf J, Chen W, Selbach M.
Courtesy of Macmillan Publishers Limited. Used with permission.
Source: Schwanhäusser, Björn, Dorothea Busse, et al. "Global Quantification of
Mammalian Gene Expression Control." Nature 473, no. 7347 (2011): 337-42.

Nature. 2011 May 19;473(7347):337-42. doi: 10.1038/nature10098. Global quantification of mammalian gene expression control. Schwanhäusser B1, Busse D, Li N, Dittmar G, Schuchhardt J, Wolf J, Chen W, Selbach M.

Courtesy of Macmillan Publishers Limited. Used with permission.
Source: Schwanhäusser, Björn, Dorothea Busse, et al. "Global Quantification of
Mammalian Gene Expression Control." Nature 473, no. 7347 (2011): 337-42.
Nature. 2011 May 19;473(7347):337-42. doi: 10.1038/nature10098. Global quantification of mammalian gene expression control. Schwanhäusser B1, Busse D, Li N, Dittmar G, Schuchhardt J, Wolf J, Chen W, Selbach M.

Strategies: 1. Use expression to infer upstream events 2. Explicitly model downstream steps
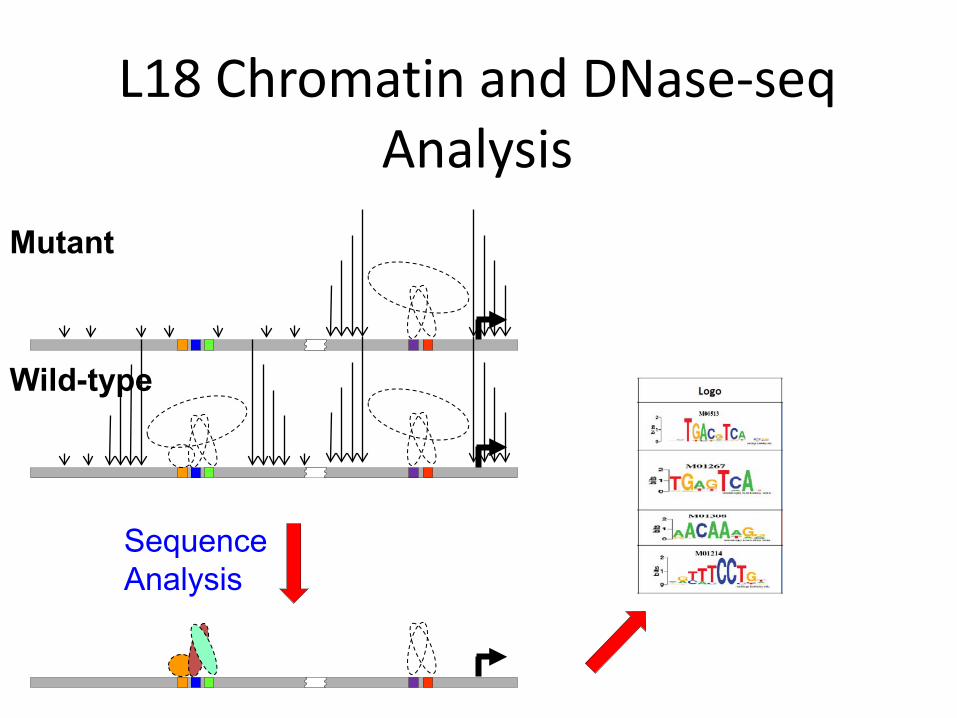
L18 Chromatin and DNase-seq Analysis
Mutant
Wild-type
Sequence Analysis

Move upstream of transcription
Network integration
Epigenomic Data & Sequence
Analysis mRNA
DNA- binding proteins
Interactome

Strategies: 1. Use expression to infer upstream events 2. Explicitly model downstream steps

Courtesy of Vaske et al. License: CC-BY.
Source: Vaske, Charles J., Stephen C. Benz, et al. "Inference of Patient-specific Pathway Activities from
Multi-dimensional Cancer Genomics Data Using PARADIGM." Bioinformatics 26, no. 12 (2010): i237-i45.
Vaske C J et al. Bioinformatics 2010;26:i237-i245
© The Author(s) 2010. Published by Oxford University Press.

Overview of the PARADIGM method.
Vaske C J et al. Bioinformatics 2010;26:i237-i245 Courtesy of Vaske et al. License: CC-BY.
Source: Vaske, Charles J., Stephen C. Benz, et al. "Inference of Patient-specific Pathway Activities from
Multi-dimensional Cancer Genomics Data Using PARADIGM." Bioinformatics 26, no. 12 (2010): i237-i45.
© The Author(s) 2010. Published by Oxford University Press.
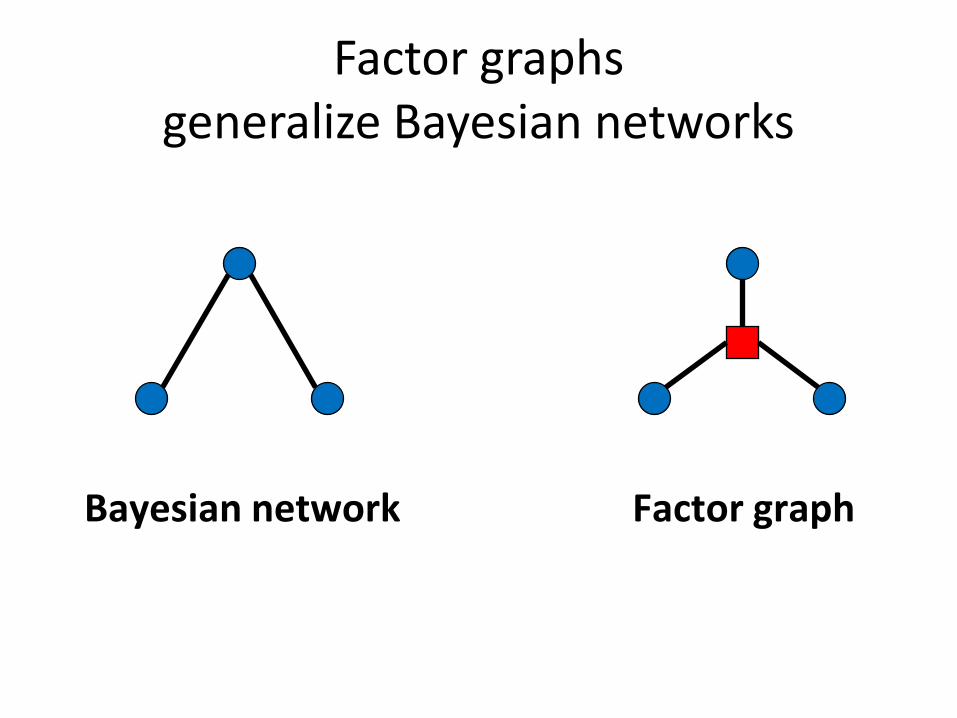
Factor graphs generalize Bayesian networks
Bayesian network Factor graph

Factor graphs
• Bipartite graph (means there are two types of nodes)
• Describes how a global function can be factored into a product of local functions • Bayesian networks are a type of
Factor graph factor graph

Factor graphs
Global function of the variables : g x x x ( 1 2 , 3 =∏ j ( j ), ) f X j J∈
Variable node, x
Factor node, f
x3
f
x1 x2
Edge exists Factor graph iff x is an argument of f

Factor graphs
• A node for: x1 – every variable and f
g x x x ( , , ) j ( )1 2 3 =∏ f X j j J– every function fj (Xj) ∈
• Node xi is connected to factor fj iff the variable xi appears as a term in fj
x3
f
x1 x2
Factor graph

In our setting Joint probabilty function : P x x x ( 1 2 , 3 =∏ j ( j ), ) f X
j J∈
Variable node, x = state of gene/protein/pathway
Factor node, f describes relationships
Edge exists iff x is an argument of f
x3
f
x1 x2
Factor graph

Global function: g( , , , , ) x x x x x 1 2 3 4 5
g( , , , , ) x x x x x Marginal g ai ( ) : sum 1 2 3 4 5
over all configurations of the variables with xi=a What is the probability that MYC/MAX is active? P(xi=active)
Factor graphs provide a method to compute such marginals
© American Association for Cancer Research. All rights reserved. This content is excluded from our
Creative Commons license. For more information, see http://ocw.mit.edu/help/faq-fair-use/.Source: Goldstein, Theodore C., Evan O. Paull, et al. "Molecular Pathways: Extracting Medical
Knowledge from High-throughput Genomic Data." Clinical Cancer Research 19, no. 12 (2013): 3114-20.

Global function: ( , , , , ) = ( ) ( ) ( , , ) ( , ) ( , ) g x x x x x f x f x f x x x f x x f x x 1 2 3 4 5 A 1 B 2 C 1 2 3 D 3 4 E 3 5
g x x x x x Marginal g a( ) : sum ( , , , , )i 1 2 3 4 5
over all configurations of the variables with xi=a
g x( ) = ( )f x ×1 1 A 1
( ) ( , , ) f x x ( , ) f x f x x x ( , ) f x x
∑ B 2 ∑ C 1 2 3 ∑ D 3 4 ∑ E 3 5 x x x x 2 3 4 5
x2x1 x3 x5x4
fA fB fC fD fE

Global function: ( , , , , ) = f x f x f x x x f x x f x x ( ) ( ) ( , , ) ( , ) ( , ) g x x x x x 1 2 3 4 5 A 1 B 2 C 1 2 3 D 3 4 E 3 5
( ) x x x x x Marginal g a : sum g( , , , , ) i 1 2 3 4 5
over all configurations of the variables with xi=a
( ) = g( , , , , ) g x x x x x x i i ∑ 1 2 3 4 5 x ~{ }
x2 x3
“not-sum” or summary i
over all values of xj≠i
x1 x4 x5
fA fB fDfC fE

Global function: ( , , , , ) = ( ) ( ) ( , , ) ( , ) ( , ) g x x x x x f x f x f x x x f x x f x x 1 2 3 4 5 A 1 B 2 C 1 2 3 D 3 4 E 3 5
g x x x x x Marginal g a( ) : sum ( , , , , )i 1 2 3 4 5
over all configurations of the variables with xi=a
g x( ) = ( )f x ×1 1 A 1
( ) ( , , ) f x x ( , ) f x f x x x ( , ) f x x∑ B 2 ∑ C 1 2 3 ∑ D 3 4 ∑ E 3 5 x x x x 2 3 4 5
g x( ) = ( )f x ×1 1 A 1
( ) ( , , ) f ( , ) f x x f x f x x x x x ( , ) ∑
B 2 C 1 2 3 ∑ D 3 4 ∑ E 3 5
~{ }x ~{ }x ~{ } x1 3 3

Global function: ( , , , , ) = fA ( ) ( ) ( , , ) ( , ) ( , )x f x x x f x x f x xg x x x x x x f1 2 3 4 5 1 B 2 C 1 2 3 D 3 4 E 3 5
How do we find the marginal for any factor graph?
x2x1 x3 x5x4
fA fB fC fD fE

To compute the marginal with respect to variable xi : draw the factor graph as a tree with root xi
© IEEE. All rights reserved. This content is excluded from our Creative Commons
license. For more information, see http://ocw.mit.edu/help/faq-fair-use/.Source: Kschischang, Frank R., Brendan J. Frey,et al. "Factor Graphsand the Sum-product Algorithm." Information Theory, IEEE Transactions on 47,no. 2 (2001): 498-519.
x1
fC
x2 x3 x4 x5
fA fB fD fE

Expression Factor Tree Graph
© IEEE. All rights reserved. This content is excluded from our Creative Commons
license. For more information, see http://ocw.mit.edu/help/faq-fair-use/.Source: Kschischang, Frank R., Brendan J. Frey,et al. "Factor Graphsand the Sum-product Algorithm." Information Theory, IEEE Transactions on 47,no. 2 (2001): 498-519.
Marginal: g x( ) = ( )f x ×1 1 A 1
( ) ( , , ) f ( , ) f x x f x f x x x x x ( , )∑ B 2 C 1 2 3 ∑ D 3 4 ∑ E 3 5
~{ }x ~{ }x ~{ } x1 3 3
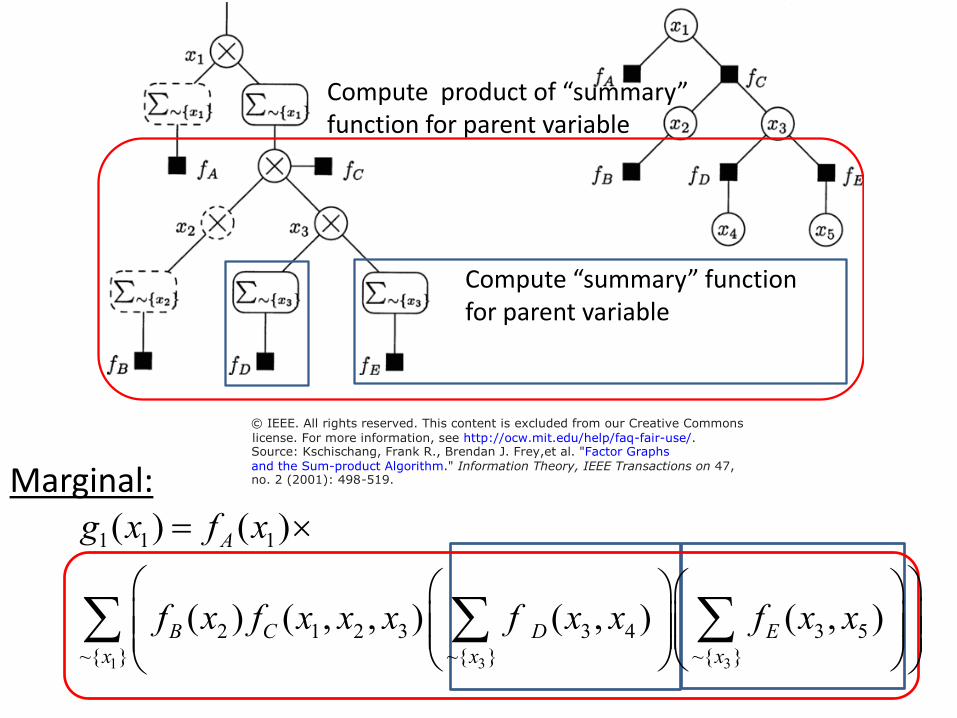
Compute “summary” function for parent variable
Compute product of “summary” function for parent variable
© IEEE. All rights reserved. This content is excluded from our Creative Commons
license. For more information, see http://ocw.mit.edu/help/faq-fair-use/.Source: Kschischang, Frank R., Brendan J. Frey,et al. "Factor Graphsand the Sum-product Algorithm." Information Theory, IEEE Transactions on 47,no. 2 (2001): 498-519.Marginal:
g x( ) = ( )f x ×
1 3 3
1 1 1
2 1 2 3 3 4 3 5 ~{ } ~{ } ~{ }
( ) ( , , ) ( , ) ( , )
A
B C D E x x x
f x f x x x f x x f x x
∑ ∑ ∑

© IEEE. All rights reserved. This content is excluded from our Creative Commons
license. For more information, see http://ocw.mit.edu/help/faq-fair-use/.Source: Kschischang, Frank R., Brendan J. Frey,et al. "Factor Graphsand the Sum-product Algorithm." Information Theory, IEEE Transactions on 47,no. 2 (2001): 498-519.
Messages flow up from leaves: •Each vertex waits for messages from all children before computing message to send to parents •Variable nodes send product of messages from children •Factor nodes with parent x send the “summary” for x of the product of the children’s functions.
Kschischang, F.R.; Frey, B.J.; Loeliger, H.-A., "Factor graphs and the sum-product algorithm," 2001 http://ieeexplore.ieee.org/stamp/stamp.jsp?tp=&arnumber=910572&isnumber=19638

Belief propagation: An algorithm known as “Sum-Product” can be used to simultaneously compute all marginals! See citation for details
© IEEE. All rights reserved. This content is excluded from our Creative Commons
license. For more information, see http://ocw.mit.edu/help/faq-fair-use/.Source: Kschischang, Frank R., Brendan J. Frey,et al. "Factor Graphsand the Sum-product Algorithm." Information Theory, IEEE Transactions on 47,no. 2 (2001): 498-519.
Kschischang, F.R.; Frey, B.J.; Loeliger, H.-A., "Factor graphs and the sum-product algorithm," 2001 http://ieeexplore.ieee.org/stamp/stamp.jsp?tp=&arnumber=910572&isnumber=19638

Factor graphs in PARADIGM
Variable node, x: x3
three states: 1 activated 0 nominal
f
x1 x2
-1 deactivated Factor graph
Factor node, f
Edge exists iff x is an argument of f

Courtesy of Vaske et al. License: CC-BY.
Source: Vaske, Charles J., Stephen C. Benz, et al. "Inference of Patient-specific Pathway Activities from
Multi-dimensional Cancer Genomics Data Using PARADIGM." Bioinformatics 26, no. 12 (2010): i237-i45.
Vaske C J et al. Bioinformatics 2010;26:i237-i245
© The Author(s) 2010. Published by Oxford University Press.

Courtesy of Vaske et al. License: CC-BY.
Source: Vaske, Charles J., Stephen C. Benz, et al. "Inference of Patient-specific Pathway Activities from
Multi-dimensional Cancer Genomics Data Using PARADIGM." Bioinformatics 26, no. 12 (2010): i237-i45.
• Goal: – Estimate probability that pathways are active – Use log likelihood ratio
Parameters estimated by EM from experimental data Vaske C J et al. Bioinformatics 2010;26:i237-i245

Manually constructed Known pathways: •Convert to a directed graph •Each edge is labeled as either positive or negative based on influence •Define joint probability
Courtesy of Vaske et al. License: CC-BY.
Source: Vaske, Charles J., Stephen C. Benz, et al. "Inference of Patient-specific
Pathway Activities from Multi-dimensional Cancer Genomics Data Using
PARADIGM." Bioinformatics 26, no. 12 (2010): i237-i45.

Defining joint probability
Courtesy of Vaske et al. License: CC-BY.
Source: Vaske, Charles J., Stephen C. Benz, et al. "Inference of Patient-specific
Pathway Activities from Multi-dimensional Cancer Genomics Data Using
PARADIGM." Bioinformatics 26, no. 12 (2010): i237-i45.
Expected state: •Majority vote of parent variables •If a parent is connected by a positive edge it contributes a vote of +1 times its own state to the value of the factor. •If the parent is connected by a negative edge, then the variable votes −1 times its own state.
ϵ was set to 0.001
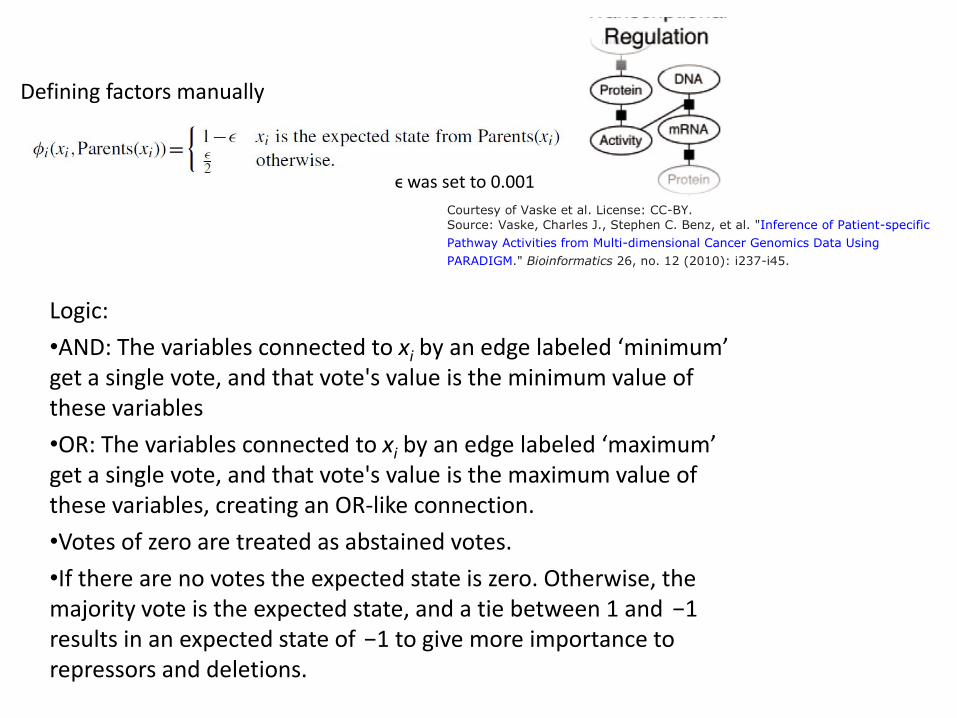
Defining factors manually
ϵ was set to 0.001 Courtesy of Vaske et al. License: CC-BY.
Source: Vaske, Charles J., Stephen C. Benz, et al. "Inference of Patient-specific
Pathway Activities from Multi-dimensional Cancer Genomics Data Using
PARADIGM." Bioinformatics 26, no. 12 (2010): i237-i45.
Logic: •AND: The variables connected to xi by an edge labeled ‘minimum’ get a single vote, and that vote's value is the minimum value of these variables •OR: The variables connected to xi by an edge labeled ‘maximum’ get a single vote, and that vote's value is the maximum value of these variables, creating an OR-like connection. •Votes of zero are treated as abstained votes. •If there are no votes the expected state is zero. Otherwise, the majority vote is the expected state, and a tie between 1 and −1 results in an expected state of −1 to give more importance to repressors and deletions.

Defining factors manually
ϵ was set to 0.001
Logic: •AND: The variables connected to xi by an edge labeled ‘minimum’ get a single vote, and that vote's value is the minimum value of these variables
•OR: The variables connected to xi by an edge labeled ‘maximum’ get a single vote, and that vote's value is the maximum value of these variables, creating an OR-like connection.
Compared to Bayesian networks, factor graphs provide an more intuitive way to represent these regulatory steps
Courtesy of Vaske et al. License: CC-BY.
Source: Vaske, Charles J., Stephen C. Benz, et al."Inference of Patient-specific Pathway Activities
from Multi-dimensional Cancer Genomics Data
Using PARADIGM." Bioinformatics 26,no. 12 (2010): i237-i45.

Joint probability of graph
Product over all m factors φj
Setting of variables = possible values

Marginal
Set of all possible assignments to the variables X consistent with data D
Full specified factor graph
Likelihood

Courtesy of Vaske et al. License: CC-BY.Source: Vaske, Charles J., Stephen C. Benz, et al. "Inference of Patient-specific Pathway Activities from
Multi-dimensional Cancer Genomics Data Using PARADIGM." Bioinformatics 26, no. 12 (2010): i237-i45.
Vaske C J et al. Bioinformatics 2010;26:i237-i245
© The Author(s) 2010. Published by Oxford University Press.
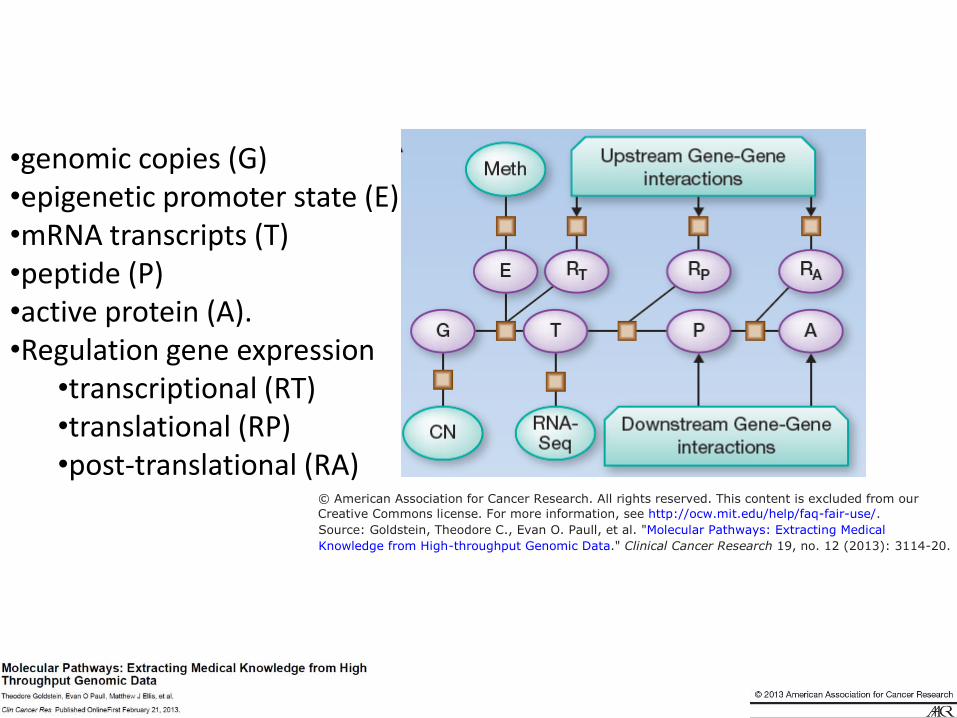
•genomic copies (G) •epigenetic promoter state (E) •mRNA transcripts (T) •peptide (P) •active protein (A). •Regulation gene expression •transcriptional (RT) •translational (RP) •post-translational (RA)
© American Association for Cancer Research. All rights reserved. This content is excluded from our Creative Commons license. For more information, see http://ocw.mit.edu/help/faq-fair-use/.Source: Goldstein, Theodore C., Evan O. Paull, et al. "Molecular Pathways: Extracting MedicalKnowledge from High-throughput Genomic Data." Clinical Cancer Research 19, no. 12 (2013): 3114-20.

© American Association for Cancer Research. All rights reserved. This content is excluded from ourCreative Commons license. For more information, see http://ocw.mit.edu/help/faq-fair-use/.Source: Goldstein, Theodore C., Evan O. Paull, et al. "Molecular Pathways: Extracting Medical
Knowledge from High-throughput Genomic Data." Clinical Cancer Research 19, no. 12 (2013): 3114-20.
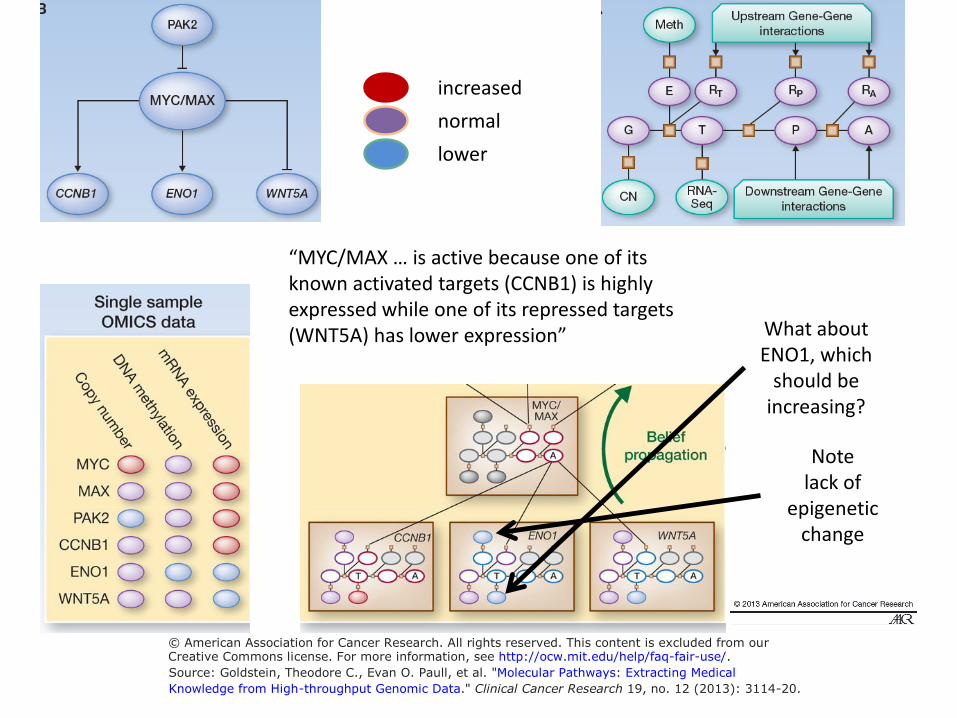
increased normal lower
“MYC/MAX … is active because one of its known activated targets (CCNB1) is highly expressed while one of its repressed targets
What about (WNT5A) has lower expression” ENO1, which
should be increasing?
Note lack of
epigenetic change
© American Association for Cancer Research. All rights reserved. This content is excluded from ourCreative Commons license. For more information, see http://ocw.mit.edu/help/faq-fair-use/.Source: Goldstein, Theodore C., Evan O. Paull, et al. "Molecular Pathways: Extracting Medical
Knowledge from High-throughput Genomic Data." Clinical Cancer Research 19, no. 12 (2013): 3114-20.

increased normal lower
© American Association for Cancer Research. All rights reserved. This content is excluded from ourCreative Commons license. For more information, see http://ocw.mit.edu/help/faq-fair-use/.Source: Goldstein, Theodore C., Evan O. Paull, et al. "Molecular Pathways: Extracting Medical
Knowledge from High-throughput Genomic Data." Clinical Cancer Research 19, no. 12 (2013): 3114-20.

Reasoning on curated pathways
Courtesy of Vaske et al. License: CC-BY.Source: Vaske, Charles J., Stephen C. Benz, et al. "Inference of Patient-specific
Pathway Activities from Multi-dimensional Cancer Genomics Data Using
PARADIGM." Bioinformatics 26, no. 12 (2010): i237-i45.
Reasoning on the interactome
© source unknown. All rights reserved. This content is excluded from our Creative
Commons license. For more information, see http://ocw.mit.edu/help/faq-fair-use/.

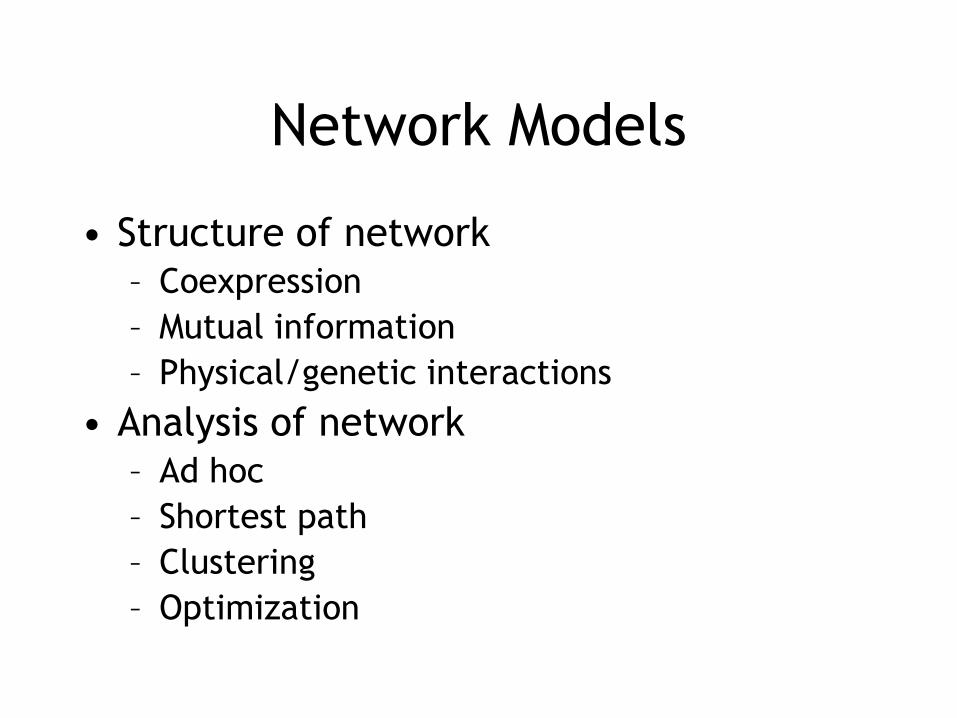
Network Models
• Structure of network – Coexpression – Mutual information – Physical/genetic interactions
• Analysis of network – Ad hoc – Shortest path – Clustering – Optimization

Graph Algorithms for Interaction Networks
• Rich area of computer science • Applications to Interaction Networks:
– Distances: • Finding kinase substrates
– Clustering • PPI->Protein complexes, functional annotation • Coexpression -> Modules • Blast ->Protein families
– Active subnetworks • Finding hidden components of processes

P
P
P
P
Networkin
If I know a protein has been phosphorylated, can I determine the kinase?
Courtesy of Macmillan Publishers Limited. Used with permission.Source: Yeger-Lotem, Esti, Laura Riva, et al. "Bridging High-throughput Genetic and
Transcriptional Data Reveals Cellular Responses to Alpha-synuclein Toxicity."
Nature Genetics 41, no. 3 (2009): 316-23.
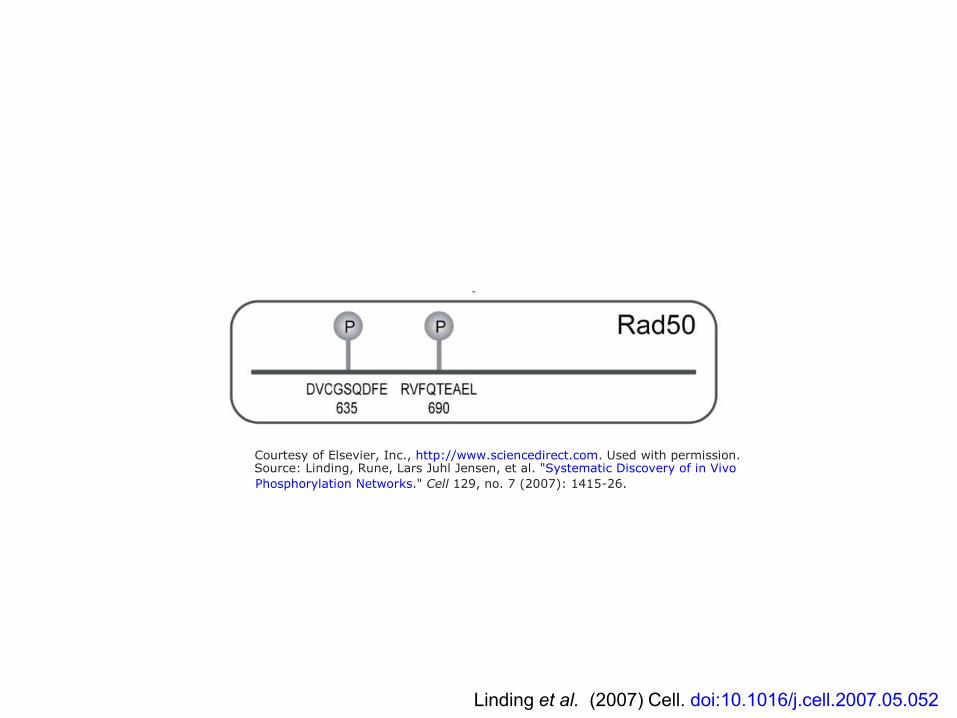
Source: Linding, Rune, Lars Juhl Jensen, et al. "Systematic Discovery of in Vivo
Phosphorylation Networks." Cell 129, no. 7 (2007): 1415-26.
Linding et al. (2007) Cell. doi:10.1016/j.cell.2007.05.052
Courtesy of Elsevier, Inc., http://www.sciencedirect.com. Used with permission.
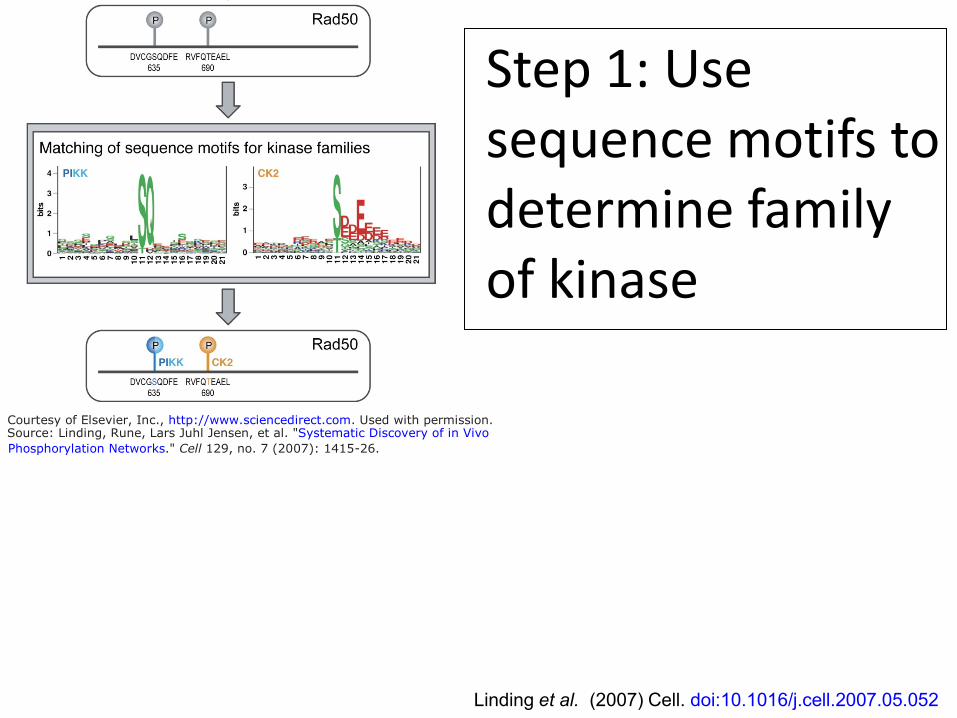
Step 1: Use sequence motifs to determine family of kinase
Linding et al. (2007) Cell. doi:10.1016/j.cell.2007.05.052
Courtesy of Elsevier, Inc., http://www.sciencedirect.com. Used with permission.Source: Linding, Rune, Lars Juhl Jensen, et al. "Systematic Discovery of in Vivo
Phosphorylation Networks." Cell 129, no. 7 (2007): 1415-26.

Step 1: Use sequence motifs to determine family of kinase
Step 2: Use Interactome data to find most likely family member
Linding et al. (2007) Cell. doi:10.1016/j.cell.2007.05.052
Courtesy of Elsevier, Inc., http://www.sciencedirect.com.Used with permission.Source: Linding, Rune, Lars Juhl Jensen, et al. "Systematic Discovery
of in Vivo Phosphorylation Networks." Cell 129, no. 7 (2007): 1415-26.

Which is best?
High-throughput Two-hybrid assay
High confidence interaction

How do we find the closest kinase?
• Many efficient algorithms exist once we treat our problem as one in Graph Theory.

Graph Terminology • G=(V,E) • Undirected vs. directed • Weights – numbers assigned to each edge • Degree(v) – number of edges incident on v
– In-degree and out-degree
• Path from a to b is a series of vertices <a, v0, …, b> where edges exist between sequential vertices • Path length = sum of edges weights (or
number of edges) on path.

Data Structure
1
2
4
3 5
Adjacency Matrix 1 2 3 4 5
1 0 1 0 0 0 2 1 0 1 0 1 3 0 1 0 1 0 4 0 0 1 0 0 5 0 1 0 0 0
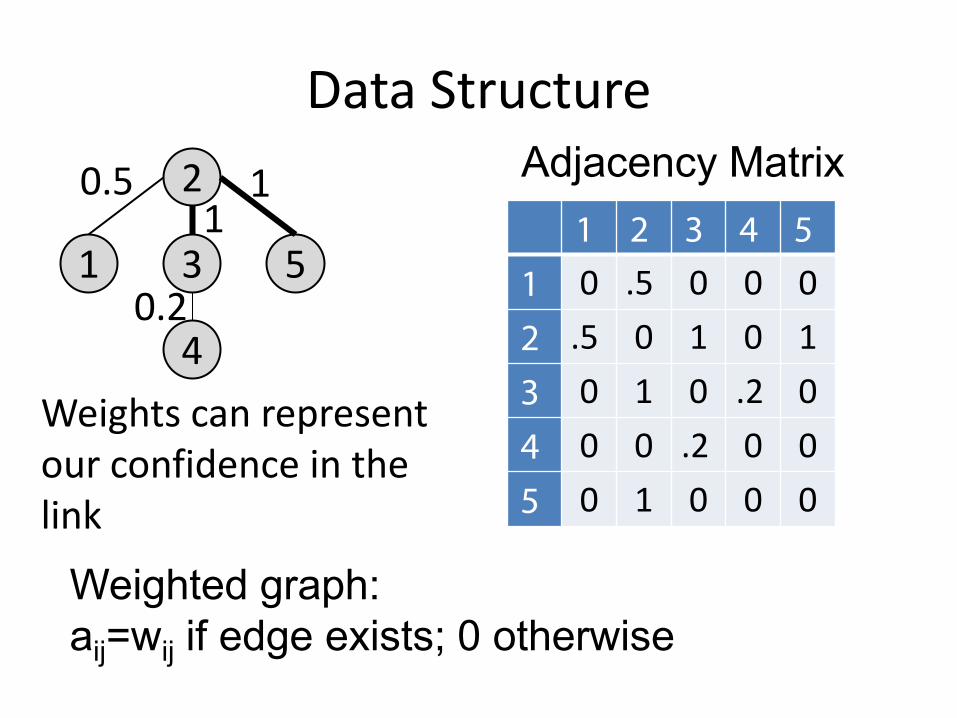
Data Structure
1
2
4
3 5
0.5
0.2
1 1
Adjacency Matrix
Weights can represent our confidence in the link
Weighted graph: aij=wij if edge exists; 0 otherwise
1 2 3 4 5 1 0 .5 0 0 0 2 .5 0 1 0 1 3 0 1 0 .2 0 4 0 0 .2 0 0 5 0 1 0 0 0
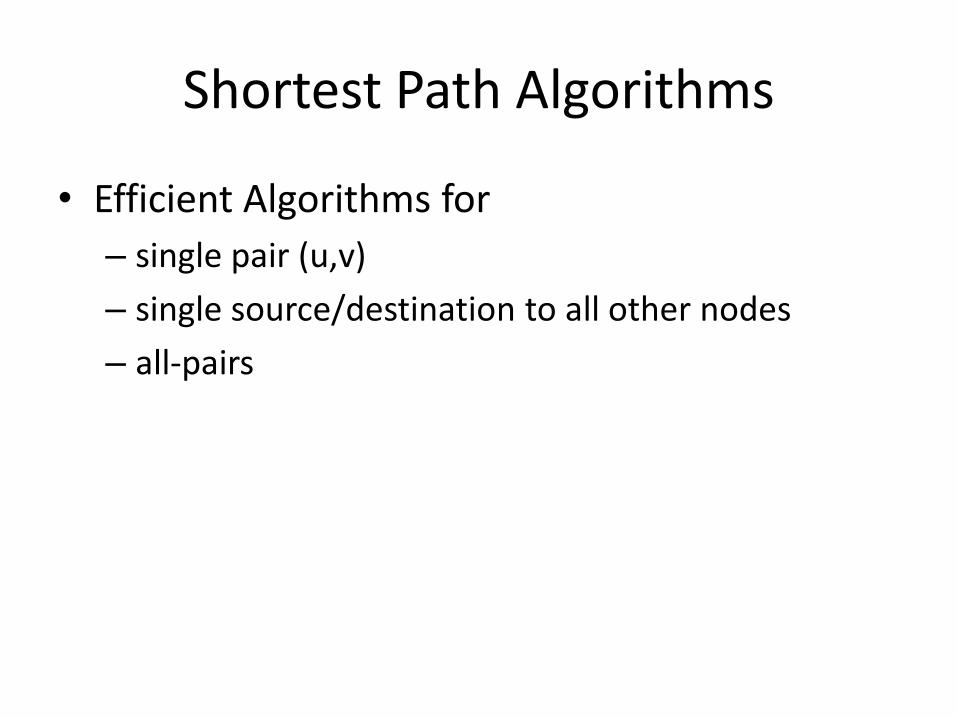
Shortest Path Algorithms
• Efficient Algorithms for – single pair (u,v) – single source/destination to all other nodes – all-pairs

Reliability of edges
• Assign weight to each edge based on reliability. • Total distance in network = sum of edge
weights • If weightij=-log(Pij):
minΣwij = min(-log ΠPij) = max (joint probability) = most probable path

Interaction Weights
• How do we assign reliability of edges?

© American Association for the Advancement of Science. All rights reserved. This content is excluded
from our Creative Commons license. For more information, see http://ocw.mit.edu/help/faq-fair-use/.Source: Jansen, Ronald, Haiyuan Yu, et al. "A Bayesian Networks Approach for Predicting Protein-Protein
Interactions from Genomic Data." Science 302, no. 5644 (2003): 449-53.
http://www.sciencemag.org/content/302/5644/449.abstract 74
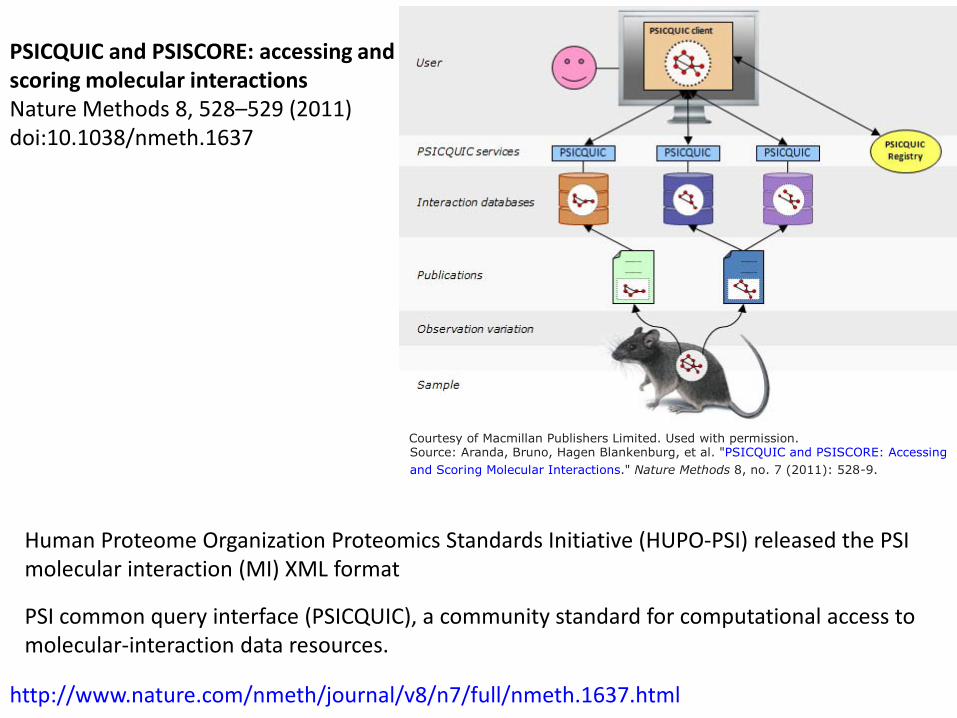
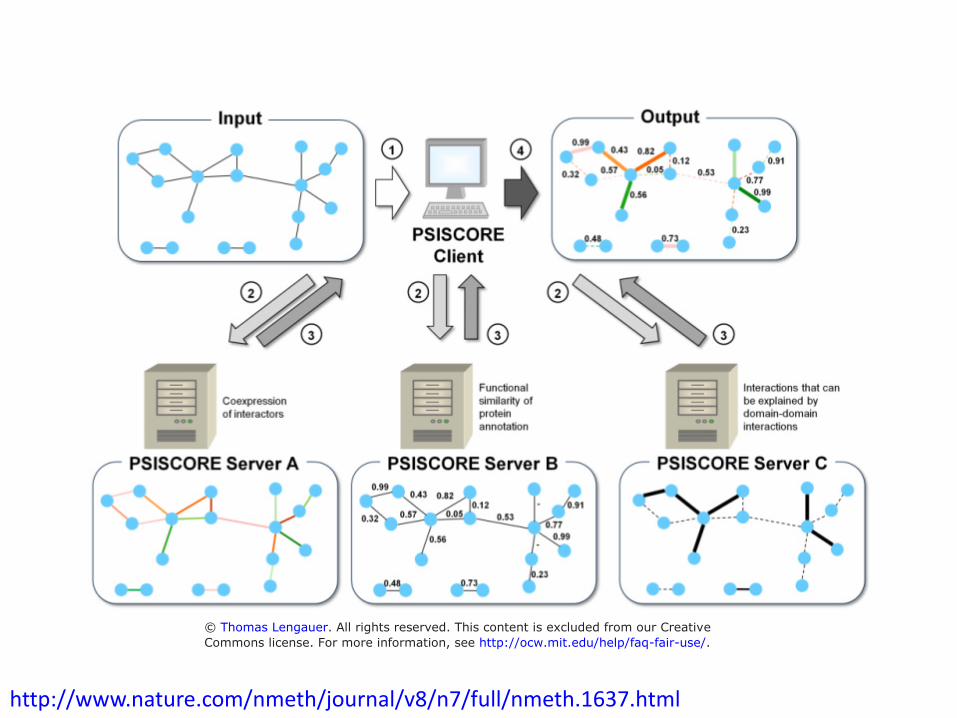
PSICQUIC and PSISCORE: accessing and scoring molecular interactions Nature Methods 8, 528–529 (2011) doi:10.1038/nmeth.1637
Courtesy of Macmillan Publishers Limited. Used with permission.Source: Aranda, Bruno, Hagen Blankenburg, et al. "PSICQUIC and PSISCORE: Accessing
and Scoring Molecular Interactions." Nature Methods 8, no. 7 (2011): 528-9.
Human Proteome Organization Proteomics Standards Initiative (HUPO-PSI) released the PSI molecular interaction (MI) XML format
PSI common query interface (PSICQUIC), a community standard for computational access to molecular-interaction data resources.
http://www.nature.com/nmeth/journal/v8/n7/full/nmeth.1637.html
http://www.nature.com/nmeth/journal/v8/n7/full/nmeth.1637.html
© Thomas Lengauer. All rights reserved. This content is excluded from our Creative
Commons license. For more information, see http://ocw.mit.edu/help/faq-fair-use/.

Miscore algorithm
Courtesy of Miscore. Used with permission.
Miscore is a normalized score between 0 and 1 that takes into account several variables: •Number of publications •Experimental detection methods found for the interaction •Interaction types found for the interaction Each of these variables is also represented by a score between 0 and 1. The importance of each variable in the main equation can be adjusted using a weight factor.

Miscore algorithm
•Number of publications •Experimental method (biophys.; imaging; genetic) •Annotation of interaction type (physical, genetic)
Depends on

Weighted Interactome
© source unknown. All rights reserved. This content is excluded from our Creative
Commons license. For more information, see http://ocw.mit.edu/help/faq-fair-use/.

Finding Modules
• Topological module: – locally dense – more connections
among nodes in module than with nodes outside module
• Functional module: – high density of
functionally related nodes
Courtesy of Macmillan Publishers Limited. Used with permission.Source: Barabási, Albert-László, Natali Gulbahce, et al. "Network Medicine: A Network-based
Approach to Human Disease." Nature Reviews Genetics 12, no. 1 (2011): 56-68.
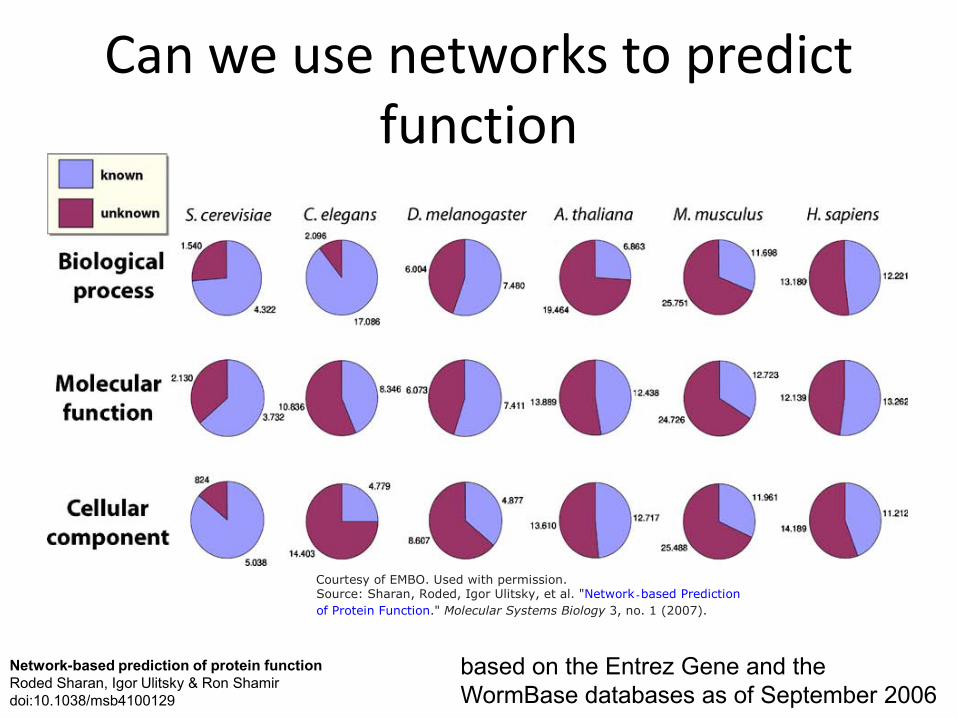
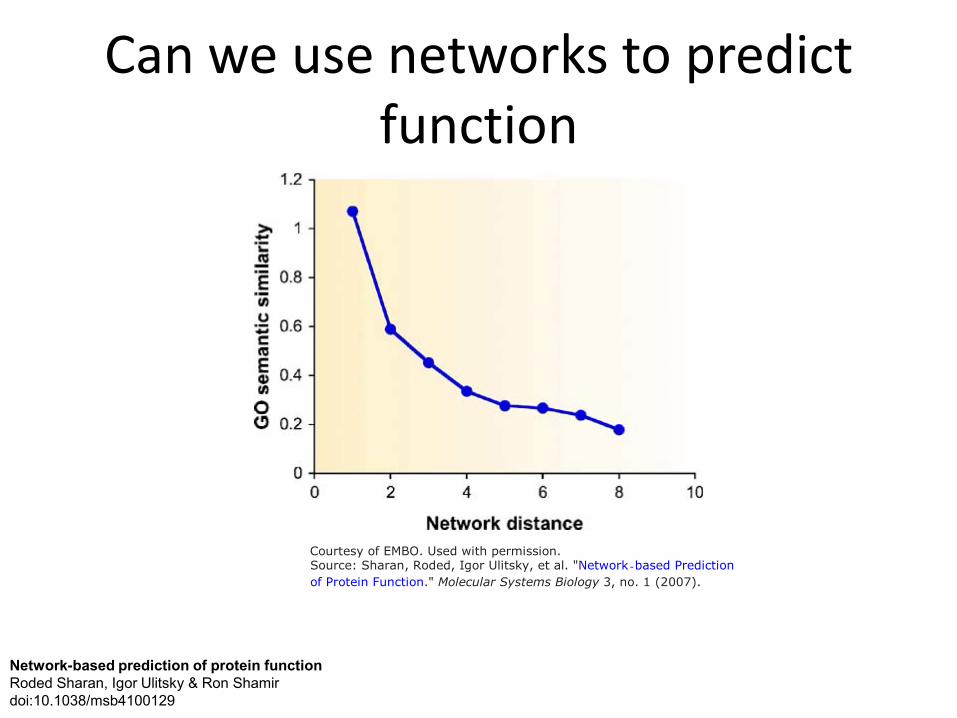
Can we use networks to predict function
Courtesy of EMBO. Used with permission.Source: Sharan, Roded, Igor Ulitsky, et al. "Network‐based Prediction
of Protein Function." Molecular Systems Biology 3, no. 1 (2007).
Network-based prediction of protein function based on the Entrez Gene and the Roded Sharan, Igor Ulitsky & Ron Shamir doi:10.1038/msb4100129 WormBase databases as of September 2006
Can we use networks to predict function
Courtesy of EMBO. Used with permission.Source: Sharan, Roded, Igor Ulitsky, et al. "Network‐based Prediction
of Protein Function." Molecular Systems Biology 3, no. 1 (2007).
Network-based prediction of protein function Roded Sharan, Igor Ulitsky & Ron Shamir doi:10.1038/msb4100129

Systematically deduce the annotation of unknown nodes u from the known (filled) nodes

“Direct” method for gene annotation
K=1 K=2
• K-nearest neighbors – assume that a node has
the same function as its neighbors
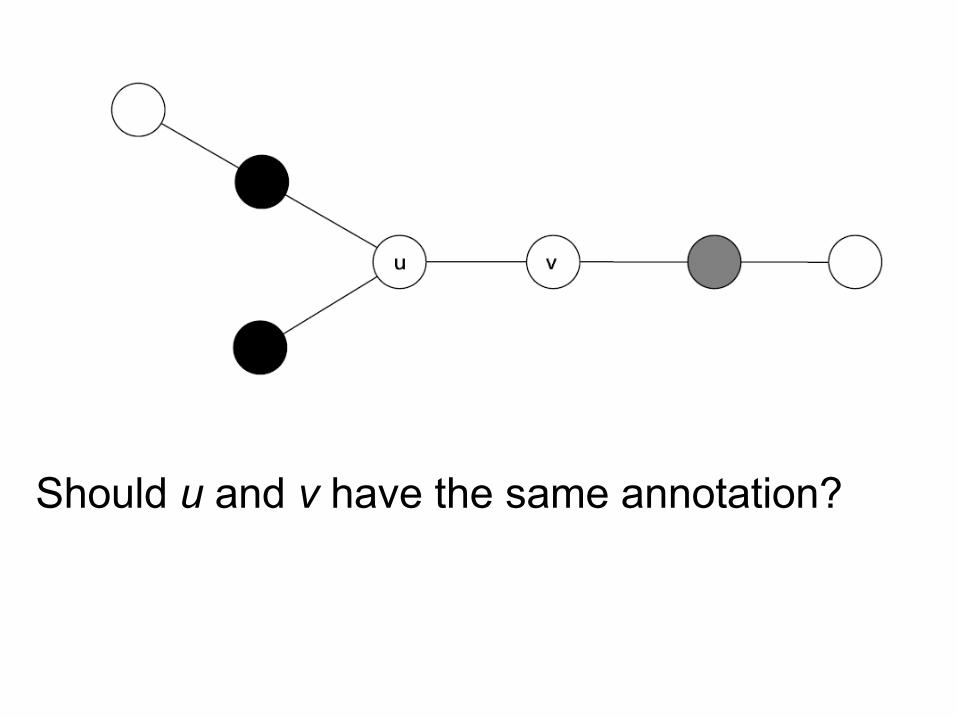
Should u and v have the same annotation?
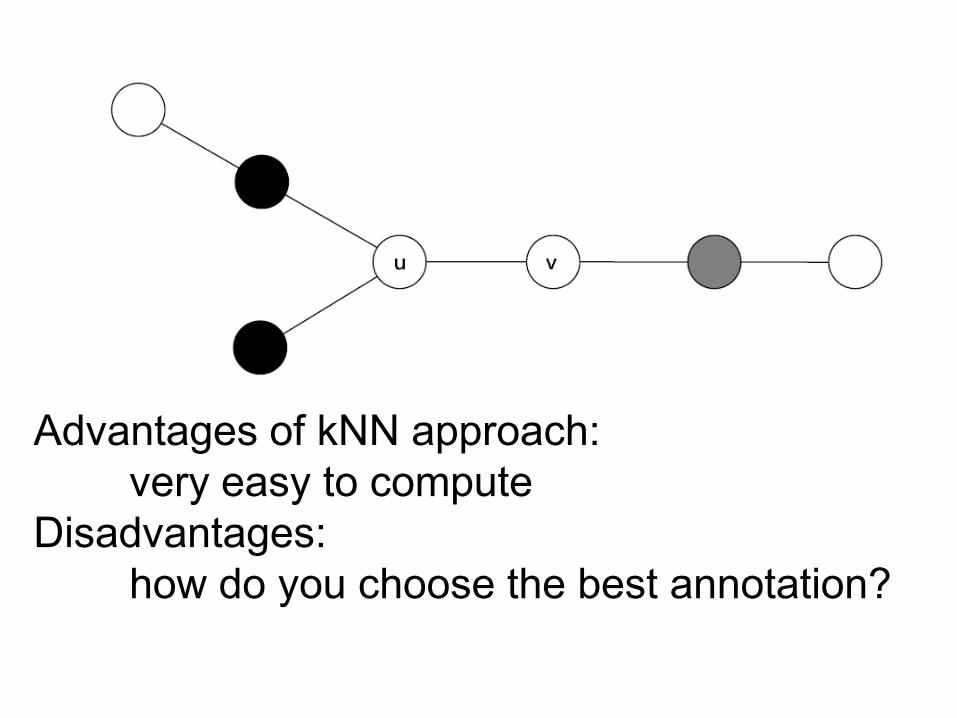
Advantages of kNN approach: very easy to compute
Disadvantages: how do you choose the best annotation?

“Direct” Local search (Karaoz[2004]): • For each annotation:
– Sv=1 if v has the annotation, -1 otherwise – Procedure: for each unassigned node u, set Su
maximize ΣSuSv for all edges (u,v) – iterate until convergence
S=? S=1
S=1
S=1
S=-1
Network-based prediction of protein function Roded Sharan, Igor Ulitsky & Ron Shamir doi:10.1038/msb4100129

B CA
Local search may not find some good solutions. ΣSuSv does not improve if I only change A or C. Changing only B makes the score worse.

A B C
Can’t get there by a local optimization
CA B
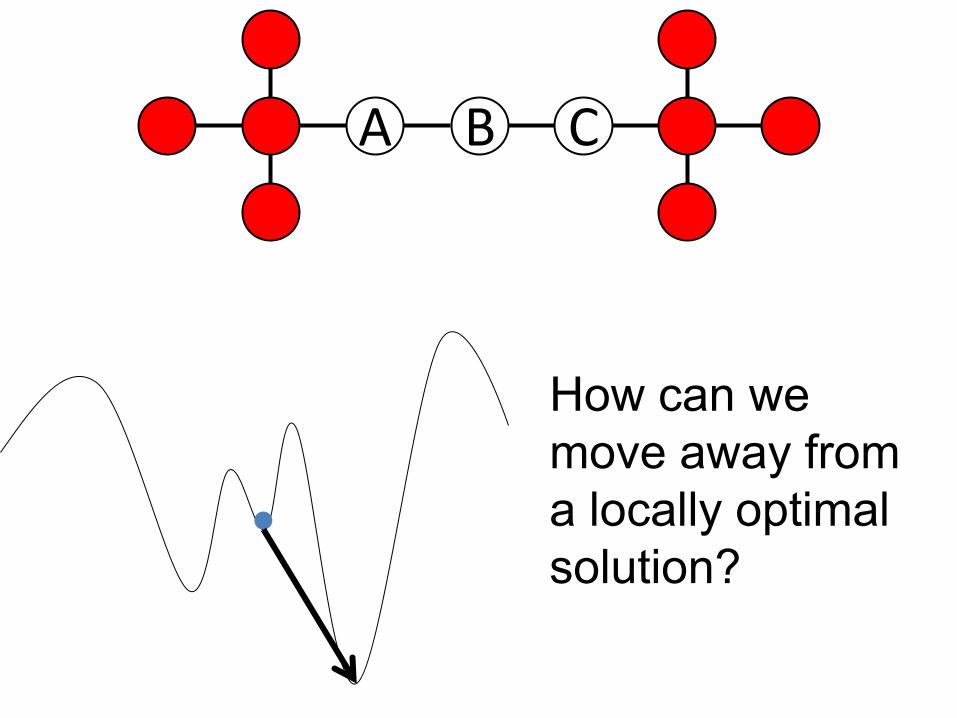
B CA
How can we move away from a locally optimal solution?

B CA
Simulated Annealing Solution: •Initialize T and subgraph Gn with score Sn •Repeat while •Pick a neighboring node v to add to the subgraph •Score new subgraph -> Stest •If Sn<Stest: keep new subgraph •Else keep new subgraph with
P=exp[-(Stest-Sn)/T] •Modify T according to “cooling schedule.”
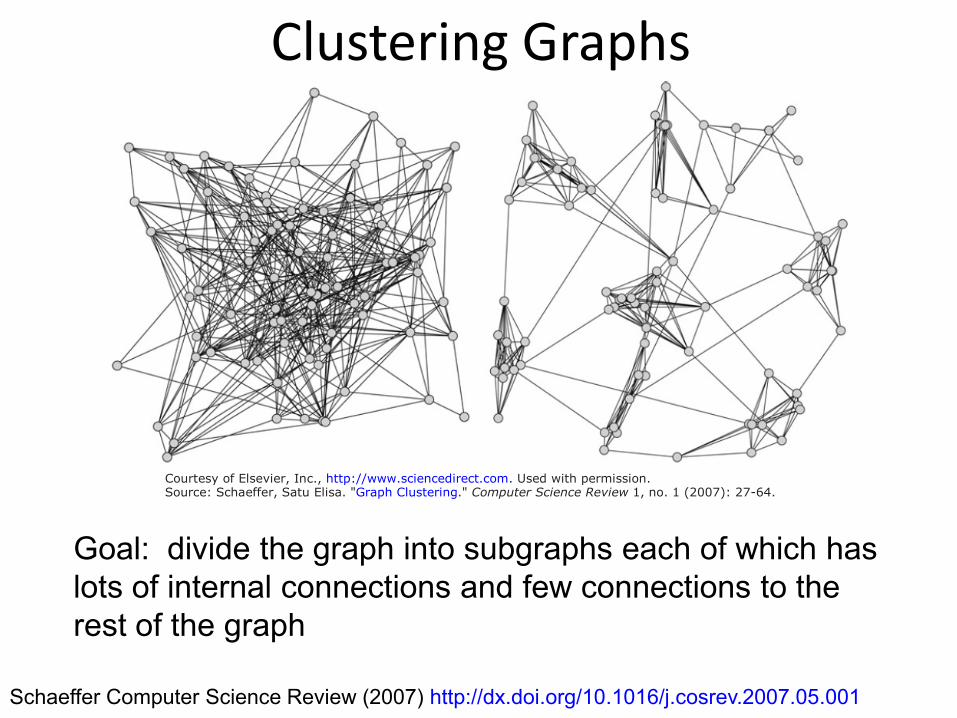
Clustering Graphs
Source: Schaeffer, Satu Elisa. "Graph Clustering." Computer Science Review 1, no. 1 (2007): 27-64.
Goal: divide the graph into subgraphs each of which has lots of internal connections and few connections to the rest of the graph
Schaeffer Computer Science Review (2007) http://dx.doi.org/10.1016/j.cosrev.2007.05.001
Courtesy of Elsevier, Inc., http://www.sciencedirect.com. Used with permission.
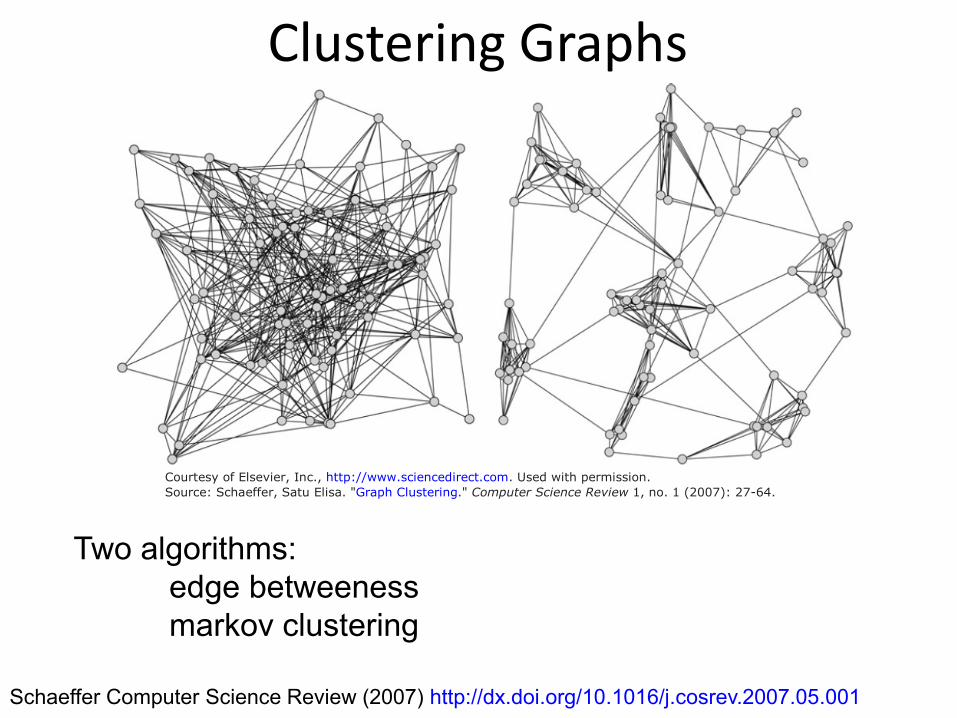
Clustering Graphs
Source: Schaeffer, Satu Elisa. "Graph Clustering." Computer Science Review 1, no. 1 (2007): 27-64.
Two algorithms: edge betweeness markov clustering
Schaeffer Computer Science Review (2007) http://dx.doi.org/10.1016/j.cosrev.2007.05.001
Courtesy of Elsevier, Inc., http://www.sciencedirect.com. Used with permission.

Betweeness clustering
• Edge betweeness = number (or summed weight) of shortest paths between all pairs of vertices that pass through the edge. – Take a weighted average if there are >1 shortest
paths for the same pair of nodes.
Source: Schaeffer, Satu Elisa. "Graph Clustering." Computer Science Review 1, no. 1 (2007): 27-64.Courtesy of Elsevier, Inc., http://www.sciencedirect.com. Used with permission.

Betweeness clustering
• Repeat until max(betweeness) < threshold: – Compute betweeness – Remove edge with highest betweeness
Source: Schaeffer, Satu Elisa. "Graph Clustering." Computer Science Review 1, no. 1 (2007): 27-64.
Courtesy of Elsevier, Inc., http://www.sciencedirect.com. Used with permission.

Markov clustering (MCL)
• Goal: produce sharp partitions • Intuition: A random walk will spend more time
within a cluster than passing between clusters. • Concisely explained here: Enright et al. NAR
Source: Schaeffer, Satu Elisa. "Graph Clustering." Computer Science Review 1, no. 1 (2007): 27-64.
(2002) http://www.ncbi.nlm.nih.gov/pmc/articles/PMC101833
Courtesy of Elsevier, Inc., http://www.sciencedirect.com. Used with permission.

Adjacency Matrix
1
2
4
3 5 1 2 3 4 5
1 0 1 0 0 0 2 1 0 1 0 1 3 0 1 0 1 0 4 0 0 1 0 0 5 0 1 0 0 0

Adjacency Matrix
1
2
3
AN: aij= m iff there exist exactly m paths of length N between i and j.
1 2 3 1 0 1 0 2 1 0 1 3 0 1 0
1 2 3 1 0 1 0 2 1 0 1 3 0 1 0
1 2 3 1 1 0 1 2 0 2 0 3 1 0 1

MCL clustering
• Stochastic Matrix: each element Mij represents a probability of moving from i to j (this is a “Column Stochastic Matrix”).
Source: Schaeffer, Satu Elisa. "Graph Clustering." Computer Science Review 1, no. 1 (2007): 27-64.Courtesy of Elsevier, Inc., http://www.sciencedirect.com. Used with permission.

MCL clustering • Stochastic Matrix: each element Mij
represents a probability of moving from i to j (this is a “Column Stochastic Matrix”). • Therefore, • The probability of moving from i to j in two
steps is given by
.
Source: Schaeffer, Satu Elisa. "Graph Clustering." Computer Science Review 1, no. 1 (2007): 27-64.
Courtesy of Elsevier, Inc., http://www.sciencedirect.com. Used with permission.

• If we keep multiplying the stochastic matrix by itself, we compute the probabilities of longer and longer walks – we expect that the transitions will occur more frequently within a natural cluster than between them.
Source: Schaeffer, Satu Elisa. "Graph Clustering." Computer Science Review 1, no. 1 (2007): 27-64.
Courtesy of Elsevier, Inc., http://www.sciencedirect.com. Used with permission.

• This procedure won’t produce discrete clusters, so the algorithm includes an “inflation” step that exaggerates these effects: raise each element of the matrix to the power r and renormalize.
pA = 0.9 pB = 0.1
.81 pA → = .99 .81+ .01
.01 pB → = .01 .81+ .01
Protein Interaction Networks: Computational Analysis By Aidong Zhang http://books.google.com/books?id=hOzAUrwW-ZoC&lpg=PA141&ots=Vd0TK0fCAR&dq=mcl%20inflation%20operator&pg=PA142#v=onepage&q&f=true

G is a graph add loops to G # needed for a prob. of no transition
set Γ to some value # affects granularity
set M_1 to be the matrix of random walks on G while (change) {
M_2 = M_1 * M_1 # expansion M_1 = Γ(M_2) # inflation change = difference(M_1, M_2) }
set CLUSTERING as the components of M_1
Example
• Identifying protein families • BLAST will identify proteins with shared
domains, but these might not be very similar otherwise (eg: SH2, SH3 domains)
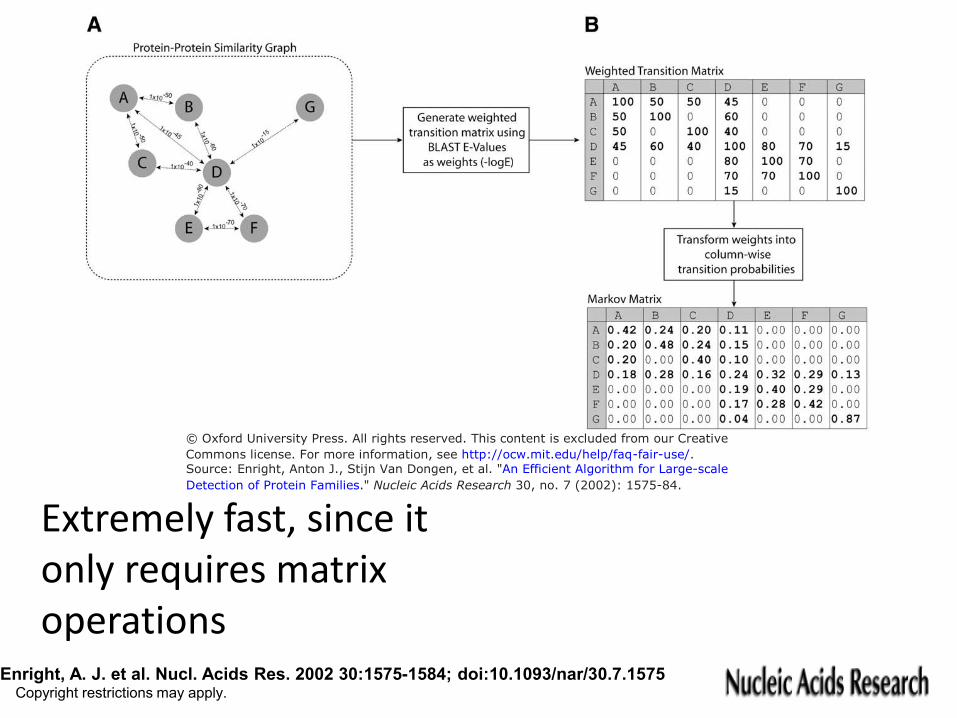
© Oxford University Press. All rights reserved. This content is excluded from our Creative
Commons license. For more information, see http://ocw.mit.edu/help/faq-fair-use/.Source: Enright, Anton J., Stijn Van Dongen, et al. "An Efficient Algorithm for Large-scale
Detection of Protein Families." Nucleic Acids Research 30, no. 7 (2002): 1575-84.
Extremely fast, since it only requires matrix operations
Enright, A. J. et al. Nucl. Acids Res. 2002 30:1575-1584; doi:10.1093/nar/30.7.1575 Copyright restrictions may apply.

InterPro Sequences
Compute Pairwise Similarity
MCL Clustering
No. of InterPro ID families Domain description IPR001064 141 Crystallin
RNA-binding region RNP-1 (RNA IPR000504 110 recognition motif)
Immunoglobulin and major histocompatibility complex
IPR003006 107 domain TonB-dependent receptor
IPR000531 97 protein Myc-type, helix–loop–helix
IPR003015 96 dimerisation domain IPR001680 76 G-protein β WD-40 repeats IPR000561 73 EGF-like domain
Eukaryotic thiol (cysteine) IPR000169 72 proteases active sites IPR001777 42 Fibronectin type III domain
Distinct clusters identified by MCL can still share a common domain

Example
• Clustering expression data for 61 mouse tissues • Nodes = genes • Edges = Pearson correlation coefficient >
threshold • Network gives an overview of connections not
obvious from hierarchical clustering

Nodes=genes Edges=pearson correlation of expression in mouse tissues Clustered by MCL
Freeman, et al.(2007) PLoS Comput Biol 3(10): e206. doi:10.1371/journ al.pcbi.0030206
Courtesy of Freeman et al. License: CC-BY.Source: Freeman, Tom C., Leon Goldovsky, et al. "Construction, Visualisation, and Clustering of Transcription
Networks from Microarray Expression Data." PLoS Computational Biology 3, no. 10 (2007): e206.
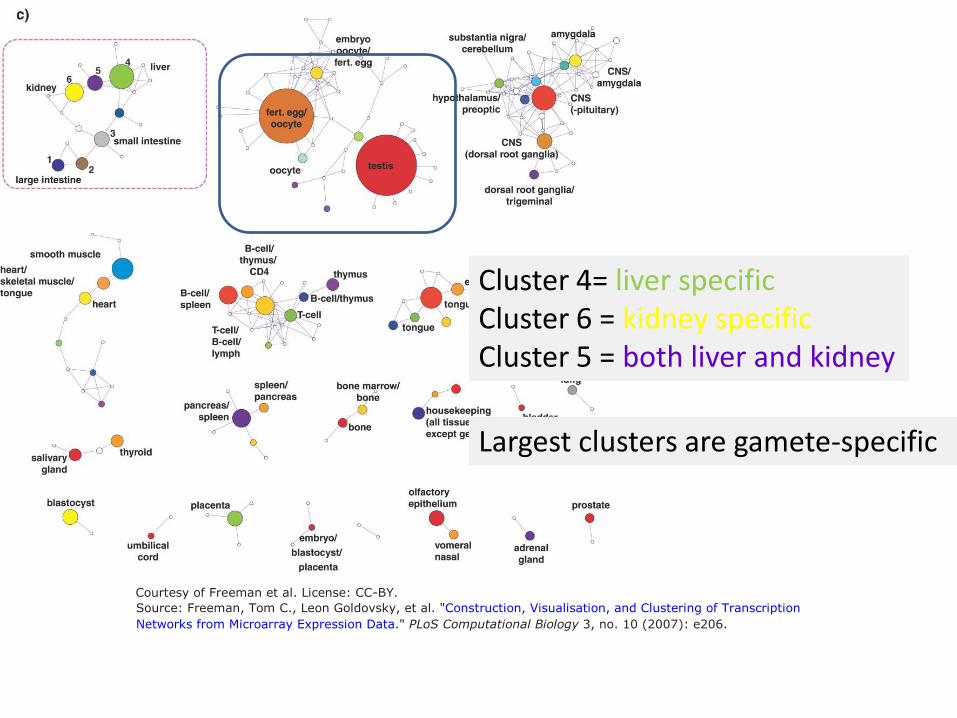
Largest clusters are gamete-specific
Cluster 4= liver specific Cluster 6 = kidney specific Cluster 5 = both liver and kidney
Courtesy of Freeman et al. License: CC-BY.
Source: Freeman, Tom C., Leon Goldovsky, et al. "Construction, Visualisation, and Clustering of Transcription
Networks from Microarray Expression Data." PLoS Computational Biology 3, no. 10 (2007): e206.
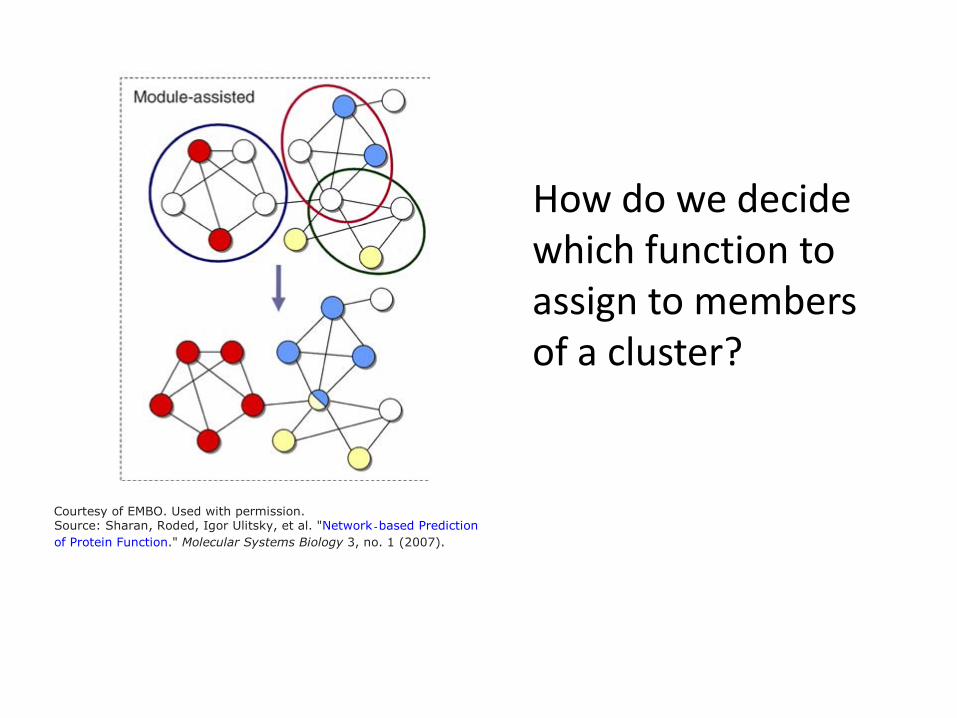
How do we decide which function to assign to members of a cluster?
Courtesy of EMBO. Used with permission.Source: Sharan, Roded, Igor Ulitsky, et al. "Network‐based Prediction
of Protein Function." Molecular Systems Biology 3, no. 1 (2007).

How do we decide which function to assign to members of a cluster? •Consensus •Significant by
Courtesy of EMBO. Used with permission.Source: Sharan, Roded, Igor Ulitsky, et al. "Network‐based Prediction hypergeometric
of Protein Function." Molecular Systems Biology 3, no. 1 (2007).
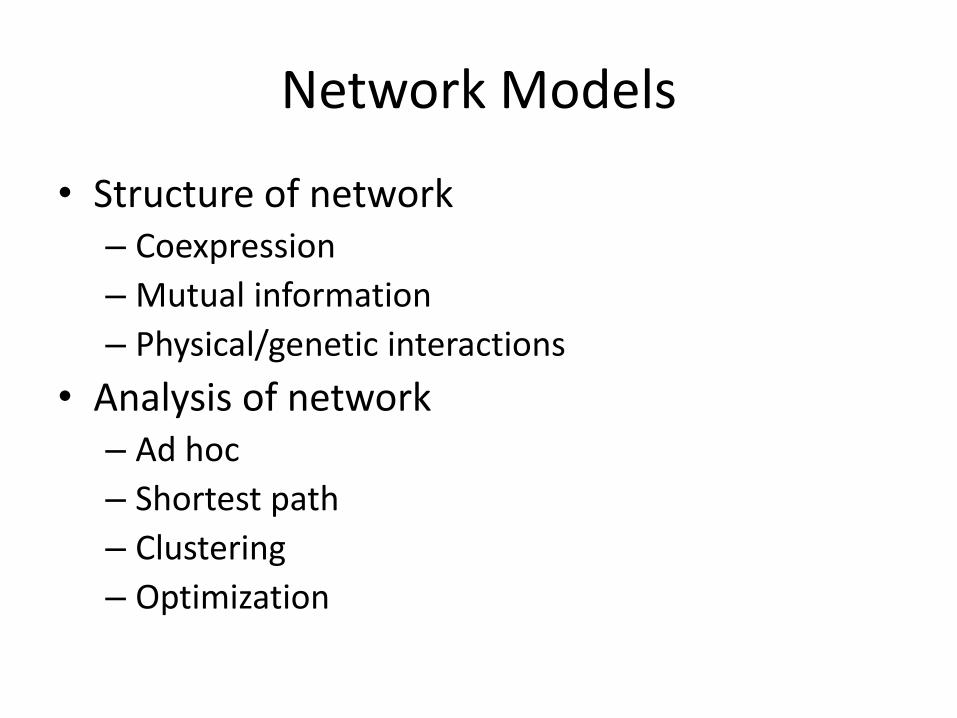
Network Models
• Structure of network – Coexpression – Mutual information – Physical/genetic interactions
• Analysis of network – Ad hoc – Shortest path – Clustering – Optimization

B CA
How do we find modules associated with specific data? Example: paint a PPI network with expression data. Try to find connected components that have overall high expression. (Example: Ideker et al. (2002) Bioinformatics).

B CA
Active subgraph problem:
Can reveal hidden components of a biological response.

A B C
Where did we see something similar?

• The annotation problem attempts to label the entire graph. • The active subnet
problem searches for a part of the graph that is enriched in a label.
B CA
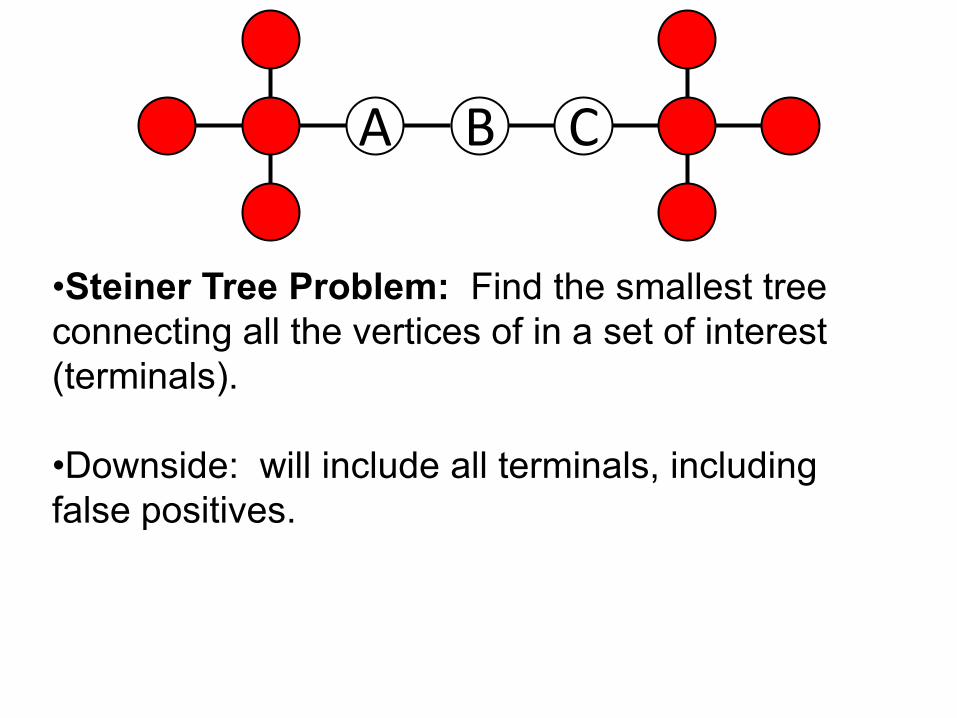
•Steiner Tree Problem: Find the smallest tree connecting all the vertices of in a set of interest (terminals).
•Downside: will include all terminals, including false positives.

Interactome Experimental hits
Naïve methods
+
© source unknown. All rights reserved. This
content is excluded from our Creative Commons
license. For more information,
see http://ocw.mit.edu/help/faq-fair-use/.
• Not all hits are real • Not all edges are real • Not all edges are known
© source unknown. All rights reserved. This content is excluded from our Creative
Commons license. For more information, see http://ocw.mit.edu/help/faq-fair-use/.
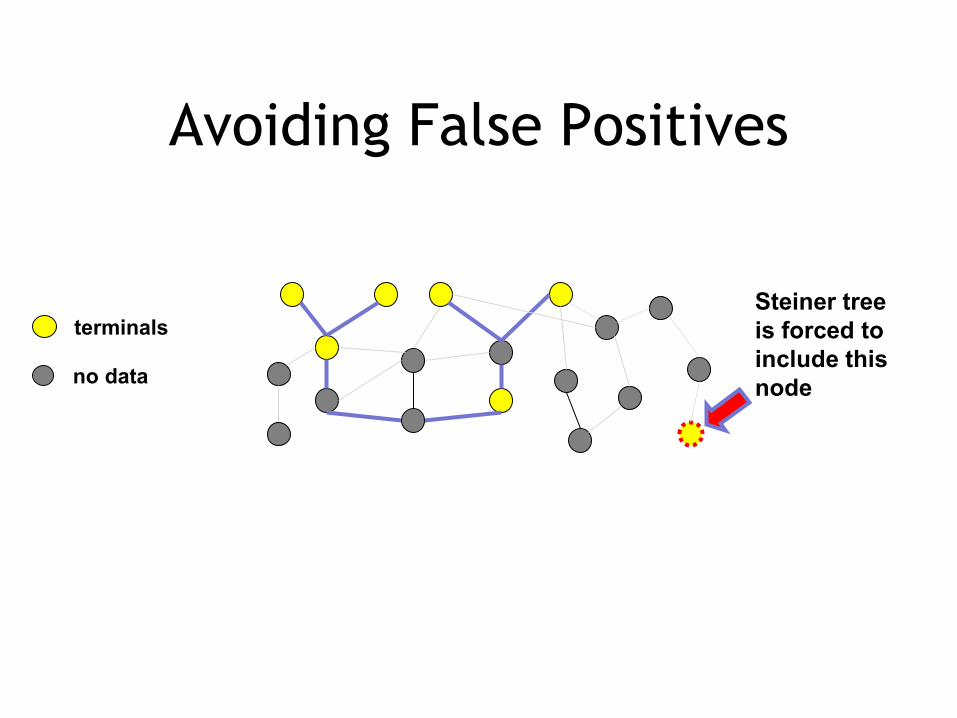
Avoiding False Positives
is forced to include this
Steiner tree terminals
no data node

Network Models
• Structure of network – Coexpression – Mutual information – Physical/genetic interactions
• Analysis of network – Ad hoc – Shortest path – Clustering – Optimization

Prize Collecting Steiner Tree • Collect a prize for each data point included
No prize No prize
phosphoprotein target gene no data TF Courtesy of Huang et al. Used with permission.Source: Huang, Shao-shan Carol, David C. Clarke, et al. "Linking Proteomic and Transcriptional
Data through the Interactome and Epigenome Reveals a Map of Oncogene-induced Signaling."PLoS Computational Biology 9, no. 2 (2013): e1002887.

Don’t Include All Data • Pay a penalty for excluding nodes
Courtesy of Huang et al. Used with permission.Source: Huang, Shao-shan Carol, David C. Clarke, et al. "Linking Proteomic and Transcriptional
Data through the Interactome and Epigenome Reveals a Map of Oncogene-induced Signaling."PLoS Computational Biology 9, no. 2 (2013): e1002887.
No penalty proportional to absolute value of log fold change
phosphoprotein TF no data target gene
penalty( cost( ) not in in
v) ev T e T
β +∑ ∑

Avoid Unlikely Interactions • Pay a cost for including edges based on
probability
phosphoprotein TF target gene no data Courtesy of Huang et al. Used with permission.Source: Huang, Shao-shan Carol, David C. Clarke, et al. "Linking Proteomic and Transcriptional
Data through the Interactome and Epigenome Reveals a Map of Oncogene-induced Signaling."PLoS Computational Biology 9, no. 2 (2013): e1002887.
∑ β penalty( v) v not in T
+ ∑ cost( ) e e in T

Balanced Objective Function
phosphoprotein TF no data target gene
Does the node penalty justify the edge costs?
Courtesy of Huang et al. Used with permission.Source: Huang, Shao-shan Carol, David C. Clarke, et al. "Linking Proteomic and Transcriptional
Data through the Interactome and Epigenome Reveals a Map of Oncogene-induced Signaling."PLoS Computational Biology 9, no. 2 (2013): e1002887.
∑ penalty( v) + ∑ cost( )β e v not in T e in T

Optimization methods: •Biazzo I, Braunstein A, Zecchina R.
Phys Rev E Stat Nonlin Soft Matter Phys. 2012 Aug;86(2 Pt 2):026706. •I. Ljubic, R. Weiskircher, U. Pferschy, G. Klau, P. Mutzel, and M. Fischetti:
Mathematical Programming, Series B, 105(2-3):427-449, 2006.
phosphoprotein TF no data target gene
Does the node penalty justify the edge costs?
Courtesy of Huang et al. Used with permission.Source: Huang, Shao-shan Carol, David C. Clarke, et al. "Linking Proteomic and Transcriptional
Data through the Interactome and Epigenome Reveals a Map of Oncogene-induced Signaling."PLoS Computational Biology 9, no. 2 (2013): e1002887.
∑ penalty( v) + ∑ cost( )β e v not in T e in T

Naïve Methods
• >2,500 nearest neighbors of phosphoproteins • >4,500 nearest
neighbors of phosphoproteins +transcription factors
© source unknown. All rights reserved. This content is excluded from our Creative
Commons license. For more information, see http://ocw.mit.edu/help/faq-fair-use/.
Linking Proteomic and Transcriptional Data through the Interactome and Epigenome Reveals a Map of Oncogene-induced Signaling PLoS Comput Biol 9(2): e1002887. doi:10.1371/journal.pcbi.1002887

Courtesy of Huang et al. Used with permission.Source: Huang, Shao-shan Carol, David C. Clarke, et al. "Linking Proteomic and Transcriptional
Data through the Interactome and Epigenome Reveals a Map of Oncogene-induced Signaling."PLoS Computational Biology 9, no. 2 (2013): e1002887.
Linking Proteomic and Transcriptional Data through the Interactome and Epigenome Reveals a Map of Oncogene-induced Signaling PLoS Comput Biol 9(2): e1002887. doi:10.1371/journal.pcbi.1002887

Can we find drug targets? Rank every node by weighted distance to all High rank targets prize-collecting Steiner tree nodes
Control targets
Stei
ner T
ree
Courtesy of Huang et al. Used with permission.Source: Huang, Shao-shan Carol, David C. Clarke, et al. "Linking Proteomic and Transcriptional
Data through the Interactome and Epigenome Reveals a Map of Oncogene-induced Signaling."PLoS Computational Biology 9, no. 2 (2013): e1002887.
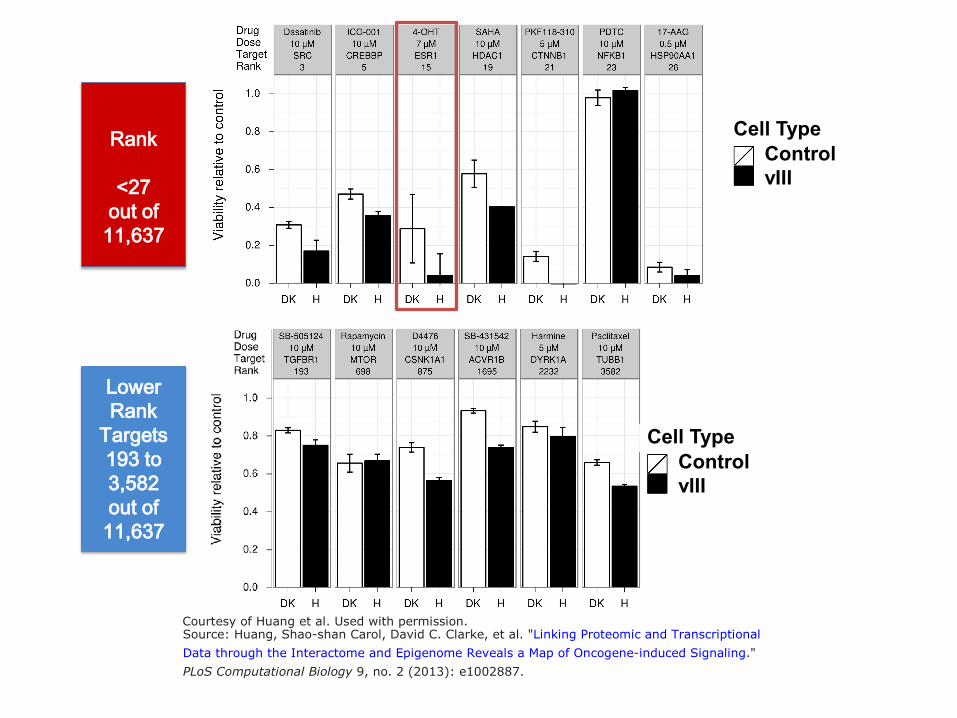
Highest
Targets
Rank
<27 out of
11,637
Control vIII
Cell Type
Lower Rank
Targets 193 to 3,582 out of
11,637
Control vIII
Cell Type
Courtesy of Huang et al. Used with permission.Source: Huang, Shao-shan Carol, David C. Clarke, et al. "Linking Proteomic and Transcriptional
Data through the Interactome and Epigenome Reveals a Map of Oncogene-induced Signaling."PLoS Computational Biology 9, no. 2 (2013): e1002887.

Data Integration
ApproachmRNA levels do not predict protein levels
1,000 fold range of protein concentrations
mRNA expression levels © Royal Society of Chemistry. All rights reserved. This content is excluded from our Creative
Commons license. For more information, see http://ocw.mit.edu/help/faq-fair-use/.Source: de Sousa Abreu, Raquel, Luiz O. Penalva, et al. "Global Signatures of Protein and
mRNA Expression Levels." Molecular Biosystems 5, no. 12 (2009): 1512-26.
(arbitrary units, log-scale base 10) Raquel de Sousa Abreu, Luiz Penalva, Edward Marcotte and Christine Vogel, Mol. BioSyst., 2009 DOI: 10.1039/b908315d
Prot
ein
expr
essi
on le
vels
( mol
ecul
es/c
ell,
log-
scal
e ba
se 1
0)
Source: Ning, Kang, Damian Fermin, et al. "Comparative Analysis of Different Label-free Mass
Spectrometry Based Protein Abundance Estimates and Their Correlation with RNA-Seq Gene
Expression Data." Journal of Proteome Research 11, no. 4 (2012): 2261-71.
Kang Ning, Damian Fermin, and Alexey I. Nesvizhskii J Proteome Res. 2012 April 6; 11(4): 2261–2271.

L18 Chromatin and DNase-seq Analysis
Mutant
Wild-type
Sequence Analysis

Move upstream of transcription
Network integration
Epigenomic Data & Sequence
Analysis mRNA
DNA- binding proteins
Interactome

‘Omic data don’t agree
Toxic Compound, Mutation, Environmental Change

Perturbation Differentially expressed
genes
Genetic hits
Number of overlapping
genes Growth arrest (Hydroxyurea) 59 86 0
DNA damage (MMS) 198 1448 43 Protein biosynthesis block (Cycloheximide) 20 164 0
ER stress (Tunicamycin) 200 127 5
ATP synthesis block (Arsenic) 828 50 9
Fatty acid metabolism (oleate) 269 103 9
Gene inactivation (24 datasets, median shown)
27 130 0
Genetic vs. Expression Data
Bridging high-throughput genetic and transcriptional data reveals cellular responses to alpha-synuclein toxicity Nature Genetics Published online: 22 February 2009

For 156 perturbations:
Genetic Data Enriched for: •Transcriptional regulation •Signal transduction
Expression Data Enriched for: Metabolic Processes e.g., organic acid metabolic process, oxidoreducatse activities
Bridging high-throughput genetic and transcriptional data reveals cellular responses to alpha-synuclein toxicity Nature Genetics Published online: 22 February 2009

DNA Damage
DNA repair Cell cycle arrest
Sliding clamp checkpoint DNA Damage
Bridging high-throughput genetic and transcriptional data reveals cellular responses to alpha-synuclein toxicity Nature Genetics Published online: 22 February 2009

DNA Damage
DNA repair Cell cycle arrest
DNA Damage
RAD53 = CHK2
MEC1 = ATM
Bridging high-throughput genetic and transcriptional data reveals cellular responses to alpha-synuclein toxicity Nature Genetics Published online: 22 February 2009

TF
Interactome
ChIP-chip & Sequence Analysis
Bridging high-throughput genetic and transcriptional data reveals cellular responses to alpha-synuclein toxicity Nature Genetics Published online: 22 February 2009
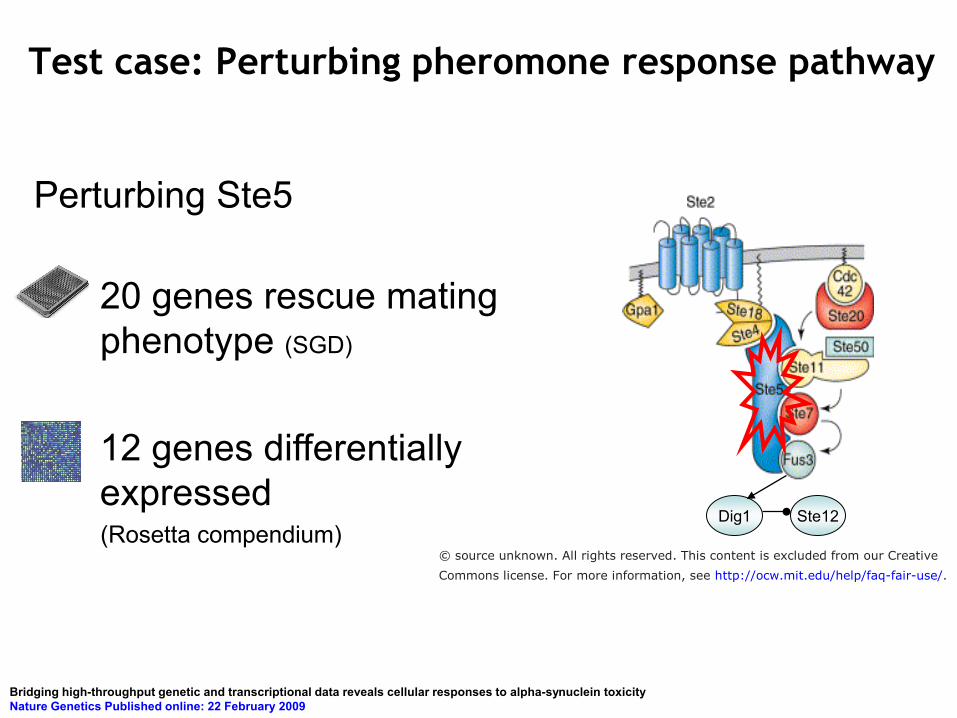
Test case: Perturbing pheromone response pathway
Ste12 Dig1
Perturbing Ste5
20 genes rescue mating phenotype (SGD)
12 genes differentially expressed (Rosetta compendium)
© source unknown. All rights reserved. This content is excluded from our Creative
Commons license. For more information, see http://ocw.mit.edu/help/faq-fair-use/.
Bridging high-throughput genetic and transcriptional data reveals cellular responses to alpha-synuclein toxicity Nature Genetics Published online: 22 February 2009

Δste5: Naïve approach Paths limited to length 3
Genetic Data
© source unknown. All rights reserved. This content is excluded from our Creative
Commons license. For more information, see http://ocw.mit.edu/help/faq-fair-use/.
Expression Data 193 nodes, 778 edges
Bridging high-throughput genetic and transcriptional data reveals cellular responses to alpha-synuclein toxicity Nature Genetics Published online: 22 February 2009

Maximize the connectivity via reliable paths
p=0.1
p=0.9
Goal: find paths that maximize product of Pij
Assign probabilities using a Bayesian approach based on reliability of underlying data type:
Myers, C.L. et al. Genome Biology (2005).
Jansen, R. et al. Science (2003). Bridging high-throughput genetic and transcriptional data reveals cellular responses to alpha-synuclein toxicity Nature Genetics Published online: 22 February 2009

Maximize the connectivity via reliable paths
Source Minimum cost flow problem
Flow
p=0.1
p=0.9
Low High probability probability
FLOW
Sink
Bridging high-throughput genetic and transcriptional data reveals cellular responses to alpha-synuclein toxicity Nature Genetics Published online: 22 February 2009

Maximize the connectivity via reliable paths
Flow
Source Minimum cost flow problem
p=0.1
p=0.1
p=0.9
Sink
Low High probability probability
FLOW
Proteins ranked by their incoming flow:
Less More important important

Maximize the connectivity via reliable paths
Source
FLOW
p=0.1
p=0.1
p=0.9
Sink
Minimum cost flow problem Maximize flow: source to sink
Minimize cost (eij) = fij *(-log Pij)
min (∑cost(eij) –γ*∑ fSj)
fij = flow through eij
cij = capacity of eij= 1 for all eij
Proteins ranked by their incoming flow:
Less More important important

Test case: Perturbing pheromone response pathway
Ste12 Dig1
Perturbing Ste5
20 genes rescue mating phenotype (SGD)
12 genes differentially expressed (Rosetta compendium)
© source unknown. All rights reserved. This content is excluded from our Creative
Commons license. For more information, see http://ocw.mit.edu/help/faq-fair-use/.
Bridging high-throughput genetic and transcriptional data reveals cellular responses to alpha-synuclein toxicity Nature Genetics Published online: 22 February 2009

Enriched for pheromone response p<10-18
Genetic Data
Expression Data
SKO1 SIN4 SSN8
TUP1 TEC1 DIG1
KSS1 FUS3
CLN2 CLB2 CDC28
XBP1 SWI6
GPA1
STE12
FUS1+ STE6STE2TEC1FUS3GPA1KAR4SST2AGA1YLR 042C
IQG1 RPD3
CMD1
SIN3 SWI1 HAP5 SDS3
CLN3 STE20 FAR1 CDC25 STE7 STE11 STE4 STE18 STE2 HOG1 AKR1 CDC36 CDC39 HSP82
STE5
49 nodes, 96 edges Predicted genes Importance
Network Models
• Structure of network – Coexpression – Mutual information – Physical/genetic interactions
• Analysis of network – Ad hoc – Shortest path – Clustering – Optimization

Physical Relationships
Statistical Relationships
Known Unknown Components Components
Differential equations Interactome
Models
Boolean logic, decision trees
Bayesian networks
mutual information
regression, clustering

MIT OpenCourseWarehttp://ocw.mit.edu
7.91J / 20.490J / 20.390J / 7.36J / 6.802J / 6.874J / HST.506J Foundations of Computational and Systems BiologySpring 2014
For information about citing these materials or our Terms of Use, visit: http://ocw.mit.edu/terms.
Related Documents