Lecture 13 – Monday Exam 1 – Today’s material will be on Exam 2 – Intro to enzymes – Next Friday 3PM-Bonus seminar for Dr. Howard Salis from Penn State University

Lecture 13 –Monday Exam 1 –Today’s material will be on Exam 2 –Intro to enzymes –Next Friday 3PM-Bonus seminar for Dr. Howard Salis from Penn State University.
Dec 31, 2015
Welcome message from author
This document is posted to help you gain knowledge. Please leave a comment to let me know what you think about it! Share it to your friends and learn new things together.
Transcript

Lecture 13
– Monday Exam 1– Today’s material will be on Exam 2– Intro to enzymes– Next Friday 3PM-Bonus seminar for Dr.
Howard Salis from Penn State University
Enzymes As Biological Catalysts
• Late 1700s, Early 1800s - digestion of meat protein by gastric fluids.
• Starch degraded by animal saliva, plant extracts.
•mid 1800s - Louis Pasteur defined term “ferments” to describe agents in yeast cells that converted sugars into ethanol (fermentation). -Only believed live cells were capable of fermentation.
• 1897 - Eduard and Hans Büchner used extracts of yeast to ferment sugar.
• 1926 - James Sumner (Cornell Univ.) isolated and crystallized urease enzyme from jack bean plant…
• Current search of Protein Data Bank (PDB) Sept 11, 2004 indicates 27112 protein structures http://www.rcsb.org/pdb/
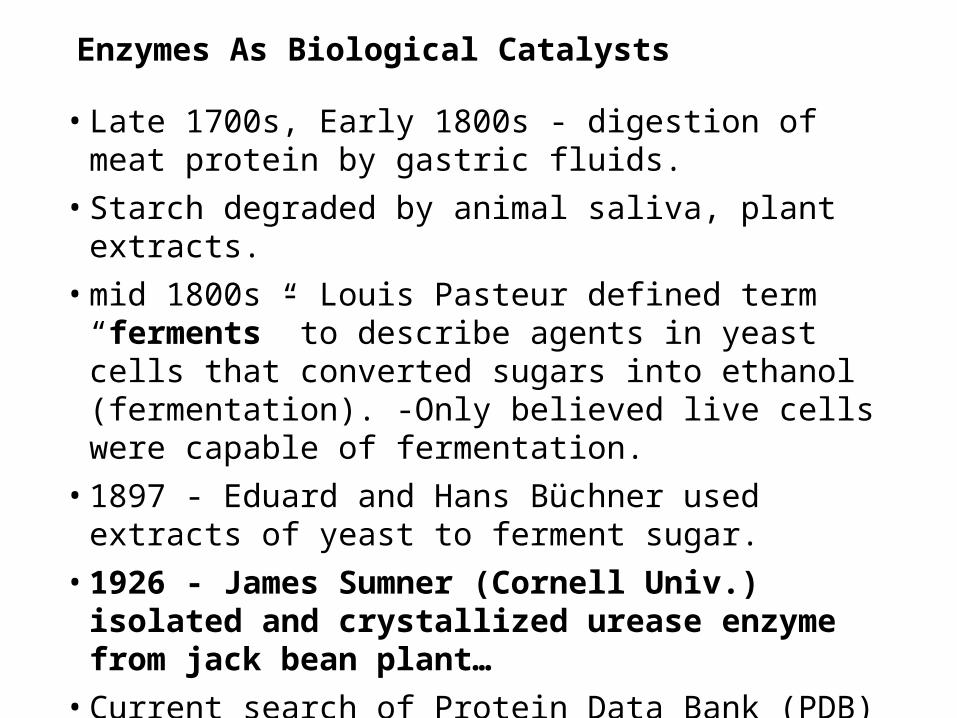
Enzymes• Enzymes are classified and named according to the nature of the
chemical reactions they catalyze.• Divided into 6 classes by the International Union of Biochemistry
and Molecular Biology (IUBMB).• The six classes of enzymes:
1. Oxidoreductases - oxidation-reduction reactions2. Transferases - Transfer of functional groups3. Hydrolases - Hydrolysis reactions4. Lyases - group elimination to form double bonds5. Isomerases - Isomerizations (bond rearrangements)6. Ligases - bond formation coupled with ATP hydrolysis

Enzymes• All enzymes are assigned a number (EC number) which defines
exactly which reaction is catalyzed by the enzyme.• Example trypsin is EC 3.4.21.4
EC 3.4.21.4 3 describes the enzyme class (hydrolase)-hydrolysis reaction
4 is for the subclass (acts on peptide bonds, so it is a peptide hydrolase)
21 denotes its sub-subclass as a serine peptidase
4 because it is the 4th entry in this subclass
• Enzyme Nomenclature Database - http://expasy.org/enzyme
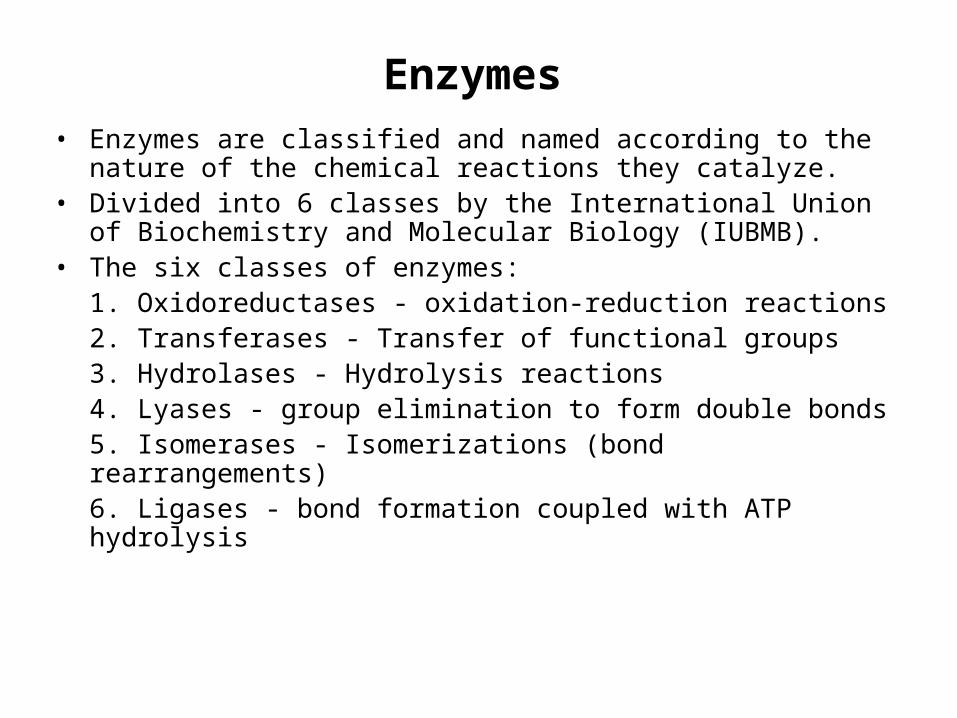
Enzymes• The 6 enzyme classes can be illustrated by the general reactions catalyzed
1. Oxidoreductases: A- + B A + B-
2. Transferases: A-B + C A + B-C
3. Hydrolase: A-B + H2O A-H + B-OH
4. Lyases: A-B A=B + X-Y
5. Isomerases: A-B A-B
6. Ligases (synthases)A + B A-B
X Y
X Y XY
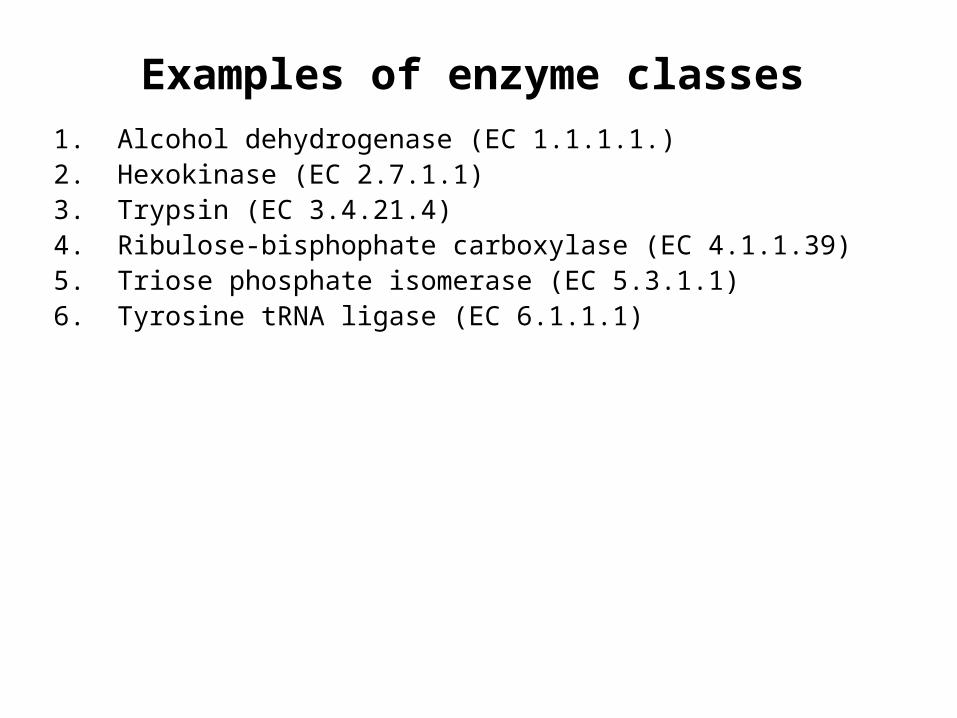
Examples of enzyme classes1. Alcohol dehydrogenase (EC 1.1.1.1.)2. Hexokinase (EC 2.7.1.1)3. Trypsin (EC 3.4.21.4)4. Ribulose-bisphophate carboxylase (EC 4.1.1.39)5. Triose phosphate isomerase (EC 5.3.1.1)6. Tyrosine tRNA ligase (EC 6.1.1.1)
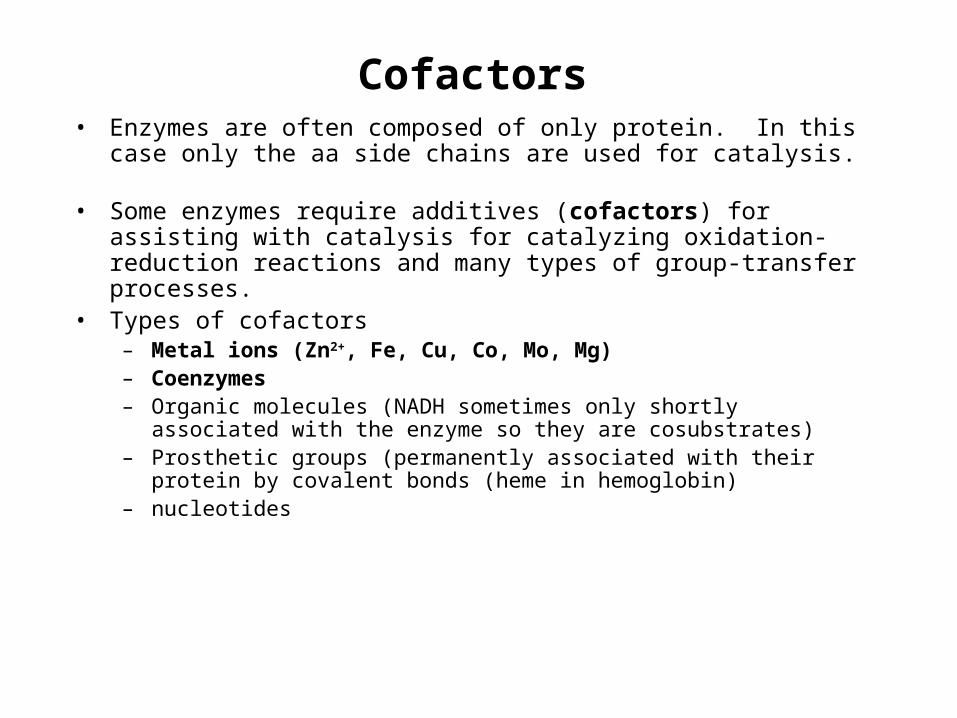
Cofactors• Enzymes are often composed of only protein. In this case only the aa
side chains are used for catalysis. • Some enzymes require additives (cofactors) for assisting with catalysis
for catalyzing oxidation-reduction reactions and many types of group-transfer processes.
• Types of cofactors– Metal ions (Zn2+, Fe, Cu, Co, Mo, Mg)– Coenzymes – Organic molecules (NADH sometimes only shortly associated with the
enzyme so they are cosubstrates)– Prosthetic groups (permanently associated with their protein by covalent
bonds (heme in hemoglobin)– nucleotides
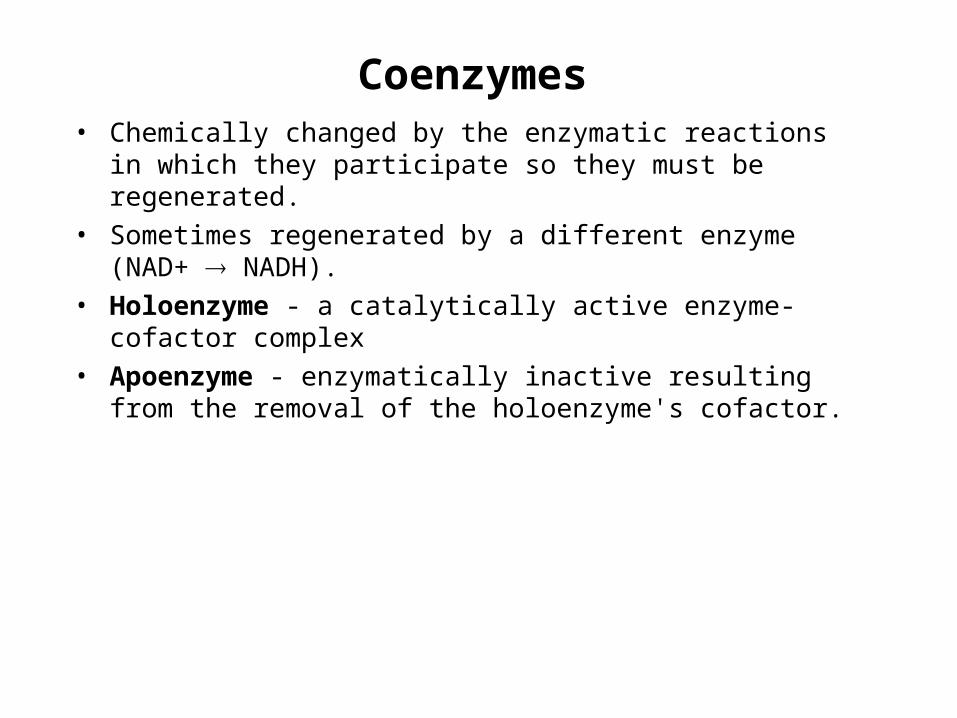
Coenzymes• Chemically changed by the enzymatic reactions in which they
participate so they must be regenerated.• Sometimes regenerated by a different enzyme (NAD+
NADH).• Holoenzyme - a catalytically active enzyme-cofactor complex• Apoenzyme - enzymatically inactive resulting from the removal
of the holoenzyme's cofactor.
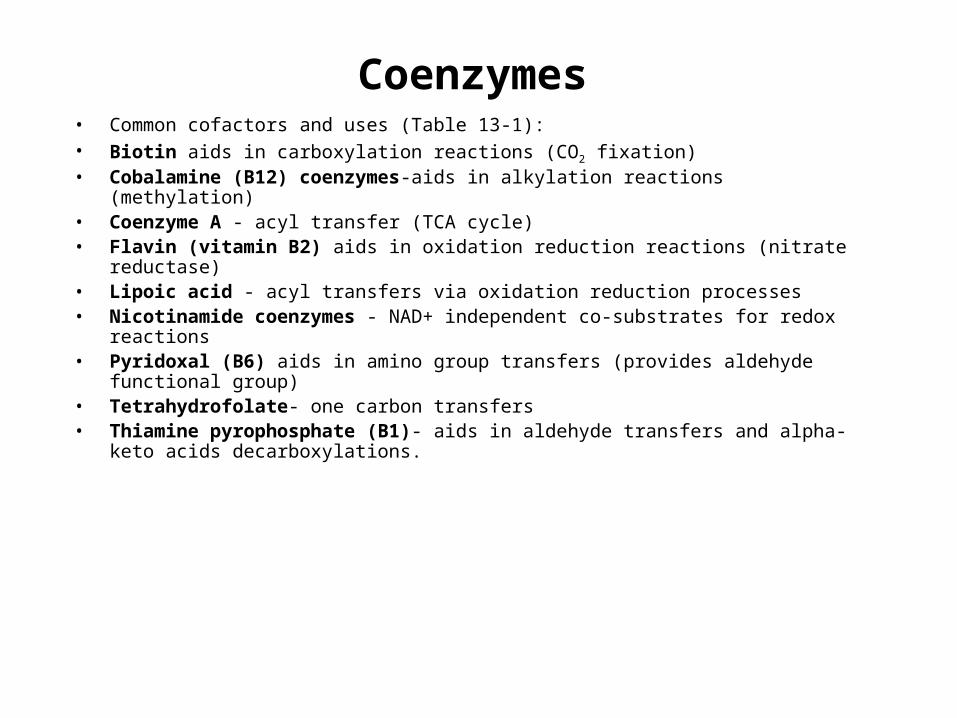
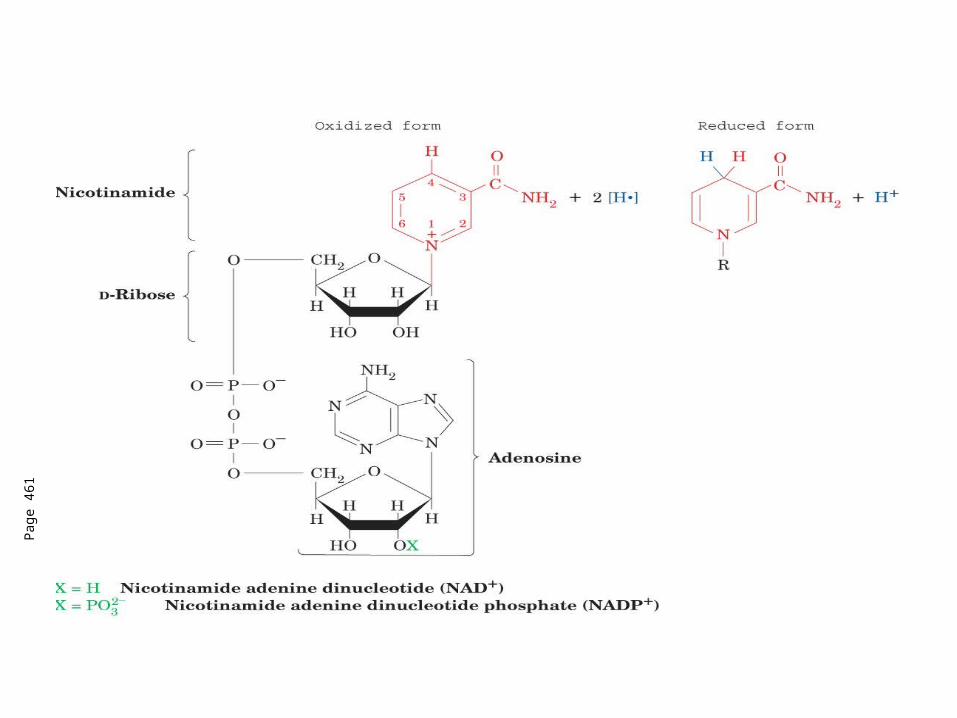
Coenzymes• Common cofactors and uses (Table 13-1):• Biotin aids in carboxylation reactions (CO2 fixation)• Cobalamine (B12) coenzymes-aids in alkylation reactions (methylation)• Coenzyme A - acyl transfer (TCA cycle)• Flavin (vitamin B2) aids in oxidation reduction reactions (nitrate reductase)• Lipoic acid - acyl transfers via oxidation reduction processes• Nicotinamide coenzymes - NAD+ independent co-substrates for redox reactions• Pyridoxal (B6) aids in amino group transfers (provides aldehyde functional group)• Tetrahydrofolate- one carbon transfers• Thiamine pyrophosphate (B1)- aids in aldehyde transfers and alpha-keto acids
decarboxylations.

Coenzymes

Summary and review from last lecture
• Supersecondary structures: be able to identify them.• Know the differences and be able to give examples of
primary, secondary, tertiary, and quaternary structure.• 6 classes of enzymes.• Types of coenzymes and what types of reactions they
assist in.

Progression of enzyme-substrate interaction models
1. 1890 - Emil Fisher model of ES complex: “lock and key”
• Enzyme is rigid, inflexible.
• Only recognizes one substrate.
2. 1958 - Daniel Koshland: “induced fit model”
• Assumes continuous changes in enzyme structure due to substrate binding.
• Verified by X-ray crystallographic experiments.
3. Present day, transition-state analog model
4. Active site both recognizes and orients substrate to activate it for reaction.
5. Bound, distorted substrate takes on characteristics of transition state.
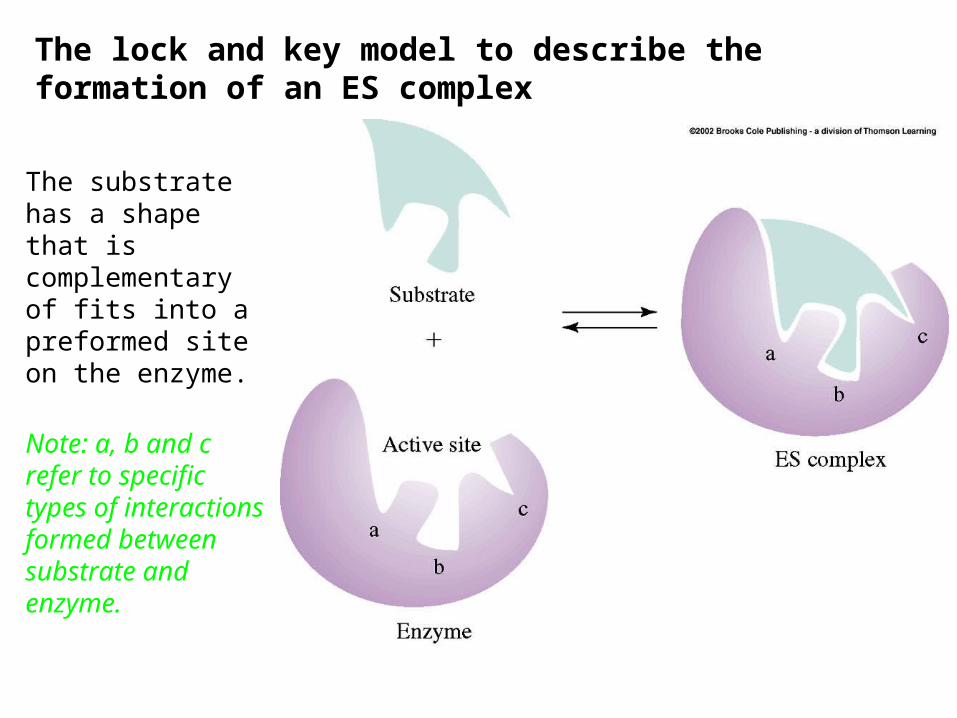
The substrate has a shape that is complementary of fits into a preformed site on the enzyme.
Note: a, b and c refer to specific types of interactions formed between substrate and enzyme.
The lock and key model to describe the formation of an ES complex
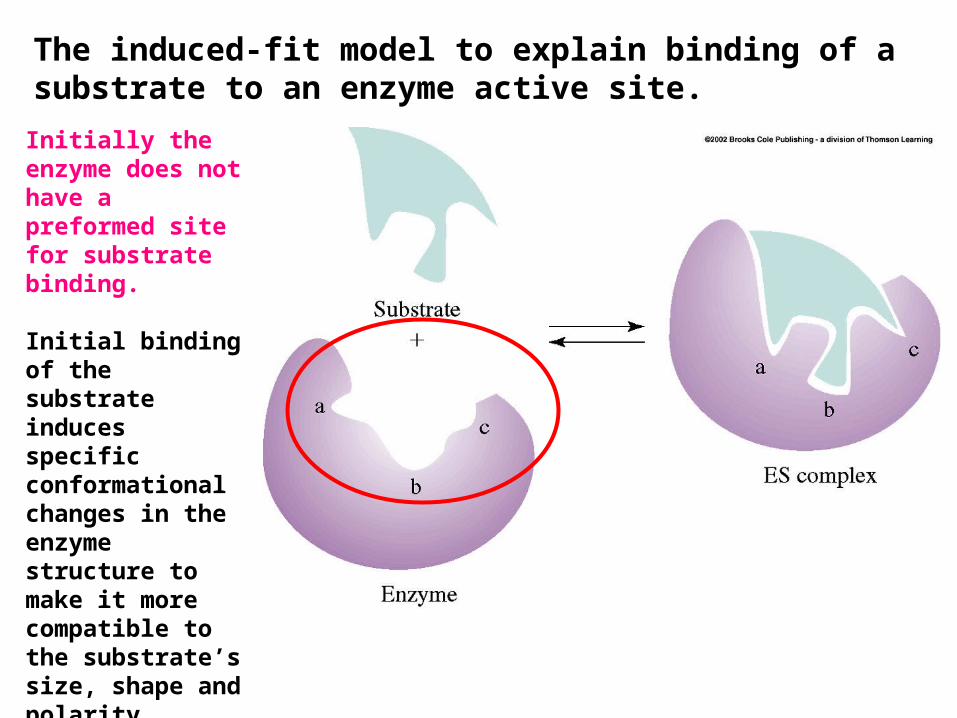
The induced-fit model to explain binding of a substrate to an enzyme active site.
Initially the enzyme does not have a preformed site for substrate binding.
Initial binding of the substrate induces specific conformational changes in the enzyme structure to make it more compatible to the substrate’s size, shape and polarity.
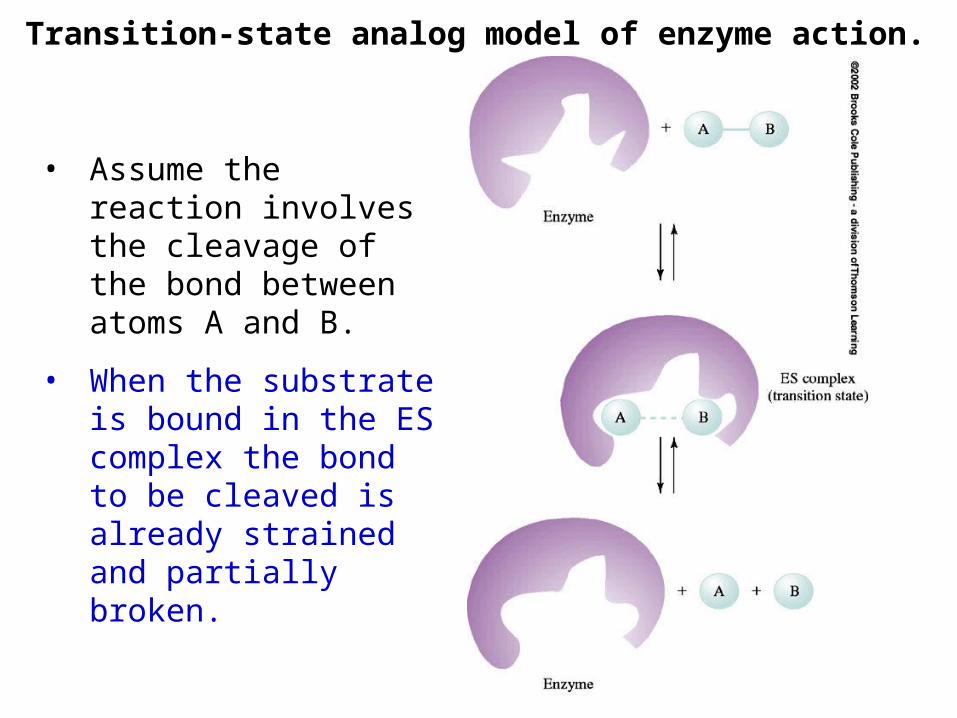
Transition-state analog model of enzyme action.
• Assume the reaction involves the cleavage of the bond between atoms A and B.
• When the substrate is bound in the ES complex the bond to be cleaved is already strained and partially broken.
Enzyme-substrate interaction models
1. Understand the differences and similarities between “lock and key”, “induced fit”, and transition-state analog models
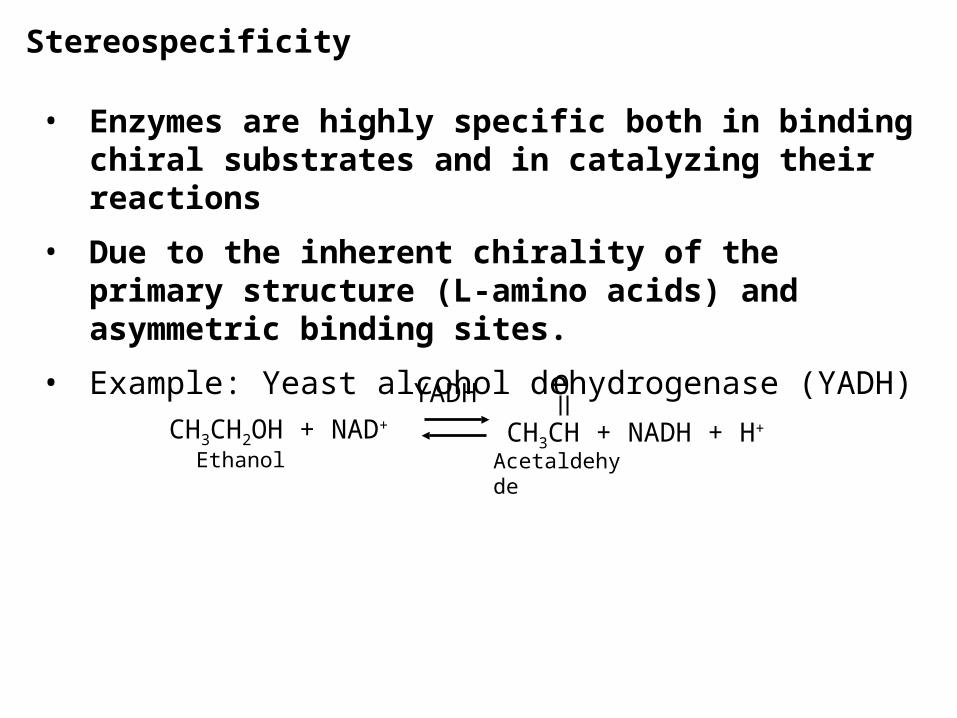
Stereospecificity
• Enzymes are highly specific both in binding chiral substrates and in catalyzing their reactions
• Due to the inherent chirality of the primary structure (L-amino acids) and asymmetric binding sites.
• Example: Yeast alcohol dehydrogenase (YADH)
CH3CH2OH + NAD+ CH3CH + NADH + H+
YADH O
Ethanol Acetaldehyde
Pag
e 46
1
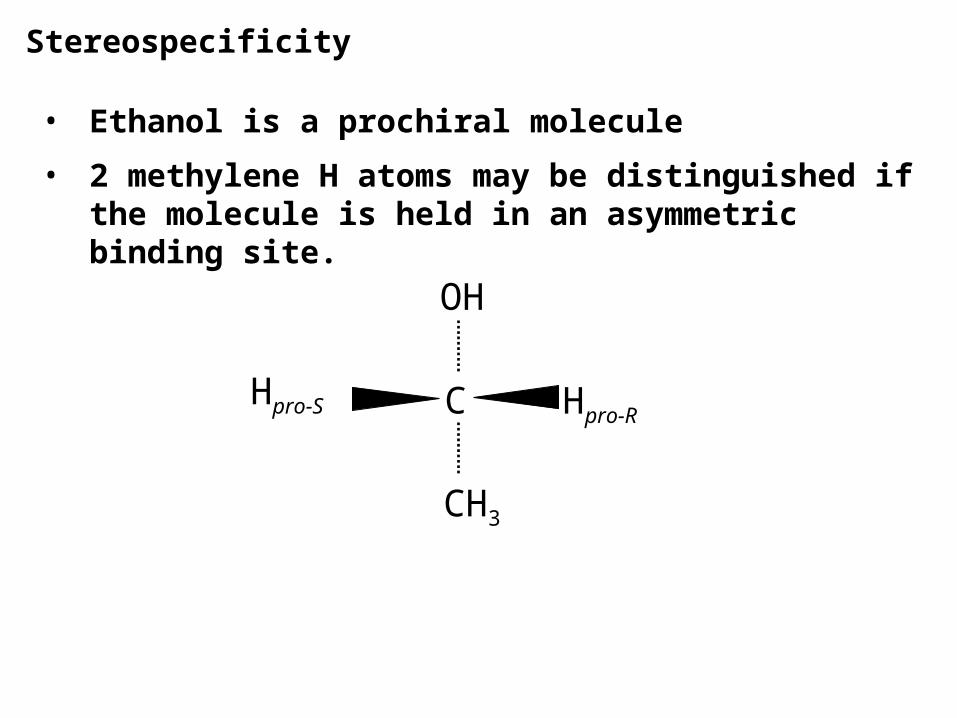
Stereospecificity
• Ethanol is a prochiral molecule
• 2 methylene H atoms may be distinguished if the molecule is held in an asymmetric binding site.
CH3
OH
Hpro-RHpro-S C

Figure 13-3 Prochiral differentiation.
Pag
e 46
1
Stereospecificity
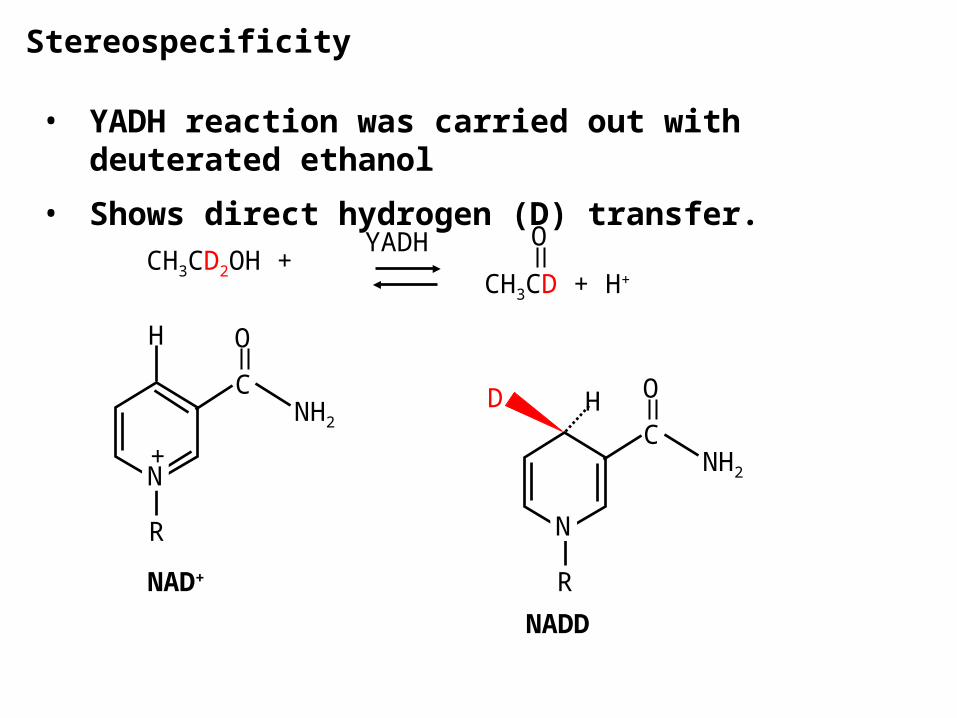
• YADH reaction was carried out with deuterated ethanol
• Shows direct hydrogen (D) transfer.
CH3CD2OH + CH3CD + H+
YADH O
NAD+
H
C
O
NH2
N+
R
HC
O
NH2
N
R
D
NADD

Stereospecificity
• NADD was isolated and used for the reverse reaction.
• Shows the stereospecificity of the enzyme.
CH3CH +YADH O
+ NAD+
HC
O
NH2
N
R
D
NADD
CH3
OH
DH C

Stereospecificity
• The enantiomer can be made as follows
CH3CD + NADH + H+
YADH O
+ NAD+
CH3
OH
C HD
• In this reaction none of the deuterium can be transferred from the product to NAD+ in the reverse reaction.
Stereospecificity
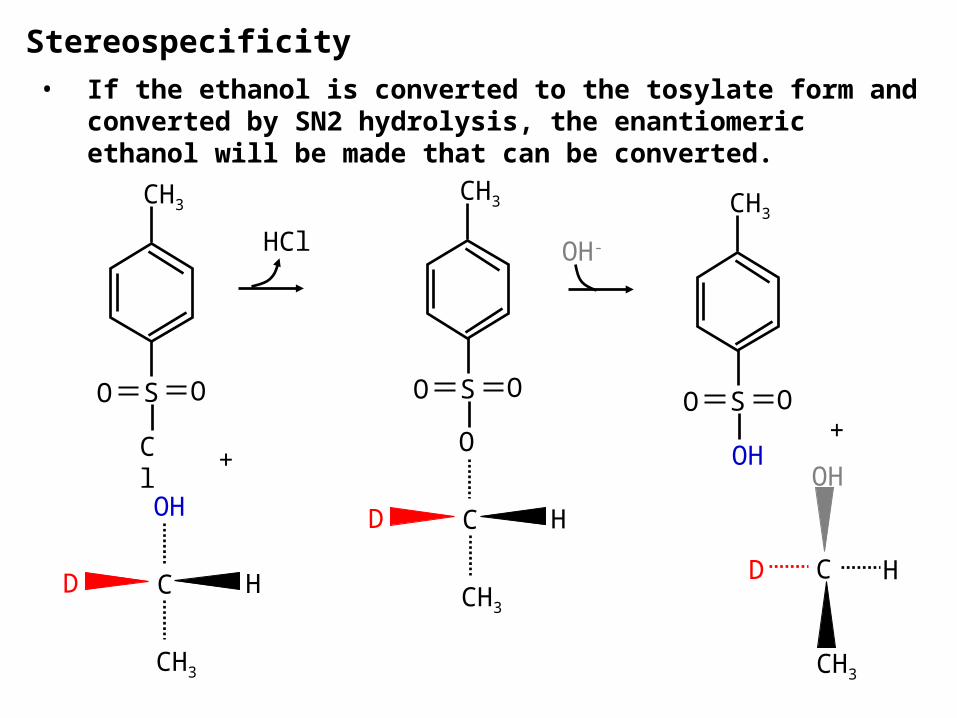
• If the ethanol is converted to the tosylate form and converted by SN2 hydrolysis, the enantiomeric ethanol will be made that can be converted.
CH3
OH
C HD
O
CH3
SO
Cl
O
CH3
SO
+
HCl
CH3
O
C HD
O
CH3
SO
OH
CH3
C HD
+
OH-
OH

Geometric specificity• In addition to stereospecificity, most enzymes are also
selective about the identities of the chemical groups on their substrates (Geometric specificity).
• Enzymes vary considerably in degree of geometric specificity
• Few enzymes are specific for only one compound (can catalyze a small range of related compounds).
• YADH catalyzes oxidation of small primary and secondary alcohols to aldehydes and ketones but less efficiently than for ethanol.
• Methanol is catalyzed 25-fold slower than ethanol, isopropanol 2.5-fold slower.

Regulation of enzymatic activity• Catalytic activities need to be regulated. Two main
ways to do this.
1. Control the amount of enzyme available. This is dependent on rate of synthesis of the enzyme and rate of degradation of the enzyme.
2. Control of enzyme activity. Enzyme activity may be directly regulated through conformational or structural alterations.
Allosteric interactions
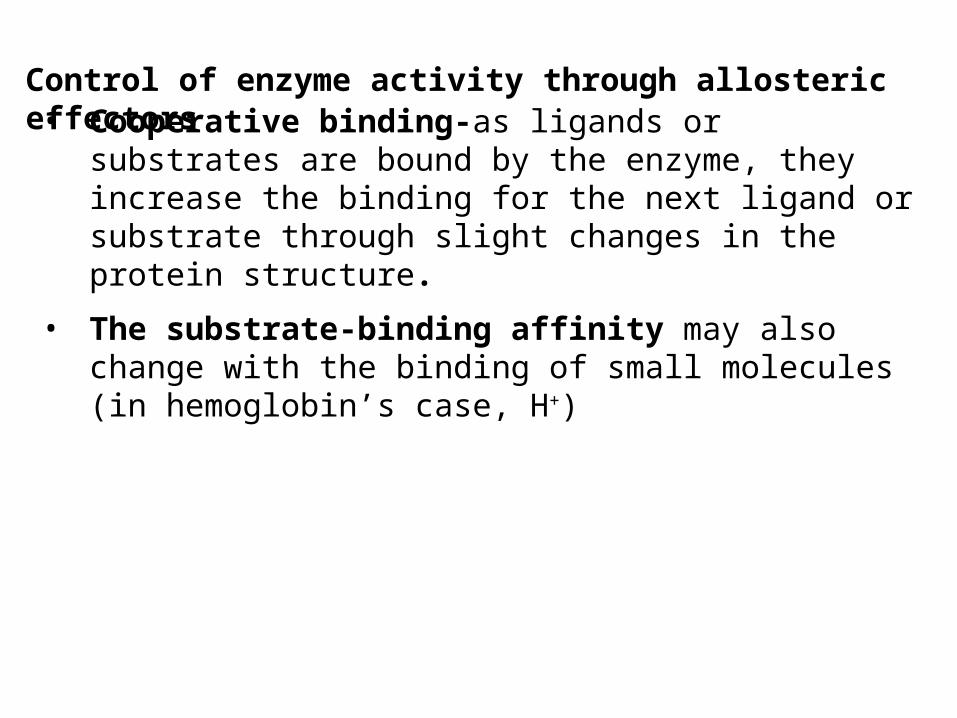
Control of enzyme activity through allosteric effectors• Cooperative binding-as ligands or substrates are bound
by the enzyme, they increase the binding for the next ligand or substrate through slight changes in the protein structure.
• The substrate-binding affinity may also change with the binding of small molecules (in hemoglobin’s case, H+)

Control of enzyme activity through allosteric effectors• Another example of allosteric control of an enzyme activity
is aspartate transcarbamoylse (ATCase).
NH2
C
OPO32-
O
O
C
CH2
O-
COO-H3N+
+
ATCase
O
C
CH2
O-
COO-NH
NH2
C
OCarbamoyl phosphate
Aspartate N-carbamoylaspartate
• Catalyzes the formation of N-carbamoylaspartate, first step for the biosynthesis of pyrimidines (nucleic acids)
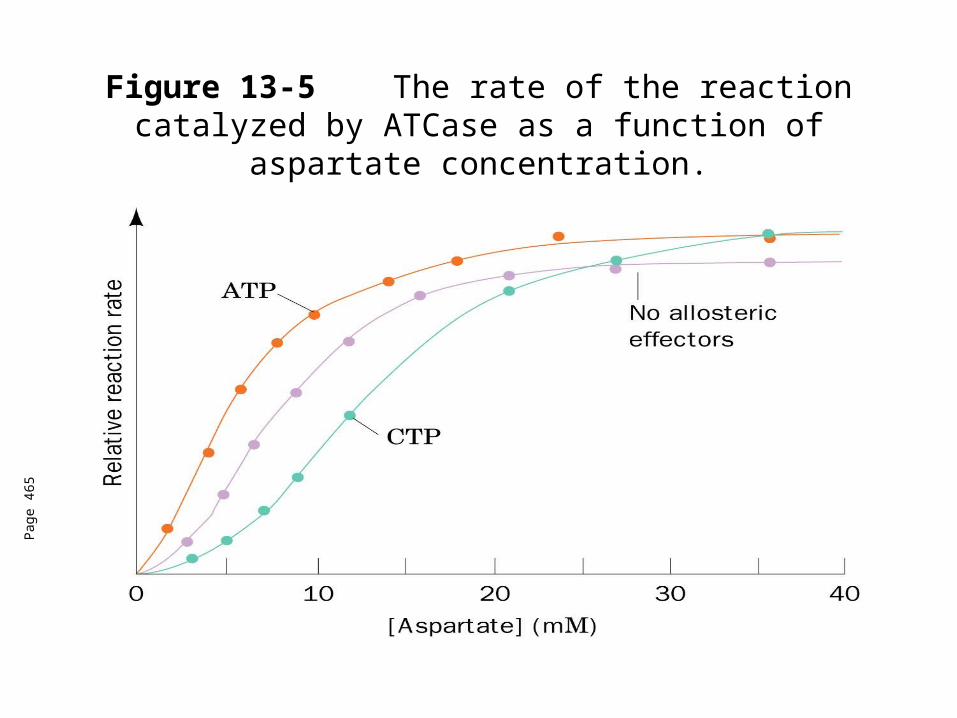
Figure 13-5 The rate of the reaction catalyzed by ATCase as a function of aspartate concentration.
Pag
e 46
5
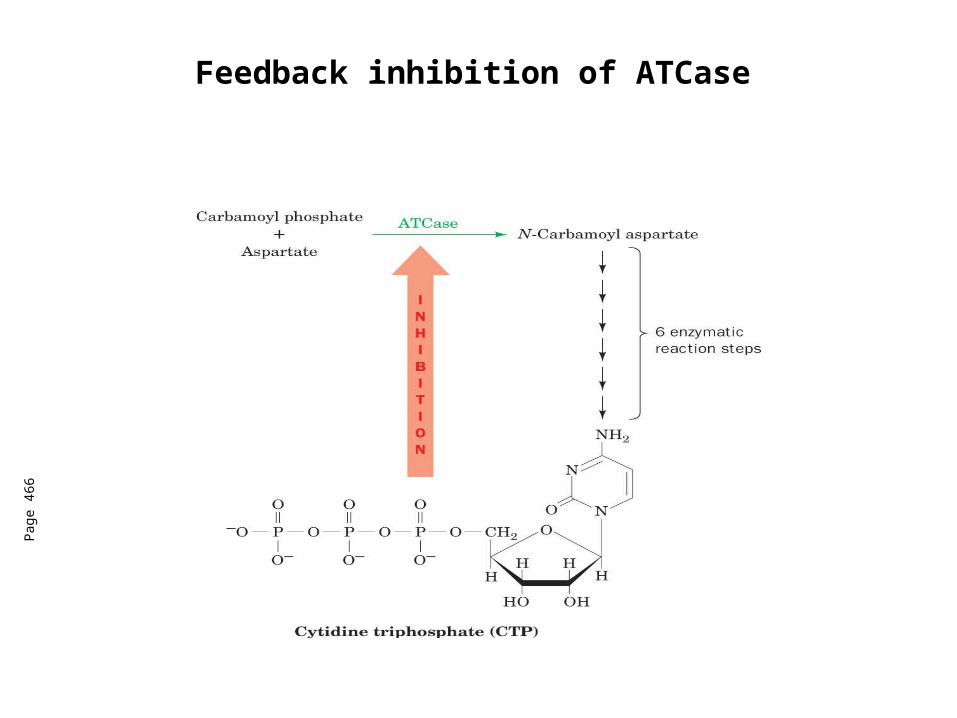
Feedback inhibition of ATCase
Pag
e 46
6
Control of enzyme activity through allosteric effectors• ATCase is regulated by feedback inhibition-the
concentration of the product controls the activity of an enzyme at the beginning of a pathway.
• ATCase is inhibited by excess CTP, a pyrimidine
• If the pyrimidines are all used up, CTP dissociates from ATCase, allowing the enzyme to resume its normal activity.
• ATP activates ATCase. ATP is a purine basd compound, that is normally found in high amounts in the cell, so it requires higher amounts of ATP to activate ATCase than the amount of CTP to inactivate the enzyme.
Control of enzyme activity through allosteric effectors
• ATCase is composed of 12 subunits (c6r6). c represent the catalytic subunits and r represents the regulatory units.
• The catalytic subunits are arranged in two sets of trimers (c3).
• Regulatory units are in three sets of dimers (r2).
• If we separate the catalytic subunits (c3) from the regulatory subunits, the catalytic subunits will have a noncooperative (hyperbolic like myoglobin) substrate saturation curve. This means that the maximum rate of the enzyme is higher than that of the intact enzyme and it is unaffected by the presence of ATP or CTP (no allosteric effect).
• The isolated regulatory dimers (r2) can bind to ATP or CTP but have no enzymatic activity.
Control of enzyme activity through allosteric effectors
• Allosteric theory predicts that the activator (ATP) will bind to preferentially to the ATCase active state (R or high substrate affinity).
• Also predicts that the inhibitor (CTP) will bind preferentially to ATCase inactive state (T or low substrate affinity).
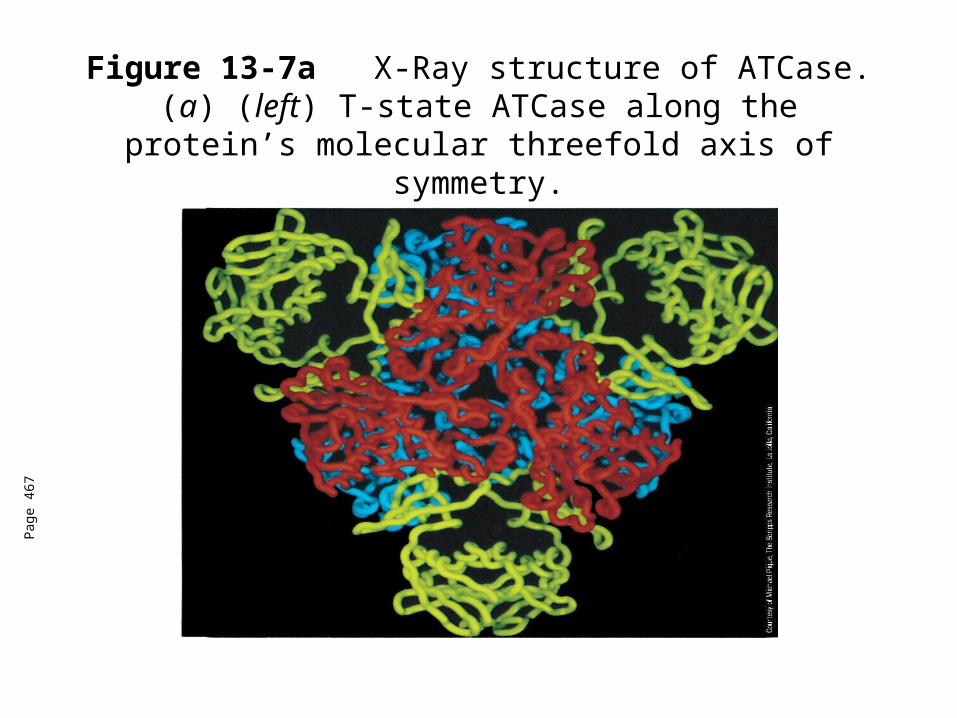
Figure 13-7aX-Ray structure of ATCase. (a) (left) T-state ATCase along the protein’s molecular threefold
axis of symmetry.
Pag
e 46
7
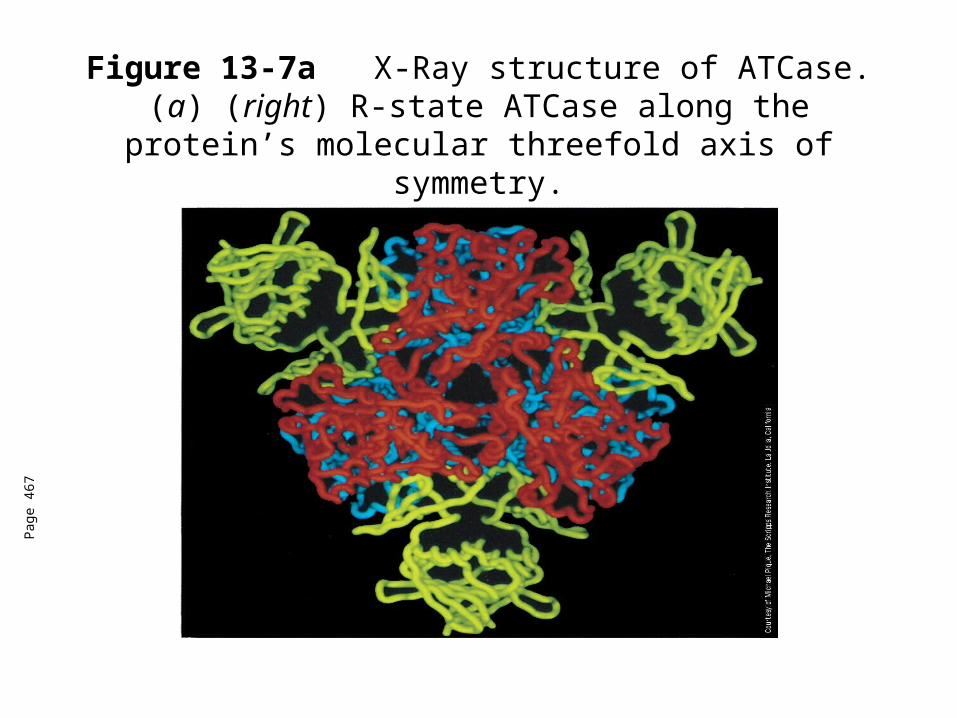
Figure 13-7aX-Ray structure of ATCase. (a) (right) R-state ATCase along the protein’s molecular threefold
axis of symmetry.
Pag
e 46
7
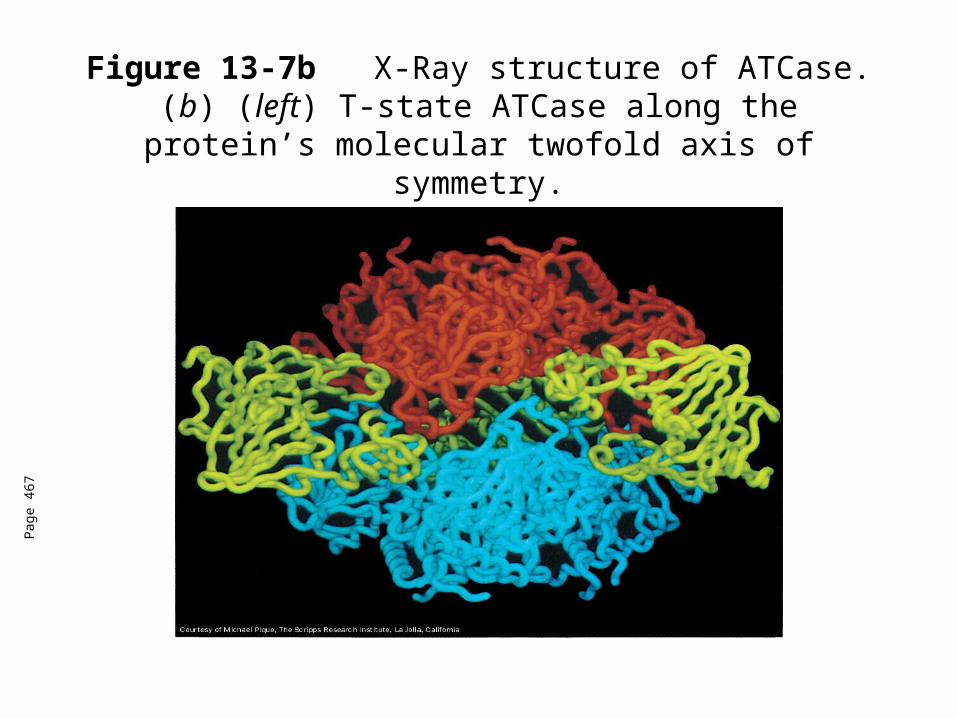
Figure 13-7bX-Ray structure of ATCase. (b) (left) T-state ATCase along the protein’s molecular twofold axis
of symmetry.
Pag
e 46
7
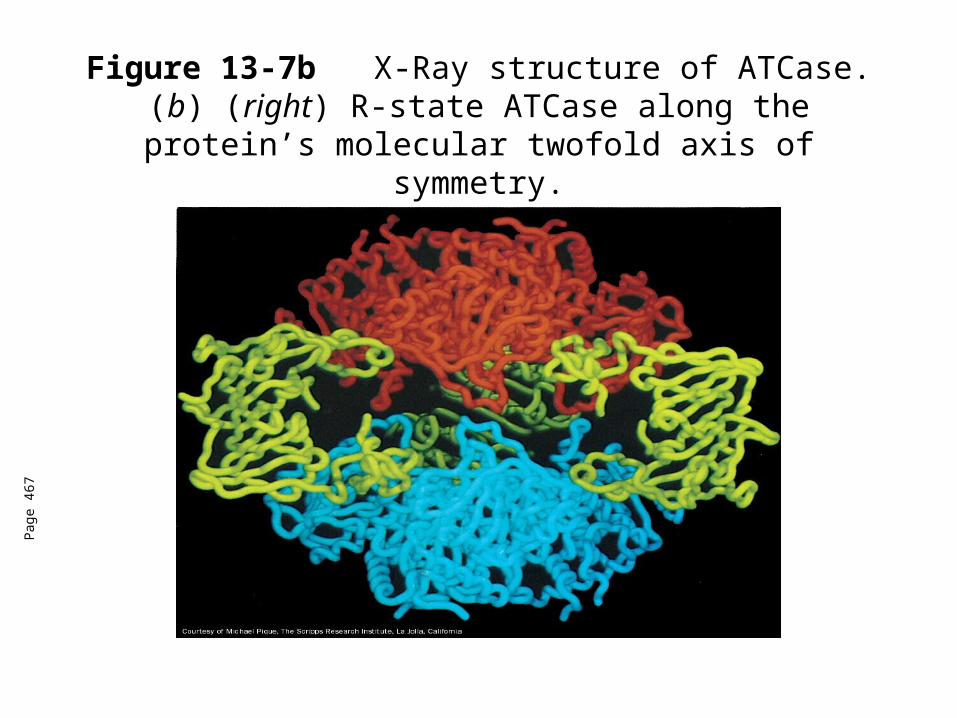
Figure 13-7bX-Ray structure of ATCase. (b) (right) R-state ATCase along the protein’s molecular twofold axis
of symmetry.
Pag
e 46
7
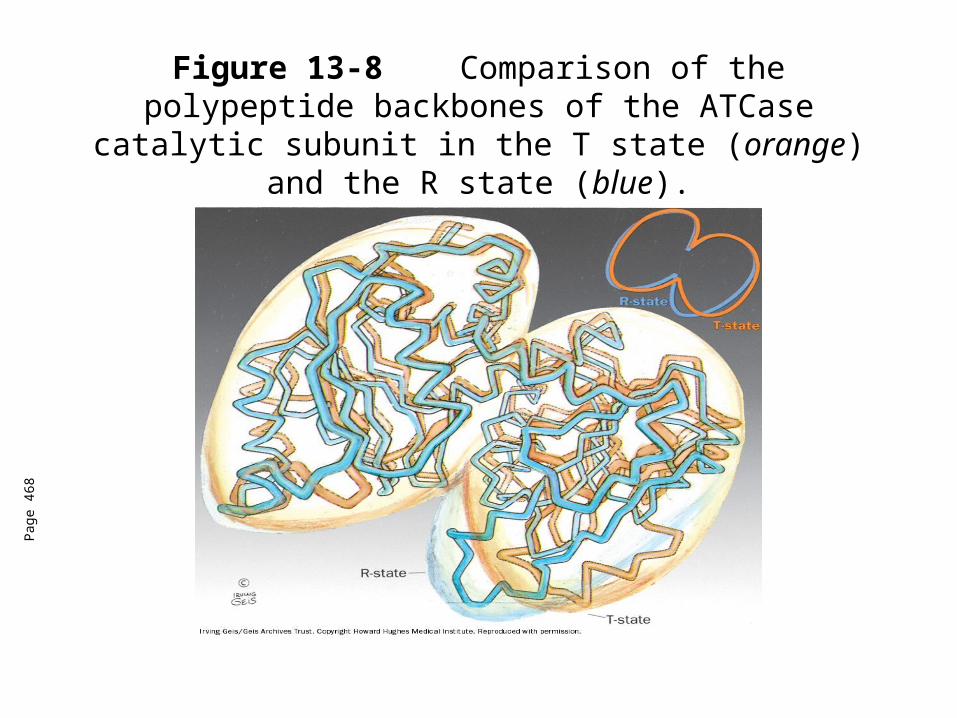
Figure 13-8 Comparison of the polypeptide backbones of the ATCase catalytic subunit in the T state (orange)
and the R state (blue).
Pag
e 46
8
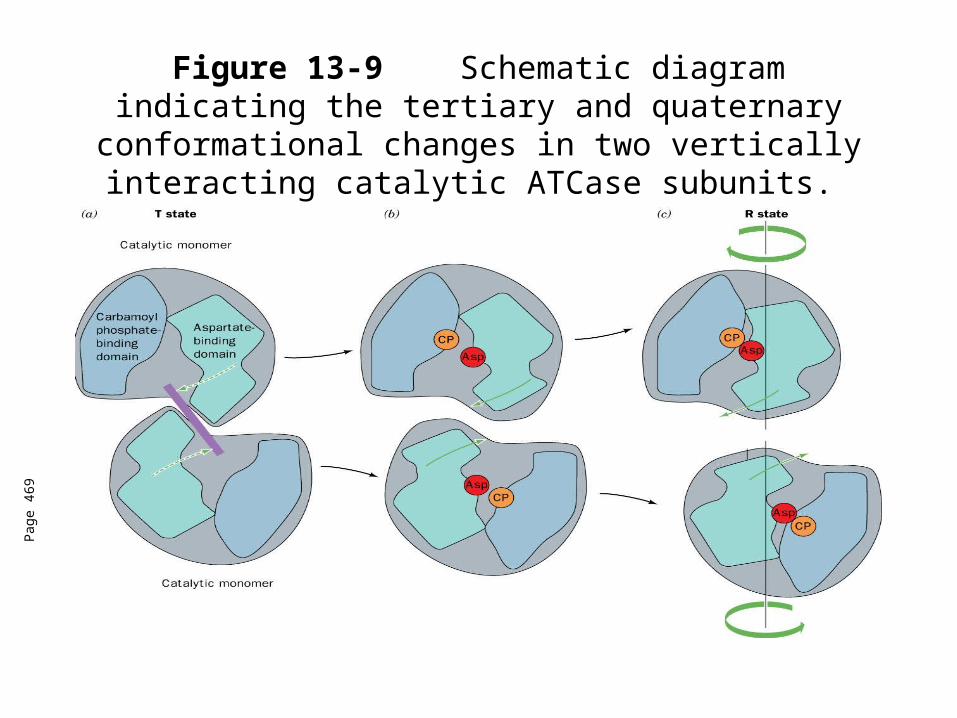
Figure 13-9 Schematic diagram indicating the tertiary and quaternary conformational changes in two vertically
interacting catalytic ATCase subunits.
Pag
e 46
9

Summary of allosterism
• Binding of substrates causes changes in quaternary structure that facilitate the enzymatic reaction.
• Binding of inhibitors can hold the enzyme in an inactive state (unfavorable for the reaction to occur or for substrates to bind).
• Binding of activators can hold the enzyme in an active state (favorable for the reaction to occur and for substrate binding).
Review from last lecture
• Understand differences between lock and key, induced fit, and transition state analog models
• Understand allosterism.
Thermodynamics
• Determines if the reaction is spontaneous (does it occur).• Does not tell us how fast a reaction will proceed.• Catalysts (enzymes) can lower the activation barrier to get
from products to reactants.
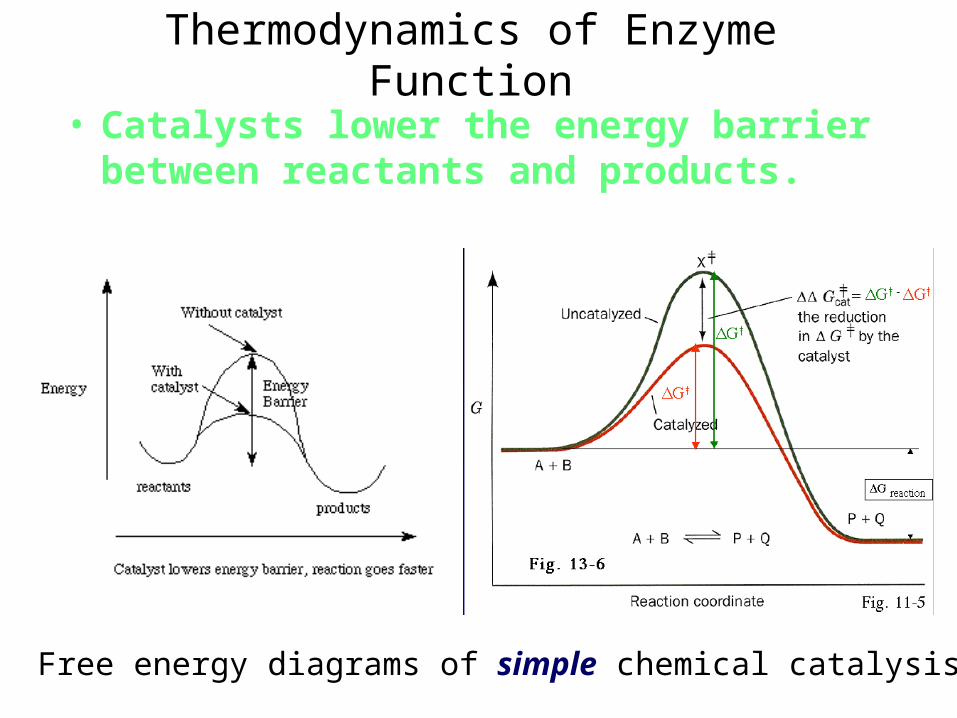
Thermodynamics of Enzyme Function
• Catalysts lower the energy barrier between reactants and products.
Free energy diagrams of simple chemical catalysis
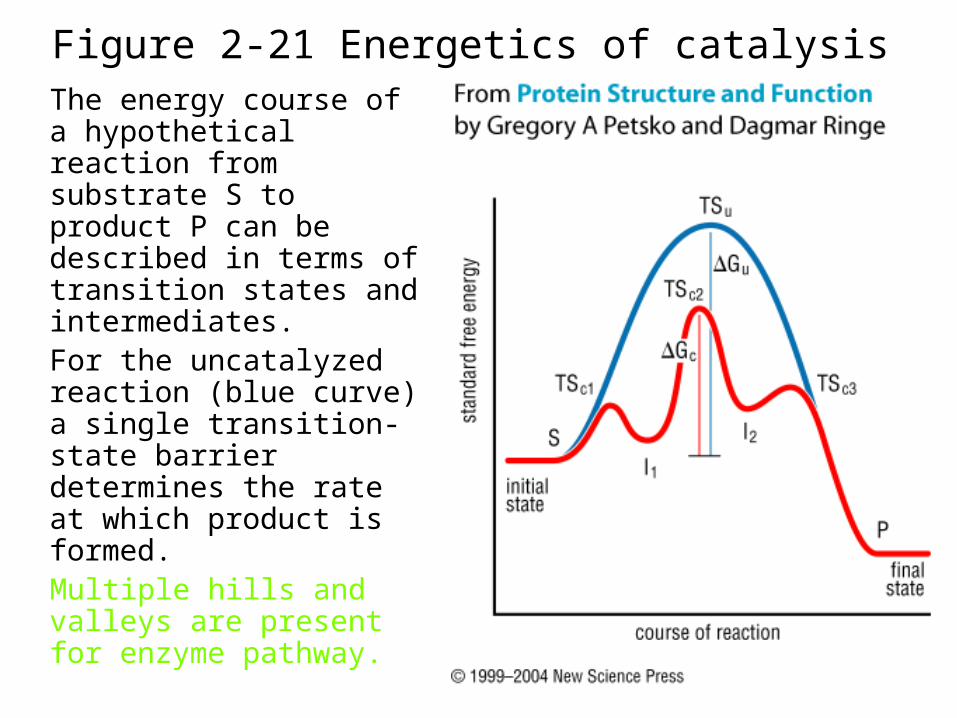
Figure 2-21 Energetics of catalysis The energy course of a hypothetical reaction from substrate S to product P can be described in terms of transition states and intermediates. For the uncatalyzed reaction (blue curve) a single transition-state barrier determines the rate at which product is formed.Multiple hills and valleys are present for enzyme pathway.
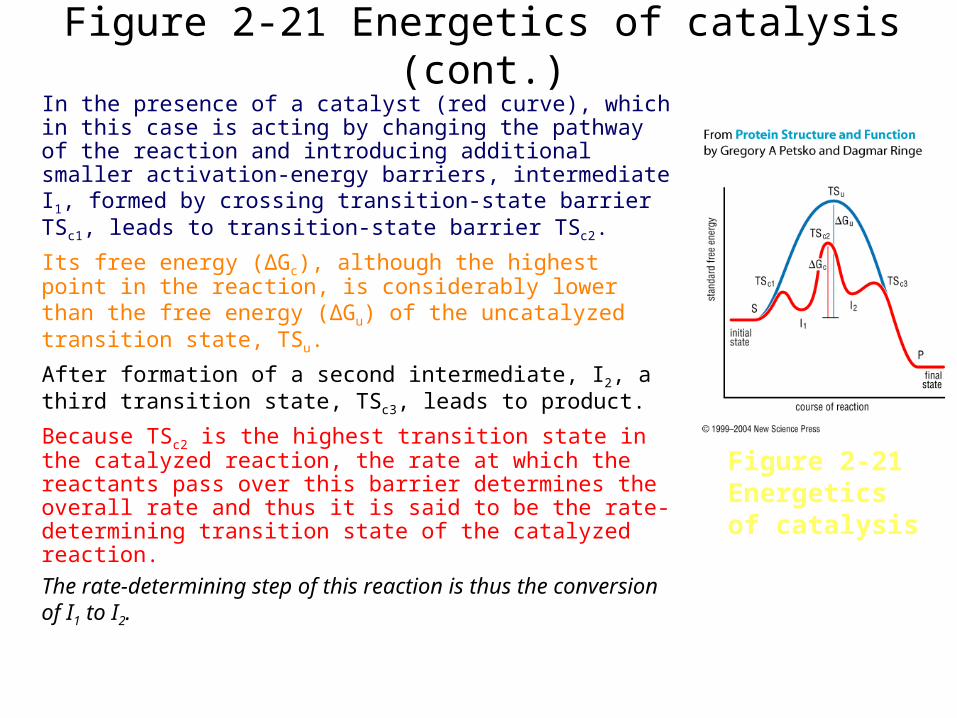
Figure 2-21 Energetics of catalysis (cont.)In the presence of a catalyst (red curve), which in this case is acting by changing the pathway of the reaction and introducing additional smaller activation-energy barriers, intermediate I1, formed by crossing transition-state barrier TSc1, leads to transition-state barrier TSc2.
Its free energy (ΔGc), although the highest point in the reaction, is considerably lower than the free energy (ΔGu) of the uncatalyzed transition state, TSu.
After formation of a second intermediate, I2, a third transition state, TSc3, leads to product.
Because TSc2 is the highest transition state in the catalyzed reaction, the rate at which the reactants pass over this barrier determines the overall rate and thus it is said to be the rate-determining transition state of the catalyzed reaction.
The rate-determining step of this reaction is thus the conversion of I1 to I2.
Figure 2-21 Energetics of catalysis

Figure 2-21 Energetics of catalysis (cont.)
The transition state is the highest point in free energy on the reaction pathway from substrate to product.
It is the top of the activation-energy barrier (see TSu in Fig. 2-21).
Chemically, it is a species that exists for about the time required for a single atomic vibration to occur (about 10-15
s).
In the transition state, the making or breaking of chemical bonds in the reaction is not yet complete: the atoms are "in flight".
The stereochemistry and charge configuration of the transition state is thus likely to be quite different from that of either the substrate or the product, although it may resemble one more than it does the other. Figure 2-21
Energetics of catalysis

Figure U2-3.2 The rate-determining step
• The rate-determining step of a reaction is the step with the largest energy barrier.
• In this example, the height of the barrier between intermediates I1 and I2 is greater than between S and I1 or I2 and P, and the rate determining step is therefore I1 to I2.
U2-1 Enzyme Kinetics: General Principles• Enzymes function as biological catalysts to increase the rate
(speed) of chemical catalysis.• Reaction rates reflect key properties of enzymes and the
reactions they catalyze• Kinetics is the study of how fast chemical reactions occur.• The free energy change can tell us in which direction the reaction will
spontaneously occur.• The free energy change does not tell us how rapidly. • Some spontaneous reactions occur quickly, e.g. sec., others occur
almost imperceptibly over many years.• The rate of a chemical reaction or process, or the reaction rate, is the
change in the concentration of reacting species (or of the products of their reaction) as a function of time (Fig. U2-1.1).
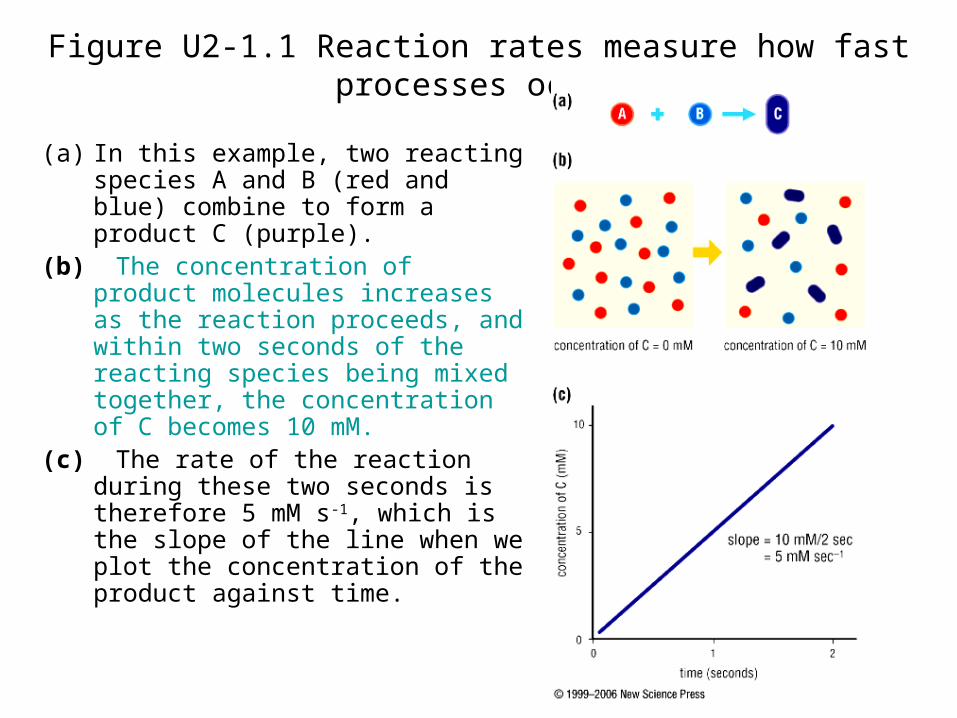
Figure U2-1.1 Reaction rates measure how fast processes occur
(a) In this example, two reacting species A and B (red and blue) combine to form a product C (purple).
(b) The concentration of product molecules increases as the reaction proceeds, and within two seconds of the reacting species being mixed together, the concentration of C becomes 10 mM.
(c) The rate of the reaction during these two seconds is therefore 5 mM s-1, which is the slope of the line when we plot the concentration of the product against time.
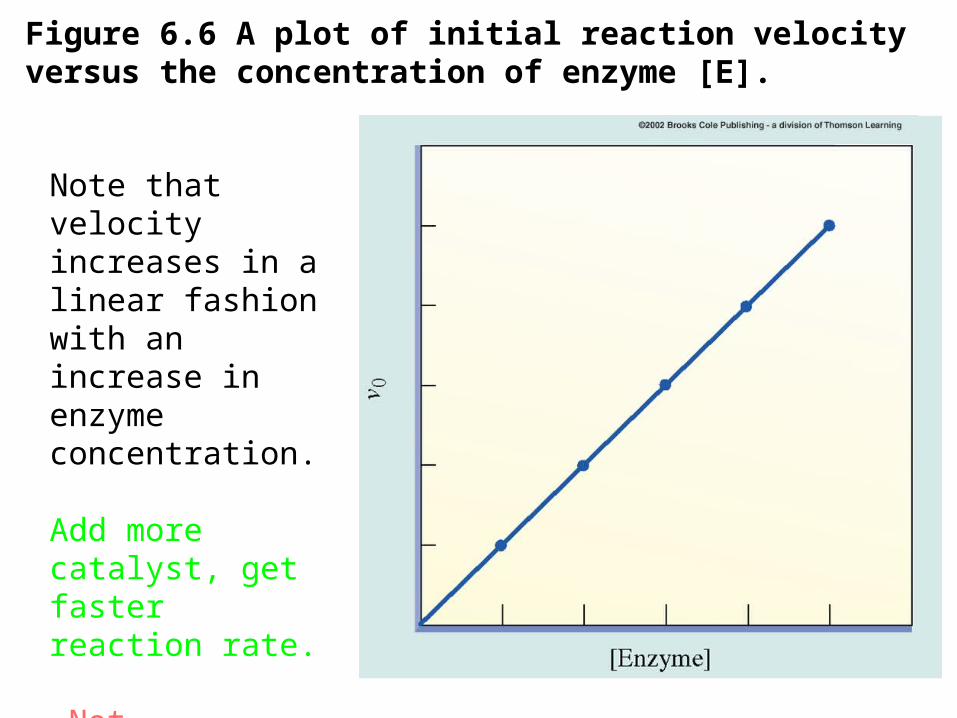
Figure 6.6 A plot of initial reaction velocity versus the concentration of enzyme [E].
Note that velocity increases in a linear fashion with an increase in enzyme concentration.
Add more catalyst, get faster reaction rate.
-Not surprising!
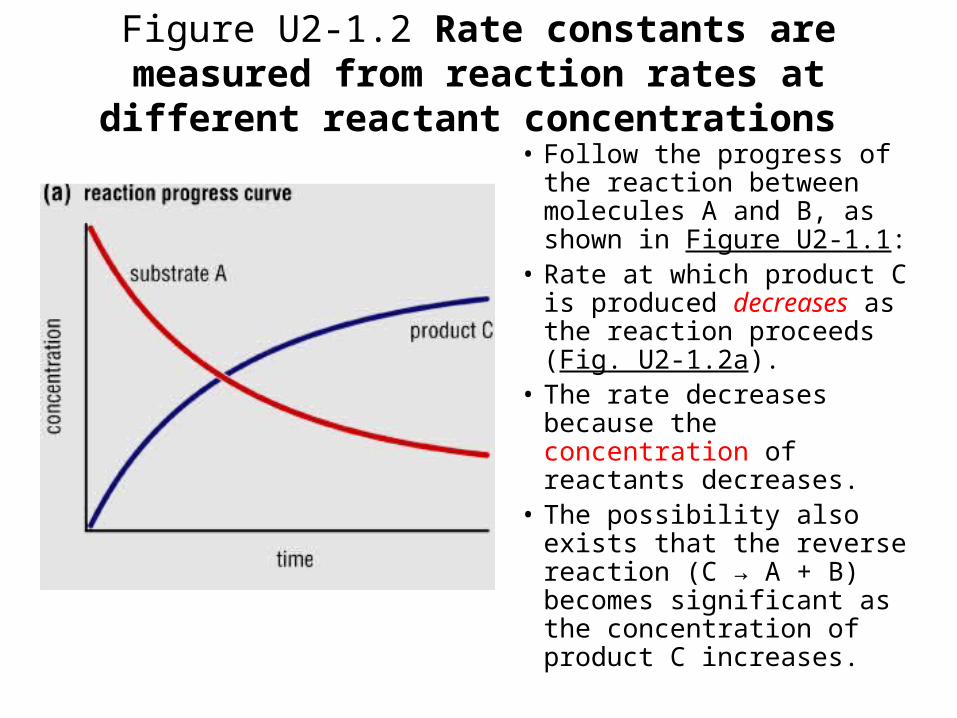
Figure U2-1.2 Rate constants are measured from reaction rates at different reactant
concentrations • Follow the progress of the
reaction between molecules A and B, as shown in Figure U2-1.1:
• Rate at which product C is produced decreases as the reaction proceeds (Fig. U2-1.2a).
• The rate decreases because the concentration of reactants decreases.
• The possibility also exists that the reverse reaction (C → A + B) becomes significant as the concentration of product C increases.
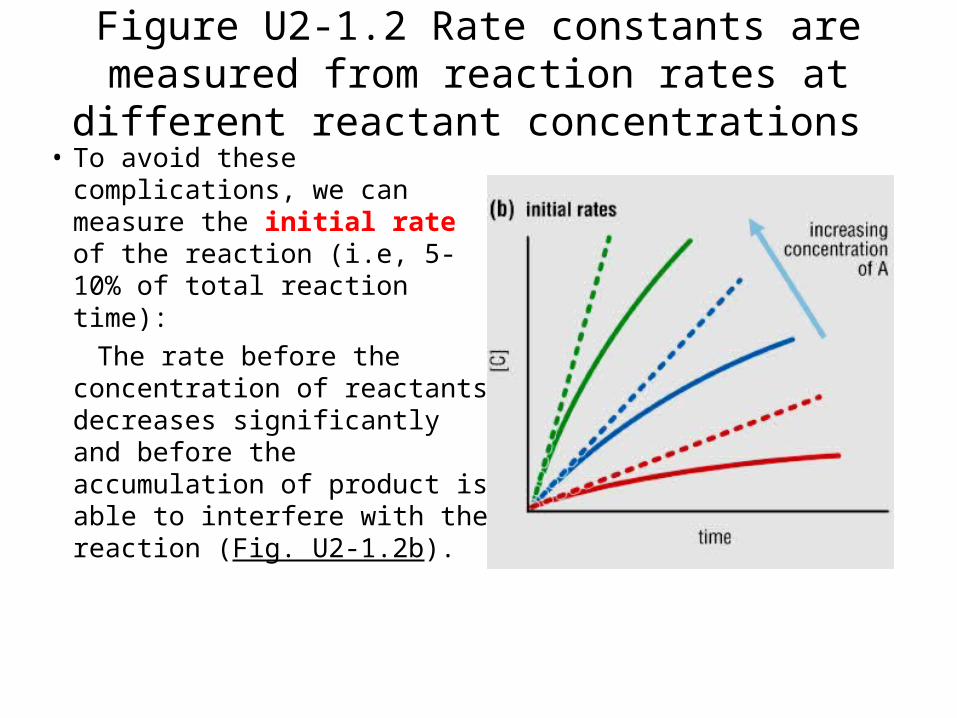
Figure U2-1.2 Rate constants are measured from reaction rates at different reactant
concentrations • To avoid these complications, we
can measure the initial rate of the reaction (i.e, 5-10% of total reaction time):
The rate before the concentration of reactants decreases significantly and before the accumulation of product is able to interfere with the reaction (Fig. U2-1.2b).
Related Documents