Lec 1: March 28th, 2006 EE512 - Graphical Models - J. Bilme s Page 1 University of Washington Department of Electrical Engineering EE512 Spring, 2006 Graphical Models Jeff A. Bilmes <[email protected]> Jeff A. Bilmes <[email protected]> Lecture 1 Slides March 28 th , 2006

Lec 1: March 28th, 2006EE512 - Graphical Models - J. BilmesPage 1 Jeff A. Bilmes University of Washington Department of Electrical Engineering EE512 Spring,
Dec 19, 2015
Welcome message from author
This document is posted to help you gain knowledge. Please leave a comment to let me know what you think about it! Share it to your friends and learn new things together.
Transcript
Lec 1: March 28th, 2006 EE512 - Graphical Models - J. Bilmes Page 1
University of WashingtonDepartment of Electrical Engineering
EE512 Spring, 2006 Graphical Models
Jeff A. Bilmes <[email protected]>Jeff A. Bilmes <[email protected]>
Lecture 1 Slides
March 28th, 2006
Lec 1: March 28th, 2006 EE512 - Graphical Models - J. Bilmes Page 2
• Class overview• What are graphical models• Semantics of Bayesian networks
Outline of Today’s Lecture
Lec 1: March 28th, 2006 EE512 - Graphical Models - J. Bilmes Page 3
Books and Sources for Today
• Jordan: Chapters 1 and 2

Lec 1: March 28th, 2006 EE512 - Graphical Models - J. Bilmes Page 4
• L1: Tues, 3/28: Overview, GMs, Intro BNs.• L2: Thur, 3/30• L3: Tues, 4/4• L4: Thur, 4/6• L5: Tue, 4/11• L6: Thur, 4/13• L7: Tues, 4/18• L8: Thur, 4/20• L9: Tue, 4/25• L10: Thur, 4/27
• L11: Tues, 5/2• L12: Thur, 5/4• L13: Tues, 5/9• L14: Thur, 5/11• L15: Tue, 5/16• L16: Thur, 5/18• L17: Tues, 5/23• L18: Thur, 5/25• L19: Tue, 5/30• L20: Thur, 6/1: final presentations
Class Road Map

Lec 1: March 28th, 2006 EE512 - Graphical Models - J. Bilmes Page 5
• READING: Chapter 1,2 in Jordan’s book (pick up book from basement of communications copy center).
• List handout: name, department, and email• List handout: regular makeup slot, and discussion
section• Syllabus• Course web page: http://ssli.ee.washington.edu/ee512• Goal: powerpoint slides this quarter, they will be on
the web page after lecture (but not before as you are getting them hot off the press).
Announcements
Lec 1: March 28th, 2006 EE512 - Graphical Models - J. Bilmes Page 6
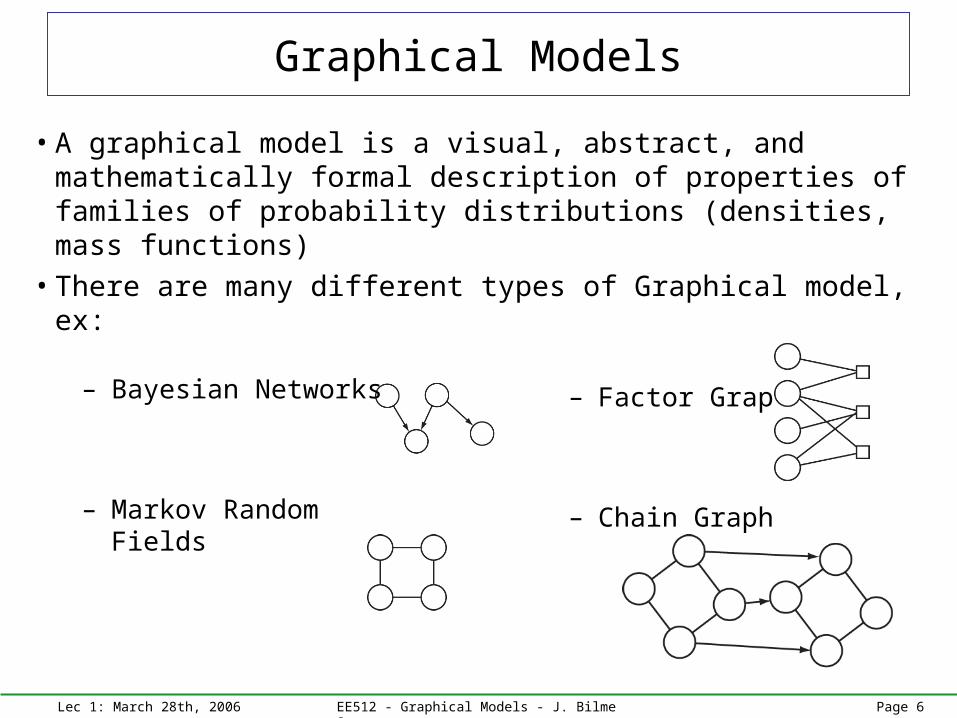
• A graphical model is a visual, abstract, and mathematically formal description of properties of families of probability distributions (densities, mass functions)
• There are many different types of Graphical model, ex:
– Bayesian Networks
– Markov Random Fields
– Factor Graph
– Chain Graph
Graphical Models
Lec 1: March 28th, 2006 EE512 - Graphical Models - J. Bilmes Page 7
Graphical Models
Chain GraphsCausal Models
DGMsUGMs
Bayesian Networks
MRFs
Gibbs/Boltzman Distributions
DBNs Mixture Models
Decision Trees
Simple Models
PCA
LDAHMM
Factorial HMM/Mixed Memory Markov Models
BMMs
Kalman
Other Semantics
FST
Dependency Networks
Segment Models
AR
ZMs
Factor Graphs
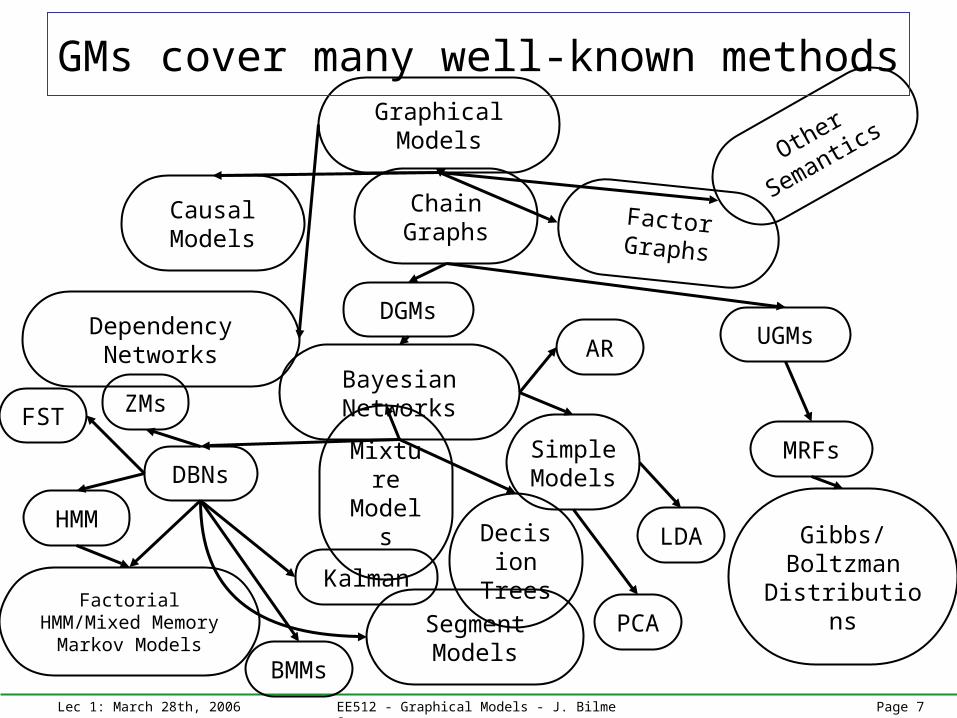
GMs cover many well-known methods
Lec 1: March 28th, 2006 EE512 - Graphical Models - J. Bilmes Page 8
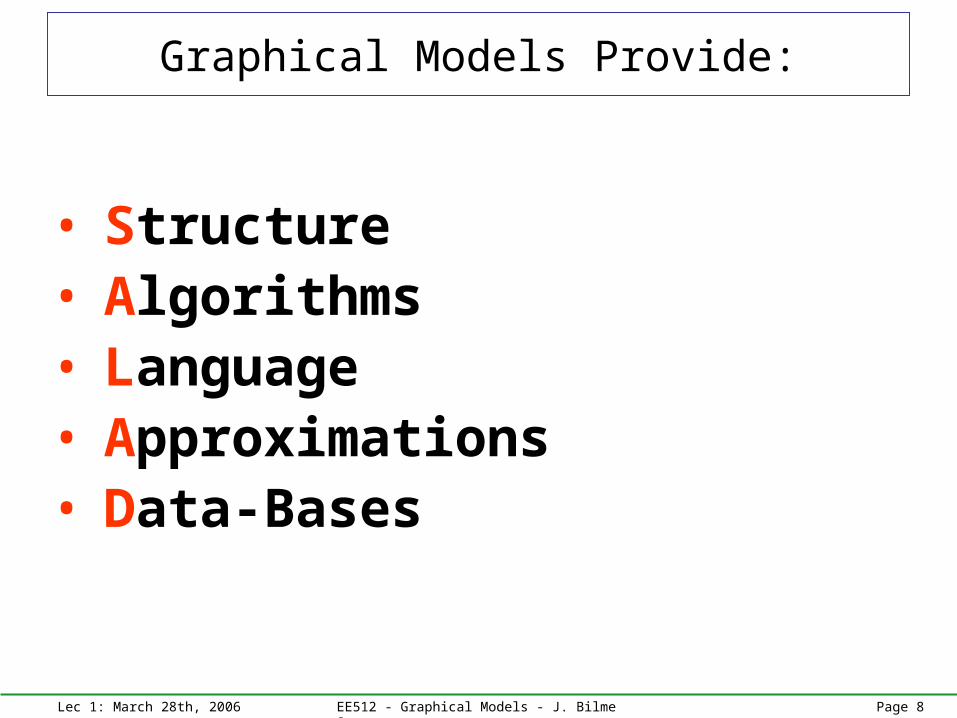
• Structure• Algorithms• Language• Approximations• Data-Bases
Graphical Models Provide:

Lec 1: March 28th, 2006 EE512 - Graphical Models - J. Bilmes Page 9
GMs give us:
I. Structure: A method to explore the structure of “natural” phenomena (causal vs. correlated relations, properties of natural signals and scenes)
II. Algorithms: A set of algorithms that provide “efficient” probabilistic inference and statistical decision making
III. Language: A mathematically formal, abstract, visual language with which to efficiently discuss families of probabilistic models and their properties.
Graphical Models Provide
Lec 1: March 28th, 2006 EE512 - Graphical Models - J. Bilmes Page 10
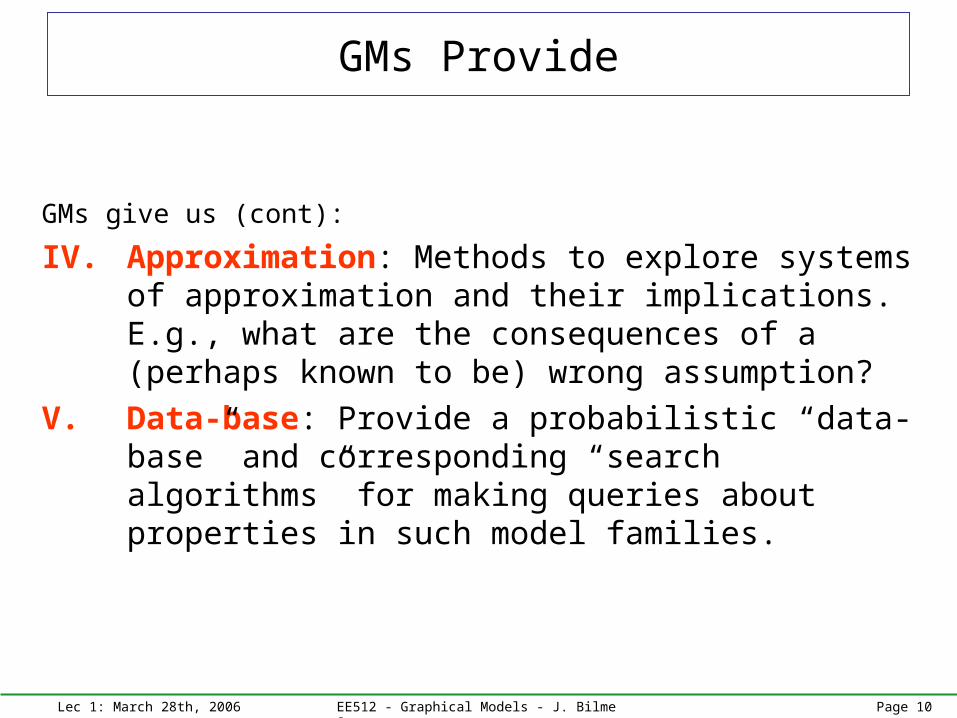
GMs give us (cont):
IV. Approximation: Methods to explore systems of approximation and their implications. E.g., what are the consequences of a (perhaps known to be) wrong assumption?
V. Data-base: Provide a probabilistic “data-base” and corresponding “search algorithms” for making queries about properties in such model families.
GMs Provide
Lec 1: March 28th, 2006 EE512 - Graphical Models - J. Bilmes Page 11
GMs
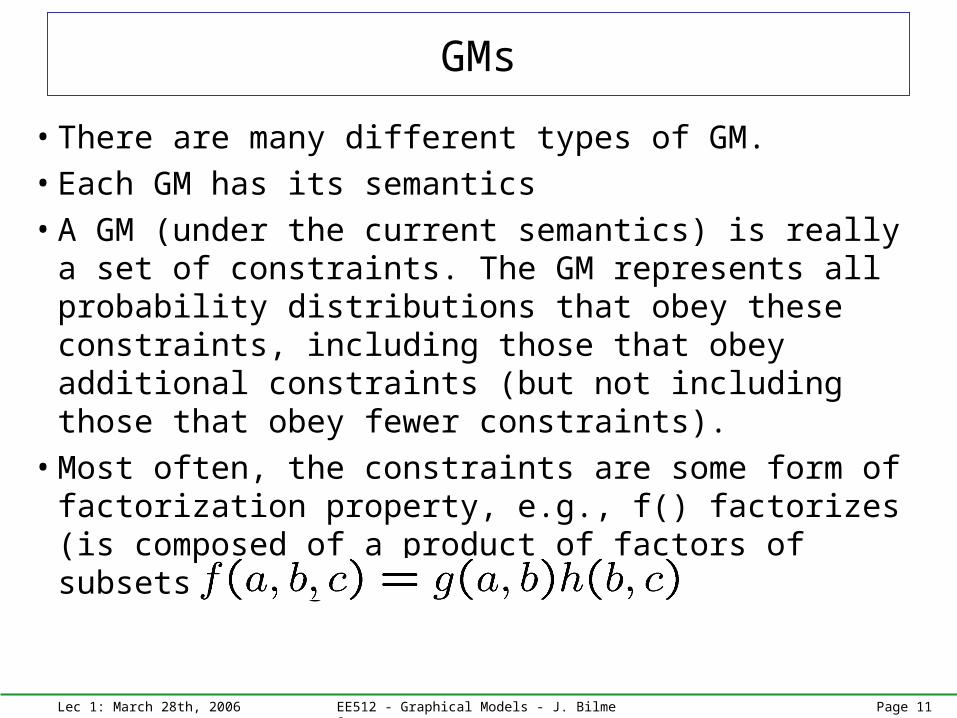
• There are many different types of GM.• Each GM has its semantics• A GM (under the current semantics) is really a set of
constraints. The GM represents all probability distributions that obey these constraints, including those that obey additional constraints (but not including those that obey fewer constraints).
• Most often, the constraints are some form of factorization property, e.g., f() factorizes (is composed of a product of factors of subsets of arguments).
Lec 1: March 28th, 2006 EE512 - Graphical Models - J. Bilmes Page 12
Types of Queries
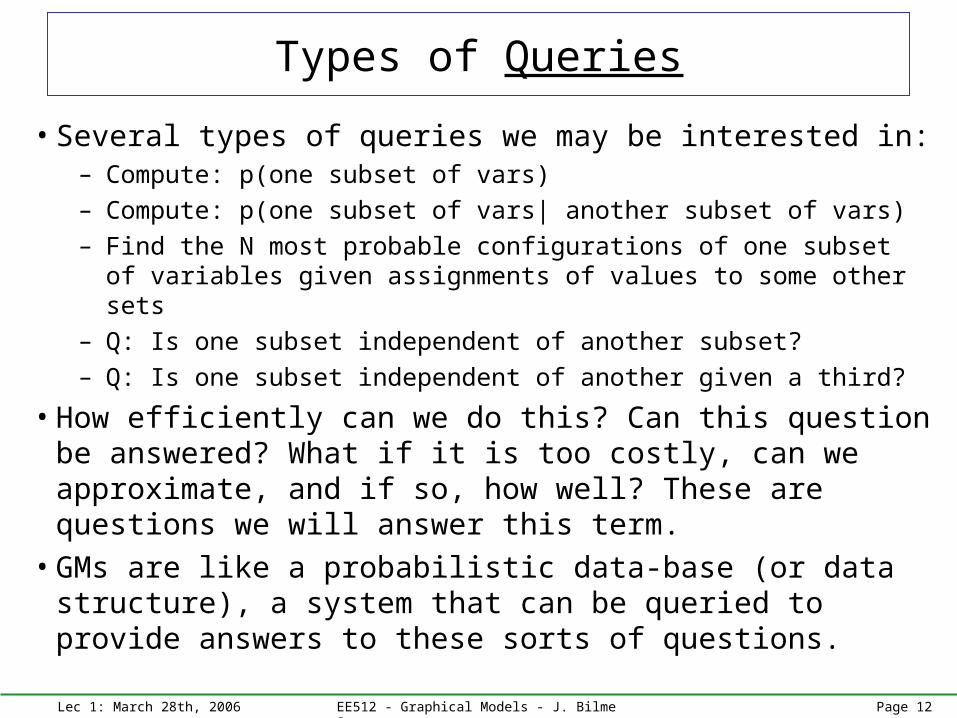
• Several types of queries we may be interested in:– Compute: p(one subset of vars)– Compute: p(one subset of vars| another subset of vars)– Find the N most probable configurations of one subset of variables
given assignments of values to some other sets– Q: Is one subset independent of another subset?– Q: Is one subset independent of another given a third?
• How efficiently can we do this? Can this question be answered? What if it is too costly, can we approximate, and if so, how well? These are questions we will answer this term.
• GMs are like a probabilistic data-base (or data structure), a system that can be queried to provide answers to these sorts of questions.

Lec 1: March 28th, 2006 EE512 - Graphical Models - J. Bilmes Page 13
Example
• Typical goal of pattern recognition:– training (say, EM or gradient descent), need query of form:
In this form, we need to compute p(o,h) efficiently.– Bayes decision rule, need to find best class for a given unknown
pattern:
– but this is yet another query on a probability distribution.– We can train, and perform Bayes decision theory quickly if we can
compute with probabilities quickly. Graphical models provide a way to reason about, and understand when this is possible, and if not, how to reasonably approximate.
Lec 1: March 28th, 2006 EE512 - Graphical Models - J. Bilmes Page 14
Some Notation
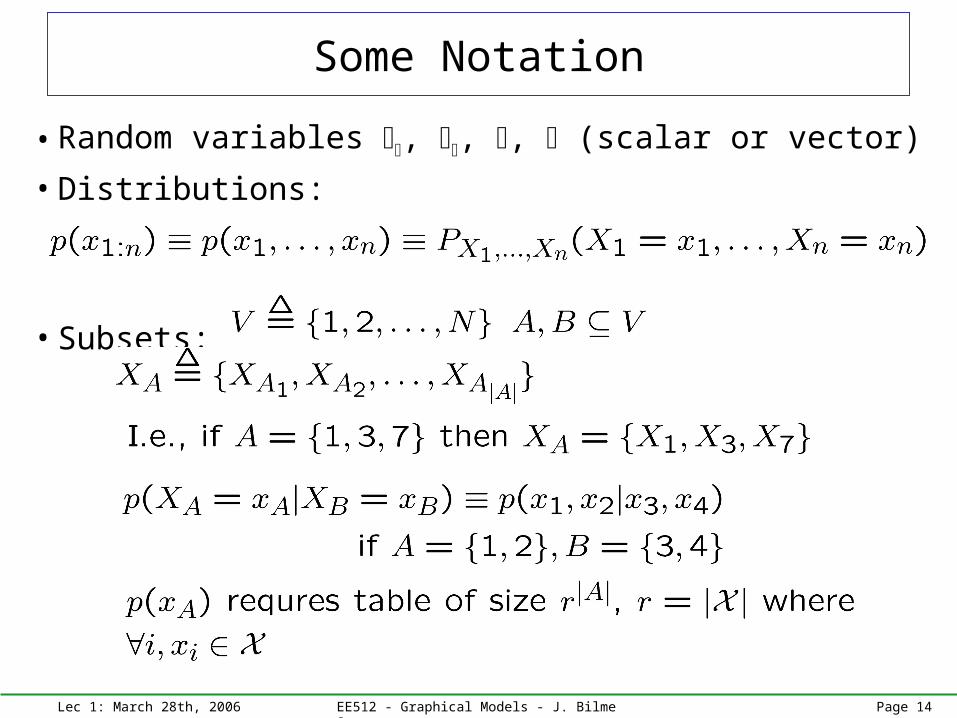
• Random variables , , , (scalar or vector)
• Distributions:
• Subsets:
Lec 1: March 28th, 2006 EE512 - Graphical Models - J. Bilmes Page 15
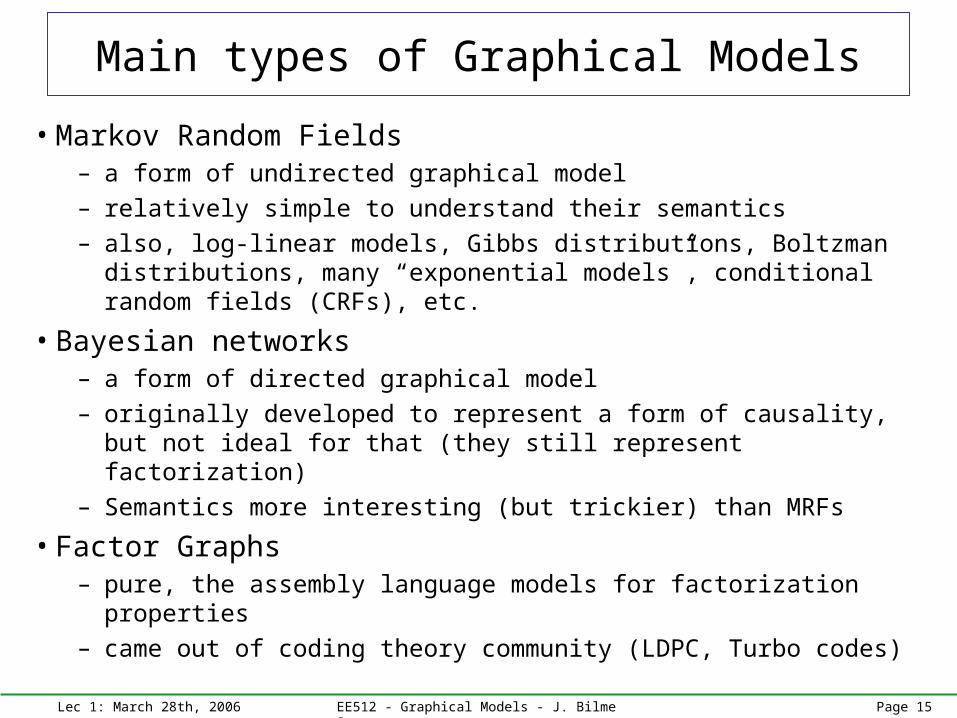
Main types of Graphical Models
• Markov Random Fields – a form of undirected graphical model– relatively simple to understand their semantics– also, log-linear models, Gibbs distributions, Boltzman distributions,
many “exponential models”, conditional random fields (CRFs), etc.
• Bayesian networks– a form of directed graphical model– originally developed to represent a form of causality, but not ideal for
that (they still represent factorization)– Semantics more interesting (but trickier) than MRFs
• Factor Graphs– pure, the assembly language models for factorization properties– came out of coding theory community (LDPC, Turbo codes)
Lec 1: March 28th, 2006 EE512 - Graphical Models - J. Bilmes Page 16
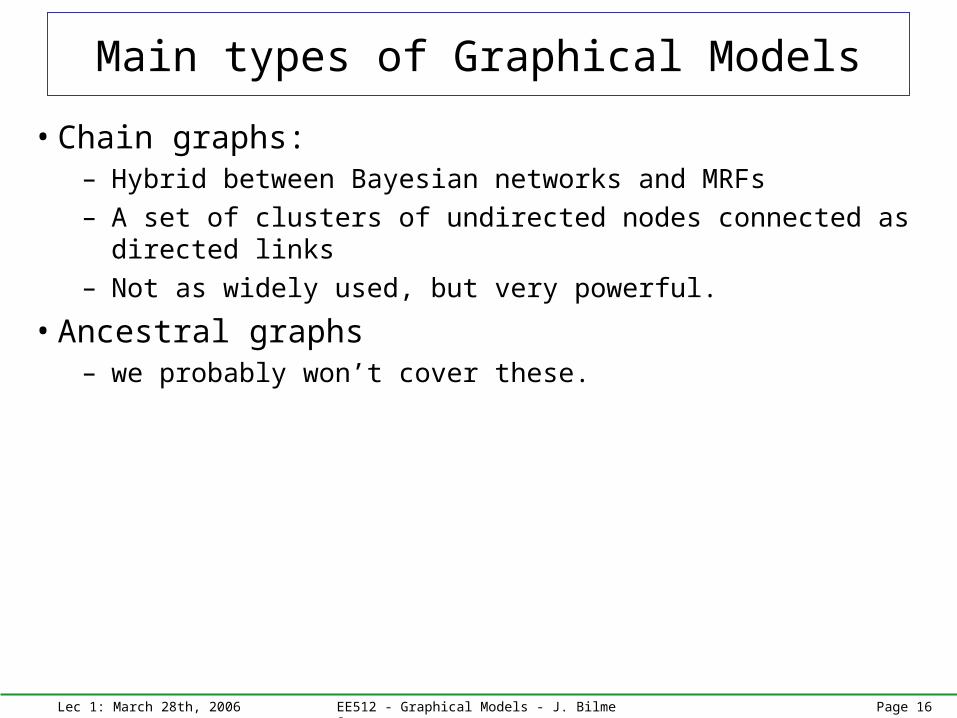
Main types of Graphical Models
• Chain graphs: – Hybrid between Bayesian networks and MRFs– A set of clusters of undirected nodes connected as directed links– Not as widely used, but very powerful.
• Ancestral graphs– we probably won’t cover these.
Lec 1: March 28th, 2006 EE512 - Graphical Models - J. Bilmes Page 17
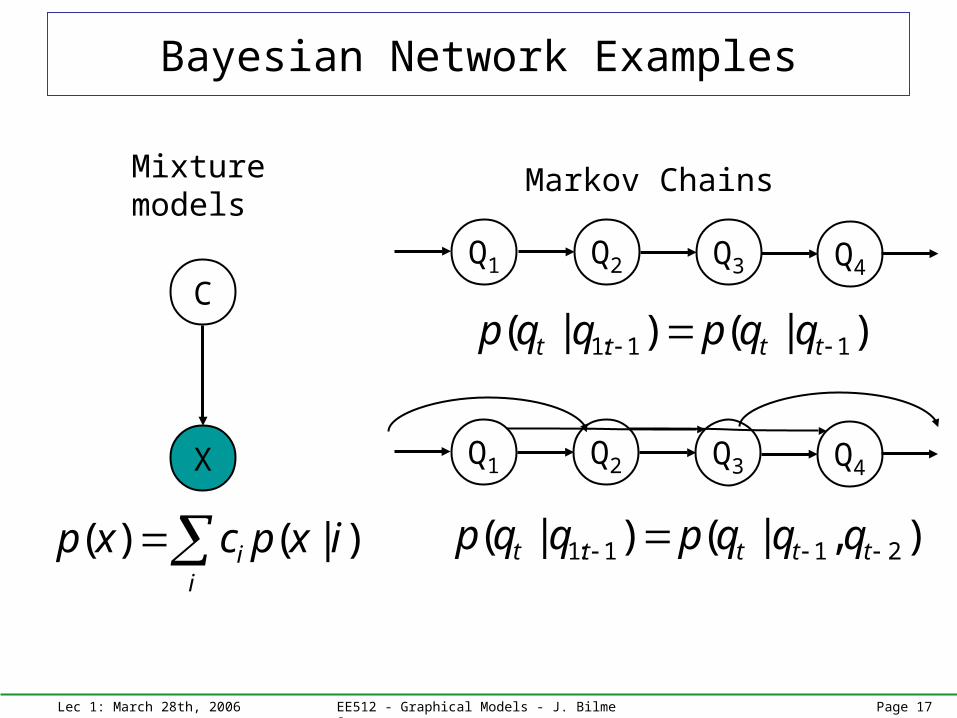
C
X
Mixturemodels
( ) ( | )ii
p x c p x i
Q1 Q2 Q3 Q4
Markov Chains
)|()|( 11:1 tttt qqpqqp
Q1 Q2 Q3 Q4
),|()|( 211:1 ttttt qqqpqqp
Bayesian Network Examples

Lec 1: March 28th, 2006 EE512 - Graphical Models - J. Bilmes Page 18
X
Y
Other generalizations possible E.g., Q = gen. diagonal, or capture using general A since
),( RNAXY
(0, )X N Q
Q
R
PCA: Q = , R 0, A = ortho
FA: Q = I, R = diagonal
XY
Y X u
( , )TY N AQA R
GMs: PCA and Factor Analysis

Lec 1: March 28th, 2006 EE512 - Graphical Models - J. Bilmes Page 19
X1 X2 X3 X4
I1 I21 2I I
The data X1:4 is explained by the two (marginally) independent causes.
Independent Component Analysis
Lec 1: March 28th, 2006 EE512 - Graphical Models - J. Bilmes Page 20
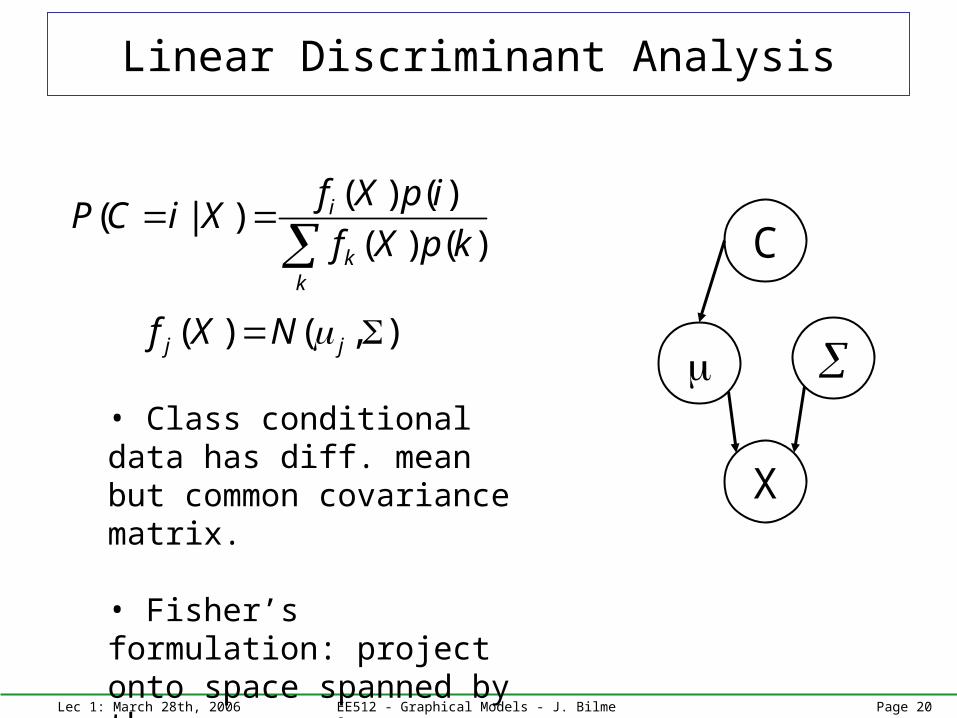
C
X
( ) ( )( | )
( ) ( )i
kk
f X p iP C i X
f X p k
( ) ( , )j jf X N
• Class conditional data has diff. mean but common covariance matrix.
• Fisher’s formulation: project onto space spanned by the means.
Linear Discriminant Analysis
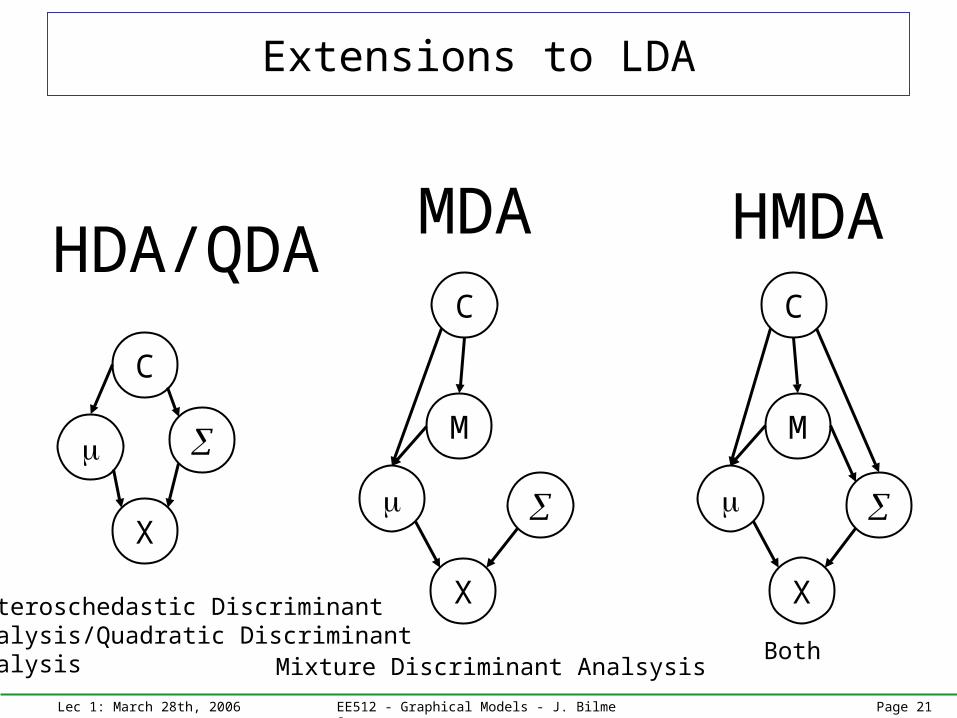
Lec 1: March 28th, 2006 EE512 - Graphical Models - J. Bilmes Page 21
C
X
C
X
M
C
X
M
HDA/QDAMDA HMDA
Extensions to LDA
Heteroschedastic Discriminant Analysis/Quadratic DiscriminantAnalysis Mixture Discriminant Analsysis
Both

Lec 1: March 28th, 2006 EE512 - Graphical Models - J. Bilmes Page 22
• Generalized Probabilistic Decision Trees
• Hierarchical Mixtures of Experts (Jordan)
O
I
D1
D2
D3
Generalized Decision Trees

Lec 1: March 28th, 2006 EE512 - Graphical Models - J. Bilmes Page 23
Example: Printer Troubleshooting
Dechter

Lec 1: March 28th, 2006 EE512 - Graphical Models - J. Bilmes Page 24
Classifier Combination
X
S
C
Mixture of Experts(Sum rule)
X1
C
Naive Bayes(prod. rule)
X2 XN...
Other CombinationSchemes
C
C1 C2
X1 X2
Lec 1: March 28th, 2006 EE512 - Graphical Models - J. Bilmes Page 25
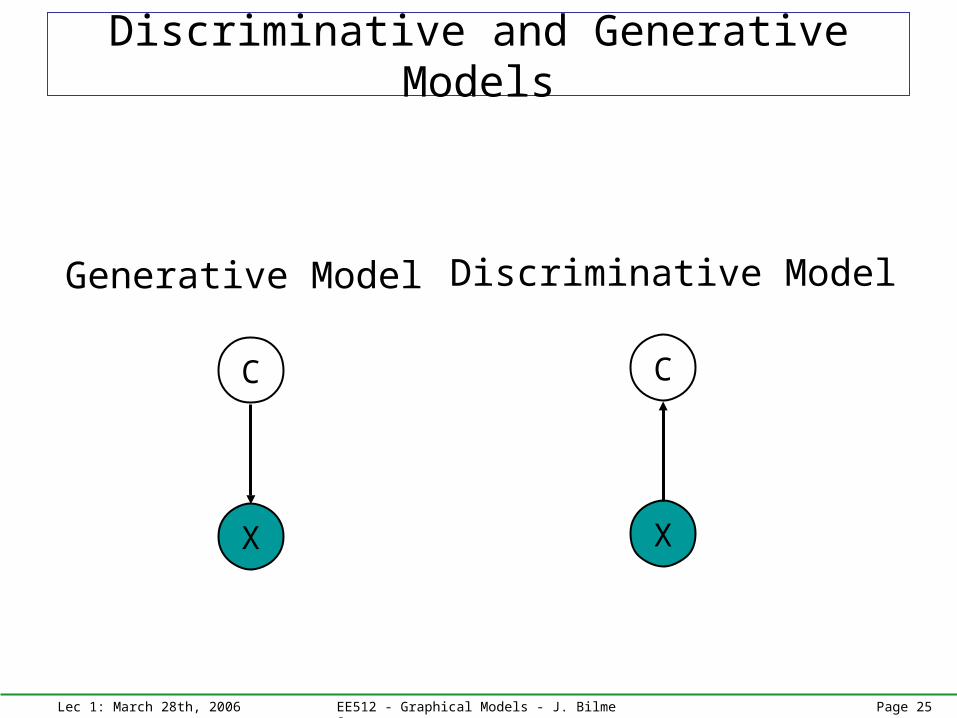
C
X
C
X
Generative Model Discriminative Model
Discriminative and Generative Models
Lec 1: March 28th, 2006 EE512 - Graphical Models - J. Bilmes Page 26
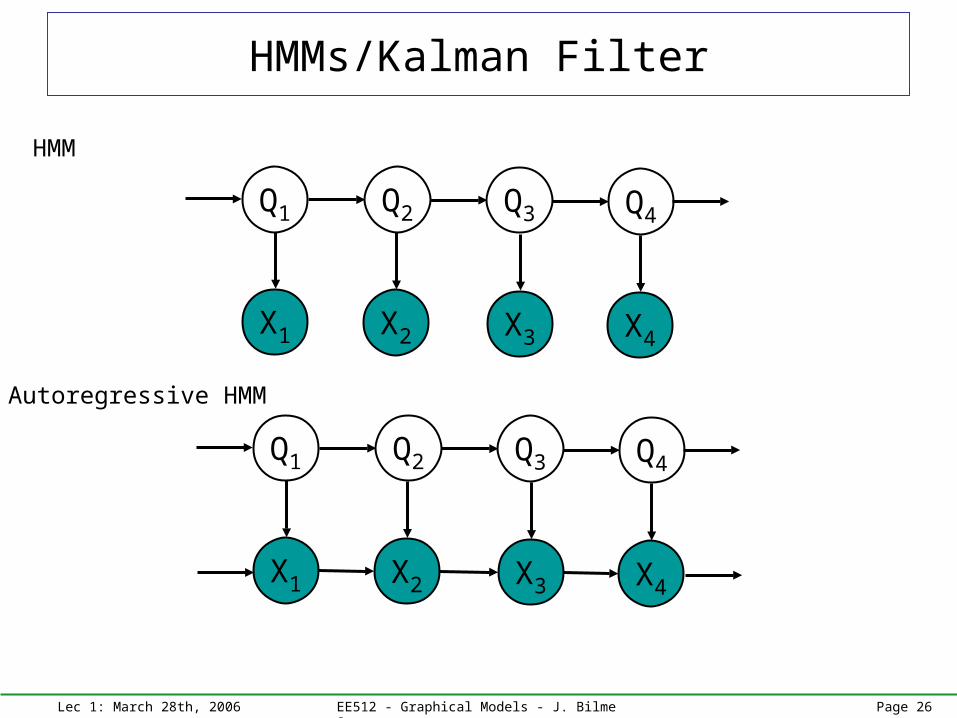
HMMs/Kalman Filter
Q1 Q2 Q3 Q4
X1 X2 X3 X4
Q1 Q2 Q3 Q4
X1 X2 X3 X4
HMM
Autoregressive HMM

Lec 1: March 28th, 2006 EE512 - Graphical Models - J. Bilmes Page 27
Switching Kalman Filter
S1 S2 S3 S4
X1 X2 X3 X4
Q1 Q2 Q3 Q4
Lec 1: March 28th, 2006 EE512 - Graphical Models - J. Bilmes Page 28
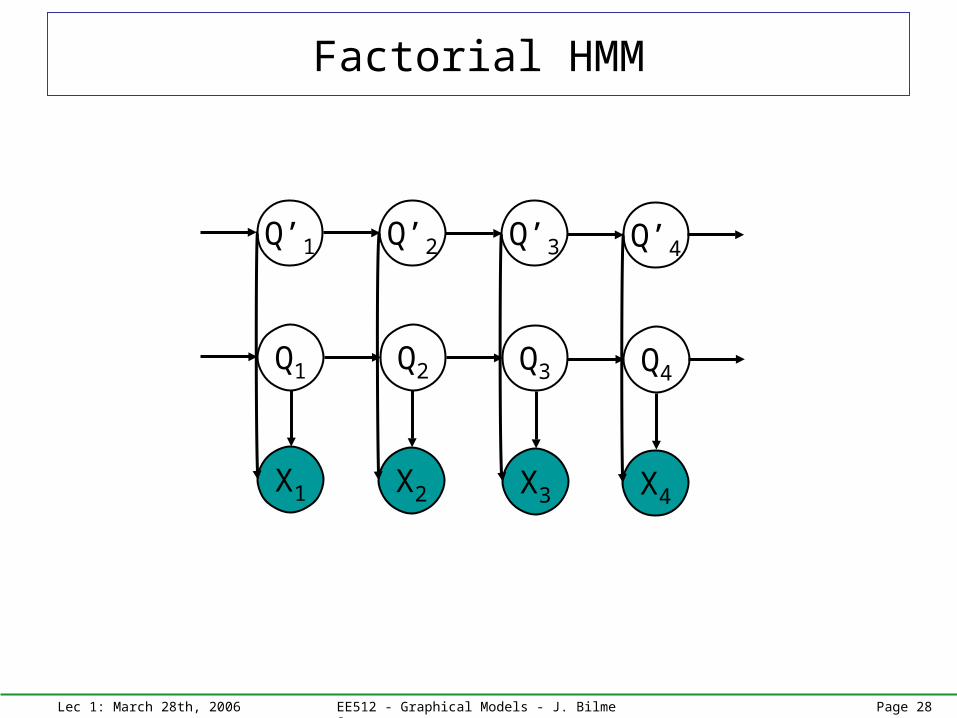
Factorial HMM
Q1 Q2 Q3 Q4
X1 X2 X3 X4
Q’1 Q’2 Q’3 Q’4
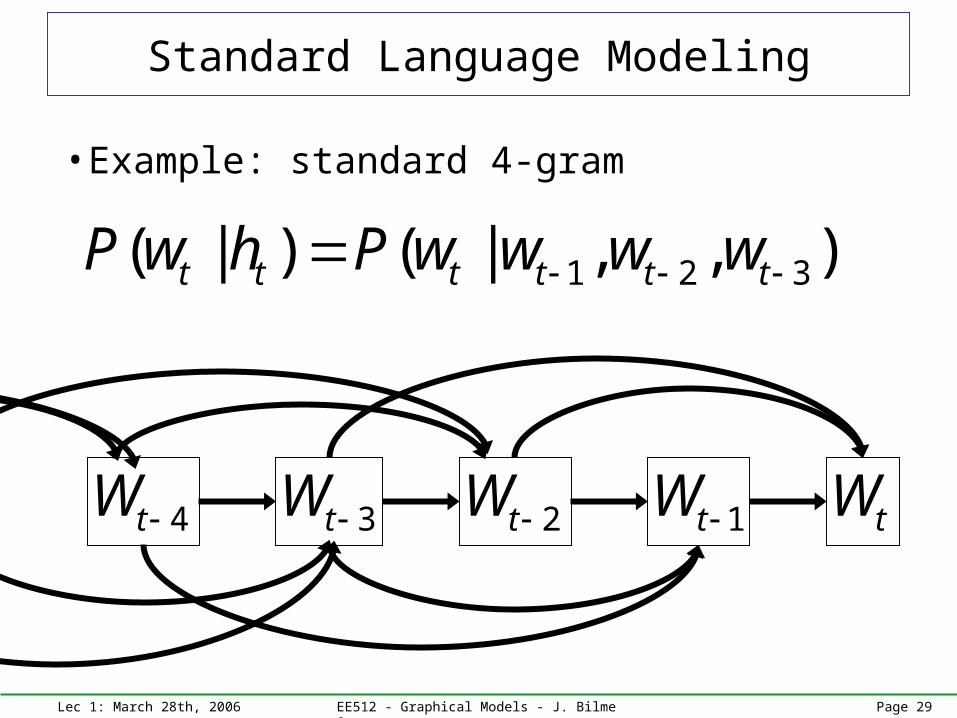
Lec 1: March 28th, 2006 EE512 - Graphical Models - J. Bilmes Page 29
1 2 3( | ) ( | , , )t t t t t tP w h P w w w w
• Example: standard 4-gram
tW1tW 2tW 3tW 4tW
Standard Language Modeling
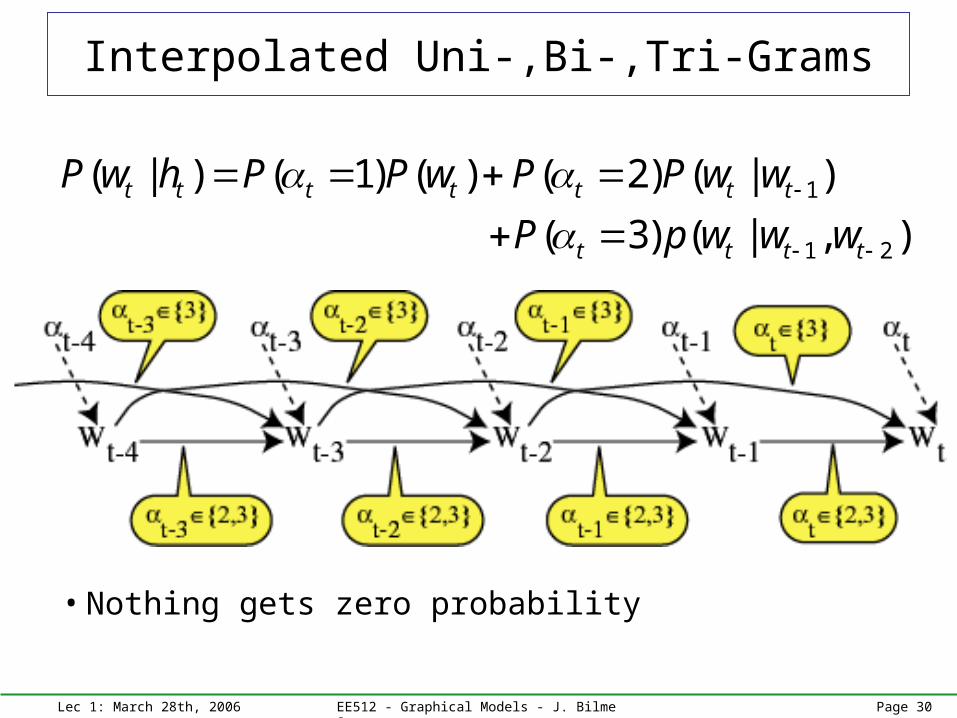
Lec 1: March 28th, 2006 EE512 - Graphical Models - J. Bilmes Page 30
1
1 2
( | ) ( 1) ( ) ( 2) ( | )
( 3) ( | , )t t t t t t t
t t t t
P w h P P w P P w w
P p w w w
• Nothing gets zero probability
Interpolated Uni-,Bi-,Tri-Grams

Lec 1: March 28th, 2006 EE512 - Graphical Models - J. Bilmes Page 31
1 2
1 2 1
1 2 1 2
( | ) ( 1| , ) ( )
( 2 | , ) ( | )
( 3 | , ) ( | , )
t t t t t t
t t t t t
t t t t t t
P w h P w w P w
P w w P w w
P w w p w w w
Conditional mixture tri-grams
Lec 1: March 28th, 2006 EE512 - Graphical Models - J. Bilmes Page 32
Bayesian Networks
• … and so on• We need to be more formal about what BNs mean.• In the rest of this, and in the next, lecture, we start with basic
semantics of BNs, move on to undirected models, and then come back to BNs again to clean up …
Lec 1: March 28th, 2006 EE512 - Graphical Models - J. Bilmes Page 33
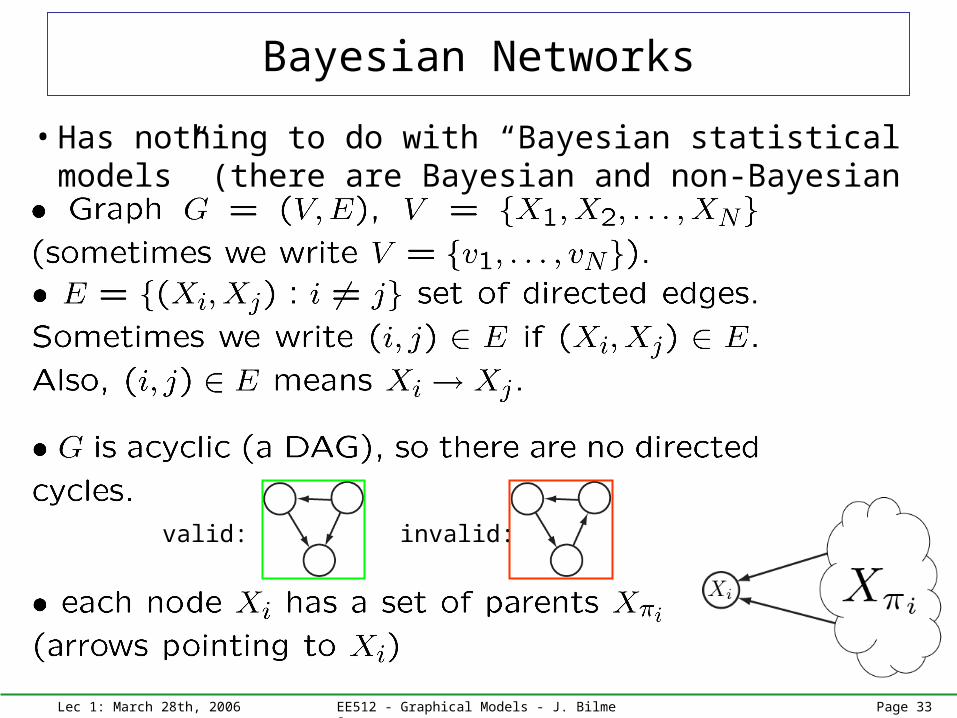
Bayesian Networks
• Has nothing to do with “Bayesian statistical models” (there are Bayesian and non-Bayesian Bayesian networks).
valid: invalid:
Lec 1: March 28th, 2006 EE512 - Graphical Models - J. Bilmes Page 34
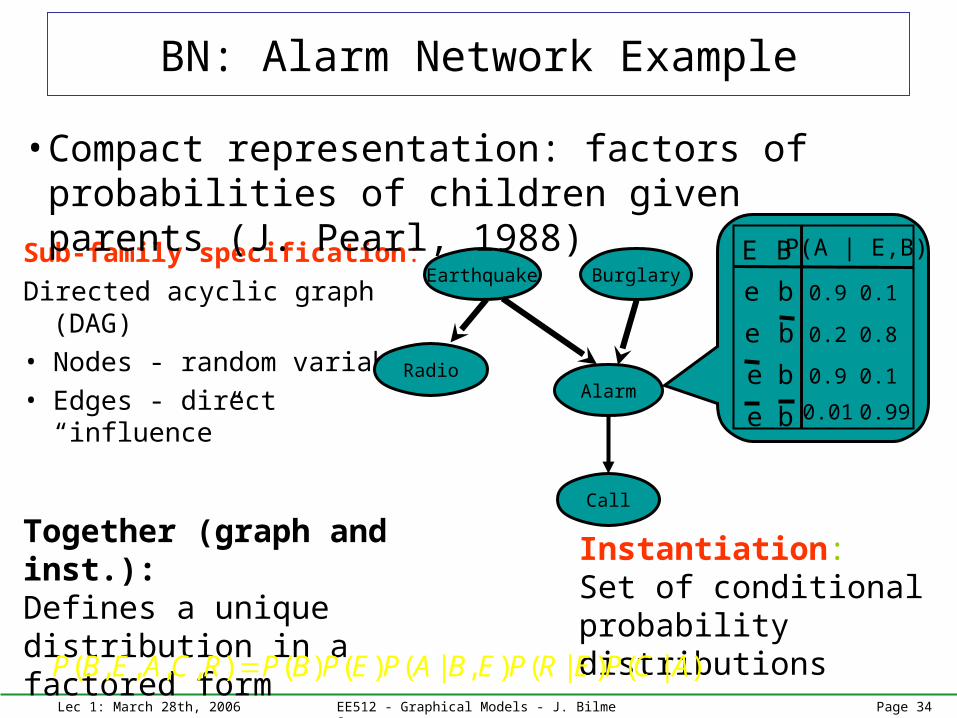
Sub-family specification:
Directed acyclic graph (DAG)• Nodes - random variables • Edges - direct “influence”
Instantiation: Set of conditional probability distributions
0.9 0.1
e
b
e
0.2 0.8
0.01 0.99
0.9 0.1
be
b
b
e
BE P(A | E,B)Earthquake
Radio
Burglary
Alarm
Call
• Compact representation: factors of probabilities of children given parents (J. Pearl, 1988)
Together (graph and inst.):Defines a unique distribution in a factored form
( , , , , ) ( ) ( ) ( | , ) ( | ) ( | )P B E A C R P B P E P A B E P R E P C A
BN: Alarm Network Example
Lec 1: March 28th, 2006 EE512 - Graphical Models - J. Bilmes Page 35
Bayesian Networks
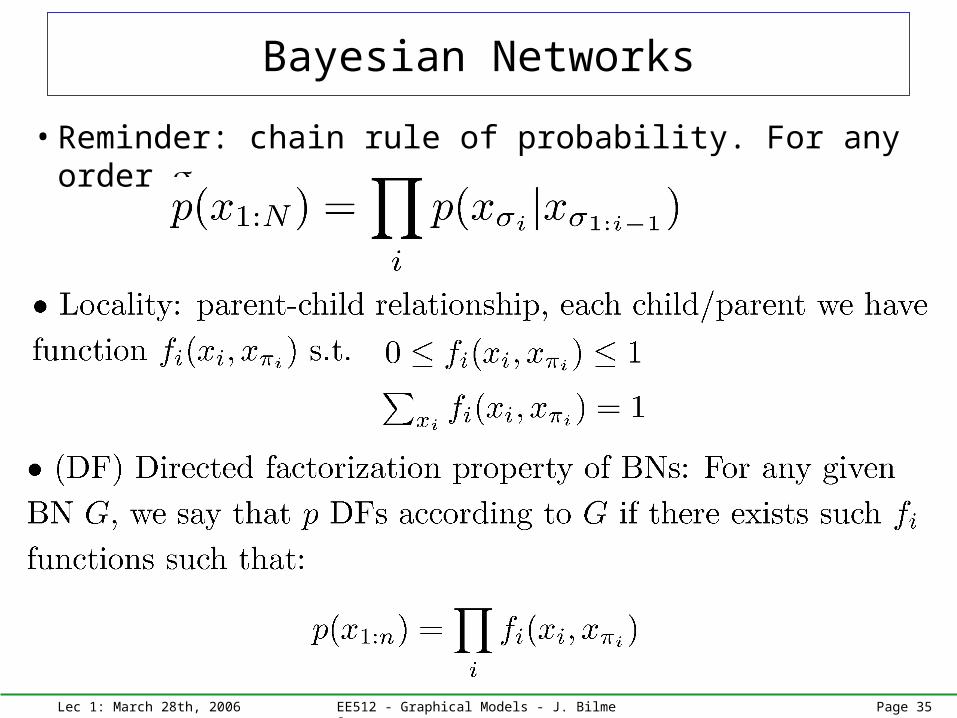
• Reminder: chain rule of probability. For any order
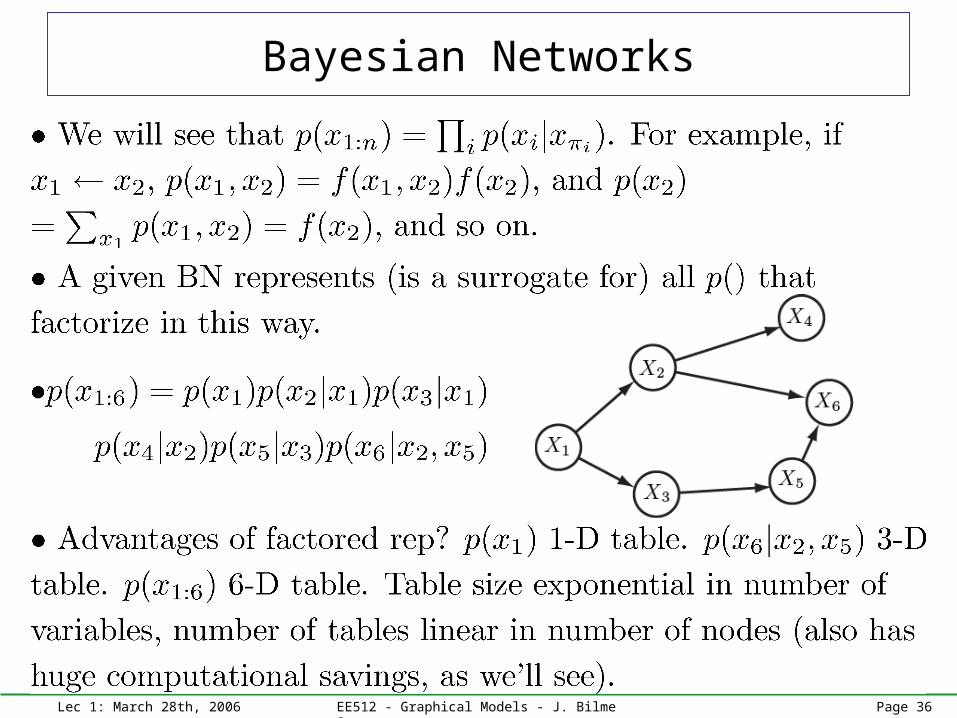
Lec 1: March 28th, 2006 EE512 - Graphical Models - J. Bilmes Page 36
Bayesian Networks
Lec 1: March 28th, 2006 EE512 - Graphical Models - J. Bilmes Page 37
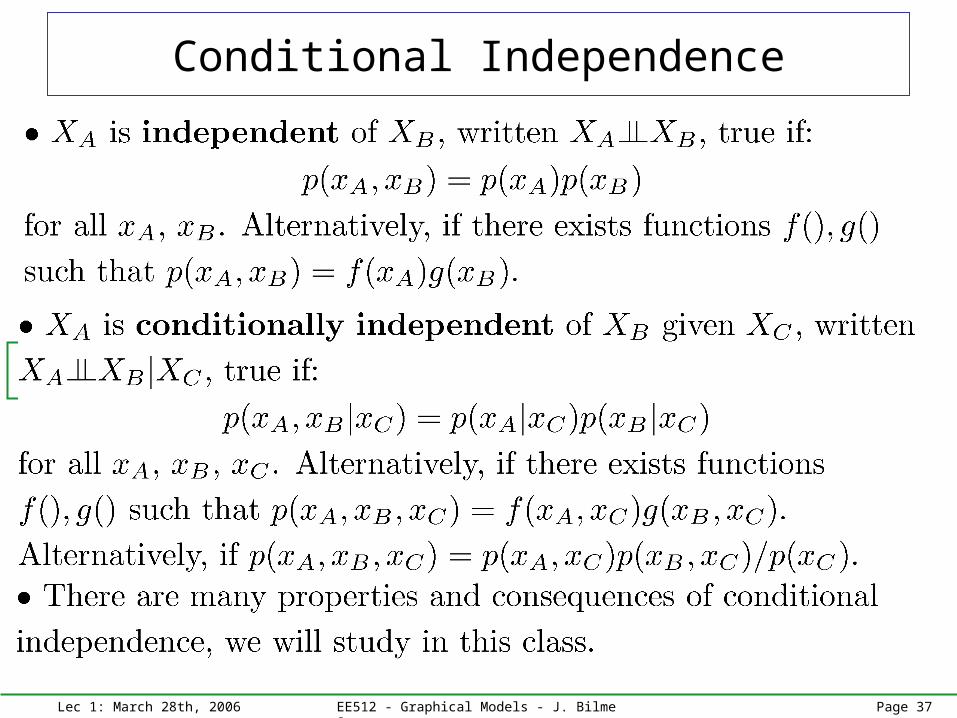
Conditional Independence
Lec 1: March 28th, 2006 EE512 - Graphical Models - J. Bilmes Page 38
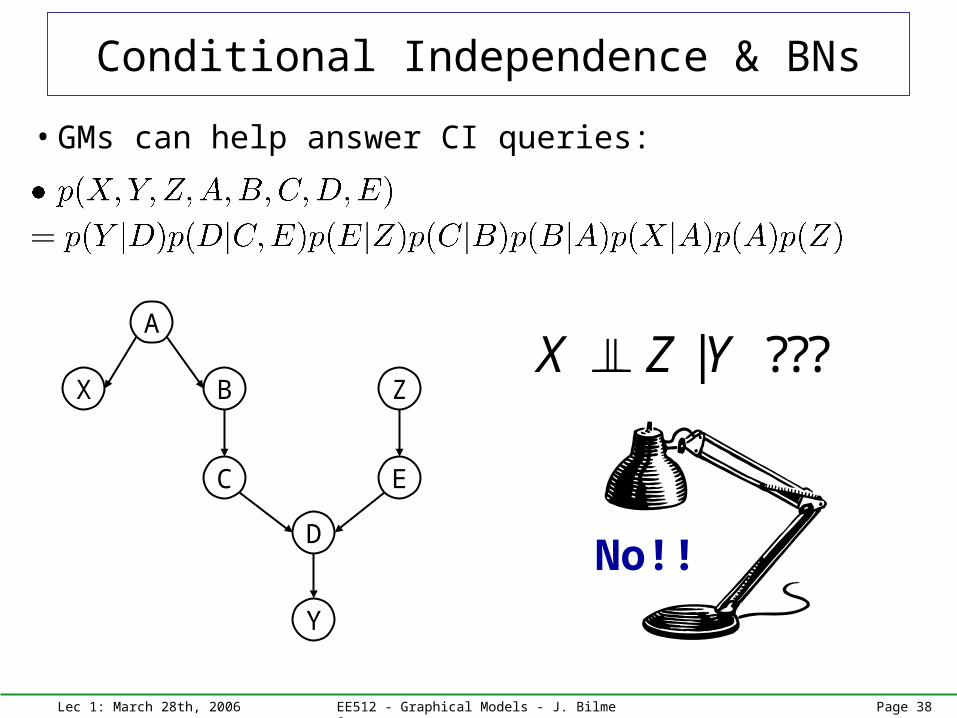
Conditional Independence & BNs
• GMs can help answer CI queries:
Y
D
C E
B ZX
A
| ???X Z Y
No!!
Lec 1: March 28th, 2006 EE512 - Graphical Models - J. Bilmes Page 39
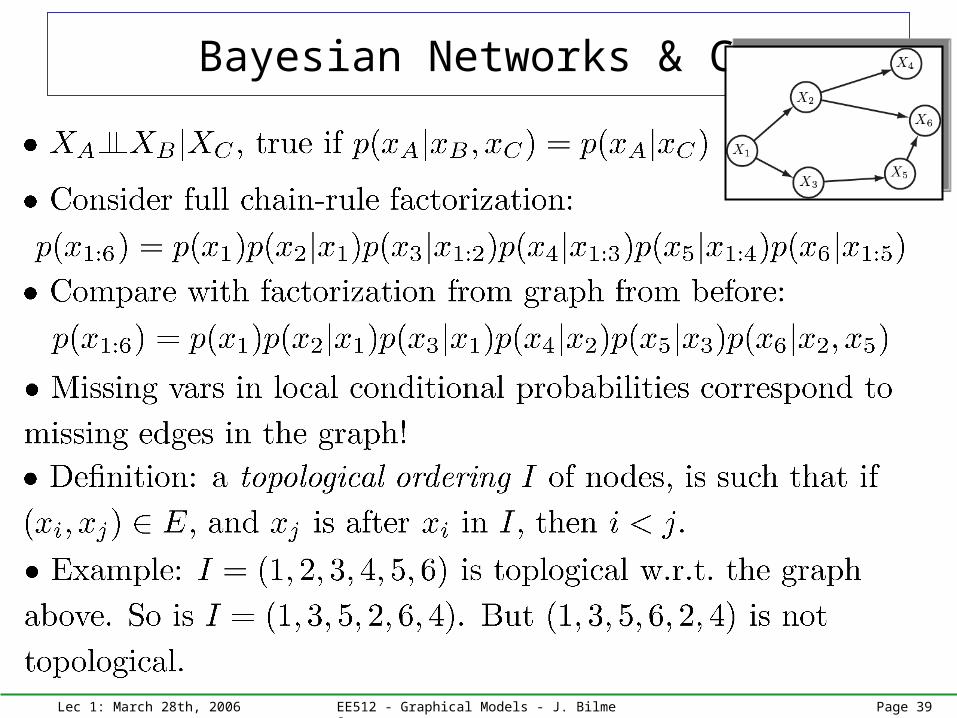
Bayesian Networks & CI
Lec 1: March 28th, 2006 EE512 - Graphical Models - J. Bilmes Page 40
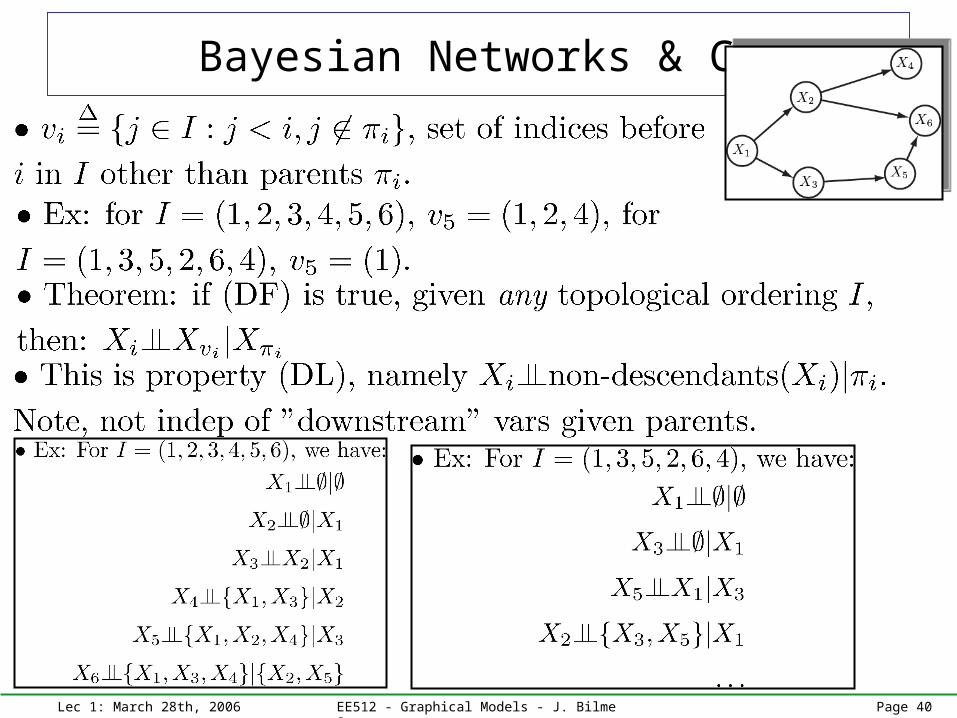
Bayesian Networks & CI
Lec 1: March 28th, 2006 EE512 - Graphical Models - J. Bilmes Page 41
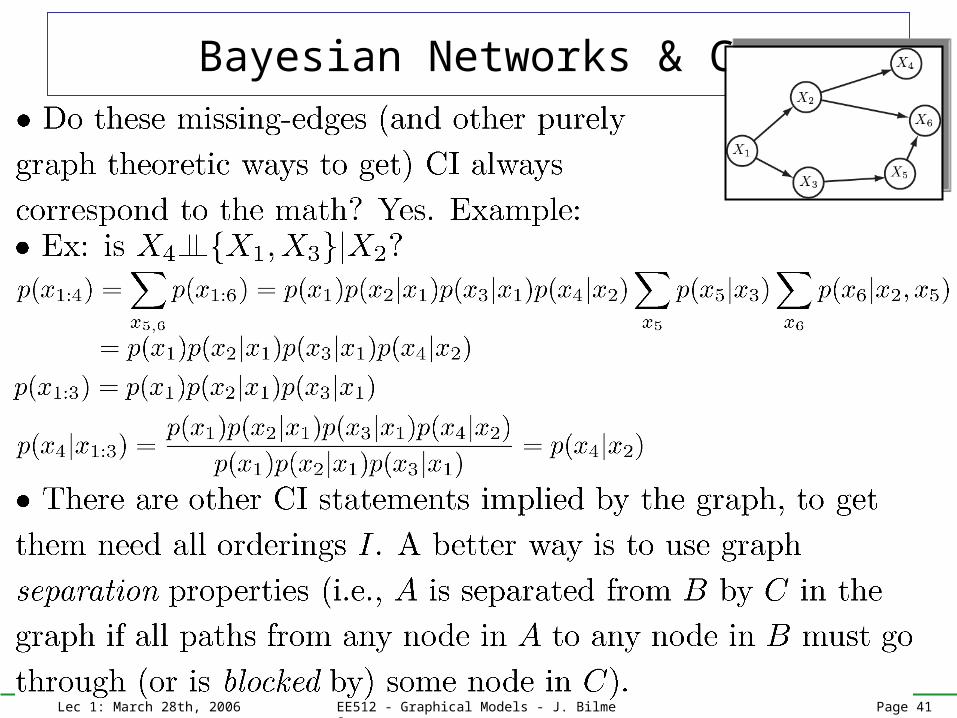
Bayesian Networks & CI

Lec 1: March 28th, 2006 EE512 - Graphical Models - J. Bilmes Page 42
Bayesian Networks & CI
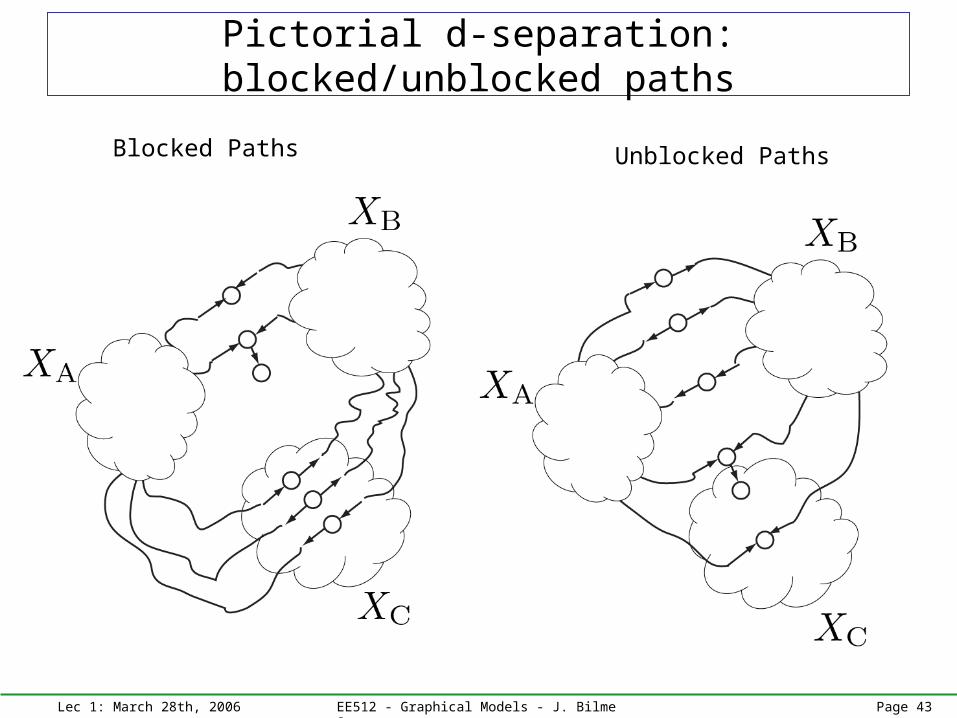
Lec 1: March 28th, 2006 EE512 - Graphical Models - J. Bilmes Page 43
Pictorial d-separation: blocked/unblocked paths
Blocked Paths Unblocked Paths
Lec 1: March 28th, 2006 EE512 - Graphical Models - J. Bilmes Page 44
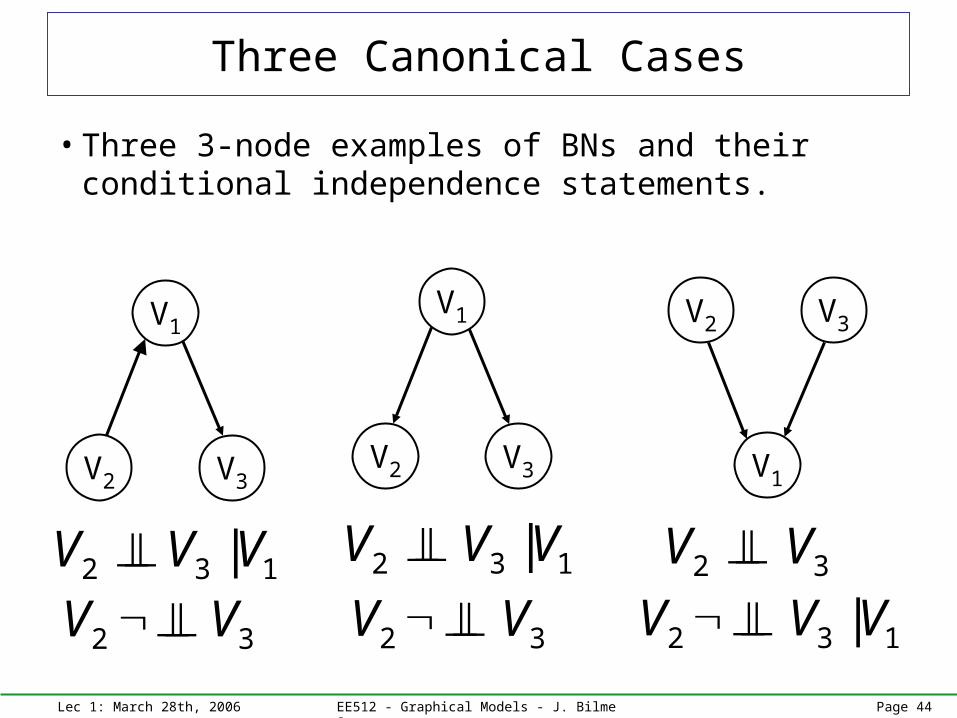
• Three 3-node examples of BNs and their conditional independence statements.
V1
V2 V3
2 3 1|V V V
V1
V2 V3
2 3V V2 3V V
2 3 1|V V V
V1
V2 V3
2 3 1|V V V
2 3V V
Three Canonical Cases

Lec 1: March 28th, 2006 EE512 - Graphical Models - J. Bilmes Page 45
Case 1
• Markov Chain
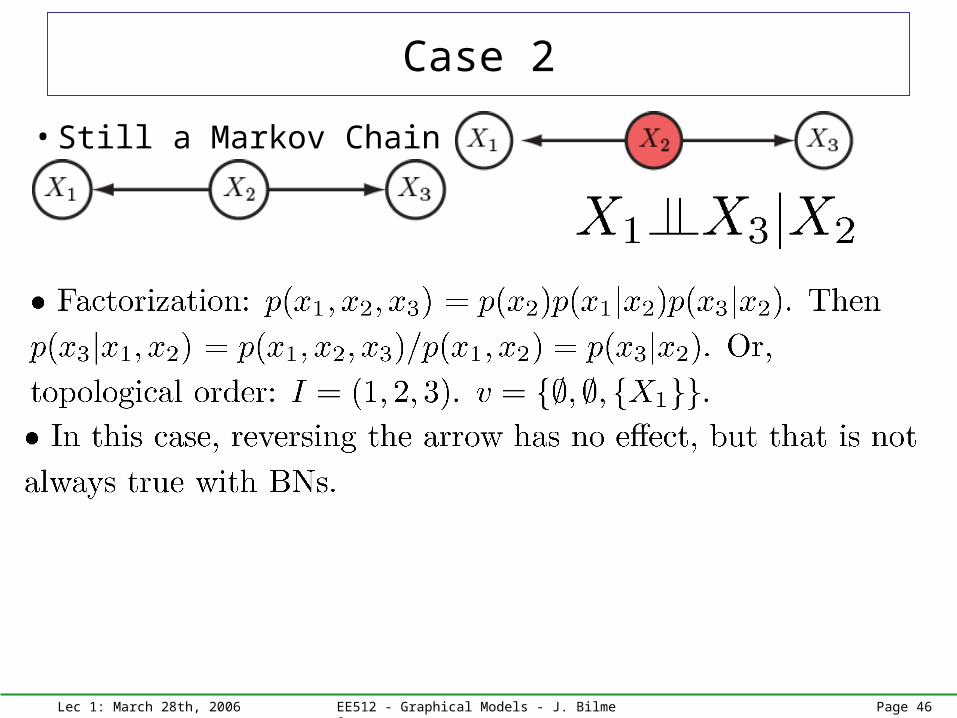
Lec 1: March 28th, 2006 EE512 - Graphical Models - J. Bilmes Page 46
Case 2
• Still a Markov Chain
Lec 1: March 28th, 2006 EE512 - Graphical Models - J. Bilmes Page 47
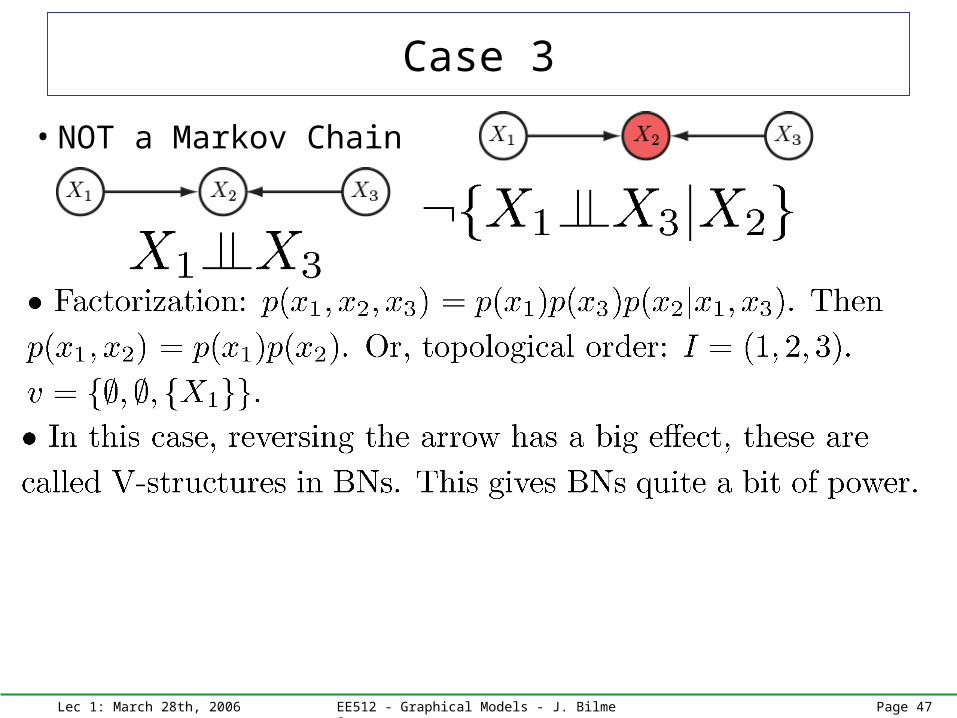
Case 3
• NOT a Markov Chain

Lec 1: March 28th, 2006 EE512 - Graphical Models - J. Bilmes Page 48
SUVsGreenhouse
GassesGlobal
Warming
LungCancer
SmokingBad
Breath
Genetics Cancer Smoking
Examples of the three cases
Lec 1: March 28th, 2006 EE512 - Graphical Models - J. Bilmes Page 49
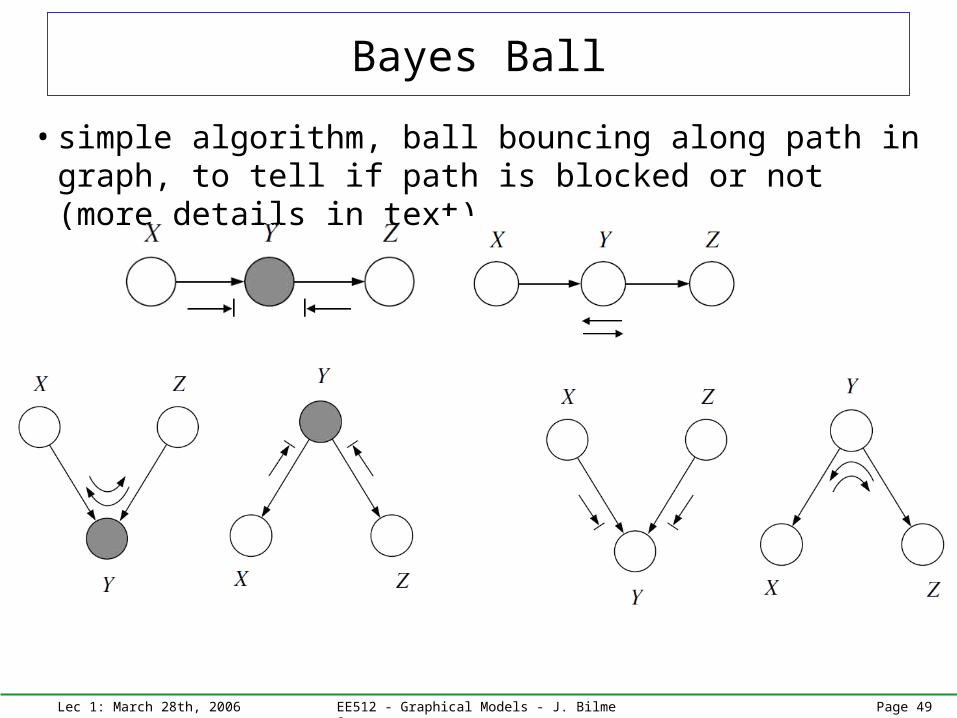
Bayes Ball
• simple algorithm, ball bouncing along path in graph, to tell if path is blocked or not (more details in text).
Lec 1: March 28th, 2006 EE512 - Graphical Models - J. Bilmes Page 50
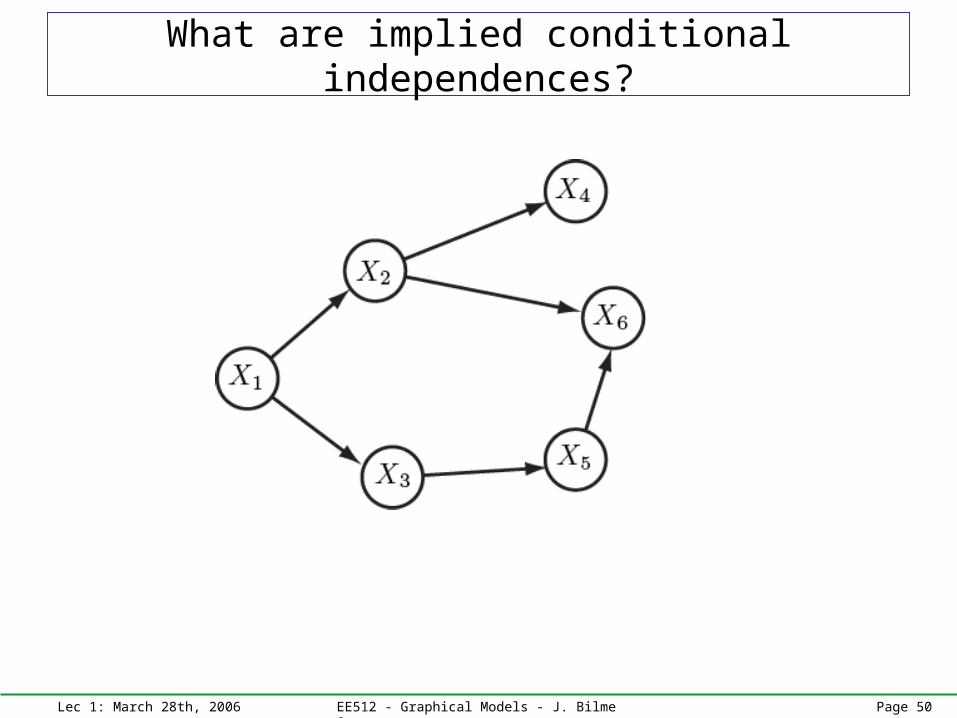
What are implied conditional independences?
Lec 1: March 28th, 2006 EE512 - Graphical Models - J. Bilmes Page 51
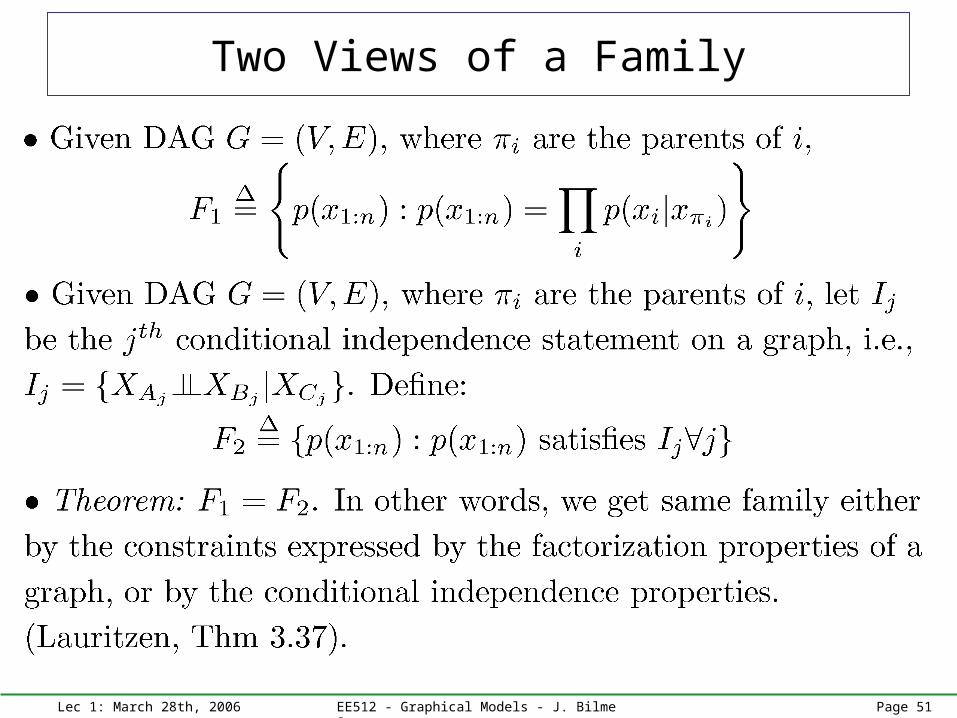
Two Views of a Family
Related Documents