SEPTIEMBRE / OCTUBRE 2016 Empresa de asesoramiento financiero (EAFI) inscrita con el número 191 en el Registro de la CNMV Paseo de la Castellana 13, 2º izda. Madrid www.lebris.es SHALUQA 2016

LeBris EAFI: Global Outlook, Notes About Spanish Economy and LCP Sectors
Apr 11, 2017
Welcome message from author
This document is posted to help you gain knowledge. Please leave a comment to let me know what you think about it! Share it to your friends and learn new things together.
Transcript

SEPTIEMBRE / OCTUBRE 2016Empresa de asesoramiento financiero (EAFI) inscrita con el número 191 en el Registro de la CNMV
Paseo de la Castellana 13, 2º izda. Madrid
www.lebris.es
SHALUQA 2016

2
1. GLOBAL OUTLOOK
2. NOTES ABOUT SPANISH ECONOMY
3. LCP SECTORS: SENSE & SENSIBILITY

3
GLOBAL OUTLOOK

4
WHERE WE ARE…

-6
-4
-2
0
2
4
6
1996 1998 2000 2002 2004 2006 2008 2010 2012 2014 2016
Global Economic Growth
Upswing
Downswing
5
…AND WHERE WE ARE GOING
#1. LEVEL
#2. TREND
6
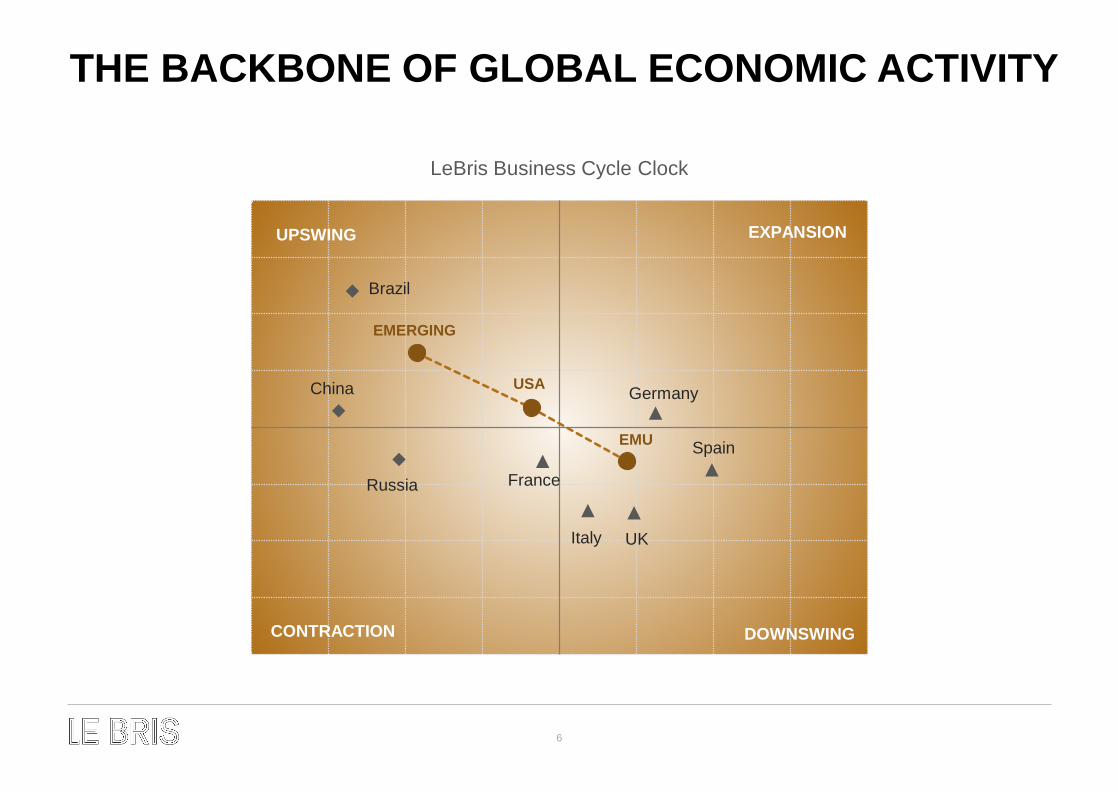
THE BACKBONE OF GLOBAL ECONOMIC ACTIVITY
LeBris Business Cycle Clock
EXPANSION
DOWNSWING
UPSWING
CONTRACTION
EMERGING
USA
EMU
Brazil
China
Russia
UK
France
Italy
Spain
Germany
7
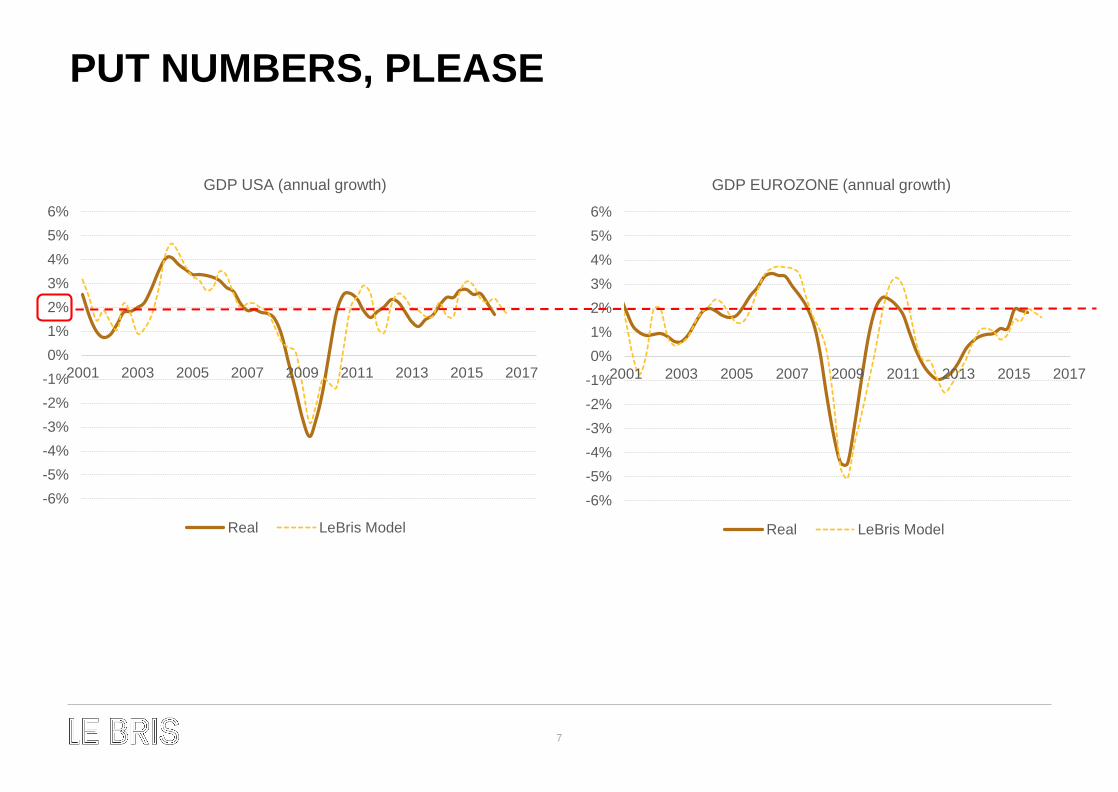
PUT NUMBERS, PLEASE
-6%-5%-4%-3%-2%-1%0%1%2%3%4%5%6%
2001 2003 2005 2007 2009 2011 2013 2015 2017
GDP USA (annual growth)
Real LeBris Model
-6%-5%-4%-3%-2%-1%0%1%2%3%4%5%6%
2001 2003 2005 2007 2009 2011 2013 2015 2017
GDP EUROZONE (annual growth)
Real LeBris Model

8
9
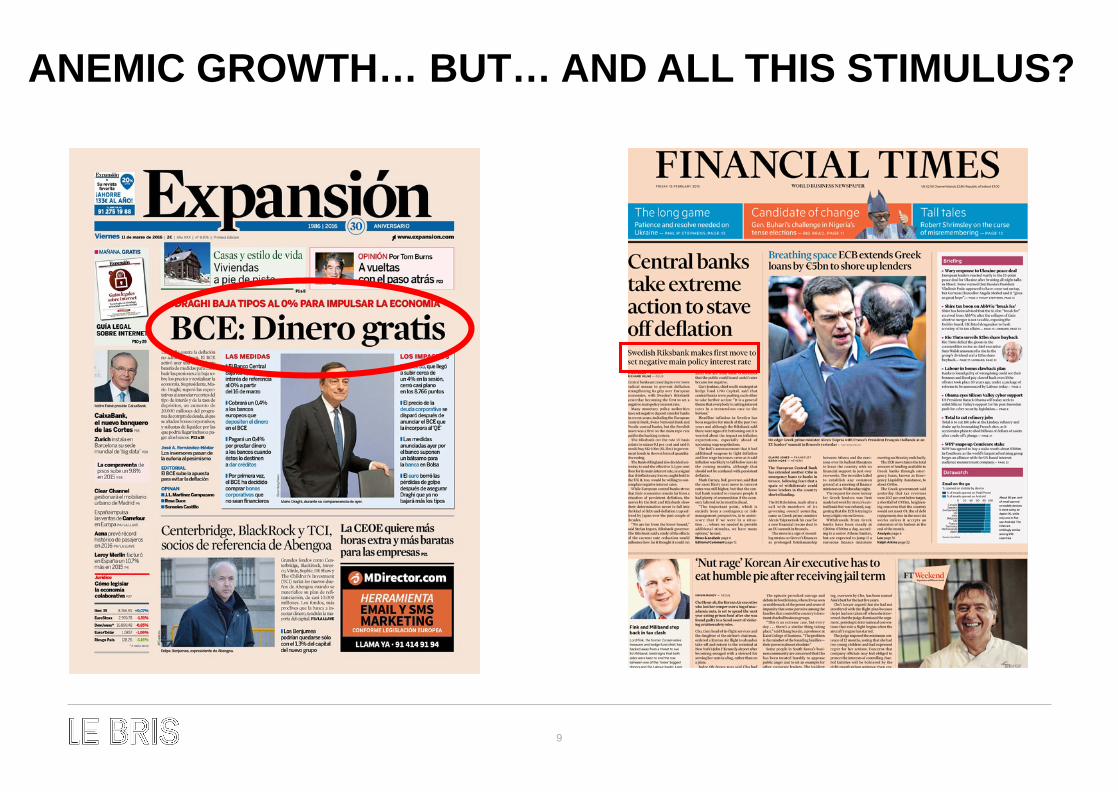
ANEMIC GROWTH… BUT… AND ALL THIS STIMULUS?
10
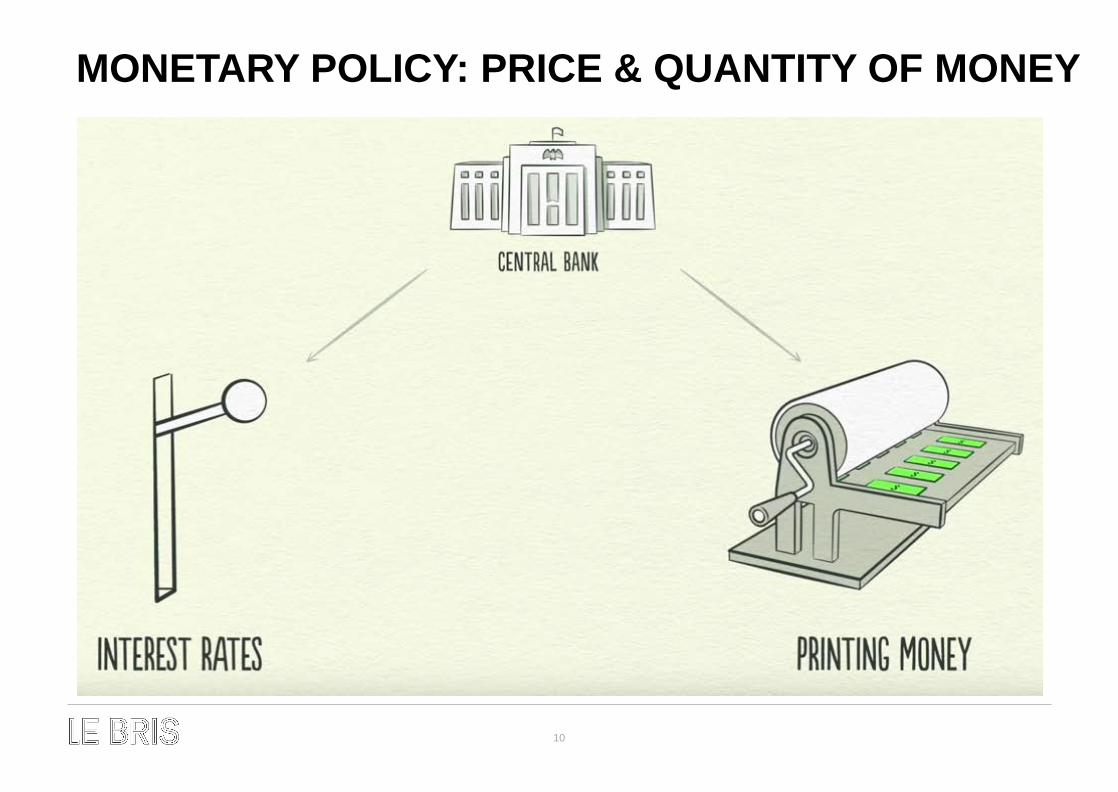
MONETARY POLICY: PRICE & QUANTITY OF MONEY

11
DO YOU KNOW THE “BALANCE SHEET RECESSION”?
ASSETS LIABILITIES
CAPITAL
DEBTREAL ESTATE

12
BEFORE & AFTER A BALANCE SHEET RECESSION
INTEREST RATE
GDP GROWTH
INFLATION
Before Balance Sheet Recession: range +2% +4%
After Balance Sheet Recession: range -1% +2%

13
ECONOMIC CYCLE ANALYSIS IN USA
Number MEAN MAX MIN MEAN MAX MINEXPANSION 11 21 39 4 24,4% 53,7% 4,4%RECESSION 11 3,5 6 2 -2,1% -4,2% -0,1%
Duration (number of quarters) Amplitude (the percent change in real GDP)
0
5
10
15
20
25
30
35
40
45
MAX. CURRENT MEAN
DURATION OF ECONOMIC EXPANSIONS (number of quarters)
0%
10%
20%
30%
40%
50%
60%
MAX. CURRENT MEAN
AMPLITUDE OF ECONOMIC EXPANSIONS (% change in real gdp)

14
ECONOMIC CYCLE ANALYSIS IN USA
-2%
0%
2%
4%
6%
8%
10%
GDP PRIVATECONSUMPTION
PUBLICCONSUMPTION
ANDINVESTMENT
PRIVATEINVESTMENT
EXPORTS IMPORTS
REAL GDP AND COMPONENTS (annual growth)
Expansions Current cycle

15
NOTES ABOUT SPANISH ECONOMY

16
The recovery strengthened in 2015 and 2016, with growth above the euro area average
Private consumption:1. Steadily improving labour market conditions.2. The increase in gross disposable income.3. Favourable credit conditions.4. Low inflation.5. High consumer confidence.
Investment:1. Positive internal and external demand prospects.2. Improvements in the situation of balances. 3. Favourable credit conditions.
External demand:1. Good competitiveness. 2. Strength of the export market in the euro zone.3. Imports suported by domestic demand.
Public Sector: 1. Strong Bruselas pressure. 2. Difficulties at regional level3. Political uncertainty
2015 2016 2017
GDP 3,2% 2,8% 2,3%Private consumption 3,1% 3,1% 2,1%Public Consumption 2,7% 1,5% 1,2%Investment 6,4% 4,6% 3,8%Domestic demand (*) 3,8 3 2,3Exports 5,4% 4,8% 5,0%Imports 7,5% 5,5% 5,2%External demand (*) -0,6 -0,2 0Inflation -0,6 -0,5 1Employment (annual growth) 3 2,5 2Unemployment rate (% labour force) 22,1 19,8 18,4General government balance (% GDP) -5,1 -3,7 -2,7General government gross debt (% GDP) 99,2 100,3 100,1Current account (% GDP) 1,4 1,1 0,9* Contribution to GDP growthSource: OECD (june 2016)
17
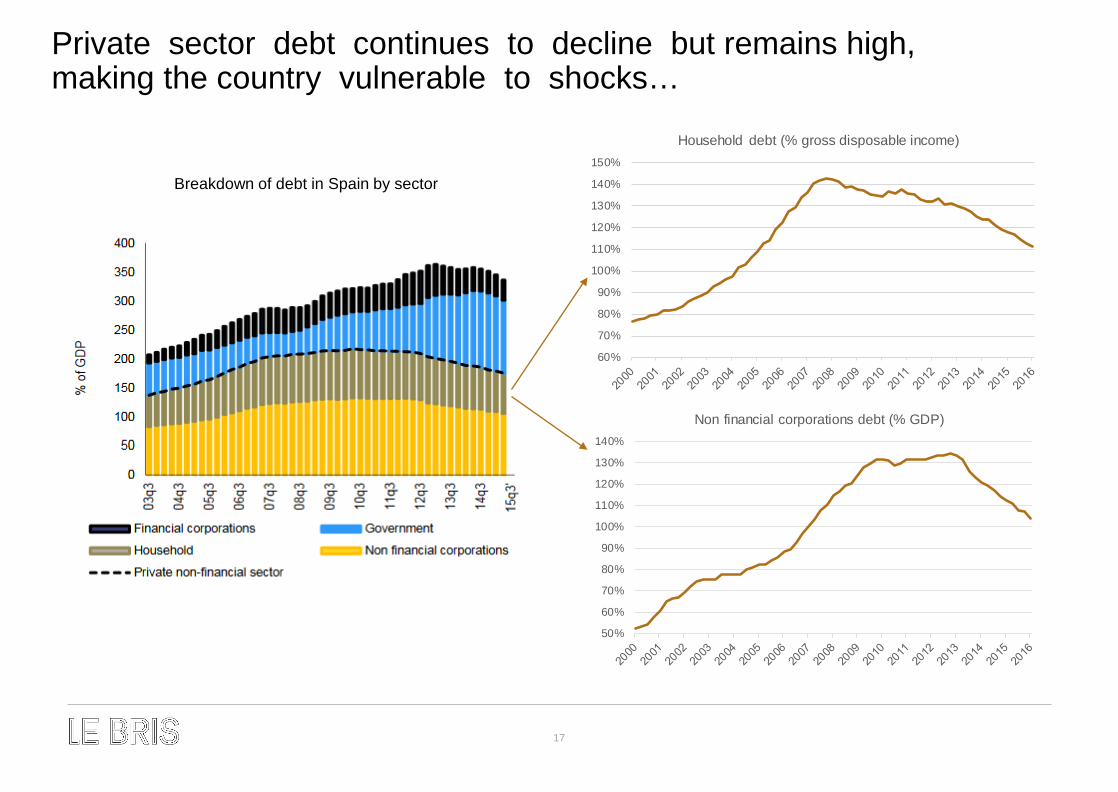
Private sector debt continues to decline but remains high, making the country vulnerable to shocks…
60%
70%
80%
90%
100%
110%
120%
130%
140%
150%
Household debt (% gross disposable income)
50%
60%
70%
80%
90%
100%
110%
120%
130%
140%
Non financial corporations debt (% GDP)
Breakdown of debt in Spain by sector

18
… low potential growth amplifies the risks related to macroeconomic imbalances.
-0,5
0
0,5
1
1,5
2
2,5
3
3,5
1983-1990 1991-2000 2001-2007 2008-2014 2015-2020
The contribution of labour, capital, and TFP to potential growth
Labour Capital TPF
Potential GDP growth Output gap

19
LCP SECTORS: SENSE & SENSIBILITY
20
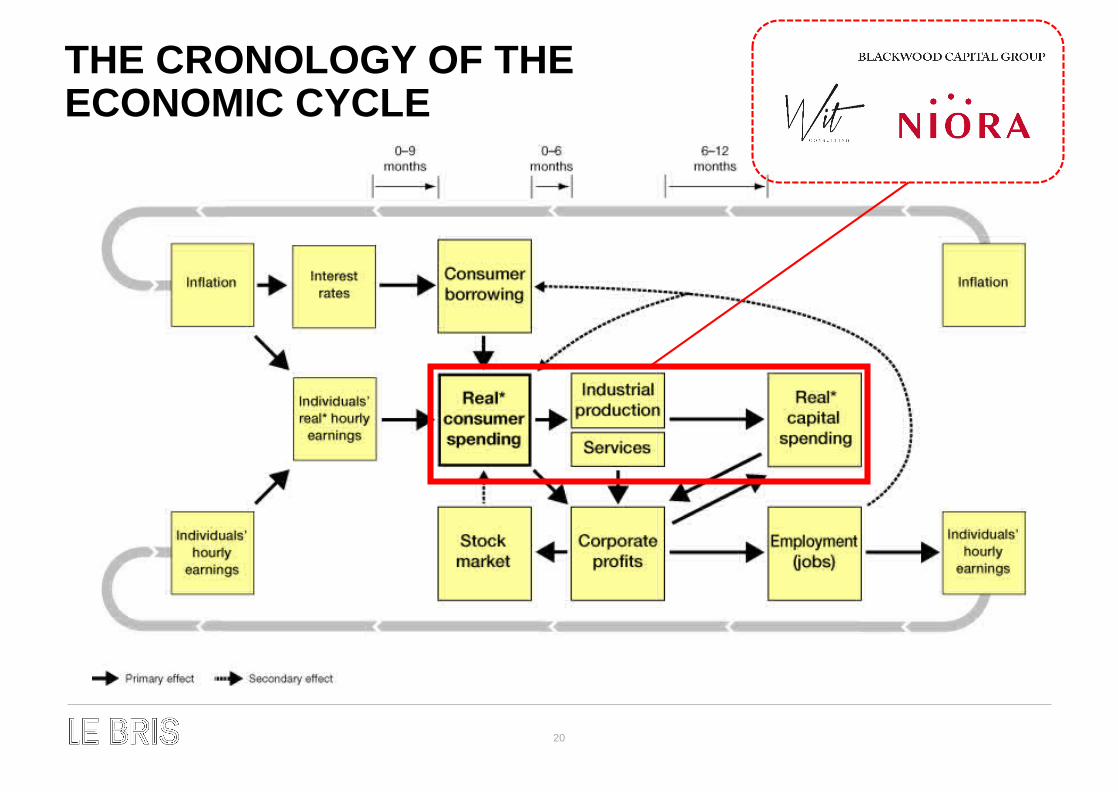
THE CRONOLOGY OF THE ECONOMIC CYCLE

21
FORECASTING FOR YOUR OWN INDUSTRYIS FORECASTING AT THE MICRO LEVEL A REALISTIC PROSPECT?
Some industries are far more subject to unpredictable domestic and international political events than to cyclical economic inputs (i.e. Defense and Energy sectors).
Some of the largest industries serving consumers´nondiscretionary social needs (healtt care, pharma, education) are inherently noncyclical. They are driven more by demographic, consumer needs.
Other industries, including several in the consumer spending category, are subject to some extent to economic variables but are driven to a much greater extent by new fashions or hits (athletic foot wear, women´s appareal, entertainment companies).
Still other industries are on such rapid growth curves that, during their highest-growth phases, the effect of economic cycle is not visible on their operating results (technology).

22
FORECASTING FOR YOUR OWN INDUSTRYSTART WITH DEDUCTIVE REASONING, FINISH WITH A CHART
Simple deductive reasoning goes a long way in giving us a starting point for developing a charted historical cause-and-effect relationship.
If the relationship can be shown visually to exist, it may prove rewarding in predicting the business demand cycles for a specific industry or even the sales of an individual company

23
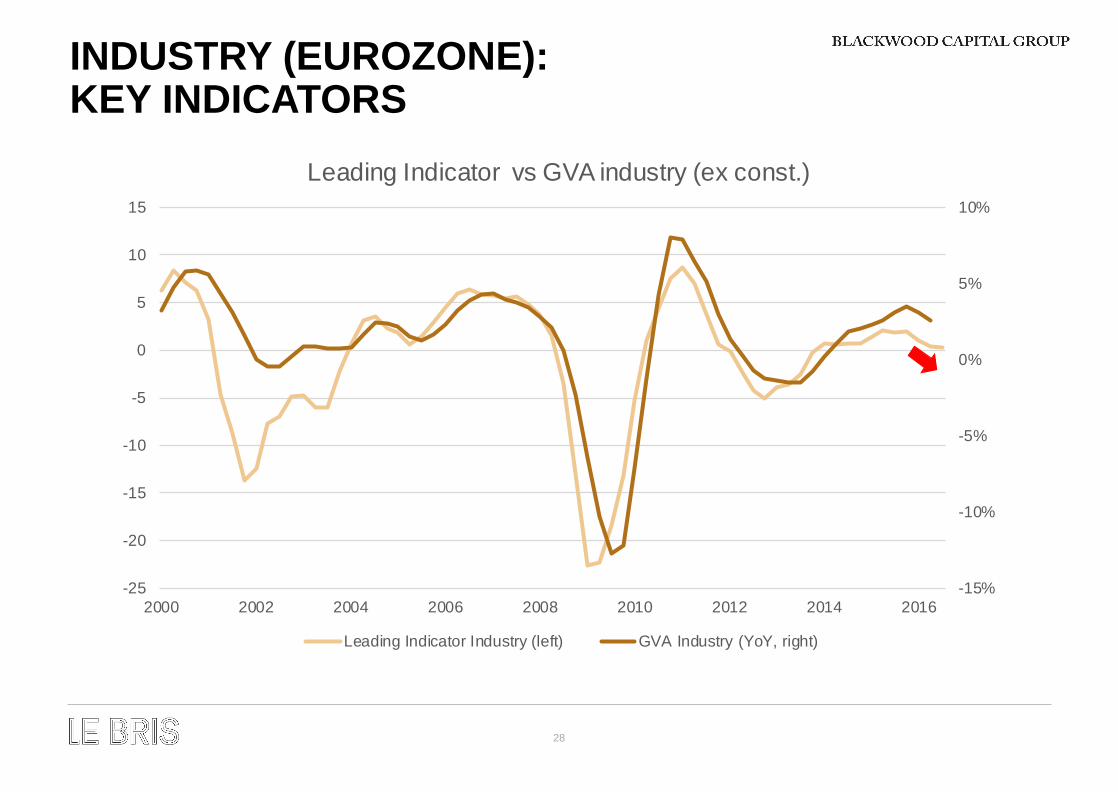
INDUSTRY (EUROZONE): KEY INDICATORS
24
YEAR 1 YEAR 2 YEAR 3 YEAR 4
+2
+4
+6
+8
+10
+12
-2
-4
-6
-8
Industrial Production
Real Capital Spending
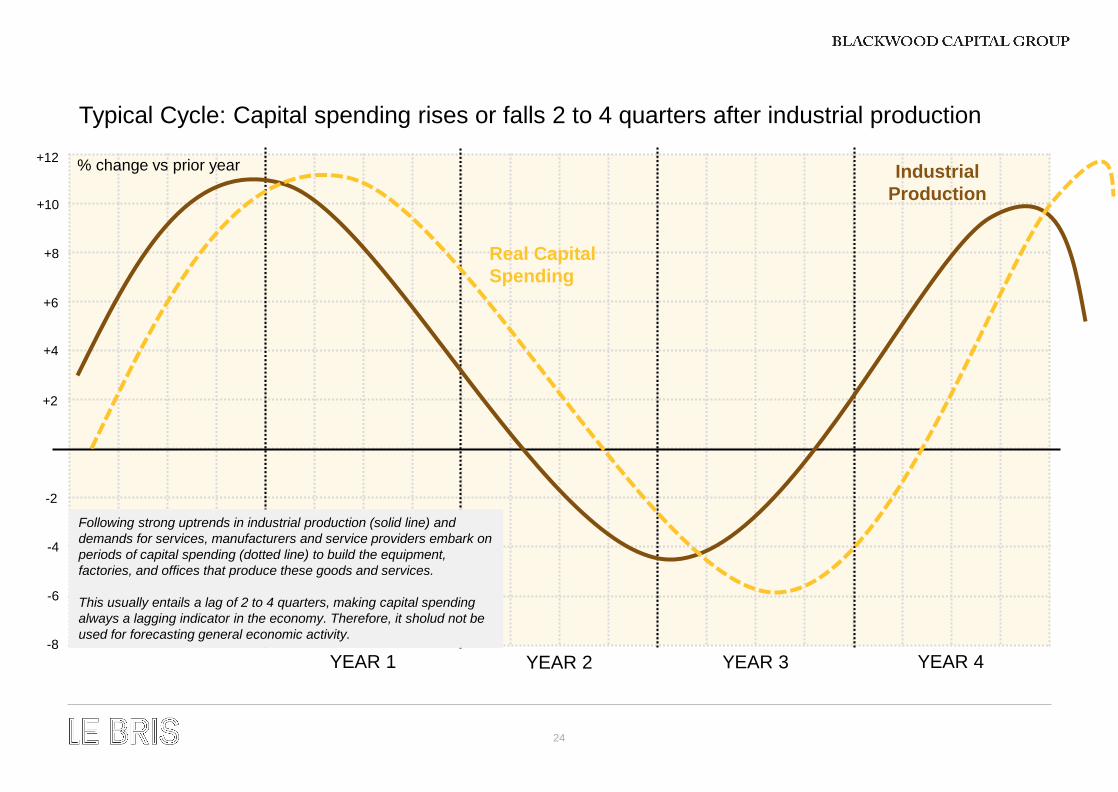
Typical Cycle: Capital spending rises or falls 2 to 4 quarters after industrial production
Following strong uptrends in industrial production (solid line) and demands for services, manufacturers and service providers embark on periods of capital spending (dotted line) to build the equipment, factories, and offices that produce these goods and services.
This usually entails a lag of 2 to 4 quarters, making capital spending always a lagging indicator in the economy. Therefore, it sholud not be used for forecasting general economic activity.
% change vs prior year

25
YEAR 1 YEAR 2 YEAR 3 YEAR 4
+2
+4
+6
+8
+10
+12
-2
-4
-6
-8
Real Consumer Spending
Real Capital Spending
Typical Cycle: Major swings in capital spending lag moderate changes in consumer spending by 2 to 4 quarters
Moderate changes in consumer spending drive volatile swings in industrial production, and the volatile capital spending cycle lags these swings by 2 to 4 quarters.
Consequently, moderate changes in real consumer spending (solid line) also lead more volatile swings in real capital spending (dotted line) by 2 to 4 quarters
% change vs prior year

26
INDUSTRY (EUROZONE): KEY INDICATORS
Industrial production: equipment goods index
Capital goods imports
Industrial production trend
Key Indicators Industry
New Orders / Inventories
Employment expectations industry sector

27
INDUSTRY (EUROZONE): KEY INDICATORS
-25
-20
-15
-10
-5
0
5
10
Leading indicator industry sector - Level
-20
-15
-10
-5
0
5
10
15
Leading indicator industry sector - Trend
Mean
Upswing
Downswing
Jan. Feb. Mar. Apr. May. Jun. Jul. Aug. Sep. Oct. Nov. Dec. Jan. Feb. Mar. Apr. May. Jun. Jul. Aug. Sep. Oct. Nov. Dec. Jan. Feb. Mar. Apr. May. Jun. Jul. Aug. Equipment goods PI. 2 1 1 -1 0 -1 2 -3 0 0 -2 0 0 1 1 1 2 2 1 3 1 3 1 0 3 0 -1 1 -1 0 -2
Capital goods Imp. -4 -3 -2 -2 -1 0 1 0 1 1 1 1 2 2 2 2 2 2 1 1 1 1 1 1 1 0 -1 -1 -2 -2
Production trend 2 3 4 2 3 2 1 2 0 0 1 0 1 0 1 2 1 0 3 1 1 3 2 2 2 0 0 0 2 0 2 -1
New orders / Inventories 1 2 1 2 2 1 1 1 1 1 2 1 1 1 2 2 2 2 2 2 2 2 2 3 2 1 1 2 2 2 3 1
Employment Exp. 2 2 2 2 2 2 2 2 2 1 1 2 3 3 3 3 4 4 3 3 4 3 4 4 2 2 2 3 3 4 4 4
2014 2015 2016
00
28
INDUSTRY (EUROZONE): KEY INDICATORS
-15%
-10%
-5%
0%
5%
10%
-25
-20
-15
-10
-5
0
5
10
15
2000 2002 2004 2006 2008 2010 2012 2014 2016
Leading Indicator vs GVA industry (ex const.)
Leading Indicator Industry (left) GVA Industry (YoY, right)

29

30

31
CONSUMER GOODS / RETAIL (SPAIN): KEY INDICATORS

32
A SIMPLE FORMULA FOR CONSUMER SPENDINGWage growth, and not employment, is a leading indicator of consumer spending
WAGES PER
WORKER
NUMBER OF
WORKERS
TOTAL WAGES
AND SALARIES
REAL CONSUMER SPENDING
LEADING INDICATOR
LAGGING INDICATOR
X
equals
Which drives

33
YEAR 1 YEAR 2 YEAR 3 YEAR 4
+2
+4
-2
Real personal consumption expenditures
Real average hourly earnings
Typical Cycle: How real average hourly earnings lead real consumer spending
Changes in individuals´year over year real average hourly earnings (dotted line) –usually ranging form -2% to +3% - have typically been a reliable indicator of broader swings in real consumer spending (solid line). And because stock market declines have often correlated with the early stages of consumer-spending slowdowns, real hourly earnings have also been a useful leading indicator of stock market direction, particulary before bear markets.
% change vs prior year+6 BEAR MARKET BEAR MARKET

34

35
CONSUMER GOODS / RETAIL (SPAIN): KEY INDICATORS
Key IndicatorsConsumer
Goods / Retail
Retail sales
Industrial production: consumer goods index
Consumer goods imports
Consumer confidence
Business retail sector confidence
Employment expectations retail sector

36
-25
-20
-15
-10
-5
0
5
10
Leading indicador retail sector - Level
-10-8-6-4-202468
10
Leading indicator retail sector - Trend
Mean
Upswing
Downswing
Jan. Feb. Mar. Apr. May. Jun. Jul. Aug. Sep. Oct. Nov. Dec. Jan. Feb. Mar. Apr. May. Jun. Jul. Aug. Sep. Oct. Nov. Dec. Jan. Feb. Mar. Apr. May. Jun. Jul. Aug. Retail Sales 1 0 0 1 1 1 0 1 1 2 3 7 5 4 4 4 4 3 4 4 6 7 5 3 4 5 5 5 4 6 6
Consumer goods PI. 5 4 1 4 4 2 3 0 2 3 -1 1 -4 -1 4 0 1 1 3 3 3 5 5 3 7 5 0 3 2 5 2
Consumer goods Imp. -4 -3 -1 0 1 1 2 3 2 3 2 1 1 1 1 1 0 0 -1 -1 -1 -1 -1 0 -1 0 0 0 0 0
Consumer Confidence 1 0 3 3 4 5 3 4 2 2 1 4 6 6 8 9 8 7 7 6 6 7 7 10 7 6 4 5 5 6 4 4
Retal Confidence 8 6 9 9 9 8 8 10 9 8 9 10 10 10 10 10 10 9 9 9 8 10 10 10 10 9 8 7 8 7 9 7
Employment Exp. -3 -3 2 3 5 -2 1 5 1 6 6 8 5 3 9 4 7 7 5 3 7 6 10 8 8 8 7 4 5 6 6 4
2014 2015 2016
CONSUMER GOODS / RETAIL (SPAIN): KEY INDICATORS

37
-5%
-4%
-3%
-2%
-1%
0%
1%
2%
3%
4%
5%
6%
-25
-20
-15
-10
-5
0
5
10
2000 2002 2004 2006 2008 2010 2012 2014 2016
Leading Indicator vs GVA retail sector
Leading Indicator Retail Sector (left) GVA Trade, Transport and Accommodation (right)
CONSUMER GOODS / RETAIL (SPAIN): KEY INDICATORS
YoY

38
CONSTRUCTION / REAL ESTATE: KEY INDICATORS

39
CONSTRUCTION / REAL ESTATE (SPAIN): KEY INDICATORS
Industrial production: construction index
Cement consumption
Building permits
New construction orders
Employment expectations construction sector
Home sales
Home prices
Consumer expectations
Wages
CONSTRUCTION REAL ESTATE

40
-25
-20
-15
-10
-5
0
5
Leading construction / real estate - Level
Construction
Housing-14
-12
-10
-8
-6
-4
-2
0
2
4
6Leading construction / real estate - Trend
Construction
Housing
Upswing
Downswing
Mean
Construction Jan. Feb. Mar. Apr. May. Jun. Jul. Aug. Sep. Oct. Nov. Dec. Jan. Feb. Mar. Apr. May. Jun. Jul. Aug. Sep. Oct. Nov. Dec. Jan. Feb. Mar. Apr. May. Jun. Jul. Aug. Construcction PI. 7 10 10 10 7 4 4 4 3 3 4 3 2 0 -1 0 0 1 0 0 1 1 0 2 3 3 2 0 1 2 3
Cement consumption -8 -8 -6 -5 -4 -3 -2 -1 0 1 1 2 3 3 3 4 5 5 4 4 4 4 4 4 4 4 3 2 2
Building permits -4 -5 -3 -2 -1 -1 0 0 1 2 2 1 2 5 4 5 5 6 5 6 6 6 8 10 10 10 10 9
New construction orders -10 -8 -9 -9 -8 -10 -7 -7 -5 -3 -5 -5 -4 -3 -5 -6 -4 -4 -5 -4 -5 -4 -3 -4 -5 -3 -6 -7 -5 -6 -6 -7
Employment Exp. -4 -5 -4 -5 -4 -7 -2 -1 -1 0 1 0 -1 0 1 0 0 -2 -1 0 -2 0 0 1 -1 0 -3 -1 -3 -4 -3 -3
Housing Jan. Feb. Mar. Apr. May. Jun. Jul. Aug. Sep. Oct. Nov. Dec. Jan. Feb. Mar. Apr. May. Jun. Jul. Aug. Sep. Oct. Nov. Dec. Jan. Feb. Mar. Apr. May. Jun. Jul. Aug.
Home sales 10 10 10 4 4 4 4 4 4 5 5 5 2 2 2 4 4 4 4 4 4 1 1 1 5 5 5
Home prices -12 -12 -11 -10 -10 -10 -11 -11 -11 -9 -9 -9 -11 -11 -11 -8 -8 -8 -8 -7 -7 -7 -7 -7 -7 -7 -7
Consumer expectations -8 -8 -8 -8 -8 -8 -8 -8 -8 -9 -9 -9 -8 -8 -8 -7 -7 -7 -7 -7 -7 -7 -7 -7 -6 -6 -6 -7 -7 -7 -5 -5
Wages -11 -11 -11 -8 -8 -8 -6 -6 -6 -6 -6 -5 -3 -3 -3 -2 -2 -2 -1 -1 -1 0 0 0 0 0 0
2014 2015 2016
CONSTRUCTION / REAL ESTATE (SPAIN): KEY INDICATORS

41
-20%
-15%
-10%
-5%
0%
5%
10%
-20
-15
-10
-5
0
5
10
2000 2001 2002 2003 2004 2005 2006 2007 2008 2009 2010 2011 2012 2013 2014 2015 2016
Leading Indicator vs GVA construction
Leading Indicator Construction (left) GVA Construction (YoY, right)
CONSTRUCTION / REAL ESTATE (SPAIN): KEY INDICATORS
Related Documents