Learning Pulse D. Di Mitri, M. Scheffel, H. Drachsler, D. Börner, S. Ternier, M. Specht A machine learning approach for predicting performance in self-regulated learning using multimodal data Paper presentation at LAK17 15th March 2017, Vancouver, Canada

Welcome message from author
This document is posted to help you gain knowledge. Please leave a comment to let me know what you think about it! Share it to your friends and learn new things together.
Transcript

Learning PulseD. Di Mitri, M. Scheffel, H. Drachsler, D. Börner, S. Ternier, M. Specht
A machine learning approach forpredicting performance in self-regulated
learning using multimodal data
Paper presentation at LAK17
15th March 2017, Vancouver, Canada

Outline
1. Background, context, vision
2. Our approach
3. Data collection
4. Data analysis
5. Conclusions
Pagina 2

Data deluge in education
Pagina 3

Collecting learning experiences
Picture from tincanapi.com
Pagina 4

Pagina 5
Learning happening across spaces

Context: Self Regulated LearningSelf-Regulated Learning → no guidance → no feedback → no support
Pagina 6

Vision: machine learning approach
y = f(X)
LearningPerformance(output space)
Predictive Model
Multimodal Data(input space)
Pagina 7

Our approach
Pagina 8

Research questions(RQ-MAIN) How can we store, model and analysemultimodal data to predict performance in human learning?
(RQ1) Which architecture allows the collection and storage of multimodal data in a scalable and efficient way?
(RQ2) What is the best way to model multimodal data to apply supervise machine learning techniques?
(RQ3) Which machine learning model is able to produce learner specific predictions on multimodal data?
Pagina 9

Participants
• 9 PhD students at Welten institute
• Different disciplines
• Different working setups:– Time
– Tasks
– Operating systems
Pagina 10

Experimental timeline
Pagina 11
Phase 0 Pre-testSystem architecture tested
Phase 1Training3 weeks of data collection
Phase 2Validation2 weeks of data collection and prediction

Input space – multimodal data
Pagina 12
Context
Body
ActivitiesBody: physiological (heart-rate)
and physical responses (steps) - from Fitbit HR
Activities: applications used during learning from RescueTime
Context: weather data from OpenWeatherMap

Output space – Flow Csikszentmihalyi, 1972
Pagina 13
Theoretical Empirical

Activity Rating Tool
ProductivityHow productive was
last activity?
StressHow stressful was
last activity?
ChallengeHow challenging was
last activity?
AbilitiesHow prepared did you
feel for the activity?
FLOW
Participants rate hourly, from 7AM to 7PM
A scalable web app!
Client: Bootstrap + JquerySever: GoogleApp + Python
“Very easy to use!”
Pagina 14

Data collection
Pagina 15
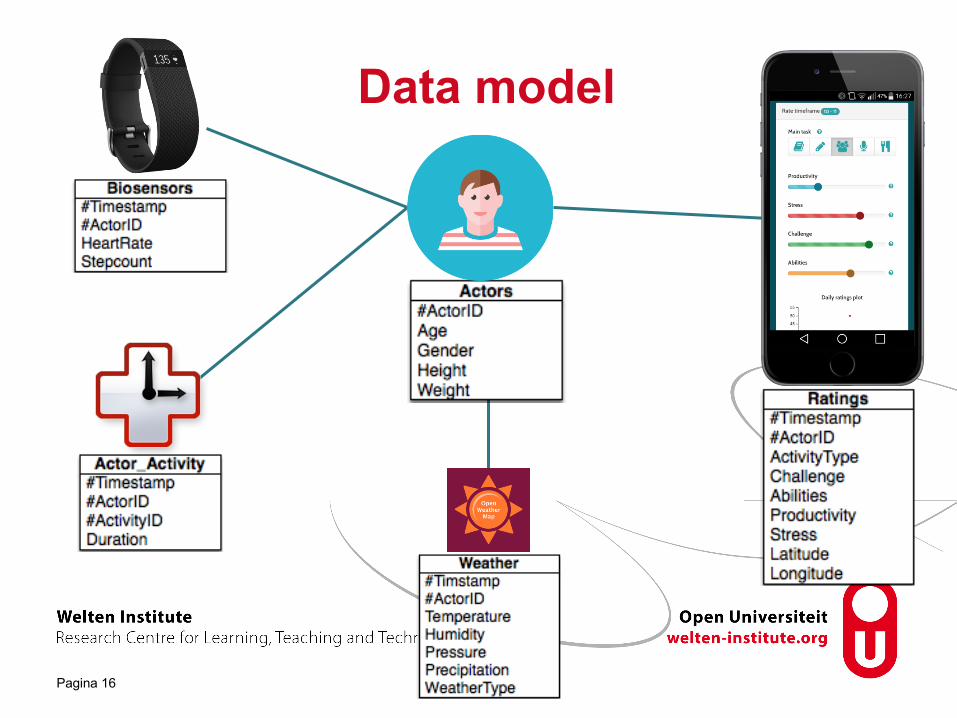
Data model
Pagina 16

Berg, A., Scheffel, M., Drachsler, H., Ternier, S. & Specht, M. (2016). The Dutch xAPI Experience. Proceedings of the 6th International Conference on Learning Analytics and Knowledge (LAK’16), April 25-29, 2016, Edinburgh, UK.
Data storing format for the Learning Record StoreExperience API
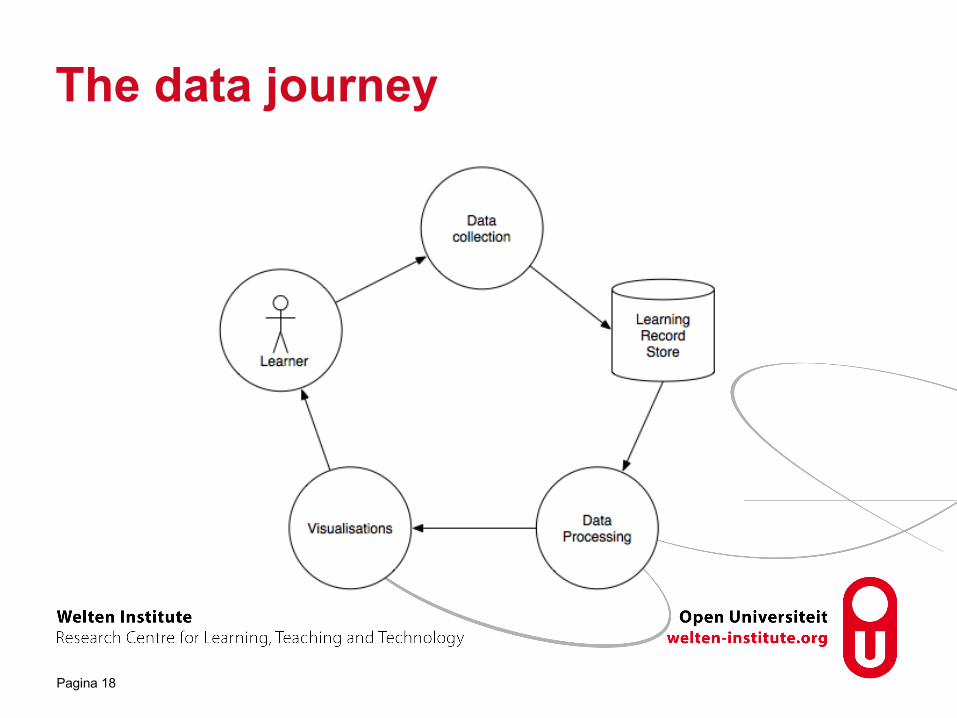
The data journey
Pagina 18

Complex architecture
Pagina 19

Data collection
• PULL data from the 3rd party APIs• Make the xAPI triples
• PUSH data in the LRS
• It’s scalable! • No collisions• It’s fast• It’s Interoperable
Learning Pulse Server +
Learning Record Store
Pagina 20

Data Processing ApplicationScript in Python running on a VM which processes data in real time
Pagina 21

Data Analysis
Pagina 22

Transformed dataset
• Time Series: tabular representation
• 5 minutes intervals
• Enough samples now!
• Easier view for Machine Learning
• Signal resampling needed
9410observations
X29 attributes
Pagina 23

Issue 1) Feature extraction from Time Series
Heart Rate Variability and Heart Rate Entropy… didn’t work
SOLUTION
• Mean of the signal• Maximum• Minimum• Standard Deviation• Average change
Hea
rt-ra
te s
igna
l for
15
min
s
Pagina 24

Issue 2) Activity data very sparseRule based grouping of applications
Learners’ activity can be compared!
Applications used are too sparse
SOLUTIONLet’s create
application categories
Pagina 25

Issue 3) Number of labels available
Trade-off:
number of labelsvs
Seamlessness of the data collections
NO SOLUTION
Pagina 26

Issue 5) Random vs continuous data
Independence constraint
Knowing one value of et for one observation does not help us to guess value of et+1
yt = α + βX t + et
cov(et ,et+1) = 0
FIXED Effect
RANDOM Effect
SOLUTION follows...
Pagina 27

Mixed Effect Linear Model
x0 x1 x2 ... xn-1 xn g y
t0 x x x ... x x 1 y
t1 x x x ... x x 1 y
t2 x x x ... x x 2 y
t... ... ... ... ... ... ... 2 y
tp-1
x x x x x x 3 y
tp ? ? --- --- --- --- x ?
Random EffectsFixed Effects Group
Used R-squared for goodness-test
LIMITATIONS
● Convergence time● Mono-output
Pagina 28

Issue 6) Inter-subject variabilityi.e. Participants have rated very differently
SOLUTION
Predictions are normalised wrt each
learner
xnew = (xmax – xmin) *xi/100 + xmin
Pagina 29

Conclusions
Pagina 30

RQ1) Architecture
The architecture developed was able of:
1. Importing great number of sensor data in xAPIformat;
2. combining sensor data with self-reports
3. programmatically transform xAPI data
4. train predictive models & reuse them
5. save the predictions to compare with actual values
Pagina 31

RQ2) Represent multimodal data
• Multiple Instance Representation
• Each learning sample is a 5 minute interval
• It’s suitable for machine learning
Pagina 32

RQ3) Machine learning model
• Linear Mixed Effect Models allow
1. taking into account data specific to each learner
2. distinguish between fixed and random effects
3. Take categorical data into account.
Pagina 33

Limitations
• Low accuracy of predictionsR-Square tests Stress: 0.32, Challenge: 0.22, Flow score: 0.16, Abilities: 0.08, Productivity: 0.05.
• Real-time issuesFitbit synchronisation, Virtual Machine performance
• 3rd party API constraints
• No great solution for grouping activity data (manual grouping)
Pagina 34

Opportunities
• Data driven
• Real Time feedback
• Visualisations can show feedback
• Seamless data collection
• Multimodal dataset for reserach
• Reusable architecture
Pagina 35
*Börner, Tabuenca, Storm, Happe, and Specht. 2015
Example visualisation:The Feedback Cube*

Related Documents