Special Olympics Healthy Athletes Matt Holder, MD, MBA Allen Wong, DDS, EdD, DABSCD Disclaimer • No Financial Interests any Products • No Conflicts of Interests to disclose Learning Objectives • History and Mission of Special Olympics • Core Programs of Special Olympics • Core Disciplines of Healthy Athletes • Unmet Health Needs of People with Intellectual Disabilities • Pertinent Medication Side Effects Special Olympics Then What began as a backyard activity at the home of Eunice Kennedy Shriver in 1962… …became the first Special Olympics Summer Games in Chicago,1968, and grew into…

Welcome message from author
This document is posted to help you gain knowledge. Please leave a comment to let me know what you think about it! Share it to your friends and learn new things together.
Transcript

Special Olympics Healthy Athletes
Matt Holder, MD, MBAAllen Wong, DDS, EdD, DABSCD
Disclaimer
• No Financial Interests any Products • No Conflicts of Interests to disclose
Learning Objectives
• History and Mission of Special Olympics
• Core Programs of Special Olympics
• Core Disciplines of Healthy Athletes
• Unmet Health Needs of People with Intellectual Disabilities
• Pertinent Medication Side Effects
Special Olympics Then
What began as a backyard activity at the home of Eunice Kennedy Shriver in 1962…
…became the first Special Olympics Summer Games in Chicago,1968, and grew into…
Special Olympics TodayOver 4.4 million athletes in over 170 countries
More than 600,000 athletes in the US
More than 1.3 million coaches and volunteers
More than 81,000 competitions around the
world each year
More than 220 competitions hosted each day
32 Olympic-type summer and winter sports
Mission
To provide year-round sports training and athletic competition in a variety of Olympic-type sports for children and adults with intellectual disabilities (ID), giving them continuing opportunities to develop physical fitness, demonstrate courage, experience joy and participate in a sharing of gifts, skills and friendship with their families, other Special Olympics athletes and the community.
Unified Sports ®
Unified Sports® places individuals with intellectual disabilities (athletes) and individuals without intellectual disabilities (partners) side-by-side on competitive sports teams. As the fastest growing sports initiative within Special Olympics, Unified Sports has been shown to raise the self-esteem of all participating athletes—with and without intellectual disabilities.
Athlete Leadership Programs
Athlete Leadership Programs train Special Olympics athletes to hold meaningful roles as public speakers, board members, sport officials, coaches, photographers and more. By participating in the Special Olympics Movement as leaders, not just recipients of services, athletes help shape the public’s perceptions about what they can do and gain skills that help them excel off the playing field.

Healthy Athlete ProgramsSince 1997, the Special Olympics Healthy Athletes Program has performed more than 1.4 million health screenings in seven different disciplines:
Fit Feet (podiatry)FUNfitness (physical therapy)Health Promotion (healthier lifestyles) Healthy Hearing (audiology)Opening Eyes (vision)Special Smiles (dentistry)MedFest (sports physical exam)
History of Healthy Athletes
Goals of Healthy Athletes
• IMPROVE access and health care for Special Olympics athletes at event based health screenings.
• Make REFERRALS to local health practitioners when appropriate.
• TRAIN health care professionals and students.
• Collect, analyze and disseminate DATA on the health status and needs of persons with intellectual disabilities.
• ADVOCATE for improved health policies and programs for persons with intellectual disabilities.
Reach of Healthy Athletes
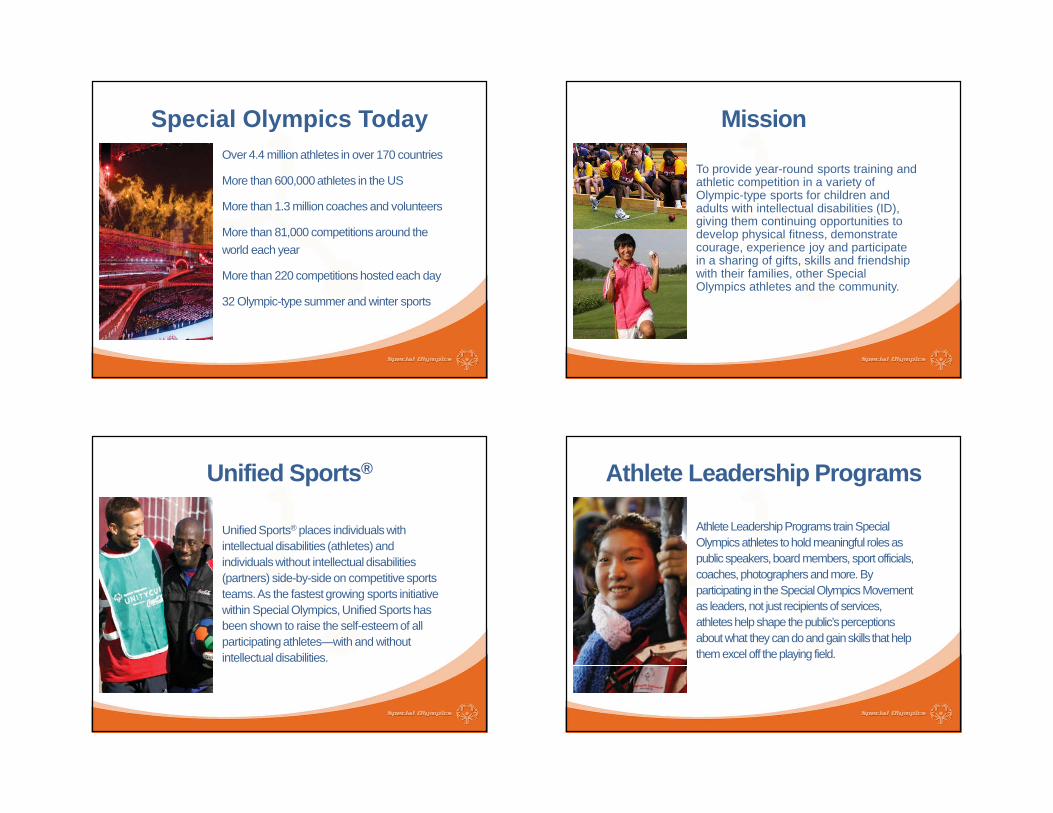
Accomplishments
• Over 1,400,000 health screenings
• Over 127,000 healthcare professionals trained
• Over 100,000 eyeglasses, as well as hearing aids, dental care, orthotics, and other products provided through partnerships
Cascade of Health Disparities
• Parents are told to have low expectations
• Families deprioritize
• Access to doctors is low
• Doctors are not trained
• Low quality care is provided, if any
• Health need are undiagnosed or misdiagnosed
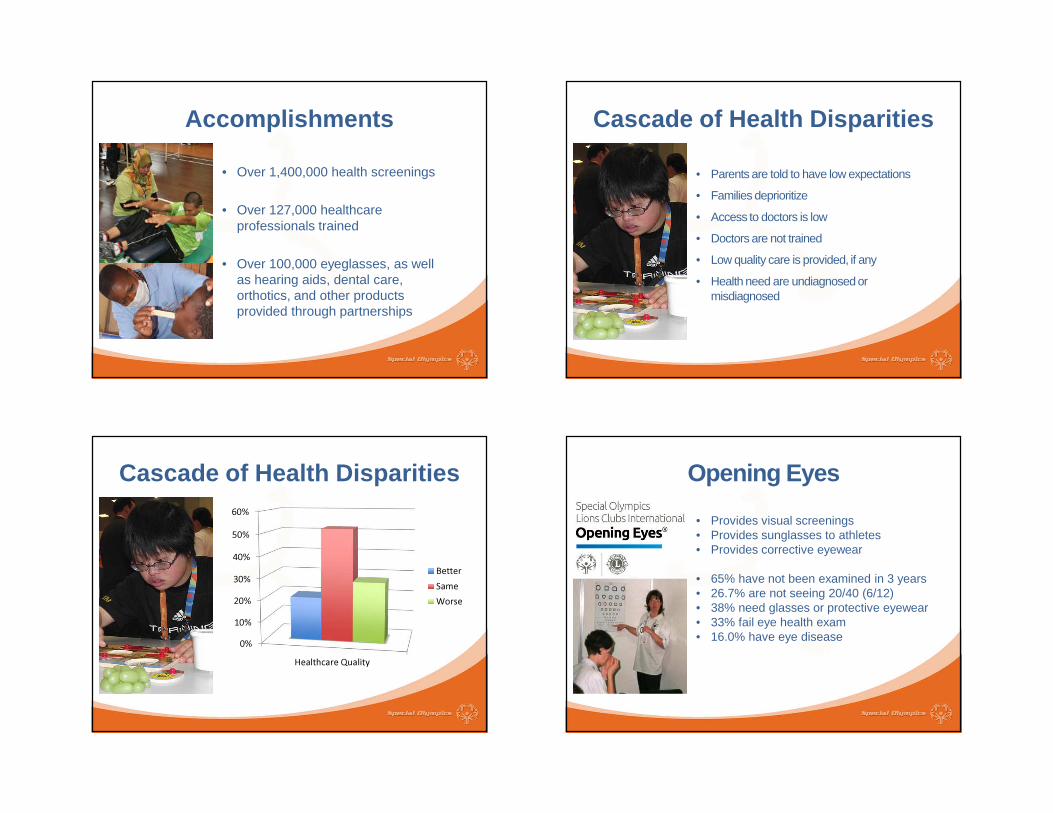
Cascade of Health Disparities
0%10%20%30%
40%
50%
60%
Healthcare Quality
BetterSameWorse
Opening Eyes
• Provides visual screenings• Provides sunglasses to athletes• Provides corrective eyewear
• 65% have not been examined in 3 years• 26.7% are not seeing 20/40 (6/12)• 38% need glasses or protective eyewear• 33% fail eye health exam• 16.0% have eye disease

Special Smiles
• Provides dental screenings• Provides mouth guards for athletes in
contact or high-risk sports
• 14.4% in active dental pain• 36.6% have untreated dental decay• 46.1% have signs of gingivitis
Special Smiles
Healthy Hearing
• Provides hearing screenings• Provides hearing aids to athletes
• 38.9% blocked ear canal
• 26.4% fail initial hearing tests• 16.5% show a hearing loss• 3.5% require hearing aids
Health Promotion
• Provide and reinforce healthy lifestyle information to athletes and families
• Establish best ways to shape lifestyle choices; promote health literacy of persons with ID
• Provide both games-based and community based opportunities for Health Promotion
• 60.2% are overweight or obese• 24.7% have low bone density

FUNfitness
• A Fitness Screening• Flexibility, strength, balance, and
aerobic condition
• 39.1% need improvement in balance• 50.8% need improvement in flexibility• 30.2% need improvement in strength• 22% need referral for physical therapy
Fit Feet• Provides screenings of the feet and
ankles• Assesses the correctness of footwear• Provides community referral as
needed
• 41% are wearing the wrong size shoes!!
• 48.1% have gait abnormalities• 25% have ingrown toenails• 11% have athlete’s foot
MedFest• Provides a free sports physical and
other health screenings to any potential Special Olympics athlete
• Provides referrals to community health providers
• 25% are taking medications which can negatively impact the athletic experience
• 22% had at least one previously undiagnosed medical condition
Neurodevelopmental Disorder
Sec
onda
ry H
ealth
Con
sequ
ence
sS
econ
dary
Hea
lth C
onse
quen
ces
Secondary H
ealth Consequences
Secondary H
ealth Consequences
Cephalic & Cervical
Cephalic & Cervical
Cardiac & PulmonaryCardiac & Pulmonary
Skeletal & ConnectiveSkeletal &
Connective
Endocrine & Metabolic
Endocrine & Metabolic
IntellectualDisability
IntellectualDisability
Sensory Impairment
Sensory Impairment
NeuromotorDysfunctionNeuromotorDysfunction
Seizure DisorderSeizure Disorder
Abnormal BehaviorAbnormal Behavior
Syndrome Specific
Conditions
Syndrome Specific
Conditions
GeneticsEnvironment
CommonCerebrogenic
Conditions
CommonCerebrogenic
Conditions
Gastro –IntestinalGastro –Intestinal
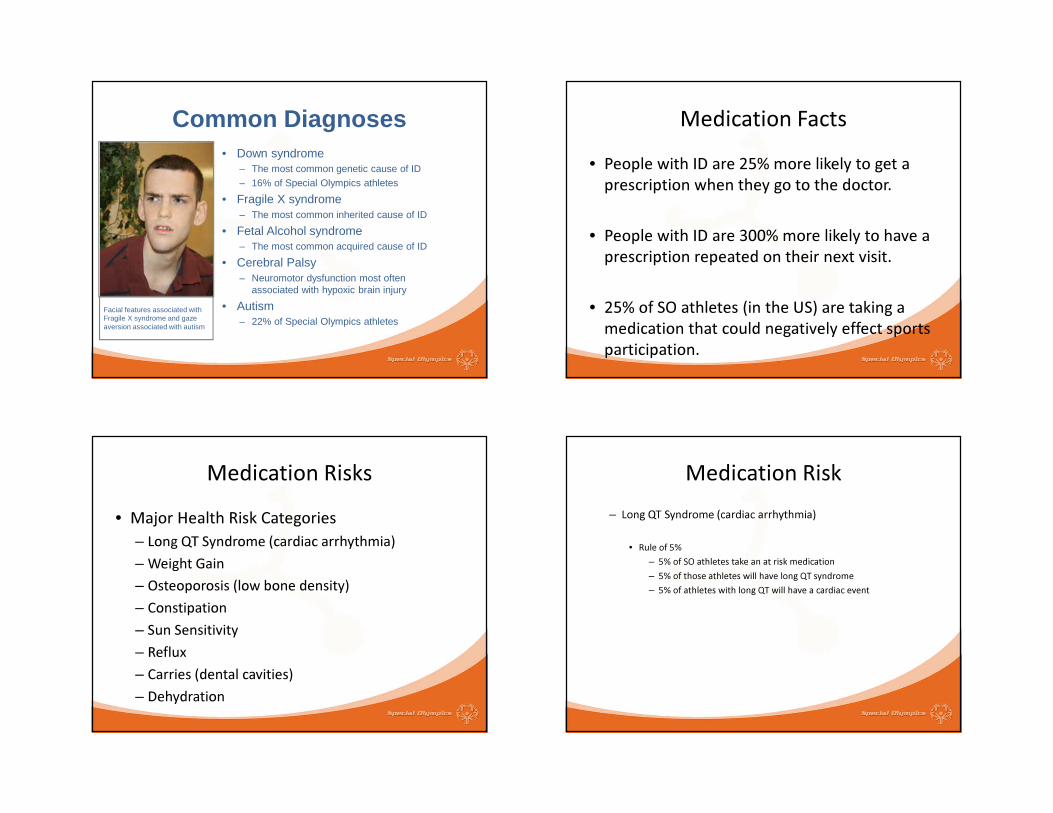
Facial features associated with Fragile X syndrome and gaze aversion associated with autism
• Down syndrome– The most common genetic cause of ID– 16% of Special Olympics athletes
• Fragile X syndrome– The most common inherited cause of ID
• Fetal Alcohol syndrome– The most common acquired cause of ID
• Cerebral Palsy– Neuromotor dysfunction most often
associated with hypoxic brain injury
• Autism– 22% of Special Olympics athletes
Common Diagnoses Medication Facts
• People with ID are 25% more likely to get a prescription when they go to the doctor.
• People with ID are 300% more likely to have a prescription repeated on their next visit.
• 25% of SO athletes (in the US) are taking a medication that could negatively effect sports participation.
Medication Risks
• Major Health Risk Categories– Long QT Syndrome (cardiac arrhythmia)– Weight Gain– Osteoporosis (low bone density)– Constipation– Sun Sensitivity– Reflux– Carries (dental cavities)– Dehydration
Medication Risk– Long QT Syndrome (cardiac arrhythmia)
• Rule of 5%– 5% of SO athletes take an at risk medication– 5% of those athletes will have long QT syndrome– 5% of athletes with long QT will have a cardiac event

Medication Risk
• Weight Gain
– In SO athletes these medications appear to cause, on average, a 5% increase in body mass compared to athletes not taking these medications.
Medication Risk
• Osteoporosis (low bone density)– About 5% of SO athletes have osteoporosis– About 15% of SO athletes have osteopenia– The lower the bone density, the higher to bone
fracture risk– 21% of SO athletes have broken a bone
– Athletes that take these medications have bone density scores that are 0.6 less on average than other SO athletes.
– 0.0 vs -0.6 (-1.0 = osteopenia)– Low BMD effects males more than females in SO
athletes under 50 but increases significantly in
Medication Risk
• Constipation
– Laxatives are one of the most common prescribed medications to people with ID (up to 48%)
– If bad enough, constipation can lead to impaction and intestinal rupture
Medication Risk
• Sun Sensitivity
– Around 20% of SO athletes take medications that can cause sun sensitivity (easy burning, or rash associated with sun exposure)

Medication Risk
• Reflux
– Very common problem in patients with ID (up to 36%)
– Causes “heartburn”, can lead to behavior problems, eating problems, enamel erosion and tooth loss, esophageal cancer
Medication Risk
• Carries (dental cavities)
– Almost half of SO athletes have untreated tooth decay
– 1 in 8 have active dental pain (carries is the first step)
– Dental pain will exacerbate behaviors, promote obesity, decrease sports interest
Special OlympicsHealthy Athletes
Special Olympics Special SmilesWorld Games 2011
Allen Wong, DDS, EdD, DABSCDNorth America Clinical Advisor Special Olympics Special SmilesProfessor, Dental Practice- Director AEGD and Hospital Dentistry ProgramPacific Dugoni School of Dentistry

Special Smiles Program-outline� History of the Beginnings of Special Smiles (Steve)� Spread of SOSS� Special Smiles and AGD�Where we were and where we are going with Smiles
� CAMBRA and Special Olympics ( Allen)� Raisin and Special Olympics� Getting involved with Special Smiles
Mission
An international organization that provides year-round sports training and athletic competition in a variety of Olympic-type sports for children and adults with intellectual disabilities, giving them continuing opportunities to develop physical fitness, demonstrate courage, experience joy and participate in the sharing of gifts, skills and friendship with their families, other Special Olympic athletes and the community.
38
Acceptance
Not Pity
SPECIAL OLYMPICS
39
Platform to Change the WorldSpecial Olympics can change the world by helping to create a global family where attitudes of fear, prejudice, embarrassment and indifference have given way to welcome, acceptance and understanding. We are on the verge of an extraordinary opportunity to promote the celebration of differences and transform the perceptions toward individuals with intellectual disabilities- one attitude at a time.
40

But…
How did a sports organization…
Become a public health organization???
41
Special Olympics Special SmilesMission
Special Olympics, Special Smiles is a global oral health initiative designed to improve access to dental care for people with special needs and to raise the public’s and
dental community’s awareness of the oral health problems many of those with special needs face.
42
Special Olympics Special SmilesSOSS Goals
� Conduct dental screenings and education programs at SOI events� Increase dental professionals’ awareness of the
particular oral health concerns people with special needs face� Develop a body of knowledge about the oral health
of children and adults with special needs
43
Special Olympics Special SmilesSOSS Goals
� Provide lists of regional dental professionals who care for people with special needs to athletes who participate in the oral health program� Implement dental education programs for dental
professionals, dental schools, dental hygiene schools, community residences, and Special Olympic athletes
44

Special Olympics Special SmilesSOSS Goals
� Serve as advocates on standards and quality of care issues�Working with SOI medical consultants, ensure
that athletes who participate in the dental program have access to the most current information on medical issues� Establish a sports injury prevention program for
Special Olympics athletes45
Special Olympics Special SmilesSOSS Goals
�Help develop adaptive devices and orofacial sports programs for quadriplegics� Develop and promote nutritional guidelines and
programs for Special Olympic athletes�Work with established programs to help dental
professionals recognize and report suspected physical and sexual abuse in patients with special needs
46
Special Olympics Special SmilesMilestones
� Yale Report “The Health Status And Needs Of Individuals With Mental Retardation.” Sept. 15, 2000� Hearing before a Subcommittee of the Committee on Appropriations United States Senate One Hundred Seventh Congress First SessionSpecial Hearing March 5, 2001 - Anchorage, Alaska.� Surgeon General’s Conference on Health Disparities and Mental Retardation. Dec. 5 & 6, 2001� Testify at Senator Bingaman’s Children’s Oral Health Hearing June 25, 2002.� American Academy of Developmental Medicine and Dentistry. (AADMD) www.aadmd.org.� CODA Standard 2–26. July, 2004� Collaborative agreement with the AGD� Collaborative agreement with FDI� Collaborative agreement with IADH� Collaborative agreement with NCOHF
47
According to HRSA (http://bhpr.hrsa.gov/muaguide.htm), a population can be considered a Medically Underserved Population (MUP) if it receives an Index of Medical Underservice (IMU) score of less than 62.0.

The IMU is calculated using the simple addition of four scores. In the case of ND/ID population, it would be calculated by adding scores � V1 = The percentage of the ND/ID population living
below the poverty line.� V2 = The percentage of the ND/ID population over the
age of 65� V3 = The infant mortality rate among people with
ND/ID� V4 = The ratio of primary care physicians to patients
with ND/ID
V1According to one article (Mental Retardation: Vol. 41, No6, pp. 446-459), roughly 33 percent of the population of both children and adults with mental retardation live in poverty. Cross referencing this with the HRSA score table give a V1 score of 5.6 the maximum score for this criterion is 25.1.
V2There are a number of statistics that can be used to calculate the percentage of people with ND/ID that are over the age of 65. Our initial estimates show roughly 10 percent of the ND/ID population are over the age of 65. This corresponds with a V2 score of 19.8. The maximum score possible for this criterion is 20.2.
V3According to the National Vital Statistics Reports, (Vol. 53, No. 5, October 12, 22004 13) the number one cause of infant mortality in the United States, accounting for 5,623 infant deaths is classified as congenital malformations, deformations and chromosomal abnormalities, essentially, the biomedical causes of neurodevelopmental disorders and/or intellectual disabilities. Since roughly 60,000 to 120,000 people with ND/ID are born every year, the infant mortality for this population is between 47/1000 and 94/1000. both of these scores represent a V3 score of 0.0. The maximum score for this criterion is 26.0.

V4This is perhaps the most difficult score to calculate, as it is extraordinarily difficult to estimate the number of primary care physicians willing and capable of caring for this population. We know the number to be fairly low. However, we shall use the maximum score, by default, for purposes of completing the IMU calculation. The maximum score for this criterion is 26.0.
To summarize the IMU calculation, we have estimated the following:V1 = 5.6 V2 = 19.8V3 = 0.0 V4 = 28.7The total IMU score for the ND/ID population, then is 54.1. This falls well below the determination score of 62.0.
Designation of the Intellectually Disabled as a Medically Underserved Population (Resolution 805-I-10)
At the American Medical Association’s (AMA) 2010 Interim Meeting, the House of Delegates referred Resolution 805-I-10, which was introduced by the International Medical Graduates Section and calls for the AMA to “lobby Congress to work with the appropriate federal agencies, such as the Department of Health and Human Services, to classify intellectually disabled persons as a medically underserved population.” The Board of Trustees referred Resolution 805-I-10 to be the Council on Medical Service for study.

This report provides background on intellectual disabilities, discusses how the federal government currently designates a group as a medically underserved population, highlights Patient Protection and Affordable Care Act (ACA< PL 111-148) provisions that are likely to impact individuals with intellectual disabilities, reviews relevant AMA policy, and presents policy recommendations.
RESOLUTION 805-I-10During testimony on Resolution 805-I-10, speakers expressed concerns about how “intellectually disabled” would be defined for the purposes of identifying a new MUP. As noted, several laws have attempted to address access to care for individuals with intellectual disabilities and a HRSA Negotiated Rulemaking Committee is reviewing its designation process.The resolution also highlights several socioeconomic barriers that can prevent individuals with intellectual disabilities from obtaining appropriate access to care. During testimony, questions were raised about whether a MUP designation would actually improve access. The Council believes that while a MUP designation could focus resources on individuals with intellectual disabilities, it is unlikely that a new designation alone would foster optimal health care access.An equally salient concern is whether there are adequate educational opportunities for those who care for the intellectually disabled. A 2005 survey conducted jointly by the American Academy of Developmental Medicine and Dentistry and the Special Olympics found that 52 percent of medical school deans, 56 percent of students, and 32 percent of medical residency program directors responded that graduates were “not competent to treat people with neurodevelopmental disorders or intellectual disabilities.” In addition, 81 percent of medical students surveyed reported receiving no clinical instruction in treating individuals with neurodevelopmental disorders and intellectual disabilities, and 66 percent reported that they were not receiving adequate classroom instruction.
The study also indicated that the lack of training is not linked to discrimination or unwillingness to treat individuals with intellectual disabilities; most medical students are interested in providing care as part of their career (Special Olympics, 2005; Wolff, Waldman, et al., 2004).

Special Smiles Program-outline� History of the Beginnings of Special Smiles� Spread of SOSS� Special Smiles and AGD�Where we were and where we are going with Smiles* CAMBRA and Special Olympics� Raisin and Special Olympics� Getting involved with Special Smiles
CDA Journal Oct/ Nov 2011

Incorporation CAMBRA� Saliva tests� ATP test
CariScreen from Oral BioTechReal time (15 second ) inexpensive screening test for identifying high risk from low risk individuals
Based on ATP measuremts
Special Smiles� Provides dental screenings� Provides mouth guards for athletes in contact or high-risk sports� 12% in active dental pain (US)� 14% world wide
� 24% had untreated dental decay (US)� 37% world wide
� 47% had gingival signs (US and world wide)� 9.4% Needed urgent dental treatment (US)� 14.2% world wide

CAMBRA and Special Smiles� Caries Management By Risk Assessment and “legal”� Getting training� Implementing facets of CAMBRA
Raisin Project� How it began?
� Results of initial pilot; Boston (state) 2009
� Results of Idaho World Games (national) 2010
� Results of Greece World Games (international) 2011
Preliminary “Boston Special Olympics State Games ” June 2009� Met Dr. Julie Jones from Raisin Board� Created a mini-study to “test” theory of paperQuick Protocol:1) Using Dental Students2) Baseline ATP swab samples, N= 183) Had them eat mini bag of raisins, waited 15 minutes4) Re-swab, wait 15 minutes more then swab again
71
Nebraska World Games Special Olympics July 2010� Incorporated CAMBRA protocols to World Games� CariFree Representatives assisted in education� Met Dr. Jim Painter, Raisin Board regarding
incorporating Special Olympics Athletes, Raisins and ATP swabs with my protocols� Train the trainers (Special Smiles Directors)
72

1 50 13 12 25 2%2 29 11 7 11 4%3 29 13 9 7 7%4 22 7 6 9 9%5 43 14 20 9 11%6 57 16 21 20 13%7 85 20 36 29 16%8 116 33 42 41 18%9 133 60 34 39 20%
Total Swabs 554approx 79 lower risk475 at MOD to HIGH RISK1 refused swabincomplete 7 screening
total after day 2
1
2
3
4
5
6
7 thousands value
ATP results (364 swabs) total after day 3 1
2
3
4
5
6
7
Final ATP results ( 554 )
1
2
3
4
5
6
7
8
Greece World Games Special Olympics protocolsJune 2011� Raisin Eating Group� Subjects: SO Athletes, N= 156� Swab, facial 6 teeth, lingual 6 teeth to confirm High ATP� Swab Right facial posterior teeth prior to Eating bag raisins� 15 minutes wait; swab Left facial posterior teeth� Mandibular Incisors: � Lingual: 6499 � Labial: 6689� Maxillary: � Right side: 5949� Left side: 3356 (15 minutes after eating raisins)
75
World Games 2011 Results

Control� No Raisin Eating� N= 40
� Mandibular Incisors: � Lingual: 6141 � Labial: 6131� Maxillary: � Right side: 5409� Left side: 4896 (15 minutes later, no
raisins)
77
Data Set Comparison� Test Group # 156� Mandibular Incisors: � Lingual: 6499 � Labial: 6689� Maxillary: � Right side: 5949� Left side: 3356
(15 minutes after eating raisins)�
� Control Group #40� Mandibular Incisors: � Lingual: 6141 � Labial: 6131� Maxillary: � Right side: 5409� Left side: 4896
(15 minutes later, NO raisins)
78
Special Smiles: WG Idaho 2010

Lessons learned ?
Invitation to Participate
QuestionsAllen Wong, DDS, EdD, DABSCD
[email protected] Holder, MD, MBA
Related Documents


