07/03/18 1 3-1 DEPT. MANAGEMENT & LAW BACHELOR DEGREE IN BUSINESS ADMINISTRATION Dr. Gabriele Palozzi [email protected] COURSE of Managerial Accounting - Basics of Cost Analysis - 3-2 Learning Objective LO1 Determine the sales volume necessary to break even or to earn a desired profit. Managerial Accounting - Basics of Cost Analysis - A.Y. 17/18

Welcome message from author
This document is posted to help you gain knowledge. Please leave a comment to let me know what you think about it! Share it to your friends and learn new things together.
Transcript
07/03/18
1
3-1
DEPT. MANAGEMENT & LAW BACHELOR DEGREE IN BUSINESS ADMINISTRATION
Dr. Gabriele Palozzi [email protected]
COURSE of Managerial Accounting
- Basics of Cost Analysis -
3-2
Learning Objective
LO1
Determine the sales volume necessary to
break even or to earn a desired profit.
Managerial Accounting - Basics of Cost Analysis - A.Y. 17/18
07/03/18
2
3-3
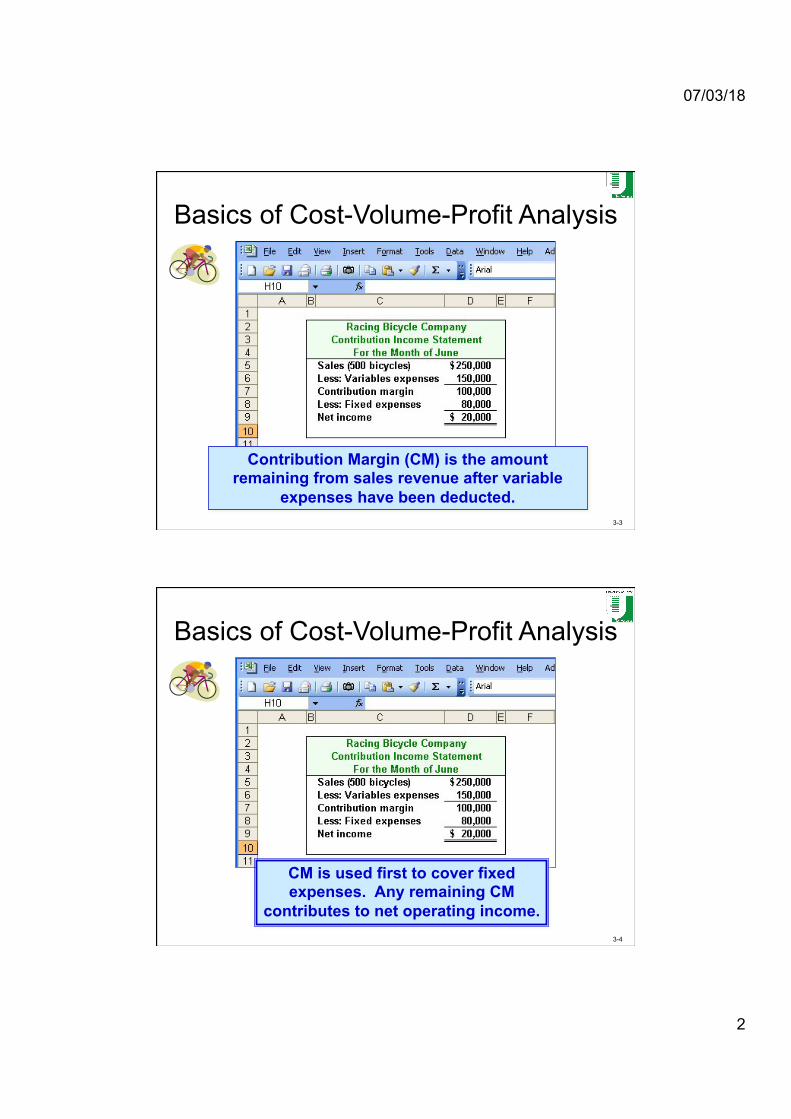
Basics of Cost-Volume-Profit Analysis
Contribution Margin (CM) is the amount remaining from sales revenue after variable
expenses have been deducted.
3-4
Basics of Cost-Volume-Profit Analysis
CM is used first to cover fixed expenses. Any remaining CM
contributes to net operating income.
07/03/18
3
3-5
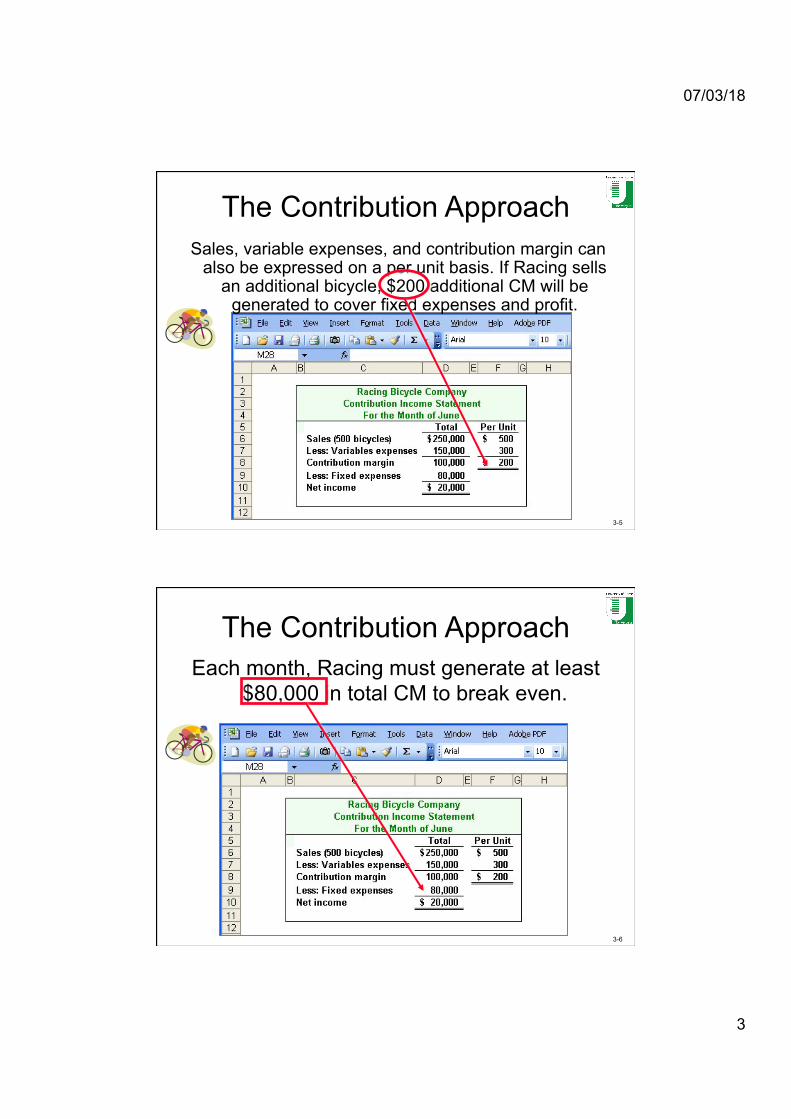
The Contribution Approach Sales, variable expenses, and contribution margin can
also be expressed on a per unit basis. If Racing sells an additional bicycle, $200 additional CM will be
generated to cover fixed expenses and profit.
3-6
The Contribution Approach Each month, Racing must generate at least
$80,000 in total CM to break even.
07/03/18
4
3-7
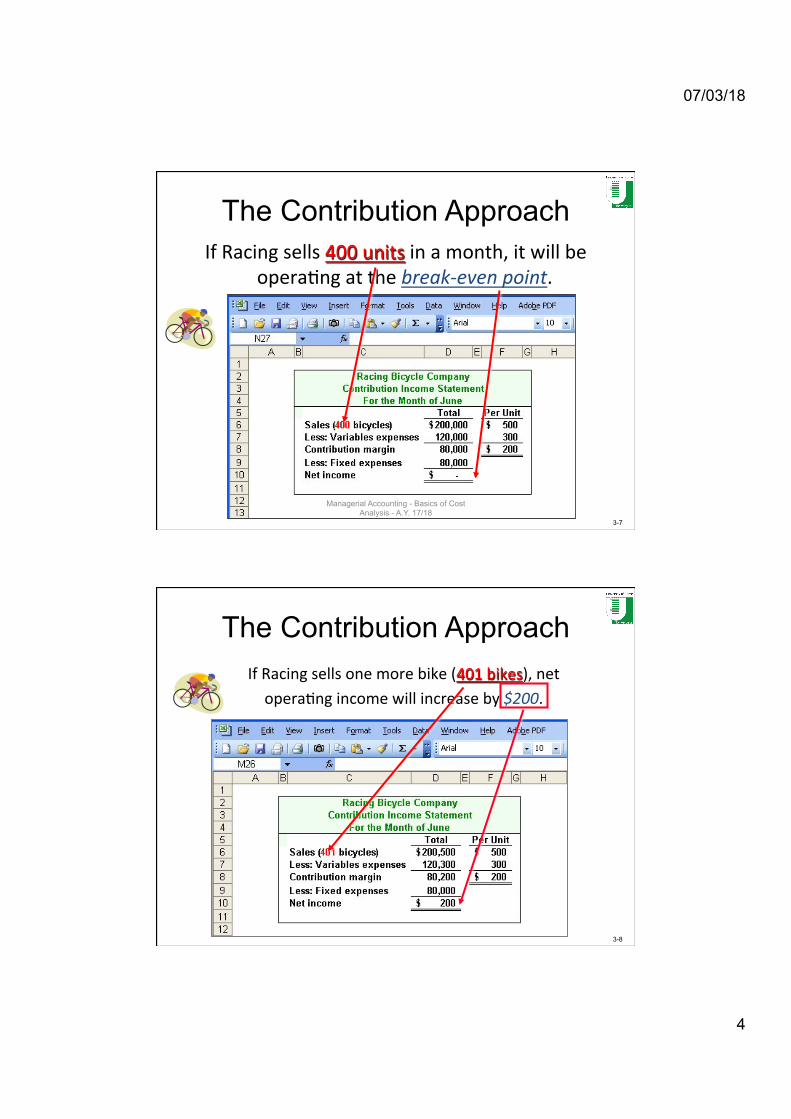
The Contribution Approach IfRacingsells400unitsinamonth,itwillbe
opera9ngatthebreak-evenpoint.
Managerial Accounting - Basics of Cost Analysis - A.Y. 17/18
3-8
The Contribution Approach IfRacingsellsonemorebike(401bikes),netopera9ngincomewillincreaseby$200.
07/03/18
5
3-9
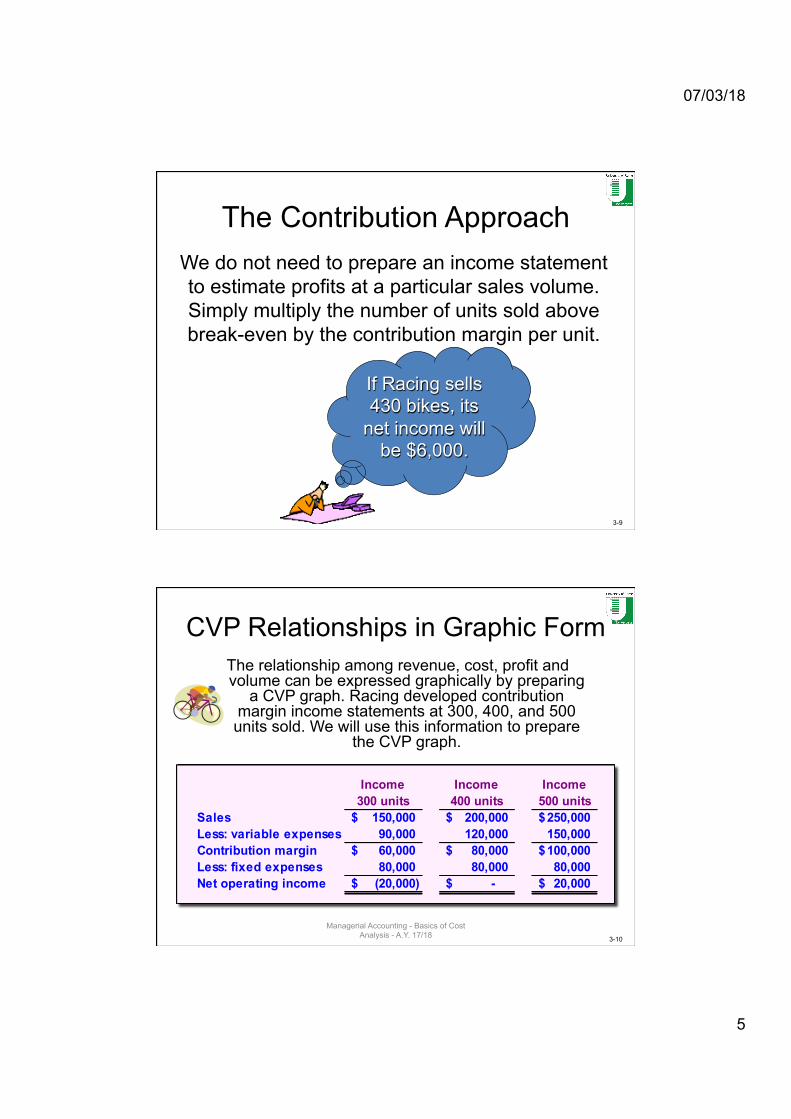
The Contribution Approach We do not need to prepare an income statement to estimate profits at a particular sales volume. Simply multiply the number of units sold above break-even by the contribution margin per unit.
If Racing sells 430 bikes, its
net income will be $6,000.
3-10
CVP Relationships in Graphic Form The relationship among revenue, cost, profit and volume can be expressed graphically by preparing
a CVP graph. Racing developed contribution margin income statements at 300, 400, and 500 units sold. We will use this information to prepare
the CVP graph.
Income 300 units
Income 400 units
Income 500 units
Sales 150,000$ 200,000$ 250,000$ Less: variable expenses 90,000 120,000 150,000 Contribution margin 60,000$ 80,000$ 100,000$ Less: fixed expenses 80,000 80,000 80,000 Net operating income (20,000)$ -$ 20,000$
Managerial Accounting - Basics of Cost Analysis - A.Y. 17/18
07/03/18
6
3-11
Learning Objective
LO2
Draw and interpret a cost-volume-profit
graph.
Managerial Accounting - Basics of Cost Analysis - A.Y. 17/18
3-12
Preparing a Cost-Volume-Profit Graph
1. Draw and label the axes.- Horizontal axis – activity (in units)- Vertical axis - dollars
2. Draw the fixed cost line.- A horizontal line
3. Draw the total cost line.- A diagonal line that begins at the fixed cost line and vertical axis
4. Draw the sales line.- A diagonal line that begins at the origin
Managerial Accounting - Basics of Cost Analysis - A.Y. 17/18
07/03/18
7
3-13
-
50.000
100.000
150.000
200.000
250.000
300.000
350.000
400.000
450.000
- 100 200 300 400 500 600 700 800
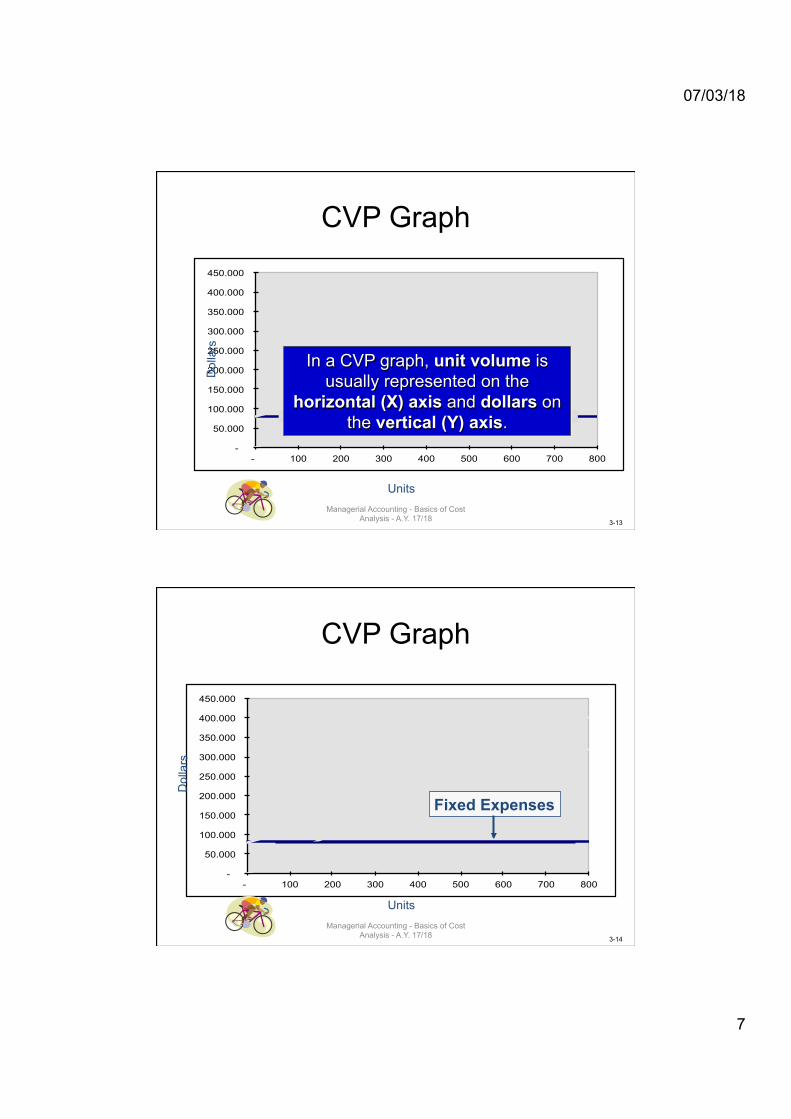
CVP Graph
Units
Dol
lars
In a CVP graph, unit volume is usually represented on the
horizontal (X) axis and dollars on the vertical (Y) axis.
Managerial Accounting - Basics of Cost Analysis - A.Y. 17/18
3-14
-
50.000
100.000
150.000
200.000
250.000
300.000
350.000
400.000
450.000
- 100 200 300 400 500 600 700 800
CVP Graph
Units
Dol
lars
Fixed Expenses
Managerial Accounting - Basics of Cost Analysis - A.Y. 17/18
07/03/18
8
3-15
-
50.000
100.000
150.000
200.000
250.000
300.000
350.000
400.000
450.000
- 100 200 300 400 500 600 700 800
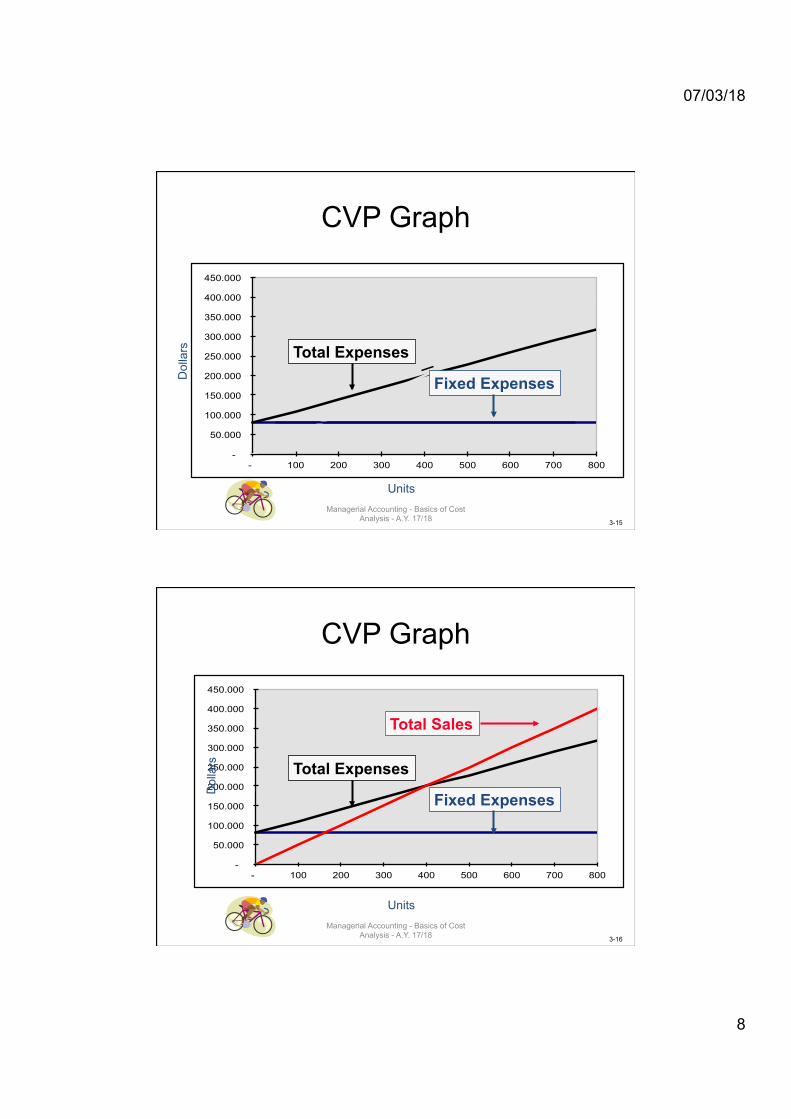
CVP Graph D
olla
rs
Units
Fixed Expenses
Total Expenses
Managerial Accounting - Basics of Cost Analysis - A.Y. 17/18
3-16
CVP Graph
-
50.000
100.000
150.000
200.000
250.000
300.000
350.000
400.000
450.000
- 100 200 300 400 500 600 700 800
Fixed Expenses Dol
lars
Total Expenses
Total Sales
Units Managerial Accounting - Basics of Cost
Analysis - A.Y. 17/18
07/03/18
9
3-17
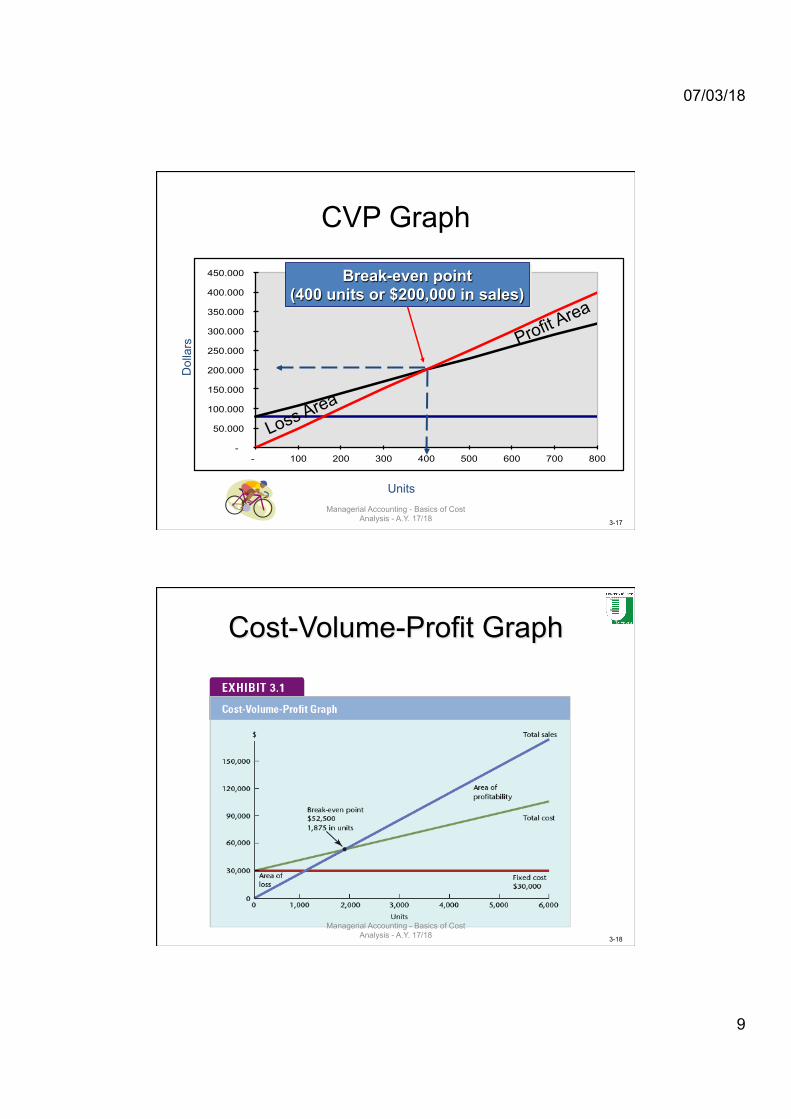
CVP Graph
-
50.000
100.000
150.000
200.000
250.000
300.000
350.000
400.000
450.000
- 100 200 300 400 500 600 700 800
Dol
lars
Units
Break-even point (400 units or $200,000 in sales)
Profit Area
Loss Area
Managerial Accounting - Basics of Cost Analysis - A.Y. 17/18
3-18
Cost-Volume-Profit Graph
Managerial Accounting - Basics of Cost Analysis - A.Y. 17/18
07/03/18
10
3-19
Learning Objective
LO3
Explain how a change in sales price, sales
volume, variable cost, or fixed cost affects
profitability.
Managerial Accounting - Basics of Cost Analysis - A.Y. 17/18
3-20
Profitability Analysis: Changes in Fixed Costs and Sales Volume
What is the profit impact if Racing can increase unit sales from 500 to 540
by increasing the monthly advertising budget by $10,000?
07/03/18
11
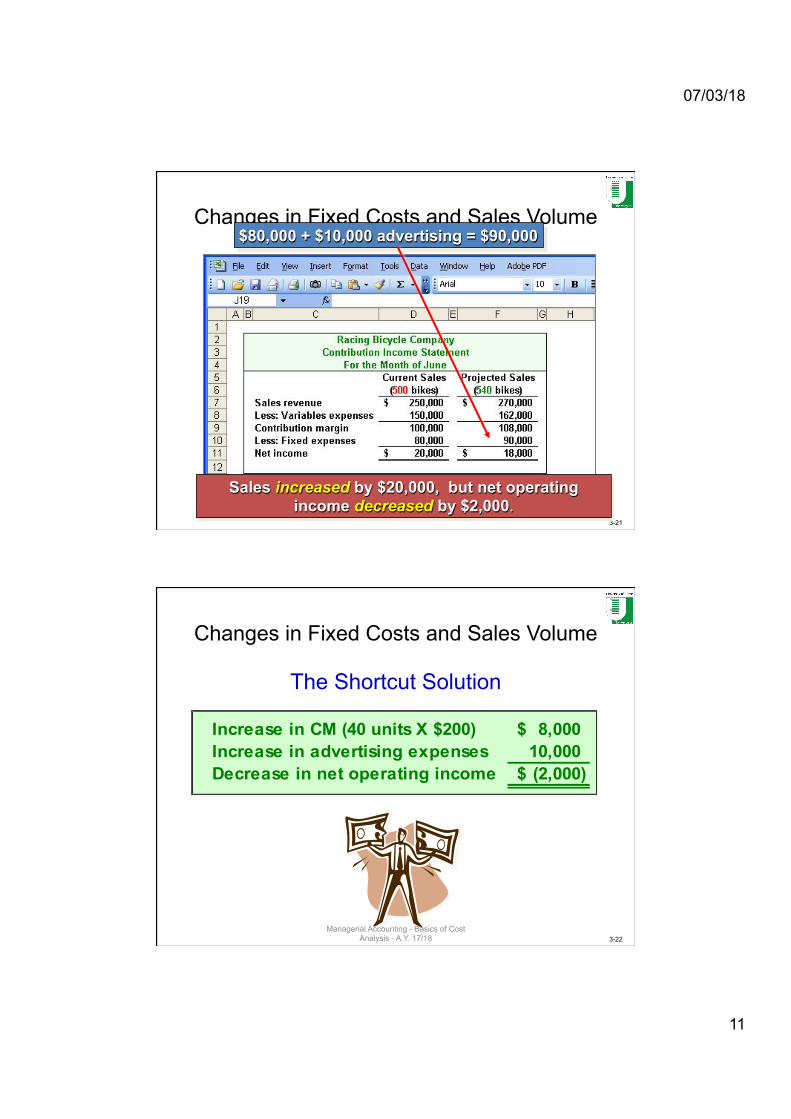
3-21
Changes in Fixed Costs and Sales Volume $80,000 + $10,000 advertising = $90,000
Sales increased by $20,000, but net operating income decreased by $2,000.
3-22
Changes in Fixed Costs and Sales Volume
The Shortcut Solution
Increase in CM (40 units X $200) 8,000$ Increase in advertising expenses 10,000 Decrease in net operating income (2,000)$
Managerial Accounting - Basics of Cost Analysis - A.Y. 17/18
07/03/18
12
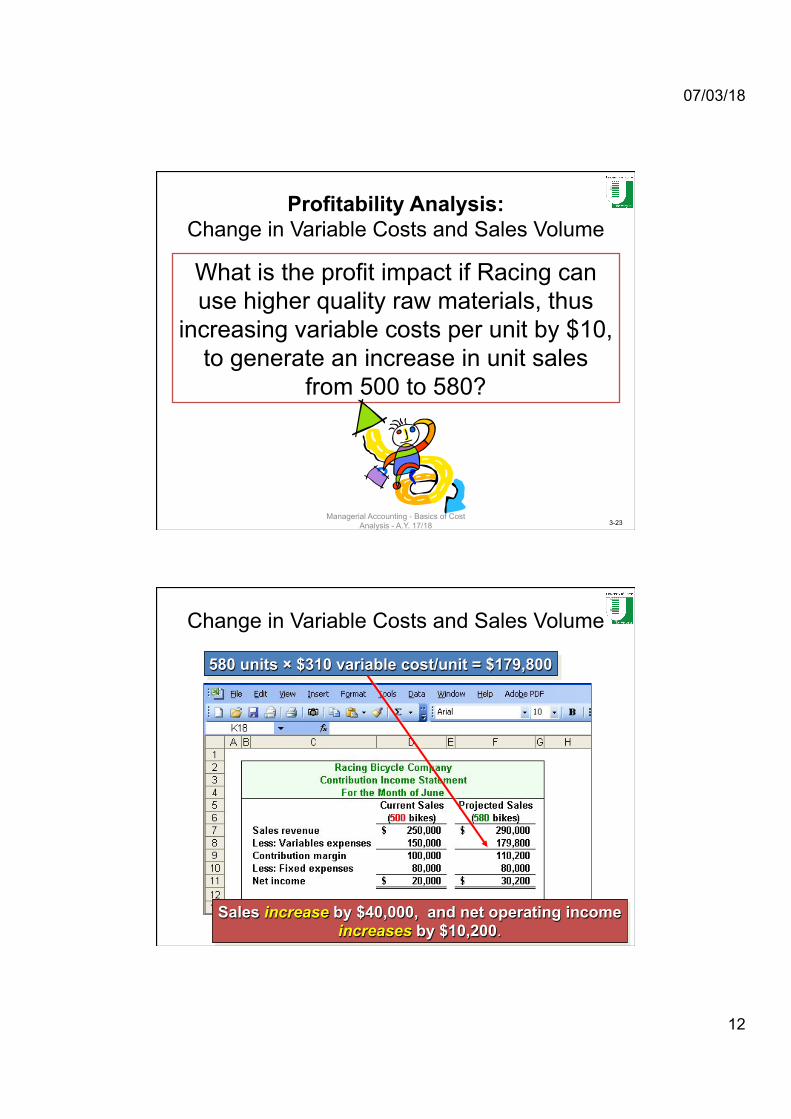
3-23
Profitability Analysis: Change in Variable Costs and Sales Volume
What is the profit impact if Racing can use higher quality raw materials, thus
increasing variable costs per unit by $10, to generate an increase in unit sales
from 500 to 580?
Managerial Accounting - Basics of Cost Analysis - A.Y. 17/18
3-24
Change in Variable Costs and Sales Volume
580 units × $310 variable cost/unit = $179,800
Sales increase by $40,000, and net operating income increases by $10,200.
07/03/18
13
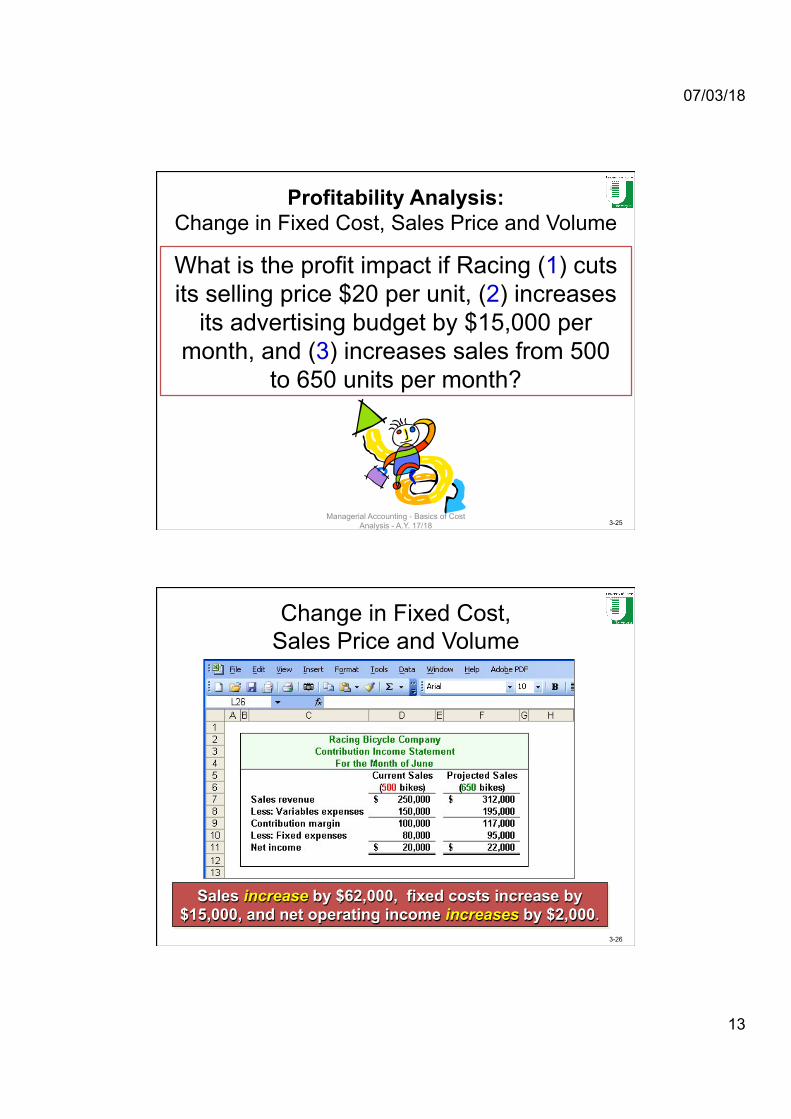
3-25
Profitability Analysis: Change in Fixed Cost, Sales Price and Volume
What is the profit impact if Racing (1) cuts its selling price $20 per unit, (2) increases
its advertising budget by $15,000 per month, and (3) increases sales from 500
to 650 units per month?
Managerial Accounting - Basics of Cost Analysis - A.Y. 17/18
3-26
Sales increase by $62,000, fixed costs increase by $15,000, and net operating income increases by $2,000.
Change in Fixed Cost, Sales Price and Volume
07/03/18
14
3-27
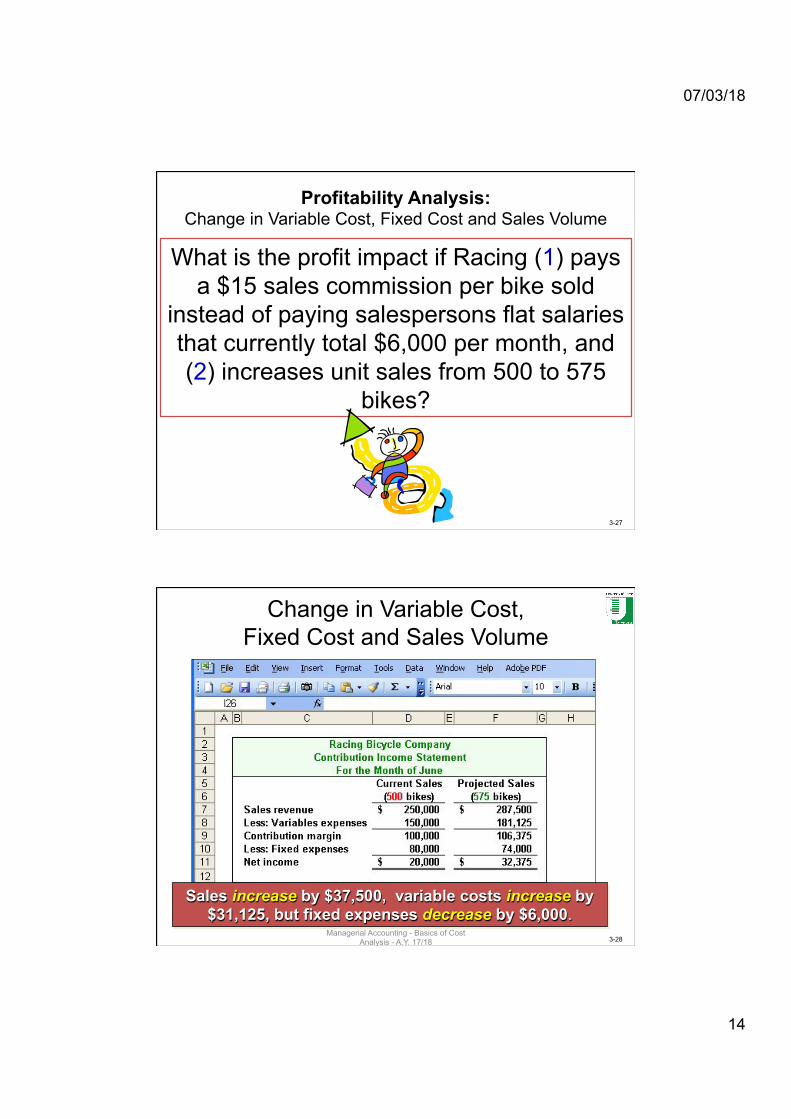
Profitability Analysis: Change in Variable Cost, Fixed Cost and Sales Volume
What is the profit impact if Racing (1) pays a $15 sales commission per bike sold
instead of paying salespersons flat salaries that currently total $6,000 per month, and (2) increases unit sales from 500 to 575
bikes?
3-28
Change in Variable Cost, Fixed Cost and Sales Volume
Sales increase by $37,500, variable costs increase by $31,125, but fixed expenses decrease by $6,000.
Managerial Accounting - Basics of Cost Analysis - A.Y. 17/18
07/03/18
15
3-29
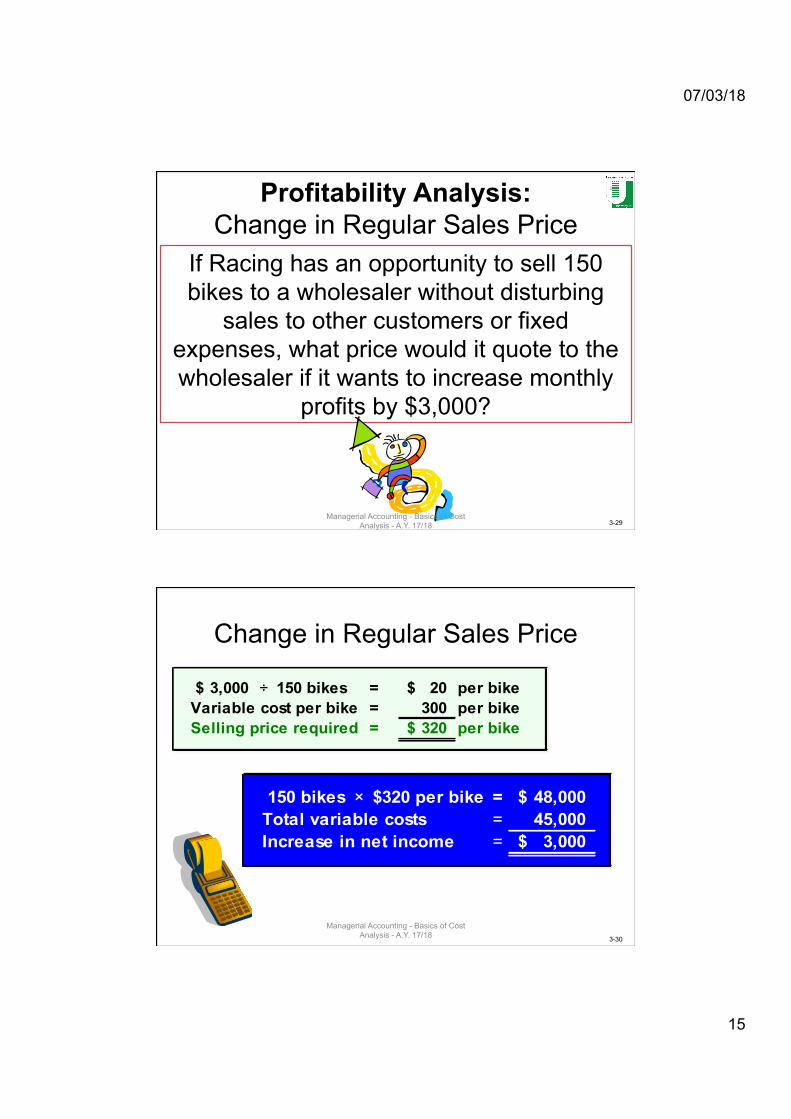
Profitability Analysis: Change in Regular Sales Price
If Racing has an opportunity to sell 150 bikes to a wholesaler without disturbing
sales to other customers or fixed expenses, what price would it quote to the wholesaler if it wants to increase monthly
profits by $3,000?
Managerial Accounting - Basics of Cost Analysis - A.Y. 17/18
3-30
Change in Regular Sales Price
3,000$ ÷ 150 bikes = 20$ per bikeVariable cost per bike = 300 per bikeSelling price required = 320$ per bike
150 bikes × $320 per bike = 48,000$ Total variable costs = 45,000 Increase in net income = 3,000$
Managerial Accounting - Basics of Cost Analysis - A.Y. 17/18
07/03/18
16
3-31
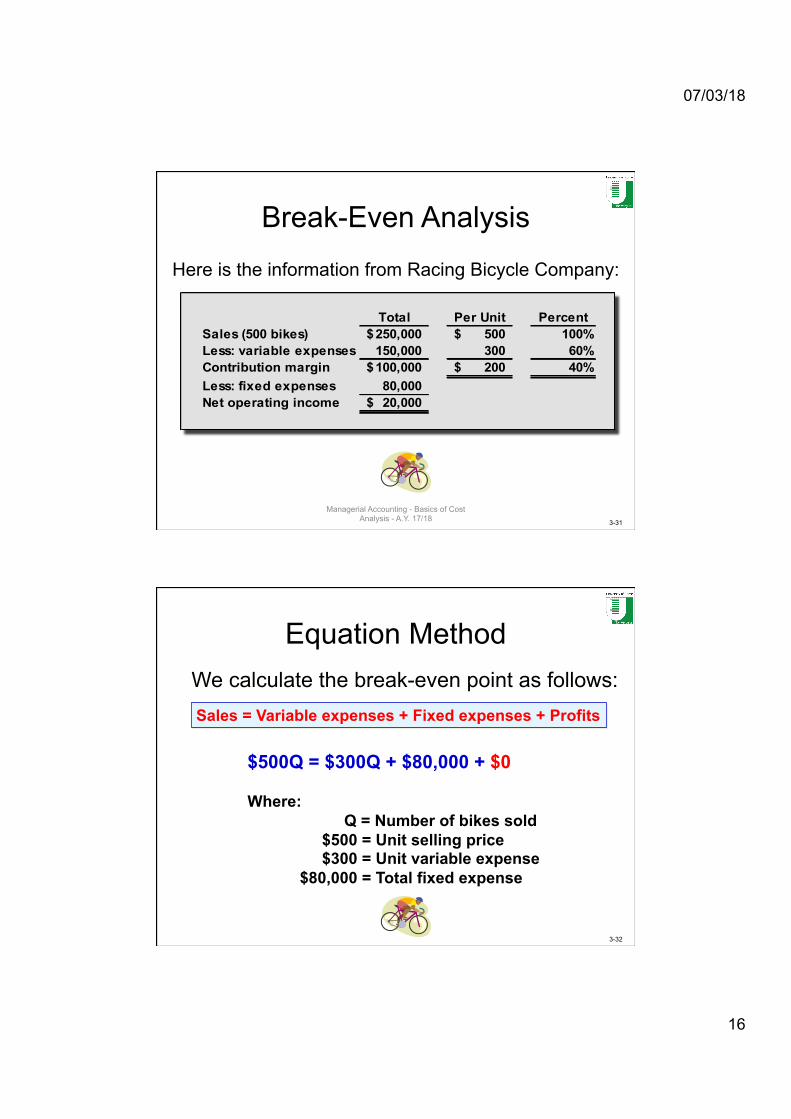
Break-Even Analysis
Here is the information from Racing Bicycle Company:
Total Per Unit PercentSales (500 bikes) 250,000$ 500$ 100%Less: variable expenses 150,000 300 60%Contribution margin 100,000$ 200$ 40%Less: fixed expenses 80,000 Net operating income 20,000$
Managerial Accounting - Basics of Cost Analysis - A.Y. 17/18
3-32
Equation Method We calculate the break-even point as follows:
Sales = Variable expenses + Fixed expenses + Profits
$500Q = $300Q + $80,000 + $0 Where:
Q = Number of bikes sold $500 = Unit selling price $300 = Unit variable expense $80,000 = Total fixed expense
07/03/18
17
3-33
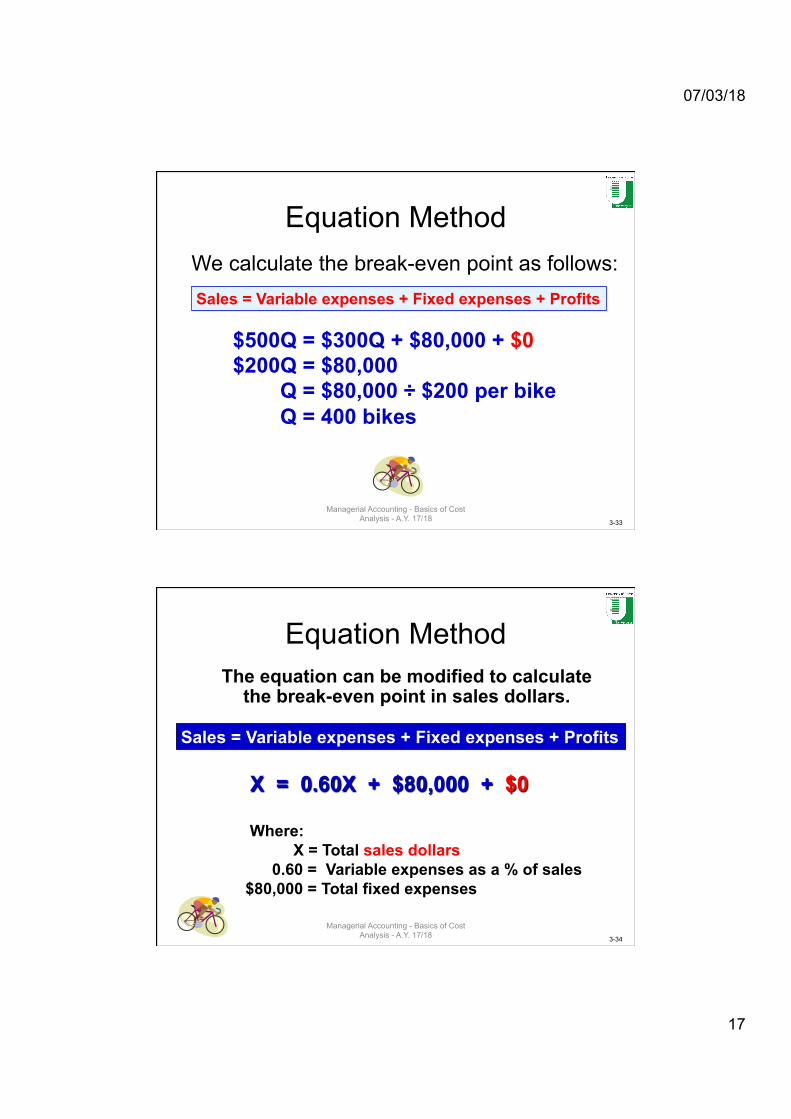
Equation Method
$500Q = $300Q + $80,000 + $0 $200Q = $80,000 Q = $80,000 ÷ $200 per bike Q = 400 bikes
We calculate the break-even point as follows: Sales = Variable expenses + Fixed expenses + Profits
Managerial Accounting - Basics of Cost Analysis - A.Y. 17/18
3-34
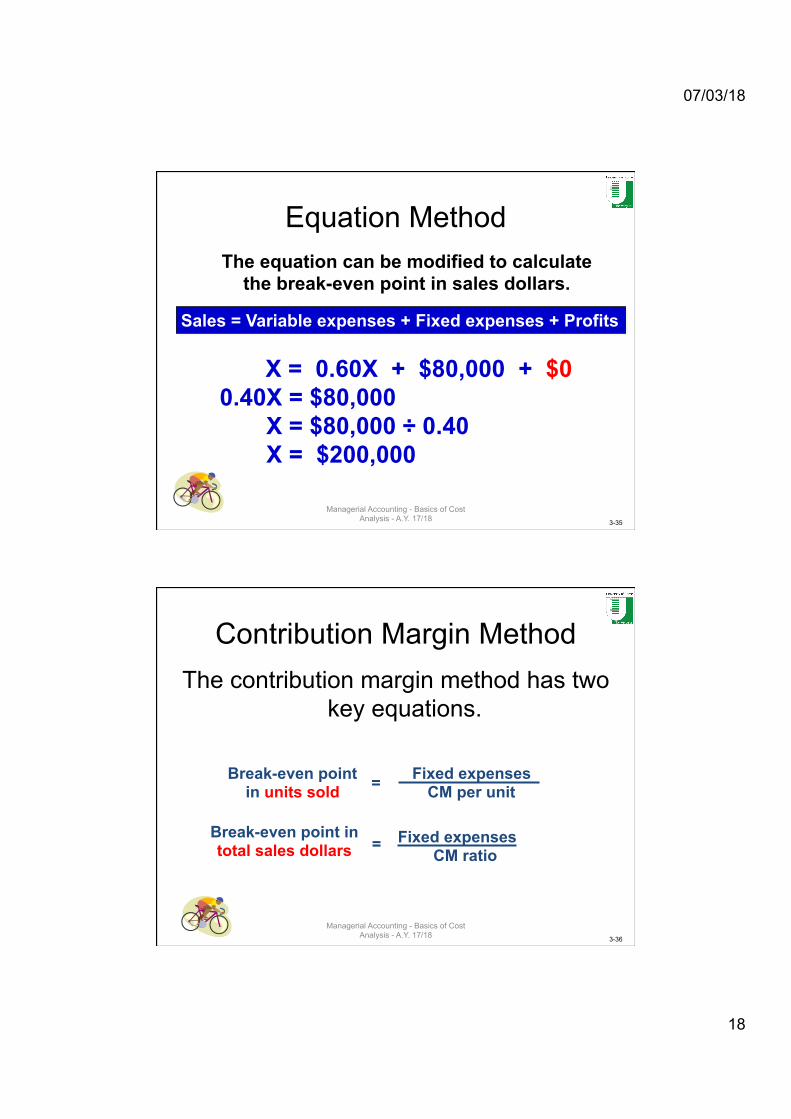
Equation Method The equation can be modified to calculate
the break-even point in sales dollars.
Sales = Variable expenses + Fixed expenses + Profits
X = 0.60X + $80,000 + $0
Where: X = Total sales dollars 0.60 = Variable expenses as a % of sales $80,000 = Total fixed expenses
Managerial Accounting - Basics of Cost Analysis - A.Y. 17/18
07/03/18
18
3-35
Equation Method
X = 0.60X + $80,000 + $0 0.40X = $80,000 X = $80,000 ÷ 0.40 X = $200,000
Sales = Variable expenses + Fixed expenses + Profits
The equation can be modified to calculate the break-even point in sales dollars.
Managerial Accounting - Basics of Cost Analysis - A.Y. 17/18
3-36
Contribution Margin Method The contribution margin method has two
key equations.
Fixed expenses CM per unit = Break-even point
in units sold
Fixed expenses CM ratio
= Break-even point in total sales dollars
Managerial Accounting - Basics of Cost Analysis - A.Y. 17/18
07/03/18
19
3-37
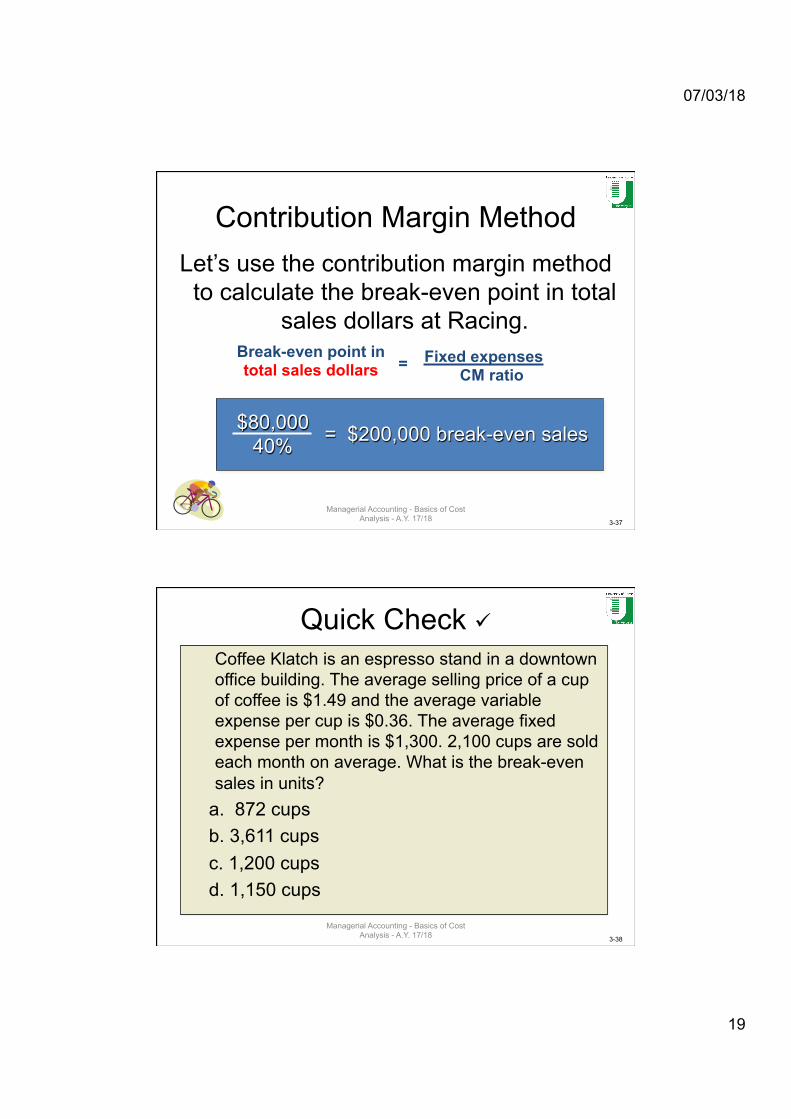
Contribution Margin Method Let’s use the contribution margin method
to calculate the break-even point in total sales dollars at Racing.
Fixed expenses CM ratio
= Break-even point in total sales dollars
$80,000 40% = $200,000 break-even sales
Managerial Accounting - Basics of Cost Analysis - A.Y. 17/18
3-38
Quick Check ü
Coffee Klatch is an espresso stand in a downtown office building. The average selling price of a cup of coffee is $1.49 and the average variable expense per cup is $0.36. The average fixed expense per month is $1,300. 2,100 cups are sold each month on average. What is the break-even sales in units?
a. 872 cups b. 3,611 cups c. 1,200 cups d. 1,150 cups
Managerial Accounting - Basics of Cost Analysis - A.Y. 17/18
07/03/18
20
3-39
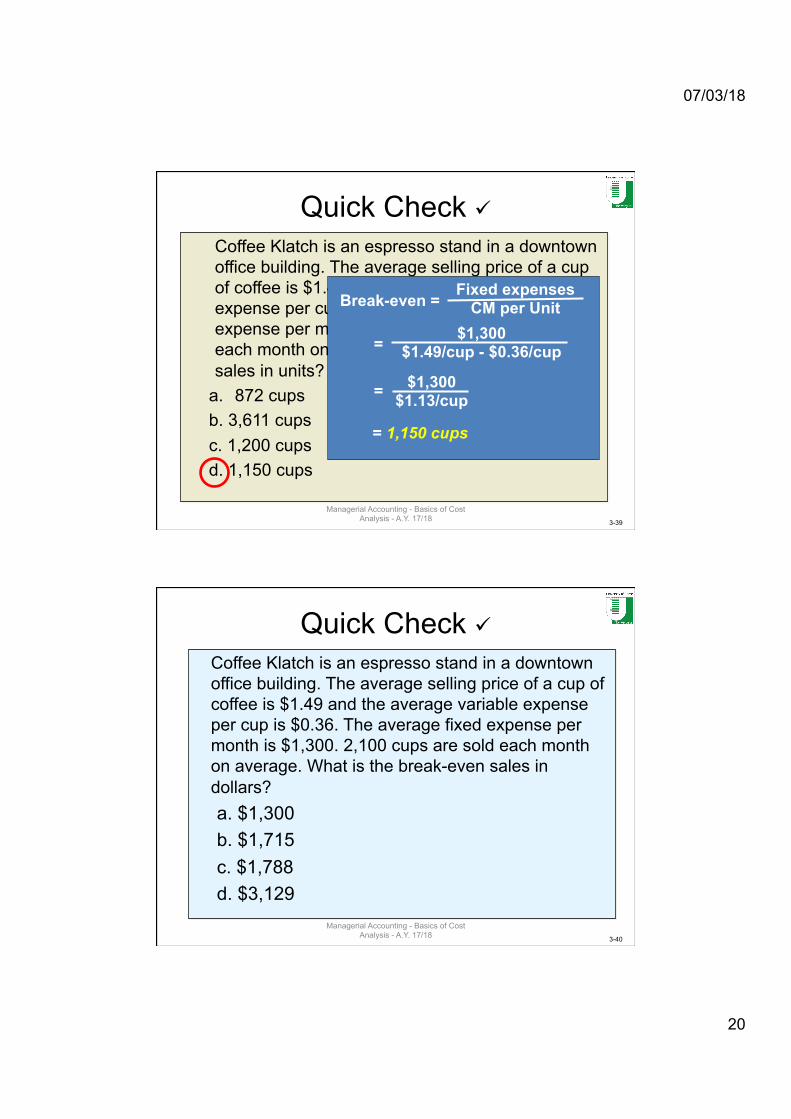
Coffee Klatch is an espresso stand in a downtown office building. The average selling price of a cup of coffee is $1.49 and the average variable expense per cup is $0.36. The average fixed expense per month is $1,300. 2,100 cups are sold each month on average. What is the break-even sales in units?
a. 872 cups b. 3,611 cups c. 1,200 cups d. 1,150 cups
Quick Check ü
Fixed expenses CM per Unit Break-even =
$1,300 $1.49/cup - $0.36/cup
= $1,300 $1.13/cup
= 1,150 cups
=
Managerial Accounting - Basics of Cost Analysis - A.Y. 17/18
3-40
Quick Check ü
Coffee Klatch is an espresso stand in a downtown office building. The average selling price of a cup of coffee is $1.49 and the average variable expense per cup is $0.36. The average fixed expense per month is $1,300. 2,100 cups are sold each month on average. What is the break-even sales in dollars? a. $1,300 b. $1,715 c. $1,788 d. $3,129
Managerial Accounting - Basics of Cost Analysis - A.Y. 17/18
07/03/18
21
3-41
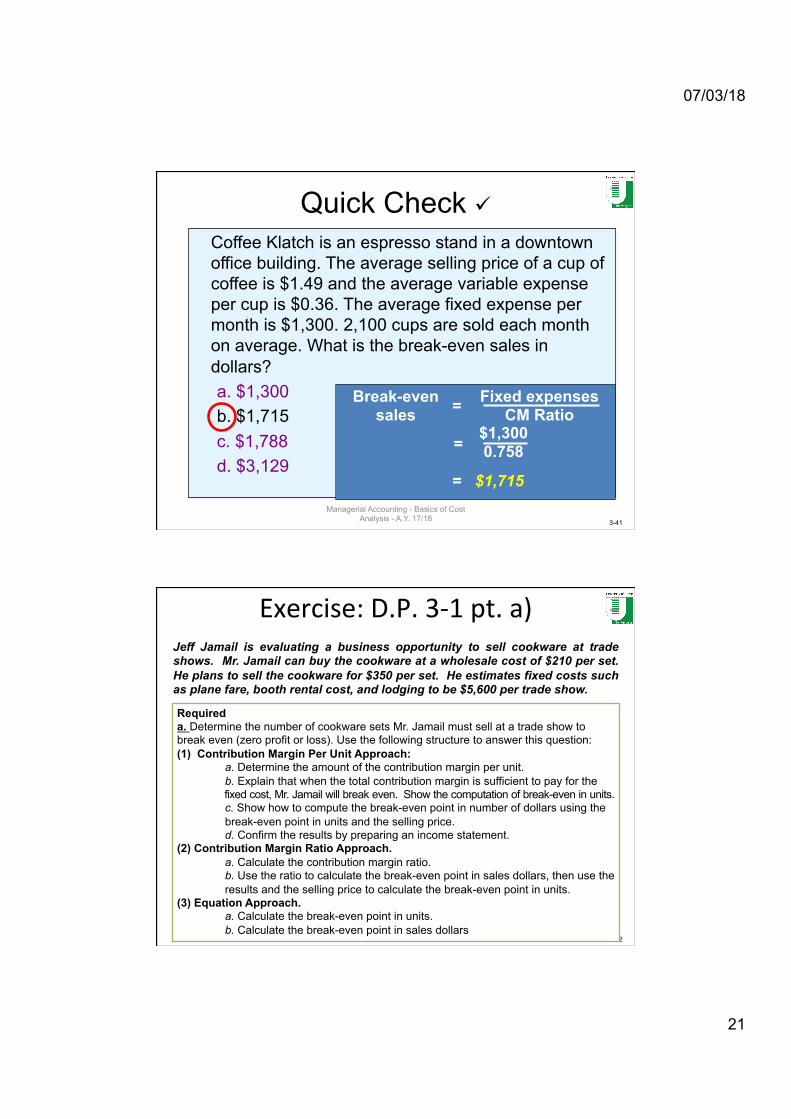
Coffee Klatch is an espresso stand in a downtown office building. The average selling price of a cup of coffee is $1.49 and the average variable expense per cup is $0.36. The average fixed expense per month is $1,300. 2,100 cups are sold each month on average. What is the break-even sales in dollars? a. $1,300 b. $1,715 c. $1,788 d. $3,129
Quick Check ü
Fixed expenses CM Ratio
Break-even sales
$1,300 0.758
= $1,715
=
=
Managerial Accounting - Basics of Cost Analysis - A.Y. 17/18
3-42
Exercise:D.P.3-1pt.a)Jeff Jamail is evaluating a business opportunity to sell cookware at trade shows. Mr. Jamail can buy the cookware at a wholesale cost of $210 per set. He plans to sell the cookware for $350 per set. He estimates fixed costs such as plane fare, booth rental cost, and lodging to be $5,600 per trade show.
Required a. Determine the number of cookware sets Mr. Jamail must sell at a trade show to break even (zero profit or loss). Use the following structure to answer this question: (1) Contribution Margin Per Unit Approach:
a. Determine the amount of the contribution margin per unit. b. Explain that when the total contribution margin is sufficient to pay for the fixed cost, Mr. Jamail will break even. Show the computation of break-even in units. c. Show how to compute the break-even point in number of dollars using the break-even point in units and the selling price. d. Confirm the results by preparing an income statement.
(2) Contribution Margin Ratio Approach. a. Calculate the contribution margin ratio. b. Use the ratio to calculate the break-even point in sales dollars, then use the results and the selling price to calculate the break-even point in units.
(3) Equation Approach. a. Calculate the break-even point in units. b. Calculate the break-even point in sales dollars
07/03/18
22
3-43
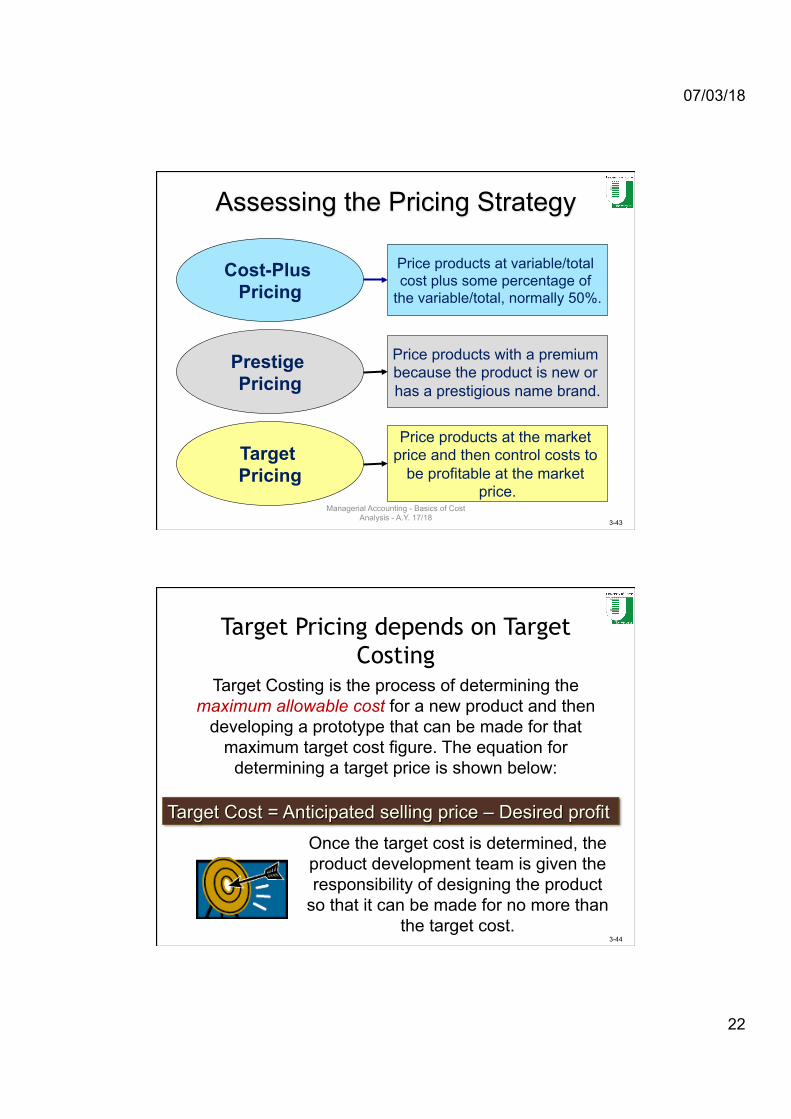
Assessing the Pricing Strategy
Cost-Plus Pricing
Prestige Pricing
Target Pricing
Price products at variable/total cost plus some percentage of
the variable/total, normally 50%.
Price products with a premium because the product is new or has a prestigious name brand.
Price products at the market price and then control costs to
be profitable at the market price.
Managerial Accounting - Basics of Cost Analysis - A.Y. 17/18
3-44
Target Pricing depends on Target Costing
Target Costing is the process of determining the maximum allowable cost for a new product and then
developing a prototype that can be made for that maximum target cost figure. The equation for
determining a target price is shown below:
Target Cost = Anticipated selling price – Desired profit Once the target cost is determined, the product development team is given the responsibility of designing the product
so that it can be made for no more than the target cost.
07/03/18
23
3-45
Reasons for Using Target Costing
Two characteristics of prices and product costs include:
1. The market (i.e., supply and demand) determines price.
2. Most of the cost of a product is determined in the design stage.
Managerial Accounting - Basics of Cost Analysis - A.Y. 16/17
3-46
Reasons for Using Target Costing
Target costing was developed in recognition of the two characteristics summarized on
the previous screen.
Target costing begins the product development process by recognizing and responding to existing market prices. Other approaches
allow engineers to design products without considering market prices.
07/03/18
24
3-47
Reasons for Using Target Costing
Target costing focuses a company’s cost reduction efforts in the product design stage of production.
Other approaches attempt to squeeze costs out of the manufacturing process after they come to the realization that the cost of a manufactured
product does not bear a profitable relationship to the existing market price.
3-48
Managing costs in the product design stage The Boeing Company is building the airframe of its 787 Dreamliner jet using
carbon fiber-reinforced plastic. While this type of plastic has been used in golf club shafts and tennis rackets, it has never been used to construct the exterior of an airplane. Boeing is excited about this innovative raw material because it allows enormous cost savings. For example, Boeing’s Dreamliner should be 20% more fuel efficient than the Boeing 767 or Airbus A330, its maintenance costs should be 30% less than aluminum planes, and the number of fasteners needed to assemble its fuselage should be 80% less than conventional airplanes. In addition, aluminum airplanes require costly corrosion inspections after 6 years of service, while the Dreamliner can fly 12 years before it would need a comparable inspection. To Boeing’s delight, the Dreamliner’s sales have “taken off” because “customers get tremendous bang for their bucks. For $120 million—about what they paid for the comparable Boeing 767-300 back in the 1980s—airlines get an all-new aircraft that flies faster than the competition and costs substantially less to operate.” Source: Stanley Holmes, “A Plastic Dream Machine,” BusinessWeek, June 20, 2005, pp. 32–36.
07/03/18
25
3-49
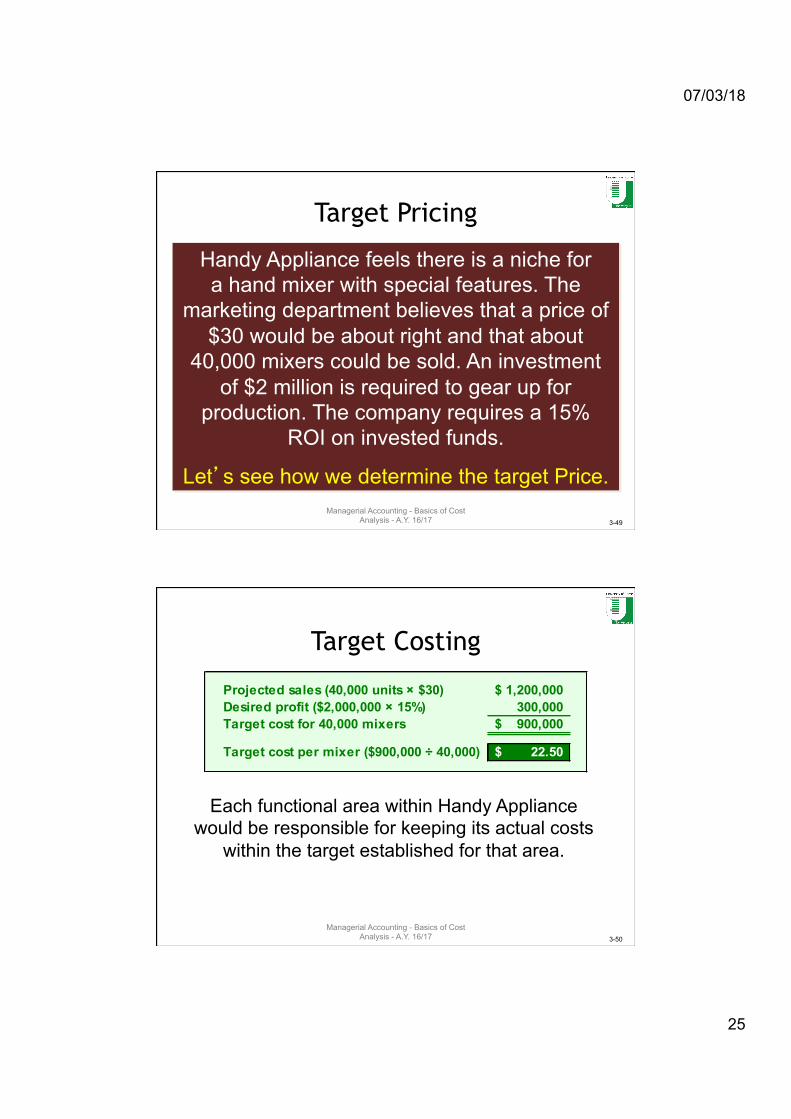
Target Pricing
Handy Appliance feels there is a niche for a hand mixer with special features. The
marketing department believes that a price of $30 would be about right and that about
40,000 mixers could be sold. An investment of $2 million is required to gear up for
production. The company requires a 15% ROI on invested funds.
Let’s see how we determine the target Price. Managerial Accounting - Basics of Cost
Analysis - A.Y. 16/17
3-50
Target Costing
Projected sales (40,000 units × $30) 1,200,000$ Desired profit ($2,000,000 × 15%) 300,000 Target cost for 40,000 mixers 900,000$
Target cost per mixer ($900,000 ÷ 40,000) 22.50$
Each functional area within Handy Appliance would be responsible for keeping its actual costs
within the target established for that area.
Managerial Accounting - Basics of Cost Analysis - A.Y. 16/17
07/03/18
26
3-51
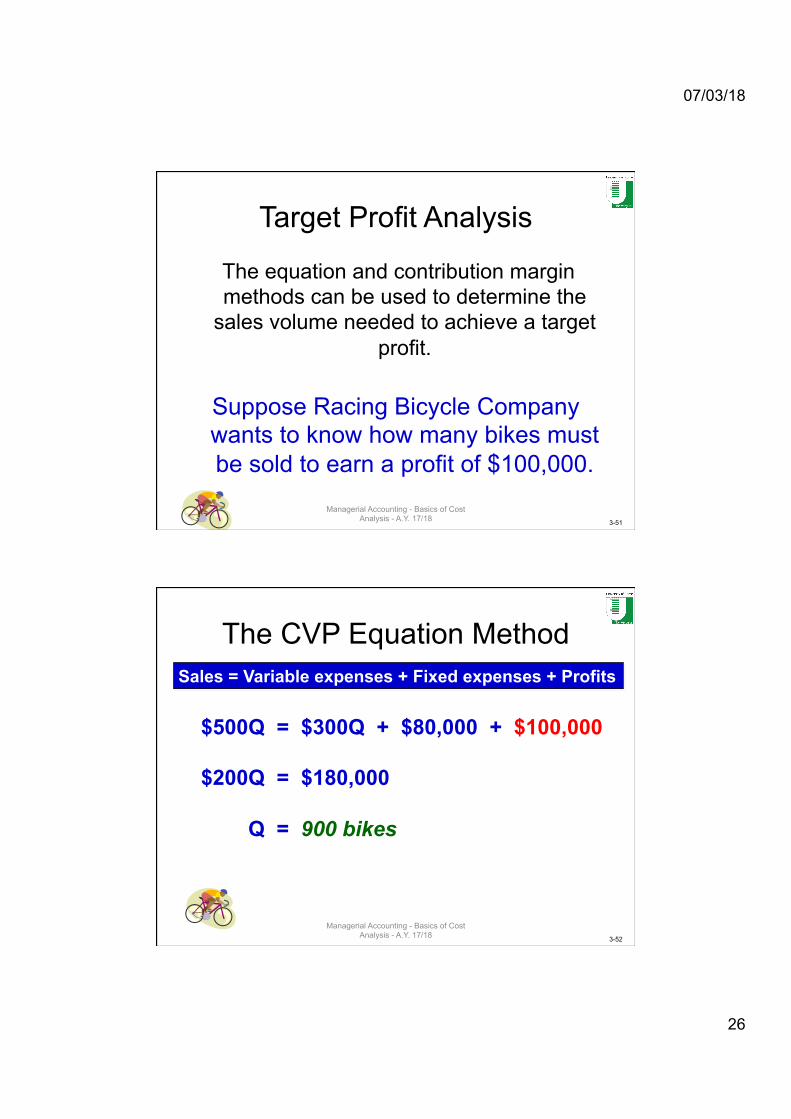
Target Profit Analysis
The equation and contribution margin methods can be used to determine the
sales volume needed to achieve a target profit.
Suppose Racing Bicycle Company wants to know how many bikes must be sold to earn a profit of $100,000.
Managerial Accounting - Basics of Cost
Analysis - A.Y. 17/18
3-52
The CVP Equation Method Sales = Variable expenses + Fixed expenses + Profits
$500Q = $300Q + $80,000 + $100,000 $200Q = $180,000 Q = 900 bikes
Managerial Accounting - Basics of Cost Analysis - A.Y. 17/18
07/03/18
27
3-53
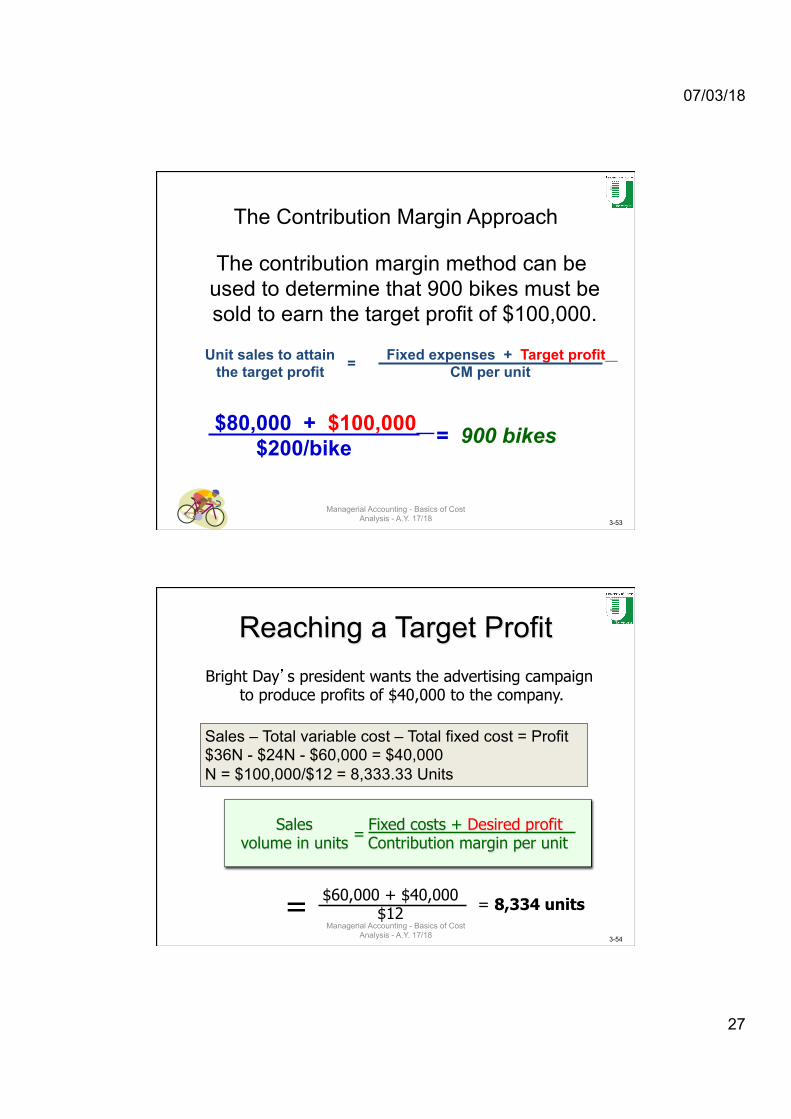
The Contribution Margin Approach
The contribution margin method can be used to determine that 900 bikes must be sold to earn the target profit of $100,000.
Fixed expenses + Target profit CM per unit = Unit sales to attain
the target profit
$80,000 + $100,000 $200/bike = 900 bikes
Managerial Accounting - Basics of Cost Analysis - A.Y. 17/18
3-54
Reaching a Target Profit Bright Day’s president wants the advertising campaign
to produce profits of $40,000 to the company.
Sales volume in units = Fixed costs + Desired profit
Contribution margin per unit
= $60,000 + $40,000 $12 = 8,334 units
Sales – Total variable cost – Total fixed cost = Profit $36N - $24N - $60,000 = $40,000 N = $100,000/$12 = 8,333.33 Units
Managerial Accounting - Basics of Cost Analysis - A.Y. 17/18
07/03/18
28
3-55
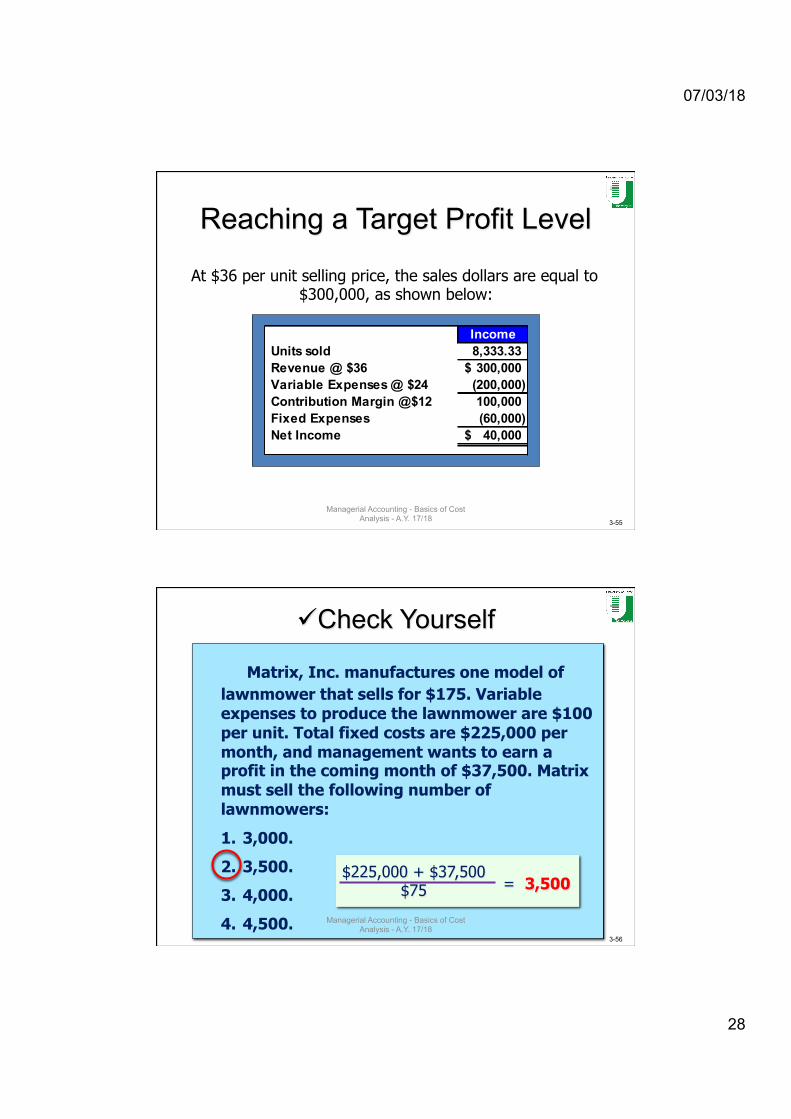
Reaching a Target Profit Level
At $36 per unit selling price, the sales dollars are equal to $300,000, as shown below:
IncomeUnits sold 8,333.33 Revenue @ $36 300,000$ Variable Expenses @ $24 (200,000) Contribution Margin @$12 100,000 Fixed Expenses (60,000) Net Income 40,000$
Managerial Accounting - Basics of Cost Analysis - A.Y. 17/18
3-56
üCheck Yourself
Matrix, Inc. manufactures one model of lawnmower that sells for $175. Variable expenses to produce the lawnmower are $100 per unit. Total fixed costs are $225,000 per month, and management wants to earn a profit in the coming month of $37,500. Matrix must sell the following number of lawnmowers:
1. 3,000.
2. 3,500.
3. 4,000.
4. 4,500.
$225,000 + $37,500 $75 = 3,500
Managerial Accounting - Basics of Cost Analysis - A.Y. 17/18
07/03/18
29
3-57
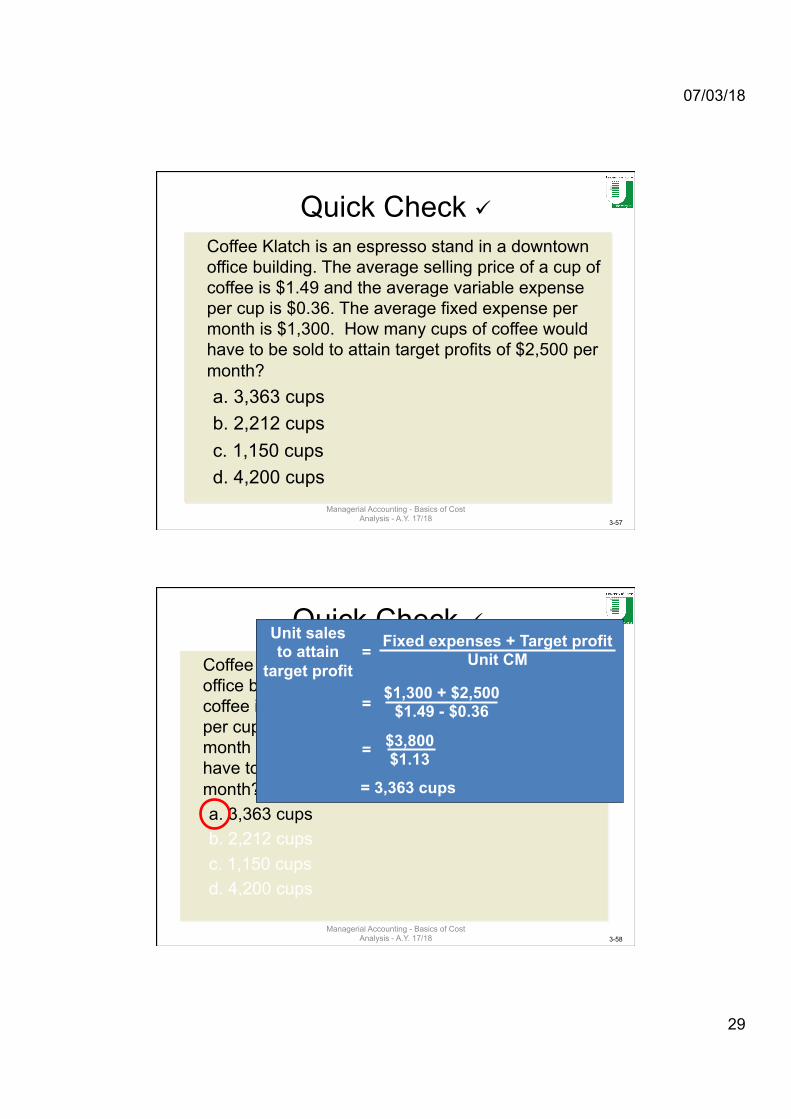
Quick Check ü
Coffee Klatch is an espresso stand in a downtown office building. The average selling price of a cup of coffee is $1.49 and the average variable expense per cup is $0.36. The average fixed expense per month is $1,300. How many cups of coffee would have to be sold to attain target profits of $2,500 per month? a. 3,363 cups b. 2,212 cups c. 1,150 cups d. 4,200 cups
Managerial Accounting - Basics of Cost Analysis - A.Y. 17/18
3-58
Coffee Klatch is an espresso stand in a downtown office building. The average selling price of a cup of coffee is $1.49 and the average variable expense per cup is $0.36. The average fixed expense per month is $1,300. How many cups of coffee would have to be sold to attain target profits of $2,500 per month? a. 3,363 cups b. 2,212 cups c. 1,150 cups d. 4,200 cups
Quick Check ü Fixed expenses + Target profit
Unit CM Unit sales to attain
target profit
= 3,363 cups
= $3,800 $1.13
$1,300 + $2,500 $1.49 - $0.36 =
=
Managerial Accounting - Basics of Cost Analysis - A.Y. 17/18
07/03/18
30
3-59
Exercise:D.P.3-1pt.b)&c)Jeff Jamail is evaluating a business opportunity to sell cookware at trade shows. Mr. Jamail can buy the cookware at a wholesale cost of $210 per set. He plans to sell the cookware for $350 per set. He estimates fixed costs such as plane fare, booth rental cost, and lodging to be $5,600 per trade show.
Required b.AssumeMr.Jamaildesirestoearnaprofitof$4,900pershow.
(1)Determinethesalesvolumeinunits(setsofcookware)necessarytoearnthedesiredprofit.(2)Determinethesalesvolumeindollarsnecessarytoearnthedesiredprofit.(3)Usingthecontribu9onmarginformat,prepareanincomestatementtoconfirmyouranswerstoparts1and2.
c.DrawaCVPgraphforMr.Jamail’sopera9onatatradeshow.
Managerial Accounting - Basics of Cost Analysis - A.Y. 17/18
3-60
Learning Objective
LO 4
Calculate and interpret the margin of safety measure.
Managerial Accounting - Basics of Cost Analysis - A.Y. 17/18
07/03/18
31
3-61
The Margin of Safety The margin of safety is the excess of
budgeted (or actual) sales over the break-even volume of sales.
Margin of safety = Total sales - Break-even sales
Let’s look at Racing Bicycle Company and determine the margin of safety.
Managerial Accounting - Basics of Cost Analysis - A.Y. 17/18
3-62
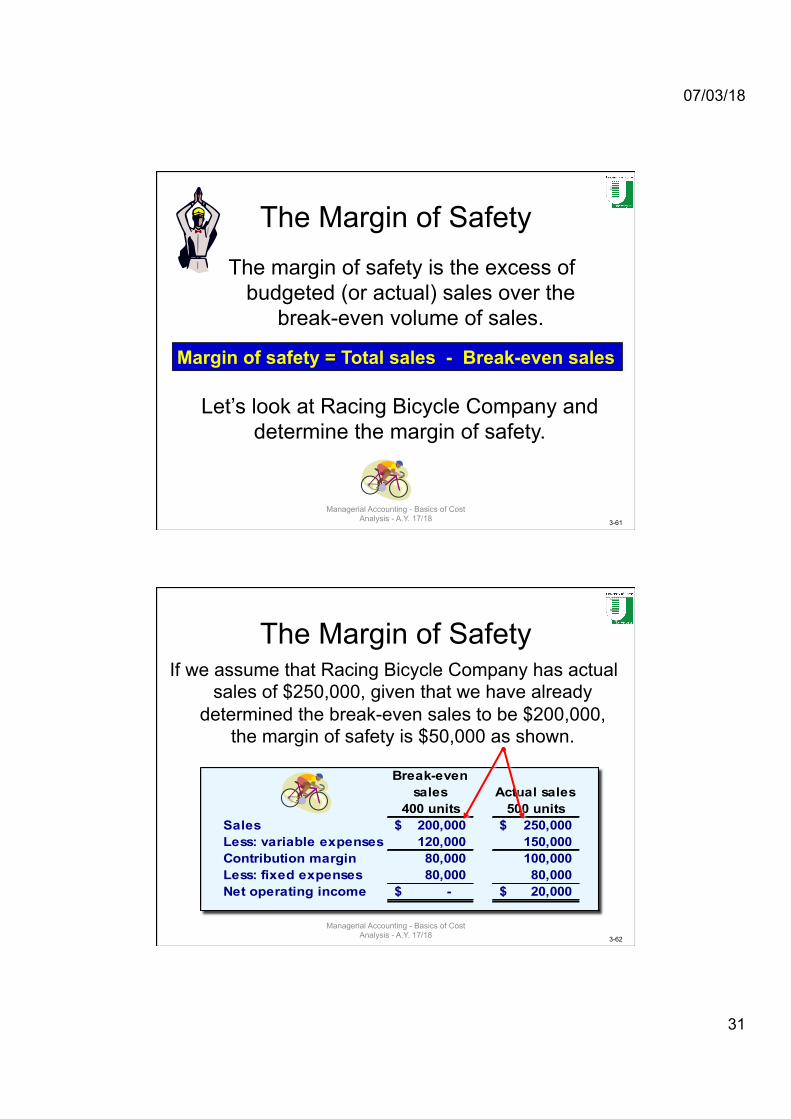
The Margin of Safety If we assume that Racing Bicycle Company has actual
sales of $250,000, given that we have already determined the break-even sales to be $200,000,
the margin of safety is $50,000 as shown.
Break-even sales
400 unitsActual sales
500 unitsSales 200,000$ 250,000$ Less: variable expenses 120,000 150,000 Contribution margin 80,000 100,000 Less: fixed expenses 80,000 80,000 Net operating income -$ 20,000$
Managerial Accounting - Basics of Cost Analysis - A.Y. 17/18
07/03/18
32
3-63
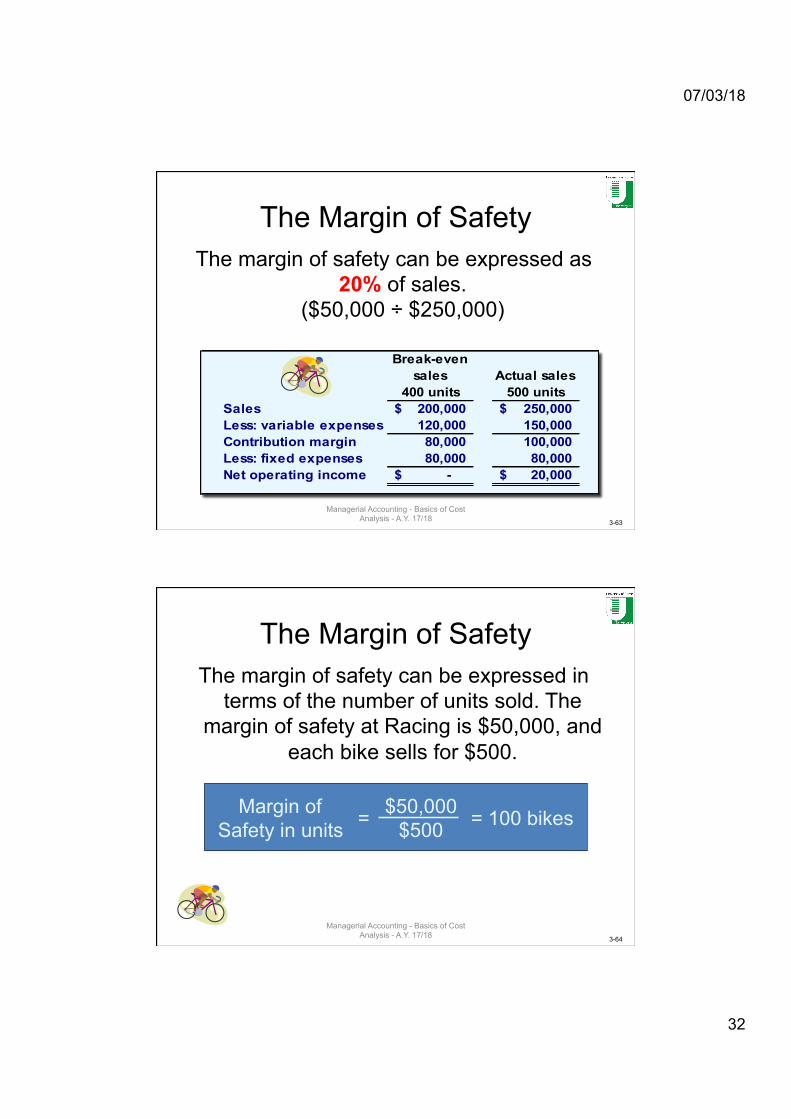
The Margin of Safety The margin of safety can be expressed as
20% of sales. ($50,000 ÷ $250,000)
Break-even sales
400 unitsActual sales
500 unitsSales 200,000$ 250,000$ Less: variable expenses 120,000 150,000 Contribution margin 80,000 100,000 Less: fixed expenses 80,000 80,000 Net operating income -$ 20,000$
Managerial Accounting - Basics of Cost Analysis - A.Y. 17/18
3-64
The Margin of Safety The margin of safety can be expressed in
terms of the number of units sold. The margin of safety at Racing is $50,000, and
each bike sells for $500.
Margin of Safety in units = = 100 bikes $50,000
$500
Managerial Accounting - Basics of Cost Analysis - A.Y. 17/18
07/03/18
33
3-65
Exercise:D.P.3-1pt.d)&e)Jeff Jamail is evaluating a business opportunity to sell cookware at trade shows. Mr. Jamail can buy the cookware at a wholesale cost of $210 per set. He plans to sell the cookware for $350 per set. He estimates fixed costs such as plane fare, booth rental cost, and lodging to be $5,600 per trade show.
Required d.Determinethemarginofsafetybetweenthesalesvolumeatthebreak-evenpointandthesalesvolumerequiredtoearnthedesiredprofit.Determinethemarginofsafetybothinsalesdollarsandasapercentage.e.AVerresearchingthemarket,Mr.Jamailconcludesthatthe$350persetsellingpriceistoohigh.Customerswilllikelypayonly$310perset.Mr.Jamailbelieveshecanobtainacostreduc9onfromhissupplierof$20perset(variablecostdropsfrom$210persetto$190perset)ands9llprovidethelevelofqualityrequiredtoachieveasalesvolumeof75sets.Underthesecircumstances,whatamountoffixedcostscanMr.Jamailincurands9llobtainthetargetprofitof$4,900?Supportyouranswerwithappropriatecomputa9ons.
3-66
Learning Objective
LO5
Conduct sensitivity analysis using spreadsheet
software and the equation method.
Managerial Accounting - Basics of Cost Analysis - A.Y. 17/18
07/03/18
34
3-67
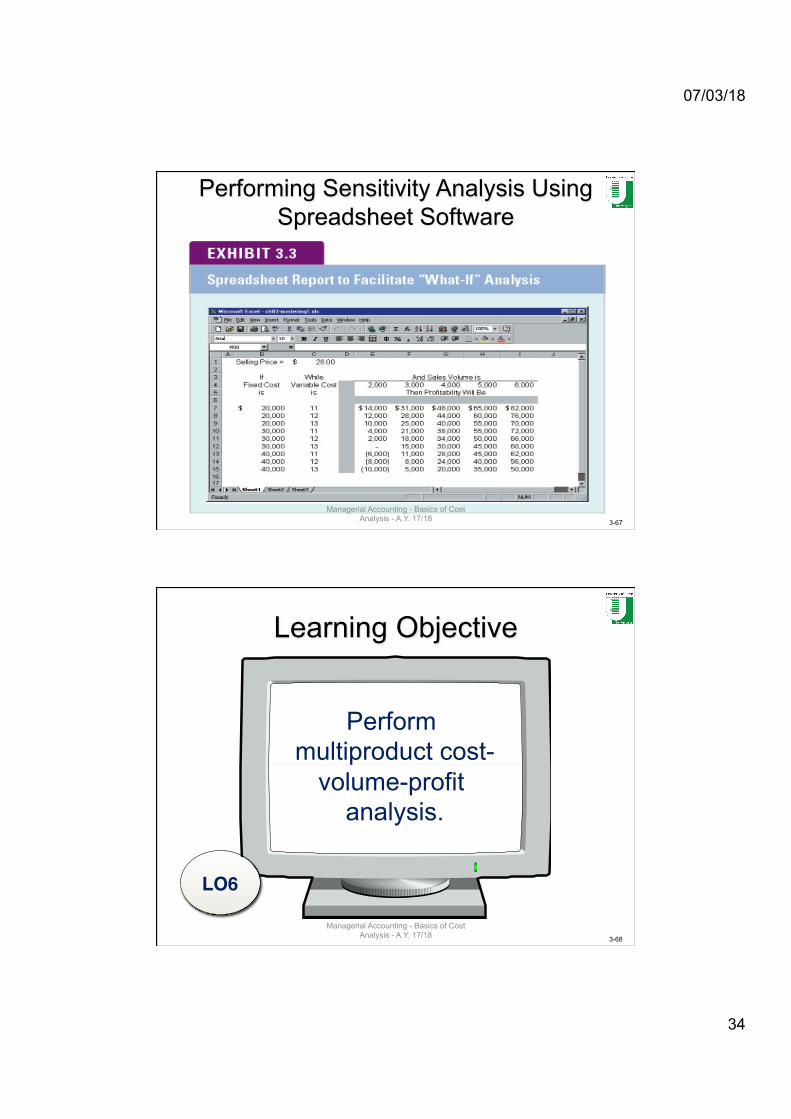
Performing Sensitivity Analysis Using Spreadsheet Software
Managerial Accounting - Basics of Cost Analysis - A.Y. 17/18
3-68
Learning Objective
LO6
Perform multiproduct cost-
volume-profit analysis.
Managerial Accounting - Basics of Cost Analysis - A.Y. 17/18
07/03/18
35
3-69
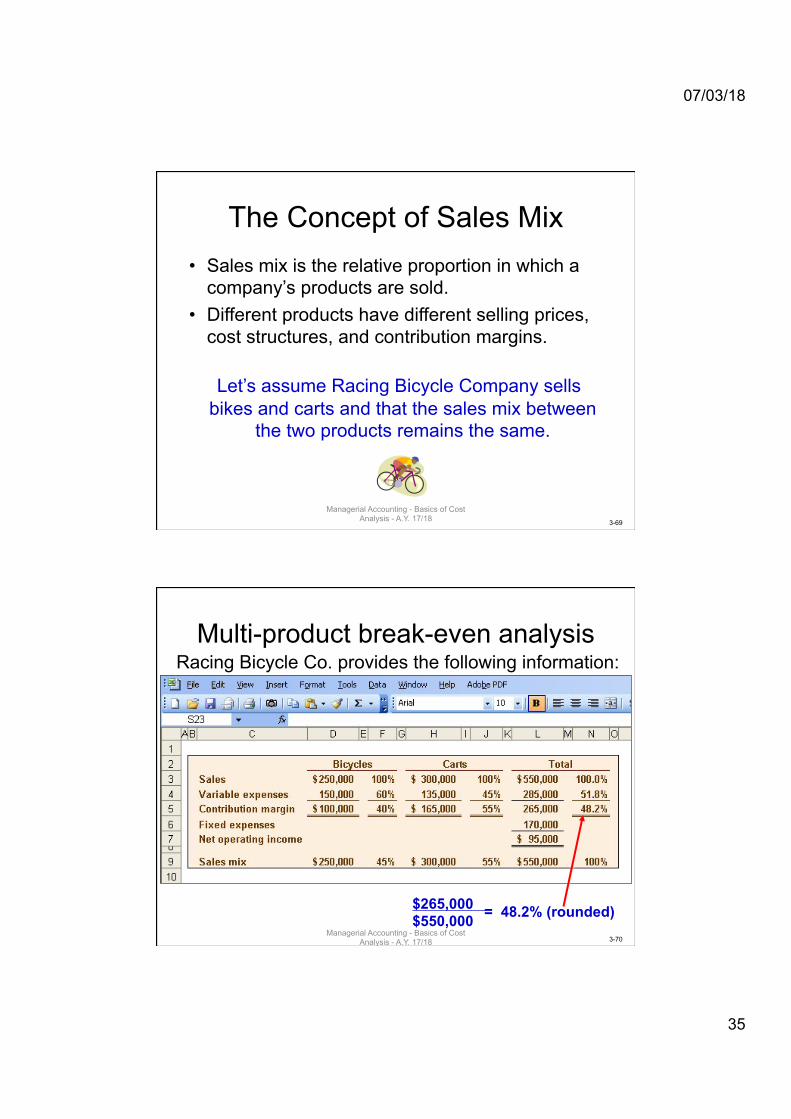
The Concept of Sales Mix • Sales mix is the relative proportion in which a
company’s products are sold. • Different products have different selling prices,
cost structures, and contribution margins. Let’s assume Racing Bicycle Company sells bikes and carts and that the sales mix between
the two products remains the same.
Managerial Accounting - Basics of Cost Analysis - A.Y. 17/18
3-70
Multi-product break-even analysis Racing Bicycle Co. provides the following information:
$265,000 $550,000 = 48.2% (rounded)
Managerial Accounting - Basics of Cost Analysis - A.Y. 17/18
07/03/18
36
3-71
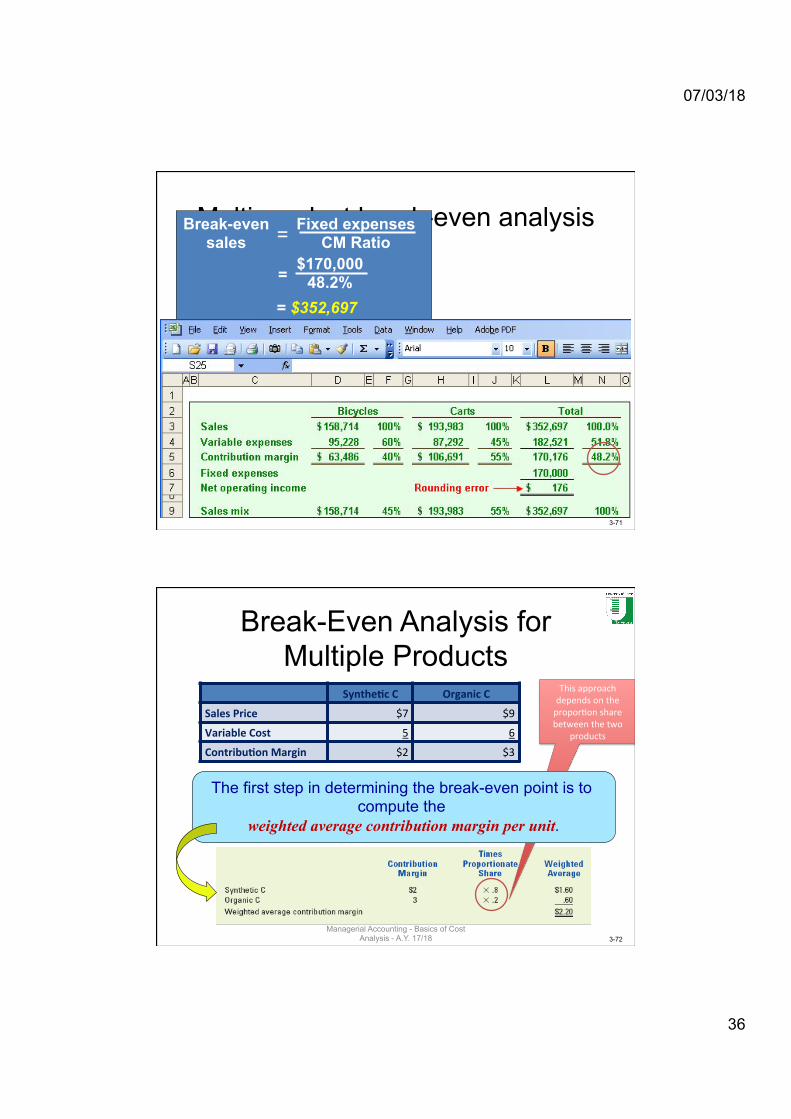
Multi-product break-even analysis Fixed expenses CM Ratio
Break-even sales
$170,000 48.2%
= $352,697
=
=
3-72
Break-Even Analysis for Multiple Products
Synthe,cC OrganicC
SalesPrice $7 $9
VariableCost 5 6
Contribu,onMargin $2 $3
Thisapproachdependsonthepropor9onsharebetweenthetwo
products
The first step in determining the break-even point is to compute the
weighted average contribution margin per unit.
Managerial Accounting - Basics of Cost Analysis - A.Y. 17/18
07/03/18
37
3-73
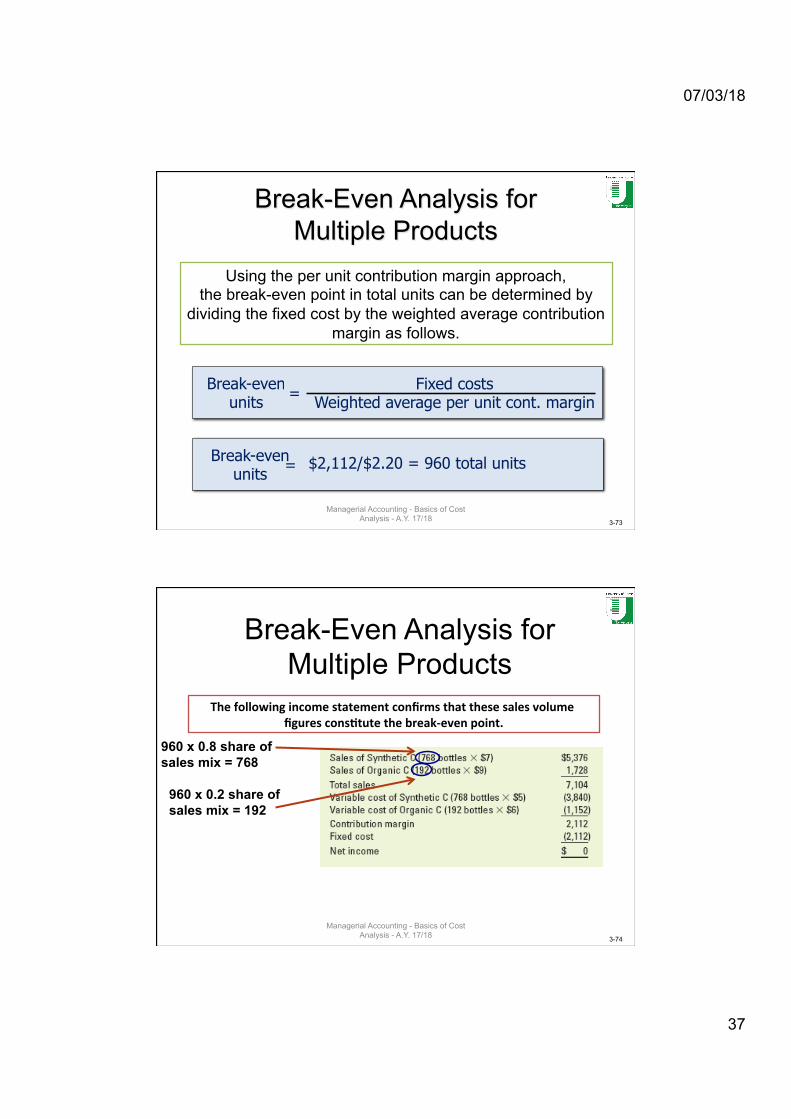
Break-Even Analysis for Multiple Products
Using the per unit contribution margin approach, the break-even point in total units can be determined by
dividing the fixed cost by the weighted average contribution margin as follows.
Break-even units = Fixed costs
Weighted average per unit cont. margin
Break-even units = $2,112/$2.20 = 960 total units
Managerial Accounting - Basics of Cost Analysis - A.Y. 17/18
3-74
Break-Even Analysis for Multiple Products
Thefollowingincomestatementconfirmsthatthesesalesvolumefigurescons,tutethebreak-evenpoint.
960 x 0.8 share of sales mix = 768
960 x 0.2 share of sales mix = 192
Managerial Accounting - Basics of Cost Analysis - A.Y. 17/18
07/03/18
38
3-75
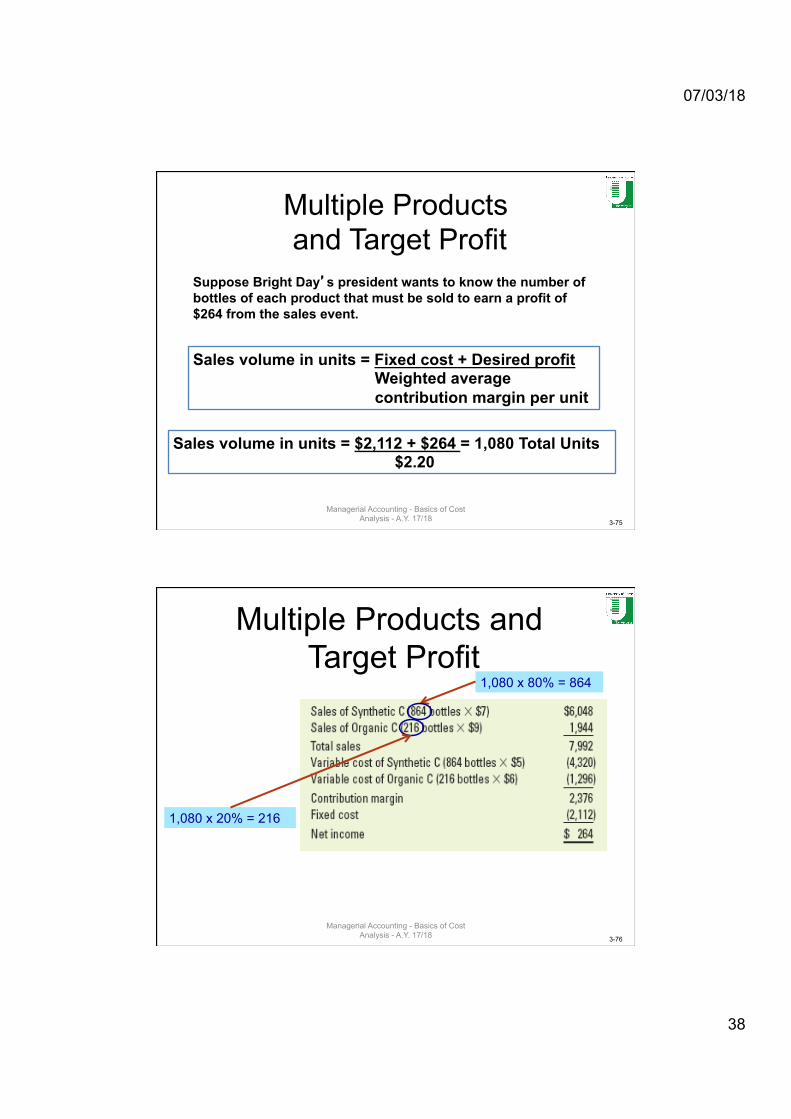
Multiple Products and Target Profit
Suppose Bright Day’s president wants to know the number of bottles of each product that must be sold to earn a profit of $264 from the sales event.
Sales volume in units = Fixed cost + Desired profit Weighted average contribution margin per unit
Sales volume in units = $2,112 + $264 = 1,080 Total Units $2.20
Managerial Accounting - Basics of Cost Analysis - A.Y. 17/18
3-76
1,080 x 20% = 216
1,080 x 80% = 864
Multiple Products and Target Profit
Managerial Accounting - Basics of Cost Analysis - A.Y. 17/18
07/03/18
39
3-77
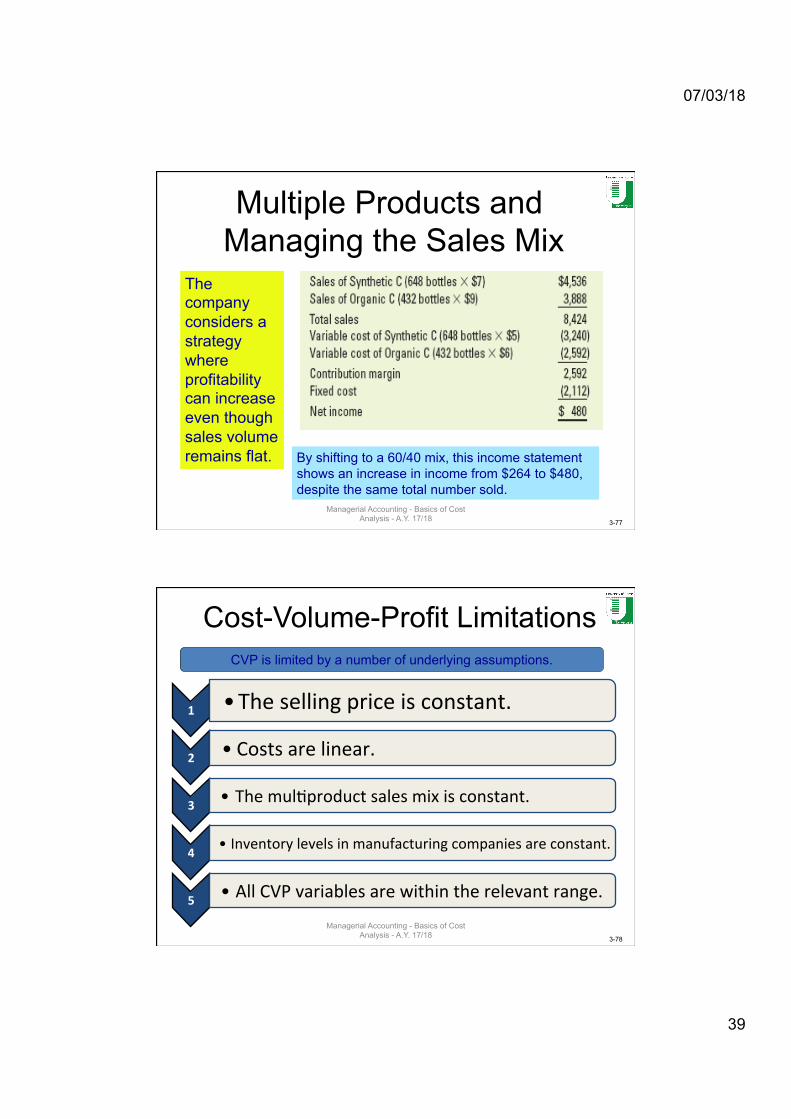
Multiple Products and Managing the Sales Mix
The company considers a strategy where profitability can increase even though sales volume remains flat. By shifting to a 60/40 mix, this income statement
shows an increase in income from $264 to $480, despite the same total number sold.
Managerial Accounting - Basics of Cost Analysis - A.Y. 17/18
3-78
Cost-Volume-Profit Limitations
1 • Thesellingpriceisconstant.
2 • Costsarelinear.
3 • Themul9productsalesmixisconstant.
4• Inventorylevelsinmanufacturingcompaniesareconstant.
5 • AllCVPvariablesarewithintherelevantrange.
CVP is limited by a number of underlying assumptions.
Managerial Accounting - Basics of Cost Analysis - A.Y. 17/18
07/03/18
40
3-79
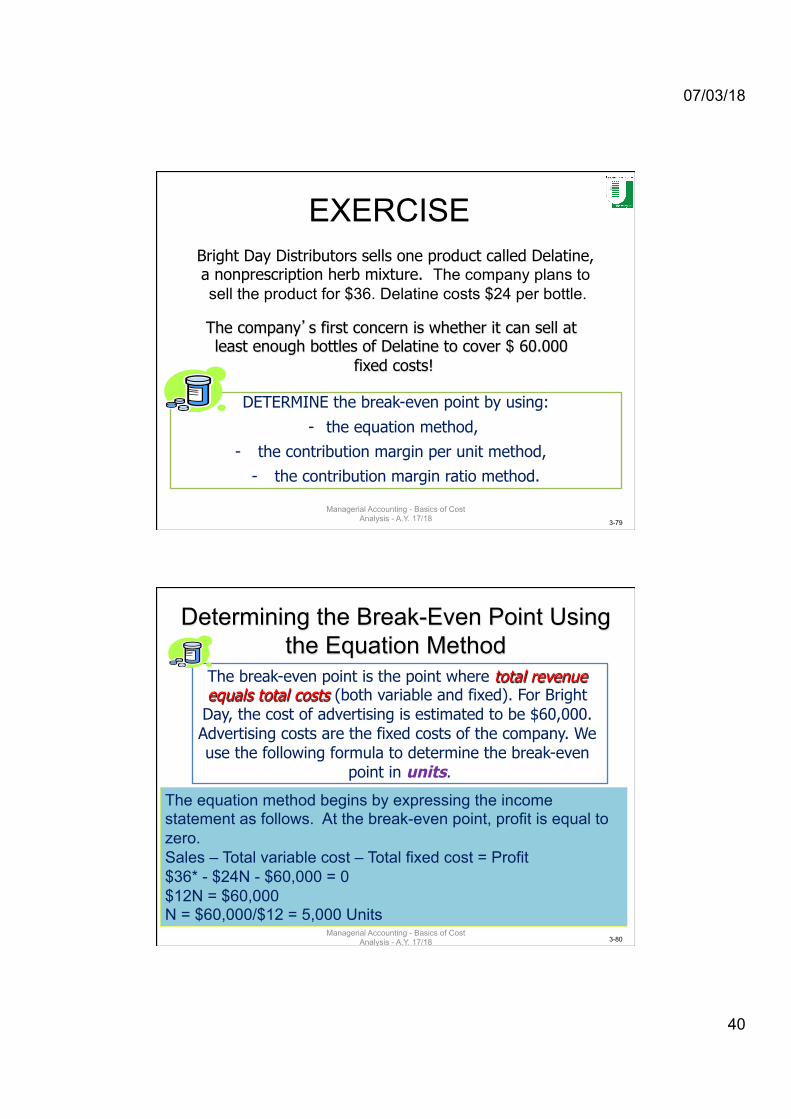
Bright Day Distributors sells one product called Delatine, a nonprescription herb mixture. The company plans to sell the product for $36. Delatine costs $24 per bottle.
The company’s first concern is whether it can sell at least enough bottles of Delatine to cover $ 60.000
fixed costs!
DETERMINE the break-even point by using:
- the equation method,
- the contribution margin per unit method,
- the contribution margin ratio method.
EXERCISE
Managerial Accounting - Basics of Cost Analysis - A.Y. 17/18
3-80
Determining the Break-Even Point Using the Equation Method
The equation method begins by expressing the income statement as follows. At the break-even point, profit is equal to zero. Sales – Total variable cost – Total fixed cost = Profit $36* - $24N - $60,000 = 0 $12N = $60,000 N = $60,000/$12 = 5,000 Units
The break-even point is the point where total revenue equals total costs (both variable and fixed). For Bright
Day, the cost of advertising is estimated to be $60,000. Advertising costs are the fixed costs of the company. We use the following formula to determine the break-even
point in units.
Managerial Accounting - Basics of Cost Analysis - A.Y. 17/18
07/03/18
41
3-81
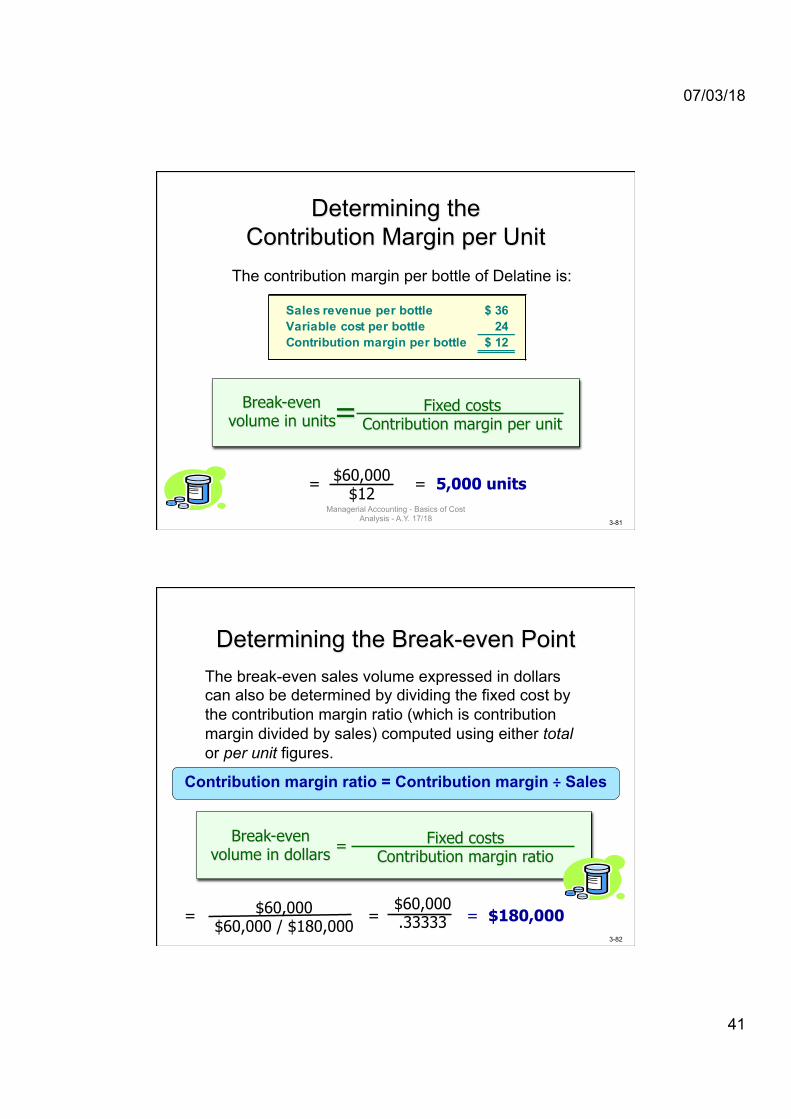
Determining the Contribution Margin per Unit
The contribution margin per bottle of Delatine is:
Sales revenue per bottle 36$ Variable cost per bottle 24 Contribution margin per bottle 12$
Break-even volume in units = Fixed costs
Contribution margin per unit
= $60,000 $12
= 5,000 units Managerial Accounting - Basics of Cost
Analysis - A.Y. 17/18
3-82
Determining the Break-even Point
Break-even volume in dollars = Fixed costs
Contribution margin ratio
= $60,000 .33333 = $180,000
The break-even sales volume expressed in dollars can also be determined by dividing the fixed cost by the contribution margin ratio (which is contribution margin divided by sales) computed using either total or per unit figures.
Contribution margin ratio = Contribution margin ÷ Sales
$60,000 $60,000 / $180,000
=
07/03/18
42
3-83
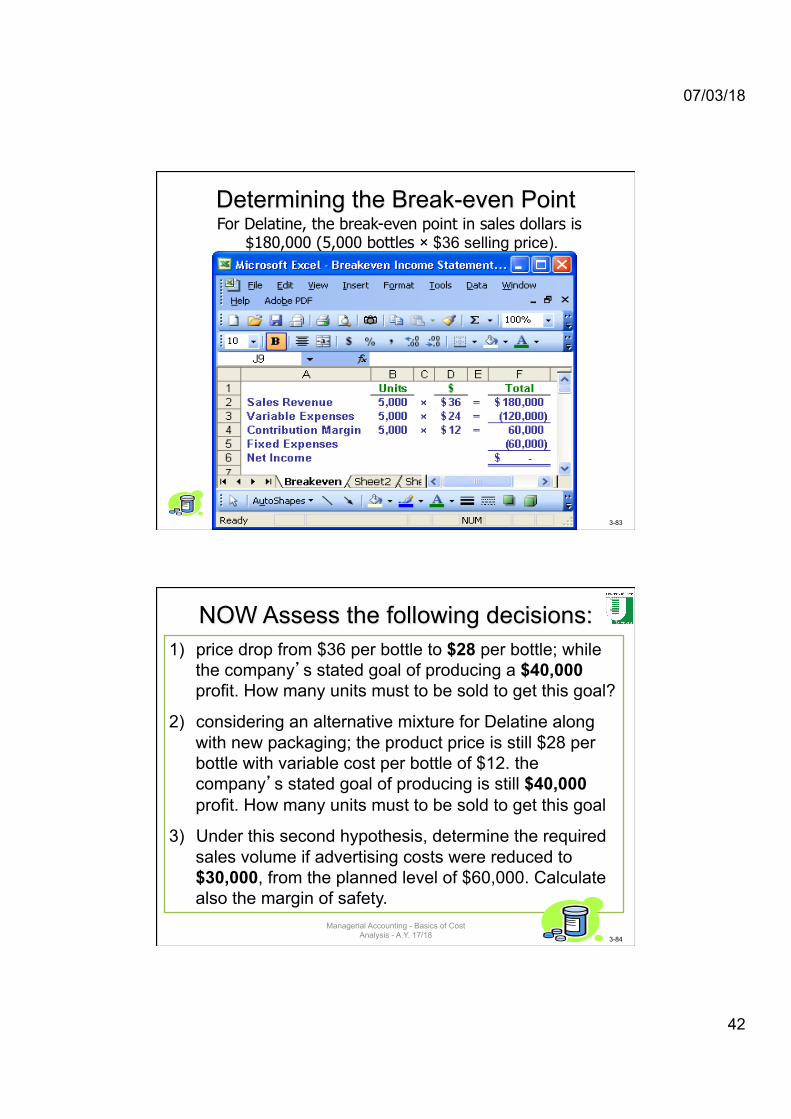
Determining the Break-even Point For Delatine, the break-even point in sales dollars is
$180,000 (5,000 bottles × $36 selling price).
3-84
NOW Assess the following decisions: 1) price drop from $36 per bottle to $28 per bottle; while
the company’s stated goal of producing a $40,000 profit. How many units must to be sold to get this goal?
2) considering an alternative mixture for Delatine along with new packaging; the product price is still $28 per bottle with variable cost per bottle of $12. the company’s stated goal of producing is still $40,000 profit. How many units must to be sold to get this goal
3) Under this second hypothesis, determine the required sales volume if advertising costs were reduced to $30,000, from the planned level of $60,000. Calculate also the margin of safety.
Managerial Accounting - Basics of Cost Analysis - A.Y. 17/18
07/03/18
43
3-85
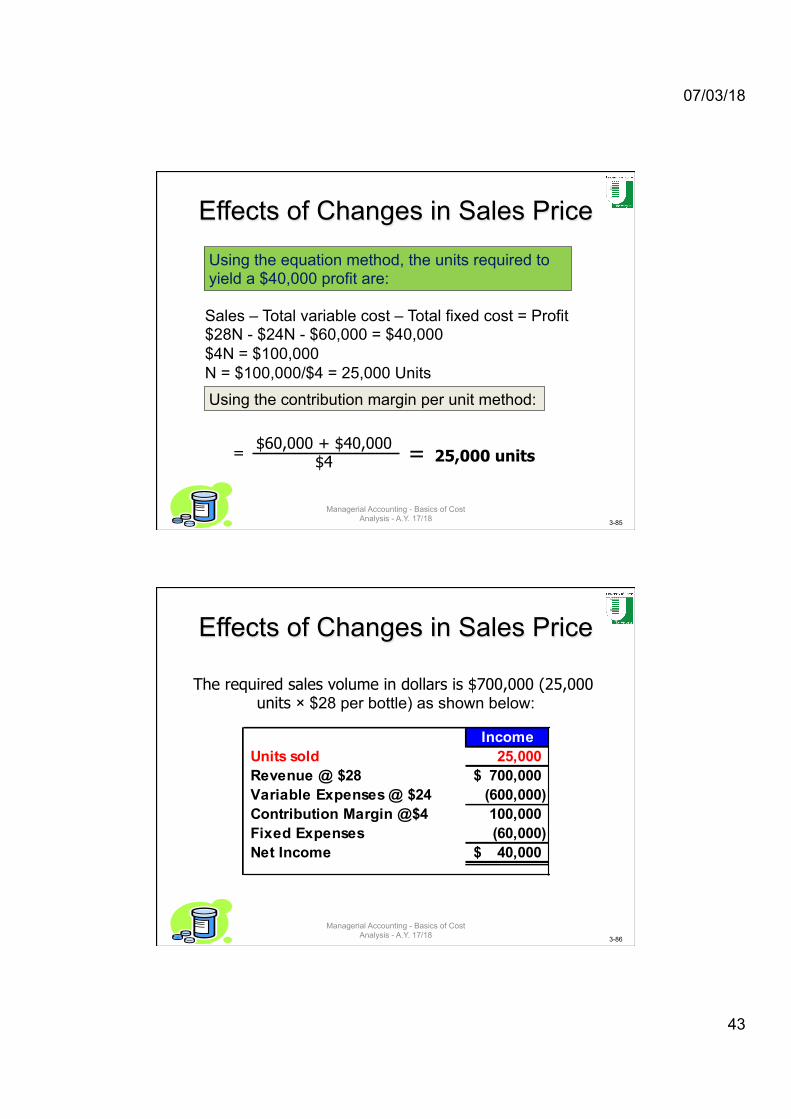
Effects of Changes in Sales Price
Sales – Total variable cost – Total fixed cost = Profit $28N - $24N - $60,000 = $40,000 $4N = $100,000 N = $100,000/$4 = 25,000 Units
Using the equation method, the units required to yield a $40,000 profit are:
Using the contribution margin per unit method:
= $60,000 + $40,000 $4 = 25,000 units
Managerial Accounting - Basics of Cost Analysis - A.Y. 17/18
3-86
Effects of Changes in Sales Price
The required sales volume in dollars is $700,000 (25,000 units × $28 per bottle) as shown below:
IncomeUnits sold 25,000 Revenue @ $28 700,000$ Variable Expenses @ $24 (600,000) Contribution Margin @$4 100,000 Fixed Expenses (60,000) Net Income 40,000$
Managerial Accounting - Basics of Cost Analysis - A.Y. 17/18
07/03/18
44
3-87
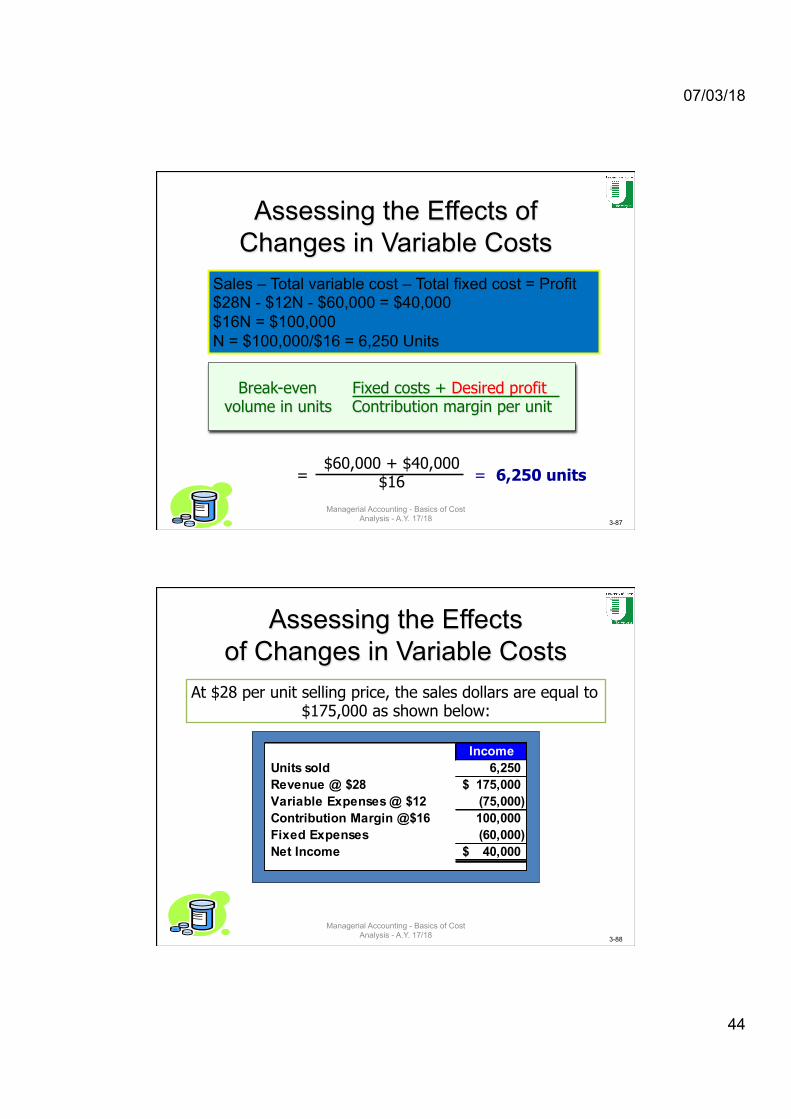
Assessing the Effects of Changes in Variable Costs
Break-even volume in units = Fixed costs + Desired profit
Contribution margin per unit
= $60,000 + $40,000
$16 = 6,250 units
Sales – Total variable cost – Total fixed cost = Profit $28N - $12N - $60,000 = $40,000 $16N = $100,000 N = $100,000/$16 = 6,250 Units
Managerial Accounting - Basics of Cost Analysis - A.Y. 17/18
3-88
Assessing the Effects of Changes in Variable Costs
At $28 per unit selling price, the sales dollars are equal to $175,000 as shown below:
IncomeUnits sold 6,250 Revenue @ $28 175,000$ Variable Expenses @ $12 (75,000) Contribution Margin @$16 100,000 Fixed Expenses (60,000) Net Income 40,000$
Managerial Accounting - Basics of Cost Analysis - A.Y. 17/18
07/03/18
45
3-89
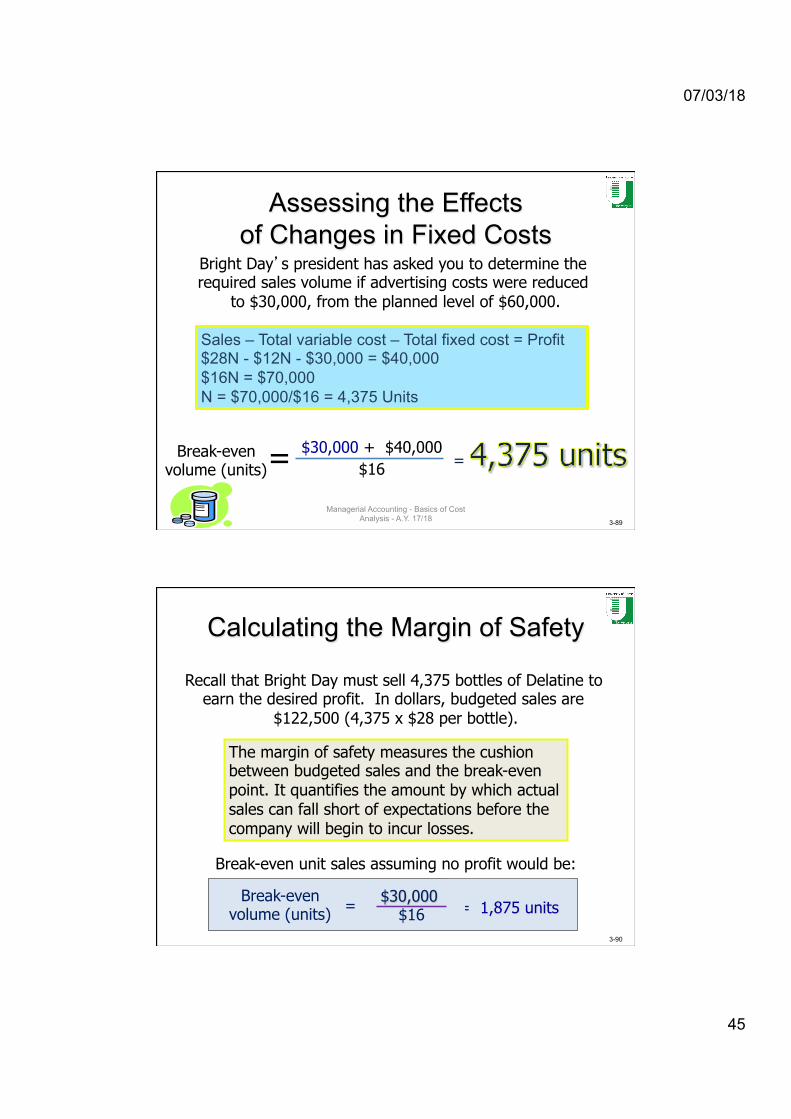
Assessing the Effects of Changes in Fixed Costs
Bright Day’s president has asked you to determine the required sales volume if advertising costs were reduced
to $30,000, from the planned level of $60,000.
Sales – Total variable cost – Total fixed cost = Profit $28N - $12N - $30,000 = $40,000 $16N = $70,000 N = $70,000/$16 = 4,375 Units
= $30,000 + $40,000 $16 = Break-even
volume (units)
Managerial Accounting - Basics of Cost Analysis - A.Y. 17/18
3-90
Calculating the Margin of Safety
Recall that Bright Day must sell 4,375 bottles of Delatine to earn the desired profit. In dollars, budgeted sales are
$122,500 (4,375 x $28 per bottle).
Break-even unit sales assuming no profit would be:
= = 1,875 units $30,000
$16 Break-even
volume (units)
The margin of safety measures the cushion between budgeted sales and the break-even point. It quantifies the amount by which actual sales can fall short of expectations before the company will begin to incur losses.
07/03/18
46
3-91
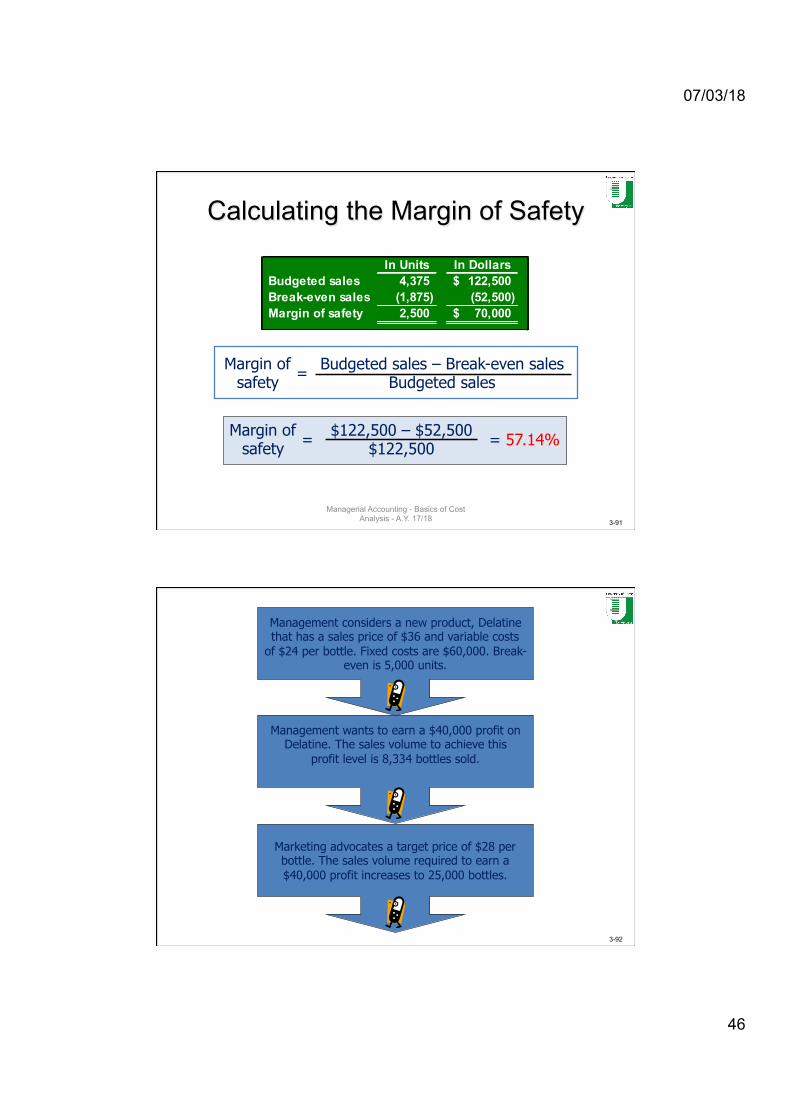
Calculating the Margin of Safety
In Units In DollarsBudgeted sales 4,375 122,500$ Break-even sales (1,875) (52,500) Margin of safety 2,500 70,000$
Margin of safety = Budgeted sales – Break-even sales
Budgeted sales
Margin of safety = $122,500 – $52,500
$122,500 = 57.14%
Managerial Accounting - Basics of Cost Analysis - A.Y. 17/18
3-92
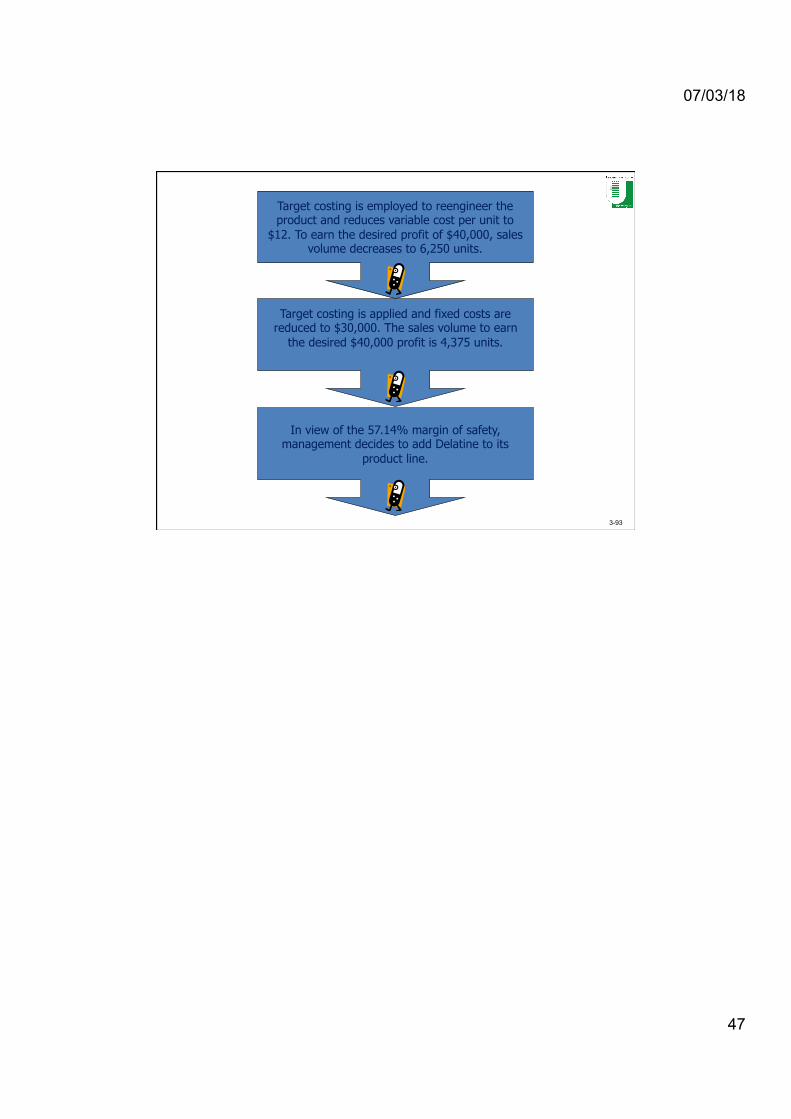
Management considers a new product, Delatine that has a sales price of $36 and variable costs
of $24 per bottle. Fixed costs are $60,000. Break- even is 5,000 units.
Management wants to earn a $40,000 profit on Delatine. The sales volume to achieve this
profit level is 8,334 bottles sold.
Marketing advocates a target price of $28 per bottle. The sales volume required to earn a $40,000 profit increases to 25,000 bottles.
07/03/18
47
3-93
Target costing is employed to reengineer the product and reduces variable cost per unit to
$12. To earn the desired profit of $40,000, sales volume decreases to 6,250 units.
Target costing is applied and fixed costs are reduced to $30,000. The sales volume to earn
the desired $40,000 profit is 4,375 units.
In view of the 57.14% margin of safety, management decides to add Delatine to its
product line.
Related Documents