Learner Outcome Measures for Further Education, Work-Based Learning and Adult Community Learning: 2012/13 The latest figures on learner outcomes in the Further Education (FE), Work-based Learning (WBL) and Adult Community Learning (ACL) sectors in Wales show: The overall learning activity success rate for FE in 2012/13 was 84 per cent. WBL framework success rates were 87 per cent and 85 per cent in Apprenticeship and Foundation Apprenticeship programmes respectively. The overall learning activity success rate for ACL was 84 per cent. Chart 1: Trends in learner outcomes In 2011/12, a set of data management principles were issued to learning providers to address inconsistencies in the recording of data. Pages 5 to 7 of this release provide further detail regarding the continuing impact of these principles on national figures. An increase in the number of Apprenticeship programmes ending within 8 weeks without completion was observed in 2012/13. The impact of this data issue on the Apprenticeship framework success rate is discussed in detail on pages 7 and 8 of this release. SDR 57/2014 3 April 2014 Statistician: Scott Clifford Tel: 029 2082 5067 E-mail: [email protected] Next Update: April 2015 (provisional) Twitter: www.twitter.com/statisticswales | www.twitter.com/ystadegaucymru

Welcome message from author
This document is posted to help you gain knowledge. Please leave a comment to let me know what you think about it! Share it to your friends and learn new things together.
Transcript
2
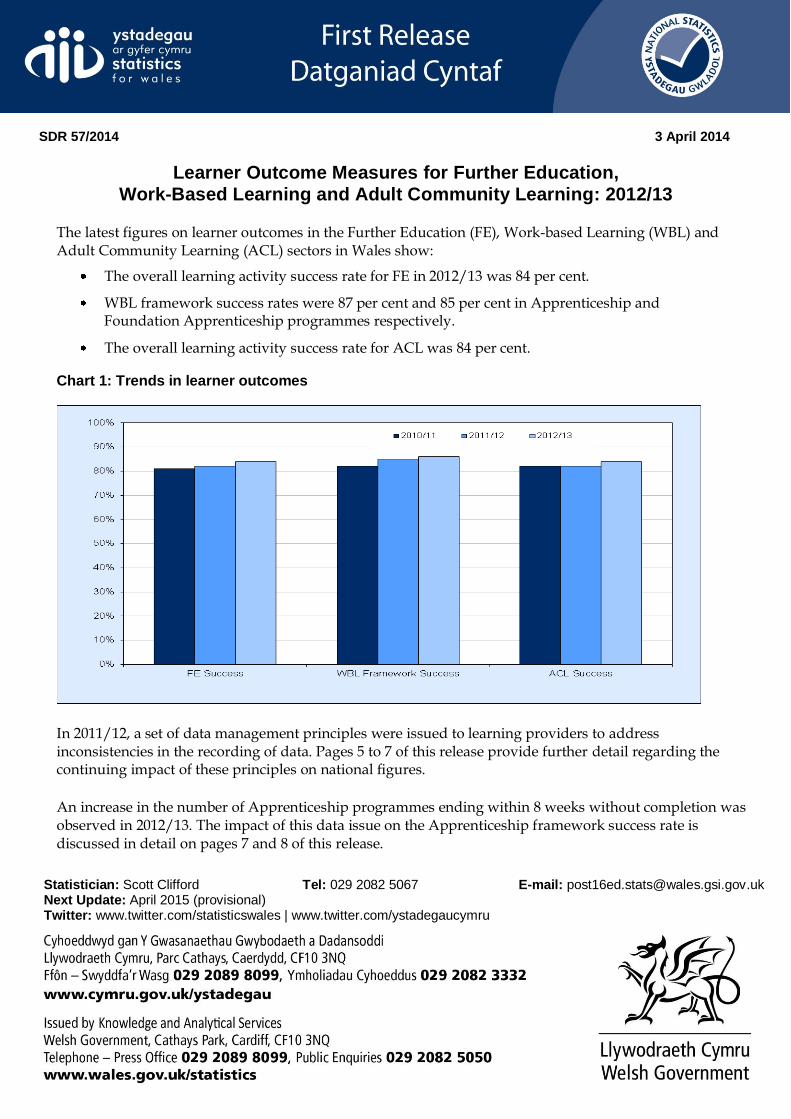
Learner Outcome Measures for Further Education, Work-Based Learning and Adult Community Learning: 2012/13
The latest figures on learner outcomes in the Further Education (FE), Work-based Learning (WBL) and Adult Community Learning (ACL) sectors in Wales show:
The overall learning activity success rate for FE in 2012/13 was 84 per cent.
WBL framework success rates were 87 per cent and 85 per cent in Apprenticeship and Foundation Apprenticeship programmes respectively.
The overall learning activity success rate for ACL was 84 per cent.
Chart 1: Trends in learner outcomes
In 2011/12, a set of data management principles were issued to learning providers to address inconsistencies in the recording of data. Pages 5 to 7 of this release provide further detail regarding the continuing impact of these principles on national figures.
An increase in the number of Apprenticeship programmes ending within 8 weeks without completion was observed in 2012/13. The impact of this data issue on the Apprenticeship framework success rate is discussed in detail on pages 7 and 8 of this release.
SDR 57/2014 3 April 2014
Statistician: Scott Clifford Tel: 029 2082 5067 E-mail: [email protected] Next Update: March 2014 (provisional) Twitter: www.twitter.com/statisticswales | www.twitter.com/ystadegaucymru
Statistician: Scott Clifford Tel: 029 2082 5067 E-mail: [email protected] Next Update: April 2015 (provisional) Twitter: www.twitter.com/statisticswales | www.twitter.com/ystadegaucymru
2
Outcomes in further education
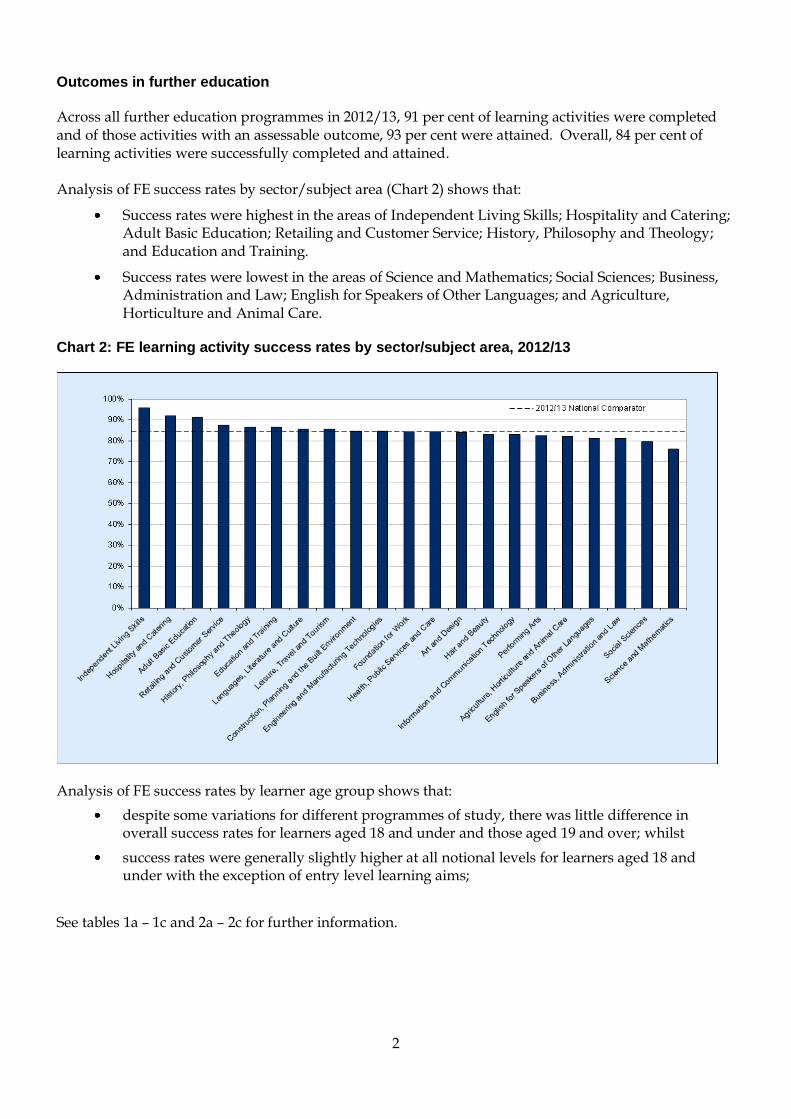
Across all further education programmes in 2012/13, 91 per cent of learning activities were completed and of those activities with an assessable outcome, 93 per cent were attained. Overall, 84 per cent of learning activities were successfully completed and attained. Analysis of FE success rates by sector/subject area (Chart 2) shows that:
Success rates were highest in the areas of Independent Living Skills; Hospitality and Catering; Adult Basic Education; Retailing and Customer Service; History, Philosophy and Theology; and Education and Training.
Success rates were lowest in the areas of Science and Mathematics; Social Sciences; Business, Administration and Law; English for Speakers of Other Languages; and Agriculture, Horticulture and Animal Care.
Chart 2: FE learning activity success rates by sector/subject area, 2012/13
Analysis of FE success rates by learner age group shows that:
despite some variations for different programmes of study, there was little difference in overall success rates for learners aged 18 and under and those aged 19 and over; whilst
success rates were generally slightly higher at all notional levels for learners aged 18 and under with the exception of entry level learning aims;
See tables 1a – 1c and 2a – 2c for further information.
3
Outcomes in work-based learning
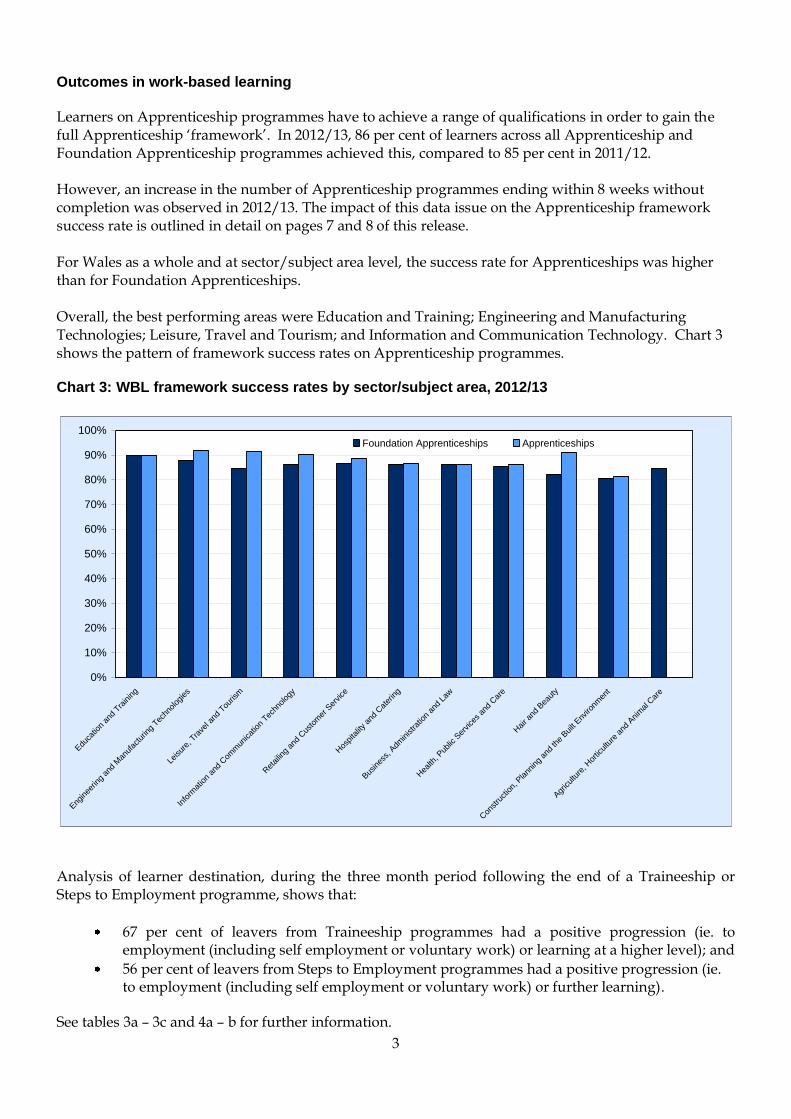
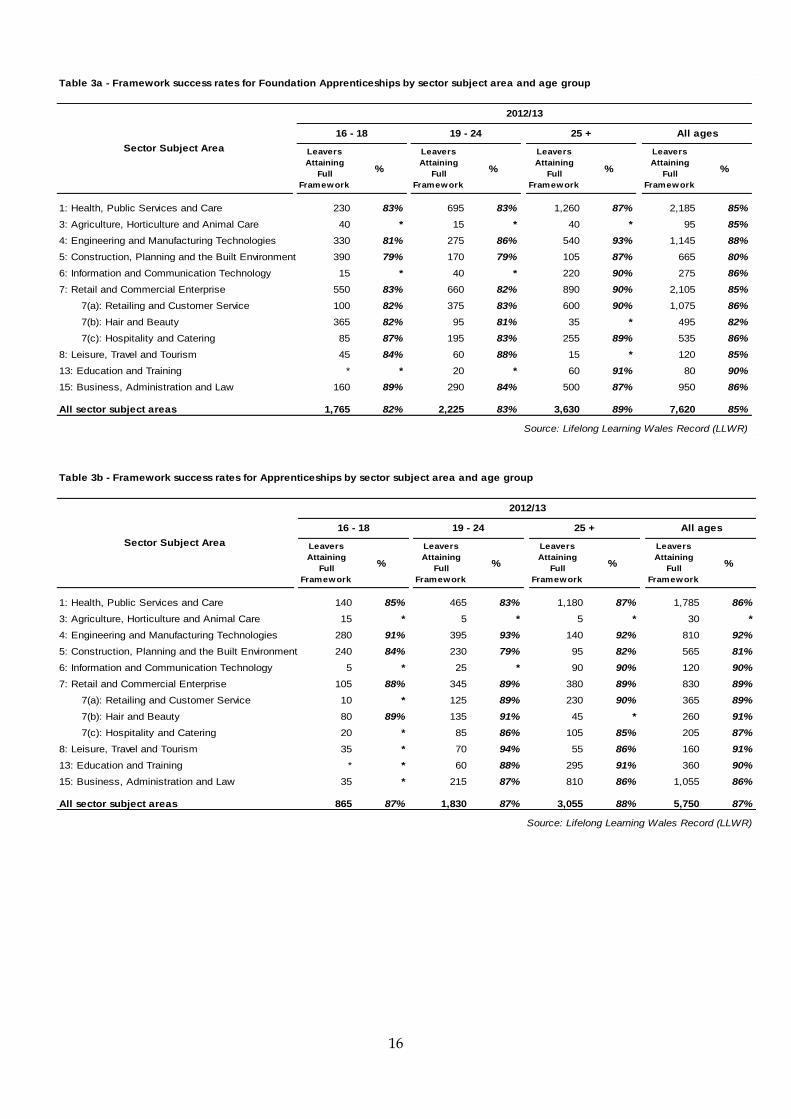
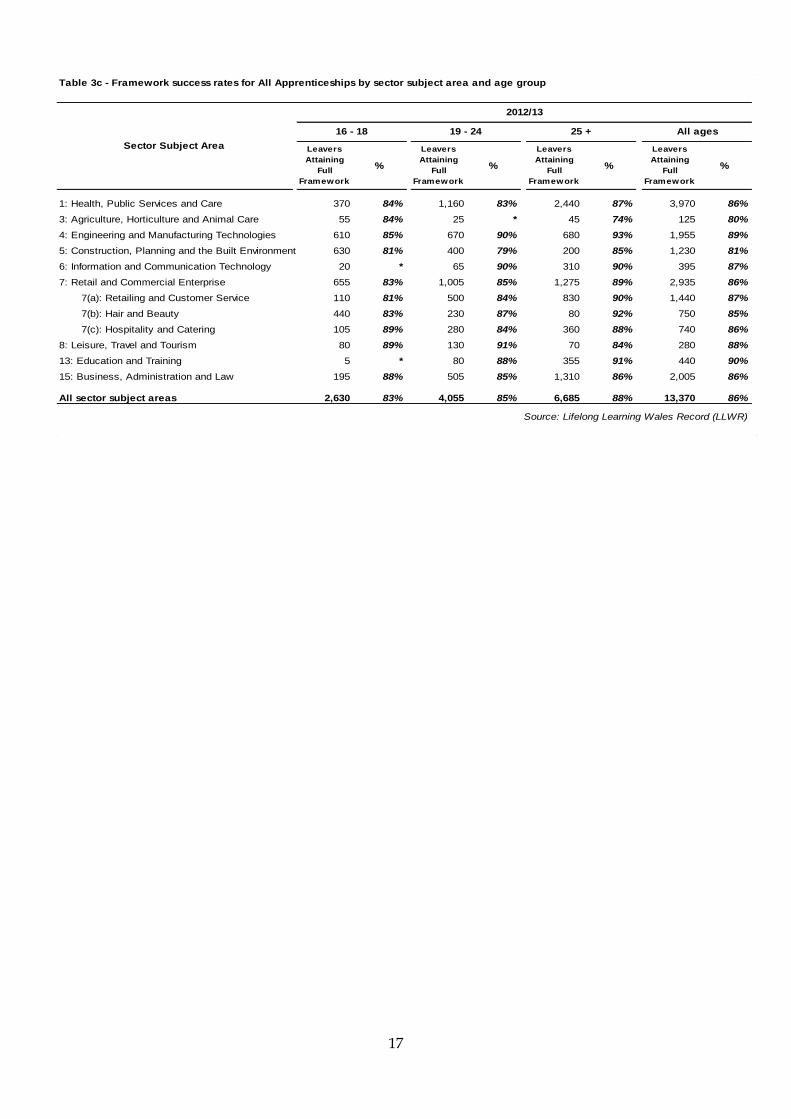
Learners on Apprenticeship programmes have to achieve a range of qualifications in order to gain the full Apprenticeship ‘framework’. In 2012/13, 86 per cent of learners across all Apprenticeship and Foundation Apprenticeship programmes achieved this, compared to 85 per cent in 2011/12. However, an increase in the number of Apprenticeship programmes ending within 8 weeks without completion was observed in 2012/13. The impact of this data issue on the Apprenticeship framework success rate is outlined in detail on pages 7 and 8 of this release. For Wales as a whole and at sector/subject area level, the success rate for Apprenticeships was higher than for Foundation Apprenticeships. Overall, the best performing areas were Education and Training; Engineering and Manufacturing Technologies; Leisure, Travel and Tourism; and Information and Communication Technology. Chart 3 shows the pattern of framework success rates on Apprenticeship programmes. Chart 3: WBL framework success rates by sector/subject area, 2012/13
0%
10%
20%
30%
40%
50%
60%
70%
80%
90%
100%
Edu
catio
n an
d Tra
ining
Eng
inee
ring
and
Man
ufac
turin
g Tec
hnolog
ies
Leisur
e, T
rave
l and
Tou
rism
Info
rmat
ion
and
Com
mun
icat
ion
Techn
olog
y
Ret
ailin
g an
d Cus
tom
er S
ervice
Hos
pita
lity an
d Cat
ering
Bus
ines
s, A
dministra
tion
and
Law
Hea
lth, P
ublic
Ser
vice
s an
d Car
e
Hair a
nd B
eaut
y
Con
stru
ction,
Plann
ing
and
the
Built Env
ironm
ent
Agr
icultu
re, H
ortic
ultu
re a
nd A
nim
al C
are
Foundation Apprenticeships Apprenticeships
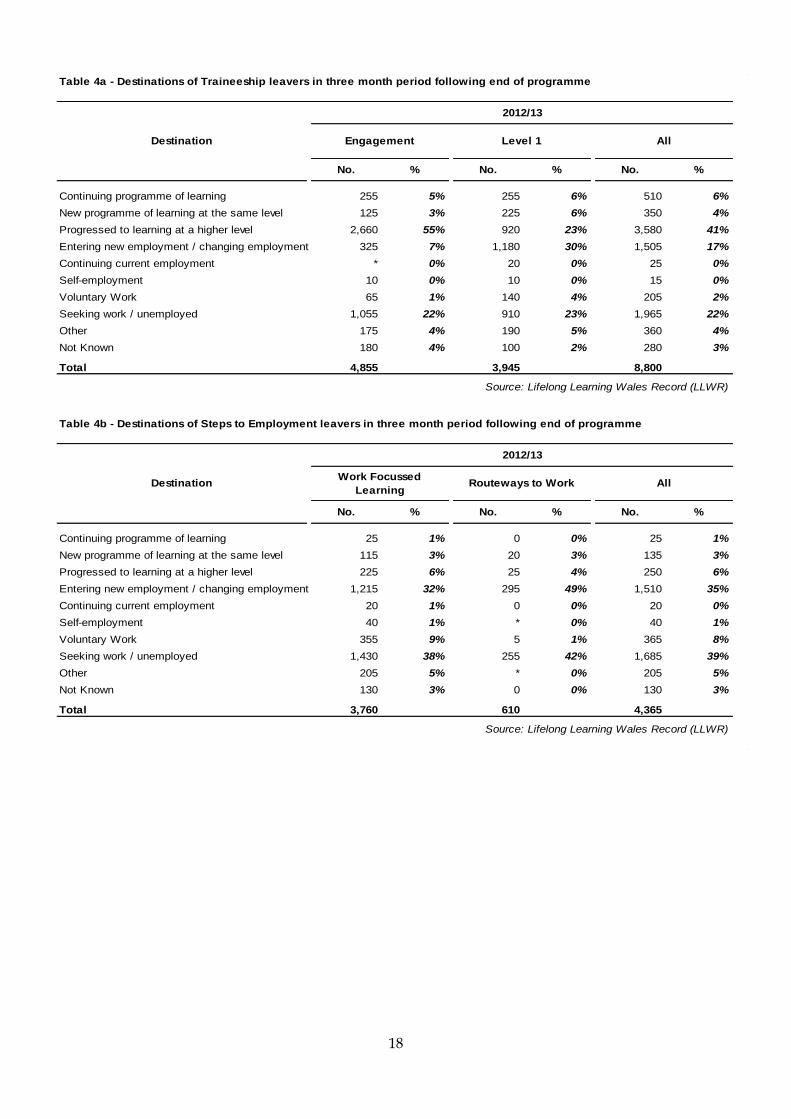
Analysis of learner destination, during the three month period following the end of a Traineeship or Steps to Employment programme, shows that:
67 per cent of leavers from Traineeship programmes had a positive progression (ie. to employment (including self employment or voluntary work) or learning at a higher level); and
56 per cent of leavers from Steps to Employment programmes had a positive progression (ie. to employment (including self employment or voluntary work) or further learning).
See tables 3a – 3c and 4a – b for further information.
4
Outcomes in adult community learning
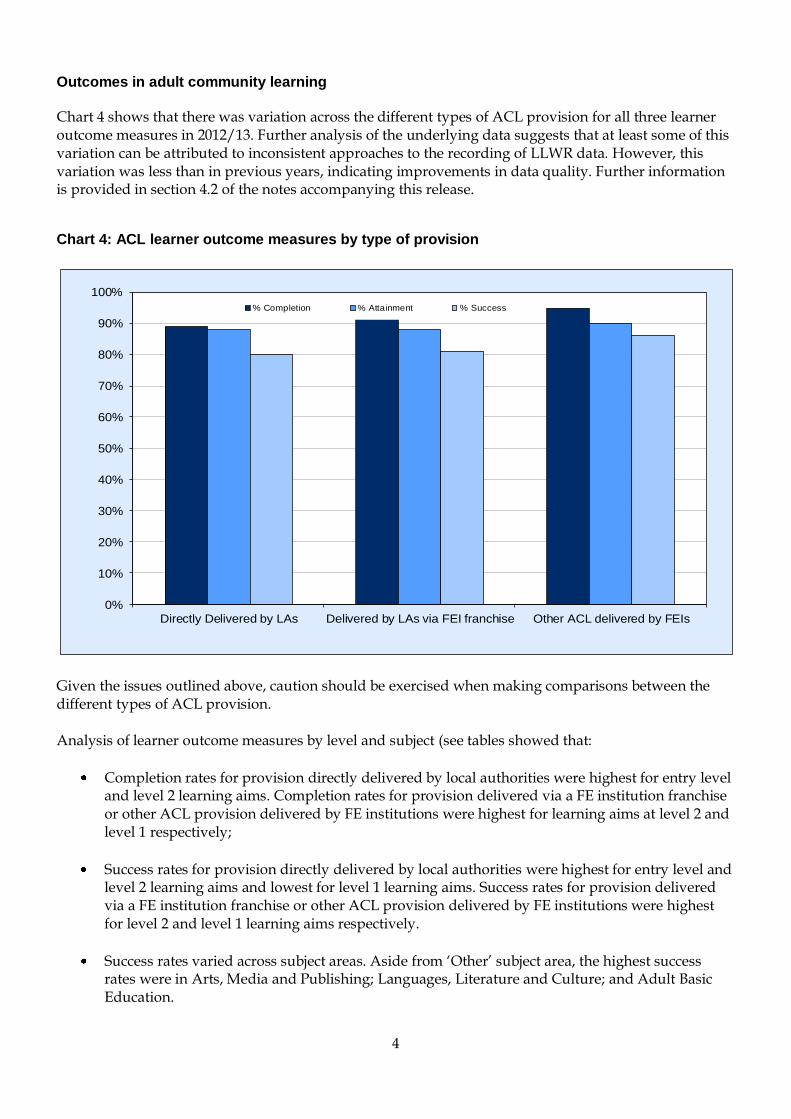
Chart 4 shows that there was variation across the different types of ACL provision for all three learner outcome measures in 2012/13. Further analysis of the underlying data suggests that at least some of this variation can be attributed to inconsistent approaches to the recording of LLWR data. However, this variation was less than in previous years, indicating improvements in data quality. Further information is provided in section 4.2 of the notes accompanying this release.
Chart 4: ACL learner outcome measures by type of provision
0%
10%
20%
30%
40%
50%
60%
70%
80%
90%
100%
Directly Delivered by LAs Delivered by LAs via FEI franchise Other ACL delivered by FEIs
% Completion % Attainment % Success
Given the issues outlined above, caution should be exercised when making comparisons between the different types of ACL provision. Analysis of learner outcome measures by level and subject (see tables showed that:
Completion rates for provision directly delivered by local authorities were highest for entry level and level 2 learning aims. Completion rates for provision delivered via a FE institution franchise or other ACL provision delivered by FE institutions were highest for learning aims at level 2 and level 1 respectively;
Success rates for provision directly delivered by local authorities were highest for entry level and level 2 learning aims and lowest for level 1 learning aims. Success rates for provision delivered via a FE institution franchise or other ACL provision delivered by FE institutions were highest for level 2 and level 1 learning aims respectively.
Success rates varied across subject areas. Aside from ‘Other’ subject area, the highest success rates were in Arts, Media and Publishing; Languages, Literature and Culture; and Adult Basic Education.
5
Data Management Principles
In recent years, discussions between officers from DfES (Department for Education and Skills) and learning providers have highlighted some inconsistencies in the way that learner outcomes are recorded. To address these inconsistencies, a set of data management principles was developed in partnership with CollegesWales and issued to FE institutions and WBL providers (in December 2011 and February 2012 respectively).
These principles provided clarification on a number of data management issues, particularly the circumstances in which LLWR records can be deleted as well as on matters such as recording transfers.
Both the deletion of LLWR records and the incorrect recording of transfers can contribute to an undercount of terminated learning activities and/or learning programmes and therefore potentially inflate the success rates detailed within this output.
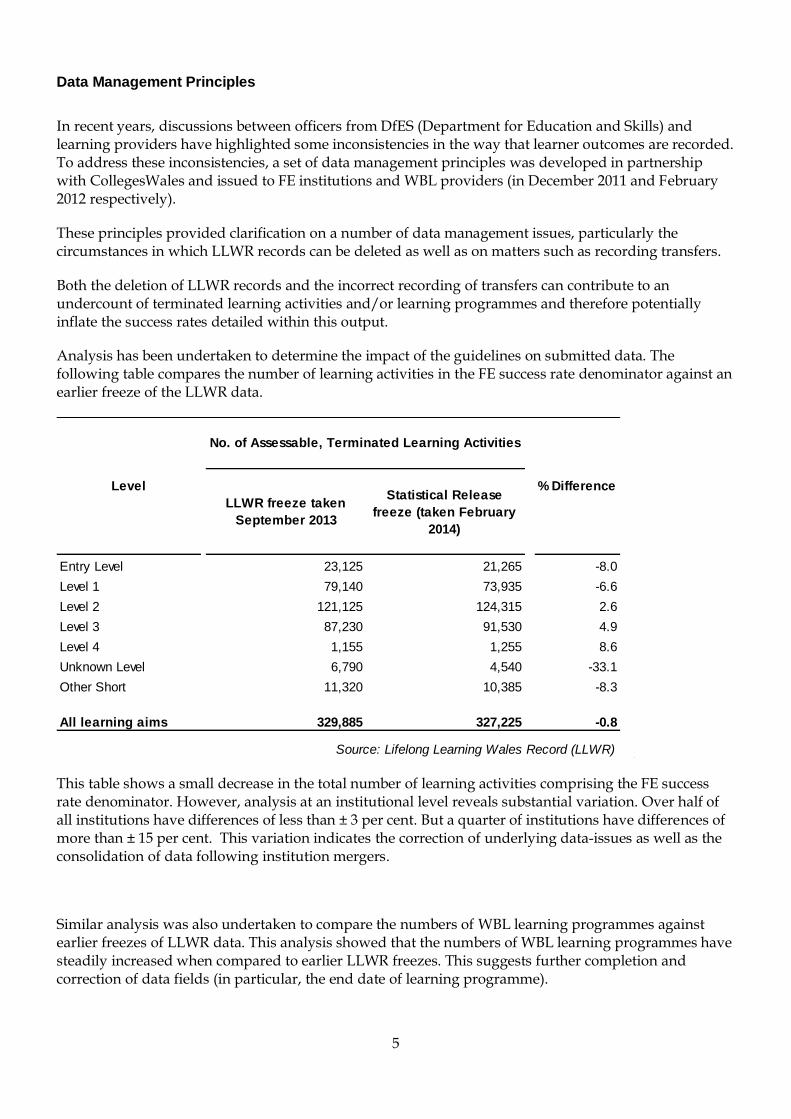
Analysis has been undertaken to determine the impact of the guidelines on submitted data. The following table compares the number of learning activities in the FE success rate denominator against an earlier freeze of the LLWR data.
LLWR freeze taken
September 2013
Statistical Release
freeze (taken February
2014)
Entry Level 23,125 21,265 -8.0
Level 1 79,140 73,935 -6.6
Level 2 121,125 124,315 2.6
Level 3 87,230 91,530 4.9
Level 4 1,155 1,255 8.6
Unknown Level 6,790 4,540 -33.1
Other Short 11,320 10,385 -8.3
All learning aims 329,885 327,225 -0.8
Source: Lifelong Learning Wales Record (LLWR)
Level
No. of Assessable, Terminated Learning Activities
% Difference
This table shows a small decrease in the total number of learning activities comprising the FE success rate denominator. However, analysis at an institutional level reveals substantial variation. Over half of all institutions have differences of less than ± 3 per cent. But a quarter of institutions have differences of more than ± 15 per cent. This variation indicates the correction of underlying data-issues as well as the consolidation of data following institution mergers.
Similar analysis was also undertaken to compare the numbers of WBL learning programmes against earlier freezes of LLWR data. This analysis showed that the numbers of WBL learning programmes have steadily increased when compared to earlier LLWR freezes. This suggests further completion and correction of data fields (in particular, the end date of learning programme).
6
Additional analysis was undertaken to specifically investigate the recording of learning programmes and learning activities as transferred or continuing. If a learning activity is recorded as continuing or transferred, it is excluded from learning activity success rates. Similarly, if a learning programme is recorded as continuing or transferred, it is excluded from Apprenticeship framework success rates.
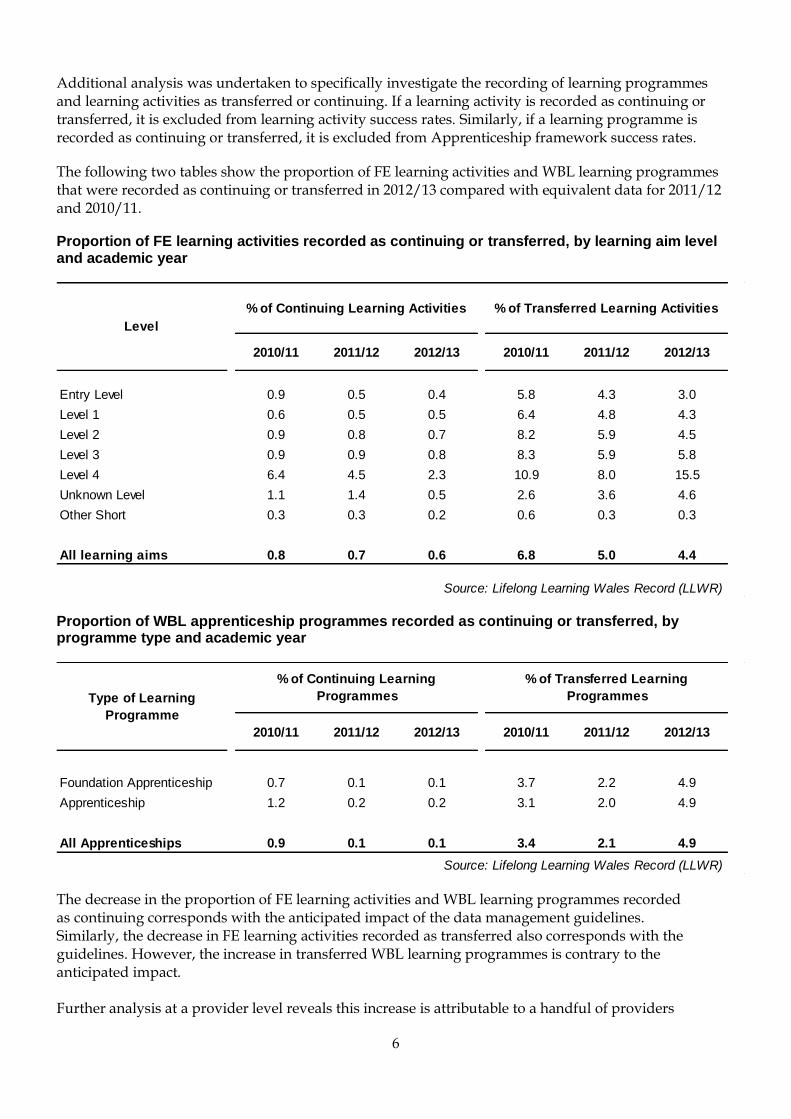
The following two tables show the proportion of FE learning activities and WBL learning programmes that were recorded as continuing or transferred in 2012/13 compared with equivalent data for 2011/12 and 2010/11.
Proportion of FE learning activities recorded as continuing or transferred, by learning aim level and academic year
2010/11 2011/12 2012/13 2010/11 2011/12 2012/13
Entry Level 0.9 0.5 0.4 5.8 4.3 3.0
Level 1 0.6 0.5 0.5 6.4 4.8 4.3
Level 2 0.9 0.8 0.7 8.2 5.9 4.5
Level 3 0.9 0.9 0.8 8.3 5.9 5.8
Level 4 6.4 4.5 2.3 10.9 8.0 15.5
Unknown Level 1.1 1.4 0.5 2.6 3.6 4.6
Other Short 0.3 0.3 0.2 0.6 0.3 0.3
All learning aims 0.8 0.7 0.6 6.8 5.0 4.4
Source: Lifelong Learning Wales Record (LLWR)
% of Continuing Learning Activities % of Transferred Learning Activities
Level
Proportion of WBL apprenticeship programmes recorded as continuing or transferred, by programme type and academic year
2010/11 2011/12 2012/13 2010/11 2011/12 2012/13
Foundation Apprenticeship 0.7 0.1 0.1 3.7 2.2 4.9
Apprenticeship 1.2 0.2 0.2 3.1 2.0 4.9
All Apprenticeships 0.9 0.1 0.1 3.4 2.1 4.9
Source: Lifelong Learning Wales Record (LLWR)
% of Continuing Learning
Programmes
% of Transferred Learning
ProgrammesType of Learning
Programme
The decrease in the proportion of FE learning activities and WBL learning programmes recorded as continuing corresponds with the anticipated impact of the data management guidelines. Similarly, the decrease in FE learning activities recorded as transferred also corresponds with the guidelines. However, the increase in transferred WBL learning programmes is contrary to the anticipated impact. Further analysis at a provider level reveals this increase is attributable to a handful of providers
7
with significant increases in transferred learning programmes. However, this analysis highlighted another data-issue which is discussed at length in the next section of this release.
In summary, it seems that the data management principles have had some impact on the submission of LLWR data. However, analysis suggests that inconsistencies remain in the recording of data and further detailed analysis will be required to explain the individual increases and decreases in learning activity and learning programme volumes. Further analysis will be required to assess and monitor the ongoing impact of the guidelines on LLWR data in subsequent years
WBL Framework Success Rate
When deriving the WBL framework success rates detailed in tables 3a to 3c of this release, learning programmes are excluded from the calculation for the following reasons:
The learning programme is recorded as transferred or continuing at another provider,
The learning programme ended within 8 weeks without completion (‘early drop outs’),
The learner is recorded as leaving due to redundancy or death.
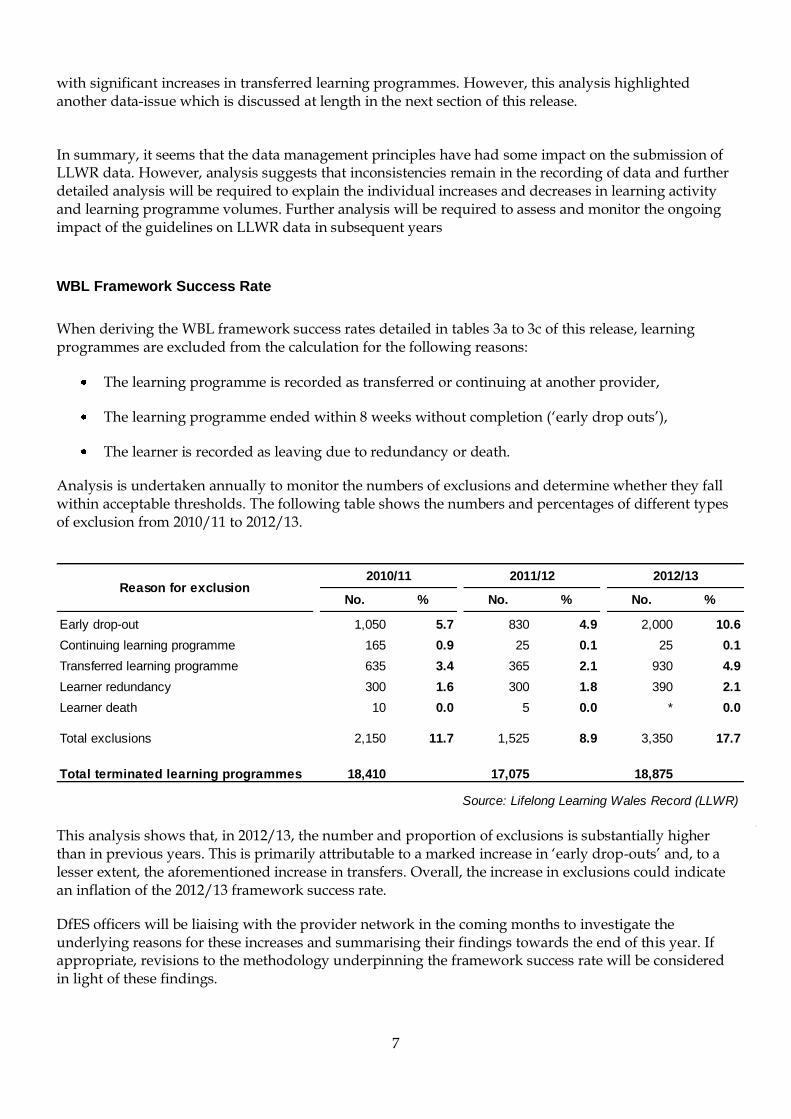
Analysis is undertaken annually to monitor the numbers of exclusions and determine whether they fall within acceptable thresholds. The following table shows the numbers and percentages of different types of exclusion from 2010/11 to 2012/13.
No. % No. % No. %
Early drop-out 1,050 5.7 830 4.9 2,000 10.6
Continuing learning programme 165 0.9 25 0.1 25 0.1
Transferred learning programme 635 3.4 365 2.1 930 4.9
Learner redundancy 300 1.6 300 1.8 390 2.1
Learner death 10 0.0 5 0.0 * 0.0
Total exclusions 2,150 11.7 1,525 8.9 3,350 17.7
Total terminated learning programmes 18,410 17,075 18,875
Source: Lifelong Learning Wales Record (LLWR)
Reason for exclusion2010/11 2011/12 2012/13
This analysis shows that, in 2012/13, the number and proportion of exclusions is substantially higher than in previous years. This is primarily attributable to a marked increase in ‘early drop-outs’ and, to a lesser extent, the aforementioned increase in transfers. Overall, the increase in exclusions could indicate an inflation of the 2012/13 framework success rate.
DfES officers will be liaising with the provider network in the coming months to investigate the underlying reasons for these increases and summarising their findings towards the end of this year. If appropriate, revisions to the methodology underpinning the framework success rate will be considered in light of these findings.
8
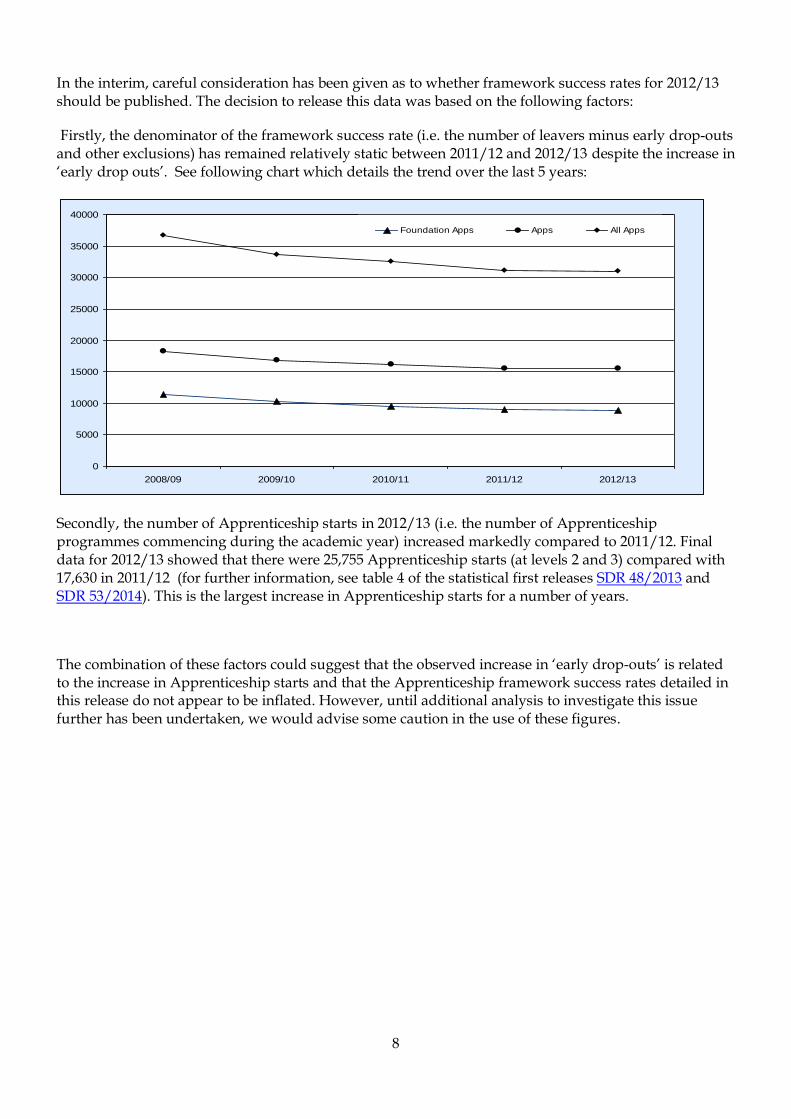
In the interim, careful consideration has been given as to whether framework success rates for 2012/13 should be published. The decision to release this data was based on the following factors:
Firstly, the denominator of the framework success rate (i.e. the number of leavers minus early drop-outs and other exclusions) has remained relatively static between 2011/12 and 2012/13 despite the increase in ‘early drop outs’. See following chart which details the trend over the last 5 years:
0
5000
10000
15000
20000
25000
30000
35000
40000
2008/09 2009/10 2010/11 2011/12 2012/13
Foundation Apps Apps All Apps
Secondly, the number of Apprenticeship starts in 2012/13 (i.e. the number of Apprenticeship programmes commencing during the academic year) increased markedly compared to 2011/12. Final data for 2012/13 showed that there were 25,755 Apprenticeship starts (at levels 2 and 3) compared with 17,630 in 2011/12 (for further information, see table 4 of the statistical first releases SDR 48/2013 and SDR 53/2014). This is the largest increase in Apprenticeship starts for a number of years.
The combination of these factors could suggest that the observed increase in ‘early drop-outs’ is related to the increase in Apprenticeship starts and that the Apprenticeship framework success rates detailed in this release do not appear to be inflated. However, until additional analysis to investigate this issue further has been undertaken, we would advise some caution in the use of these figures.
9
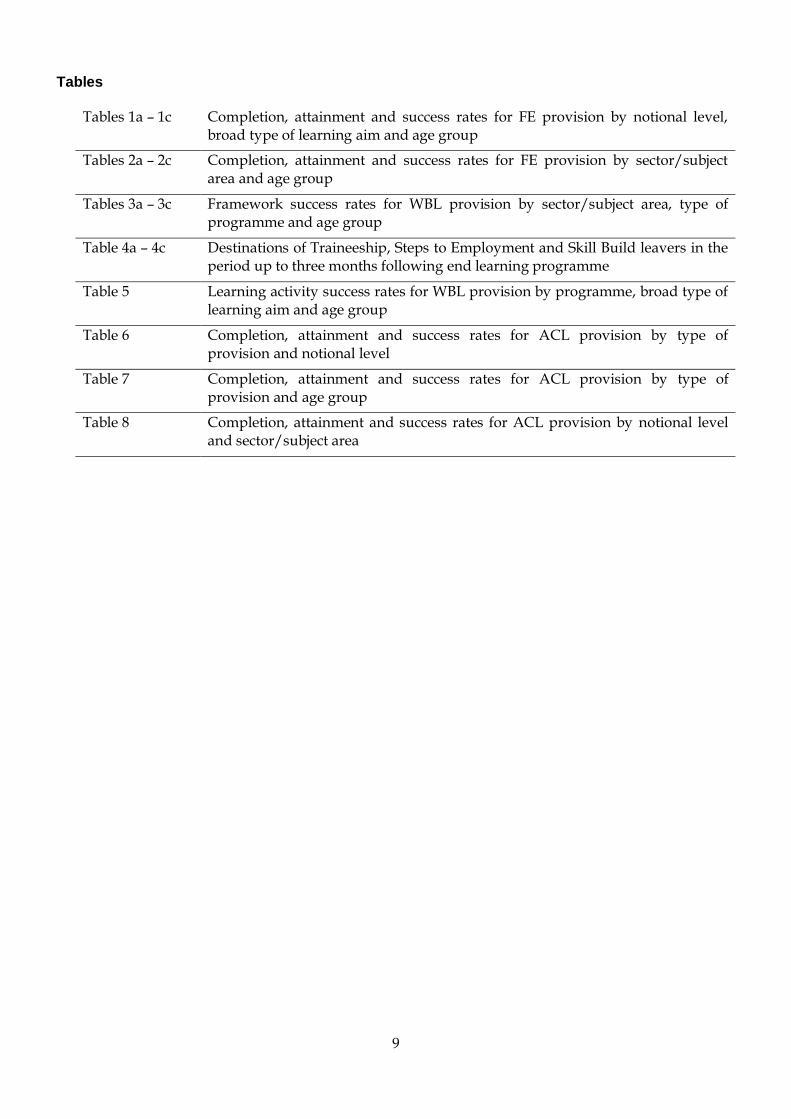
Tables
Tables 1a – 1c Completion, attainment and success rates for FE provision by notional level, broad type of learning aim and age group
Tables 2a – 2c Completion, attainment and success rates for FE provision by sector/subject area and age group
Tables 3a – 3c Framework success rates for WBL provision by sector/subject area, type of programme and age group
Table 4a – 4c Destinations of Traineeship, Steps to Employment and Skill Build leavers in the period up to three months following end learning programme
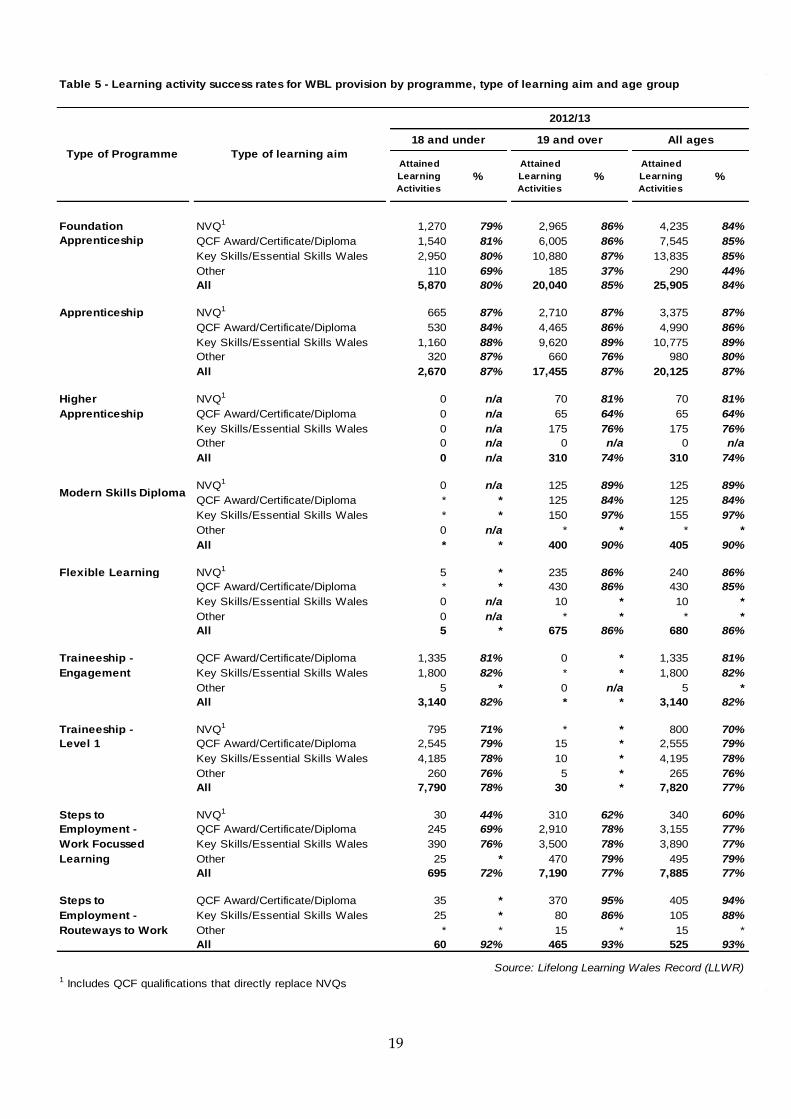
Table 5 Learning activity success rates for WBL provision by programme, broad type of learning aim and age group
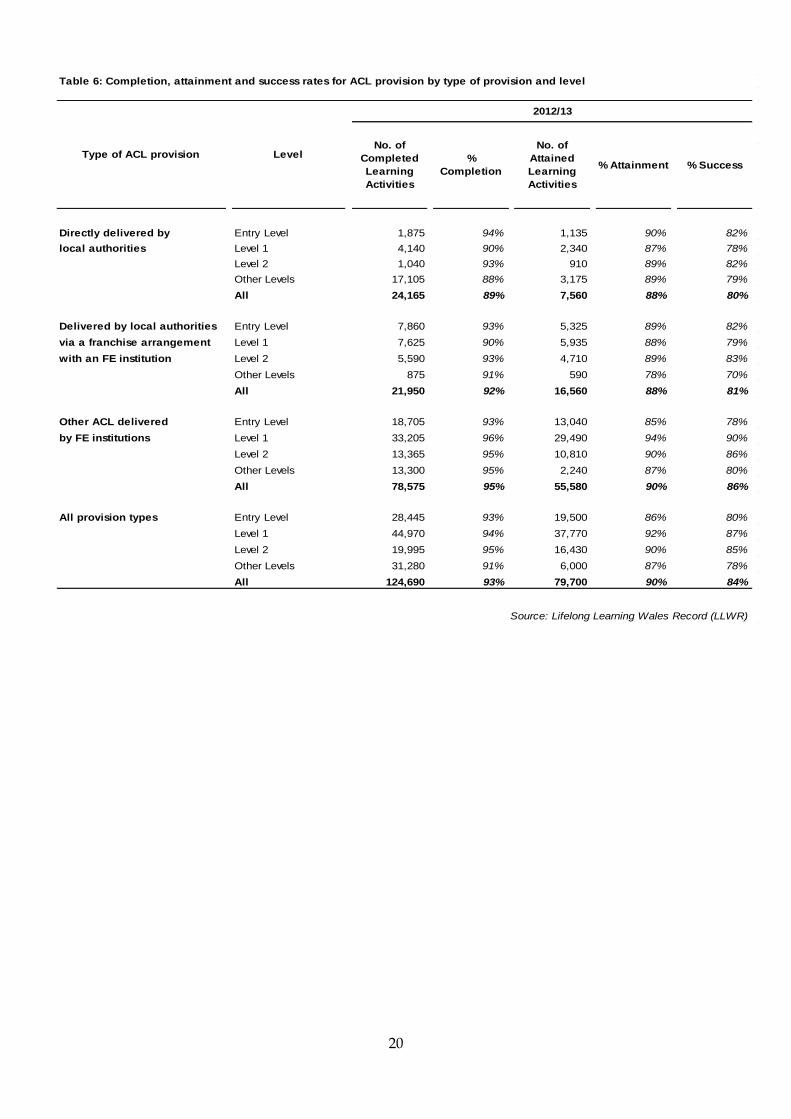
Table 6 Completion, attainment and success rates for ACL provision by type of provision and notional level
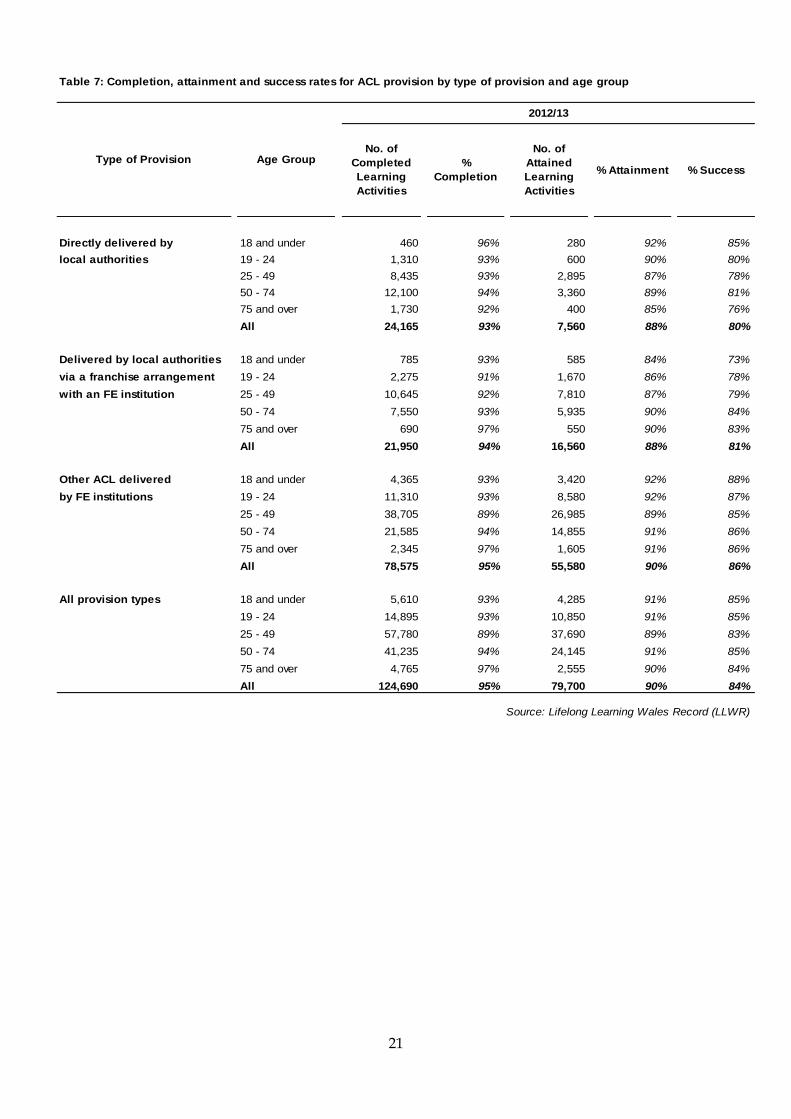
Table 7 Completion, attainment and success rates for ACL provision by type of provision and age group
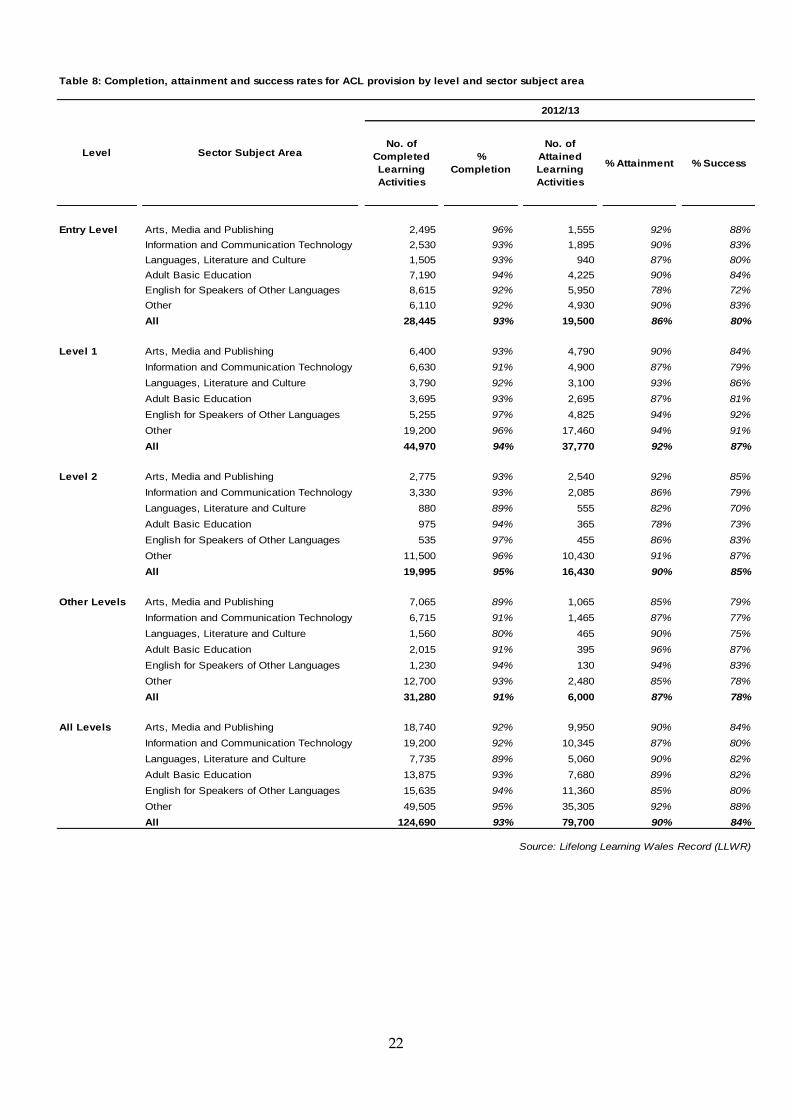
Table 8 Completion, attainment and success rates for ACL provision by notional level and sector/subject area
10
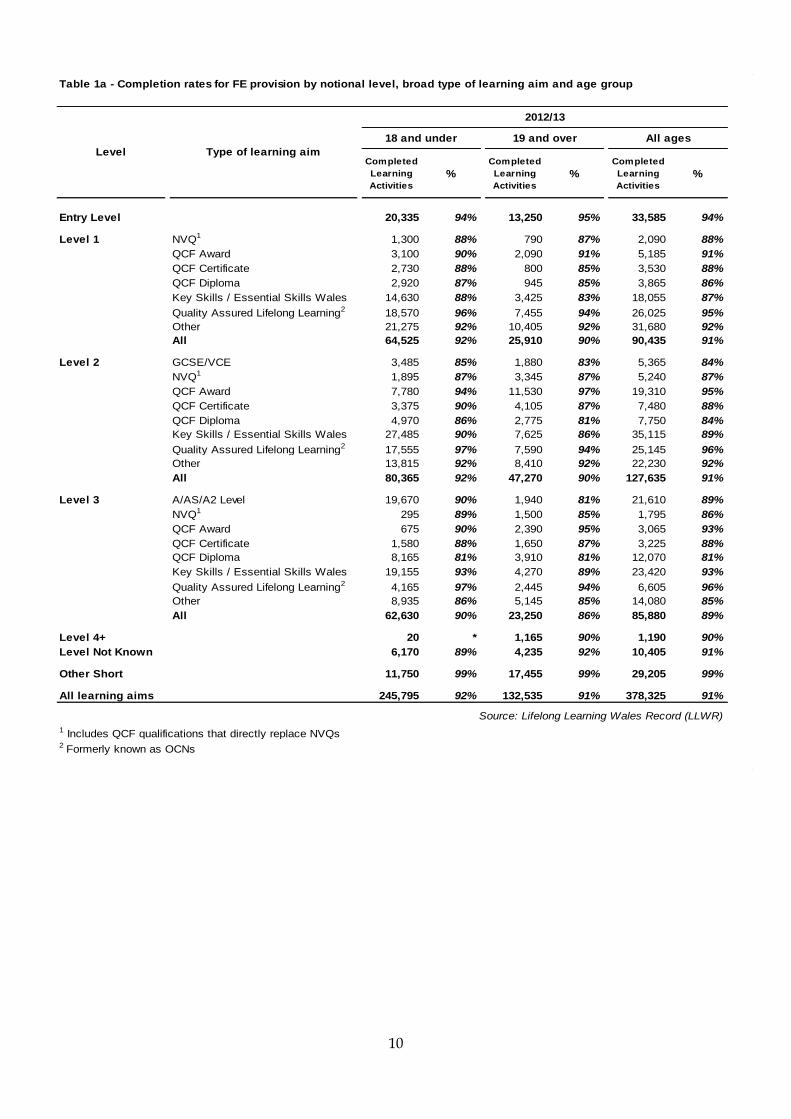
Table 1a - Completion rates for FE provision by notional level, broad type of learning aim and age group
Completed
Learning
Activities
%
Completed
Learning
Activities
%
Completed
Learning
Activities
%
Entry Level 20,335 94% 13,250 95% 33,585 94%
Level 1 NVQ1 1,300 88% 790 87% 2,090 88%
QCF Award 3,100 90% 2,090 91% 5,185 91%
QCF Certificate 2,730 88% 800 85% 3,530 88%
QCF Diploma 2,920 87% 945 85% 3,865 86%
Key Skills / Essential Skills Wales 14,630 88% 3,425 83% 18,055 87%
Quality Assured Lifelong Learning2 18,570 96% 7,455 94% 26,025 95%
Other 21,275 92% 10,405 92% 31,680 92%
All 64,525 92% 25,910 90% 90,435 91%
Level 2 GCSE/VCE 3,485 85% 1,880 83% 5,365 84%
NVQ1 1,895 87% 3,345 87% 5,240 87%
QCF Award 7,780 94% 11,530 97% 19,310 95%
QCF Certificate 3,375 90% 4,105 87% 7,480 88%
QCF Diploma 4,970 86% 2,775 81% 7,750 84%
Key Skills / Essential Skills Wales 27,485 90% 7,625 86% 35,115 89%
Quality Assured Lifelong Learning2 17,555 97% 7,590 94% 25,145 96%
Other 13,815 92% 8,410 92% 22,230 92%
All 80,365 92% 47,270 90% 127,635 91%
Level 3 A/AS/A2 Level 19,670 90% 1,940 81% 21,610 89%
NVQ1 295 89% 1,500 85% 1,795 86%
QCF Award 675 90% 2,390 95% 3,065 93%
QCF Certificate 1,580 88% 1,650 87% 3,225 88%
QCF Diploma 8,165 81% 3,910 81% 12,070 81%
Key Skills / Essential Skills Wales 19,155 93% 4,270 89% 23,420 93%
Quality Assured Lifelong Learning2 4,165 97% 2,445 94% 6,605 96%
Other 8,935 86% 5,145 85% 14,080 85%
All 62,630 90% 23,250 86% 85,880 89%
Level 4+ 20 * 1,165 90% 1,190 90%
Level Not Known 6,170 89% 4,235 92% 10,405 91%
Other Short 11,750 99% 17,455 99% 29,205 99%
All learning aims 245,795 92% 132,535 91% 378,325 91%
Source: Lifelong Learning Wales Record (LLWR)
1 Includes QCF qualifications that directly replace NVQs2 Formerly known as OCNs
Type of learning aimLevel
2012/13
18 and under 19 and over All ages

11
Table 1b - Attainment rates for FE provision by notional level, broad type of learning aim and age group
Attained
Learning
Activities
%
Attained
Learning
Activities
%
Attained
Learning
Activities
%
Entry Level 11,405 95% 7,820 96% 19,225 95%
Level 1 NVQ1 1,215 93% 740 94% 1,955 94%
QCF Award 2,925 94% 1,945 93% 4,870 94%
QCF Certificate 2,485 91% 705 88% 3,190 90%
QCF Diploma 2,720 93% 895 95% 3,615 94%
Key Skills / Essential Skills Wales 13,640 93% 3,145 92% 16,780 93%
Quality Assured Lifelong Learning2 17,700 95% 7,085 95% 24,785 95%
Other 5,605 95% 2,635 95% 8,240 95%
All 46,290 94% 17,145 94% 63,440 94%
Level 2 GCSE/VCE 3,215 92% 1,700 90% 4,915 92%
NVQ1 1,710 90% 3,135 94% 4,845 92%
QCF Award 7,285 94% 11,070 96% 18,360 95%
QCF Certificate 3,035 90% 3,725 91% 6,760 90%
QCF Diploma 4,510 91% 2,485 90% 6,995 90%
Key Skills / Essential Skills Wales 25,070 91% 6,870 90% 31,940 91%
Quality Assured Lifelong Learning2 16,785 96% 7,105 94% 23,890 95%
Other 4,620 89% 2,170 90% 6,790 90%
All 66,240 92% 38,255 93% 104,495 93%
Level 3 A/AS/A2 Level 17,330 88% 1,600 83% 18,930 88%
NVQ1 280 95% 1,350 90% 1,630 91%
QCF Award 605 90% 2,100 88% 2,705 88%
QCF Certificate 1,410 89% 1,445 88% 2,855 88%
QCF Diploma 7,465 91% 3,460 88% 10,925 90%
Key Skills / Essential Skills Wales 17,970 94% 3,940 93% 21,910 94%
Quality Assured Lifelong Learning2 4,010 96% 2,235 92% 6,250 95%
Other 5,100 90% 3,560 90% 8,660 90%
All 54,170 91% 19,695 89% 73,865 91%
Level 4+ 15 * 930 83% 945 83%
Level Not Known 2,130 94% 1,715 89% 3,845 92%
Other Short 2,280 97% 7,795 98% 10,075 97%
All learning aims 182,530 93% 93,355 93% 275,890 93%
Source: Lifelong Learning Wales Record (LLWR)
1 Includes QCF qualifications that directly replace NVQs2 Formerly known as OCNs
Type of learning aimLevel
2012/13
18 and under 19 and over All ages

12
Table 1c - Success rates for FE provision by notional level, broad type of learning aim and age group
Attained
Learning
Activities
%
Attained
Learning
Activities
%
Attained
Learning
Activities
%
Entry Level 11,405 89% 7,820 92% 19,225 90%
Level 1 NVQ1 1,215 82% 740 82% 1,955 82%
QCF Award 2,925 85% 1,945 85% 4,870 85%
QCF Certificate 2,485 80% 705 75% 3,190 79%
QCF Diploma 2,720 81% 895 80% 3,615 81%
Key Skills / Essential Skills Wales 13,640 82% 3,145 76% 16,780 81%
Quality Assured Lifelong Learning2 17,700 91% 7,085 89% 24,785 91%
Other 5,605 88% 2,635 89% 8,240 88%
All 46,290 86% 17,145 84% 63,440 86%
Level 2 GCSE/VCE 3,215 78% 1,700 75% 4,915 77%
NVQ1 1,710 79% 3,135 82% 4,845 81%
QCF Award 7,285 88% 11,070 93% 18,360 91%
QCF Certificate 3,035 81% 3,725 79% 6,760 80%
QCF Diploma 4,510 78% 2,485 73% 6,995 76%
Key Skills / Essential Skills Wales 25,070 83% 6,870 77% 31,940 81%
Quality Assured Lifelong Learning2 16,785 92% 7,105 88% 23,890 91%
Other 4,620 79% 2,170 80% 6,790 79%
All 66,240 84% 38,255 84% 104,495 84%
Level 3 A/AS/A2 Level 17,330 80% 1,600 67% 18,930 78%
NVQ1 280 85% 1,350 77% 1,630 78%
QCF Award 605 80% 2,100 83% 2,705 82%
QCF Certificate 1,410 78% 1,445 77% 2,855 77%
QCF Diploma 7,465 74% 3,460 71% 10,925 73%
Key Skills / Essential Skills Wales 17,970 88% 3,940 83% 21,910 87%
Quality Assured Lifelong Learning2 4,010 94% 2,235 86% 6,250 91%
Other 5,100 76% 3,560 75% 8,660 76%
All 54,170 82% 19,695 77% 73,865 81%
Level 4+ 15 * 930 75% 945 75%
Level Not Known 2,130 86% 1,715 83% 3,845 85%
Other Short 2,280 96% 7,795 97% 10,075 97%
All learning aims 182,530 85% 93,355 84% 275,890 84%
Weighted Success Rate 79% 77% 78%
Source: Lifelong Learning Wales Record (LLWR)
1 Includes QCF qualifications that directly replace NVQs2 Formerly known as OCNs
Type of learning aimLevel
2012/13
18 and under 19 and over All ages

13
Table 2a - Completion rates for FE provision by sector subject area and age group
Completed
Learning
Activities
%
Completed
Learning
Activities
%
Completed
Learning
Activities
%
1: Health, Public Services and Care 11,820 90% 15,485 92% 27,305 91%
2: Science and Mathematics 10,615 90% 3,130 84% 13,745 89%
3: Agriculture, Horticulture and Animal Care 2,115 90% 2,305 93% 4,420 92%
4: Engineering and Manufacturing Technologies 7,735 89% 8,805 94% 16,540 92%
5: Construction, Planning and the Built Environment 6,655 90% 6,275 94% 12,930 92%
6: Information and Communication Technology 9,930 94% 12,930 93% 22,860 93%
7: Retail and Commercial Enterprise 9,640 91% 11,670 93% 21,310 92%
7(a): Retailing and Customer Service 1,560 92% 2,170 93% 3,730 92%
7(b): Hair and Beauty 4,060 88% 3,300 87% 7,360 88%
7(c): Hospitality and Catering 4,020 94% 6,200 96% 10,220 95%
8: Leisure, Travel and Tourism 7,070 91% 1,575 92% 8,645 91%
9: Arts, Media and Publishing 12,915 89% 3,900 88% 16,815 89%
9(a): Performing Arts 3,505 89% 985 86% 4,490 89%
9(b): Art and Design 9,410 89% 2,915 89% 12,325 89%
10: History, Philosophy and Theology 5,715 95% 960 86% 6,675 93%
11: Social Sciences 2,495 91% 295 81% 2,795 90%
12: Languages, Literature and Culture 19,395 93% 7,045 91% 26,440 93%
13: Education and Training 2,540 96% 4,945 93% 7,485 94%
14: Preparation for Life and Work 126,215 92% 42,730 90% 168,945 91%
14(a): Independent Living Skills 1,120 95% 2,170 97% 3,290 96%
14(b): Adult Basic Education 15,730 96% 7,550 94% 23,280 95%
14(c): Foundation for Work 109,235 91% 32,245 89% 141,480 91%
14(d): English for Speakers of Other Languages 130 97% 765 89% 895 90%
15: Business, Administration and Law 10,900 91% 10,390 91% 21,285 91%
All sector subject areas 245,795 92% 132,535 91% 378,325 91%
Source: Lifelong Learning Wales Record (LLWR)
Sector Subject Area
2012/13
18 and under 19 and over All ages

14
Table 2b - Attainment rates for FE provision by sector subject area and age group
Attained
Learning
Activities
%
Attained
Learning
Activities
%
Attained
Learning
Activities
%
1: Health, Public Services and Care 9,715 94% 11,870 94% 21,590 94%
2: Science and Mathematics 8,610 86% 2,570 87% 11,180 86%
3: Agriculture, Horticulture and Animal Care 1,870 90% 1,930 90% 3,805 90%
4: Engineering and Manufacturing Technologies 6,855 91% 7,615 94% 14,470 92%
5: Construction, Planning and the Built Environment 5,920 93% 5,335 91% 11,250 92%
6: Information and Communication Technology 5,480 91% 4,815 92% 10,295 92%
7: Retail and Commercial Enterprise 8,560 95% 10,575 96% 19,135 95%
7(a): Retailing and Customer Service 1,110 96% 1,675 94% 2,785 95%
7(b): Hair and Beauty 3,690 95% 3,045 94% 6,730 95%
7(c): Hospitality and Catering 3,760 96% 5,860 97% 9,620 96%
8: Leisure, Travel and Tourism 6,380 94% 1,300 93% 7,680 94%
9: Arts, Media and Publishing 11,800 94% 3,240 93% 15,040 94%
9(a): Performing Arts 3,190 93% 795 92% 3,985 93%
9(b): Art and Design 8,610 95% 2,445 94% 11,055 95%
10: History, Philosophy and Theology 4,180 94% 590 88% 4,775 93%
11: Social Sciences 2,200 88% 265 89% 2,465 88%
12: Languages, Literature and Culture 10,555 94% 3,075 91% 13,630 93%
13: Education and Training 2,300 96% 3,095 92% 5,395 93%
14: Preparation for Life and Work 93,055 93% 29,940 93% 122,995 93%
14(a): Independent Living Skills 675 99% 1,430 98% 2,105 98%
14(b): Adult Basic Education 3,780 95% 2,565 97% 6,345 96%
14(c): Foundation for Work 88,540 93% 25,475 92% 114,015 93%
14(d): English for Speakers of Other Languages 60 97% 475 88% 535 89%
15: Business, Administration and Law 5,010 89% 7,040 91% 12,050 90%
All sector subject areas 182,530 93% 93,355 93% 275,890 93%
Source: Lifelong Learning Wales Record (LLWR)
Sector Subject Area
2012/13
18 and under 19 and over All ages

15
Table 2c - Success rates for FE provision by sector subject area and age group
Attained
Learning
Activities
%
Attained
Learning
Activities
%
Attained
Learning
Activities
%
1: Health, Public Services and Care 9,715 84% 11,870 85% 21,590 84%
2: Science and Mathematics 8,610 77% 2,570 73% 11,180 76%
3: Agriculture, Horticulture and Animal Care 1,870 81% 1,930 84% 3,805 82%
4: Engineering and Manufacturing Technologies 6,855 81% 7,615 88% 14,470 84%
5: Construction, Planning and the Built Environment 5,920 84% 5,335 86% 11,250 85%
6: Information and Communication Technology 5,480 84% 4,815 82% 10,295 83%
7: Retail and Commercial Enterprise 8,560 87% 10,575 89% 19,135 88%
7(a): Retailing and Customer Service 1,110 88% 1,675 87% 2,785 87%
7(b): Hair and Beauty 3,690 84% 3,045 82% 6,730 83%
7(c): Hospitality and Catering 3,760 90% 5,860 93% 9,620 92%
8: Leisure, Travel and Tourism 6,380 86% 1,300 85% 7,680 85%
9: Arts, Media and Publishing 11,800 84% 3,240 81% 15,040 84%
9(a): Performing Arts 3,190 84% 795 78% 3,985 83%
9(b): Art and Design 8,610 85% 2,445 82% 11,055 84%
10: History, Philosophy and Theology 4,180 89% 590 73% 4,775 87%
11: Social Sciences 2,200 80% 265 72% 2,465 79%
12: Languages, Literature and Culture 10,555 87% 3,075 81% 13,630 85%
13: Education and Training 2,300 92% 3,095 83% 5,395 87%
14: Preparation for Life and Work 93,055 85% 29,940 83% 122,995 85%
14(a): Independent Living Skills 675 95% 1,430 96% 2,105 96%
14(b): Adult Basic Education 3,780 91% 2,565 91% 6,345 91%
14(c): Foundation for Work 88,540 85% 25,475 82% 114,015 84%
14(d): English for Speakers of Other Languages 60 94% 475 80% 535 81%
15: Business, Administration and Law 5,010 79% 7,040 82% 12,050 81%
All sector subject areas 182,530 85% 93,355 84% 275,890 84%
Source: Lifelong Learning Wales Record (LLWR)
Sector Subject Area
2012/13
18 and under 19 and over All ages
16
Table 3a - Framework success rates for Foundation Apprenticeships by sector subject area and age group
Leavers
Attaining
Full
Framework
%
Leavers
Attaining
Full
Framework
%
Leavers
Attaining
Full
Framework
%
Leavers
Attaining
Full
Framework
%
1: Health, Public Services and Care 230 83% 695 83% 1,260 87% 2,185 85%
3: Agriculture, Horticulture and Animal Care 40 * 15 * 40 * 95 85%
4: Engineering and Manufacturing Technologies 330 81% 275 86% 540 93% 1,145 88%
5: Construction, Planning and the Built Environment 390 79% 170 79% 105 87% 665 80%
6: Information and Communication Technology 15 * 40 * 220 90% 275 86%
7: Retail and Commercial Enterprise 550 83% 660 82% 890 90% 2,105 85%
7(a): Retailing and Customer Service 100 82% 375 83% 600 90% 1,075 86%
7(b): Hair and Beauty 365 82% 95 81% 35 * 495 82%
7(c): Hospitality and Catering 85 87% 195 83% 255 89% 535 86%
8: Leisure, Travel and Tourism 45 84% 60 88% 15 * 120 85%
13: Education and Training * * 20 * 60 91% 80 90%
15: Business, Administration and Law 160 89% 290 84% 500 87% 950 86%
All sector subject areas 1,765 82% 2,225 83% 3,630 89% 7,620 85%
Source: Lifelong Learning Wales Record (LLWR)
Sector Subject Area
2012/13
16 - 18 19 - 24 All ages25 +
Table 3b - Framework success rates for Apprenticeships by sector subject area and age group
Leavers
Attaining
Full
Framework
%
Leavers
Attaining
Full
Framework
%
Leavers
Attaining
Full
Framework
%
Leavers
Attaining
Full
Framework
%
1: Health, Public Services and Care 140 85% 465 83% 1,180 87% 1,785 86%
3: Agriculture, Horticulture and Animal Care 15 * 5 * 5 * 30 *
4: Engineering and Manufacturing Technologies 280 91% 395 93% 140 92% 810 92%
5: Construction, Planning and the Built Environment 240 84% 230 79% 95 82% 565 81%
6: Information and Communication Technology 5 * 25 * 90 90% 120 90%
7: Retail and Commercial Enterprise 105 88% 345 89% 380 89% 830 89%
7(a): Retailing and Customer Service 10 * 125 89% 230 90% 365 89%
7(b): Hair and Beauty 80 89% 135 91% 45 * 260 91%
7(c): Hospitality and Catering 20 * 85 86% 105 85% 205 87%
8: Leisure, Travel and Tourism 35 * 70 94% 55 86% 160 91%
13: Education and Training * * 60 88% 295 91% 360 90%
15: Business, Administration and Law 35 * 215 87% 810 86% 1,055 86%
All sector subject areas 865 87% 1,830 87% 3,055 88% 5,750 87%
Source: Lifelong Learning Wales Record (LLWR)
16 - 18 25 +
Sector Subject Area
2012/13
19 - 24 All ages
17
Table 3c - Framework success rates for All Apprenticeships by sector subject area and age group
Leavers
Attaining
Full
Framework
%
Leavers
Attaining
Full
Framework
%
Leavers
Attaining
Full
Framework
%
Leavers
Attaining
Full
Framework
%
1: Health, Public Services and Care 370 84% 1,160 83% 2,440 87% 3,970 86%
3: Agriculture, Horticulture and Animal Care 55 84% 25 * 45 74% 125 80%
4: Engineering and Manufacturing Technologies 610 85% 670 90% 680 93% 1,955 89%
5: Construction, Planning and the Built Environment 630 81% 400 79% 200 85% 1,230 81%
6: Information and Communication Technology 20 * 65 90% 310 90% 395 87%
7: Retail and Commercial Enterprise 655 83% 1,005 85% 1,275 89% 2,935 86%
7(a): Retailing and Customer Service 110 81% 500 84% 830 90% 1,440 87%
7(b): Hair and Beauty 440 83% 230 87% 80 92% 750 85%
7(c): Hospitality and Catering 105 89% 280 84% 360 88% 740 86%
8: Leisure, Travel and Tourism 80 89% 130 91% 70 84% 280 88%
13: Education and Training 5 * 80 88% 355 91% 440 90%
15: Business, Administration and Law 195 88% 505 85% 1,310 86% 2,005 86%
All sector subject areas 2,630 83% 4,055 85% 6,685 88% 13,370 86%
Source: Lifelong Learning Wales Record (LLWR)
Sector Subject Area
16 - 18 19 - 24 All ages25 +
2012/13
18
Table 4a - Destinations of Traineeship leavers in three month period following end of programme
No. % No. % No. %
Continuing programme of learning 255 5% 255 6% 510 6%
New programme of learning at the same level 125 3% 225 6% 350 4%
Progressed to learning at a higher level 2,660 55% 920 23% 3,580 41%
Entering new employment / changing employment 325 7% 1,180 30% 1,505 17%
Continuing current employment * 0% 20 0% 25 0%
Self-employment 10 0% 10 0% 15 0%
Voluntary Work 65 1% 140 4% 205 2%
Seeking work / unemployed 1,055 22% 910 23% 1,965 22%
Other 175 4% 190 5% 360 4%
Not Known 180 4% 100 2% 280 3%
Total 4,855 3,945 8,800
Source: Lifelong Learning Wales Record (LLWR)
Table 4b - Destinations of Steps to Employment leavers in three month period following end of programme
No. % No. % No. %
Continuing programme of learning 25 1% 0 0% 25 1%
New programme of learning at the same level 115 3% 20 3% 135 3%
Progressed to learning at a higher level 225 6% 25 4% 250 6%
Entering new employment / changing employment 1,215 32% 295 49% 1,510 35%
Continuing current employment 20 1% 0 0% 20 0%
Self-employment 40 1% * 0% 40 1%
Voluntary Work 355 9% 5 1% 365 8%
Seeking work / unemployed 1,430 38% 255 42% 1,685 39%
Other 205 5% * 0% 205 5%
Not Known 130 3% 0 0% 130 3%
Total 3,760 610 4,365
Source: Lifelong Learning Wales Record (LLWR)
Destination
2012/13
Work Focussed
LearningRouteways to Work All
Destination
2012/13
Engagement Level 1 All
19
Table 5 - Learning activity success rates for WBL provision by programme, type of learning aim and age group
Attained
Learning
Activities
%
Attained
Learning
Activities
%
Attained
Learning
Activities
%
Foundation NVQ1 1,270 79% 2,965 86% 4,235 84%
Apprenticeship QCF Award/Certificate/Diploma 1,540 81% 6,005 86% 7,545 85%
Key Skills/Essential Skills Wales 2,950 80% 10,880 87% 13,835 85%
Other 110 69% 185 37% 290 44%
All 5,870 80% 20,040 85% 25,905 84%
NVQ1 665 87% 2,710 87% 3,375 87%
QCF Award/Certificate/Diploma 530 84% 4,465 86% 4,990 86%
Key Skills/Essential Skills Wales 1,160 88% 9,620 89% 10,775 89%
Other 320 87% 660 76% 980 80%
All 2,670 87% 17,455 87% 20,125 87%
Higher NVQ1 0 n/a 70 81% 70 81%
Apprenticeship QCF Award/Certificate/Diploma 0 n/a 65 64% 65 64%
Key Skills/Essential Skills Wales 0 n/a 175 76% 175 76%
Other 0 n/a 0 n/a 0 n/a
All 0 n/a 310 74% 310 74%
NVQ1 0 n/a 125 89% 125 89%
QCF Award/Certificate/Diploma * * 125 84% 125 84%
Key Skills/Essential Skills Wales * * 150 97% 155 97%
Other 0 n/a * * * *
All * * 400 90% 405 90%
Flexible Learning NVQ1 5 * 235 86% 240 86%
QCF Award/Certificate/Diploma * * 430 86% 430 85%
Key Skills/Essential Skills Wales 0 n/a 10 * 10 *
Other 0 n/a * * * *
All 5 * 675 86% 680 86%
Traineeship - QCF Award/Certificate/Diploma 1,335 81% 0 * 1,335 81%
Engagement Key Skills/Essential Skills Wales 1,800 82% * * 1,800 82%
Other 5 * 0 n/a 5 *
All 3,140 82% * * 3,140 82%
Traineeship - NVQ1 795 71% * * 800 70%
Level 1 QCF Award/Certificate/Diploma 2,545 79% 15 * 2,555 79%
Key Skills/Essential Skills Wales 4,185 78% 10 * 4,195 78%
Other 260 76% 5 * 265 76%
All 7,790 78% 30 * 7,820 77%
Steps to NVQ1 30 44% 310 62% 340 60%
Employment - QCF Award/Certificate/Diploma 245 69% 2,910 78% 3,155 77%
Work Focussed Key Skills/Essential Skills Wales 390 76% 3,500 78% 3,890 77%
Learning Other 25 * 470 79% 495 79%
All 695 72% 7,190 77% 7,885 77%
Steps to QCF Award/Certificate/Diploma 35 * 370 95% 405 94%
Employment - Key Skills/Essential Skills Wales 25 * 80 86% 105 88%
Routeways to Work Other * * 15 * 15 *
All 60 92% 465 93% 525 93%
Source: Lifelong Learning Wales Record (LLWR)1 Includes QCF qualifications that directly replace NVQs
Modern Skills Diploma
2012/13
18 and under 19 and over All ages
Type of Programme Type of learning aim
Apprenticeship
20
Table 6: Completion, attainment and success rates for ACL provision by type of provision and level
Directly delivered by Entry Level 1,875 94% 1,135 90% 82%
local authorities Level 1 4,140 90% 2,340 87% 78%
Level 2 1,040 93% 910 89% 82%
Other Levels 17,105 88% 3,175 89% 79%
All 24,165 89% 7,560 88% 80%
Delivered by local authorities Entry Level 7,860 93% 5,325 89% 82%
via a franchise arrangement Level 1 7,625 90% 5,935 88% 79%
with an FE institution Level 2 5,590 93% 4,710 89% 83%
Other Levels 875 91% 590 78% 70%
All 21,950 92% 16,560 88% 81%
Other ACL delivered Entry Level 18,705 93% 13,040 85% 78%
by FE institutions Level 1 33,205 96% 29,490 94% 90%
Level 2 13,365 95% 10,810 90% 86%
Other Levels 13,300 95% 2,240 87% 80%
All 78,575 95% 55,580 90% 86%
All provision types Entry Level 28,445 93% 19,500 86% 80%
Level 1 44,970 94% 37,770 92% 87%
Level 2 19,995 95% 16,430 90% 85%
Other Levels 31,280 91% 6,000 87% 78%
All 124,690 93% 79,700 90% 84%
Source: Lifelong Learning Wales Record (LLWR)
% Attainment % Success
2012/13
Type of ACL provision LevelNo. of
Completed
Learning
Activities
%
Completion
No. of
Attained
Learning
Activities
21
Table 7: Completion, attainment and success rates for ACL provision by type of provision and age group
Directly delivered by 18 and under 460 96% 280 92% 85%
local authorities 19 - 24 1,310 93% 600 90% 80%
25 - 49 8,435 93% 2,895 87% 78%
50 - 74 12,100 94% 3,360 89% 81%
75 and over 1,730 92% 400 85% 76%
All 24,165 93% 7,560 88% 80%
Delivered by local authorities 18 and under 785 93% 585 84% 73%
via a franchise arrangement 19 - 24 2,275 91% 1,670 86% 78%
with an FE institution 25 - 49 10,645 92% 7,810 87% 79%
50 - 74 7,550 93% 5,935 90% 84%
75 and over 690 97% 550 90% 83%
All 21,950 94% 16,560 88% 81%
Other ACL delivered 18 and under 4,365 93% 3,420 92% 88%
by FE institutions 19 - 24 11,310 93% 8,580 92% 87%
25 - 49 38,705 89% 26,985 89% 85%
50 - 74 21,585 94% 14,855 91% 86%
75 and over 2,345 97% 1,605 91% 86%
All 78,575 95% 55,580 90% 86%
All provision types 18 and under 5,610 93% 4,285 91% 85%
19 - 24 14,895 93% 10,850 91% 85%
25 - 49 57,780 89% 37,690 89% 83%
50 - 74 41,235 94% 24,145 91% 85%
75 and over 4,765 97% 2,555 90% 84%
All 124,690 95% 79,700 90% 84%
Source: Lifelong Learning Wales Record (LLWR)
Type of Provision Age Group
2012/13
No. of
Attained
Learning
Activities
% Attainment % Success
No. of
Completed
Learning
Activities
%
Completion
22
Table 8: Completion, attainment and success rates for ACL provision by level and sector subject area
Entry Level Arts, Media and Publishing 2,495 96% 1,555 92% 88%
Information and Communication Technology 2,530 93% 1,895 90% 83%
Languages, Literature and Culture 1,505 93% 940 87% 80%
Adult Basic Education 7,190 94% 4,225 90% 84%
English for Speakers of Other Languages 8,615 92% 5,950 78% 72%
Other 6,110 92% 4,930 90% 83%
All 28,445 93% 19,500 86% 80%
Level 1 Arts, Media and Publishing 6,400 93% 4,790 90% 84%
Information and Communication Technology 6,630 91% 4,900 87% 79%
Languages, Literature and Culture 3,790 92% 3,100 93% 86%
Adult Basic Education 3,695 93% 2,695 87% 81%
English for Speakers of Other Languages 5,255 97% 4,825 94% 92%
Other 19,200 96% 17,460 94% 91%
All 44,970 94% 37,770 92% 87%
Level 2 Arts, Media and Publishing 2,775 93% 2,540 92% 85%
Information and Communication Technology 3,330 93% 2,085 86% 79%
Languages, Literature and Culture 880 89% 555 82% 70%
Adult Basic Education 975 94% 365 78% 73%
English for Speakers of Other Languages 535 97% 455 86% 83%
Other 11,500 96% 10,430 91% 87%
All 19,995 95% 16,430 90% 85%
Other Levels Arts, Media and Publishing 7,065 89% 1,065 85% 79%
Information and Communication Technology 6,715 91% 1,465 87% 77%
Languages, Literature and Culture 1,560 80% 465 90% 75%
Adult Basic Education 2,015 91% 395 96% 87%
English for Speakers of Other Languages 1,230 94% 130 94% 83%
Other 12,700 93% 2,480 85% 78%
All 31,280 91% 6,000 87% 78%
All Levels Arts, Media and Publishing 18,740 92% 9,950 90% 84%
Information and Communication Technology 19,200 92% 10,345 87% 80%
Languages, Literature and Culture 7,735 89% 5,060 90% 82%
Adult Basic Education 13,875 93% 7,680 89% 82%
English for Speakers of Other Languages 15,635 94% 11,360 85% 80%
Other 49,505 95% 35,305 92% 88%
All 124,690 93% 79,700 90% 84%
Source: Lifelong Learning Wales Record (LLWR)
No. of
Attained
Learning
Activities
% Attainment % SuccessLevel Sector Subject Area
2012/13
No. of
Completed
Learning
Activities
%
Completion
23
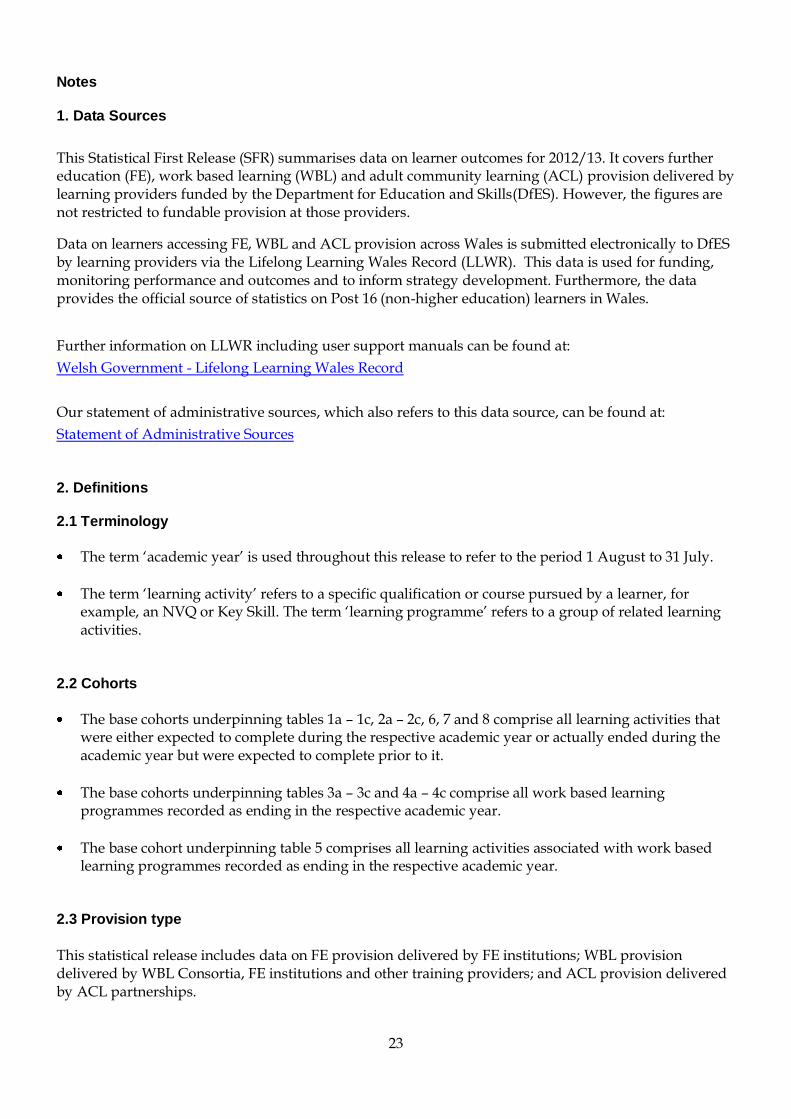
Notes 1. Data Sources
This Statistical First Release (SFR) summarises data on learner outcomes for 2012/13. It covers further education (FE), work based learning (WBL) and adult community learning (ACL) provision delivered by learning providers funded by the Department for Education and Skills(DfES). However, the figures are not restricted to fundable provision at those providers.
Data on learners accessing FE, WBL and ACL provision across Wales is submitted electronically to DfES by learning providers via the Lifelong Learning Wales Record (LLWR). This data is used for funding, monitoring performance and outcomes and to inform strategy development. Furthermore, the data provides the official source of statistics on Post 16 (non-higher education) learners in Wales.
Further information on LLWR including user support manuals can be found at:
Welsh Government - Lifelong Learning Wales Record
Our statement of administrative sources, which also refers to this data source, can be found at:
Statement of Administrative Sources
2. Definitions 2.1 Terminology
The term ‘academic year’ is used throughout this release to refer to the period 1 August to 31 July.
The term ‘learning activity’ refers to a specific qualification or course pursued by a learner, for example, an NVQ or Key Skill. The term ‘learning programme’ refers to a group of related learning activities.
2.2 Cohorts
The base cohorts underpinning tables 1a – 1c, 2a – 2c, 6, 7 and 8 comprise all learning activities that were either expected to complete during the respective academic year or actually ended during the academic year but were expected to complete prior to it.
The base cohorts underpinning tables 3a – 3c and 4a – 4c comprise all work based learning programmes recorded as ending in the respective academic year.
The base cohort underpinning table 5 comprises all learning activities associated with work based learning programmes recorded as ending in the respective academic year.
2.3 Provision type
This statistical release includes data on FE provision delivered by FE institutions; WBL provision delivered by WBL Consortia, FE institutions and other training providers; and ACL provision delivered by ACL partnerships.
24
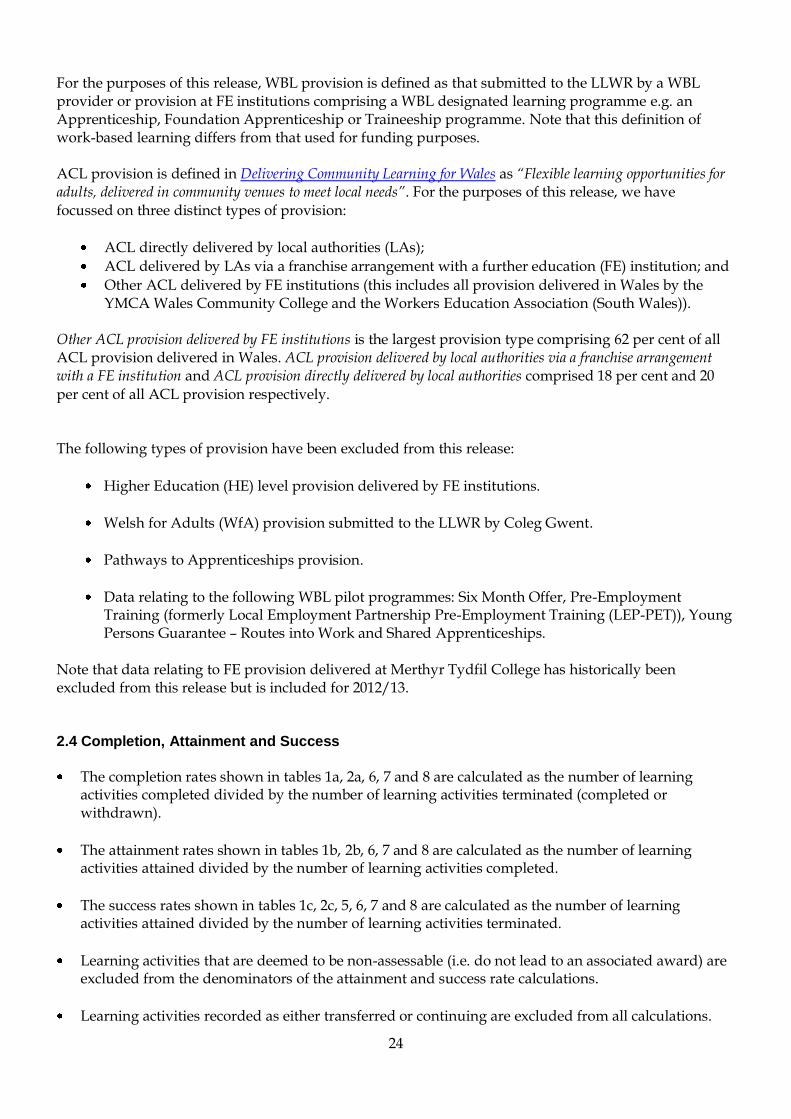
For the purposes of this release, WBL provision is defined as that submitted to the LLWR by a WBL provider or provision at FE institutions comprising a WBL designated learning programme e.g. an Apprenticeship, Foundation Apprenticeship or Traineeship programme. Note that this definition of work-based learning differs from that used for funding purposes. ACL provision is defined in Delivering Community Learning for Wales as “Flexible learning opportunities for adults, delivered in community venues to meet local needs”. For the purposes of this release, we have focussed on three distinct types of provision:
ACL directly delivered by local authorities (LAs);
ACL delivered by LAs via a franchise arrangement with a further education (FE) institution; and
Other ACL delivered by FE institutions (this includes all provision delivered in Wales by the YMCA Wales Community College and the Workers Education Association (South Wales)).
Other ACL provision delivered by FE institutions is the largest provision type comprising 62 per cent of all ACL provision delivered in Wales. ACL provision delivered by local authorities via a franchise arrangement with a FE institution and ACL provision directly delivered by local authorities comprised 18 per cent and 20
per cent of all ACL provision respectively. The following types of provision have been excluded from this release:
Higher Education (HE) level provision delivered by FE institutions.
Welsh for Adults (WfA) provision submitted to the LLWR by Coleg Gwent.
Pathways to Apprenticeships provision.
Data relating to the following WBL pilot programmes: Six Month Offer, Pre-Employment Training (formerly Local Employment Partnership Pre-Employment Training (LEP-PET)), Young Persons Guarantee – Routes into Work and Shared Apprenticeships.
Note that data relating to FE provision delivered at Merthyr Tydfil College has historically been excluded from this release but is included for 2012/13. 2.4 Completion, Attainment and Success
The completion rates shown in tables 1a, 2a, 6, 7 and 8 are calculated as the number of learning activities completed divided by the number of learning activities terminated (completed or withdrawn).
The attainment rates shown in tables 1b, 2b, 6, 7 and 8 are calculated as the number of learning activities attained divided by the number of learning activities completed.
The success rates shown in tables 1c, 2c, 5, 6, 7 and 8 are calculated as the number of learning activities attained divided by the number of learning activities terminated.
Learning activities that are deemed to be non-assessable (i.e. do not lead to an associated award) are excluded from the denominators of the attainment and success rate calculations.
Learning activities recorded as either transferred or continuing are excluded from all calculations.

25
2.5 Weighted Success
The weighted success rates for FE provision shown in table 1c are calculated using the same methodology as the standard success rate but each learning activity is weighted by the relevant Credit Equivalence Unit (CEU) value associated with it.
CEUs are the base funding unit used in DfES’ National Planning & Funding System. 1 CEU represents 10 notional hours of learning time.
2.6 Framework Success
The framework success rates shown in tables 3a – 3c are calculated as the number of learning programmes where the full framework has been achieved divided by the number of learning programmes terminated.
Learning programmes recorded as either transferred or continuing at another WBL provider are excluded from the calculation. Learning programmes that ended within 8 weeks of commencing without completion are also excluded.
Learning programmes recorded as terminated due to the learner being made redundant have been excluded from the calculation.
Framework success rates for Higher Apprenticeships have not been included in this release due to small, unrepresentative numbers of leavers in 2012/13.
2.7 Other Short learning activities
Tables 1a – 1c include a line for ‘Other Short’ learning activities. These are defined as learning activities categorised as ‘Other’ with an expected length of less than 8 weeks. .
2.8 Learner Age Group
A learner’s age group is calculated from their age at 31 August in the academic year they started learning.
In tables 1a – 1c and 2a – 2c learners of unknown age are included in the age group 19 and over. 2.9 Sector/Subject Areas
The sector/subject areas detailed in Tables 2a – 2c, 3a – 3c and 8 are based on the 15 first-tier areas of learning in the Qualifications and Curriculum Development Agency’s (QCDA) sector/subject framework and reflect the sub-areas used by Estyn for inspection purposes. The sector/subject areas in table 8 have been grouped to reflect the most popular ACL subject areas.
The total lines include learning activities with unknown sector/subject areas.
Apprenticeship programmes have been mapped to sector/subject areas in tables 3a – 3c on the basis of the occupational sector code.

26
2.10 Early Drop-out
For FE and ACL provision, learning activities with an expected length of 24 weeks or greater that ended within 8 weeks of their start date without completing have been classified as early drop-outs and excluded from calculations.
In the case of WBL provision, learning activities with an expected length of 24 weeks or greater that ended within 8 weeks of their start date without completing have been classified as early drop-outs and excluded from calculations.
2.11 Destinations
The Skill Build Youth and Adult programmes were replaced in August 2011 by Traineeship and Steps to Employment programmes respectively. As such, care should be taken when making comparisons between the data detailed in Tables 4a – 4c and Skill Build destinations data published in previous years.
Destinations data for Traineeship – Bridge to Employment programmes has not been included in this release due to small, unrepresentative numbers of leavers in 2012/13.
3. Rounding and Suppression
All figures in this Statistical Release are rounded to the nearest 5 and therefore there may be apparent slight differences between the sum of the constituent rows/columns and the totals. A ‘*’ represents numbers greater than 0 but less than 5.
In addition, percentage calculations where the denominator is less than 50 have been suppressed and the percentage replaced with a ‘*‘.
4. Key Quality Information
This section provides a summary of information on this output against five dimensions of quality: Relevance, Accuracy, Timeliness and Punctuality, Accessibility and Clarity, and Comparability. 4.1 Relevance
The measures set out in this publication are primarily used:
by the Welsh Government - DfES, to monitor providers’ performance and as baseline information to set targets for improvements as part of the Quality and Effectiveness Framework for post-16 learning;
by Estyn, to inform inspection judgements on Key Question 1 ‘How well do learners achieve?’; and
by providers themselves, as a management tool to measure their own performance and benchmark themselves against sector averages, as part of their annual self-assessment cycles.
The Welsh Government and Estyn have a commitment to share data in order to minimise bureaucracy for providers and ensure consistent definitions of performance wherever possible and have worked together closely to develop these measures and a standard format for presenting data.
27
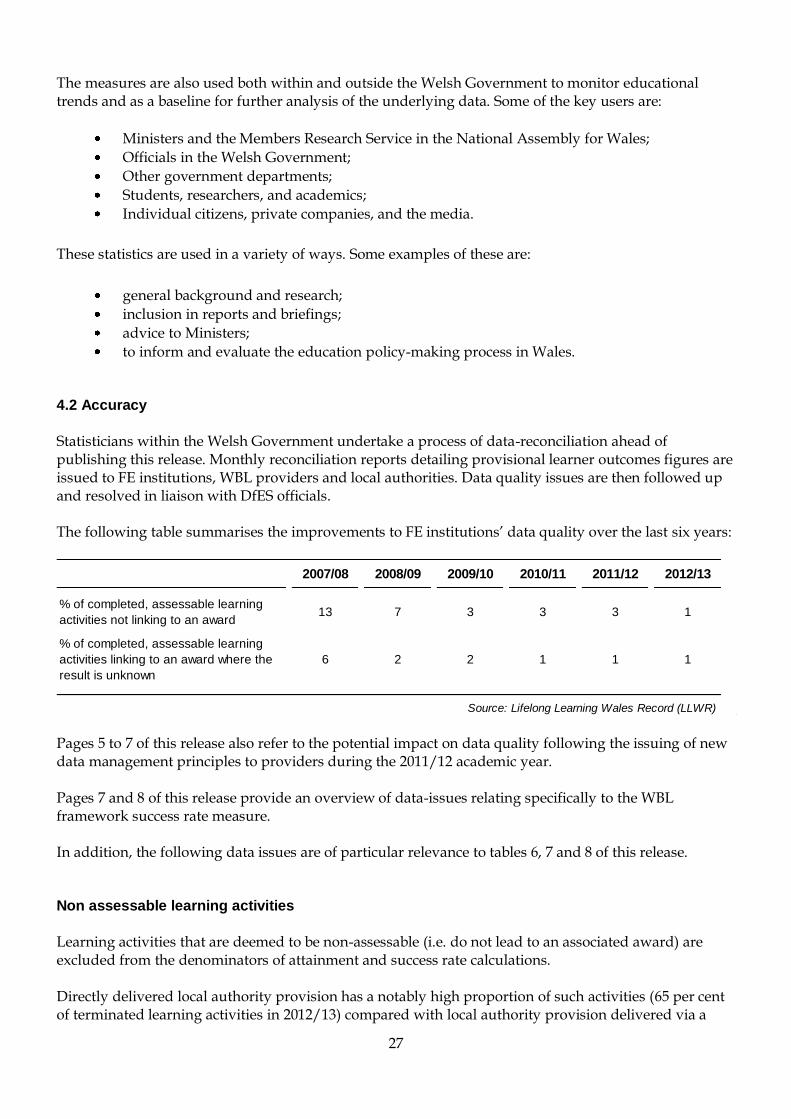
The measures are also used both within and outside the Welsh Government to monitor educational trends and as a baseline for further analysis of the underlying data. Some of the key users are:
Ministers and the Members Research Service in the National Assembly for Wales;
Officials in the Welsh Government;
Other government departments;
Students, researchers, and academics;
Individual citizens, private companies, and the media.
These statistics are used in a variety of ways. Some examples of these are:
general background and research;
inclusion in reports and briefings;
advice to Ministers;
to inform and evaluate the education policy-making process in Wales. 4.2 Accuracy
Statisticians within the Welsh Government undertake a process of data-reconciliation ahead of publishing this release. Monthly reconciliation reports detailing provisional learner outcomes figures are issued to FE institutions, WBL providers and local authorities. Data quality issues are then followed up and resolved in liaison with DfES officials. The following table summarises the improvements to FE institutions’ data quality over the last six years:
2007/08 2008/09 2009/10 2010/11 2011/12 2012/13
% of completed, assessable learning
activities not linking to an award13 7 3 3 3 1
% of completed, assessable learning
activities linking to an award where the
result is unknown
6 2 2 1 1 1
Source: Lifelong Learning Wales Record (LLWR) Pages 5 to 7 of this release also refer to the potential impact on data quality following the issuing of new data management principles to providers during the 2011/12 academic year. Pages 7 and 8 of this release provide an overview of data-issues relating specifically to the WBL framework success rate measure. In addition, the following data issues are of particular relevance to tables 6, 7 and 8 of this release. Non assessable learning activities
Learning activities that are deemed to be non-assessable (i.e. do not lead to an associated award) are excluded from the denominators of attainment and success rate calculations. Directly delivered local authority provision has a notably high proportion of such activities (65 per cent of terminated learning activities in 2012/13) compared with local authority provision delivered via a
28
franchise arrangement with an FE institution (14 per cent of terminated learning activities) and other ACL provision delivered by FE institutions (22 per cent of terminated activities). However, further analysis by local authority reveals that the proportion of non-assessable activities varies considerably between providers. This indicates that non-assessable provision is being inconsistently recorded and thereby potentially impacting on attainment and success rates. Level of learning activities
A significant number of local authority learning activities were recorded with a level of ‘Not Known’ or ‘Not Applicable’ on LLWR. In 2012/13, these learning activities have been categorised as ‘Other Levels’ in tables 6 and 8 of this release. Other ACL delivered by FE institutions
For the purposes of this release, this provision has been identified using information recorded in the type of learning programme field. Information on type of learning programme is based on FE institutions’ own identification of ACL provision.
4.3 Timeliness and Punctuality
Data for a given academic year are published as soon as possible. The current annual timescale for the production of final learner outcomes data has been agreed in consultation with learning providers and balances timeliness against the need for accurate data-quality in order to underpin robust sector benchmarks. Statistics on a given academic year are drawn from a database based on the LLWR as at February following the end of the academic year. This first release is then produced and published as soon as possible during April.
4.4 Accessibility and Clarity
This statistical release is pre-announced and then published on the Statistics and Research section of the Welsh Government website. 4.5 Comparability
Figures in this statistical release are broadly comparable with previous years. Past releases can be accessed via the following link: Learner Outcome Measures for Further Education, Work Based Learning and Adult Community Learning - past releases Note that, prior to this year, data on FE and WBL provision were published separately to ACL provision. Equivalent data on post-16 learner outcomes in England, Scotland and Northern Ireland can be found via the following links: Skills Funding Agency / Department for Business & Skills - Learner participation, outcomes and level of highest qualification Scottish Funding Council - Staff and Student Performance Indicators for FE Colleges

29
Department for Employment & Learning Northern Ireland - Further Education Performance Statistics However, due to differences in methodology and data collection, caution should be exercised in making direct comparisons with the figures contained within this release. 5. Additional Information 5.1 Further dissemination of performance measures
Learner Outcomes Reports (LORs) for FE institutions, WBL consortia, other training providers and ACL partnerships will be published by DfES in May 2014: Learner Outcomes Reports for Further Education Learner Outcomes Reports for Work Based Learning Providers
Data underpinning the 2012/13 learner outcome measures will also be included in WAG - DfES’ online benchmarking tool for use by FE institutions, WBL providers and ACL partnerships. This will enable providers to make detailed comparisons of their learner outcomes down to individual learning activity level. Estyn inspectors will also have access to the benchmarking tool in order to inform their judgements on how well learners achieve.
Related Documents