Lean Six Sigma Trial Exam Green Belt Name of the Green Belt: …………………………… Please check you are taking the correct exam. This is an open-book exam. You are allowed to use books and notes. You are not allowed to use a calculator, telephone, tablet or computer. Please circle your answer. Calculation of points Score = 10(#correct – 10) / 30 The score will be rounded to halves, with the exception of 5.5. The exam consists of 40 questions. This material is intellectual property of the Institute for Business and Industrial Statistics of the University of Amsterdam (IBIS UvA) http://www.ibisuva.nl.

Welcome message from author
This document is posted to help you gain knowledge. Please leave a comment to let me know what you think about it! Share it to your friends and learn new things together.
Transcript
Lean Six SigmaTrial Exam
Green Belt
Name of the Green Belt:
……………………………
Please check you are taking the correct exam.
This is an open-book exam. You are allowed to use books and notes.
You are not allowed to use a calculator, telephone, tablet or computer.
Please circle your answer.
Calculation of points
Score = 10(#correct – 10) / 30
The score will be rounded to halves, with the exception of 5.5.
The exam consists of 40 questions.
This material is intellectual property ofthe Institute for Business and Industrial Statistics
of the University of Amsterdam (IBIS UvA)
http://www.ibisuva.nl.
DMAIC 7: Improve process control
The Green Belt (GB) implements new standard operating procedures. To make sure these procedures are followed, she organizes weekly coaching sessions. In a coaching session, the team leaders check whether the team members follow procedures. If not, then the team leader helps team members to do so. If necessary, the operating procedures are further improved.
According to Juran, this is an example of…
a) …visual management.b) …quality improvement, where management continuously improves the process.c) …quality control, where management checks and facilitates personnel.d) …a control chart with an out-of-control-action-plan (OCAP).
1
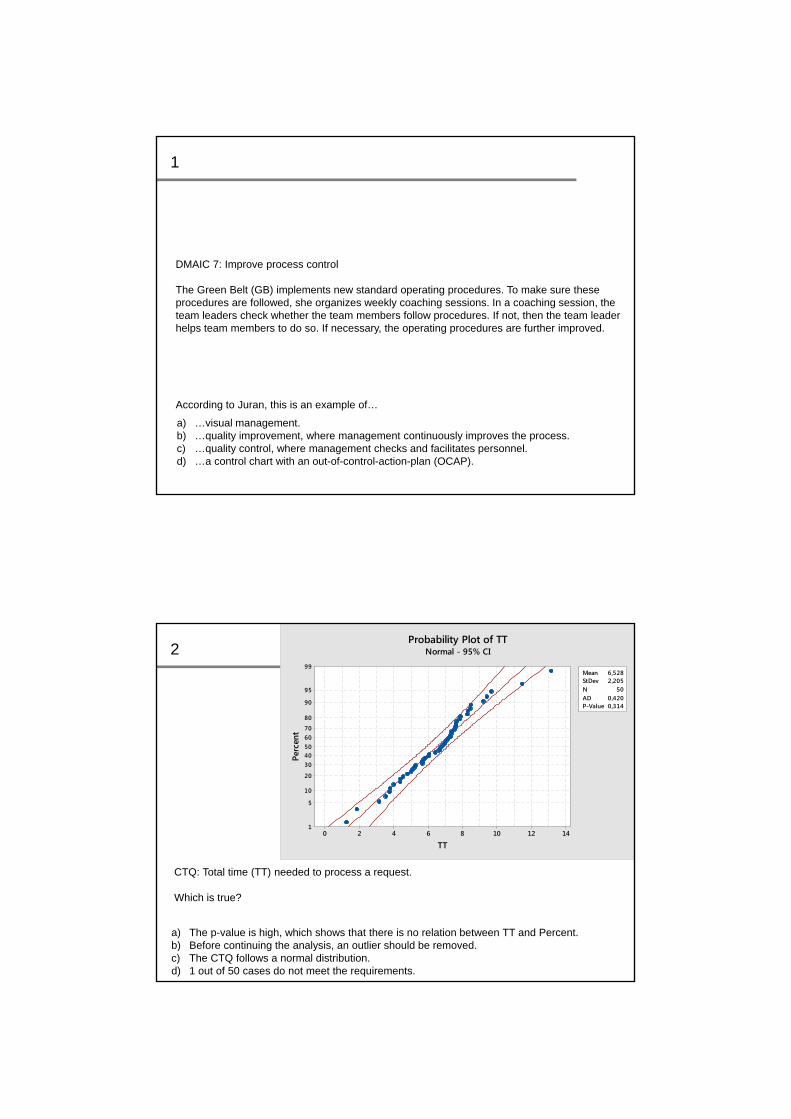
CTQ: Total time (TT) needed to process a request.
Which is true?
a) The p-value is high, which shows that there is no relation between TT and Percent.b) Before continuing the analysis, an outlier should be removed.c) The CTQ follows a normal distribution.d) 1 out of 50 cases do not meet the requirements.
2
14121086420
99
95
90
80
7060504030
20
10
5
1
Mean 6,528StDev 2,205N 50AD 0,420P-Value 0,314
TT
Perc
ent
Probability Plot of TTNormal - 95% CI

In DMAIC 3, the GB creates the control chart above.
What is the logical next step?
a) The process is not in control, proceed to DMAIC’s control phase.b) Find out what caused the outliers.
c) Split the dataset in two, and make a separate control chart for each part.
d) Determine the customer specification limits (LSL and USL).
3
464136312621161161
4,0
3,8
3,6
3,4
3,2
3,0
_X=3,335
UCL=3,649
LCL=3,022
111
Step 1
PT: 5 min.
Step 2
PT: 2 min.
Step 3
PT: 10 min.Takt time: 3 min.Takt rate: 20 requests/hr
a) 3. b) 7.c) 10.d) 17.
Requests are processed in three steps. The processing time (PT) for each process step is indicated above. There is negligible variation in work volume and PTs.
How many employees are needed to sufficiently staff this process (assume that employees are dedicated to a process step)?
Incoming requests
4
How did we arrive at ‘Six Sigma’ as a name for the improvement programme?
a) Because all processes are allowed to deviate 6 from the mean at most.b) The method originated from statistics.c) It is a symbolic name that represents the pursuit of virtually zero defects.d) It was the official name of the 6th reorganisation at Motorola.
5
In a distribution center, a GB measures the daily work volume, and the amount of time that is needed (TN) to collect an order.
She uses a database that contains daily volumes. She uses time sheets to measure the TNs.
What type of variables is she dealing with?
a) Work volume is categorical, TN is categorical.b) Work volume is numerical, TN is categorical.c) Work volume is categorical, TN is numerical.d) Work volume is numerical, TN is numerical.
6

A GB performed a regression to study the potential effect of X on her CTQ Y.
Given the analysis above, which statement is true?
a) X explains the majority of the variation in Y.b) X does not have a significant effect on Y.c) The predicted value for Y is 2.05 when X=2.d) The p-value is too low for reliable conclusions.
7
Regression Analysis: CTQ versus XThe regression equation is CTQ = 0.65 + 0.70 X S = 1.40 R-Sq = 34.8% R-Sq(adj) = 32.5 %
Analysis of VarianceSource DF SS MS F PRegression 1 29.1469 29.1469 14.9743 0.001Error 28 54.5010 1.9465 Total 29 83.6478
a) Customer satisfaction and operational costs.b) Quality, efficiency and operational costs.
c) Quality of service.
d) Personnel costs.
8
A GB investigates a process in a call center, where requests for information are processed. Company policy prescribes that waiting time before a customer is connected to an operator, should always be below 10 minutes. There is only one CTQ: Waiting time (per call).
What could be the strategic focal point(s) of this project?
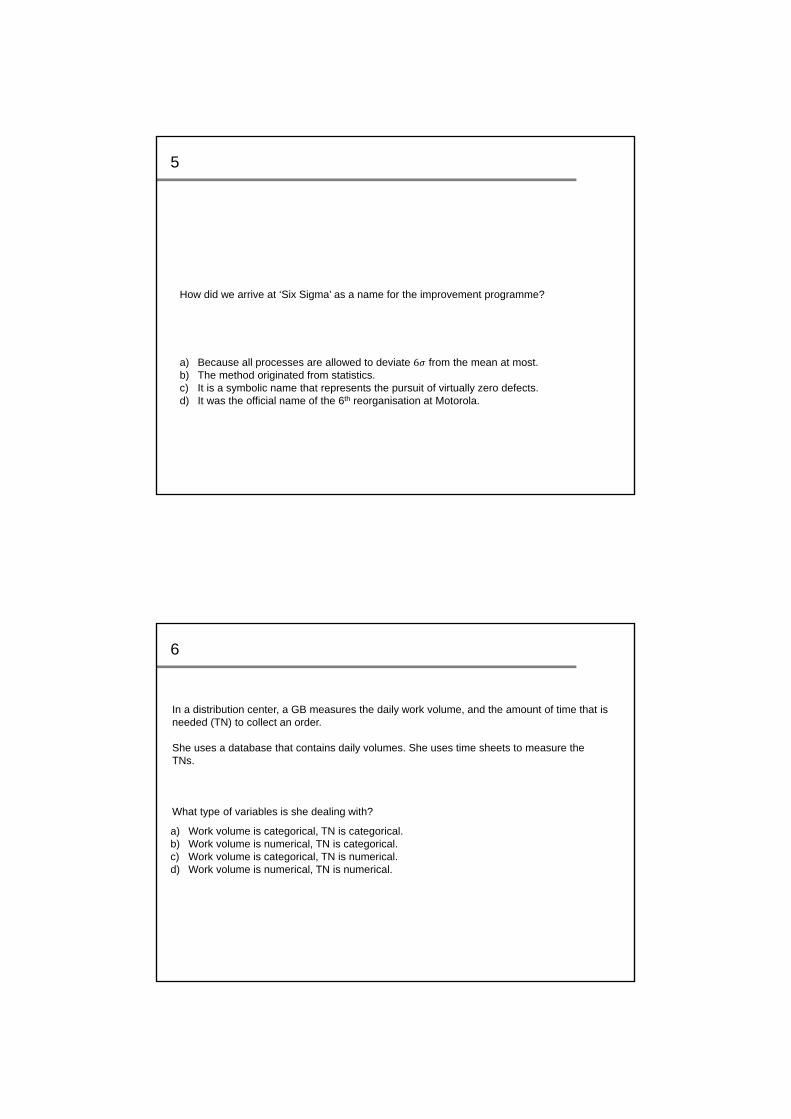
What statement is not true given the information in the boxplot?
a) The distribution of Group 1 is relatively skewed.b) The graph enables us to read the averages of both groups separately.c) The dispersion in Group 2 is higher.d) Roughly half of the values in Group 2 is higher than 3.9.
9
Boxplot of Group 1, Group 2
Group 1 Group 2
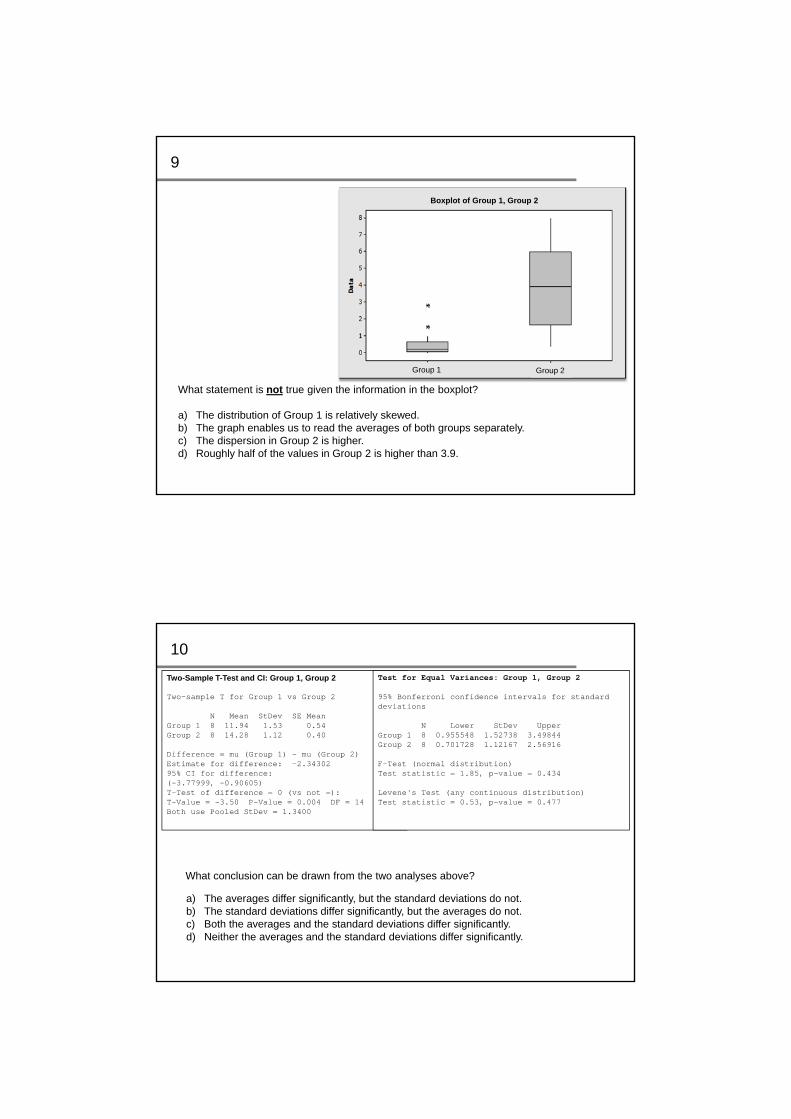
Two-Sample T-Test and CI: Group 1, Group 2
Two-sample T for Group 1 vs Group 2
N Mean StDev SE MeanGroup 1 8 11.94 1.53 0.54Group 2 8 14.28 1.12 0.40
Difference = mu (Group 1) - mu (Group 2)Estimate for difference: -2.3430295% CI for difference: (-3.77999, -0.90605)T-Test of difference = 0 (vs not =): T-Value = -3.50 P-Value = 0.004 DF = 14Both use Pooled StDev = 1.3400
Test for Equal Variances: Group 1, Group 2
95% Bonferroni confidence intervals for standard deviations
N Lower StDev UpperGroup 1 8 0.955548 1.52738 3.49844Group 2 8 0.701728 1.12167 2.56916
F-Test (normal distribution)Test statistic = 1.85, p-value = 0.434
Levene's Test (any continuous distribution)Test statistic = 0.53, p-value = 0.477
a) The averages differ significantly, but the standard deviations do not.b) The standard deviations differ significantly, but the averages do not.c) Both the averages and the standard deviations differ significantly.d) Neither the averages and the standard deviations differ significantly.
What conclusion can be drawn from the two analyses above?
10
DMAIC 4 is called “Identify potential influence factors”. Which of these tools is probably not useful here?
a) Failure Mode & Effect Analysis (FMEA).b) Control charts.c) Control plan.d) Ishikawa or fishbone diagram.
11
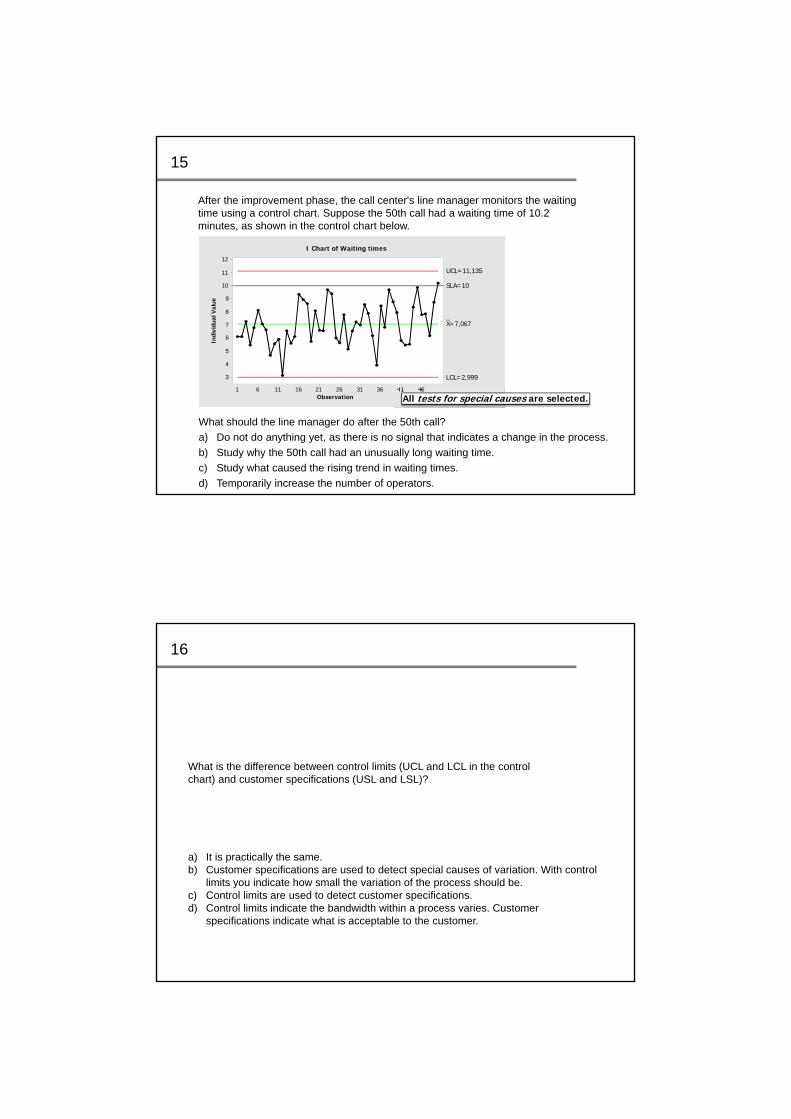
a) In roughly 95% of days, the amount of calls is between 475 and 575.b) The standard deviation is roughly equal to the median.c) In roughly 68% of days, the amount of calls is between 495 500 25 and
505 500 25 .d) In roughly 50% of days, the amount of calls is below 500.
The number of calls that arrives at a call center each day has a normal distribution with an average of 500 and a standard deviation of 25.
A GB records the number of incoming calls for 1000 consecutive days
What is true about the data that the GB collected?
12

If the GB wants to generate more ideas for possible influence factors, what would be a good next step?
a) Autopsies and BOB vs. WOW.
b) Find out the reason for the large differences between call centers.
c) Perform an ANOVA to find out whether the differences are significant.
d) Perform a test for equal variances.
A company has three call centers. To find influence factors for waiting time (WT), the GB considers the individual value plot.
13
Individual value plot of WT versus CC
Call center
WT
a) Explain to him that Lean Six Sigma is a good method, and stress what the financial benefits are.
b) Invite him for a meeting, and ask something like “A worthless method, you say?” and listen.
c) Shout at him and tell him he is being disloyal.d) Accept his resignation and try to find somebody to replace him on the team.
During the first Lean Six Sigma team meeting, a team member does not show up. You run into him in the hallways the next day, and ask him where he was the day before.He tells you that he will also be absent the next meeting, because he thinks Lean Six Sigma is a worthless method.
What is the appropriate response?
14
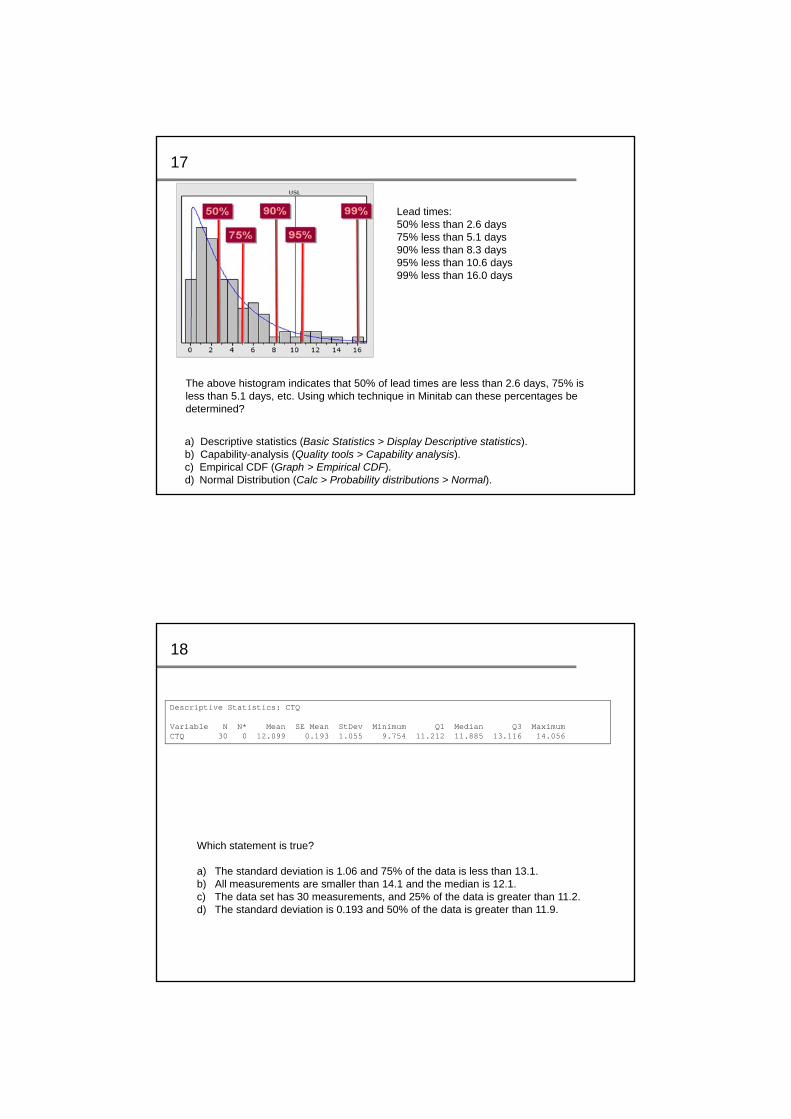
After the improvement phase, the call center's line manager monitors the waiting time using a control chart. Suppose the 50th call had a waiting time of 10.2 minutes, as shown in the control chart below.
What should the line manager do after the 50th call?
a) Do not do anything yet, as there is no signal that indicates a change in the process.
b) Study why the 50th call had an unusually long waiting time.
c) Study what caused the rising trend in waiting times.
d) Temporarily increase the number of operators.
464136312621161161
12
11
10
9
8
7
6
5
4
3
Observation
Indi
vidu
alV
alue
_X=7,067
UCL=11,135
LCL=2,999
SLA=10
I Chart of Waiting times
All tests for special causes are selected.
15
What is the difference between control limits (UCL and LCL in the control chart) and customer specifications (USL and LSL)?
a) It is practically the same.b) Customer specifications are used to detect special causes of variation. With control
limits you indicate how small the variation of the process should be.c) Control limits are used to detect customer specifications.d) Control limits indicate the bandwidth within a process varies. Customer
specifications indicate what is acceptable to the customer.
16
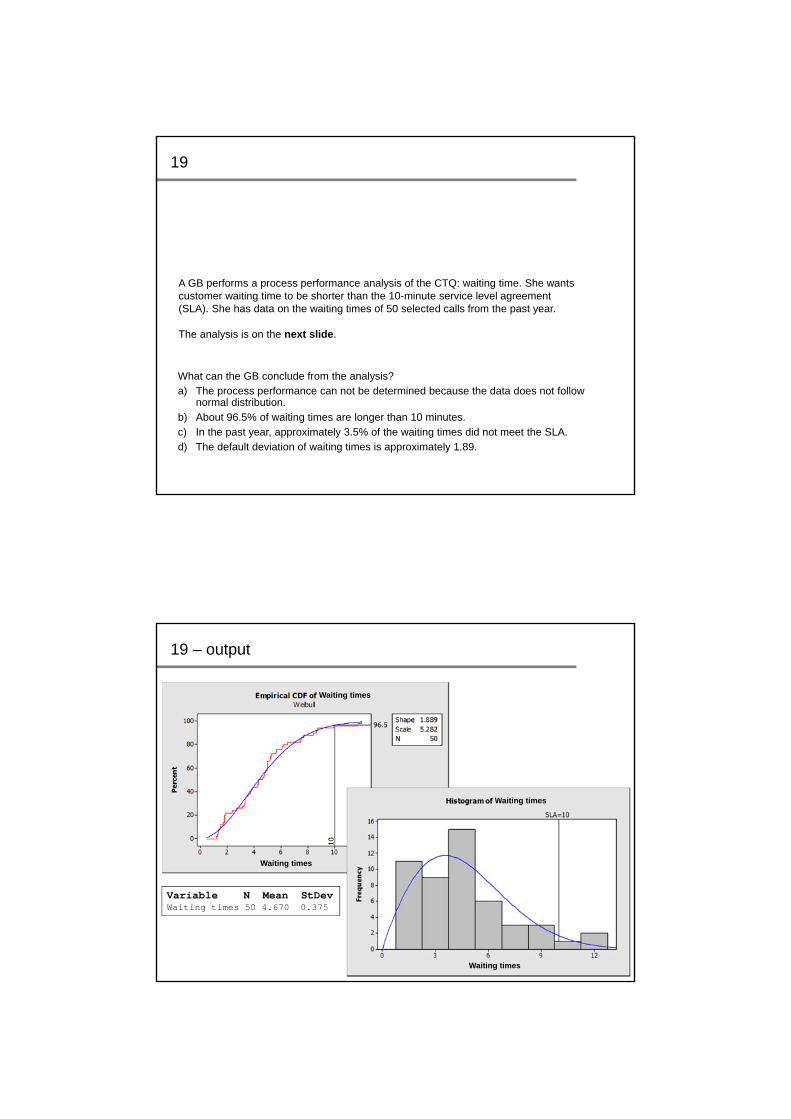
Lead times:50% less than 2.6 days75% less than 5.1 days90% less than 8.3 days95% less than 10.6 days99% less than 16.0 days
The above histogram indicates that 50% of lead times are less than 2.6 days, 75% is less than 5.1 days, etc. Using which technique in Minitab can these percentages be determined?
a) Descriptive statistics (Basic Statistics > Display Descriptive statistics). b) Capability-analysis (Quality tools > Capability analysis).c) Empirical CDF (Graph > Empirical CDF).d) Normal Distribution (Calc > Probability distributions > Normal).
17
Descriptive Statistics: CTQ
Variable N N* Mean SE Mean StDev Minimum Q1 Median Q3 MaximumCTQ 30 0 12.099 0.193 1.055 9.754 11.212 11.885 13.116 14.056
Which statement is true?
a) The standard deviation is 1.06 and 75% of the data is less than 13.1.b) All measurements are smaller than 14.1 and the median is 12.1.c) The data set has 30 measurements, and 25% of the data is greater than 11.2.d) The standard deviation is 0.193 and 50% of the data is greater than 11.9.
18
A GB performs a process performance analysis of the CTQ: waiting time. She wants customer waiting time to be shorter than the 10-minute service level agreement (SLA). She has data on the waiting times of 50 selected calls from the past year.
The analysis is on the next slide.
What can the GB conclude from the analysis?a) The process performance can not be determined because the data does not follow
normal distribution.
b) About 96.5% of waiting times are longer than 10 minutes.
c) In the past year, approximately 3.5% of the waiting times did not meet the SLA.d) The default deviation of waiting times is approximately 1.89.
19
Variable N Mean StDevWaiting times 50 4.670 0.375
19 – output
Waiting times
Waiting times
Waiting times
Waiting times

One-way ANOVA: Waiting time versus CallcenterSource DF SS MS F PCallcenter 2 2.85 1.42 0.16 0.855Error 27 243.42 9.02Total 29 246.27
S = 3.003 R-Sq = 1.16% R-Sq(adj) = 0.00%
Individual 95% CIs For Mean Level N Mean StDev --------+---------+---------+---------+-Central 10 5.288 3.460 (---------------*---------------)North 10 4.993 2.848 (----------------*---------------)South 10 4.539 2.639 (---------------*---------------)
--------+---------+---------+---------+-3.6 4.8 6.0 7.2
The GB has performed an ANOVA with CTQ Waiting time and factor Callcenter.
What conclusion can the GB draw from this analysis of variance (ANOVA)?
a) There are significant differences in average waiting time between call centers.
b) Call center has an effect on waiting time, but only a very small effect.
c) Call Center has no significant effect on waiting time.
d) South can serve as a benchmark, because it has the shortest waiting times.
20
When producing caffeine-free coffee, the extraction time (ET) is the most important factor of influence.
To investigate the effect of ET on the caffeine percentage (CTQ), the GB performs an experiment, varying the ET from 200 to 700 minutes.
The results of the experiment are analyzed using regression analysis.
In this case, how can the GB make sure her analysis is reliable?a) By looking at the corresponding patterns and normality of the residuals.
b) By removing outliers.
c) Due to the high R-Sq, more than 87.1%.d) By counting the dots (observations), there must be more than 30.
21
Analysis of VarianceSource DF SS MS F PRegression 1 0.0315351 0.0315351 121.09 0.000Error 18 0.0046876 0.0002604Total 19 0.0362227

Assume that the analysis is correct.
Based on the fitted line plot on the previous slide, which is shown above as well. What would be an acceptable extraction time (ET) to meet the USL of 0.1%?
a) ET = 200 min.
b) ET = 300 min.
c) ET = 350 min.d) ET = 430 min.
22
What does this mean?
a) It means that the slope of the regression line significantly differs from zero (i.e., theregression line is not horizontal).
b) It means that Caf% is significant.c) It means that the ET determines almost 100% of Caf%.
d) It means that the dataset is not large enough to prove that there is a relationshipbetween Caf% and ET.
23
Analysis of VarianceSource DF SS MS F PRegression 1 0.0315351 0.0315351 121.09 0.000Error 18 0.0046876 0.0002604Total 19 0.0362227
The regression analysis of Caf% versus ET (two slides back) states:
Suppose that a GB worries about possible irregularities in the data set during the analysis phase in DMAIC (Analyze), and thus wants to screen the data on outliers.
What is the best way to identify outliers in a dataset?
a) Regression
b) The empirical CDF (cumulative distribution function).c) The probability plot.
d) ANOVA.
24
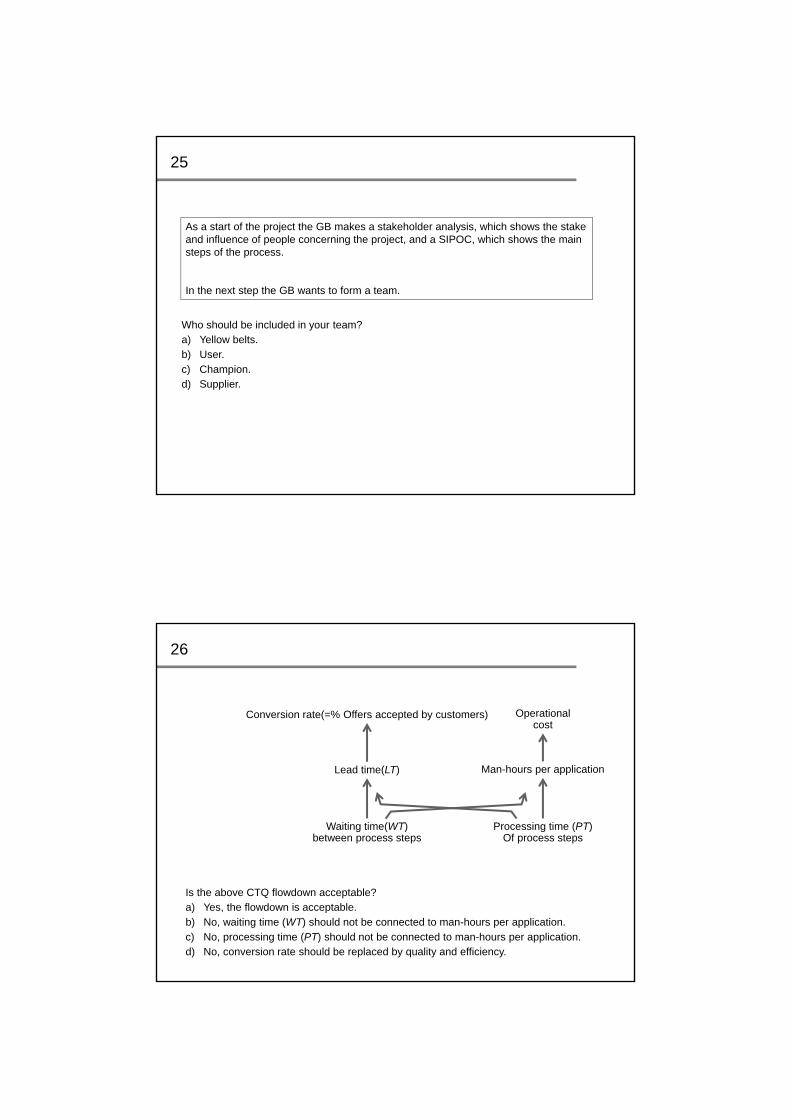
Reduce lead time of mortgage offersQuestions 25 to 40 relate to this case.
A bank handles requests for mortgages. If the request is accepted, an offer will be sent. Otherwise, a rejection letter will be drawn up.
• On average, 40 requests each day go through the process. In the first phase, they are processed by 4 coordinators, who check the applications for completeness, and request further information from the Kadaster.
• Next, the coordinators send the request to one of the 3 reviewers. They assess whether the applicant meets the requirements for a loan, and they determine the interest rate.
• Applications for the larger loans (25% of applications) are then sent to an internal advisor who assesses the risk and decides on approval or rejection of the loan.
• Eventually 10% of applications are rejected. In that case, the secretary will write a rejection letter. For approved applications (90%), the secretary makes an offer and sends it to the applicant.
The company loses customers due to the long turnaround of the process. If applicants do not receive an offer within a few days, they give it up and try it at another bank. This results in a bad conversion rate (= the percentage of bids accepted by the applicants).
Who should be included in your team?a) Yellow belts.
b) User.
c) Champion.d) Supplier.
As a start of the project the GB makes a stakeholder analysis, which shows the stake and influence of people concerning the project, and a SIPOC, which shows the main steps of the process.
In the next step the GB wants to form a team.
25
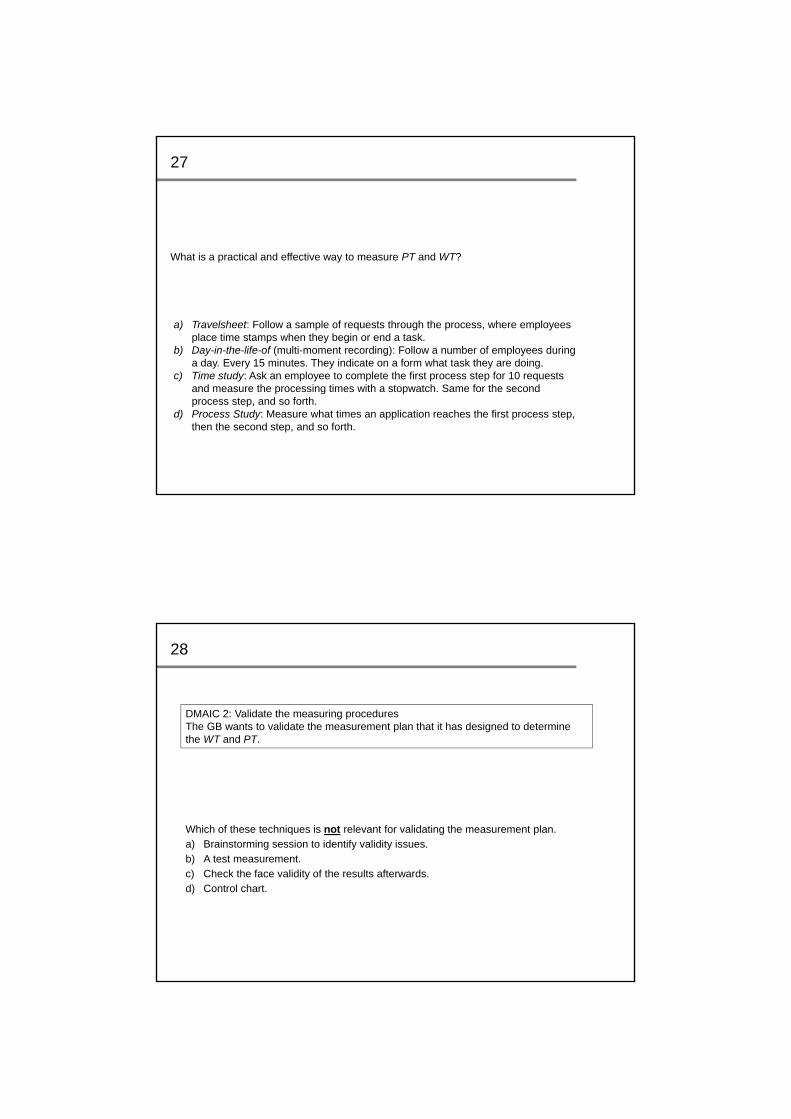
Conversion rate(=% Offers accepted by customers) Operational cost
Man-hours per applicationLead time(LT)
Processing time (PT)Of process steps
Waiting time(WT)between process steps
Is the above CTQ flowdown acceptable?a) Yes, the flowdown is acceptable.
b) No, waiting time (WT) should not be connected to man-hours per application.
c) No, processing time (PT) should not be connected to man-hours per application.d) No, conversion rate should be replaced by quality and efficiency.
26
What is a practical and effective way to measure PT and WT?
a) Travelsheet: Follow a sample of requests through the process, where employees place time stamps when they begin or end a task.
b) Day-in-the-life-of (multi-moment recording): Follow a number of employees duringa day. Every 15 minutes. They indicate on a form what task they are doing.
c) Time study: Ask an employee to complete the first process step for 10 requestsand measure the processing times with a stopwatch. Same for the second process step, and so forth.
d) Process Study: Measure what times an application reaches the first process step, then the second step, and so forth.
27
Which of these techniques is not relevant for validating the measurement plan.a) Brainstorming session to identify validity issues.
b) A test measurement.
c) Check the face validity of the results afterwards.d) Control chart.
DMAIC 2: Validate the measuring proceduresThe GB wants to validate the measurement plan that it has designed to determinethe WT and PT.
28
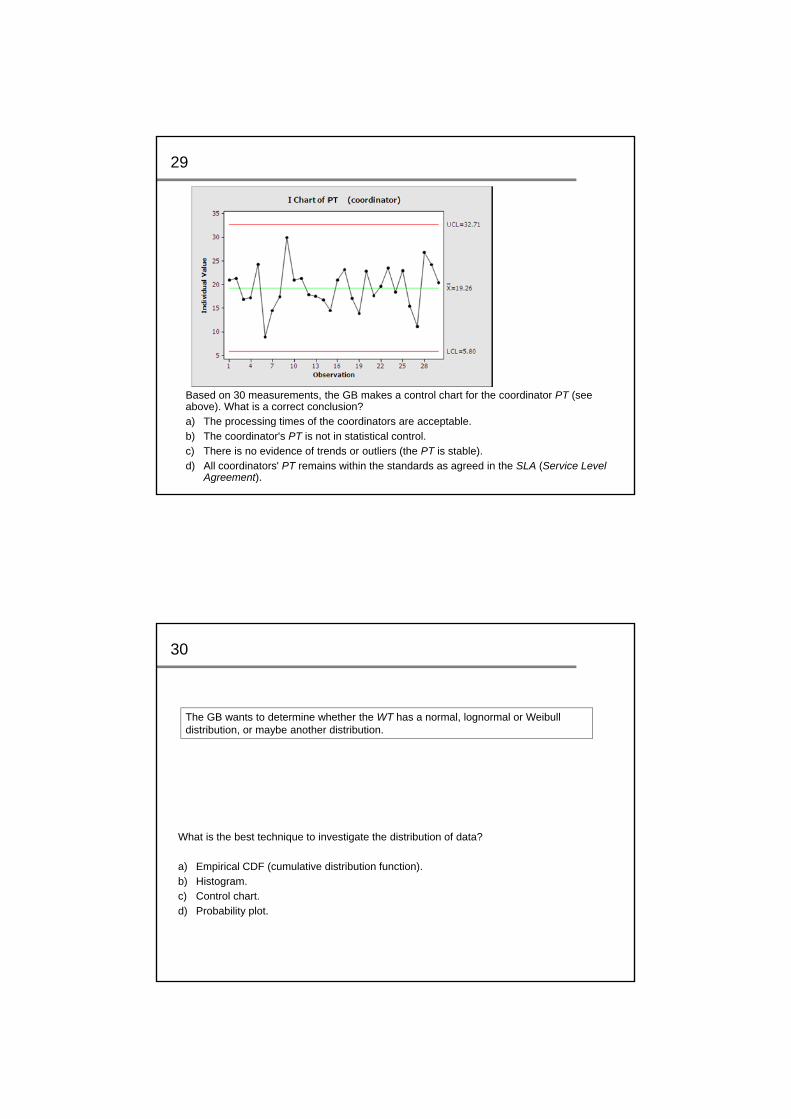
Based on 30 measurements, the GB makes a control chart for the coordinator PT (see above). What is a correct conclusion?a) The processing times of the coordinators are acceptable.
b) The coordinator's PT is not in statistical control.
c) There is no evidence of trends or outliers (the PT is stable).d) All coordinators' PT remains within the standards as agreed in the SLA (Service Level
Agreement).
29
PT
The GB wants to determine whether the WT has a normal, lognormal or Weibull distribution, or maybe another distribution.
What is the best technique to investigate the distribution of data?
a) Empirical CDF (cumulative distribution function).
b) Histogram.c) Control chart.
d) Probability plot.
30
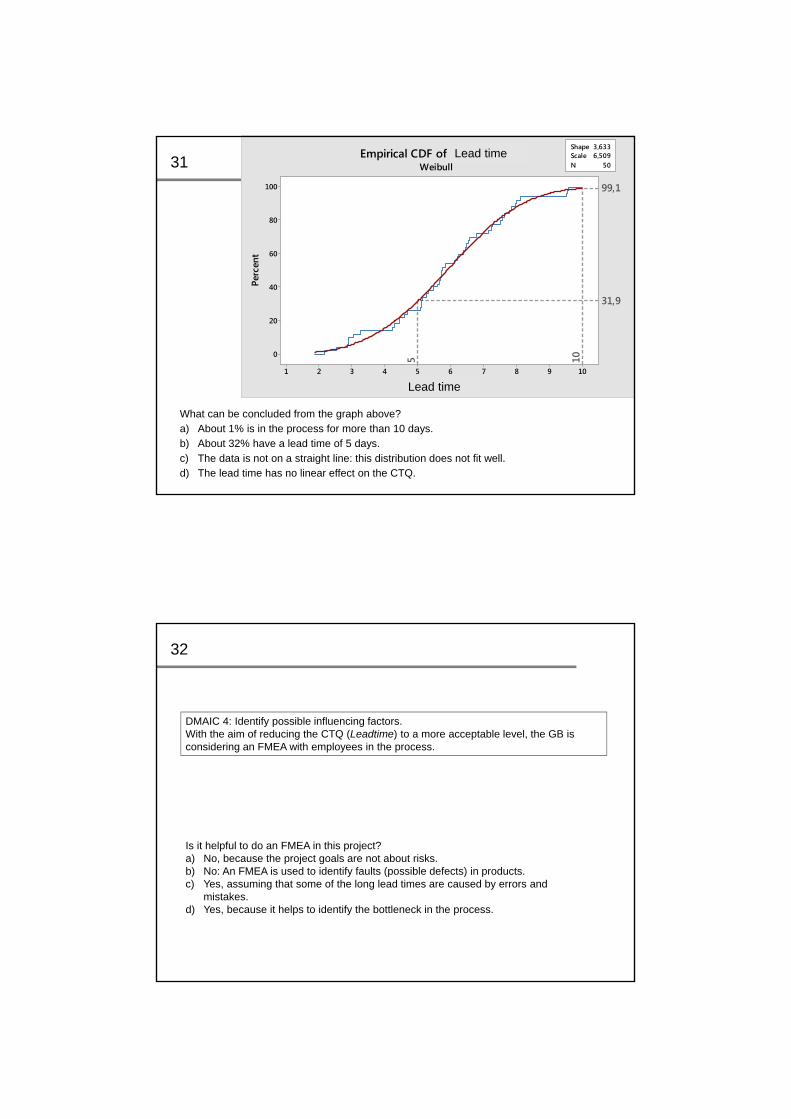
What can be concluded from the graph above?a) About 1% is in the process for more than 10 days.
b) About 32% have a lead time of 5 days.
c) The data is not on a straight line: this distribution does not fit well.d) The lead time has no linear effect on the CTQ.
31
10987654321
100
80
60
40
20
0
Shape 3,633Scale 6,509N 50
Doorlooptijd
Perc
ent
31,9
5
99,1
10
Empirical CDF of DoorlooptijdWeibull
Lead time
Lead time
DMAIC 4: Identify possible influencing factors.With the aim of reducing the CTQ (Leadtime) to a more acceptable level, the GB is considering an FMEA with employees in the process.
Is it helpful to do an FMEA in this project?a) No, because the project goals are not about risks.b) No: An FMEA is used to identify faults (possible defects) in products.c) Yes, assuming that some of the long lead times are caused by errors and
mistakes.d) Yes, because it helps to identify the bottleneck in the process.
32
DMAIC 4: Identify possible influencing factors.The GB organizes a brainstorm session with the employees from the process. The purpose of the meeting is to identify causes of long lead times and to think of possible solutions.
What is the main role of the employees in this brainstorming session?a) The employees vote on the value of improvement ideas, and the ideas with the most
votes are implemented.
b) Employees suggest a large number of potential causes and solutions.
c) Employees judge whether the influence factors indicated by the GB are correct.d) The employees are discussing some promising solutions.
33
How are the processing times (PT) per process step determined in the Value Stream Map?a) As the average of the measurements.
b) As the median of the measurements.
c) As the average of the measurements plus twice the standard deviation.d) As the maximum of measurements.
Based on the measurements, the GB creates a Value Stream Map (next slide).
34
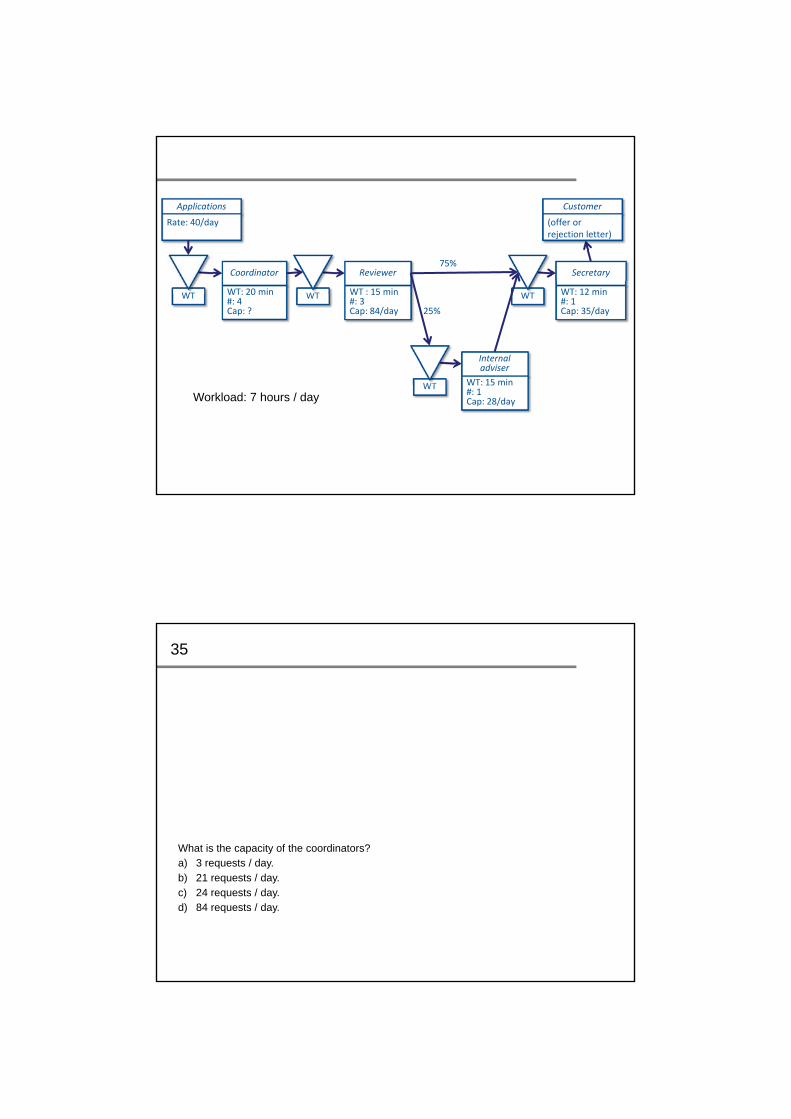
Coordinator
WT: 20 min#: 4Cap: ?
WT
Applications
Rate: 40/day
Reviewer
WT : 15 min#: 3Cap: 84/day
WT
Internal adviser
WT: 15 min#: 1Cap: 28/day
WT
Secretary
WT: 12 min#: 1Cap: 35/day
WT
Customer
(offer or rejection letter)
Workload: 7 hours / day
75%
25%
What is the capacity of the coordinators?a) 3 requests / day.
b) 21 requests / day.
c) 24 requests / day.d) 84 requests / day.
35
What process step has undercapacity?a) None of the process steps have undercapacity.
b) The internal advisory process step.
c) The secretary's process step.d) Both the internal adviser's step and the secretary's step.
36
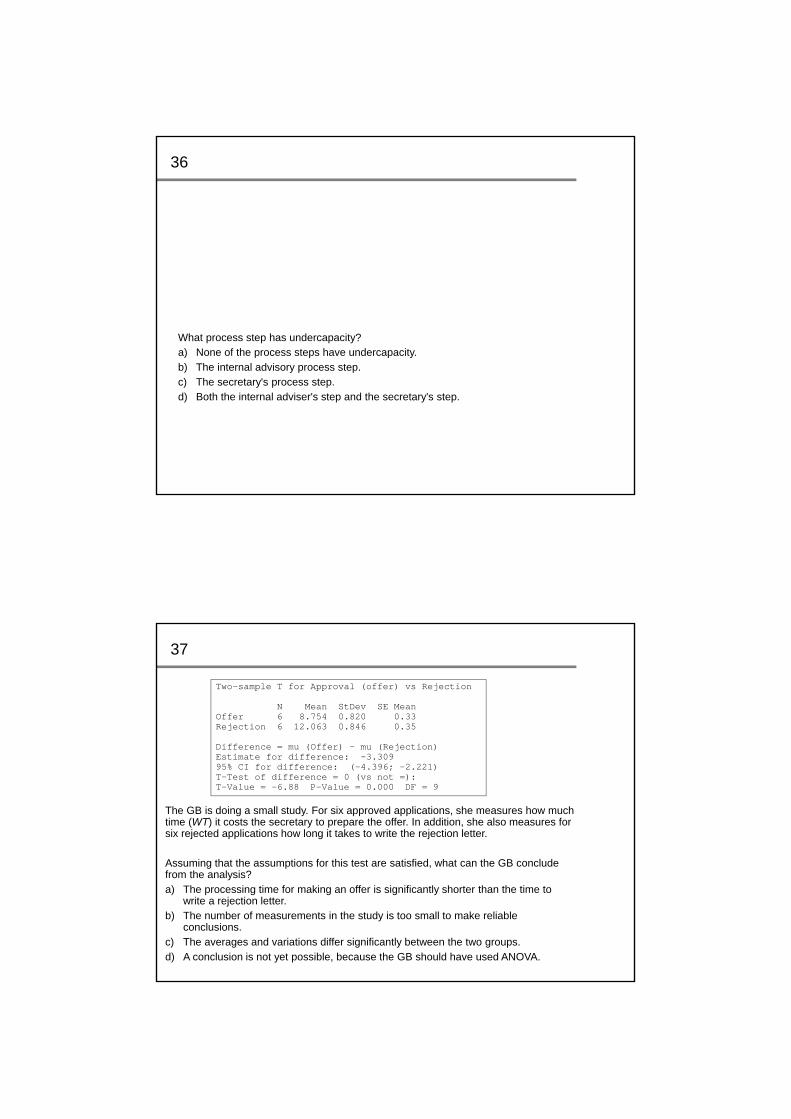
Two-sample T for Approval (offer) vs Rejection
N Mean StDev SE MeanOffer 6 8.754 0.820 0.33Rejection 6 12.063 0.846 0.35
Difference = mu (Offer) - mu (Rejection)Estimate for difference: -3.30995% CI for difference: (-4.396; -2.221)T-Test of difference = 0 (vs not =):T-Value = -6.88 P-Value = 0.000 DF = 9
The GB is doing a small study. For six approved applications, she measures how much time (WT) it costs the secretary to prepare the offer. In addition, she also measures for six rejected applications how long it takes to write the rejection letter.
Assuming that the assumptions for this test are satisfied, what can the GB conclude from the analysis?
a) The processing time for making an offer is significantly shorter than the time to write a rejection letter.
b) The number of measurements in the study is too small to make reliable conclusions.
c) The averages and variations differ significantly between the two groups.
d) A conclusion is not yet possible, because the GB should have used ANOVA.
37

Is this a good fit?a) Yes, there is no evidence of a bad fit.
b) No, there are too many points off the regression (fitted) line.
c) No, the relationship is not significant.d) No, there are outliers to be removed from the data.
The GB wants to determine the relationship between the waiting time WT in the queue for the coordinators, and the workload WL (the number of applications submitted per day). On 21 different days, she registers the number of applications submitted. In addition, she keeps track of how long a randomly chosen application stays in the queue for the coordinator.See the regression analysis on the next slide.
38
Regression Analysis: WT versus WL
The regression equation isWT (hours) = - 10.35 + 0.2392 WL (requests)
S = 0.481152 R-Sq = 96.5% R-Sq(adj) = 96.3%
Analysis of Variance
Source DF SS MS F PRegression 1 121.771 121.771 525.99 0.000Error 19 4.399 0.232Total 20 126.170
WL (requests)
WT
(ho
urs)
Is the workload (WL) an important influence factor for the waiting time (WT) for the coordinators?
a) Yes, the small p-value indicates that this is an important influence factor.b) Yes, the high R2 indicates that this is an important influence factor.c) No, the small p value indicates that this is not an important influence factor.d) No, the high R2 indicates that most of the variation can not be explained by this
influence factor.
39
Suppose the workload is equal to 60 requests per day, that is, WL = 60. What can you say about the waiting time WT (in hours) in the queue for the coordinator?
a) In that case, 95% of all requests will be less than 4 hours in the queue for the coordinators.
b) Then the WT is up to 4 hours.c) Then the WT is on average of 4 hours.d) Then the WT is exactly 4 hours.
40
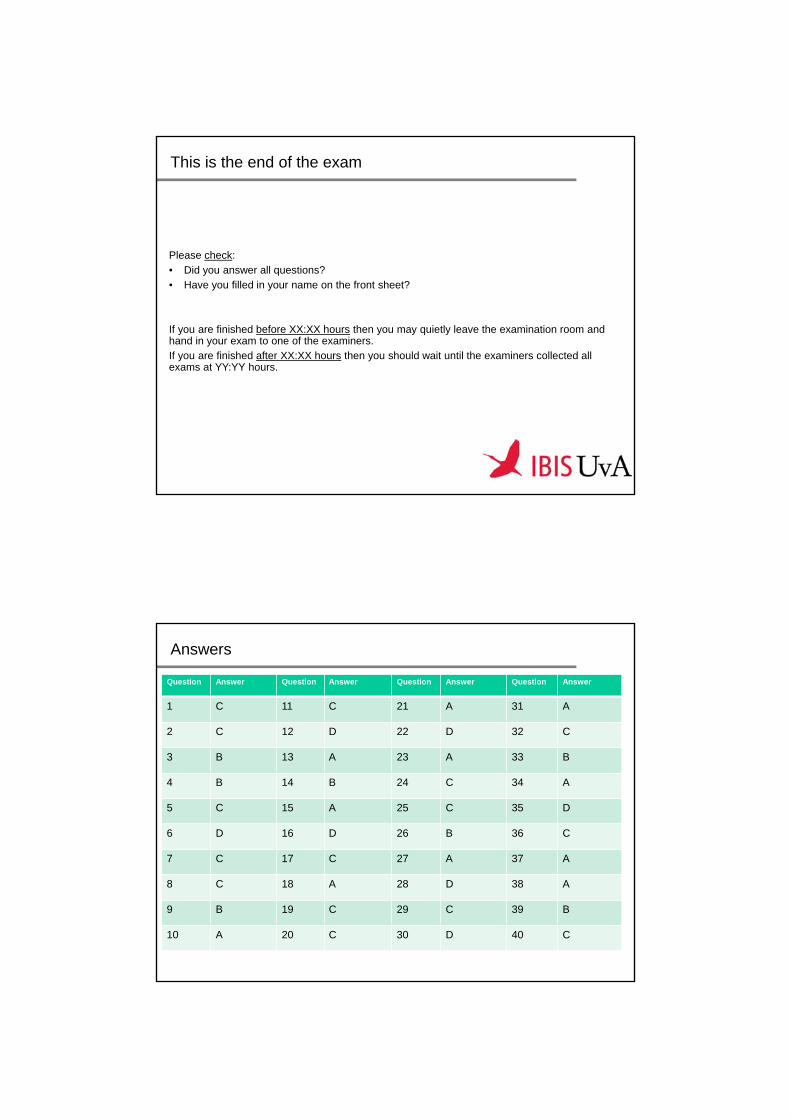
Please check:
• Did you answer all questions?
• Have you filled in your name on the front sheet?
If you are finished before XX:XX hours then you may quietly leave the examination room and hand in your exam to one of the examiners.If you are finished after XX:XX hours then you should wait until the examiners collected all exams at YY:YY hours.
This is the end of the exam
Question Answer Question Answer Question Answer Question Answer
1 C 11 C 21 A 31 A
2 C 12 D 22 D 32 C
3 B 13 A 23 A 33 B
4 B 14 B 24 C 34 A
5 C 15 A 25 C 35 D
6 D 16 D 26 B 36 C
7 C 17 C 27 A 37 A
8 C 18 A 28 D 38 A
9 B 19 C 29 C 39 B
10 A 20 C 30 D 40 C
Answers
Related Documents