1/28/2010 1 Lean Means Speed Alessandro Anzalone, Ph.D Hillsborough Community College, Brandon Campus 1. Is This Lean? 2. The Essentials of Lean 3. The Lean Metric: Cycle Efficiency 4. Velocity of Any Process 5. Knowing Where to Focus: The 80/20 Rule 6. Using a Value Stream Map to Find the 20% Waste 7. The Major Lean Improvement Tools 8. The Lean Enterprise 9. The Laws of Lean Six Sigma 10 References 10. References

Welcome message from author
This document is posted to help you gain knowledge. Please leave a comment to let me know what you think about it! Share it to your friends and learn new things together.
Transcript
1/28/2010
1
Lean Means Speed
Alessandro Anzalone, Ph.D
Hillsborough Community College, Brandon Campus
1. Is This Lean?2. The Essentials of Lean3. The Lean Metric: Cycle Efficiency4. Velocity of Any Process5. Knowing Where to Focus: The 80/20 Rule6. Using a Value Stream Map to Find the 20% Waste7. The Major Lean Improvement Tools8. The Lean Enterprise9. The Laws of Lean Six Sigma10 References10. References

1/28/2010
2
“O di il t i t i t i th ht f li “Ordinarily, money put into inventory is thought of as live money, ... but it is waste—which, like every other form of waste, turns up in high prices. We do not own or use a single warehouse! Time waste differs from material waste in that there can be no salvage.” Henry Ford (1863-1947)

1/28/2010
3
Robert Martichenko of Transfreight, an expert in Lean logistics, likes to explain Lean by describing an idealized plant tour inspired by actual experience. He “tours” a small company where they believe they are practicing Lean manufacturing This company has one of the simplest practicing Lean manufacturing. This company has one of the simplest product lines imaginable: they make widgets in two colors, red and green. While he is there, he notices they are making green widgets all day long. (When they don’t have to change the paint line, they can make 400 green widgets per day.)
In the middle of the day, the Logistics Manager, John, tells Robert, “Watch this ... Lean at its best!” At that moment, the manufacturing line is on its last box of green widget handles. Wouldn’t you know it? A truck shows up with a full load of green widget handles and the day is saved because up with a full load of green widget handles and the day is saved because of the Lean system in place. John is very proud that the truck showed up “just in time.” After the day is over, Robert sits down and asks John a few basic questions:
1. How many customer orders do you have confirmed for green widgets?2. Why are you manufacturing only green widgets today?3. On Tuesdays, do customers use only green widgets?4 Why did you order a whole truckload of green widget handles?4. Why did you order a whole truckload of green widget handles?5. Why will you still be making green widgets tomorrow when more than
half of today’s production is still in inventory?
John tells Robert that they had orders on the books for only 200 green widgets, but they make green ones all day because of the manufacturing economies of scale. As for the truckload of green widget handles, well, the supplier gives such great volume discounts that John buys in truckload quantity. “But,” John said, “the truck never shows up until we truckload quantity. But, John said, the truck never shows up until we are just running out.” (John didn’t mention that a truckload of widget handles would last for two months!)

1/28/2010
4
The truth is that Lean is not just a raw material procurement strategy, but rather a process philosophy, with three purposes:
To eliminate wasted time effort and material To eliminate wasted time, effort, and material. To provide customers with make-to-order products. To reduce cost while improving quality.
As in most factories, the material in the widget line spent more than 95% of its time waiting ... waiting for value to be added ... or waiting in finished goods inventory for a customer. In contrast, the goal of Lean is to virtually eliminate wait time Instead every operation becomes so virtually eliminate wait time. Instead, every operation becomes so flexible that the actual usage by the customer creates a demand on the factory to build only the amount consumed by the customer, whether external or internal. The Lean factory is flexible enough to efficiently build in small batches to keep up with consumption. When this goal is achieved, parts will move directly from one workstation to another at high velocity and reduce the waiting time, work in process, and finished goods inventory by 50%-80%.
As velocity increases, the cost of stockrooms, material movers and As velocity increases, the cost of stockrooms, material movers and equipment, expeditors, scrap, rework, obsolescence, excess capital expenditures—the Hidden Factory—will be removed. As a rule of thumb, if the waiting time is reduced by 80%, the manufacturing overhead and quality cost will drop by 20%.
1/28/2010
5
The Keys to the Kingdom of Lean are founded on two principles that are observed in every factory or process we have ever encountered:
Material usually spends 95% of its time waiting which is due to the time Material usually spends 95% of its time waiting, which is due to the time delay injected by fewer than 20% of the workstations, which are known as time traps.
Time traps can be prioritized using MRP data and the spreadsheet calculations or software and eliminated using Lean Six Sigma improvement methods.
Identifying and prioritizing time traps—at the most basic level, that’s all you need to know about Lean! The basic principles and improvement need to know about Lean! The basic principles and improvement opportunities apply to any process, not just manufacturing, and together they create a Lean enterprise.
Since speed is a key goal of Lean, the natural questions are “How fast is fast?” and “How slow is slow?”
The answer comes by comparing the amount of value added time (work that The answer comes by comparing the amount of value-added time (work that a customer would recognize as necessary to create the product or service) and the total lead time (how long the process takes from start to end). If the value-added time needed to manufacture a product down the critical path is 100 hours of touch labor (including machining, assembly, testing, etc.), to be world-class the total lead time should not exceed 400 hours. These two figures come together to produce a metric called process cycle efficiency that we can use to gauge the potential for cost reduction:cost reduction:
Process Cycle Efficiency = Value-Added Time / Total Lead Time
1/28/2010
6
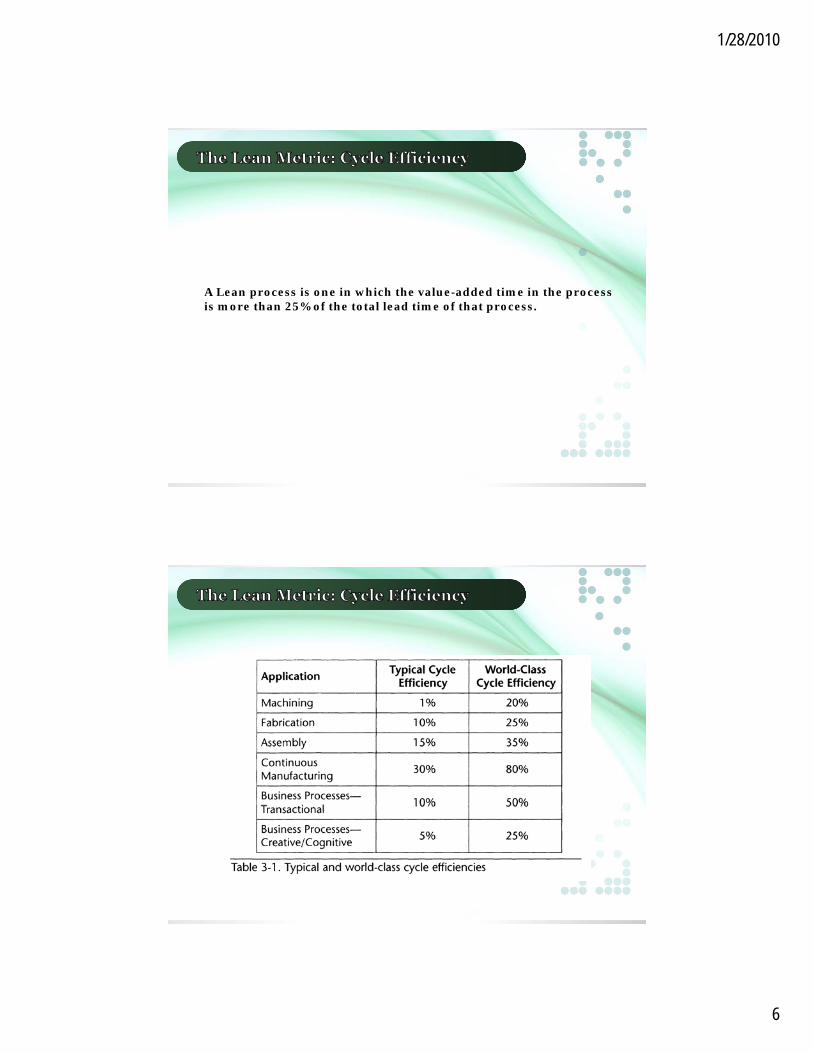
A Lean process is one in which the value-added time in the processis more than 25% of the total lead time of that process.
1/28/2010
7
Where Do the Cost Reductions Come From?The slowness of most processes—their low cycle efficiency—guarantees that
there is a large amount of work in process (or projects in process) at any given time either on the plant floor or finished goods in stock rooms given time, either on the plant floor or finished goods in stock rooms. Much of the plant space is tied up with idle inventory, idle machines, stockrooms, rework labor, quality control, expeditors, schedulers, and related non-value-added activities. In other words, WIP generates hidden costs in overhead, rework, scrap, manufacturing overhead, invested capital, and happy customers ... and in consequence puts a company in constant jeopardy of losing existing business as well as revenue growth.
When process cycle efficiencies rise above 20%, much of these non-value-When process cycle efficiencies rise above 20%, much of these non valueadded activities can be eliminated. As a side benefit, the personnel associated with non-value-added work are often some of the most talented in the company, and sometimes the only people who really understand the whole process because they have had to cope with it. Thus, redeploying them into value-added assignments in manufacturing, engineering, marketing, or the Lean Six Sigma process allows them to be in a value creation role.
Sources of Cost ReductionLet’s again review the components of the Hidden Factory that can be
eliminated through the application of Lean methods. The reduction of cost is not just from reduced scrap and rework or from having less cost is not just from reduced scrap and rework or from having less money tied up in inventory. Shorter lead time and smaller inventory have a host of benefits that can be estimated in advance and tabulated:
Shorter lead time, which can increase revenue growth dramatically. Less handling, which reduces the demand for people and equipment. Less cost for storage, floor, and stock room space. Fewer customer service activities.
1/28/2010
8
Sources of Cost ReductionWhen your inventory is small, you also avoid all the problems associated with
large WIP, such as the following:
Parts shortages caused by inflexible workstations. The need for extra operators, expeditors, supervision, and overtime. Shipping a disproportionate percentage of product at the end of the
month though you have to pay for this peak capacity of property, plant, and equipment (PP&E), inspection, test, and overhead cost all month long.
The increased likelihood that defects will be shipped to customers (who have been kept waiting for their parts), necessitating expensive field have been kept waiting for their parts), necessitating expensive field repair and loss of subsequent sales.
Speed Applies to All Processes
There is as much or more improvement opportunity in business processes to improve speed flexibility and/or responsiveness and reduce cost The improve speed, flexibility and/or responsiveness and reduce cost. The point is that, in successful implementations of Lean, the manufacturing process could not have been improved if the non-manufacturing processes had not been leaned out.
Lean does not mean manufacturing. Lean means speed.
1/28/2010
9
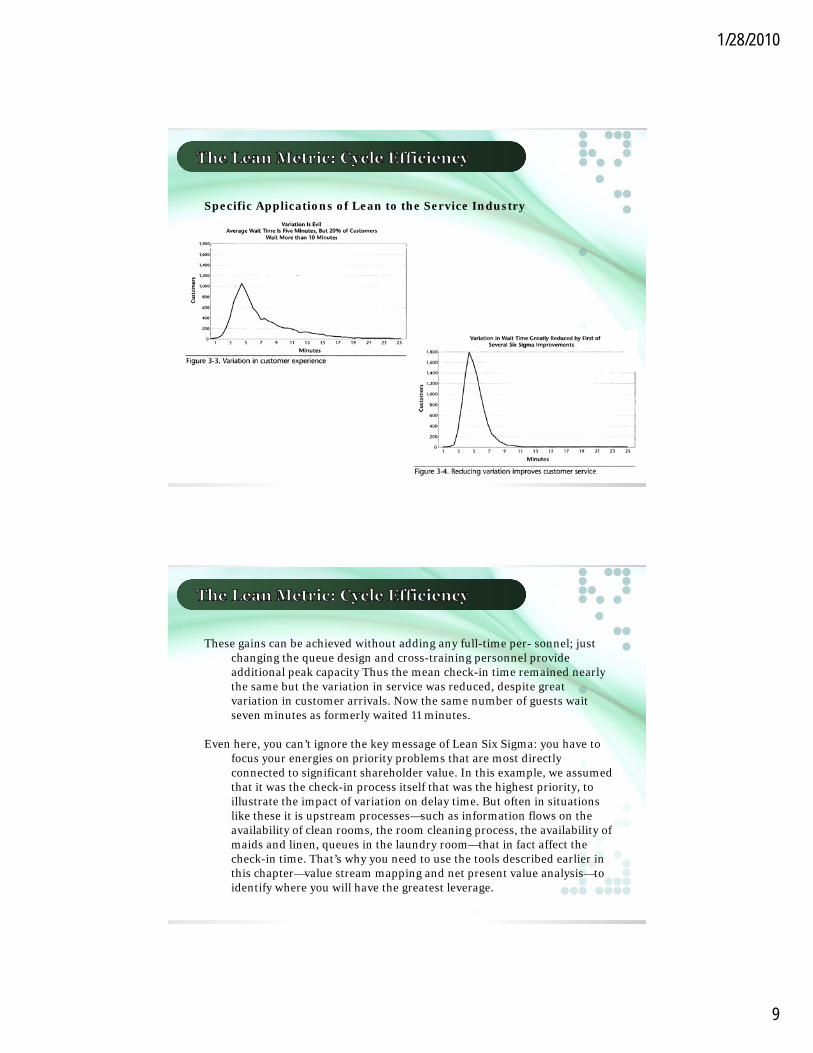
Specific Applications of Lean to the Service Industry
These gains can be achieved without adding any full-time per- sonnel; just changing the queue design and cross-training personnel provide additional peak capacity Thus the mean check-in time remained nearly the same but the variation in service was reduced despite great the same but the variation in service was reduced, despite great variation in customer arrivals. Now the same number of guests wait seven minutes as formerly waited 11 minutes.
Even here, you can’t ignore the key message of Lean Six Sigma: you have to focus your energies on priority problems that are most directly connected to significant shareholder value. In this example, we assumed that it was the check-in process itself that was the highest priority, to illustrate the impact of variation on delay time. But often in situations illustrate the impact of variation on delay time. But often in situations like these it is upstream processes—such as information flows on the availability of clean rooms, the room cleaning process, the availability of maids and linen, queues in the laundry room—that in fact affect the check-in time. That’s why you need to use the tools described earlier in this chapter—value stream mapping and net present value analysis—to identify where you will have the greatest leverage.
1/28/2010
10
This hotel check-in example shows how variation in arrivals and processing time intrinsically causes delay, even in a process much simpler than most manufacturing processes. The work was done at a single “workstation” (the clerk) It had no setup time no scrap no downworkstation (the clerk). It had no setup time, no scrap, no down-time—each of which creates delay and is a source of variation. There, it was absolutely clear where the delay occurred, why it caused the time trap, and where the company needed to apply DMAIC improvement activities to reduce variation. The obvious question is whether these same principles apply to processes that are more complex—and whether you find time traps by intuition or by looking at the plant, as some claim they can?
Where Are Your Manufacturing Time Traps?
1/28/2010
11
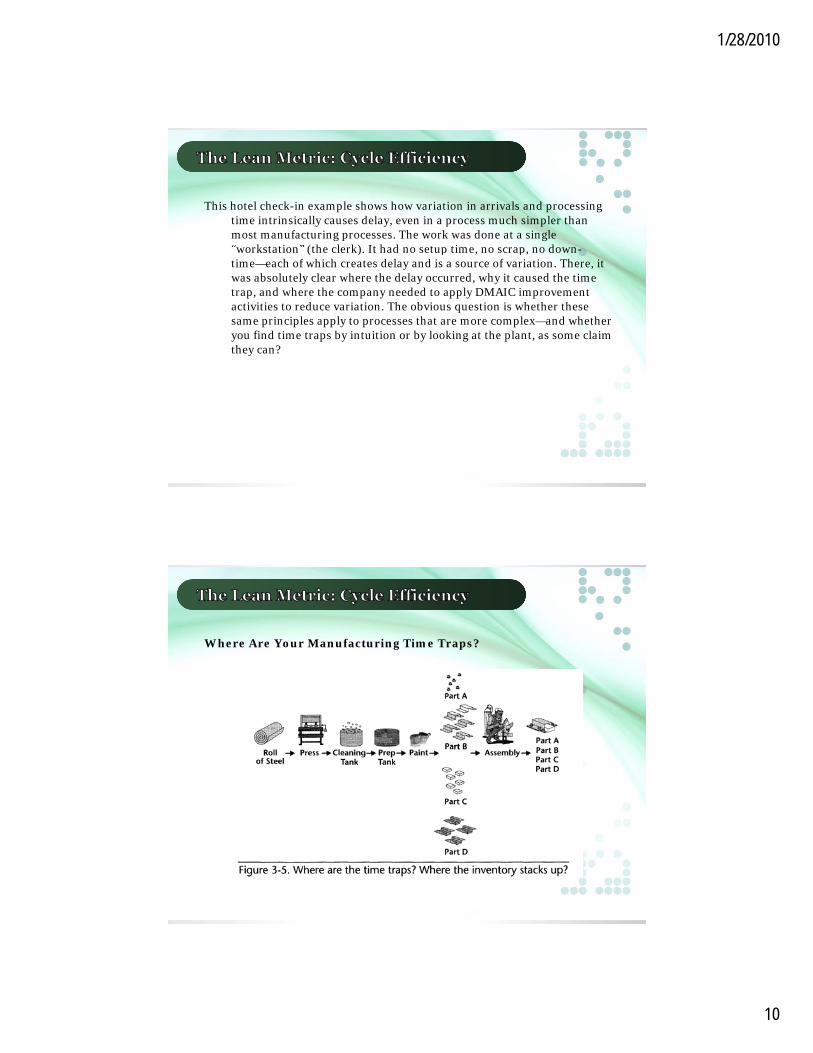
Where Are Your Manufacturing Time Traps?
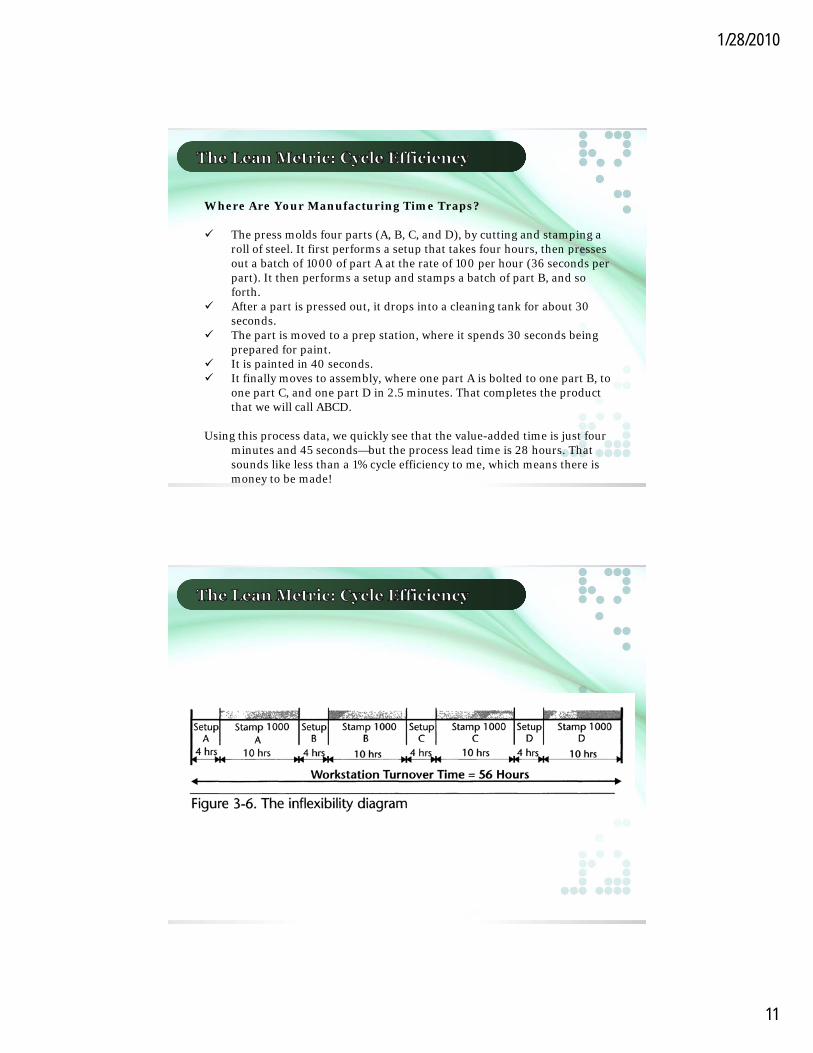
The press molds four parts (A, B, C, and D), by cutting and stamping a roll of steel It first performs a setup that takes four hours then presses roll of steel. It first performs a setup that takes four hours, then presses out a batch of 1000 of part A at the rate of 100 per hour (36 seconds per part). It then performs a setup and stamps a batch of part B, and so forth.
After a part is pressed out, it drops into a cleaning tank for about 30 seconds.
The part is moved to a prep station, where it spends 30 seconds being prepared for paint.
It is painted in 40 seconds.It is painted in 40 seconds. It finally moves to assembly, where one part A is bolted to one part B, to
one part C, and one part D in 2.5 minutes. That completes the product that we will call ABCD.
Using this process data, we quickly see that the value-added time is just four minutes and 45 seconds—but the process lead time is 28 hours. That sounds like less than a 1% cycle efficiency to me, which means there is money to be made!
1/28/2010
12
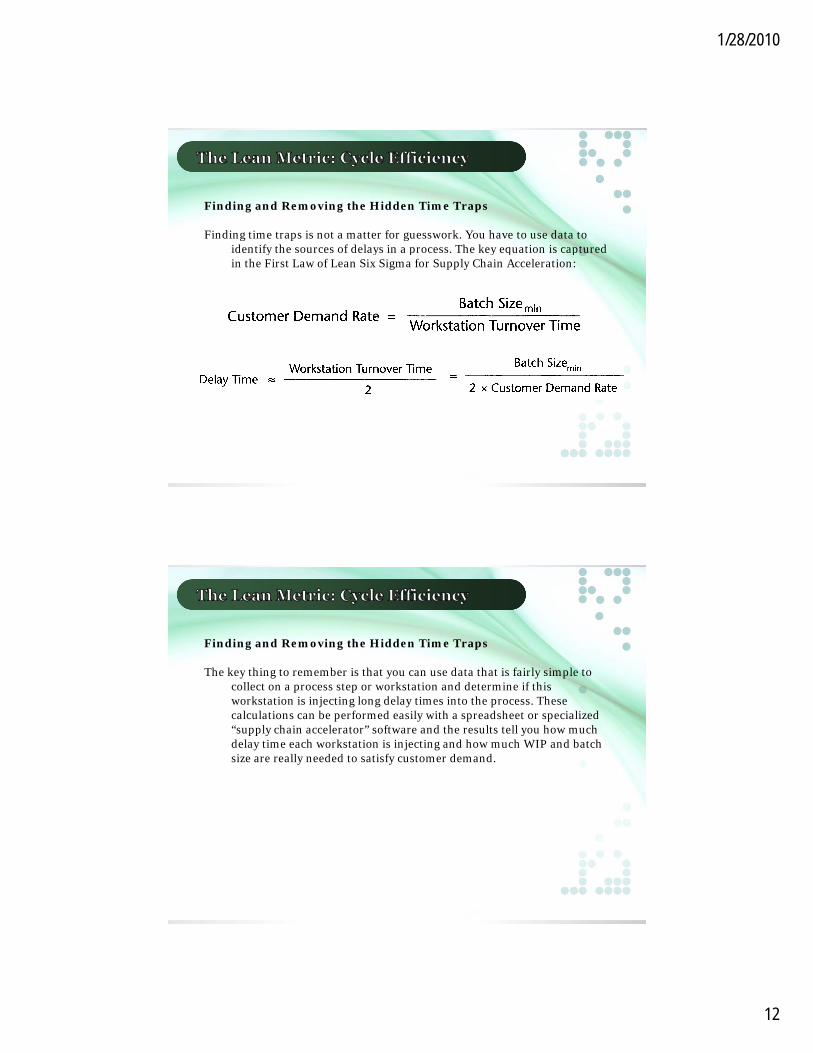
Finding and Removing the Hidden Time Traps
Finding time traps is not a matter for guesswork. You have to use data to identify the sources of delays in a process The key equation is captured identify the sources of delays in a process. The key equation is captured in the First Law of Lean Six Sigma for Supply Chain Acceleration:
Finding and Removing the Hidden Time Traps
The key thing to remember is that you can use data that is fairly simple to collect on a process step or workstation and determine if this collect on a process step or workstation and determine if this workstation is injecting long delay times into the process. These calculations can be performed easily with a spreadsheet or specialized “supply chain accelerator” software and the results tell you how much delay time each workstation is injecting and how much WIP and batch size are really needed to satisfy customer demand.

1/28/2010
13
Conclusion: The cause of delay in a process is a time trap. You can’t just look for where material piles up; rather, you must calculate how much time each workstation injects into a process using the First Law of Lean Six SigmaSix Sigma.
Crucial Insight: Batch sizes must be calculated from process variables and the total number of parts produced at a given workstation.
1/28/2010
14
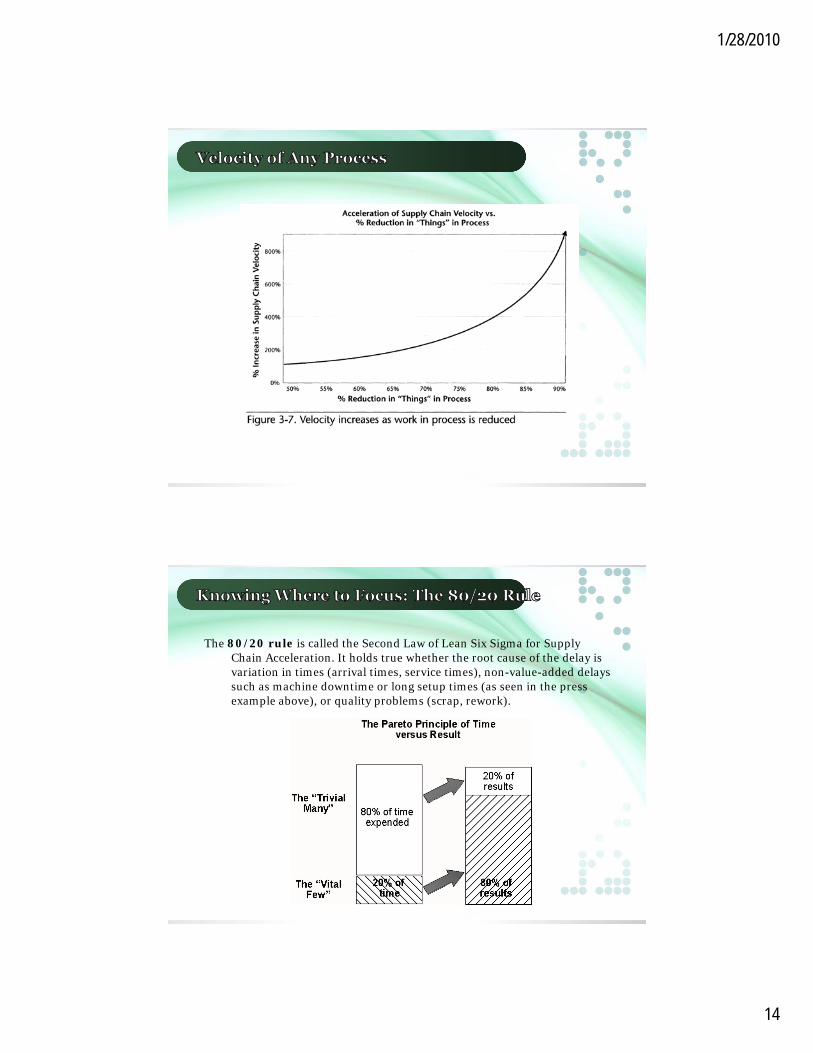
The 80/20 rule is called the Second Law of Lean Six Sigma for Supply Chain Acceleration. It holds true whether the root cause of the delay is variation in times (arrival times, service times), non-value-added delays such as machine downtime or long setup times (as seen in the press such as machine downtime or long setup times (as seen in the press example above), or quality problems (scrap, rework).
1/28/2010
15
In a Lean system, focus begins with a value stream map, which depicts all the process steps (including rework) associated with turning a customer need into a delivered product or service and indicates how much value each of the steps adds to the product Any activity that creates a form each of the steps adds to the product. Any activity that creates a form, feature, or function of value to the customer is termed value-added; those that don’t are called non-value-added.
Value stream mapping provides a clear understanding of the current process by:
Visualizing multiple process levels. Highlighting waste and its sources.Highlighting waste and its sources. Making “hidden” decision points apparent.
The key insight is that a majority of non-value-added costs are in fact currently required to move the product through the “molasses” flow. You can’t remove these costs until you remove the underlying causes; trying to do so will just create greater costs in the long run.
Creating a Value Stream Map
A value stream map starts with a pencil-and-paper sketch of the process to understand the flow of material and information needed to produce a understand the flow of material and information needed to produce a product or service. (This sketch can be supplemented with many flowcharting software tools.) The diagram visually presents the flow of a product from customer to supplier and presents both the current-state map and future-state vision.
Value stream mapping typically classifies each activity/task type by asking a series of questions:
Customer Value-Added (CVA) Questions Business Value-Added (BVA) Questions Non-Value-Added (NVA) Questions

1/28/2010
16
Customer Value-Added (CVA) Questions:
Does the task add a form or feature to the product or service? Does the task enable a competitive advantage (reduced price faster Does the task enable a competitive advantage (reduced price, faster
delivery, fewer defects)? Would the customer be willing to pay extra or prefer us over the
competition if he or she knew we were doing this task?
Business Value-Added (BVA) Questions:
Is this task required by law or regulation? Does this task reduce the financial risk of the owner(s)? Does this task reduce the financial risk of the owner(s)? Does this task support financial reporting requirements? Would the process break down if this task were removed?
1/28/2010
17
Non-Value-Added (NVA) Questions:
Does the task include any of the following activities: counting, handling, inspecting transporting moving delaying storing all rework loops inspecting, transporting, moving, delaying, storing, all rework loops, expediting, multiple signatures?
Taking a global view of the supply chain, having made these improvements, to how many factories do we really need to deliver projected volume? Will the faster lead time and lower costs fill up existing facilities?
With faster lead times, how many distribution centers can be eliminated? (Experience shows that when three facilities are consolidated to two, you save half an overhead, about 17% of total consolidated to two, you save half an overhead, about 17% of total overhead cost. This captures the operational value of higher cycle efficiency, but not the elimination of the cost of poor quality.)
Here is an overview of the creation of a value stream map:1. Select a value stream (product family, etc.) whose improvement will
create the greatest impact on operating profit.2 Create a process map or download the MRP router information on that 2. Create a process map or download the MRP router information on that
value stream. Because MRP routers generally have good data only on value-added steps, but not on the other 95% of the time used, you will initially start with a value stream that looks pretty clean.
3. Have the black belt and his or her team “walk the process” to find out what really happens in the process and identify both value-added and non-value-added work, such as rework loops, quality inspections, moves in and out of stock (i.e., time that does not appear in MRP), and information flows. Most teams will be surprised to find more non-value-information flows. Most teams will be surprised to find more non valueadded steps in the process than value-added.
4. The team does a sanity check on MRP data, such as setup times, etc., by verifying the numbers with operators.

1/28/2010
18
5. Input the data into a spreadsheet or supply chain acceleration software. The time traps are then sorted on a spreadsheet or displayed in a bar graph.
6 The spreadsheet or software calculates delay time at each time trap and 6. The spreadsheet or software calculates delay time at each time trap and recommends application of Lean Six Sigma tools. The black belt can input how much improvement can be effected and the spreadsheet or software will recalculate the delay time.
7. Implement the improvement activities to address the time traps in priority order.
This process only works if the black belt and his or her team are trained to define and solve these problems:
What are the non value added steps ( rework move count etc ) that What are the non-value-added steps ( rework, move, count, etc.) that can be eliminated?
What are the time traps in priority order? What improvement methods are required at each time trap How much improvement is needed? What is the smaller batch size that can now be run? What is the shorter delay time at both the workstation and the whole
process?

1/28/2010
19
1/28/2010
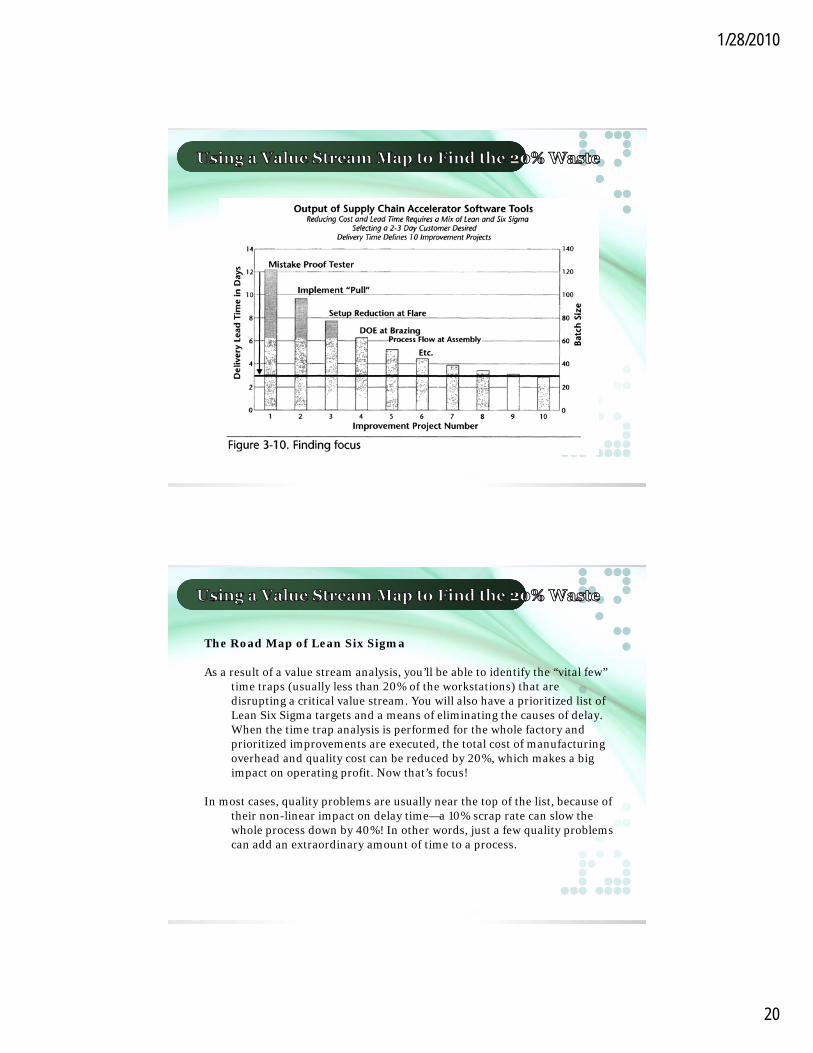
20
The Road Map of Lean Six Sigma
As a result of a value stream analysis, you’ll be able to identify the “vital few” time traps (usually less than 20% of the workstations) that are time traps (usually less than 20% of the workstations) that are disrupting a critical value stream. You will also have a prioritized list of Lean Six Sigma targets and a means of eliminating the causes of delay. When the time trap analysis is performed for the whole factory and prioritized improvements are executed, the total cost of manufacturing overhead and quality cost can be reduced by 20%, which makes a big impact on operating profit. Now that’s focus!
In most cases, quality problems are usually near the top of the list, because of In most cases, quality problems are usually near the top of the list, because of their non-linear impact on delay time—a 10% scrap rate can slow the whole process down by 40%! In other words, just a few quality problems can add an extraordinary amount of time to a process.
1/28/2010
21
Pull Systems: As discussed earlier in this chapter, process velocity and lead time are absolutely determined by the amount of the work in process. It therefore stands to reason that we must have a mechanical or electronic mechanism to keep the WIP (“things in process”) below some maximum mechanism to keep the WIP ( things in process ) below some maximum level or else the process lead time will grow uncontrollably. The Lean tool that achieves this goal is the pull system, which puts a cap on WIP and thus keeps process lead time below a maximum level. (This is sometimes called the Kanban system, after the Japanese word for “card” or, more literally, “visible record” or “sign.” In Japan, WIP is released only when a card shows that consumption has occurred.)
Setup Reduction: The setup time is defined as the interval between the last good part of one run of part numbers and the first good part of the next part number. Setup reduction techniques can reduce setup time by 80% with little if any increased capital expenditureswith little if any increased capital expenditures.

1/28/2010
22
Total Productive Maintenance: Data from scores of factories shows that machines are typically producing product only 60% of the time. About 20% of the downtime is scheduled for lunch, breaks, and maintenance. The other 20% is unscheduled due to machine breakdown setup time The other 20% is unscheduled, due to machine breakdown, setup time, parts shortages, absenteeism, etc. Total Productive Maintenance can virtually eliminate the unscheduled downtime; management initiatives can attack scheduled downtime. When a machine is running at near capacity variation in the arrival of parts or machine processing times (similar to the hotel check-in example) can increase queue times by 10 to 20 times.

1/28/2010
23
It’s difficult to overstate the opportunities represented by the slow processes found in nearly every organization. The problem that most firms have is in implementation. They perform training and conduct some isolated improvement efforts but in the end make little measurable impact on improvement efforts, but in the end make little measurable impact on overall lead time or cost.
Lean Six Sigma provides an unambiguous roadmap to implementation by prioritizing time traps and applying improvement methods, in that order. Eliminating the causes of wasted time allows a process to improve cost, quality, and responsiveness—characteristics that are critical to customers and shareholders. In most organizations, this can contribute 5% of revenue to operating margins. The speed and responsiveness of Lean can allow a company to increase revenue growth responsiveness of Lean can allow a company to increase revenue growth beyond its slower competitors. Finally, Lean methods apply to virtually all processes, from product development to order fulfillment. The increasing process speeds of Lean also enhance the power of Six Sigma tools such as Design of Experiments. But Lean alone, just like Six Sigma alone, isn’t the complete answer. The next chapter will show how to bring Lean and Six Sigma together to create a powerful engine for value creation.
Lean means speed; it applies to all processes. Slow processes are expensive processes. The Lean metric is process cycle efficiency Batch sizes must be calculated using flow variables Batch sizes must be calculated using flow variables. 95% of the lead times in most processes is wait time. To improve speed, you need to identify and eliminate the biggest time
traps, which is possible using the Three Laws of Lean Six Sigma: Zeroeth Law: The Law of the Market. Customer critical-to-quality
issues must be addressed first. First Law: The Law of Flexibility. Process velocity is directly
proportional to flexibility For example, in a manufacturing process, flexibility is proportional to workstation turnover time. Maximum flexibility is proportional to workstation turnover time. Maximum flexibility is achieved by launching minimum batch sizes .
Second Law: The Law of Focus. 80% of the delay in any process is caused by 20% of the activities.
Third Law: The Law of Velocity. The average velocity of flow through any process is inversely proportional to both the number of “things” in process and the average variation in supply and demand.

1/28/2010
24
1. Michael George, Lean Six Sigma : Combining Six Sigma Quality with Lean Production Speed, McGraw-Hill, first edition , 2002, ISBN-13: 978-0130176158.
2. Salman Taghizadegan, Essentials of Lean Six Sigma, Elsevier Inc., first edition, 2006, ISBN: 978-0-12-370502-0
3. http://www.bsu.edu/web/emnoe/jb civil ford 1 e.jpg3. ttp:// .bsu.edu/ eb/e oe/jb_c _ o d_ _e.jpg4. http://roadmatics.files.wordpress.com/2009/04/1912-ford-model-t-2-lg.jpg5. http://dailyplanit.files.wordpress.com/2009/03/pareto2chart1.jpg
Related Documents


