Volume 3, Issue 3, March– 2018 International Journal of Innovative Science and Research Technology ISSN No:-2456-2165 IJISRT18MA514 www.ijisrt.com 702 “Lean Manufacturing” Dissertation Submitted in Partial Fulfillment of the Requirement for the Award of the Degree of Master of Technology (Mechanical Engineering) Submitted By: Ajay MTM/16/02 Department of Mechanical Engineering N.C. College of Engineering, Israna- 132107 ( Panipat) Kurukshetra, India MAY 2018

Welcome message from author
This document is posted to help you gain knowledge. Please leave a comment to let me know what you think about it! Share it to your friends and learn new things together.
Transcript
Volume 3, Issue 3, March– 2018 International Journal of Innovative Science and Research Technology
ISSN No:-2456-2165
IJISRT18MA514 www.ijisrt.com 702
“Lean Manufacturing”
Dissertation
Submitted in Partial Fulfillment of the Requirement for the Award of the Degree of
Master of Technology
(Mechanical Engineering)
Submitted By: Ajay
MTM/16/02
Department of Mechanical Engineering
N.C. College of Engineering,
Israna- 132107 ( Panipat)
Kurukshetra, India
MAY 2018
Volume 3, Issue 3, March– 2018 International Journal of Innovative Science and Research Technology
ISSN No:-2456-2165
IJISRT18MA514 www.ijisrt.com 703
CERTIFICATE
This is certified that the work contained in this dissertation entitled “Study on lean manufacturing” by
AJAY(MTM/16/02) in requirement of the partial fulfilment for the award of degree of Master of Technology in
Mechanical Engineering at N.C. College of Engineering, Israna (Panipat). This work was completed under my
direct supervision.
The work embodied in this dissertation has not been submitted for the award of any degree to the best of
our knowledge.
Mr. Sandeep Malik
(Supervisor)
Volume 3, Issue 3, March– 2018 International Journal of Innovative Science and Research Technology
ISSN No:-2456-2165
IJISRT18MA514 www.ijisrt.com 704
ACKNOWLEDGMENT
I wish to express my heart-felt thanks and sincere gratitude to my supervisor Mr. Sandeep Malik
(Assistant Professor), for their inspiring guidance and constant encouragement throughout the course of this
work. I am indebted to them for their concern and sincerity, which has brought this work in completion.
I am grateful to the faculty of Mechanical Engineering Department for their kind cooperation and help
during my research programme.
I am very much thankful to my parents and husband for providing me every type of support during this
work.
Ajay
MTM/16/02
Volume 3, Issue 3, March– 2018 International Journal of Innovative Science and Research Technology
ISSN No:-2456-2165
IJISRT18MA514 www.ijisrt.com 705
ABSTRACT
Lean manufacturing or lean production, is quite simple. Basically lean means a production practice that
undertakes the expenditure of any resources for achievement of any goal rather than creation of value for the
customer for the end consumer to be wasteful and thus a target can be achieved working from the perpective or
considering the needs of consumer value is defined as process that the consumer is ready to pay for the specific
goods and services.
Here we have implemented the lean manufacturing technique in an automobile industry (wiring
harness) to reduce the waste elements of a production process. Initially, we created a current state map for the
complete process. Then the process studied showing various conditions and parameters like cycle time,
inventory etc. Then the bottlenecks were identified in the processes which were hampering the complete
production process. Time study was done to actually know the time taken to complete the process and that time
was compared with the tact time. The time of all the processes was balanced to make the process smooth. Then
a future state map was designed showing the process flow after improvements with complete parameters.
The main objective of this study is to remove the wastes from the process which is the main objective of
lean manufacturing.
Volume 3, Issue 3, March– 2018 International Journal of Innovative Science and Research Technology
ISSN No:-2456-2165
IJISRT18MA514 www.ijisrt.com 706
ACRONYMS & NOTATIONS
CVSM Current Value Stream Map
First In First Out FIFO
Future Value Stream Map FVSM
International Motor Vehicle Program IMVP
Just In Time JIT
Lean Manufacturing System LMS
Original Equipment Manufacturing OEM
Poly Vinyl Chloride PVC
Toyota Production System TPS
Value Stream Map VSM
Volume 3, Issue 3, March– 2018 International Journal of Innovative Science and Research Technology
ISSN No:-2456-2165
IJISRT18MA514 www.ijisrt.com 707
I. INTRODUCTION
A. Lean Manufacturing
The main concept Lean production is set of principles and practices that assists in the determination and
elimination of waste in various processes. The quality of the product is improved by reduction of waste, time,
cost and resources. Lean production also assists in the determination and reduction of non-value-added
activities at different stages such as design and production (APICS Dictionary, 12th Edition).
Lean manufacturing is a production practice that considers the expenditure of resources for any goal other than
the creation of value for the end customer to be wasteful, and thus a target for elimination. Working from the
perspective of the customer who consumes a product or service, "value" is defined as any action or process that
a customer would be willing to pay for. Basically, lean is centered on preserving value with less work.
Lean manufacturing is a practice that undertakes the expense of different resources for the achievement
of goal. It is generic process management philosophy come into existence from the Toyota Production System
(TPS) and identified as "Lean". It is renowned for its focus on reduction of the original Toyota seven wastes to
improve overall customer value, but there are varying perspectives on how this is best achieved. The steady
growth of Toyota, from a small company to the world's largest automaker, has focused attention on how it has
achieved this.
Lean manufacturing is a variation on the theme of efficiency based on optimizing flow; it is a present-
day instance of the recurring theme in human history toward increasing efficiency, decreasing waste, and using
empirical methods to decide what matters, rather than uncritically accepting pre-existing ideas. As such, it is a
chapter in the larger narrative that also includes such ideas as the time and motion study, the Efficiency
Movement, and Fordism. Lean manufacturing is often seen as a more refined version of earlier efficiency
efforts, building upon the work of earlier leaders such as Taylor or Ford, and learning from their mistakes.
Lean Manufacturing has increasingly been applied by leading manufacturing companies throughout the
world. It has proven to have many positive outcomes, which include such concepts as reduced cycle time,
decreased cost, reduction of defects and waste. Lean manufacturing aims to achieve the same output with less
input; such as less time, less space, less human effort, less machinery, less material and less cost. To better
understand lean manufacturing, one first needs to understand the basic principles that guide it. Some major lean
manufacturing principles include: recognizing wastes, having standard processes, having a continuous flow,
pull-production, quality at the source and maintaining continuous improvement.
The main objective of lean production is to reduce lead-time, cycle time and resources and to improve
the quality and productivity. Many companies hesitate to implement it, because of the belief that productivity
will decrease during the implementation stages. But in reality the results are different from their belief. In LMS,
continuous improvement is the best feature.
Volume 3, Issue 3, March– 2018 International Journal of Innovative Science and Research Technology
ISSN No:-2456-2165
IJISRT18MA514 www.ijisrt.com 708
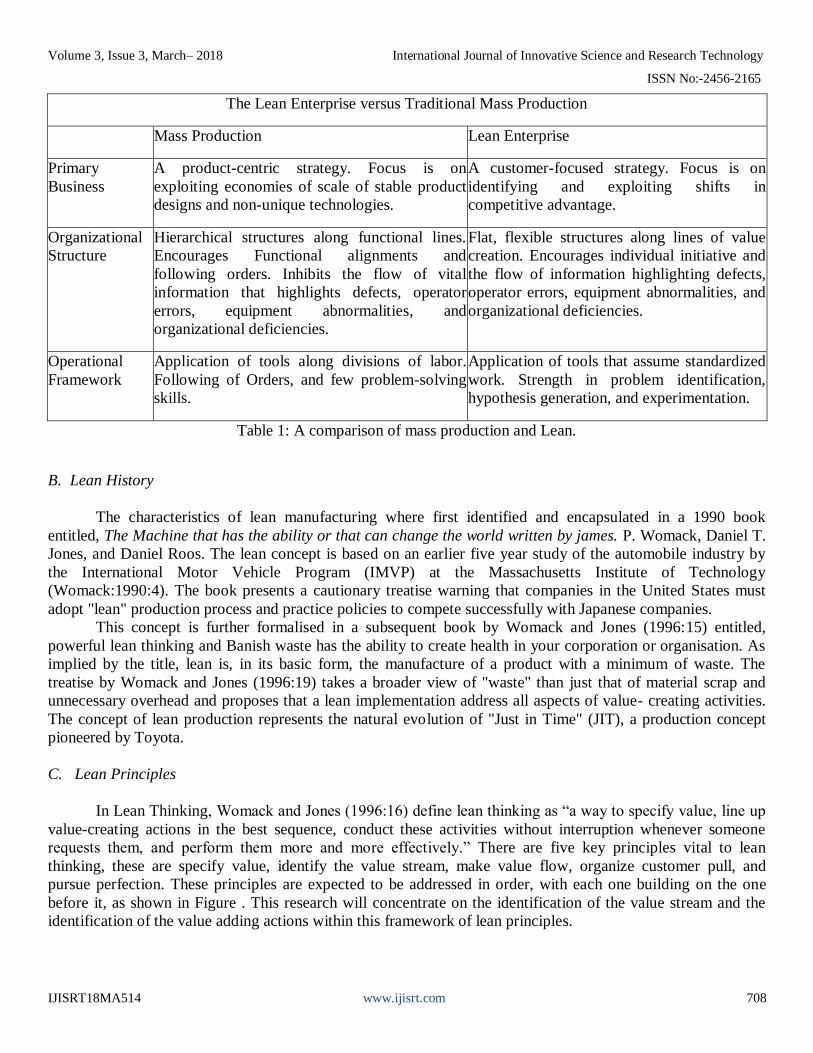
The Lean Enterprise versus Traditional Mass Production
Mass Production Lean Enterprise
Primary
Business
A product-centric strategy. Focus is on
exploiting economies of scale of stable product
designs and non-unique technologies.
A customer-focused strategy. Focus is on
identifying and exploiting shifts in
competitive advantage.
Organizational
Structure
Hierarchical structures along functional lines.
Encourages Functional alignments and
following orders. Inhibits the flow of vital
information that highlights defects, operator
errors, equipment abnormalities, and
organizational deficiencies.
Flat, flexible structures along lines of value
creation. Encourages individual initiative and
the flow of information highlighting defects,
operator errors, equipment abnormalities, and
organizational deficiencies.
Operational
Framework
Application of tools along divisions of labor.
Following of Orders, and few problem-solving
skills.
Application of tools that assume standardized
work. Strength in problem identification,
hypothesis generation, and experimentation.
Table 1: A comparison of mass production and Lean.
B. Lean History
The characteristics of lean manufacturing where first identified and encapsulated in a 1990 book
entitled, The Machine that has the ability or that can change the world written by james. P. Womack, Daniel T.
Jones, and Daniel Roos. The lean concept is based on an earlier five year study of the automobile industry by
the International Motor Vehicle Program (IMVP) at the Massachusetts Institute of Technology
(Womack:1990:4). The book presents a cautionary treatise warning that companies in the United States must
adopt "lean" production process and practice policies to compete successfully with Japanese companies.
This concept is further formalised in a subsequent book by Womack and Jones (1996:15) entitled,
powerful lean thinking and Banish waste has the ability to create health in your corporation or organisation. As
implied by the title, lean is, in its basic form, the manufacture of a product with a minimum of waste. The
treatise by Womack and Jones (1996:19) takes a broader view of "waste" than just that of material scrap and
unnecessary overhead and proposes that a lean implementation address all aspects of value- creating activities.
The concept of lean production represents the natural evolution of "Just in Time" (JIT), a production concept
pioneered by Toyota.
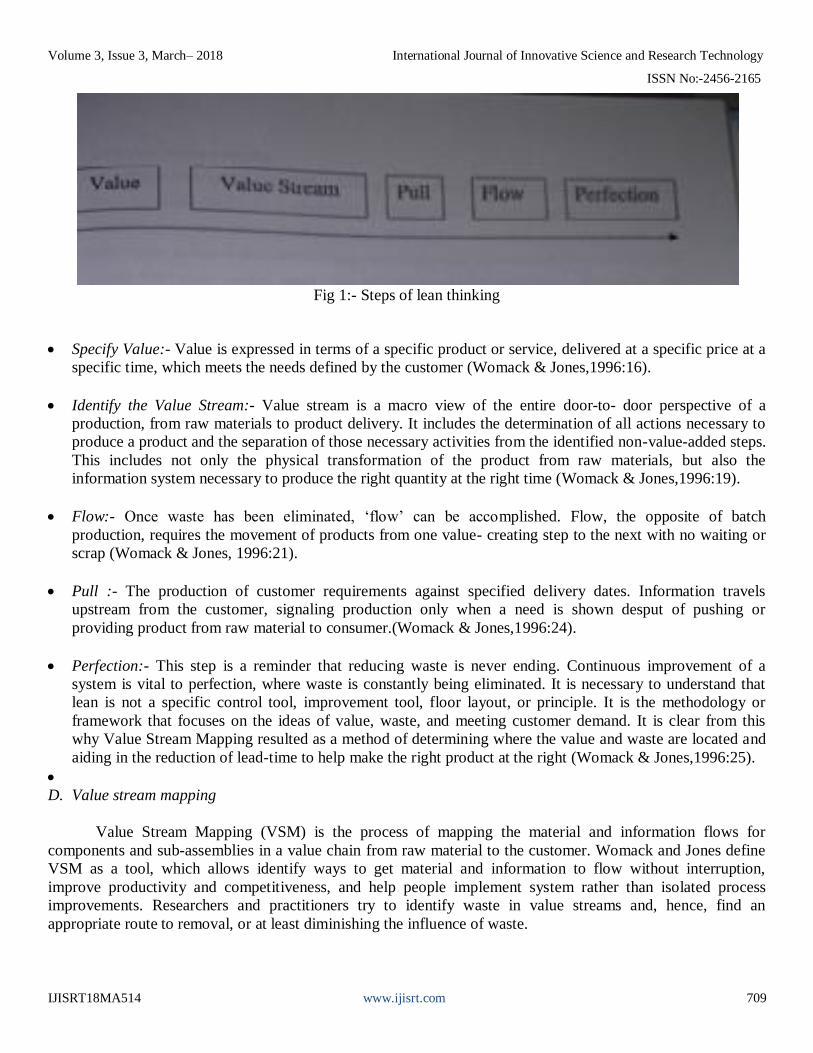
C. Lean Principles
In Lean Thinking, Womack and Jones (1996:16) define lean thinking as “a way to specify value, line up
value-creating actions in the best sequence, conduct these activities without interruption whenever someone
requests them, and perform them more and more effectively.” There are five key principles vital to lean
thinking, these are specify value, identify the value stream, make value flow, organize customer pull, and
pursue perfection. These principles are expected to be addressed in order, with each one building on the one
before it, as shown in Figure . This research will concentrate on the identification of the value stream and the
identification of the value adding actions within this framework of lean principles.
Volume 3, Issue 3, March– 2018 International Journal of Innovative Science and Research Technology
ISSN No:-2456-2165
IJISRT18MA514 www.ijisrt.com 709
Fig 1:- Steps of lean thinking
Specify Value:- Value is expressed in terms of a specific product or service, delivered at a specific price at a
specific time, which meets the needs defined by the customer (Womack & Jones,1996:16).
Identify the Value Stream:- Value stream is a macro view of the entire door-to- door perspective of a
production, from raw materials to product delivery. It includes the determination of all actions necessary to
produce a product and the separation of those necessary activities from the identified non-value-added steps.
This includes not only the physical transformation of the product from raw materials, but also the
information system necessary to produce the right quantity at the right time (Womack & Jones,1996:19).
Flow:- Once waste has been eliminated, ‘flow’ can be accomplished. Flow, the opposite of batch
production, requires the movement of products from one value- creating step to the next with no waiting or
scrap (Womack & Jones, 1996:21).
Pull :- The production of customer requirements against specified delivery dates. Information travels
upstream from the customer, signaling production only when a need is shown desput of pushing or
providing product from raw material to consumer.(Womack & Jones,1996:24).
Perfection:- This step is a reminder that reducing waste is never ending. Continuous improvement of a
system is vital to perfection, where waste is constantly being eliminated. It is necessary to understand that
lean is not a specific control tool, improvement tool, floor layout, or principle. It is the methodology or
framework that focuses on the ideas of value, waste, and meeting customer demand. It is clear from this
why Value Stream Mapping resulted as a method of determining where the value and waste are located and
aiding in the reduction of lead-time to help make the right product at the right (Womack & Jones,1996:25).
D. Value stream mapping
Value Stream Mapping (VSM) is the process of mapping the material and information flows for
components and sub-assemblies in a value chain from raw material to the customer. Womack and Jones define
VSM as a tool, which allows identify ways to get material and information to flow without interruption,
improve productivity and competitiveness, and help people implement system rather than isolated process
improvements. Researchers and practitioners try to identify waste in value streams and, hence, find an
appropriate route to removal, or at least diminishing the influence of waste.
Volume 3, Issue 3, March– 2018 International Journal of Innovative Science and Research Technology
ISSN No:-2456-2165
IJISRT18MA514 www.ijisrt.com 710
According to Seth and Gupta, Value Stream Mapping (VSM) is the process of mapping the material and
information flows for components and sub-assemblies in a value chain from raw material to the customer.
Womack & Jones, and Rother described value-stream maps as “material and information flow maps”, which are
one-page diagrams showing the processes used to make a product. VSM is used to identify the sources of waste
in the value stream as basis for implementation plan that helps to see and focus on flow with a vision of and
ideal.
VSM is a mapping paradigm used to describe the configuration of value streams and it maps not only
material flows but also information flows that signal and control these material flows. Seth and Gupta state that
it is necessary to map the value stream of products both within a company and across the supply chain. VSM
modeling language includes standard icons, and it is easy to use with its widening dissemi- nation within the
manufacturing community, and VSM also includes a step by step approach to transform a current
manufacturing state into a Lean Future State, which is the basis of its success in practice.
VSM became a popular implementation method for Lean manufacturing, and it is considered as a
classification scheme. VSM with seven mapping tools (namely, process activity mapping, supply-chain
response matrix, production variety funnel, quality filter mapping, demand amplification mapping, decision
point analysis and physical structure mapping) and their major application areas are very useful.
Mostly, the value-stream maps were applied to manufacturing activities, but nowadays the technique is
used to map any service business process, including business-to-business sales, retail sales, e-business, auditing,
healthcare, education, and government services.
Value Stream Mapping is an organized approach, used on selected product families, whereby cross-
functional project teams walk and map the current material and information flow. They then apply lean thinking
to create a future state map, with lean elements such as kanban systems and cellular flow. Kaizen breakthrough
event targets are identified.
E. Value stream mapping objectives
Various objectives of using VSM as given by Mike and John (1996) are listed below:
It helps to visualize more than just the single- process level, i.e. assembly, welding, etc., in production. One
can see the flow.
It helps to see more than the waste. Mapping helps to see the sources of waste in your value stream.
It can solve the language barrier by giving them common language.
It makes decisions about the flow apparent, so one can discuss them. Otherwise, many details and decisions
on the shop floor just happen by default.
It ties together lean concepts and techniques, which helps to avoid "cherry picking".
It creats a link between the information and material flow.
Provides a company with a "blueprint" for strategic planning to deploy the principles of Lean Thinking for
their transformation into a Lean Enterprise.
Volume 3, Issue 3, March– 2018 International Journal of Innovative Science and Research Technology
ISSN No:-2456-2165
IJISRT18MA514 www.ijisrt.com 711
F. Three types of activity
Manufacturing, especially lean manufacturing strives to reduce waste in human effort, inventory and
time to market. Manufacturing space is becoming highly responsive to customer demand, same as the demand
to produce the quality products is focused on the efficient and economical manner. Since lean thinking analyzes
business processes systematically by identifying and removing wastes, it helps also to distinguish between value
added and non-value added processes. Classification of processes is based on the elimination of waste. There
are two types of activities classification, see Table 2.
Activities, classified by Monden Activities, classified by Womack & Jones
Value-added activities Value-added activities
Necessary but non value-added activities Type One muda
Non value-added activities Type Two muda
Table 2: Classification of activities
Value-added activities involve the conversion or processing of raw materials or semi-finished products
through the use of manual labor. Examples include activities such as sub- assembling of parts, forging raw
materials, and painting bodywork. Thus, value added activities are the machinery working time required to
produce a product.
Meanwhile, necessary but non-value added activities or Type One muda may be wasteful but are
necessary under the current operating procedures. Examples include such as walking long distances to pick up
parts, unpacking deliveries, and transferring a tool from one hand to another. In order to eliminate these types of
operation it would be necessary to make major changes to the operating system such as creating a new layout or
arranging for suppliers to deliver unpacked goods. Such change may not be possible immediately.
Non-value added activities or Type two muda stands for the pure waste and involves unnecessary
actions, which can be eliminated completely. Examples include waiting time, stacking intermediate products,
double handling and etc. Typically, 95% of all lead-time is non-value added activities.
G. Wastes
According to Hines, Taylor, Butterworth & Sullivan, understanding wastes within the supply chain is
considered as the first stages of VSM. Researchers and practitioners try to identify waste in value streams and,
hence, find an appropriate route to removal, or at least diminishing the influence of waste.
Waste takes many forms and can be found at any time and in any place. It may be found hidden in
policies, procedures, production process, product designs, and in other operations. Waste consumes
resources but does not add any value to the product. Russell and Taylor define waste is defined as something
despite of minimum amount, time, efforts and labour that are required to add value of specific product.
Volume 3, Issue 3, March– 2018 International Journal of Innovative Science and Research Technology
ISSN No:-2456-2165
IJISRT18MA514 www.ijisrt.com 712
According to Shingeo, Bicheno and Taiichi there are seven types of wastes, which are accepted commonly in
manufacturing industry:
Overproduction,
Waiting,
Transportation,
Inappropriate processing,
Un-necessary inventory,
Unnecessary movement and
Defects.
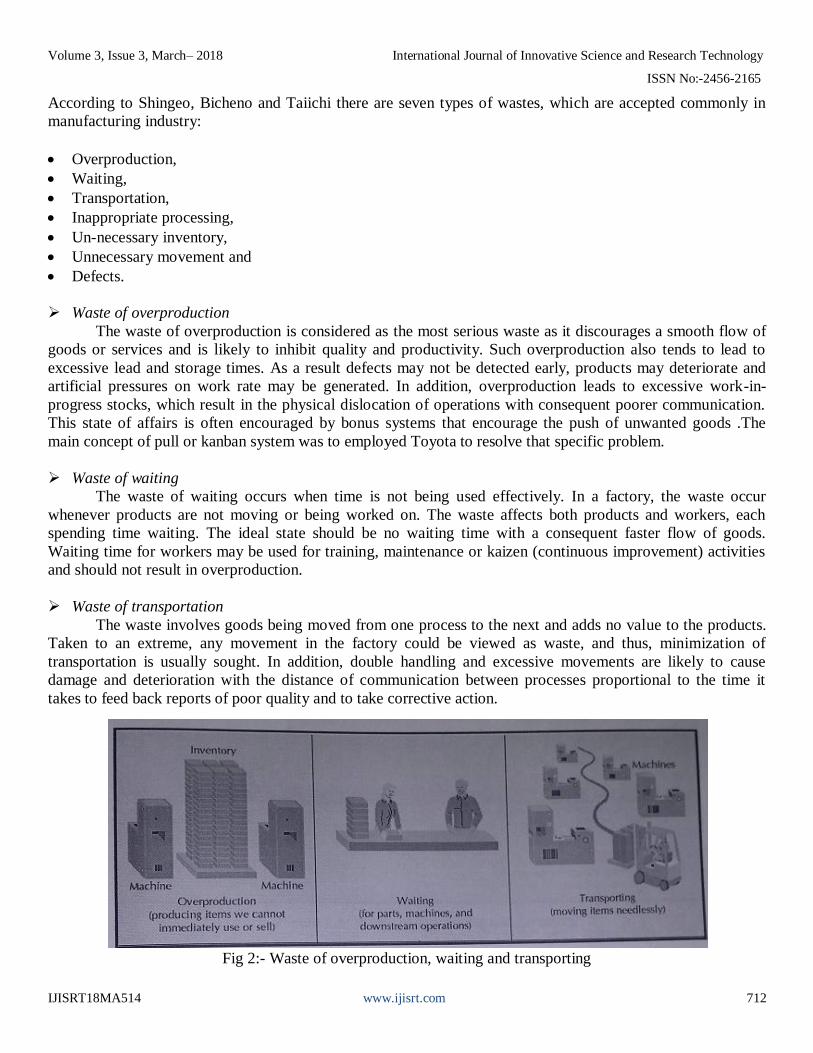
Waste of overproduction
The waste of overproduction is considered as the most serious waste as it discourages a smooth flow of
goods or services and is likely to inhibit quality and productivity. Such overproduction also tends to lead to
excessive lead and storage times. As a result defects may not be detected early, products may deteriorate and
artificial pressures on work rate may be generated. In addition, overproduction leads to excessive work-in-
progress stocks, which result in the physical dislocation of operations with consequent poorer communication.
This state of affairs is often encouraged by bonus systems that encourage the push of unwanted goods .The
main concept of pull or kanban system was to employed Toyota to resolve that specific problem.
Waste of waiting
The waste of waiting occurs when time is not being used effectively. In a factory, the waste occur
whenever products are not moving or being worked on. The waste affects both products and workers, each
spending time waiting. The ideal state should be no waiting time with a consequent faster flow of goods.
Waiting time for workers may be used for training, maintenance or kaizen (continuous improvement) activities
and should not result in overproduction.
Waste of transportation
The waste involves goods being moved from one process to the next and adds no value to the products.
Taken to an extreme, any movement in the factory could be viewed as waste, and thus, minimization of
transportation is usually sought. In addition, double handling and excessive movements are likely to cause
damage and deterioration with the distance of communication between processes proportional to the time it
takes to feed back reports of poor quality and to take corrective action.
Fig 2:- Waste of overproduction, waiting and transporting
Volume 3, Issue 3, March– 2018 International Journal of Innovative Science and Research Technology
ISSN No:-2456-2165
IJISRT18MA514 www.ijisrt.com 713
Waste of inappropriate processing
The waste of inappropriate processing occurs in situations where overly complex solutions are found to
simple procedures such as using a large inflexible machine instead of several small flexible ones. The over-
complexity generally discourages ownership and encourages the employees to overproduce to recover the large
investment in the complex machines. Such an approach encourages poor layout, leading to excessive transport
and poor communication. The ideal, therefore, is to have the smallest possible machine, capable of producing
the required quality, located next to preceding and subsequent operations. Inappropriate processing occurs also
when machines are used without sufficient safeguards, such as poke-yoke (mistake-proofing technique) or
jidoka (stopping a manual line or process when something goes wrong) devices, so that poor quality goods can
be made.
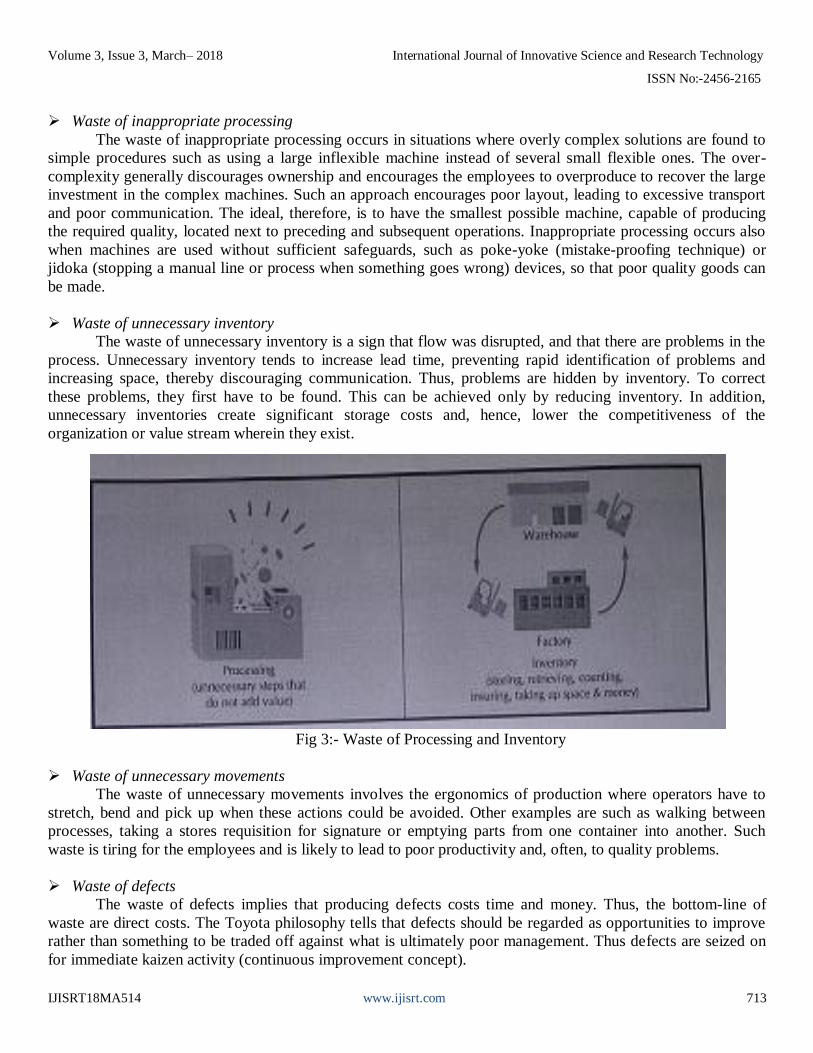
Waste of unnecessary inventory
The waste of unnecessary inventory is a sign that flow was disrupted, and that there are problems in the
process. Unnecessary inventory tends to increase lead time, preventing rapid identification of problems and
increasing space, thereby discouraging communication. Thus, problems are hidden by inventory. To correct
these problems, they first have to be found. This can be achieved only by reducing inventory. In addition,
unnecessary inventories create significant storage costs and, hence, lower the competitiveness of the
organization or value stream wherein they exist.
Fig 3:- Waste of Processing and Inventory
Waste of unnecessary movements
The waste of unnecessary movements involves the ergonomics of production where operators have to
stretch, bend and pick up when these actions could be avoided. Other examples are such as walking between
processes, taking a stores requisition for signature or emptying parts from one container into another. Such
waste is tiring for the employees and is likely to lead to poor productivity and, often, to quality problems.
Waste of defects
The waste of defects implies that producing defects costs time and money. Thus, the bottom-line of
waste are direct costs. The Toyota philosophy tells that defects should be regarded as opportunities to improve
rather than something to be traded off against what is ultimately poor management. Thus defects are seized on
for immediate kaizen activity (continuous improvement concept).
Volume 3, Issue 3, March– 2018 International Journal of Innovative Science and Research Technology
ISSN No:-2456-2165
IJISRT18MA514 www.ijisrt.com 714
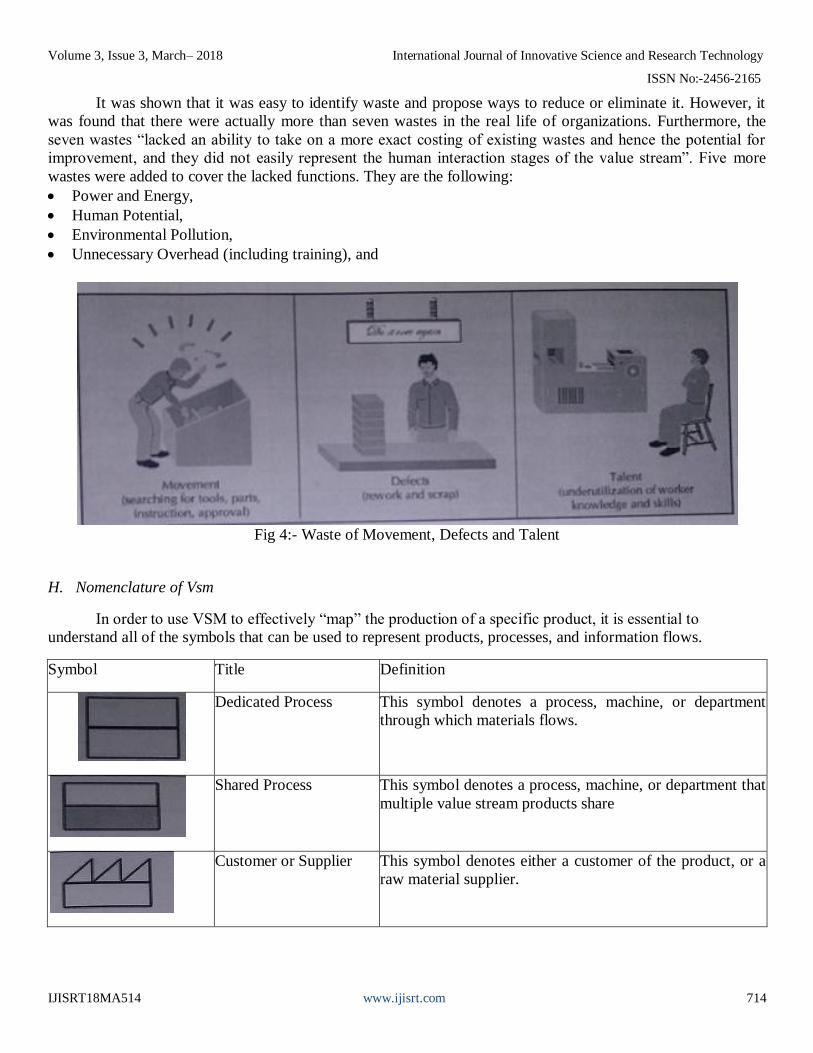
It was shown that it was easy to identify waste and propose ways to reduce or eliminate it. However, it
was found that there were actually more than seven wastes in the real life of organizations. Furthermore, the
seven wastes “lacked an ability to take on a more exact costing of existing wastes and hence the potential for
improvement, and they did not easily represent the human interaction stages of the value stream”. Five more
wastes were added to cover the lacked functions. They are the following:
Power and Energy,
Human Potential,
Environmental Pollution,
Unnecessary Overhead (including training), and
Fig 4:- Waste of Movement, Defects and Talent
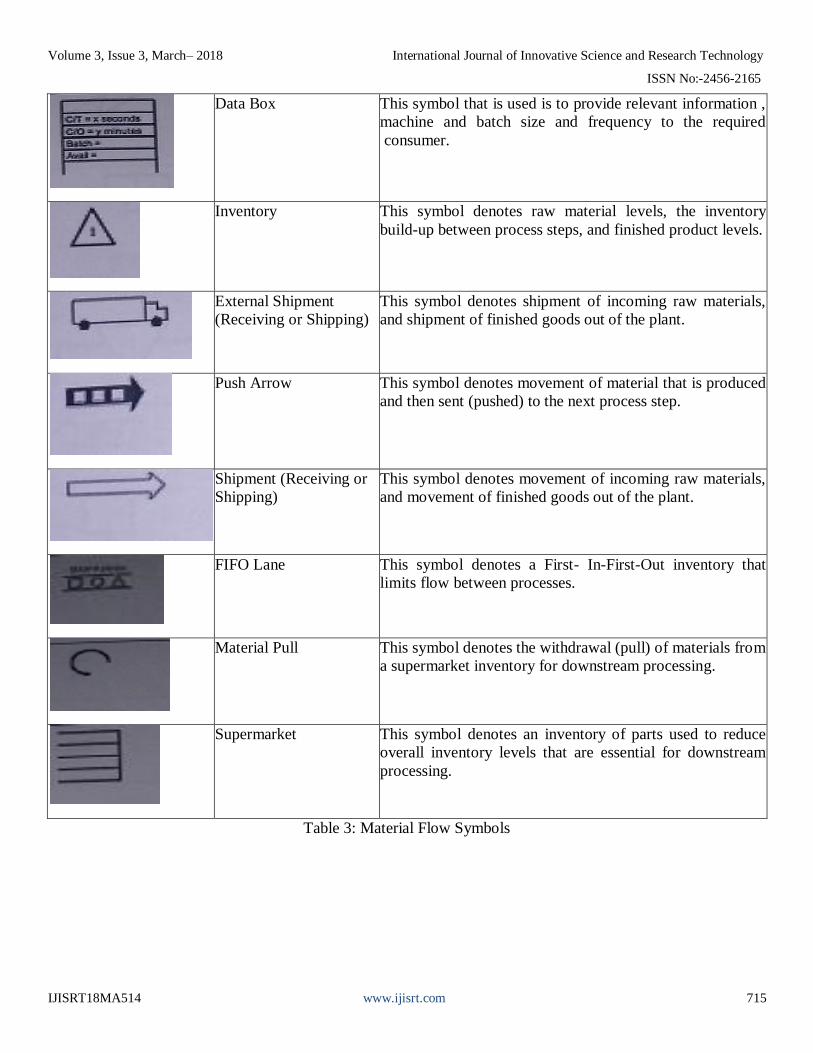
H. Nomenclature of Vsm
In order to use VSM to effectively “map” the production of a specific product, it is essential to
understand all of the symbols that can be used to represent products, processes, and information flows.
Symbol Title Definition
Dedicated Process This symbol denotes a process, machine, or department
through which materials flows.
Shared Process This symbol denotes a process, machine, or department that
multiple value stream products share
Customer or Supplier This symbol denotes either a customer of the product, or a
raw material supplier.
Volume 3, Issue 3, March– 2018 International Journal of Innovative Science and Research Technology
ISSN No:-2456-2165
IJISRT18MA514 www.ijisrt.com 715
Data Box This symbol that is used is to provide relevant information ,
machine and batch size and frequency to the required
consumer.
Inventory This symbol denotes raw material levels, the inventory
build-up between process steps, and finished product levels.
External Shipment
(Receiving or Shipping)
This symbol denotes shipment of incoming raw materials,
and shipment of finished goods out of the plant.
Push Arrow This symbol denotes movement of material that is produced
and then sent (pushed) to the next process step.
Shipment (Receiving or
Shipping)
This symbol denotes movement of incoming raw materials,
and movement of finished goods out of the plant.
FIFO Lane This symbol denotes a First- In-First-Out inventory that
limits flow between processes.
Material Pull This symbol denotes the withdrawal (pull) of materials from
a supermarket inventory for downstream processing.
Supermarket This symbol denotes an inventory of parts used to reduce
overall inventory levels that are essential for downstream
processing.
Table 3: Material Flow Symbols
Volume 3, Issue 3, March– 2018 International Journal of Innovative Science and Research Technology
ISSN No:-2456-2165
IJISRT18MA514 www.ijisrt.com 716
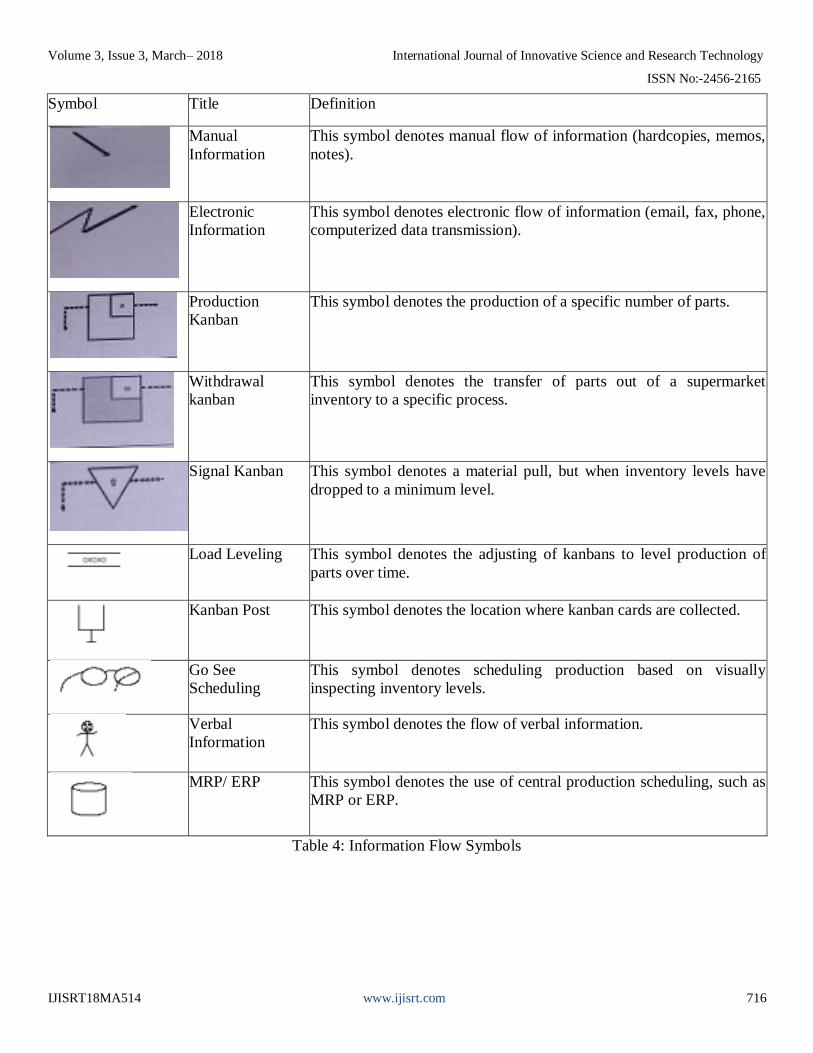
Symbol Title Definition
Manual
Information
This symbol denotes manual flow of information (hardcopies, memos,
notes).
Electronic
Information
This symbol denotes electronic flow of information (email, fax, phone,
computerized data transmission).
Production
Kanban
This symbol denotes the production of a specific number of parts.
Withdrawal
kanban
This symbol denotes the transfer of parts out of a supermarket
inventory to a specific process.
Signal Kanban This symbol denotes a material pull, but when inventory levels have
dropped to a minimum level.
Load Leveling This symbol denotes the adjusting of kanbans to level production of
parts over time.
Kanban Post This symbol denotes the location where kanban cards are collected.
Go See
Scheduling
This symbol denotes scheduling production based on visually
inspecting inventory levels.
Verbal
Information
This symbol denotes the flow of verbal information.
MRP/ ERP This symbol denotes the use of central production scheduling, such as
MRP or ERP.
Table 4: Information Flow Symbols
Volume 3, Issue 3, March– 2018 International Journal of Innovative Science and Research Technology
ISSN No:-2456-2165
IJISRT18MA514 www.ijisrt.com 717
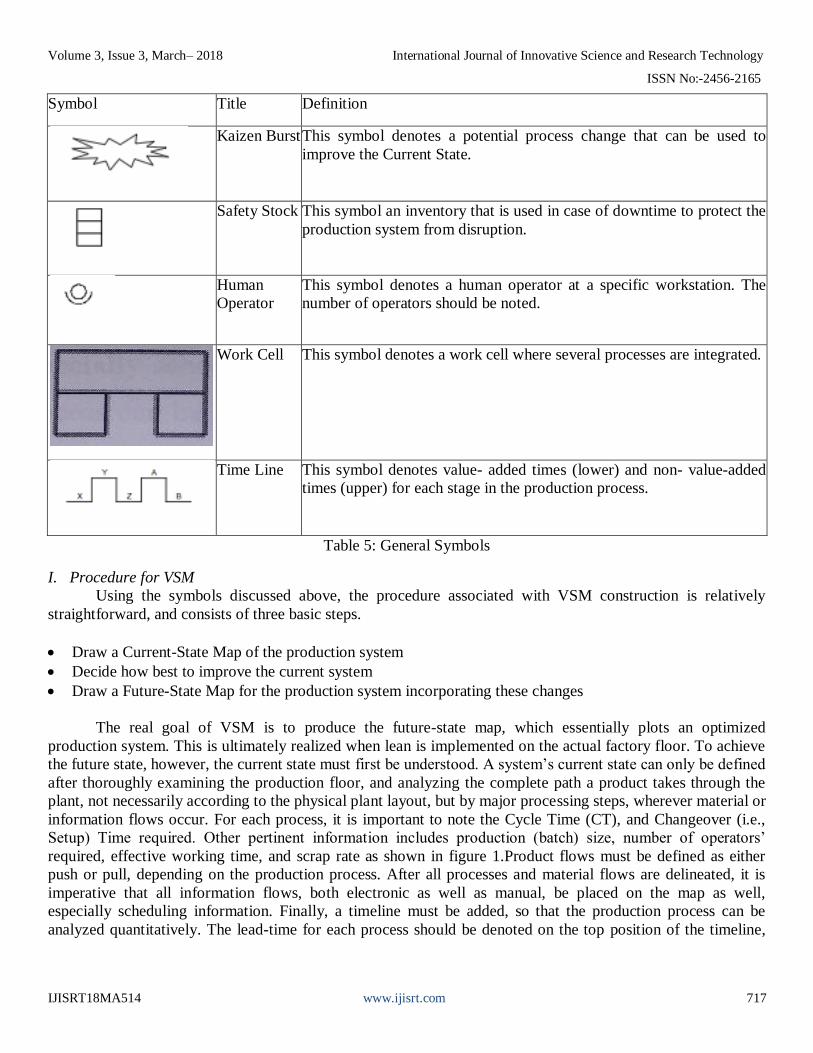
Symbol Title Definition
Kaizen Burst This symbol denotes a potential process change that can be used to
improve the Current State.
Safety Stock This symbol an inventory that is used in case of downtime to protect the
production system from disruption.
Human
Operator
This symbol denotes a human operator at a specific workstation. The
number of operators should be noted.
Work Cell This symbol denotes a work cell where several processes are integrated.
Time Line This symbol denotes value- added times (lower) and non- value-added
times (upper) for each stage in the production process.
Table 5: General Symbols
I. Procedure for VSM
Using the symbols discussed above, the procedure associated with VSM construction is relatively
straightforward, and consists of three basic steps.
Draw a Current-State Map of the production system
Decide how best to improve the current system
Draw a Future-State Map for the production system incorporating these changes
The real goal of VSM is to produce the future-state map, which essentially plots an optimized
production system. This is ultimately realized when lean is implemented on the actual factory floor. To achieve
the future state, however, the current state must first be understood. A system’s current state can only be defined
after thoroughly examining the production floor, and analyzing the complete path a product takes through the
plant, not necessarily according to the physical plant layout, but by major processing steps, wherever material or
information flows occur. For each process, it is important to note the Cycle Time (CT), and Changeover (i.e.,
Setup) Time required. Other pertinent information includes production (batch) size, number of operators’
required, effective working time, and scrap rate as shown in figure 1.Product flows must be defined as either
push or pull, depending on the production process. After all processes and material flows are delineated, it is
imperative that all information flows, both electronic as well as manual, be placed on the map as well,
especially scheduling information. Finally, a timeline must be added, so that the production process can be
analyzed quantitatively. The lead-time for each process should be denoted on the top position of the timeline,
Volume 3, Issue 3, March– 2018 International Journal of Innovative Science and Research Technology
ISSN No:-2456-2165
IJISRT18MA514 www.ijisrt.com 718
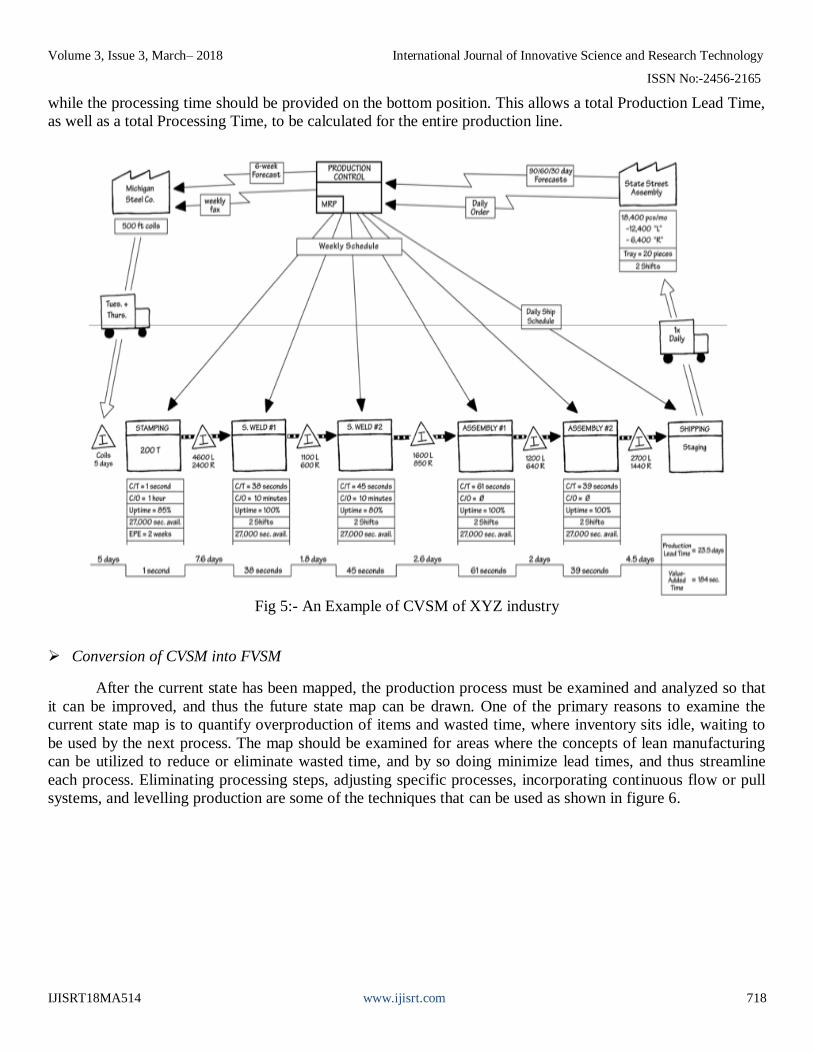
while the processing time should be provided on the bottom position. This allows a total Production Lead Time,
as well as a total Processing Time, to be calculated for the entire production line.
Fig 5:- An Example of CVSM of XYZ industry
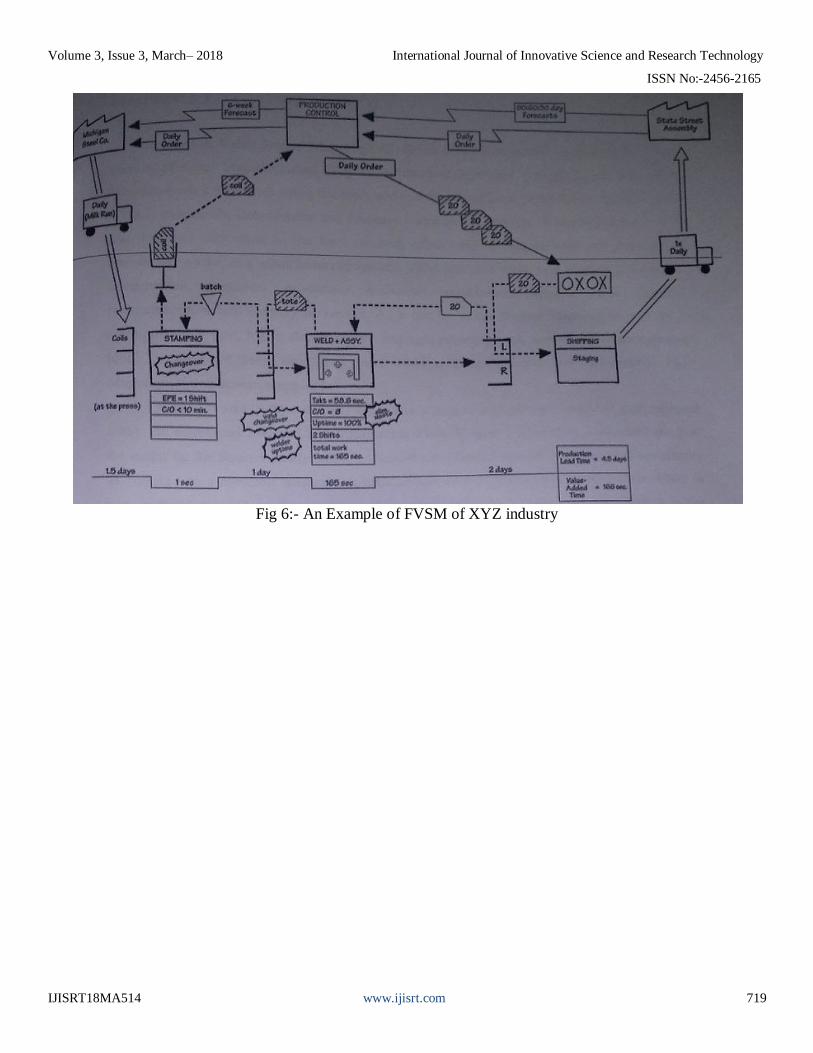
Conversion of CVSM into FVSM
After the current state has been mapped, the production process must be examined and analyzed so that
it can be improved, and thus the future state map can be drawn. One of the primary reasons to examine the
current state map is to quantify overproduction of items and wasted time, where inventory sits idle, waiting to
be used by the next process. The map should be examined for areas where the concepts of lean manufacturing
can be utilized to reduce or eliminate wasted time, and by so doing minimize lead times, and thus streamline
each process. Eliminating processing steps, adjusting specific processes, incorporating continuous flow or pull
systems, and levelling production are some of the techniques that can be used as shown in figure 6.
Volume 3, Issue 3, March– 2018 International Journal of Innovative Science and Research Technology
ISSN No:-2456-2165
IJISRT18MA514 www.ijisrt.com 719
Fig 6:- An Example of FVSM of XYZ industry
Volume 3, Issue 3, March– 2018 International Journal of Innovative Science and Research Technology
ISSN No:-2456-2165
IJISRT18MA514 www.ijisrt.com 720
II. LITERATURE SURVEY
In essence, Value Stream Mapping (VSM) is a visualization tool oriented to the Toyota version of Lean
Manufacturing (Toyota Production System). It helps to understand and streamline work processes using the
tools and techniques of Lean Manufacturing. The goal of VSM is to identify, demonstrate and decrease waste in
the process. Waste being any activity that does not add value to the final product, often used to demonstrate and
decrease the amount of ‘waste’ in a manufacturing system. VSM can thus serve as a starting point to help
management, engineers, production associates, schedulers, suppliers, and customers recognize waste and
identify its causes. As a result, Value Stream Mapping is primarily a communication tool, but is also used as a
strategic planning tool, and a change management tool. Toyota have been benefiting since 1940’s, from
Material and Information Flow Mapping (Value stream mapping).
Taiichi Ohno (1988) could not see waste at a glance (especially across a geographical area). He
developed Material and Information Flow Mapping (VSM) as a standard method for mapping the flows visually
and it became the standard basis for designing improvements at Toyota - as a common language. It became one
of their business planning tools. VSM is now utilized throughout the world, in many businesses to strategically
plan and it is the starting point to any lean transformation and implementation.
Shingo (1989) has discussed the strategies for the effective implementation of Value Stream Mapping in
a wood industry. He also opines that loops can be formed to identify the similar processes and these loops will
be helpful in identifying the non value activities in a systematic manner. He has suggested the ways to eliminate
non value added activity and proposed measures to increase the Value added ratio.
New (1993), and Jones et.al (1997) and other researchers developed individual tools to understand the
value stream. VSM extends guidance for improvements in the process, identifies the need to improve workflow
and finally shows avenues to reduce waste.
(Womack and Jones, 1994) Lean manufacturing requires that not only should technical questions be
fully understood, but existing relationships between manufacturing and the other areas of the firm should also
be examined in depth, as should other factors external to the firm.
Heragu (1997) suggests another key area of lean manufacturing is layout which determines the
arrangement of facilities in a factory. A poor layout may have several deteriorating effects such as high material
handling costs, excessive work-in-process inventories, and low or unbalanced equipment utilization Layouts
that cause inventory accumulation and interrupt process flow should be eliminated. On the other hand, lean
manufacturing needs flexible layouts that reduce movements of both materials and people, minimize material
handling losses, and avoid inventories between stations.
In order to attain noteworthy improvements the Zayko, et.al (1997) have decided to use value stream
mapping to visualize the entire flow and select lean tools that yielded maximum benefits.
Hines and Rich (1997) has opined that, the value stream is “the specific activities within a supply chain
required to design order and provide a specific product or value”.
Liker (1997) reported that the benefits of lean manufacturing generally are lower costs, higher quality,
and shorter lead times. The term lean manufacturing is created to represent less human effort in the company,
less manufacturing space, less investment in tools, less inventory in progress, and less engineering hours to
develop a new product in less time. Shingo (1997) developed the concept of single minute exchange of dies
(SMED) to reduce set up times; for instance, setup times in large punch presses could be reduced from hours to
Volume 3, Issue 3, March– 2018 International Journal of Innovative Science and Research Technology
ISSN No:-2456-2165
IJISRT18MA514 www.ijisrt.com 721
less than ten minutes. This has a big effect on reducing lot sizes. Another way to reduce inventory is by trying
to minimize machine downtime. This can be done by preventive maintenance. It is clear that when inventory is
reduced other sources of waste are reduced too. For example, space that was used to keep inventory can be
utilized for other things such as to increase facility capacity. Also, reduction in setup times as a means to reduce
inventory simultaneously saves time, thus reduces time as a source of waste
Womack and Jones (1998) and Moore (2006) have stated that, the organizations of many types are
implementing lean manufacturing, or lean production, practices to respond to competitive challenges. They
have mentioned that lean initiatives can be taken up in the fields of automotive sector, aerospace, and consumer
goods industries around the world. Moore has discussed various implementation tools of Lean Manufacturing,
which can be incorporated in the industries.
Rother and Shook (1999) have discussed that Value Stream Mapping (VSM) is used to define and
analyze the current state for a product value stream and design a future state focused on reducing waste,
improving lead-time, and improving workflow. The use of VSM appears to be increasing, particularly since the
publication of “learning to see” by Rother and Shook (1999). One of the unique characteristics of VSM in
comparison with other process analysis techniques is that one map depicts both material and information flow
that controls the material flow. The focus of VSM is on a product “value stream” (all actions required to
transform raw materials into a finished product) for a given “product family” -- products that follow the same
overall production steps.
Abbett and Payne (1999) have discussed the application of value stream mapping in an aircraft-
manufacturing unit. Thus value stream mapping was extended in the field of aircraft manufacturing also. They
have created the current and future state in such a proper and effective manner to reduce the time of the
consumers.
Doolen et al (2002) have extended the applications of lean production techniques in the electronics
manufacturing perspectives. Hyer (2002) has implemented Lean manufacturing in the office service and
administrative processes.
Yang-Hua and Valandeghem (2002) describe, Value stream mapping as a mapping tool that is used to
describe supply chain networks. It maps not only material flows but also information flows that signal and
control the material flows. The material flow path of the product is traced back from the final operation in its
routing to the storage location for raw material. This visual representation facilitates the process of lean
implementation by helping to identify the value-added steps in a value stream, and eliminating the non-value
added steps / waste (muda).
Pavnaskar et al (2003) proposed scheme of classification for lean manufacturing tools and allied
detailing. This scheme of classification is structured around seven levels: system, object, operation, activity,
resource, characteristic and application. Each level is linked systematically so that lean manufacturing tools and
metrics. or manufacturing waste problems, are classified in a meaningful and logical way.
Simchi-Levi et al (2004) are of the opinion that the customers are always concerned with their order
status, and sometimes they value the order status more than a reduced lead time. But, McDonald et.al (2002)
point out that the VSM creates a common language for production process, thus facilitating more thoughtful
decisions to improve the value stream. This will effectively reduce the wastes and improves the productivity.
While researchers and practitioners have developed a number of tools to investigate individual firms and supply
chains, most of these tools fall short in linking and visualizing the nature of the material and information flow in
Volume 3, Issue 3, March– 2018 International Journal of Innovative Science and Research Technology
ISSN No:-2456-2165
IJISRT18MA514 www.ijisrt.com 722
an individual company. McDonald et.al (2002) have used simulation techniques for the high-performance
motion control products manufacturing system to demonstrate that, simulation can be a very crucial tool in
assessing different future state maps. They demonstrate that simulation can provide and examine different
scenarios to complement those obtained from future state mapping.
Doolen and Hacker (2005); Shah and Ward (2007). Relationship with customers is also crucial in lean
manufacturing Customers decide what to buy, and when and how they are going to purchase a product. Since
the customers determine value, it is essential to develop a good relationship with them. Setting up good
relationships with customers will enable an organization to understand and meet their needs and predict their
demands accurately, as it is important to attain a perfect match between market demands and production flows
(Panizzolo, 1998).
Badrinarayana and Sharma (2007) discusses that the interdependent components form the value stream
and Value Stream is the set of all specific actions required to bring out a specific product. Wong et al. (2009) As
an integrative concept, the adoption of lean manufacturing can be characterized by a collective set of key areas
or factors. These key areas encompass a broad array of practices that are believed to be critical for its
implementation. They are, scheduling, inventory, material handling, equipment, work processes, quality,
employees, layout, suppliers, customers, safety and ergonomics, product design, management and culture, and
tools and techniques.
V. Ramesh, K.V. Sreenivasa Prasad, T.R. Srinivas (2008) has observed that, due to enormous potential
in the lean manufacturing tools, value stream mapping study was carried out in a medium scale industry for the
manufacture of machining center. It was observed from CVSM that the value added time was less. Hence, the
study was carried out in the manufacture of Base, Column, Cross Slide, Milling Head and Table and various
parameters like cycle time, set up time, WIP were recorded. By carrying out interviews with the managers,
engineers and workers, the authors have proposed measures to reduce cycle time and improve the process of
manufacture. A CVSM was drawn for all the processes as it was one of the main objectives of this study and
identified the reasons for increase in cycle & set up time. The authors have suggested FVSM for improving the
value added time by reducing the cycle time and the set up time. Finally, the reductions in the cycle time after
the implementation is estimated and proposed.
Yu Cheng Wong, Kuan Yew Wong, Anwar Ali (2009) has provided important insights into the current
status of lean manufacturing implementation in the electrical and electronics industry in Malaysia, as well as
highlighted some associated issues. Firstly, the respondent companies’ general backgrounds (e.g. their size,
their involvement in lean manufacturing, etc) have been discussed. The companies are found to have a good
understanding of lean manufacturing, and since its implementation, they have gained many benefits such as
reduced cost and improved productivity. It is also apparent that the companies have implemented various tools
and techniques to support lean manufacturing, and they do not adopt a single tool in isolation. In order to assess
the extent to which they have implemented lean manufacturing, developing and producing 14 key areas and
factor which efficiently judge the discipline they have can be checked.
Bhim Singh & Suresh K. Garg & Surrender K. Sharma (2010) highlight some of critical issues relevant
to value stream mapping. The available literature is categorized as, conceptual work, empirical/modeling work,
case studies, survey articles. Vast literature on value stream mapping and its growing adaptation in developed
and developing countries indicate the interest shown in this area by researchers and practitioners. Results of the
case study conducted in XYZ Indian Industry shows that VSM is a very effective technique for identification
and reduction of various types of wastes. The reduction in work in process inventory by 80.09%, finished goods
Volume 3, Issue 3, March– 2018 International Journal of Innovative Science and Research Technology
ISSN No:-2456-2165
IJISRT18MA514 www.ijisrt.com 723
inventory by 50%, product lead time by 82.12%, station cycle time by 3.75%, change over time by 6.75% and
manpower required by 16.66%.
Based upon the literature reviewed in this paper on VSM, few areas need further scrutiny.
There is a need to discuss cost–benefit analysis of proposed changes made in future state map while
applying value stream mapping technique for any specific application.
Little work has been done with the help of this technique in the area of vendor management.
Effect of changes done in current state during VSM implementation has not seen yet on human factor.
Ma Ga (Mark), Yang Paul Hong, Sachin B. Modi (2011) This paper explores relationships between lean
manufacturing practices, environmental management (e.g., environmental management practices and
environmental performance) and business performance outcomes (e.g., market and financial performance). The
hypothesized relationships of this model are tested with data collected from 309 international manufacturing
firms (IMSS IV) by using AMOS. The findings suggest that prior lean manufacturing experiences are positively
related to environmental management practices. Environmental management practices alone are negatively
related to market and financial performance. The paper provides empirical evidences with large sample size that
environmental management practices become an important mediating variable to resolve the conflicts between
lean manufacturing and environmental performance.
Volume 3, Issue 3, March– 2018 International Journal of Innovative Science and Research Technology
ISSN No:-2456-2165
IJISRT18MA514 www.ijisrt.com 724
III. CASE STUDY
To implement the technique of Lean manufacturing, firstly we required to select an industry where it could be
best applied.
So, we selected Delphi Automotive Systems as our study area. Delphi is basically a wiring harness
manufacturing company which supplies wiring harness to automobile OEM companies like General Motors,
Mahindra and Mahindra etc.
Wire harness is a product which supplies power from the power source (Battery) to different parts of an
automobile.
Types of wire harness in a vehicle:
Engine harness
Engine compartment harness
Instrumental panel harness
Floor or chassis harness
Lead wires or small harness (Tail lamp, tail gate, dome lamp etc)
Components of wire harness:
Wires
Terminals
Connectors
Tape
PVC tube or Corrugated tube
All the above parts are assembled together to make a complete harness.
The manufacturing of a harness consists of two processes in the manufacturing unit.
Lead preparation: In the lead preparation cell the wires are cut as per the lengths they are required in the
harness. Then crimping process is done in which the terminals are connected with the wires. After that these
crimped wires are delivered to the assembly area for further processing.
Harness assembly: In the assembly area the wires are fitted in connectors and other components like tape,
grommet, and corrugated tubes. All these components combine to form a wire harness.
The processes in the assembly of wire harness are:
Volume 3, Issue 3, March– 2018 International Journal of Innovative Science and Research Technology
ISSN No:-2456-2165
IJISRT18MA514 www.ijisrt.com 725
Sub-assembly: The wires are assembled in small assemblies or sub-assemblies so as if all are combined
constitute the circuit of a complete harness.
Mounting or Routing: In this process, all the sub-assemblies are combined and laid on the building boards
where they are routed as per the fixtures and drawing requirement.
Taping: In the taping process as the name suggests taping is done on the wires routed on the boards. Some
other components like corrugated tubes, PVC tubes, clamps and grommet can also be applied as per the
harness requirement. After taping the harness is complete in shape and is processed for checking of defects.
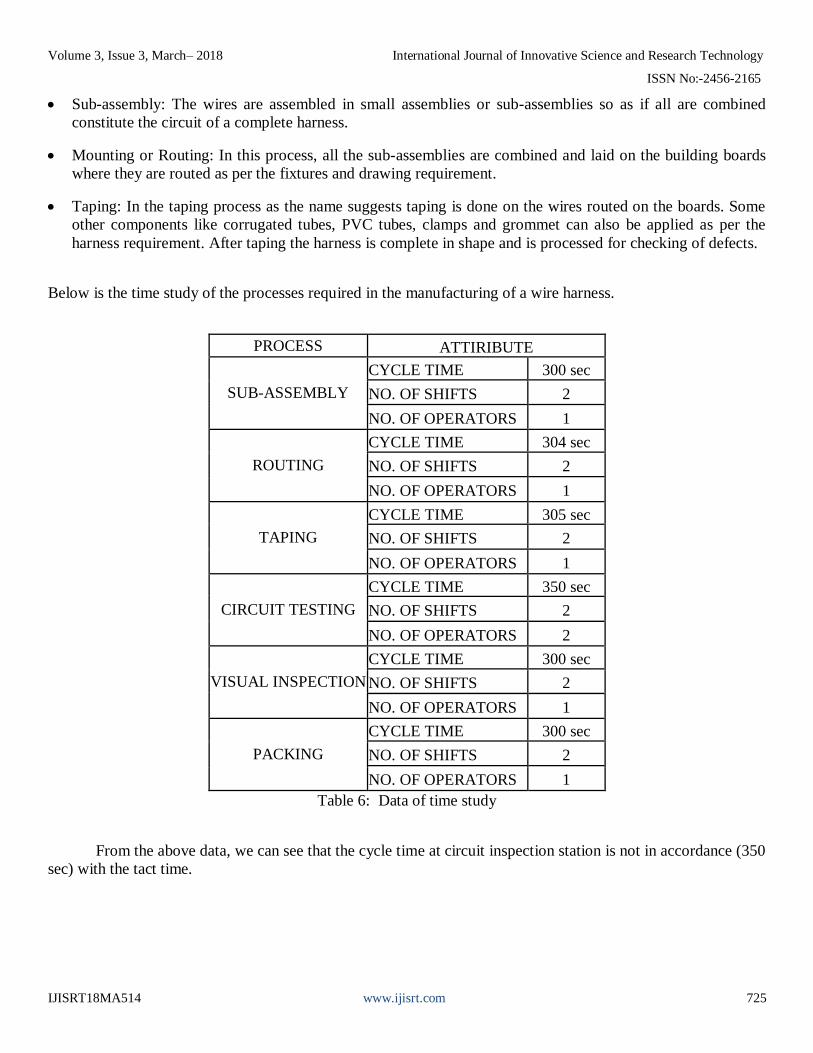
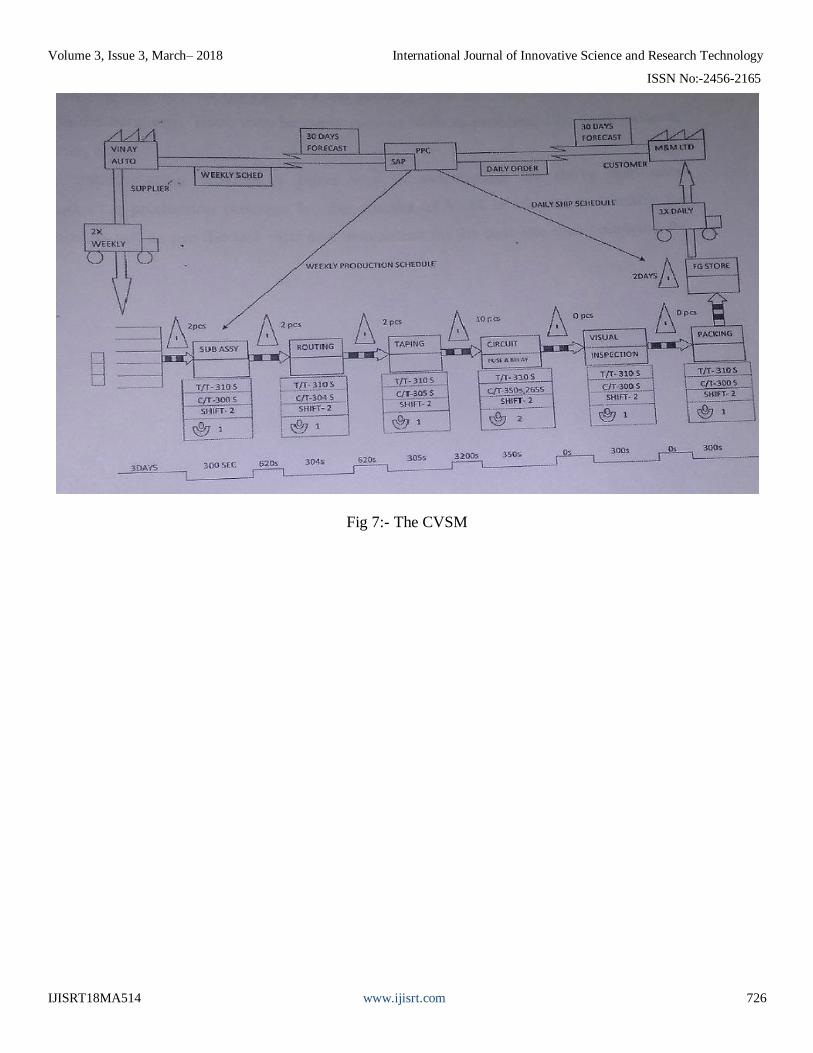
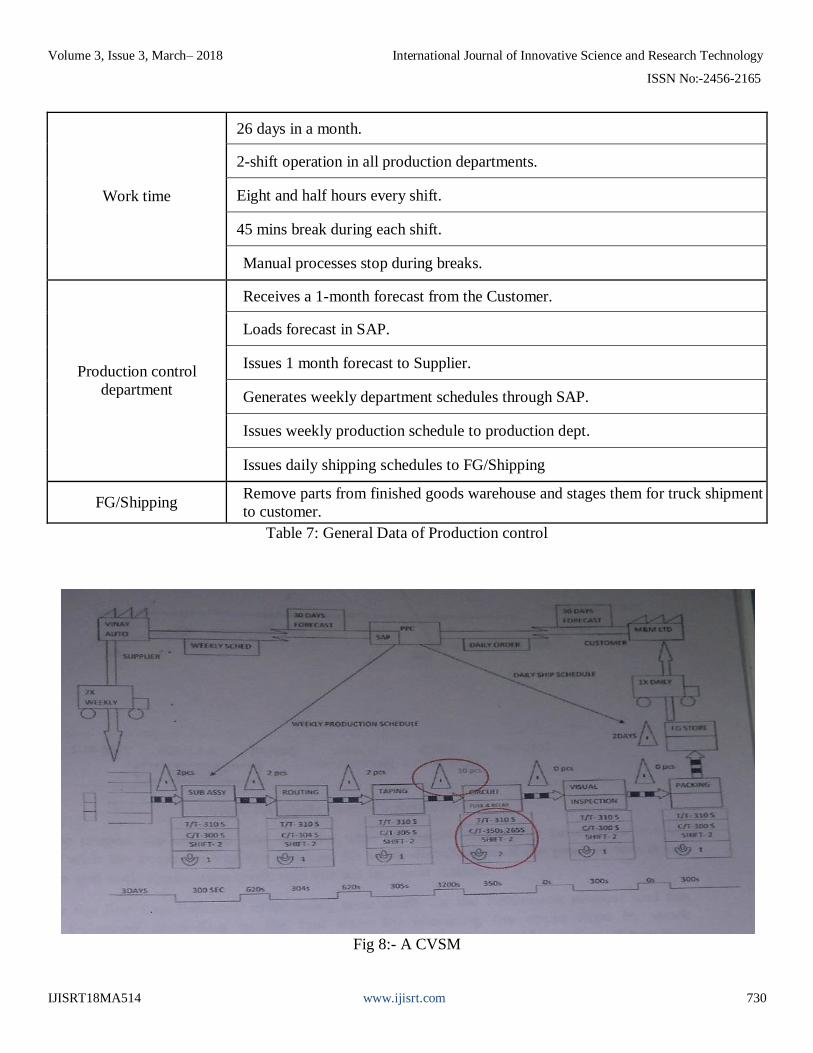
Below is the time study of the processes required in the manufacturing of a wire harness.
PROCESS ATTIRIBUTE
SUB-ASSEMBLY
CYCLE TIME 300 sec
NO. OF SHIFTS 2
NO. OF OPERATORS 1
ROUTING
CYCLE TIME 304 sec
NO. OF SHIFTS 2
NO. OF OPERATORS 1
TAPING
CYCLE TIME 305 sec
NO. OF SHIFTS 2
NO. OF OPERATORS 1
CIRCUIT TESTING
CYCLE TIME 350 sec
NO. OF SHIFTS 2
NO. OF OPERATORS 2
VISUAL INSPECTION
CYCLE TIME 300 sec
NO. OF SHIFTS 2
NO. OF OPERATORS 1
PACKING
CYCLE TIME 300 sec
NO. OF SHIFTS 2
NO. OF OPERATORS 1
Table 6: Data of time study
From the above data, we can see that the cycle time at circuit inspection station is not in accordance (350
sec) with the tact time.
Volume 3, Issue 3, March– 2018 International Journal of Innovative Science and Research Technology
ISSN No:-2456-2165
IJISRT18MA514 www.ijisrt.com 726
Fig 7:- The CVSM
Volume 3, Issue 3, March– 2018 International Journal of Innovative Science and Research Technology
ISSN No:-2456-2165
IJISRT18MA514 www.ijisrt.com 727
IV. OBJECTIVE
As discussed earlier, a wire harness consists of many steps in its manufacturing. The major problem
faced in the assembly area of excess inventory at a station leading to waiting time for the next process. Excess
inventory and waiting time both are losses to the company.
In an industry the main focus is laid on reducing non value adding wastes thus reducing manufacturing
costs.
In this study also, the main problems incurred were of accumulating of harness at a station and waiting
time at the next station leading to line imbalance. Also, operators were required to be planned on over time to
clear the pending material lying on line which was a direct loss to the company. There may be many reasons to
these problems like work balance, time balancing etc.
Lean manufacturing provides a better way of overcoming the above mentioned shortcomings of a
production process. So, the process of VSM is adopted to identify the process which is not as per the tact time
and then acting on the problem thus balancing the process.
Volume 3, Issue 3, March– 2018 International Journal of Innovative Science and Research Technology
ISSN No:-2456-2165
IJISRT18MA514 www.ijisrt.com 728
V. METHODOLOGY
To implement the process of lean manufacturing by applying the technique of Value Stream Mapping it
is necessary to create a current state Value Stream Map (CVSM).
Step1: Firstly, a CVSM was plotted using various symbols and notations showing parameters like cycle
time, inventory etc. at various processes. All the assembly processes were shown using standard symbols also
representing inventory, cycle time at various stations.
Step 2: After preparing the current value stream map (CVSM), the process was studied for
unbalanced/abnormal situations like heavy inventory; unusual cycle time etc. In the above figure the abnormal
situation is encircled red.
Step 3: In the next step, time study of the work was done to verify the actual process. After the time
study the work was balanced considering the cycle time of both the operators on the circuit testing station. After
work distribution time study was again performed to check whether the cycle time is in accordance to the tact
time or not.
Step 4: In the last step, the Future State Value Stream Map is made in which the shortcomings of the
CVSM are eliminated. In the FVSM all the processes are balanced and there is smooth flow of material without
any inventory. Also the cycle time of the processes is in accordance to the tact time.
Volume 3, Issue 3, March– 2018 International Journal of Innovative Science and Research Technology
ISSN No:-2456-2165
IJISRT18MA514 www.ijisrt.com 729
VI. RESULT AND DISCUSSION
From the study of different aspects we get to know that VSM is a strong technique of lean
manufacturing which aims at identifying wastes in a process and giving various measures to eradicate those
wastes.
What is the Takt Time?
The Takt time is the demand rate and consequently the time between completions of each product off of
the production line. It is first necessary to find the available capacity of the production line.
Takt time can be first determined with the formula:
{T= Ta/Td}
Where :
T = Takt time, e.g. [minutes of work / unit produced]
Ta = Net time available to work, e.g. [minutes of work / day]
Td = Time demand (customer demand), e.g. [units required / day]
Net available time is the amount of time available for work to be done. This excludes break times and any
expected stoppage time (for example scheduled maintenance, team briefings, etc.).
Example :- If there is a total of 8 and half hours (or 510 minutes) in a shift (gross time) less 30 minutes lunch,
15 minutes for breaks, then the net Available Time to Work = 510 - 30 - 15 = 465 minutes. If customer demand
was, say, 180 units a day and one shift was being run, then the line would be required to spend a maximum of
155sec to make a part in order to fulfil the need of the consumer.
Takt Time
Customer requirement = 4650 products/month.
No. Of working days = 26
No. Of shifts= 2
Time available in each shift = 8 and half hrs. = 30600 sec.
Time for breaks or non-working time per shift = 45 mins = 2700 sec.
Net available working time per shift = 30600 – 2700 = 27900 sec.
Therefore, Tact Time = 27900 sec ÷ 90 units per shift = 310 sec.
What this tact number means is that to meet customer demand within its available work time, we need to
produce a wire harness in every 310 seconds.
Volume 3, Issue 3, March– 2018 International Journal of Innovative Science and Research Technology
ISSN No:-2456-2165
IJISRT18MA514 www.ijisrt.com 730
Work time
26 days in a month.
2-shift operation in all production departments.
Eight and half hours every shift.
45 mins break during each shift.
Manual processes stop during breaks.
Production control
department
Receives a 1-month forecast from the Customer.
Loads forecast in SAP.
Issues 1 month forecast to Supplier.
Generates weekly department schedules through SAP.
Issues weekly production schedule to production dept.
Issues daily shipping schedules to FG/Shipping
FG/Shipping Remove parts from finished goods warehouse and stages them for truck shipment
to customer.
Table 7: General Data of Production control
Fig 8:- A CVSM
Volume 3, Issue 3, March– 2018 International Journal of Innovative Science and Research Technology
ISSN No:-2456-2165
IJISRT18MA514 www.ijisrt.com 731
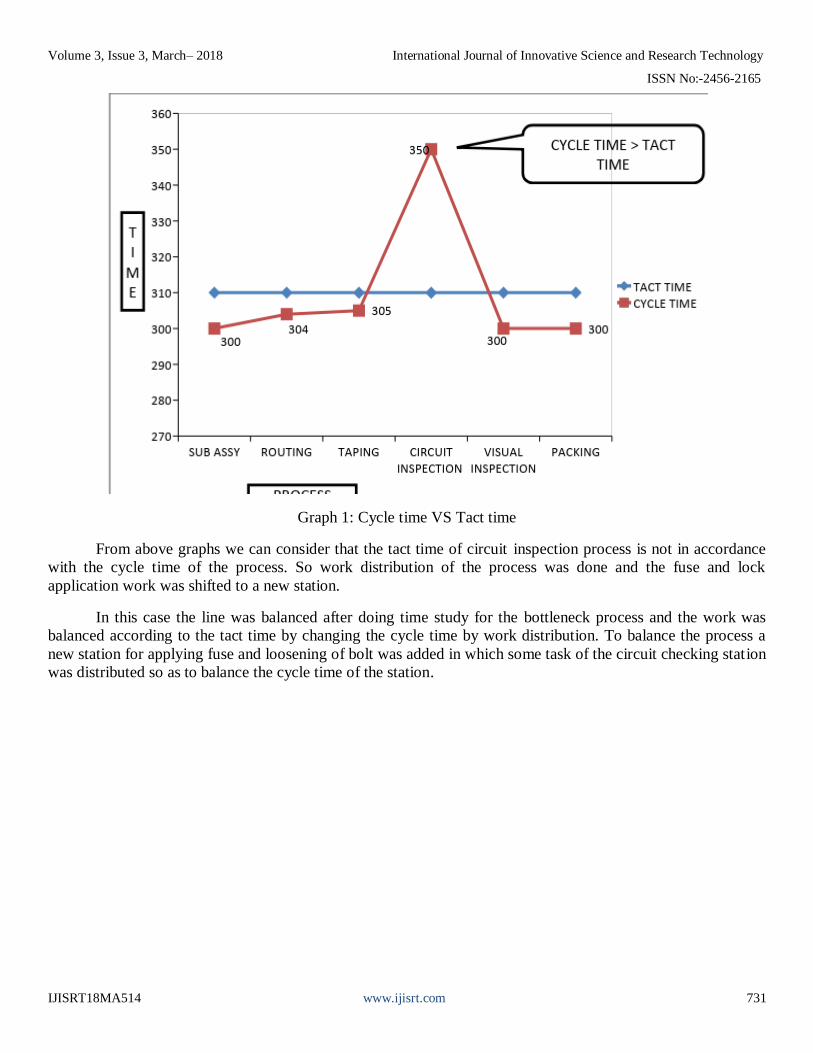
Graph 1: Cycle time VS Tact time
From above graphs we can consider that the tact time of circuit inspection process is not in accordance
with the cycle time of the process. So work distribution of the process was done and the fuse and lock
application work was shifted to a new station.
In this case the line was balanced after doing time study for the bottleneck process and the work was
balanced according to the tact time by changing the cycle time by work distribution. To balance the process a
new station for applying fuse and loosening of bolt was added in which some task of the circuit checking station
was distributed so as to balance the cycle time of the station.
Volume 3, Issue 3, March– 2018 International Journal of Innovative Science and Research Technology
ISSN No:-2456-2165
IJISRT18MA514 www.ijisrt.com 732
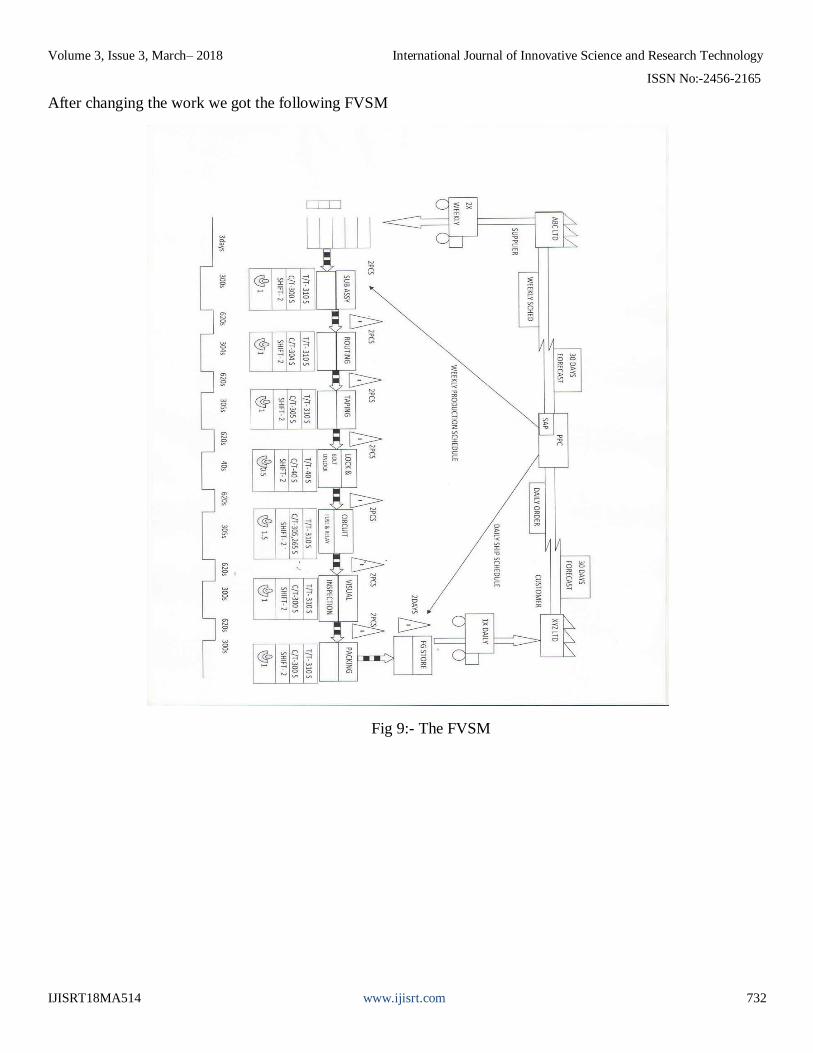
After changing the work we got the following FVSM
Fig 9:- The FVSM
Volume 3, Issue 3, March– 2018 International Journal of Innovative Science and Research Technology
ISSN No:-2456-2165
IJISRT18MA514 www.ijisrt.com 733
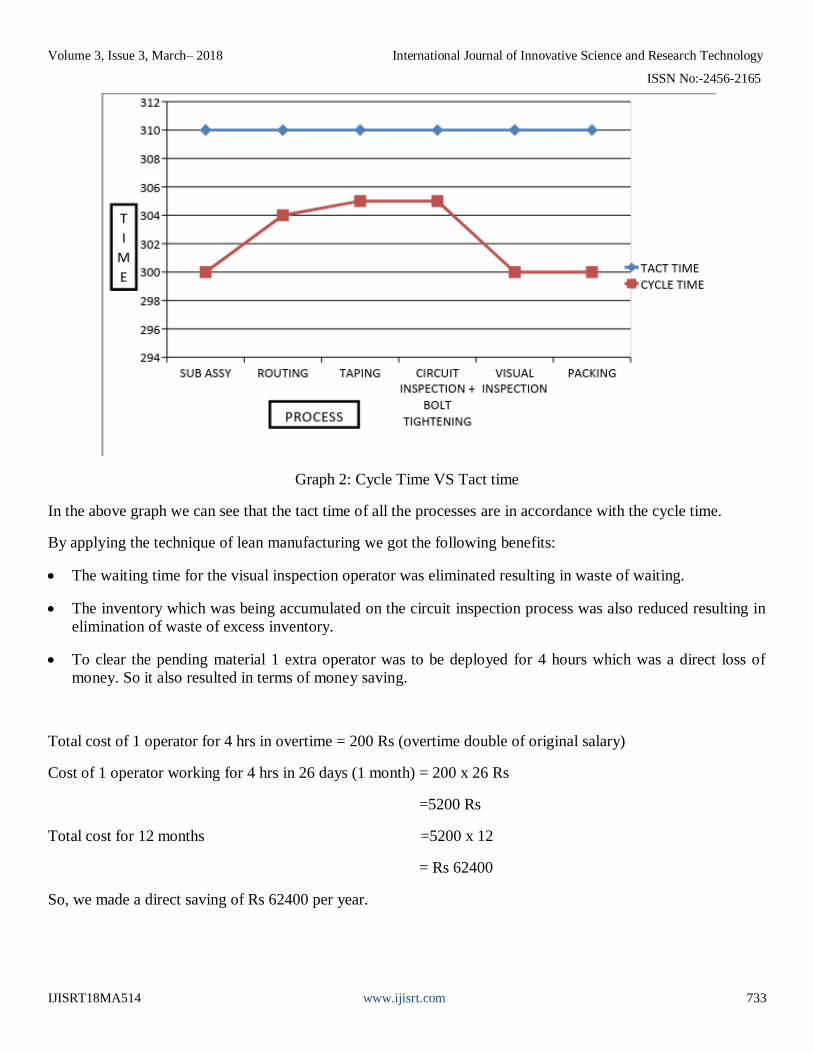
Graph 2: Cycle Time VS Tact time
In the above graph we can see that the tact time of all the processes are in accordance with the cycle time.
By applying the technique of lean manufacturing we got the following benefits:
The waiting time for the visual inspection operator was eliminated resulting in waste of waiting.
The inventory which was being accumulated on the circuit inspection process was also reduced resulting in
elimination of waste of excess inventory.
To clear the pending material 1 extra operator was to be deployed for 4 hours which was a direct loss of
money. So it also resulted in terms of money saving.
Total cost of 1 operator for 4 hrs in overtime = 200 Rs (overtime double of original salary)
Cost of 1 operator working for 4 hrs in 26 days (1 month) = 200 x 26 Rs
=5200 Rs
Total cost for 12 months =5200 x 12
= Rs 62400
So, we made a direct saving of Rs 62400 per year.
Volume 3, Issue 3, March– 2018 International Journal of Innovative Science and Research Technology
ISSN No:-2456-2165
IJISRT18MA514 www.ijisrt.com 734
VII. CONCLUSIONS AND FUTURE WORK
From the analysis and study done in balancing the process by applying the value stream mapping
process, it was concluded that Lean manufacturing is an effective technique of improving the process. Here, we
improved the production process and reduced wastes like of inventory and waiting.
Lean manufacturing is an effective technique in removing wastes which hampers the process. Main
method of Lean is not the tools, but the reduction of three types of waste: muda ("non-value-adding work"),
muri ("overburden"), and mura ("unevenness"), to expose problems systematically and to use the tools where
the ideal cannot be achieved. Lean implementation is therefore focused on getting the right things to the right
place at the right time in the right quantity to achieve perfect work flow, while minimizing waste and being
flexible and able to change. The main aims of lean to make the work simple enough to understand, do and
manage.
The core of lean is founded on the concept of continuous product and process improvement and the
elimination of non-value added activities. "The Value adding activities are simply only those things the
customer is willing to pay for, everything else is waste, and should be eliminated, simplified, reduced, or
integrated". Improving the flow of material through new ideal system layouts at the customer's required rate
would reduce waste in material movement and inventory. A continuous improvement mindset is essential to
reach the company's goals. The term "continuous improvement" means incremental improvement of products,
processes, or services over time, with the goal of reducing waste to improve workplace functionality, customer
service, or product performance.
"For improvement to flourish it must be carefully cultivated in a rich soil bed (a receptive organization),
given constant attention (sustained leadership), assured the right amounts of light (training and support) and
water (measurement and data) and protected from damaging."
Volume 3, Issue 3, March– 2018 International Journal of Innovative Science and Research Technology
ISSN No:-2456-2165
IJISRT18MA514 www.ijisrt.com 735
REFERENCES
[1]. "Problems continue at Heathrow's Terminal 5", New York Times, March 31, 2008 article [1]
[2]. (Charles Buxton Going, preface to Arnold and Faurote, Ford Methods and the Ford Shops (1915))
[3]. Andrew Dillon, translator, 1987. The Sayings of Shigeo Shingo: Key Strategies for Plant Improvement.
[4]. Bailey, David (24 January 2008). "Automotive News calls Toyota world No 1 car maker". Reuters.com.
Reuters. Retrieved 19 April 2008.
[5]. Bennett, Harry; with Marcus, Paul (1951). We Never Called Him Henry. New York: Fawcett Publications.
LCCN 51036122.
[6]. Ford, Henry; with Crowther, Samuel (1922). My Life and Work. Garden City, New York, USA: Garden
City Publishing Company, Inc. Various republications, including ISBN 978-1-4065-0018-9. Original is
public domain in U.S.
[7]. Holweg, Matthias (2007). "The genealogy of lean production". Journal of Operations Management 25 (2):
420–437. doi:10.1016/j.jom.2006.04.001.
[8]. Krafcik, John F. (1988). "Triumph of the lean production system". Sloan Management Review 30 (1): 41–
52.
[9]. Ohno, Taiichi (1988). Toyota Production System. Productivity Press. p. 8. ISBN 0-915299-14-3.
[10]. Ruffa, Stephen A. (2008). Going Lean: How the Best Companies Apply Lean Manufacturing Principles
to Shatter Uncertainty, Drive Innovation, and Maximize Profits. AMACOM. ISBN 0-8144-1057-X.
[11]. Spear, Steven; Bowen, H. Kent (September 1999). "Decoding the DNA of the Toyota Production
System". Harvard Business Review.
[12]. Suprateek Roy (1988), p 4
[13]. Womack, James P.; Daniel T. Jones (2003). Lean Thinking. Free Press.
[14]. Womack, James P.; Daniel T. Jones, and Daniel Roos (1990). The Machine That Changed the World.
[15]. http://en.wikipedia.org/wiki/Lean_manufacturing
[16]. http://www.lean.org/whatslean/
[17]. www.mindtools.com
[18]. www.lean-manufacturing-japan.com
Related Documents