Lean Manufacturing in a Mass Customization Plant: Inventory Correction and Shortage Measurement by Sumant Raykar B.E. in Mechanical Engineering, University of Pune, 2009 Submitted to the Department of Mechanical Engineering in partial fulfillment of the requirements for the degree of Master of Engineering in Manufacturing at the MASSACHUSETTS INSTITUTE OF TECHNOLOGY September 2011 ARCHIVES MASSACHUSETTS INSTWIUTE OF TECHNOLOGY NOV 0 1 2011 LiBRARIES C Sumant Raykar, 2011. All rights reserved. The author hereby grants MIT permission to reproduce and distribute publicly paper and electronic copies of this thesis document in whole or in part A uthor.................................... ........................ ....... Sumant Raykar Department of Mechanical Engineering August 16, 2011 C ertified by ........................ (. ............................. Stephen C. Graves Abraham J. Siegel Professor of Management Science Thesis Supervisor Acceptedby................... .. .. .-... . . ...... IDavid E. Hardt Ralph E. and Eloise F. Cross Professor of Mechanical Engineering Chairman, Committee for Graduate Students

Welcome message from author
This document is posted to help you gain knowledge. Please leave a comment to let me know what you think about it! Share it to your friends and learn new things together.
Transcript

Lean Manufacturing in a Mass Customization Plant:Inventory Correction and Shortage Measurement
by
Sumant RaykarB.E. in Mechanical Engineering,
University of Pune, 2009
Submitted to the Department of Mechanical Engineeringin partial fulfillment of the requirements for the degree of
Master of Engineering in Manufacturing
at the
MASSACHUSETTS INSTITUTE OF TECHNOLOGY
September 2011
ARCHIVES
MASSACHUSETTS INSTWIUTEOF TECHNOLOGY
NOV 0 1 2011
LiBRARIES
C Sumant Raykar, 2011. All rights reserved.
The author hereby grants MIT permission to reproduce anddistribute publicly paper and electronic copies of this thesis document
in whole or in part
A uthor.................................... ........................ .......Sumant Raykar
Department of Mechanical EngineeringAugust 16, 2011
C ertified by ........................ (. .............................Stephen C. Graves
Abraham J. Siegel Professor of Management ScienceThesis Supervisor
Acceptedby................... .. .. .-... . . ......
IDavid E. HardtRalph E. and Eloise F. Cross Professor of Mechanical Engineering
Chairman, Committee for Graduate Students

This page left blank intentionally.

Lean Manufacturing in a Mass Customization Plant:Inventory Correction and Shortage Measurement
Sumant Raykar
Abstract
This thesis documents the application of the principles of lean manufacturing and supply chainplanning at Varian Semiconductor Equipment Associates. The company's products are highlycustomizable, and the production schedules change daily to comply with customer requests.
In situations where variability - whether in product features or logistics - is high, leanimplementation is difficult. Nonetheless, use of lean manufacturing techniques like Value StreamMapping helps to highlight problems. Value Stream Maps of Varian's processes were drawnwhich revealed that the main problem was chronic raw material shortages. Further investigationrevealed improper supply chain and inventory management. Moreover, existing metrics for partsshortage measurement were found to be lacking in accuracy.
Based on the principles of postponement, it is recommended that the work-in-process inventorybe reduced. The demand can be met by holding the inventory in raw material form instead, andby improving stocking policies. Also, a better system for shortage measurement wasrecommended, and a framework for its data collection and analysis was presented. We projectthat these recommendations will lead to an efficient and lean system of manufacture.
Thesis Supervisor: Stephen C. Graves

This page left blank intentionally.

Acknowledgements
I would like to take this opportunity to thank all those who made this project possible,pleasurable and profitable, and also to those who made my time at MIT unforgettable.
First of all, I thank all the people at Varian Semiconductor Equipment Associates. I thank ScottSherbondy, Vice President of Manufacturing, and Dan Martin, Sr. Manager of ManufacturingEngineering for providing us this fantastic opportunity. I would especially like to thank Dan formaking available the resources, for linking us with others in the company, and for patientlyanswering the slew of questions we asked him. I would also like to thank Tom Faulkner forbeing our lean guru, and for being the driving force behind our work along with Dan. Our projectwould have been impossible without the help of Varian's engineers and managers. I speak ofMike Rathe, Richard Van Kirk, Gaetano Peritore, Ron Dognazzi, Bob Cook, Chris Pontes, AdamMahoney, Nick Bukhovko, Cathy Cole and Tim Webber. I also thank the shop floor operatorsfor their generous cooperation and support on this project.
I would also like to thank our advisor Dr. Stephen Graves for his guidance on this project.Thanks also go to Prof David Hardt and Dr. Brian Anthony for being great mentors, andJennifer Craig for helping us put our work together in this thesis.
This project would not have been possible without the help of my team mates MoojanDaneshmand and Jerry Chen. It definitely has been one of the most fruitful and enjoyablecollaborations I have been part of.
Big thanks also go to my family and friends who helped me keep my sanity at MIT. Thanks tomy friends in the M.Eng program for all the great sports, dinner and entertainment events, andfor being constant companions at MIT. Finally, big thanks to my friends here and in India, foralways being there for me.
Last but not the least goes a thank you to the cities of Boston and Cambridge, which made mystay here the most enriching period of my life. I shall always call them home.

This page left blank intentionally.

Table of Contents
1. Introduction ..................................................................................................................... 12
1.1 The Sem iconductor Equipment Industry ............................................................................. 12
1.2 Company background ............................................................................................................ 13
1.3 Company Need ...................................................................................................................... 15
2. D escription of O perations at V SEA ............................................................................ 17
2.1 Company-Specific Language.................................... .......... .............................................. 17
2.2 M anufacturing Operations ................................................................................................... 19
3. Problem Statem ent...........................................................................................................24
3.1 Unnecessary Non-Value-Added operations......................................................................... 24
3.2 Inefficient Information and M aterial Flow .................................... 27
3.3 Testing Processes ................................................................................................................... 30
3.4 M aterials M anagement ........................................................................................................... 32
3.5 Summary ............................................................................................................................... 40
4. R eview of Theoretical Background ................................................................................. 41
5. M ethodology.....................................................................................................................43
5.1 Prelim inary analysis ............................................................................................................... 43
5.2 Inventory Correction M ethodology......................................... 47
5.3 Supply Chain Scorecard M ethodology................................................................................ 51
6. Inventory C orrection A nalysis ..................................................................................... 58
6.1 Section overview .................................................................................................................... 58
6.2 Analysis of W IP data.............................................................................................................. 58
6.3 Solution for Inventory Correction.................................. .... .......................................... 64
6.4 Costs and Benefits Analysis ............... ............... .............................................. 64
7. Supply C hain Scorecard A nalysis .............................................................................. 66
7.1 Section Overview ................................................................................................................... 66
7.2 Analysis of Supply Chain Scorecard.................................................................................. 66
7.3 Solution for Supply Chain Scorecard.................................................................................. 68
7.4 Costs and Benefits Analysis ............................................................................................... 73
8. C onclusion and Future W ork...................................................................................... 75

8.1 Recomm endations for Inventory Correction ....................................................................... 75
8.2 Recomm endations for Supply Chain Scorecard .......................................................... ..... 75
8.3 Future W ork...........................................................................................................................75
8.4 Summary of Ideal and Future State Value Stream M aps ..................................................... 77
9. R eferences ........................................................................................................................ 78
8

List of Figures
Figure 1: A few modules of a Varian ion implanter machine .................................................. 15
Figure 2: Semiconductor Equipment revenues in billions of dollars, 2007-2012(forecast) ........ 16
Figure 3: Varian's Gloucester facilities illustration (not to scale)......... ............................... 20
Figure 4: Parts sourcing for Module Assembly line from internal suppliers ......................... 27
Figure 5: Material and information flow between Building 80 and the Flow Line ............... 28
Figure 6: Shortages on High and Medium Current tools affected by demand Q3'07 to Q3' l...34
Figure 7: Snapshots of WIP inventory for the 900 Module .................................................. 36
Figure 8: Inventory mix by dollar value in June 2011 ..... ................................................... 50
Figure 9: Kit picking process in the warehouses..... ............................................................. 52
Figure 10: Shortage ticket generation process ...................................................................... 52
Figure 11: Supplier on Tim e to N eed logic ..... ..................................................................... 55
Figure 12: Measurement of shortages using shortage ticket data ..... ..................................... 57
Figure 13: Inventory and shortages against number of builds .............................................. 59
Figure 14: Inventory and shortages over tim e ..... ................................................................. 61
Figure 15: Inventory and Utilization against number of builds ............................................ 63
List of Tables
Table 1: V arian's product offerings....................................................................................... 14
Table 2: Production areas and their tasks .............................................................................. 21
Table 3: Top contributors to QNs filed for 90' and Terminal Modules ................................. 31
Table 4: Top shortage instances observed on the 90' module and their duration ................... 33
Table 5: WIP Requirements Calculation.......................................48
Table 6: Reduced WIP Calculation ........................ ................. 60
T ab le 7 : W IP A g in g ................................................................................................................. 62
T able 8: Space saving s ............................................................................................................. 64
Table 9: Summary of shortage tickets data from 2009 to 2011................................................66
Table 10: Summary of shortage tickets data for top shortage contributors from 2009 to 2011 ....67

Table 11: Summary of procurement policies of top shortage contributors from 2009 to 2011 .... 67
Table 12: Comparison of existing and proposed systems of shortage measurement ............... 72
Table 13: Estim ated production lead tim es ........................................................................... 77

This page left blank intentionally.

1. Introduction
This section serves to deliver an overview of the semiconductor equipment industry, background
information about Varian Semiconductor Equipment Associates and the needs of the company at
the point at which the project was conceived. Thereafter, Varian's operations are described. The
product offerings are listed, and the product architecture and functioning of the modules of the
tool are described in short. Finally, the section on the company's needs introduces the problem
posed to us by the company managers.
1.1 The Semiconductor Equipment Industry
Semiconductor wafer manufacture, depending on the manufacturer, requires about 18 different
types of primary equipment for processes like etching, ion implantation, sputtering, chemical
vapor deposition, testing and assembly and packaging. The price of each piece of equipment runs
in the millions of dollars mainly because of complexity of design and manufacture, and the use
of expensive materials. Thus, the cost of building a semiconductor fabricating facility, also called
a 'fab', can be up to $5 billion.
Fabs purchase new equipment either to increase capacity, to change to different wafer sizes or
when starting a new technology line [1]. Each chipmaker has unique 'recipes' or treatments that
it performs on the wafer to get the desired composition of the silicon wafer. Thus, each
chipmaker requires unique pieces of equipment customized to suit specific requirements.
Moreover, the size of the equipment complicates the logistics of installation for the chipmaker
and thus requires the equipment maker to be flexible in terms of shipping dates. Sun [2], Jia [3]
and Konisky [4] cite the high barrier of entry created by the capital intensive nature of the
business as a reason why chipmakers exert so much buyer influence on equipment makers and

why the latter comply with any customer request, at any stage of production. The high level of
customization demanded by customers and the complicated design and size of the equipment
make manual assembly of the final product the only feasible process.
1.2 Company background
1.2.1 Overview
Varian Semiconductor Equipment Associates, Inc. (VSEA) is a designer and producer of ion
implantation machines. Ion implantation constitutes a critical step in the manufacture of
integrated circuits. VSEA was founded in 1975 in Gloucester, Massachusetts by Varian
Associates' acquisition of Extrion Corporation. Today Varian is the world's leading ion
implantation equipment company with a dominant market share in the high current, medium
current, high energy and plasma doping equipment categories. Their customers include the
world's biggest chipmakers including amongst others Intel, Samsung, IBM, Sony, Texas
Instruments and Global Foundries. VSEA has its own research and development function and
manufacturing facilities, and it markets and services its equipment worldwide [5].
1.2.2 Product Offerings
Ion implantation or doping is employed in semiconductor fabrication to introduce charge carriers
in the crystal lattice of the semiconductor [6]. Varian's products are categorized based on the
energy intensity and level of doping the product delivers. The product families are viz. High
Current (HC), Medium Current (MC), High Energy and Ultra High Dose or VIISTA PLAD. The
'200 mm' or '300 mm' identifier refers to the size of the wafer which will be processed by the
equipment. The products are referred to as 'machines' or 'tools'. The basic product variants are
grouped in table 1.

Table 1: Varian's product offerings
High Current (HC) Medium Current (MC) High Energy Ultra High Dose (PLAD)
VIISTA HCP VIISTA 81OXP VIISTA 3000 XP VIISTA PLAD
200 mm 200 mm 200 mm 200 mm
VIISTA HCP VIISTA 810XP VIISTA 3000 XP VIISTA PLAD
300 mm 300 mm 300 mm 300 mm
VIISTA 900XPVIISTA HCPv2.0
200 mm
VIISTA HCS VIISTA 900XP
300 mm 300 mm
1.2.3 Product Architecture and Functioning
The product architecture is modular. The modules which constitute an ion implanter are the
beam line module, the end station and the control station. The modules contain mechanical as
well as electronic sub-assemblies. These modules are customizable to certain extent based on
customer specifications.
The beam line module contains foremost an indirectly heated cathode source which ionizes the
dopant gases like Boron or Arsenic. The ions are generated in the form of a beam, and this beam
is modulated by means of powerful magnets and electrostatic lenses. A dose system controls the
exposure time of the beam upon the semiconductor wafer which ultimately determines the ion
concentration of the doped wafer [7].
The end station module contains chambers where a fab engineer can load wafers to be doped. It
also contains mechanisms to take one wafer at a time, expose it at the right position and
orientation to the beam arriving from the preceding beam line module, and to withdraw an
implanted wafer that is to be moved to the next stage of fabrication [7].

The critical parameters which determine the implantation quality are namely wafer orientation,
wafer charge level, vacuum level within the tool, doping energy, wafer temperature and the
number of scans the beam performs upon the wafer. Automated control over these parameters is
achieved by means of the control system, which consists of computer hardware and software.
The control system also provides real time information useful in production, as well as in
diagnostic and maintenance tasks [7]. Figure 1 shows the modules of a typical Varian machine.
Figure 1: A few modules of a Varian ion implanter machine
1.3 Company Need
The company executives presented the company situation and a brief statement on what they
expected the project should address at that point [8]. The semiconductor industry was witnessing
growth in revenues after a collapse in sales in the years 2008 and 2009. The industry witnesses
cyclic periods of growth and slump. The data from 2010 revealed that the industry was renewing
itself, and the forecast for 2011 and 2012 was expected to exceed pre-2008 levels. Figure 2
shows the trend from 2007 and forecast till 2012 [1].

Forecast Forecast
Figure 2: Semiconductor Equipment revenues in billions of dollars, 2007 - 2012 (forecast)
At this juncture, the company wanted to meet the growing demand not by making a capital
investment to expand their facilities, but by weeding out the inefficiencies in their operations.
Specifically, the company wanted the team to help identify methods of reducing the labor hours
and cycle time required to build a tool. The company had some prior experience in applying
techniques of lean manufacturing to remove wasteful processes from their operations. The
manufacturing engineering team now wanted to do a more detailed analysis of the operations,and implement improved systems and processes with the objective of reducing the costs,resources and time required in manufacturing.
Worldwide sales of Semiconductor Equipment$50 $45.81 $47.14
$45 $42.77$39.5
$40
$35
$30 -$29.52
$25 -
$20$15.92
$15
$10 - --2007 2008 2009 2010 2011 2012

2. Description of Operations at VSEA
2.1 Company-Specific Language
Company and industry terminology make up a large part of daily dialogue at Varian. It is
essential to introduce some terms which may occur often in this thesis.
2.1.1 Types of Orders
A Machine Order (or Tool Order) is an order placed by a customer. These orders are received
by sales representatives. The machine order will contain information about the shipping date,
terms and conditions, and price. Each machine order may include specific requirements and
different options specified by a customer.
A Sales Order is the order placed by a customer for spare parts. Some sales orders may be
assigned higher priority than others. An Emergency Order or EMO is the highest priority item.
A Production Build Order (PBO) is a very detailed machine order. It is used by the operators to
know which configuration options are requested by the customer. A PBO can change upon
customer request at any time 10 days prior to the shipping 'freeze period', during which changes
can no longer be made to the PBO.
A Shop Order is issued to an operator to build a single assembly or to perform machine testing.
Shop orders have different levels. For example, at the higher level, a single shop order can be
issued for the assembly of an entire module. At the lower levels, shop orders will be issued to
different sub-assemblers for each subassembly in the tool.
An Engineering Change Order (ECO) is issued when a design change is to be implemented. The
design change occurs for various reasons such as machine upgrade, part quality issue especially

at customer site or supplier design change. Once an ECO is approved, the change is applied to
the machine and it will be a part of the procedure thereafter.
2.1.2 Bill of Materials
A Bill of Materials (BOM) is the list of all the parts required for the assembly of a tool. It
specifies the quantity of each part, its storage location and the kit code under which the part is
grouped. The BOM of a typical tool contains around 1200 parts depending on its configuration
and options requested by a customer.
2.1.3 Kit Codes
Since the BOM of a tool may contain over 6000 parts, it is impossible to keep these parts on the
shop floor. Most of the parts needed are housed in company or supplier warehouses. These parts
can be ordered or 'pulled' from the warehouses by the shift supervisor when they are needed,
ordering in advance to account for the lead time of delivery of the parts. To simplify the pulling
of parts from warehouses, parts have been grouped in kit codes which roughly correspond to the
build procedure. A kit for a module can contain anywhere from 1 to 300 parts. The parts have
been grouped roughly in such a manner that parts in one kit have to be assembled closer in time
to each other than parts in other kits. There are two types of kit codes - Z-pick kit codes, and Z-
pick lists. Z-pick codes are used for parts stored in an external storage location, called Building
80 and the kits are usually pulled 24 hours before module assembly is begun. The Z-pick lists are
kits of parts stored in an indoor location. These are the parts needed for the base configuration of
the machine. The modules each require about 15 kits. The large size of kits reduces visibility
about shortages in a kit, and also causes operators to search for a particular part for a long time.
Daneshmand's thesis [9] addresses in detail the problems associated with kit codes, and proposes
some solutions.
2.1.4 Other terms

A Laydown Date is the date on which a module assembly is set to begin. The first step in the
assembly of any module consists of laying down a Higher-Level Assembly (HLA) frame in the
assembly bay. The production schedule is driven by MRP logic, and back-calculates a scheduled
laydown date based on a shipping date, and planned lead times. However, the production
supervisor makes the day-to-day decision on which tool is to be laid down, and on which date,
subject to last minute scheduling changes and parts availability.
Varian'sfiscal calendar for a year begins on October 1 of the previous calendar year, and ends
on September 30 of that year. The production planning and control as well as financial reporting
are done on a quarterly basis, starting on October 1 of the fiscal year.
A Purchase Order is an order for raw material released to a supplier. A purchase order contains
an itemized list of parts needed, their quantity and the agreed price of a part. When a part is
delivered by a supplier, the receipt is checked against the purchase order to see if the delivery is
complete or not. It is common for items on the purchase order to be delivered at different times
by the supplier. The status of purchase orders can be checked in the company's enterprise
resource planning system, SAP.
2.2 Manufacturing Operations
2.2.1 Overall operations
Varian manufactures a number of different products from its single manufacturing facility in
Gloucester. The company receives either pre-fabricated parts or sub-assemblies from its global
supplier base. The facility first assembles different sub-assemblies and the different modules
which constitute the machine. Thereafter, the testing of the tool can be done in two ways. If the
customer orders a 'Full Build' machine, the different modules of the machine are assembled in a
clean room, and the machine as a whole is tested. After testing, the machine is disassembled into
the modules, which are then shipped separately in different crates. The machine must then be
assembled on site. To reduce the time which went into assembling and then disassembling the

machine, Varian began a new system called Smart Ship. Under this system, the individual
modules are tested separately and then shipped in different crates. This method saves about 400
man-hours in assembly time. Presently, about 75% of the customer orders adopt the Smart Ship
process, and the remaining 25% are built as per Full Build procedures, because of customer
mandate.
2.2.2 Production Areas
The production floor is divided into different zones that manufacture and test different sub-
assemblies and modules. The division of work content is summarized in table 2. In the next
section, the Flow Line zone is explained in greater detail. Figure 3 depicts the production areas
and the warehouses at Varian's Gloucester facilities.
Figure 3: Varian's Gloucester facilities illustration (not to scale)
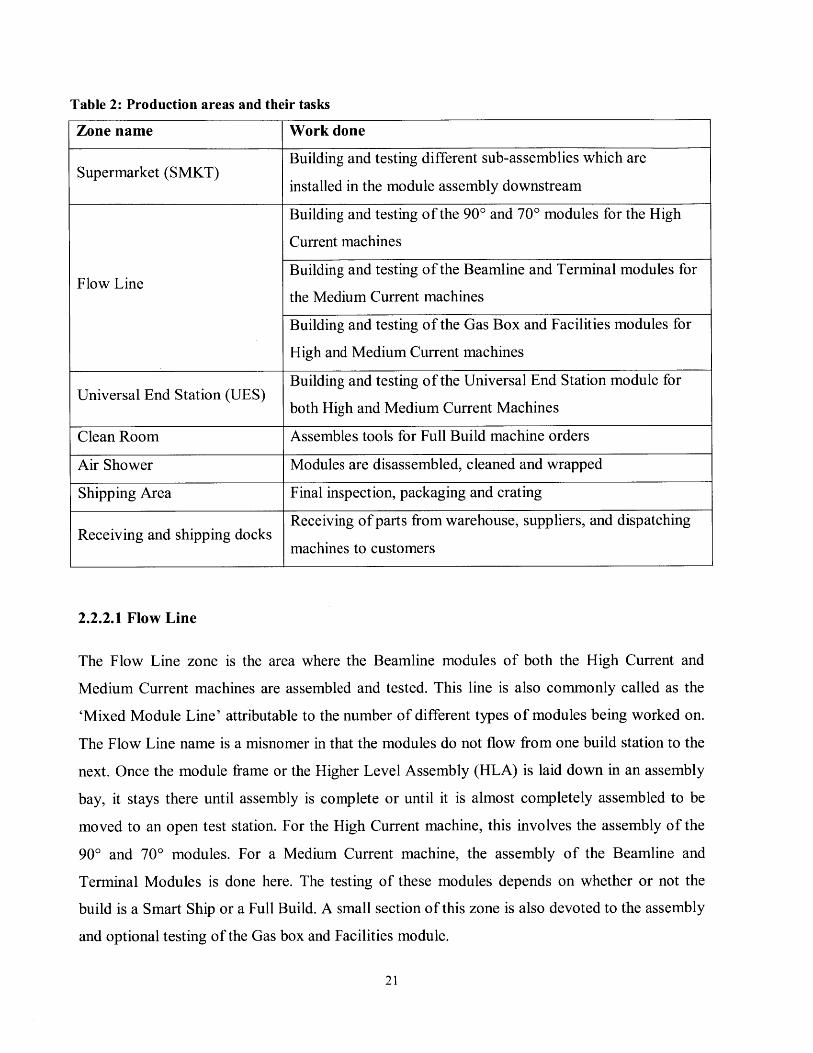
Table 2: Production areas and their tasks
Zone name Work done
Building and testing different sub-assemblies which are
installed in the module assembly downstream
Building and testing of the 90' and 70' modules for the High
Current machines
Flow Line Building and testing of the Beamline and Terminal modules for
the Medium Current machines
Building and testing of the Gas Box and Facilities modules for
High and Medium Current machines
Building and testing of the Universal End Station module for
both High and Medium Current Machines
Clean Room Assembles tools for Full Build machine orders
Air Shower Modules are disassembled, cleaned and wrapped
Shipping Area Final inspection, packaging and crating
Receiving and shipping docks Receiving of parts from warehouse, suppliers, and dispatching
machines to customers
2.2.2.1 Flow Line
The Flow Line zone is the area where the Beamline modules of both the High Current and
Medium Current machines are assembled and tested. This line is also commonly called as the
'Mixed Module Line' attributable to the number of different types of modules being worked on.
The Flow Line name is a misnomer in that the modules do not flow from one build station to the
next. Once the module frame or the Higher Level Assembly (HLA) is laid down in an assembly
bay, it stays there until assembly is complete or until it is almost completely assembled to be
moved to an open test station. For the High Current machine, this involves the assembly of the
90' and 70' modules. For a Medium Current machine, the assembly of the Beamline and
Terminal Modules is done here. The testing of these modules depends on whether or not the
build is a Smart Ship or a Full Build. A small section of this zone is also devoted to the assembly
and optional testing of the Gas box and Facilities module.
The production is done in three shifts: first shift and second shift which work regular hours on
weekdays, and a 'fourth' shift which works longer hours on the two days of the weekend and one
day of the week. Note that the Flow Line does not operate daily during the third shift of
production. The High Current machine's 90' module and the Medium Current machine's
Terminal module involve the most work content, and thus take longer to assemble and test. The
assembly and testing of these modules were focused on to identify manufacturing bottlenecks.
The build and test for a 90' module requires on average about 5 and 4 days respectively,
depending on the configuration. The corresponding times for a Terminal module are 4 and 3 days
respectively. However, high level of product customization, last minute customer requests,
material shortages, and testing failure and rework cause the production cycle time to be highly
variable, and nearly impossible to predict.
The mixed module line is not the bottleneck of the entire process. The bottleneck is actually the
testing and assembly of the Universal End Station module. However, the mixed module
production line is the focus of our project. This is because improvements in the mixed module
area can potentially free up space and labor which can be devoted to the Universal End Station
which has significantly more work content and requires greater resources. Freeing up the
resources for the End Station can then bring down the cycle time of this bottleneck process,
thereby increasing throughput. Thus, the capacity can be increased without expanding the
facility.
2.2.3 Part Storage Locations
Varian houses its parts inventory at different locations within its premises. These locations are
namely Building 80 or Warehouse, Building 70, Building 5 and MOD storage area. Building 80
carries inventory of relatively small parts required on a daily basis at the Supermarket or the
module assembly lines. Building 5 and Building 70 stock large sized parts like machine
enclosures. The MOD storage area carries parts needed on the Flow Line and is located close to
the Flow Line in the same building. The inventory in these storage locations is driven by a

Materials Requirement Planning (MRP) system. Knowing the shop order, the machine delivery
date, and the production lead time, the MRP system calculates when a particular part is needed to
be delivered to the production floor from the storage location. It takes into account the lead time
of the suppliers and provides an estimate of how much inventory is needed on hand to fulfill the
expected demand.
The inventory in these storage locations is pulled by means of the kit codes. Varian's suppliers
also carry some inventory on their end. Presently, about 55% by value of the total Cost of Goods
Sold (COGS) is controlled by a Kanban system. Under the Kanban system, the supplier gets a
signal to deliver a specific part only when it is used up during the production process.

3. Problem Statement
In this section, the operational problems discovered by first-person observations and by
preparing value stream maps are described. The focus of the observations was on the assembly
and testing for the High Current (HC) 90' module and the Medium Current (MC) Terminal
module. The intent in the observations was to identify non-value added activities and inefficient
work practices which caused more time to be spent in the production of the tool than warranted
by the work instructions.
After brief descriptions of some of the major problems, the focus will be directed on the issue of
material shortages which was found to be the biggest problem. The rest of the thesis will be
devoted to documenting this problem and testing the proposed solution. Some of the other
problems are addressed in Chen's thesis [10] and Daneshmand's thesis [9].
The problems observed in Varian's operations can be grouped into the following categories:
1. Unnecessary Non-Value-Added operations
2. Inefficient information and material flow
3. Testing Procedure
4. Materials Management
3.1 Unnecessary Non-Value-Added operations
Non-value added (NVA) operations are those which do not add any value to the product. These
can be of two types - necessary and unnecessary. Necessary NVA operations are those which for
various reasons cannot be entirely eliminated (e.g.: inspection, transporting parts). Unnecessary
NVA tasks are those that can be eliminated without affecting the process or diminishing the

value of the product. Identifying and eliminating these operations is valuable in terms of
increased efficiency of production. The main contributors to unnecessary NVA were found to be
- Work Procedures in Flow line; Parts Searching Process; Supplier Quality Issue; and Repetitive
kitting and auditing.
3.1.1 Work Procedures in Flow line
As described in section 2.2.1, the operations in the flow line can be mainly divided into two
sections - assembly and testing. The assembly of both the High Current 900 module as well as
that of the Medium Current Terminal module contains 10 steps, each of which contains many
sub-steps. In total, both assembly procedures contain hundreds of sub-steps. The work
instructions for these procedures are documented in the company's log book system.
Although the instructions of each sub-step are all understandable, they are not standardized
enough for an operator to know the exact sequence of operations inside each sub-step. In other
words, with the current procedure, operators can still carry out each sub-step in various ways.
Some operators can do some of the same operations in a more efficient manner taking far less
than stipulated labor hours. Also, if done in a wrong way, some sub-steps would require several
hours of rework. Hence, the other ways of doing the same operations are considered to contain
unnecessary NVA activities.
3.1.2 Parts Searching Process
As mentioned in section 2.1.3 parts are grouped by kit codes and pulled from the warehouses by
the shift supervisor. The kits which are pulled arrive on the Flow Line in bins and boxes without
any specific label. Thus in the current situation, the operators need to look through all the bins
and boxes in order to find a part among all the kits which got delivered on the line. Additionally,
since there is no shortage notification system along with the kits delivered, the operators need to
look in all the bins before detecting that the kit is incomplete. No value is added during the
searching process, and it can be eliminated if there is a proper part organizing system and
improved communication of material flow. Daneshmand's thesis [9] details this problem.

3.1.3 Supplier Quality Issues
Except for the sub-assemblies that come from Supermarket area, all the parts needed on the
assembly line are from third party manufacturers. The materials and parts that come from the
suppliers are often not in a ready-to-assemble state. Most of the time, the unclean parts need to
be taken apart and cleaned in order to avoid potential rework. Also, parts coming from the
suppliers still carry their packaging material on them. Line operators spend a lot of time
removing the packaging boxes, wrappings and shipping attachments.
In addition, some materials have quality issues. Thus, extra non-assembly work like tapping,
filing and sanding is necessary before an assembly can be done correctly. These cleaning and
reworking operations can be eliminated if all the suppliers can offer clean parts that meet the
design. Hence they are also deemed as unnecessary non-value-added operations.
3.1.4 Repetitive Kitting and Auditing
Some kits go to the flow line after being pulled from the warehouse, and do not get assembled on
the modules. These kits are shipped with either the 90' module or the Terminal module directly
to the customer after the module is fully assembled. Assembly operators audit the kits to ensure
their completeness. Since the parts are already counted and checked at the warehouse when the
material handler picks those kits, this auditing work on the flow line is considered as repetitive
work.
In addition, at times the operators need to add parts and hardware to some of the kits. The
operator opens the kit, audits them and adds the hardware. Since this hardware is stored at both
the flow line area and the warehouse area, it can be added to the kits when the kits get picked at
the warehouse. Since the kits will be counted twice at two different locations, the double
counting is deemed as an unnecessary NVA task.

3.2 Inefficient Information and Material Flow
The material needed for assembly on the mixed module line comes from three sources viz. the
Supermarket area, external storage locations Buildings 80, 5 and 70, and the MOD storage area
on the shop floor. As Figure 4 shows, the Flow Line uses three different communication systems
- MRP, Z-pick and Z-pick List - to pull material from the three different sources.
Supermarketsub-assemblies
4
Bldgs. 80, 5 & 70Storage Module MOD Stc
Z-pick Kits Assembly Z-pick
Figure 4: Parts sourcing for Module Assembly line from internal suppliers
A)rageList
The parts from the supermarket area are pulled using the MRP system based on the modules'
scheduled shipping date. The parts from warehouse are pulled by the production manager 24
hours ahead of the actual needed time using Z-pick kit codes, which were discussed in section
2.1.3. Parts stored in the MOD inventory area are grouped and pulled 24 hours ahead of need as
per a Z-Pick List, as discussed in section 2.1.3.
The material flow and its communication between the MOD and Supermarket areas, and mixed
module line are simple and clear because these areas are in close vicinity of the mixed module
line. However, the material flow from the other warehouses, especially Building 80 is

complicated. The problems concerning material flow from Building 80 are discussed in section
3.2.1.
3.2.1 Warehouse Material Flow
Figure 5 shows the material and information flow between Building 80 and the Flow Line.
SAP
4.---------------
Coordinator 2)
Shortage / ShortageRack / list
(2) %Y 1 /\ II1
- Kits Deliver-*
2)-,
Bldg. 80 Module Modulestorage Assembly Testing
- 2 (1),(3)Material Flow 1-Assembly
- -- + Information Flow (1)-Testing
- - - + Inefficient
Figure 5: Material and information flow between Building 80 and the Flow Line
The current workflow and its communication system have several elements in the network. The
main elements in the system are: the warehouse, the assembly bay, the testing bay, the shortage
rack, the shortage list and the SAP system.
After material is pulled by the production supervisor using the kit codes, the material handler
first picks the parts for the kits, and the kits are delivered by truck from warehouse to flow line
approximately 12 times a day. When the material handler picks the parts for the kits, some parts

might be out of stock at the time of picking. In such a case, the material handler records the
shortage situation, but still picks and delivers the incomplete kits to the flow line. The missing
parts will be delivered to the flow line once the warehouse receives those parts from the supplier.
However, when the incomplete kits are delivered to the flow line, no notification about the
shortage is made to the flow line. When the operators find out some parts are missing from the
kit, they write the shortage information on the shortage list to notify the material coordinator.
Also, when the out of stock parts are made available to the warehouse, they are at times
delivered directly to the machine (path 2 showed in Figure 5) whereas other times they are
delivered to a shortage rack (path 1 showed in Figure 5). Whether the parts will be delivered to
the tool or the shortage rack depends on the operator who works at receiving area at the flow
line. When the missing parts are delivered to the shortage rack rather than directly to the tool, no
notification is made to the assembly bay. Thus, the operator needs to frequently check the
shortage rack to see if the needed part has arrived (path 1 in Figure 5).
3.2.2 Testing Bay Material Flow
During module testing, the parts which fail need to be replaced, and are pulled by test
technicians. There are several different paths of pulling and receiving the material. When the part
need is not urgent, the test technician sends the request through the SAP system, and waits for
the warehouse to deliver the parts to the testing bay. When the test technician needs the parts
urgently, he or she will call the material coordinator and the coordinator will call a 'hotline' to
request the warehouse to deliver the parts with the next scheduled truck (path (1) showed in
Figure 5). At the highest level of urgency, the test technician will use the parts from the kits
delivered to assembly, and make note of it on the shortage list to communicate this to both the
material coordinator and the assembly operator (path (2) showed in Figure 5).
In either case, the test technician sends a request for parts through the SAP system (path (3)
showed in Figure 5). Since there are three paths of communication, it is confusing for both

material coordinator and test technician. In the instance that the test technician chooses to get
parts from the assembly bay, it causes delays to the upstream assembly process.
3.3 Testing Processes
Close observations of the testing process revealed that the process had a lot of avoidable non-
value added activity. Also, there are several tests done at the Supermarket to ensure the quality of
the various sub-assemblies, which are repeated at the 90' module test bay. Currently, the first
pass yield of the process is 0%. This means that no machine passes testing without having a
quality incident of one form or the other, and all of them need rework to some extent. The
sections below will talk about each of the following issues in more detail.
1. Hook-up and break-down time
2. Eliminating or reducing testing
3. Rework
3.3.1 Hook-up and Break-Down Time
The process of connecting the machine to the test fixture and different outlets is called hook-up,
and the disconnection of these after testing is called break-down. The hook up and break down
processes can take up to 9 hours altogether. These 9 hours do not add any value to the machine
but they are unavoidable steps. Investigating these steps in more detail and probing ways to do
the same job in shorter time will have value for the company and reduce the lead time for the
testing process.
3.3.2 Eliminating or Reducing Testing
Certain sub-assemblies built in the Supermarket area are tested there before being forwarded to
the Flow Line. Consider the example of the Quad 1, Quad 2 and Quad 3 sub-assemblies of the

90' module. The Quads 1, 2 and 3 pass a Gauss test in the Supermarket after being built and are
then delivered to the Flow Line. After the 90' module is built and moved to the test bay, the
same test is conducted at the 900 module test bay. Thus, the test procedure at the 90' module test
bay seems redundant. Comparing the test procedures at the Supermarket sub-assembly area and
the 90' test bay to identify differences can be beneficial. If there is no major difference, then the
test procedure at the 900 test bay can be eliminated.
Also, the gas box assembly is common to both the 900 module and the Terminal module. For a
90' module, the gas box is tested in its sub-assembly zone, and then moved downstream.
However, for the Terminal module, the gas box is tested after it is assembled with the Terminal
module. If the gas box for the terminal could be tested earlier at the sub-assembly level, it will
reduce the cycle time directly as the gas box testing could be done in parallel with the Terminal
build process. Moreover, upstream testing of the gas box will reveal problems or quality issues
earlier and it is easier to fix the problems at the sub-assembly level rather than after the gas box
is assembled into the Terminal module.
3.3.3 Rework
Currently all the machines fail one test or the other, and need rework to some extent. Analysis of
the quality notifications (QN) data revealed the top three reasons for testing failures of a 90'
module and Terminal module as shown in table 3.
Table 3: Top contributors to QNs filed for 90* and Terminal Modules
Module Reason 1 Reason 2 Reason 3
900 Module Supplier: 39% In-house manufacturing: 25% Material Handling: 9%
Terminal Module Supplier: 47% In-house manufacturing: 23% Miscellaneous: 7%

Also, many a time a part or sub-assembly fails during testing and has to be replaced. As
mentioned in section 3.2.2 there are several different ways of receiving a failed part. Moreover,
our analysis showed that a majority of the parts which regularly failed were not located close-by,
but in Building 80, which is not located close-by. Every time an operator working in test bay
needs a part replacement, he or she has to go through the complex process described in section
3.2.2. Therefore, the quality issue of a failed part followed by the material flow issues
compounds these problems. This is also an issue which is addressed in Daneshmand's thesis [9]
as a factor to be considered while deciding kit sizes and part storage locations.
3.4 Materials Management
Management of parts and inventory was found to have certain problems at strategic and
operational levels. The main problems observed were as follows -
1. Material shortages
2. High work-in-process (WIP) inventory
3. Unscientific supply chain performance indicators
3.4.1 Material Shortages
Material shortage is a common situation on the production floor and delays production to a large
extent. Not all instances of shortage delay production because operators can work on different
tasks of the module, and then returning to a process on part arrival. However there are some
shortages which hold back production because these out of stock parts or subassemblies are
crucial in the build process.
Several reasons are identified for material shortages. The biggest contributor of the shortages is
unavailability of parts on time from the suppliers. While the uncertain demand and changing
customer orders is a big driver of shortages, Varian also resists holding inventory to offset the
variability. The company prefers carrying the least possible raw materials inventory. This is

because of the nature of the market Varian operates in. Due to the cyclic fluctuations of the
market, any large form of inventory can become a liability if the demand suddenly drops.
Moreover, given the rate of technological change and design changes in this domain, there is a
high risk of obsolescence associated with large inventories. Thus, for reasons of cost and
obsolescence, the company policy is to have the least possible raw material inventory.
Based on the observations of production process over a period of 4 weeks, the instances of
shortage and their duration were documented. This was meant to understand in first person how
often the shortages occur, and how long a machine might be held up waiting for a part to arrive.
These observations revealed that while all machines in the build stage face shortage of some
form or the other, there are some parts which are out of stock more frequently and delay the
build process far longer than other parts. Table 4 lists these parts and sub-assemblies, and how
long the shortage situation existed on an average, based on observations over a period of 4
weeks.
Table 4: Shortage instances observed on the 900 module and their duration
Number of tools which were Average time the shortagewaiting for this part lasted (days)
Beamline manipulator 3 6.66
Resolving assembly 2 6
Source chamber 2 9
D2 Harness (Japanese) 1 3
Dual N2 bleed assembly 1 4
Fiber optic harness 1 5Flange ion 1 4
Japanese A.C Harness 1 8
Raceway Japanese B. L 1 8
Upper ground straps 1 3
XP Cooling kit 1 10
The Logistics department has a metric to measure shortages. Their metric,
laydown', measures the number of parts which are unavailable when required
called
on the
'shorts at
scheduled

laydown date of the machine. The average number of shorts per laydown over the past 9 months
for High Current tools is 29.11 parts and for Medium Current tools it is 29.55 parts. However,
this may not be the most accurate way of measuring the shortages, and this metric will be
discussed in detail in section 3.4.3. Nonetheless, it is a useful indicator of the occurrence of
shortages.
The shortage occurrences depend strongly on customer demand and how fast Varian's suppliers
can ramp up production to meet the demand. Varian has found it difficult to accurately forecast
customer demand. Varian experiences cyclic production swings from 1 tool order per month to
30 tool orders per month within a period of 6 quarters. The number of instances of shortages is
found to follow the rise and fall of demand. Figure 6 shows this. The data have been masked for
reasons of confidentiality.
Builds vs. Shortages
Q3'07 Q4'07 Ql'08 Q2'08 Q3'08 Q4'08 Ql'09 Q2'09 Q309 Q4'09 Q'lO Q21O Q3'1O Q4'10 Ql'll Q2'll Q3'll-a-Tools built - Shortages at laydown -HC -*-Shortages at laydown - MC
Figure 6: Shortages on High and Medium Current tools affected by demand Q3'07 to Q3'11

The shortage of parts causes several problems on the production floor. Firstly, it delays the tool
build process thereby causing a tool to spend longer time as WIP on the floor with no work being
done on it. Tools which stay on the floor longer tend to be worked upon by more operators, and
this carries the risk of quality issues. Finally, it leads to shipping delays to customer. The
company's supply chain score card reveals a 90% on-time tool shipment rating for tools shipped
over past 8 months. Thus, the issue of raw material shortages is an important one and is the one
of the focal points of this thesis.
3.4.2 High Work-In-Process (WIP) Inventory
When there is a material shortage that hinders the progress of assembly, the operators try to work
around the shortage by working on another tool which does not have a shortage. In such a
situation, the lead time of assembly is lengthened because of material shortage. As a result, more
machines need to be laid down in the assembly area to achieve the required throughput rate. This
leads to more space being taken up and more work-in-process (WIP) inventory. Moreover,
greater the number of machines being assembled, greater is the instance of shortages as the
machines will often be waiting for the same parts or subassemblies.
First person observations were performed to document the WIP at different instances of time,
and whether at that instant the tool was being worked upon by one or more operators or whether
it was idle. The team prepared a spreadsheet in which to note down these observations. This is
shown in figure 7.
In the figure, every row represents the WIP situation of the 900 module line. The first 3 columns
show the time at which the observation was made. The next column denotes which shifts were at
work at that time. Each cell with a 6-digit machine number indicates that a machine is laid down
in that bay on the shop floor. The different colors are meant to give a visual indication of the
status of the machine. The key for the colors is as follows -

0% (empty spot or just laiddown)WIP - 1 person working
WIP - 2 persons working
WIP - 3 persons working
WIP - NO person working
Tool build complete
:3U AM 1 1 137899 1379(
Figure 7: Snapshots of WIP inventory for the 90* module
A cursory look over of the figure shows that very often an assembly bay contains a tool but the
tool is not being worked upon at the instant observed. The observation on 6/9/2011 also shows a
tool laid down in an area outside the 90* module bays, but being idle.
Many times a tool can sit idly and not be worked upon because it is not a priority sales order.
Another reason why a tool may be idle is shortages. While not all shortages stop the build

process altogether, the build can no longer be continued if there are too many shortages or if a
critical item runs short. This is observed for the machine number 137899. This machine faced
part shortages throughout, and at times the shortage was critical and the machine had to be kept
idle waiting for the parts to arrive.
There are many problems associated with high WIP. Firstly, having several tools on the floor at
the same time requires more space to be devoted for the build area than warranted for by
customer demand. Secondly, when a tool is in the WIP stage, a customer may make changes to
the original machine order. This disrupts the build process and often causes rework to make the
demanded changes to the tool. The chance of this occurring is greater with a higher WIP when
there are more tools being worked upon. One of the principles of lean manufacturing is to have
the least WIP inventory possible. The reason for this is that higher WIP tends to hide problems
which would otherwise have been seen. Thus the WIP offers a sense of comfort, and prevents the
root causes of operational problems being observed or acted upon. Also, if a quality issue is
discovered down the line, there is a high probability that the other tools in WIP inventory might
also have the same defect, thereby causing a lot of waste to correct the problem. Finally, having a
high WIP with more tools spending longer time on the shop floor reduces the turnaround time
and returns on inventory.
3.4.3 Inaccurate supply chain performance indicators
Varian's Logistics department is responsible for managing the supply chain, and it has some
performance indicators against which their performance is measured. Two main measures related
to shortages are of most concern here -
1. Shorts at laydown
2. Supplier on time to need

3.4.3.1 Shorts at laydown
The Logistics department measures the number of shortages using a software package called
RapidResponse which sources data from Varian's SAP system. The software finds out which
parts are needed for the machine assembly, and detects which parts are unavailable on the
scheduled laydown date. This data is recorded for all tools in a month, and a monthly average of
the number of out of stock parts is calculated. This is the shorts at laydown metric used by the
company.
There are 3 problems associated with how this shortage is measured, which diminish the
accuracy of the data. They are -
1. Changes to the scheduled laydown date
2. Actual need date for a part
3. Exclusion of Kanban parts from the shorts at laydown metric
The scheduled laydown date is subject to changes. It may get shifted earlier or the laydown
might get postponed owing to customer requirements. Thus, counting which parts are in shortage
on a particular scheduled date does not accurately reflect if there is actual demand on the shop
floor for those parts.
Secondly, not all parts are needed on the day of the laydown itself. The build process usually
requires 4 to 5 days depending on the machine configuration, and not all parts are needed on the
1st day or the day of the laydown. In fact, sub-assemblies needed for the tool, which are
assembled in the supermarket area need parts up to 5 days before the tool is laid down. Thus, the
parts needed for this sub-assembly would be needed a few days before the laydown. Likewise,
some parts or assemblies might be needed well beyond the laydown date, and are not required
until then. Thus the short at laydown metric does not measure if the shortage is 'real', that is for
an actual demand or shop order.

Finally, when calculating the shorts at laydown metric, Vendor Managed Inventory (VMI) parts
and Kanban parts are removed from the list of shortages. The VMI parts are removed because
these are mainly low value hardware items like nuts and bolts, which are situated at several bins
on the shop floor, and thus do not really cause delays. The Kanban parts are removed because the
shortages are measured on scheduled laydown date, and not the actual laydown date whereas the
Kanban parts are delivered as per actual laydown date. This exclusion seems reasonable.
However, our analysis of historic shortage data, which is discussed in section 5.3.1 and
summarized in section 7.2.1, reveals that 34.89% of the top 15% shortage contributor parts are in
fact Kanban items. Thus, while the exclusion of Kanban parts from the shorts at laydown metric
is logically consistent, the metric is inherently incorrect, and gives an inaccurate picture of the
shortages.
3.4.3.2 Supplier on Time to Need
This metric is used by Varian to measure what percent of time a supplier delivers parts early or
on time for a machine's scheduled laydown date. Varian's suppliers access a web portal which
shares the MRP data of which parts are needed, in what quantity and by which date. The supplier
can also see how many parts already exist in inventory at Varian's warehouses and can thus plan
its delivery accordingly. Varian measures what percent of time the supplier delivers material
when there in actual requirement for it. If a delivery is received 0-5 days before the need date, it
is considered to be on-time. If the delivery is received more than 6 days before need, it is
considered to be early. And if the delivery is 1 or more than 1 day after need date, it is
considered late. The metric measures the percentage of deliveries which are early or on-time,
averaged across all suppliers.
As in section 3.4.3.1 on shorts at laydown, the scheduled laydown date is subject to change, and
is not an accurate measure of the exact date, whether earlier or later, that a part is required.
Therefore, the shortage measured by this metric may not be 'real' i.e. there might not be an
actual shop order for which the part is needed at that time. Also, the metric measures whether the
delivery is on time, but not the individual parts. If two or more parts needed for different build
orders in a delivery are late, it is still counted as 1 instance of late delivery. This does not reflect

the shortage situation on the shop floor, where the shortage is perceived for every build order.
Likewise, if several parts of the same type arrive under the PO, and only 1 of them is late against
an order, the system still considers all of the parts as being late.
3.5 Summary
The issue of shortages is considered by our team and Varian's production group as the biggest
hurdle limiting Varian from reaching theoretical capacities. The focus of this thesis will be to
recommend solutions to reduce the instances of shortages. To summarize, the problems which
will be addressed by this thesis are -
1. Raw material & WIP inventory correction
The idea behind this is to reduce the amount of WIP which spends more time than needed
on the shop floor, and instead raise the raw material inventory to reduce the instances of
shortages. The 90' module WIP will be targeted as it is found to be more than needed.
2. Supply chain scorecard
Considering existing operations, recommendations will be made on how to measure key
supply chain performance indicators effectively. Better performance indicators will
reflect actual supply chain performance more accurately, and highlight issues like
shortages which get hidden by the existing metrics.
The subject of shortages and tackling the supply chain policies is of a wider scope than this
thesis alone can cover. Chen's thesis [10] looks at the procurement policies and suggests
corrections in the stocking policies to reduce the instance of shortages. Daneshmand's thesis [9]
addresses the problem of kitting described in sections 3.1.2 and 3.1.4.
The other problems mentioned in this section were presented before the company, so that actions
could be taken on them in the future.

4. Review of Theoretical Background
This section is meant to give an overview of the pertinent theoretical work published in the areas
of lean manufacturing and supply chain planning.
A lot of technical literature has been published on the subject of lean manufacturing. One of the
most rigorous analysis is contained in the highly influential book 'The Machine That Changed
the World' [12] by James P. Womack, Daniel T. Jones and Daniel Roos. Based on studies of
factories worldwide, with a special focus on the Toyota Motor Corporation, the book discusses in
detail the basic concepts of lean manufacturing, and its broad applicability in manufacture of
different products. The methods discussed herein were useful in NVA and waste identification.
Value Stream Maps are a useful lean manufacturing tool to graphically plot the flow of material
and information starting from the suppliers, through the internal manufacturing processes and
ending with the customer. This technique originated at the Toyota Manufacturing Company.
'Learning to See' by Rother and Shook [13] is a guide book which explains how to effectively
use VSMs.
The value stream map (VSM) gives a look at the big picture and not just individual processes.
Value stream mapping provides an opportunity to discover the root causes of wastes and improve
the whole process rather than optimizing individual steps.
Value stream maps have three stages of development.
1- Current state VSM: It shows the process in the existing state and includes the entire
process including the non-value added activities. It requires several hours of observations

to map a representative VSM. Detailed observations and drawing spaghetti charts were
the key for the team to be able to map the process.
2- Ideal state VSM: It shows the process in the perfect condition, which could be almost
impossible to achieve practically. This map would show how the process would look like
in a perfect setting if nothing went wrong or there was no process variability to deal with,
and the resultant benefits.
3- Future state VSM: The purpose of the whole VSM process is to identify the waste and
eliminate them by implementation of the improvements that would reduce these wastes.
The future state VSM is drawn after comparing the current state VSM to the ideal states
VSM. The future state VSM chooses the most practical goals from the ideal state VSM,
shows which improvements can become a reality in a short period of time, and the
resultant benefits.
Rother and Shook [13] explain how to draw current-state, future-state and ideal-state VSMs.
This informed the methodology towards the project.
In lean manufacturing philosophy, inventory is considered one of the 7 wastes which are
commonly observed at most production facilities. The Toyota Production System (TPS)
emphasizes single piece flow wherein only one product is worked upon at a time [14].
Methods of measuring service levels are commonly found in most books on supply chain
planning strategies. Simchi-Levi et.al [11] discuss Type 1 and Type 2 service levels and give
examples to demonstrate their use.

5. Methodology
5.1 Preliminary analysis
5.1.1 First person observations
The first step in the process of identifying areas for process improvements is performing micro
level observations. The team spent over 4 weeks observing the build and test processes to
identify the non-value added activities that occur at each step. The operator's actions were
compared to the steps given in the work procedures. If the operator's action did not match the
procedure, the reason for it was investigated.
A useful method of identifying unnecessary operator motions is by drawing a spaghetti chart.
The chart gets its name from the way the graphic typically looks like after documenting a couple
of operator movements. Spaghetti charts were drawn to document wasteful motions i.e. to see
how much time operators wasted searching for tools and parts stored at different locations on the
shop floor.
In addition, the following observations were recorded on a daily basis:
* Shortages on each machine: To track the amount of time each machine stays idle and
waits for parts to arrive.
" Work in Process (WIP): To track how many machines are sitting on the shop floor, how
many are being worked upon, and how many are idle.
" Cycle Time: To track the actual cycle time for each machine and compare it with the
planned cycle times.
e Quality issues: To investigate the reasons that rework occurs on each machine at the test
bay.

The company log book which contains the work procedures was used as a reference to break
down the lengthy assembly and testing processes into smaller segments. SAP software which is
the company's Enterprise Resource Planning (ERP) system was used to gather operational data
on cycle times, quality issues, material movements, scheduling and procurement history.
5.1.2 Value Stream Maps
The preliminary observations help map out the process and identify the non-value added
activities that can be eliminated. Value stream mapping was used as a graphical tool to document
the material flow and all the details about each process. The value stream maps cannot be shared
here because they contain confidential data. However, the main findings derived from them are
presented here. The guidelines for constructing a VSM specific to Varian are also discussed.
5.1.2.1 Findings from Current State VSM for the 900 module
The main findings from the current state VSM for the 90' module are -
1. The lead time for the build and test processes combined, including delays due to
shortages is found to be 251.9 hours. However, the actual time spent working on the tool
is only 66.5 hours.
2. The main reasons why the cycle time is so distended are - Material shortages; NVA time
spent looking for parts or hardware; and performing non-assembly tasks over-and-above
those given in the work procedures.
3. Material shortages are found to cause lead time to increase by up to 4 days. The main
shortages are found to occur on the Resolving Assembly, the Source Chamber, the
Beamline Manipulators and the Q3 lens.
4. Operators frequently move around the shop floor looking for tools, or parts needed for
assembly. It is estimated that up to 2 hours are wasted in the total build procedure
collecting parts or hardware from different locations on the floor.

5. Non-assembly tasks observed being performed by operators takes the process longer than
expected. The list of such tasks includes operations like filing, grounding or sanding
imperfect parts from suppliers; un-packing and de-trashing parts received from suppliers;
and making kits and auditing those received from the warehouses. The team's estimate is
that up to 2.5 hours are spent doing non-assembly tasks.
5.1.2.2 Findings from Current State VSM for the Terminal module
The main findings from the current state VSM for the Terminal module are -
1. The lead time for the build and test processes combined, including delays due to
shortages is found to be 143.6 hours. However, the actual time spent working on the tool
is only 101 hours.
2. The main reasons why the cycle time is so inflated are - Material shortages; NVA time
spent looking for parts or hardware; and performing non-assembly tasks over-and-above
those given in the work procedures.
3. Material shortages are found to cause lead time to increase by 1 day at a minimum. The
main shortages are found to occur on the Source Chamber and the Gas Box sub-
assemblies.
4. The time spent by operators searching for parts or hardware is estimated to be about 4
hours.
5. Operators perform such non-assembly tasks as - typing and printing out labels (2 hours
per tool); un-packing and de-trashing parts received from suppliers; and making kits and
auditing those received from the warehouses. In total, an estimated 5 hours are spent
doing non-assembly tasks.
5.1.2.3 Guidelines for Ideal and Future State VSMs
For constructing an Ideal state VSM, the following assumptions were made.

1. No amount of time spent searching for parts. It is assumed that parts are easily available
to the operators when needed.
2. There are no shortages of materials to the shop floor. Thus, the waiting time attributed to
shortages is taken out of the lead times shown in the current state VSM.
3. It is assumed that there is no time spent doing rework.
4. It is assumed that operators do not spend time on non-assembly tasks such as printing
labels, auditing or making kits or minor rework to incoming parts.
For constructing a Future state VSM, the following assumptions were made.
1. Daneshmand's thesis [9] deals with improving the presentation of raw materials to the
shop floor. This is intended to save the time spent looking for parts, or hardware.
However, it is not possible to completely eliminate this. So, the time spent doing this is
reduced from current state maps, based on heuristic data.
2. The recommendations presented here and in Chen's thesis [10] should lead to reducing
the problem of material shortages. But it is acknowledged that shortages cannot be
entirely eliminated, and may occur as an operational mishap. Nonetheless, an estimate of
how long a shortage may last is made and the delay is included in calculating the lead
time.
3. It is assumed that rework does occur and requires as much time as on the current state
VSM.
4. It is assumed that operators do not spend time on non-assembly tasks such as printing
labels, auditing or making kits or minor rework to incoming parts.
The outcome of the ideal and future state maps is discussed in section 8.4.

5.1.3 Analysis of Data from Databases
The SAP and Lotus Notes databases are the source of historical and factual information of the
operations. This data was found useful in the observation stages as well as while doing analysis
for verifying our hypotheses.
5.1.3.1 Data for Value Stream Maps
While value stream maps are useful to document first hand observations, these alone might not
give the complete and accurate map of the process. A more representative and accurate source of
information is the production history data from the databases. From these databases, actual data
about cycle times measured over extended periods of time was found.
5.2 Inventory Correction Methodology
Several metrics have to be taken into account to measure if the solutions put forth perform
effectively. The performance metrics are based on discussions with the company and are as
follows -
1. Ability to deliver on time to customers at existing shortage rate and with better policies
and revised raw material inventory
2. Space saving
3. Inventory cost savings with and without better policies and revised raw material
inventory
5.2.1 On-time Delivery
It is possible to determine how many tools need to be built alongside each other depending on
the demand. Based on the demand and cycle times, a range for the WIP can be calculated. A
model is constructed assuming 4 scenarios for number of tools built, starting from a low output
of 30 tools per quarter to a maximum of 100 tools built per quarter. Usually, the number of tools

built in the last month of the quarter is higher. Thus, the number of tools built quarterly is split
into 3 months using 30%:30%:40% ratios. It is assumed that 70% of the tools built will be high
current tools, and therefore need a 90' module. The number of High Current tools built every
month of the quarter is estimated. The cycle time for the 90' module assembly measured in terms
of labor hours is taken from historic tracking of this data. Thereby, the total number of assembly
hours needed every month is calculated. As discussed in section 2.2.1.1, the company operates
the 1st and 2 "d shifts which are 8 hours each during the weekdays, and a 4 th shift which works for
12 hours over 2 days of the weekend, and 1 weekday. Thereby, the theoretically available hours
every month can be calculated. Based on historic data, the utilization percentages are substituted
for every quarter, and the actual hours available per month are then calculated. Based on this, the
total manpower needed is calculated. Furthermore, since only 1 or 2 persons work on a tool at a
given time, an average of 1.5 persons working on a tool is assumed, and the WIP on the floor is
calculated. Table 5 shows these calculations.
Table 5: WIP Requirements Calculation
Ql Q2 Q3 Q4
Tools built 30 60 90 100
Month 1 9 18 27 30
Month 2 9 18 27 30
Month 3 12 24 36 40
High Current Tools Built
Month 1 6.3 12.6 18.9 21
Month 2 1 _6.3 12.6 18.9 21
Month 3 8.4 16.8 25.2 28
90' Mod Assembly Labor Hours Required T93.7548 T93.7548 93.7548 93.7548
Total hours required
Month 1 590.65 1181.31 1771.96 1968.85
Month 2 590.65 1181.31 1771.96 1968.85
Month 3 787.54 1575.08 2362.62 2625.13
Total theoretical hours available per month I 422 422 422 422'422 t 422Total theoretical hours available per month 1 422 1 422 1

Utilization 60% 70% 80% 80%Actual hours available per month 253.2 295.4 337.6 337.6
Labor required
Month 1 2.33 4.00 5.25 5.83Month 2 2.33 4.00 5.25 5.83Month 3 3.11 5.33 7.00 7.78
Maximum number of people working on 1 tool 1.5 1.5 1.5 1.5
WIP
Month 1 1.56 2.67 3.50 3.89
Month 2 1.56 2.67 3.50 3.89Month 3 2.07 3.55 4.67 5.18
Whenever the WIP is found to exceed 4 tools, it is proposed that a shift be added to increase the
number of theoretical hours available every month. This is discussed in the section 6.
5.2.2 Space Savings
A 900 module laid down on the floor requires approximately 12 ft. x 10 ft. area so that it can be
laid down, be worked upon conveniently and be moved out of the assembly bay after completing
assembly. Currently, 66 ft. x 10 ft. of space is allocated on the floor for a WIP of six 90' tools to
be worked on at a time. Thus, not every tool gets a 12 ft. long space if 6 tools are laid down, and
the tools may be laid down closer to each other to fit in the available space. The space savings
would be calculated by finding the space taken by the observed number of average machines on
the floor at any instant over the space taken for the suggested number of WIP tools.
5.2.3 Inventory cost savings
Figure 8 shows the division of inventory dollar value among raw material, WIP and finished
goods in June 2011.

FY'11 June
Figure 8: Inventory mix by dollar value in June 2011
At 42%, the WIP is a significant portion of the total inventory holding costs. The proposed
solution however looks not only to reduce the fraction of WIP in the total inventory, but also to
reduce the overall inventory being held i.e. to shrink the pie.
The inventory costs can be reduced by reducing the WIP inventory, and adjusting the stocking
and procurement policies to reduce the instances of shortages. This leads to a net savings in
costs. This is because there is more product variation at the WIP level than the raw material
level. A manufacturing postponement strategy can be pursued, which delays the customization
decision as close to the customer order as possible. Once the order is received, the requisite
material can be drawn from the raw material inventory and the order can be completed. To get
the same level of responsiveness, an enormous amount of WIP inventory is required to cater to
the large number of possible machine configurations. With postponement, the same part can be
used to build different configurations of tools. Thus, a specific decrease in WIP can be matched
by increasing the raw material inventory by a relatively small amount while still getting the same
level of responsiveness. This leads to an overall decrease in the inventory costs at the same level
of responsiveness and on-time delivery.

5.3 Supply Chain Scorecard Methodology
As discussed in section 3.4.3, some of the company's supply chain metrics do not give accurate
information about shortages. Performance indicators based on academic literature are more
robust, and give better information about the state of the supply chain.
5.3.1 Methodology for Proposed Metric
As stated in section 3.4.3, existing methods of measuring shortages are not entirely accurate and
do not reflect the actual state of shortages. The team found a unique way of measuring the
shortage instances which had not been attempted by the company. A part is considered to be
under shortage only when there is an order for it, and it is out-of-stock. This data can be used to
determine Type 1I service levels for individual parts.
The material pickers in the warehouse receive printed orders which state which parts have to be
picked, in what quantity and for which machine order. This printed order is generated by the
production supervisor anticipating a machine laydown in the following 24 hours. Thus, there is a
certain demand for the part which needs to be picked. If the part on the pick list is available, a
data entry person makes a notification in SAP that the part has been issued to an order. However,
if some parts from the pick list are out of stock, the data entry person files a notification in SAP
to that effect. Whenever that part is delivered by a supplier, the SAP system automatically prints
out a 'shortage ticket' which is a small tag which states that the part is due for an order and
specifies details about the order. Thus, the warehouse immediately knows that the received part
has to be sent in the requisite quantity to the shop floor to fulfill the shortage. Figures 9 and 10
illustrate this.

NO
PICK LIST IS ISSUED TOWAREHOUSE
-is PART AVAILABLE INSTOCK?
FILL 'OUT OF STOCK'NOTIFICATION IN SAP
A
YES
MAKE ENTRY IN SAPSHOWING PART ISSUE TO THE
ORDER
1 END
Figure 9: Kit picking process in the warehouses
PARTS RECEIVED AGAINSTA PURCHASE ORDER
NO
DELIVER ALL PARTSTO STORAGE
LOCATION
CHECK IFAN ORDER ISWAITING FOR THE PART-1 YES
PRINT SHORTAGE TICKET ANDSEND REQUIRED PARTS TOSHOP FLOOR FOR WAITING
ORDER
-~ END
Figure 10: Shortage ticket generation process
It is possible to extract the history of all shortage tickets printed by SAP. This data gives a
historic record of all parts which were out of stock when there was an actual demand for them.
This is similar to a Type II or p service level used in supply chain planning [11]. The Type II
A )

service level measures what fraction of actual demand can be fulfilled from stock on hand. Two
years of data of shortage tickets were collected and analyzed to detect trends in instances of
shortages. Using 2 year data gives a more balanced representation of shortages, and measures
shortages over several periods of cyclic demands which Varian experiences.
The Type II service level for a part is calculated as follows -
Expected Backorders per Cycle
Demand per Cycle
The Expected Backorders per Cycle is equal to the number of shortage tickets generated for that
part. This data is made available from SAP, and can be easily captured. The Demand per Cycle is
equal to the actual number of orders received by the warehouse or supplier. This data too is easy
to source from SAP. Thus, the Type II service level can be calculated from the available data as
follows -
Number of shortage tickets generated for a part
Total number of part issues against an order
The total number of parts issued consists of all parts not under shortage issued to a tool, and the
shortage tickets issued. The Type 1I service level for a part will be compared with the Supplier
on Time to Need data for that part. The comparison will reveal the accuracy gained by
implementing the proposed metric. The raw data for Supplier on Time to Need tags part as Early
(E), On-time (OT) and Late. This will be discussed in section 5.3.2.2. For a specific part, the on
time delivery percentage is calculated as follows -
ON TIME TO NEED= 1 - NUMBER OF'L'PART STOTAL NUMBER OF PARTS
NUMBER OF'E'+'OT'PARTS
TOTAL NUMBER OF PARTS

5.3.2 Accuracy of the Proposed Metric
There are several parameters which show the accuracy of the proposed metric. The shortage
ticket history data provides information which is not currently measured by the Shorts at
Laydown and On Time to Need Metrics. This is because of the shortage ticket is meant for a
specific build order, and thereby carries more information such as order number and actual need
date.
5.3.2.1 Compared to Shorts at Laydown
As was discussed in section 3.4.3.1, parts are needed for the sub-assemblies in the Supermarket
zone up to 5 days before the laydown. Thus, the orders for these parts are released 5 days before
the actual laydown date. Also, some parts may be needed up to 5 days after module laydown.
The Shorts at Laydown metric however measures parts deliveries from supplier based on the
laydown date. It considers neither the lead time required for the sub-assemblies, nor the actual
need date for the late-needed parts. On the other hand, the proposed system can measure
shortages against orders from all zones, including the Supermarket. Thus, it takes into account
the actual need date of parts for the sub-assemblies, as well as the module build.
Moreover, since the proposed metric measures shortages by actual laydown date, it is reasonable
to include the Kanban driven parts in the shortage measurements. As mentioned in section
3.4.3.1, the Shorts at Laydown metric does not count Kanban parts shortages because that system
is based on a scheduled laydown date, whereas the Kanban parts movement is triggered by the
actual laydown date. With the proposed metric, the inclusion of Kanban parts means that it is
possible to measure shortages on these parts which account for 55% by value of the cost of
goods sold.
5.3.2.2 Compared to Supplier on Time to Need
The Supplier on Time to Need metric is based upon goods receipt against a purchase order (PO).
Whenever a part or several parts are delivered at the warehouse, the SAP system checks the
parts' need against the scheduled laydown date. Based on the scheduled laydown date, all the

parts which are delivered under the PO are tagged as Early (E), On-Time (OT) or Late (L).
Whether a part is early, on-time or late is based on the following algorithm, as shown in Figure
11.
/'PARTS RECEIVED AGAINSTA PURCHASE ORDER
SORT PARTS UNDER SAMEPURCHASE ORDER BYMATERIAL NUMBER
>= 5
CHECK PARTS REQUIREMENTAGAINST SCHEDULED NEED
DATE
IF (SCHEDULED NEED DATE)'-(RECEIPT DATE)
>= 1
< 5 BUT>= 0
PART IS EARLY.STATUS:E
PART IS ON-TIME.STATUS: OT
PART IS LATE.STATUS:L
Figure 11: Supplier on Time to Need logic
This process is repeated for all POs from a supplier and an On Time to Need percent is
calculated for each supplier as follows -
SUPPLIER ON TIME TO NEED =1-NUMBER OF'L'PARTS
TOTAL NUMBER OF PARTS
NUMBER OF'E'+'OT'PARTS
TOTAL NUMBER OF PARTS

The average of Supplier on Time to Need percentage for all suppliers is the metric reported on
the Supply Chain Scorecard.
If several parts arrive under the PO, and only 1 of them is late, the system still brands all of the
parts as being late. Also, if parts needed for different POs arrive late, Supplier on Time to Need
counts it as 1 instance of shortage, whereas the proposed metric counts each instance of shortage,
because shortage tickets are generated for each build order. The distinction is important because
the shop floor actually witnesses instances of shortage for each order, and not instances of late
receipts. Thus, basing the metric on build order rather than purchase order gives more accurate
and realistic data.
The proposed system can source data not only about shortage tickets, but also about parts issued
to a certain order when they are in stock, as mentioned in section 5.3.1. This provides more
detailed information to measure a Supplier on Time to Need, based on an actual need date, rather
than the scheduled need date as is done now. The flowchart in figure 12 shows how this can be
achieved.

ON TIME TO NEEDMEASURMENT
ACTUALNEED DATE
SHORTAGETICKET HISTORY
NOYES SHORTAGE TICKET PRINTED--,
ON DAY OF ARRIVAL
YESIS PART ISSUED ON DAY OF
ARRIVAL
PART IS ON-TIME.
-+ END 4-
PART IS LATE.
Figure 12: Measurement of shortages using shortage ticket data
Note that the Type II service level measures what fraction of the demand had late parts, shown in
the figure above. The Type II service level treats early and on-time parts as the same. The Type
II service level should be sufficient to measure supplier delivery performance, but additional data
on whether parts are early or late can also be readily obtained and analyzed as shown above.
HISTORY OFPARTS
ISSUED TOORDERS
NO
PART IS EARLY.
6. Inventory Correction Analysis
6.1 Section overview
As stated in section 3.4.1, material shortages delay production and lead to excess WIP inventory
on the shop floor. Also, as discussed in section 3.4.2, the WIP in turn leads to shortages as now
many more of the machines are waiting for the same parts to arrive. This section presents an
analytical test for the recommendation to reduce the WIP, and the results expected from the
implementation.
6.2 Analysis of WIP data
Inventory data was made available by the Logistics department, and some analysis of the data
was done to identify trends. The numbers have been masked to protect confidentiality of the
data.
6.2.1 Inventory and Demand
Figure 13 shows the changes in the inventories and shortages as the number of tools built
increases. This data illustrates that the same number of tools can be built with a lower WIP, and
lower inventory costs. The numbers have been masked for reasons of confidentiality.

Inventory and Shortages vs. Builds
Tools Built-0-Raw Mat. Inventory
-i-Raw + WIP
- Medium Current Shorts at Laydown
-u-WIP Inventory
- High Current Shorts at Laydown
Figure 13: Inventory and shortages against number of tools built
From the graph, it is seen that the highest instances of shortages do not necessarily occur when
the number of tools being built is the most. The highest instances of shortage occur when the
demand for tools exceeds forecasts. The crucial insight obtained from this graph is that, at
several points (circled) where the number of tools built is the same, the WIP is lower at the
different points as highlighted in the graph.
In section 5.2.1, it was found that when the number of tools being built was high i.e. 90 or 100,the 90' module WIP needed on the floor exceeded 4 tools. In such a high demand situation, it is
recommended that additional labor be deployed to fulfill the orders. Table 6 shows a model
which can be used to calculate the labor hour allocation.

Table 6: Reduced WIP Calculation
Q3 Q490 100
90' module WIP required as per Table 5Month 1 3.50 3.89Month 2 3.50 3.89Month 3 4.67 5.18
Corrected 900 module WIP (<= 4) 4 4Maximum number of people working on 1 tool 1.5 1.5Labor required 6 6Total Hours Required as per Table 5 2362.62 2625.13Actual hours needed 393.77 437.522Utilization 80% 80%Theoretical Hours needed 492.21 546.90Theoretical Hours available by adding 3rd shift only 567 567Theoretical Hours available by adding 5th shift only 554 554
It is found that by adding an extra shift, the same number of tools can be built keeping
90'module WIP at under 4 tools. Thus, the demand can be fulfilled satisfactorily.
6.2.2 Inventory and Shortages
Figure 14 shows the number of tools built, number of shorts at laydown seen on the High Current
and Medium Current Tools, and the raw and WIP inventories from the 3rd Quarter of the fiscal
year 2007 to the 3rd Quarter of the fiscal year 2011. It is recommended that the inventory be
carried in raw material form, and that the stocking policies should be adjusted in response to the
consumption. The WIP inventory on the other hand, should be held low and constant.

Inventory and Shortages - Overview
Q3'07Q4'07Ql'08Q2'08Q3'08Q4'08Q1'09Q2'09Q3'09Q4'09Q1'10Q2'10Q3'10Q4'1OQ1'l1Q2'l1 Q3'11
- Tools built - Shortages at laydown - HC -Shortages at laydown - MC
-U-WIP Inventory -e-Raw Mat. Inventory -U-Raw + WIP Inventory
Figure 14: Inventory and shortages over time
The graph shows that the WIP fluctuates in response to the number of tools built. The raw
material inventory however remains more or less the same throughout the period. It can also be
observed that from Q3'09 onward, as the number of tools built increased, the shortages rose
dramatically. The raw material inventory during this period actually decreases, instead of scaling
up to meet the demand.
It is beneficial to carry more raw material inventory than to carry the same dollar value inventory
in WIP for several reasons. Having the inventory in the warehouse, rather than in a semi-
assembled or fully assembled state on the shop floor adds flexibility to the operations. The raw
material inventory held in the warehouses is not committed to a specific machine order. It can be
used for many different variants. This permits postponement on the decision about which tool to
start assembling. Thus, the tool can be laid down when there is a certain order, and there are

fewer chances of customer-requested changes in the order later on. This saves the labor effort
which would be wasted in reconfiguring the tool when the order changes.
Having the requisite raw material inventory in the warehouses also ensures that shortages are
infrequent. Thus, the WIP tools spend less time waiting for the parts to arrive. This ensures a
faster turnaround of the tool. Thus, the inventory on the floor keeps moving fast and does not
stagnate and pile up.
More data is available to quantify the impact of high, non-moving WIP on parts shortages. A
metric tracked by the Logistics department is the 'WIP Aging' on the shop floor. In SAP, if a
part is under WIP status, it means that the part is issued by a warehouse or supplier to the
production floor. Data from SAP presents which parts or sub-assemblies have been under WIP
status for n number of months, n being any number equal to or greater than 0. However, it is not
possible to get further resolution on the data i.e. WIP greater than 1 week, or WIP greater than 2
weeks and so on. The company is interested in knowing how much inventory has been under
WIP status for more than 3 months, and has a maximum dollar value limit on it.
Table 7 shows the data for the 90' modules which had the longest duration of WIP, and the
shortages faced by that build order. It is found that much of the top long staying WIP parts or
sub-assemblies did not have part shortages. However, as mentioned in section 3.4.2, the WIP
takes up floor space, and it takes up parts which could be used for another build if they were
waiting in the warehouse instead.
Table 7: WIP Aging
ModuleNumber Module Description WIP Duration (days) Shortages faced
E11437550 90 MODULE,ANALYZER 20E11437550 90 MODULE,ANALYZER 14
El1423980INT 90 MODULE MODULE, VIISTA 12 1HCPi
E11437550 90 MODULE,ANALYZER 9 5
6.2.3 Inventory and Labor Utilization

Figure 15 shows the changes in the inventories and the labor utilization and overtime percentages
with an increase in the number of tools built. The numbers have been masked to protect
confidentiality. The graphic illustrates the positive effect of a low WIP inventory on the labor
utilization percentage. The numbers have been masked to protect confidentiality.
Figure 15: Inventory and Utilization against number of builds
In general, the utilization and overtime percentages gradually increase as the number of tools
being built increases. However, the highlighted points show instances where the same numbers
of tools were built at different points in time. There are 4 such instances as shown. In 3 out of 4
instances, the labor utilization is found to stay almost constant or increase with a decrease in the
WIP. In case of the exception, the number of tools built is extremely low. At such a low level of
Inventory and Utilization vs. Tools Built
Tools Built
-u-Raw Mat. Inventory -0-WIP Inventory -U-Raw + WIP Inventory -u-Utilization % -U-Overtime %

production, any addition of WIP inventory improves the labor utilization. Thus, reducing the
WIP inventory helps to improve the labor utilization
6.3 Solution for Inventory Correction
Looking at the data presented in sections 6.1.1 and 6.1.2, it is recommended that the WIP
inventory be reduced, and the shortages be dealt with either by increasing the raw material
inventory, or revising the purchase and inventory policies on the top shortage contributors. High
WIP is recognized as a problem leading in turn to problems like tools waiting for parts,
congestion on the shop floor, rework, hiding problems and low inventory turnover. It is
recommended that the WIP be reduced and determined more in accordance with demand. The
WIP should not be used as a buffer against shortages. Rather, changes in procurement policies
and revising raw material inventory levels should be effected to address the problem of shortages
arising from suppliers.
6.4 Costs and Benefits Analysis
The following benefits are expected as an outcome of this project.
1. Space Savings
Keeping the 90' module WIP at or under 4 tools directly leads to savings in floor space. Table 8
shows the savings achieved.
Table 8: Space savings
Length (ft.) Width (ft.)
Space needed for 6 90' WIP Tools 66 10
Space needed for 4 900 WIP Tools 48 10
Savings achieved 8 10

Thus, by reducing the WIP, 80 square feet of floor space can be saved.
2. Reduced inventory costs
The overall inventory can be reduced by reducing the WIP inventory and instead improving the
procurement and stocking policies. In times of high demand, it is recommended that the raw
material inventory be raised rather than the WIP. Having sufficient raw material inventory
provides the benefit of delayed decision, and thus reduces the need to carry much WIP inventory.
3. Faster turnaround of tools
The tools which are laid down will move in and out of build state faster. This reduces the aging
of WIP inventory. It also reduces chances of generating rework, because the shorter a tool stays
on the floor, the less likely it is to be worked on by several different operators.
The following costs are associated with the implementation of WIP reduction.
1. Cost of labor
In times when the demand increases, it is recommended that an additional manpower shift be
added. The cost of additional labor is the direct cost associated with the implementation of this
project. However, since the material costs constitute a very high portion of total manufacturing
costs, it is most likely that the savings in inventory costs may well make up for the increase in
labor costs.
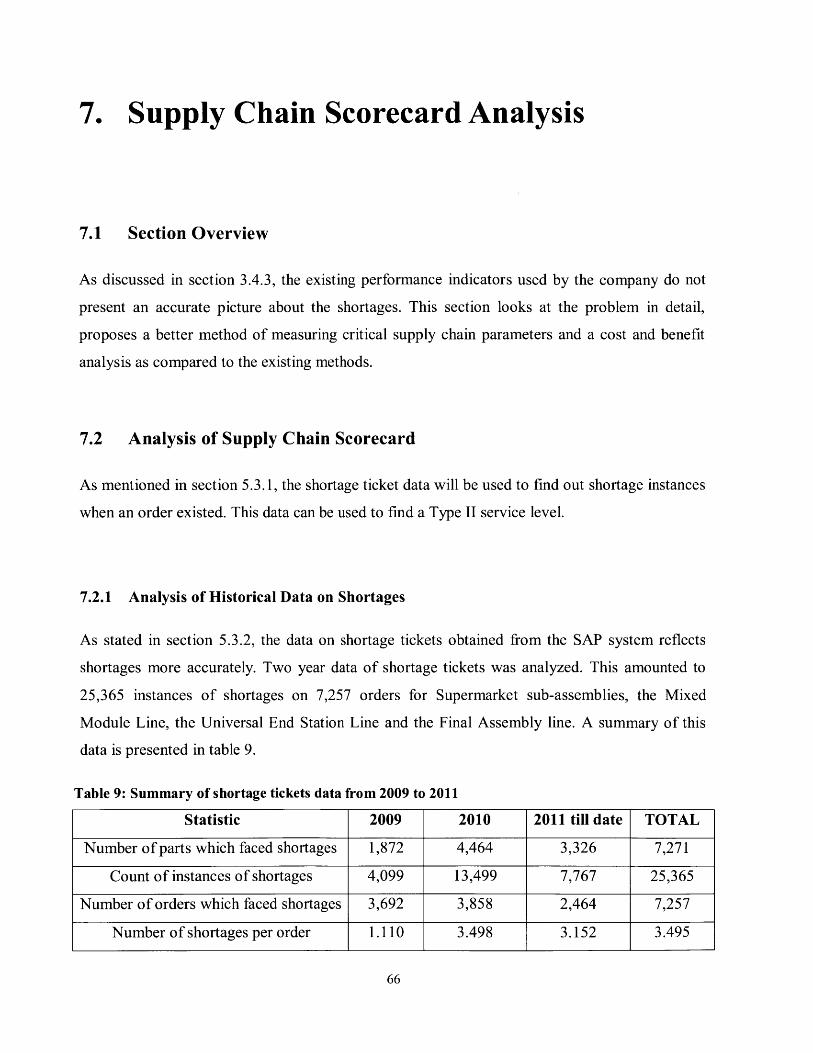
7. Supply Chain Scorecard Analysis
7.1 Section Overview
As discussed in section 3.4.3, the existing performance indicators used by the company do not
present an accurate picture about the shortages. This section looks at the problem in detail,
proposes a better method of measuring critical supply chain parameters and a cost and benefit
analysis as compared to the existing methods.
7.2 Analysis of Supply Chain Scorecard
As mentioned in section 5.3.1, the shortage ticket data will be used to find out shortage instances
when an order existed. This data can be used to find a Type II service level.
7.2.1 Analysis of Historical Data on Shortages
As stated in section 5.3.2, the data on shortage tickets obtained from the SAP system reflects
shortages more accurately. Two year data of shortage tickets was analyzed. This amounted to
25,365 instances of shortages on 7,257 orders for Supermarket sub-assemblies, the Mixed
Module Line, the Universal End Station Line and the Final Assembly line. A summary of this
data is presented in table 9.
Table 9: Summary of shortage tickets data from 2009 to 2011
Statistic 2009 2010 2011 till date TOTAL
Number of parts which faced shortages 1,872 4,464 3,326 7,271
Count of instances of shortages 4,099 13,499 7,767 25,365
Number of orders which faced shortages 3,692 3,858 2,464 7,257
Number of shortages per order 1.110 3.498 3.152 3.495
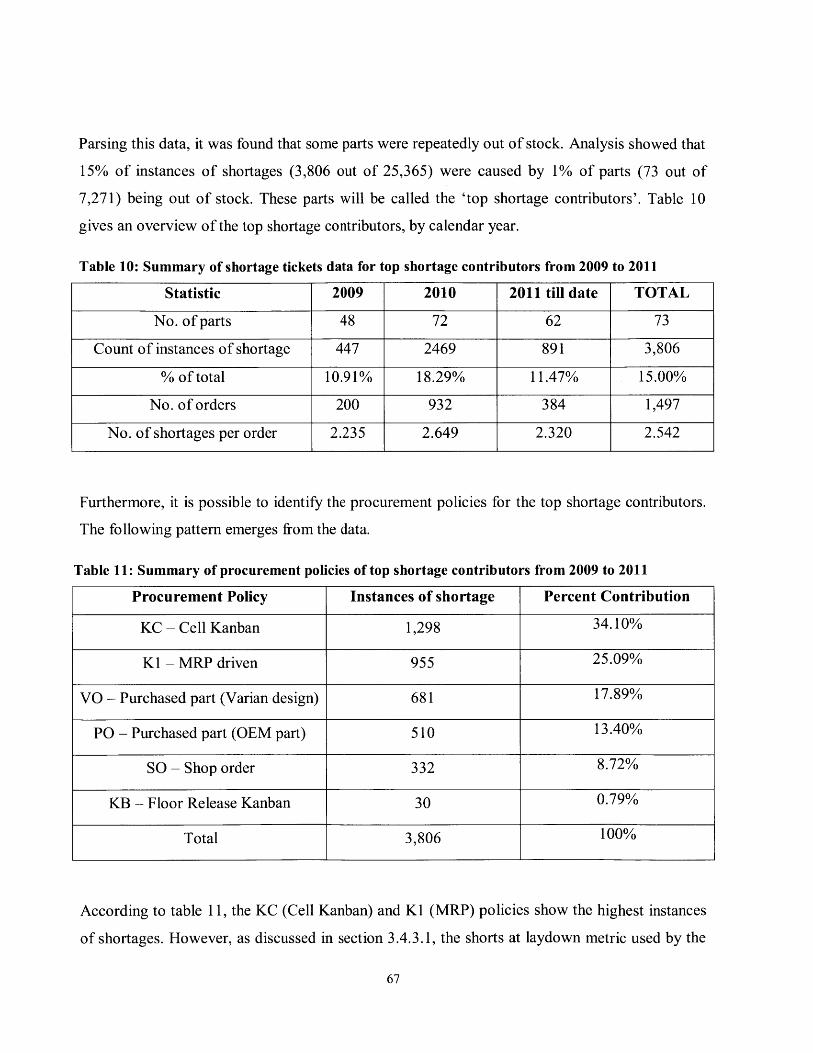
Parsing this data, it was found that some parts were repeatedly out of stock. Analysis showed that
15% of instances of shortages (3,806 out of 25,365) were caused by 1% of parts (73 out of
7,271) being out of stock. These parts will be called the 'top shortage contributors'. Table 10
gives an overview of the top shortage contributors, by calendar year.
Table 10: Summary of shortage tickets data for top shortage contributors from 2009 to 2011
Statistic 2009 2010 2011 till date TOTAL
No. of parts 48 72 62 73
Count of instances of shortage 447 2469 891 3,806
% of total 10.91% 18.29% 11.47% 15.00%
No. of orders 200 932 384 1,497
No. of shortages per order 2.235 2.649 2.320 2.542
Furthermore, it is possible to identify the procurement policies for the top shortage contributors.
The following pattern emerges from the data.
Table 11: Summary of procurement policies of top shortage contributors from 2009 to 2011
Procurement Policy Instances of shortage Percent Contribution
KC - Cell Kanban 1,298 34.10%
K1 - MRP driven 955 25.09%
VO - Purchased part (Varian design) 681 17.89%
PO - Purchased part (OEM part) 510 13.40%
SO - Shop order 332 8.72%
KB - Floor Release Kanban 30 0.79%
Total 3,806 100%
According to table 11, the KC (Cell Kanban) and Ki (MRP) policies show the highest instances
of shortages. However, as discussed in section 3.4.3.1, the shorts at laydown metric used by the
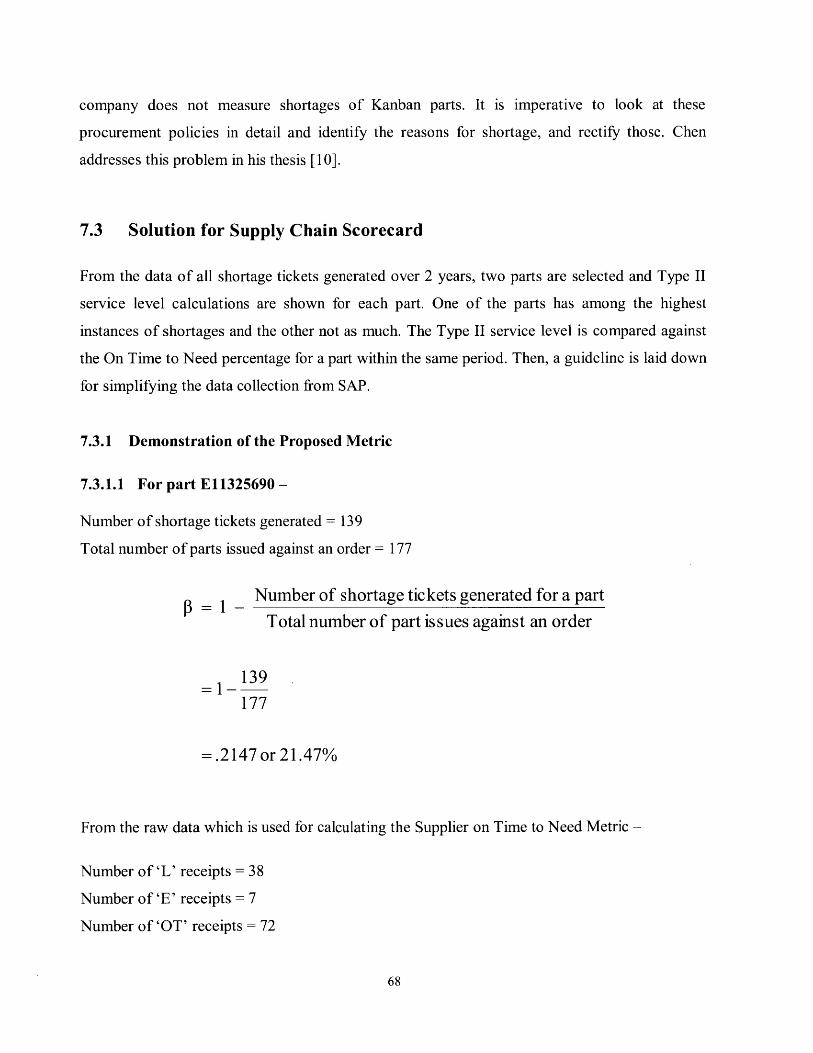
company does not measure shortages of Kanban parts. It is imperative to look at these
procurement policies in detail and identify the reasons for shortage, and rectify those. Chen
addresses this problem in his thesis [10].
7.3 Solution for Supply Chain Scorecard
From the data of all shortage tickets generated over 2 years, two parts are selected and Type II
service level calculations are shown for each part. One of the parts has among the highest
instances of shortages and the other not as much. The Type II service level is compared against
the On Time to Need percentage for a part within the same period. Then, a guideline is laid down
for simplifying the data collection from SAP.
7.3.1 Demonstration of the Proposed Metric
7.3.1.1 For part E11325690 -
Number of shortage tickets generated = 139
Total number of parts issued against an order = 177
Number of shortage tickets generated for a part
Total number of part issues against an order
177
=.2147 or 21.47%
From the raw data which is used for calculating the Supplier on Time to Need Metric -
Number of 'L' receipts = 38
Number of 'E' receipts = 7
Number of 'OT' receipts = 72

Total number of receipts = 117
ON TIME TO NEED = 1 -NUMBER OF' L' PART S
TOTAL NUMBER OF PARTS
NUMBER OF'E'+'OT'PARTSTOTAL NUMBER OF PARTS
=0.6752 or 67.52%
Also, out of the 117 receipts in the given period, shortage tickets were not generated for 3
receipts. This means that the receipt was early or on-time. This means that 3 out of 117 i.e.
2.56% of deliveries of E 11325690 were early or on-time.
7.3.1.2 For part E19287170 -
Number of shortage tickets generated = 2
Total number of parts issued against an order = 21
P = 1 -Number of shortage tickets generated for a part
Total number of part issues against an order
21
=0.9048 or 90.48%
From the raw data which is used for calculating the Supplier on Time to Need Metric -
Number of 'L' receipts = 12
Number of 'E' receipts = 0
Number of 'OT' receipts = 4

Total number of receipts = 16
ON TIME TO NEED = 1- NUMBER OF 'L' PART S
TOTAL NUMBER OF PARTS
NUMBER OF'E'+'OT'PARTS
TOTAL NUMBER OF PARTS
= 0.25 or 25%
For E19287170, out of the 16 receipts in the given period, shortage tickets were not generated for
14 receipts. This means that the receipt was early or on-time. This means that 14 out of 16
receipts i.e. 87.5% of deliveries of E19287170 were early or on-time.
Also for part E19287170, there are found to be 3 issues of the part on the same day as the part
was received. An order did not exist for the part before, and hence no shortage ticket was
generated. Thus, the 3 instances of parts being issued to an order on the same day as the arrival
of the part are considered as On-Time Delivery.
7.3.1.3 For part E19287170 -
In the case of this part, it was found that one receipt contained two parts needed for two different
orders. Both were late as per scheduled need date. But On Time to Need counts this as 1 instance
of shortage.
Number of 'L' parts = 3
Number of 'L' receipts = 2
Number of 'E' receipts = 1
Number of 'OT' receipts 1
Total number of receipts 4

ON TIME TO NEED = 1- NUMBER OF'L' PART S
TOTAL NUMBER OF PARTS
NUMBER OF'E'+'OT'PARTS
TOTAL NUMBER OF PARTS
-0.5 or 50%
The proposed metric on the other hand measures each part late receipt as a different instance of
shortage. In this case, shortage tickets were not generated for 2 out of 5 parts received. Thus,
actually 40% of the parts received were early or on-time, and not 50%. This is the benefit of the
proposed method - it measures late parts to unique build order, rather than number of late
receipts. The Type II service level is calculated as follows -
Number of shortage tickets generated for a part
Total number of part issues against an order
=1- 2
21
=0.9048 or 90.48%
From the raw data which is used for calculating the Supplier on Time to Need Metric -
Number of 'L' receipts = 12
Number of 'E' receipts = 0
Number of 'OT' receipts 4
Total number of receipts 16
Table 12 is meant to give a comparison of the two systems. It shows the shortage measurement
for some critical parts using the existing method as well as the proposed method. In the first case
with material El11325690, it is found that the Type II service level is quite lower than the value

given by the On Time to Need metric. In other cases, the Type II service level is higher than the
On Time to Need. Based on this, the stocking policies for these parts can be changed. With the
proposed metric, it is also possible to calculate what percent of parts of a particular type are
received before an order is released. This metric reveals which parts arrive in advance of an
order, and what percent of time. For E 11325690, this being 2.56% is the reason why the Type II
service level is so poor. This metric can thus be used to schedule deliveries in advance of the
order to avoid shortages.
Table 12: Comparison of existing and proposed systems of shortage measurement
Existing method Proposed method
Material number On Time to Need % Type 11 service level % Receipts before order isp% released
E11325690 67.52% 21.47% 2.56%
E19287170 25% 90.48% 87.50%
E16345670 50% 76.92% 40%
E17290710 100% 98.58% 88%
E31001206 70.63% 76.14% 86.67%
E11324980 50% 70% 85.71%
7.3.2 SAP Variant Design
The company's SAP system has a feature which simplifies the data collection process, and
returns the most pertinent information to a query. These features called variants are
recommended to be used here so as to simplify data collection. To collect the shortage ticket
data, the following information has to be inputted -
1. The time period for which shortages are being measured
2. The plant and storage location codes
3. The movement type '261' which is a standard SAP code for Goods Issued to an Order

4. Username. When the SAP system automatically creates and prints a shortage ticket as
discussed in section 5.3.1, the username for it is SAPBATCHBTXN. When the part is not
out of stock, and it is issued by the warehouse to the shop floor, the username will be the
user id of the person doing the notification in SAP.
Also from the data which is obtained from SAP, it is necessary to remove items unrelated to the
work zone under consideration. This can be filtered by going through the order numbers. Sub-
assemblies and modules have specific module numbers by which they can be shortlisted. Thus, it
is recommended that the different production areas develop variants for their specific use, to
measure shortages in their production zone.
7.4 Costs and Benefits Analysis
The benefits associated with the recommended metric are as follows -
1. It measures shortages based not on scheduled lay down date, but based on actual need
date for the part. Thus, Supermarket parts which are needed 5 days before actual laydown
and final assembly parts which are needed 5 days after actual laydown are not measured
based on a single, hypothetical date. They are measured based on the date they are
actually required. This is a more accurate measure of shortages.
2. The data considers parts with all the different types of procurement policies. Thus, it does
not neglect Kanban parts which are among the biggest shortage contributors, but are
currently ignored by the shorts at laydown metric.
3. This Type II service level can also substitute for the 'Supplier on Time to Need' metric,
which is a Type I service level. In this case, the Type II service level is better because it
is based on actual demand date, rather than the supplier of time to need measure which is
based on the scheduled laydown date.

4. With this metric, it is also possible to measure what percent of time a part is received
before an order for it is created. Parts for which this percentage is low will face shortages
more often. Thus, this is an indicator to revise the procurement policies for the part.
Thus, the recommended metric is more accurate than either of the two metrics - Shorts at
Laydown and Supplier on Time to Need - being used currently, and it provides more useful
information than either.
The following costs are associated with the implementation of the recommended metric -
1. Cost of developing a layout in SAP to make data mining easier -
As mentioned in section 7.3.2, an SAP layout makes it easy to find the most relevant data from
the database. In case of shortage measurement by the proposed method, it is necessary to
generate a targeted query to get only the most pertinent data, which can then be processed easily.
2. Developing a spreadsheet model to take the raw SAP data and filter it as per requirement,
and to perform the necessary calculations to calculate the Type 1I service level.
3. A drawback of this method is that it cannot measure shortages for parts delivered directly on
the line by a supplier. For example, a magnet assembly received on the day of laydown does not
get a shortage ticket if it is received after an order is created. It is recommended for future work
that the part be routed in such a way that the shortage ticket system can be applied to such parts
as well.

8. Conclusion and Future Work
8.1 Recommendations for Inventory Correction
In order to have a faster turnaround of tools on the shop floor, and to reduce overall inventory
costs, it is recommended that the work-in-process inventory be reduced. The inventory should
instead be held in raw material storage. This strategy allows delayed decision-making so that the
customer order is well known, and there are fewer chances of reconfigurations being done. As
most parts are shared across different configurations of tool, less material is required to be held
in the warehouses. It is recommended that the WIP inventory be held low and constant, and that
raw material policies be adjusted, and labor allocation be modulated in response to changes in
demand.
8.2 Recommendations for Supply Chain Scorecard
A build-order and actual laydown date based system of measuring shortages is recommended for
implementation in place of the existing purchase order, scheduled laydown date based system of
measuring shortages. This system is found to provide more accurate data in terms of quantity,
time and type of shortages. It better describes the actual state of shortages as seen on the shop
floor. Using this metric can give better insight on common instances of shortages. This can be
used to take actions in improving the procurement and stocking policies, especially for critical
parts.
8.3 Future Work

8.3.1 SAP Variant for the Proposed Metric
As discussed in section 7.3.2, an SAP variant will be found immensely useful in collecting and
parsing the data on shortage tickets. Guidelines on preparing the variant were also suggested in
section 7.3.2. Creating this data collection system for the different production zones is the
immediate next step in moving towards the proposed system.
8.3.2 Re-routing Material Flow
Presently, some parts are delivered directly to the shop floor on the day of the laydown of the
module. Thus, these parts bypass being invoiced at the warehouses, and thus do not receive a
shortage ticket if they are late against an order. It is recommended that in the future, the parts be
routed in such a way that the shortage ticket system can be used on these parts as well. This will
give visibility of shortages over such parts as well, thereby providing better information about
on-time delivery.
8.3.3 Shortages on MRP-driven parts
From table 11, it is seen that 65.11% of the top shortage contributors have varying forms of
MRP-driven form of inventory control. It is imperative to investigate these policies, and find out
the root causes of the shortages. Action should be taken to improve the stocking policy. This
allies with the WIP reduction project because the WIP reduction will provide better results when
the raw material stocking policies are better in tune with the customer demand.
8.3.4 Other Recommendations
Operational problems which were discovered as part of the team's first person observations were
discussed in section 3. These observations were presented to the company as future actionable
items.

8.4 Summary of Ideal and Future State Value Stream Maps
The findings from the current state VSM and guidelines for constructing the ideal and future
state VSMs were presented in section 5.1.2. Based on these and the recommendations presented
in this thesis, ideal and future state VSMs were constructed. While the maps cannot be included
in the thesis because of confidentiality concerns, the production lead times are scaled and
summed up in table 13 below.
Table 13: Estimated production lead times
Current State Ideal State Future State
90' Module 1.0000 0.2706 0.5366
Terminal Mod 1.0000 0.6963 0.8587
Thus, it is assessed that the production lead time could be reduced by 46.34% for the 90'
module, and by 14.13% for the Terminal module over the Current State, by adopting
recommendations contained in this thesis, as well as those in Daneshmand's [9] and Chen's [10]
theses. These are significant savings, and the methods of achieving these savings were presented
to Varian.

9. References
[1] Semiconductor Equipment and Materials International - Market Information - 16 February -
http://www.semi.org/en/Marketlnfo/EquipmentMarket
[2] Sun, Yulei 'Implementation of RFID in a Low Volume High Flexibility Assembly Plant:
Process Redesign', Graduate Thesis, 2010, Massachusetts Institute of Technology
[3] Jia, Rui 'Implementation of RFID in a Low Volume High Flexibility Assembly Plant:
Module Component Tracking', Graduate Thesis, 2010, Massachusetts Institute of Technology
[4] Konisky, Cyril 'Implementation of RFID in a Low Volume High Flexibility Assembly Plant:
Item-Level Tagging', Graduate Thesis, 2010, Massachusetts Institute of Technology
[5] Varian Semiconductor Equipment Associates website, http://www.vsea.com
[6] Ion Implantation - Wikipedia, 15 June, 2011 - http://en.wikipedia.org/wiki/Ion-implantation
[7] Varian Semiconductor Equipment Associates technical literature
[8] Sherbondy, S., Martin, D. "Varian Semiconductor Equipment Associates Inc." MIT M.Eng
in Manufacturing Project Presentations, November 29, 2010.
[9] Daneshmand, M., 'Lean Manufacturing in a Mass Customization Plant: Improved
Efficiencies in Raw Material Presentation', Graduate Thesis, 2011, Massachusetts Institute of
Technology
[10] Chen, W., 'Lean Manufacturing in a Mass Customization Plant: Improvement of Kanban
Policy and Implementation', Graduate Thesis, 2011, Massachusetts Institute of Technology

[11] Simchi-Levi, D., Kaminsky P., Simchi-Levi E. Designing and managing the supply chain:
concepts, strategies, and case studies, McGraw Hill Professional, 2003.
[12] Womack, J. P., Jones, D. T., and Roos, Daniel (1991) 'The Machine That Changed the
World', New York: HarperCollins Publishers.
[13] Rother M., Shook, J. 'Learning to see: Value-Stream Mapping to Create Value and
Eliminate Muda', Version 1.3, June 2003, The Lean Enterprise Institute
[14] Gembutsu Consulting - The Benefits of Lean Manufacturing: Single Piece Flow - 11 July,
2011 - http://www.gembutsu.com/articles/leanmanufacturingprinciples.html
Related Documents