LEAN MANUFACTURING - AN INTEGRATED SOCIO-TECHNICAL SYSTEMS APPROACH TO WORK DESIGN A Thesis Presented to the Graduate School of Clemson University In Partial Fulfillment For the Requirements of the Degree Doctor of Philosophy Management by Mohammed Iqbal Raja May 2011 Accepted by: Dr. Lawrence Fredendall, Committee Chair Dr. Lawrence LaForge Dr. Thomas Zagenczyk Dr. Dewayne Moore

Welcome message from author
This document is posted to help you gain knowledge. Please leave a comment to let me know what you think about it! Share it to your friends and learn new things together.
Transcript

LEAN MANUFACTURING - AN INTEGRATED SOCIO-TECHNICAL SYSTEMS APPROACH TO WORK DESIGN
A Thesis Presented to
the Graduate School of Clemson University
In Partial Fulfillment For the Requirements of the Degree
Doctor of Philosophy Management
by Mohammed Iqbal Raja
May 2011
Accepted by: Dr. Lawrence Fredendall, Committee Chair
Dr. Lawrence LaForge Dr. Thomas Zagenczyk
Dr. Dewayne Moore

ii
ABSTRACT
Over the years, the manufacturing industry has witnessed a number of work
design practices, based on different principles, which have significantly shaped the nature
of work and have affected employees’ behavior and performance. This study compares
the socio-technical systems (STS) principles and lean production (LP) principles in to
explore the potential for synergistic integration between the two. They are categorized
according to the common overarching goals of these principles, and through a process of
theoretical rationalization, these categories are operationalized into the work design
practices of middle management support, social practices usage, and technical practices
usage.
A model of work design is proposed to test the relationships between these work
practices and to understand their effect on employees’ quality of work life and
performance. The effect of task interdependence is also examined since teams are the
basic unit of analysis in STS and LP approaches to work design. This model is tested
with a cross-sectional survey research in which team leaders in manufacturing plants in
the United States were the key respondents.
Statistical analyses of survey data yielded three key findings. Middle management
support has a positive direct and indirect effect on improved employee performance, a
positive direct effect on social practices usage, and a positive indirect effect on technical
practices usage and on employees’ quality of work life. Social practices usage has a total
positive direct effect on technical practices usage, and a positive indirect effect on

iii
employees’ quality of work life and their performance. Technical practices usage has a
direct effect on both quality of work life and employee performance.
This study provides empirical support for the definition of lean production posited
by Shah and Ward (2007). Results indicate that middle management is crucial for the
implementation and sustainability of a lean system because it offers the support necessary
for the usage of social and technical practices. Applications for manufacturing
organizations and suggestions for future research are presented.
Keywords: Lean principles, work design practice, socio-technical systems principles,
quality of work life, employee performance, task interdependence, manufacturing

iv
DEDICATION
This dissertation is lovingly dedicated to my parents and grandparents:
Iqbal Z Raja, Dad late Zainuddin A Raja, Dadaji
late Munira I Raja, Mom Batul Z Raja, Dadima
It was their encouragement, love, and sacrifices that enabled me to achieve this goal.
Raat jitni bhi sangeen hogi, Subah utni hi rangeen hogi.
Raat bhar ka mehman hai yeh andhera, Kiske roke ruka hai savera.

v
ACKNOWLEDGEMENTS
First and foremost, I am forever grateful to my Advisor, Dr. Lawrence Fredendall,
who patiently provided me with his guidance and expertise through every step of this
dissertation. He is a wonderful mentor, and I greatly appreciate the time he made to meet
with me regularly, and sometimes frequently, throughout this process. Dr. Fredendall
helped me to maintain a clear research focus and to progress with a clear direction.
This dissertation would certainly not have seen the light of day if it were not for
the advice and support of my committee members. I offer my deepest thanks to Dr.
Dewayne Moore for his direction on the usage and interpretation of statistical analyses
applied in this study. He has an incredible ability to explain complex statistical situations
in a manner that I could understand. I am also very thankful to Dr. Lawrence LaForge
and Dr. Thomas Zagenczyk for their valuable comments and suggestions that helped me
to improve the quality of my dissertation.
I thank my friends Ravi Narayanaswamy for providing me with input on certain
parts of this thesis, and Hari Jaganathan for his assistance in the data collection process.
Finally, I want to especially thank my wife, Tasneem, who is an endless source of
love, patience and encouragement. She has sacrificed a lot in order to support me in this
long journey.

vi
TABLE OF CONTENTS
Page
Title Page ............................................................................................................................. i
Abstract ............................................................................................................................... ii
Dedication .......................................................................................................................... iv
Acknowledgements ..............................................................................................................v
List of Tables ..................................................................................................................... ix
List of Figures .................................................................................................................... xi
Chapter 1. Introduction ..................................................................................................... 1
1.1. Background of work design practices .....................................................2
1.2. Research Questions .................................................................................7
1.3. Structure of the Dissertation ..................................................................10
Chapter 2. Literature Review .......................................................................................... 13
2.1. Socio-technical systems ........................................................................13
2.2. Lean production perspective .................................................................35
2.3. Work design practices ...........................................................................62
2.4. Quality of work life ...............................................................................88
2.5. Employee performance ..........................................................................94
Chapter 3. Research Model and Hypotheses .................................................................. 97
3.1. Conceptualization of the research model ..............................................97
3.2. Research model ...................................................................................107
Chapter 4. Research Methodology ................................................................................ 121
vii
4.1. Research design ...................................................................................121
4.2. Construct measurement .......................................................................125
4.3. Data validation ....................................................................................142
Chapter 5. Results ......................................................................................................... 153
5.1. Pre-testing ............................................................................................153
5.2. Pilot testing ..........................................................................................155
5.3. Final survey results ..............................................................................157
Chapter 6. Summary and Conclusion ........................................................................... 193
6.1. Key findings ........................................................................................193
6.2. Overall conclusions .............................................................................198
6.3. Contributions of research ....................................................................200
6.4. Limitations of the study .......................................................................202
6.5. Suggestions for future research ...........................................................204
Appendices ......................................................................................................................206
A. Items dropped, retained, and added after pilot test ..............................207
B. Sample calculation for Cohen’s K value .............................................211
C. Key respondent survey booklet ...........................................................214
D. Correlation analyses for all items ........................................................222
E. Univariate descriptive statistics ...........................................................223
References ........................................................................................................................224

viii
LIST OF TABLES
Table 1.1 A comparison of the STS/LP and Tayloristic approach to work design
practice .............................................................................................................4
Table 2.1 Work Models based on the STS approach .....................................................17
Table 2.2 Theoretical comparison of STS principles based on works of Cherns
(1987) and Clegg (2000) ...............................................................................32
Table 2.3 Commonly cited lean practices and techniques in operations
management literature ....................................................................................39
Table 2.4 Lean definitions based on a philosophical approach ......................................41
Table 2.5 Lean definitions based on a practical approach ..............................................44
Table 2.6 Bridging gap between philosophical and practical approach to
defining lean production .................................................................................46
Table 2.7 Matching lean principles by Liker and Womack and Jones to lean
principles by Dennis .......................................................................................60
Table 2.8 Meta-Analyses of employee participation studies ..........................................66
Table 2.9 Perspectives on employee empowerment .......................................................75
Table 2.10 Lean practices associated with types of waste ...............................................82
Table 2.11 Quality of Work life definitions .....................................................................90
Table 3.1 Work practices associated with LP and STS principles .................................98
Table 4.1 Criteria to determine the structure (e.g. reflective, formative) of the
constructs ......................................................................................................139
Table 5.1 Number of items entering q-sort process .....................................................153

ix
Table 5.2 Item placement ratios ...................................................................................154
Table 5.3 Construct reliabilities based on pilot data ....................................................155
Table 5.4 Number of items entering the final survey ...................................................156
Table 5.5 Industry representation in sample data .........................................................160
Table 5.6 Organizational characteristics of sample data ..............................................161
Table 5.7 Respondent characteristics of data sample ...................................................163
Table 5.8 Assessment of non-response bias .................................................................164
Table 5.9 Factor Loadings and Reliabilities .................................................................166
Table 5.10 Factor Loadings ............................................................................................167
Table 5.11 Assessment of discriminant validity .............................................................172
Table 5.12 Correlation and Average Variance Extracted ...............................................174
Table 5.13 Results of partial correlation procedure .......................................................176
Table 5.14 Item loading based on marker variable ........................................................176
Table 5.15 Results of unmeasured latent method factor ................................................179
Table 5.16 Item loading based on unmeasured latent method factor .............................180
Table 5.17 Fit of the hypothesized structural model* ....................................................184
Table 5.18 Summary of direct effectsin the proposed model .........................................185
Table 5.19 Sobel test for indirect effects ........................................................................190
Table 5.20 One-way ANOVA for process type and technical practices ........................191
Table 5.21 One-way ANOVA for Organizational Size and Technical Practice ............191
Table 6.1 Total effect decomposition ...........................................................................196
x
LIST OF FIGURES
Figure 1.1. Key to profitability using a lean approach. ..................................................... 4
Figure 2.1. Joint optimization of the STS approach ........................................................ 19
Figure 2.2. Timeline depicting the origin of lean production .......................................... 37
Figure 2.3. House of Lean Production ............................................................................. 55
Figure 3.1. Research model for lean work practice ....................................................... 108
Figure 4.1. Scale development approach (adopted from Menor and Roth, 2006) ......... 126
Figure 4.2 Data validation plan ..................................................................................... 143
Figure 4.3 Procedure to test interaction effect ............................................................... 152
Figure 5.1. Revised research model ............................................................................... 171
Figure 5.2 Hypothesized structural model with standardized path loadings ................. 184
Figure 6.2 Significant paths in the research model ........................................................ 195
1
CHAPTER 1. INTRODUCTION
Over the years, organizations have witnessed a number of work-design practices
based on different principles. These design practices have significantly shaped the nature
of work (Ohno, 1988; Cherns, 1976; Trist & Bamforth, 1951; Taylor, 1947; Taylor,
1911) and have affected employees’ behavior and performance within an organization
(Conti et.al., 2006; Liker, 2004; Bruno & Jordan, 2002; Waterson et.al., 2002 Jones,
2000; Babson, 1993). Prominent among them are the ‘Tayloristic or Fordistic’ practices
based on scientific management principles (Taylor, 1947, 1911), the ‘holistic open
systems’ practices based on the socio-technical systems (STS) principles (Hyer et.al.,
1999; Taylor & Felten, 1993; Cherns, 1987, 1976), and the lean production (LP) practices
based on the principles of the Toyota Production System (Shah & Ward, 2007; Dennis,
2007; Liker, 2004; Womack and Jones, 1996).
This study provides a clear comparison between the STS and LP approaches to
work design practice and explores the potential for synergistic integration between the
two. Specific work practices are identified from theoretical arguments in STS and LP
literature to develop an integrated model of work design practice that is grounded in both
approaches. Furthermore, the model developed in this study is an attempt to build a
theory on lean production, which is based on the definition of lean provided by Shah &
Ward (2007). To validate the theory, this model is then examined empirically to evaluate
how these practices affect employees’ performance and their quality of work life in an
organization.

2
1.1. Background of work design practices
The Fordist-Tayloristic practice developed in the 1920’s broke away from the
then popular craftsmanship approach to manufacturing. This work design practice
optimized the way in which work tasks were performed in manufacturing to improve
productivity. Taylor (1911) proposed four principles in his book, The Principles of
Scientific Management, which formed the basis of this work design practice. The first
principle focused on replacing rule-of-thumb work methods with methods based on a
scientific study of the tasks. The second principle emphasizes the need to scientifically
select, train, and develop workers, rather than leave them to train themselves. The third
principle focused on the cooperation of managers with their workers to ensure that the
scientifically developed methods were being followed. Finally, the fourth principle
referred to the execution of work, wherein the managers apply scientific management
principles to plan the work and the workers actually perform the tasks. These principles
described the application of the scientific method to the management of workers. The
Fordist-Tayloristic practice created a clear delineation of authority and responsibility by
separating planning from operations, which resulted in improved productivity (Forza,
1996).
The socio-technical systems (STS) approach developed in the 1950’s at the
Tavistock Institute of Human Relations provided a form of work design practice very
different from the traditional ‘Tayloristic’ approach (Trist & Bamforth, 1951, Trist,
1981). It proposed the introduction of autonomous work groups as the basic unit of
organizational design and emphasized the unity of preparation, execution, and control at
3
the lowest possible level in an organization (Hyer et.al., 1999). The STS approach
emphasized the joint optimization of the social and technical systems of an organization
by providing a conceptual framework and methodology to enhance the overall systems
performance (Emery, 1959, Cherns, 1976, 1987). This approach was purpose-oriented
and addressed the whole system instead of the problem-oriented or solution-oriented
approach of ‘Taylorism’, which addressed only part of the system (Taylor & Felten,
1993; Taylor & Asadorian, 1985).
The origins of the LP system can be traced to the Toyota Production System
(TPS) at Toyota Motor Company (Shah & Ward, 2007; Holweg, 2007), which
implemented the concepts of just-in-time (JIT) and ‘autonomation’. JIT emphasized low
cost production through the elimination of waste in the system (Monden, 1993; Ohno,
1988), whereas ‘autonomation’ – automation with a human touch – recognized workers’
diligence and ability; and therefore, entrusted them with greater responsibility and
authority (Sugimori et.al., 1977). The LP approach came to be known as ‘doing more
with less’ – less time, less space, less human effort, less machinery (Womack and Jones,
1996; Womack et.al., 1990). As shown in Figure 1.1, this approach focused on achieving
higher profitability by reduction costs, rather than the traditional approach of increasing
price to increase profitability (Dennis, 2007). LP approaches advocate the latter to
improve profits, thereby giving customers better quality products at for the same prices.

4
Adopted from Dennis (2007) Figure 1.1. Key to profitability using a lean approach.
Each of the three approaches discussed above have a distinct influence on the
organizational work design. However, a deeper look reveals that STS and LP approaches
have more in common with each other as opposed to the Fordist-Tayloristic approach to
work design. Table 1.1 illustrates the focus of STS and LP approaches, and the Fordist-
Tayloristic approach on organizational changes, management role changes, and employee
role changes within an organization.
Table 1.1 A comparison of the STS/LP and Tayloristic approaches to work design practice
STS / LP approach to work design
Tayloristic approach to work design
Organizational Change
1. Open systems thinking 2. Product focus 3. Semi-autonomous
groups; teams 4. Long term focus 5. Quality and quantity
1. Closed systems thinking 2. Task focus 3. Individual 4. Short term focus 5. Quantity
Management Role Change
1. Participative and collaborative
2. Empower employees 3. Encourage innovation
1. Directive and competitive
2. Command and conquer 3. Risk averse
Employee Role Change
1. Informed 2. Assertive 3. Multi-functional
skill-set 4. Empowered
1. Uninformed 2. Passive 3. Single skill-set
4. Dependent
Adapted from Taylor & Felten (1993)

5
Organizational Change
In an integrated STS and LP approach to work design, work practices are
developed as an ‘open system1’ and are based on a holistic view, which is grounded in
systems theory (Von Bertalanffy, 1950). The boundaries of work practices are defined in
terms of the product focus; hence facilitating a systems thinking approach. Semi-
autonomous groups and teamwork is promoted in these approaches (Liker, 2004; Trist,
1981). Finally, the organizations implementing the integrated STS and LP approach to
work design have a long term focus and recognize both quantity and quality as measures
for products being manufactured.
On the other hand, work practices developed based on the traditional Fordist-
Tayloristic approach to work design are developed as a ‘closed system’, wherein the
focus is only on the technical component of organizational work design. The boundaries
of work practices are based on the task that is to be performed (Dankbaar, 1997; Taylor,
1911). The unit of control is the individual workers (Taylor, 1911). Finally, the
organizations implementing the Fordist-Tayloristic approach to work design have a short
term focus and only recognize the performance of employees in terms of quantity
produced.
1 A system that spontaneously reorganizes towards states of greater heterogeneity and complexity and
achieve a steady state at a level where they can still do work (Bertalanffy, 1950)

6
Management role change
In an STS/LP approach to work design, the management role is more participative
and collaborative. Managers require employees to participate in decision making on
issues that affect their work. They act as facilitators to collaborate with employees on
how best to implement the chosen decisions. Managers empower employees to innovate
and improve existing processes (Spear & Bowen, 1999; Lawler et.al., 1995; Huber &
Brown, 1991; Ohno, 1988).
On the other hand, work practices developed based on the Tayloristic approach is
directive and competitive. Managers do not involve employees in decision making,
instead provide them with instructions. Managers tend to be competitive since they are
always trying to achieve one’s departmental goals, even if it means compromising the
overall company goals. Managers like to have control over the decision making and are
risk averse (Dankbaar, 1997; Taylor, 1911).
Employee role change
In an STS/LP approach to work design, employees are well informed about their
organization in terms of its social, technical and environmental components. They are
encouraged to be assertive and learn multiple skills so that they can perform multiple
tasks in the future (Closs et.al., 2008; Dennis, 2007; Huber & Brown, 1991). Most
importantly, the employees are empowered to make design and process changes if it
helps in both product and process improvements respectively (Ohno, 1988; Lawler et.al.,
1995).

7
On the other hand, work practices developed based on a Fordist-Tayloristic
approach to work design, the employees are uninformed, passive, and possess only a
single skill-set. They are mostly dependent on management to provide them with details
on how to perform their job (Briscoe, 1980; Taylor, 1911).
1.2. Research questions
The broad objective of this study is to provide a clear comparison between the
STS and LP approaches to work design and to explore the potential for synergistic
integration of work practices based on these two approaches. More specifically, this study
aims to identify specific work practices from theoretical arguments based on STS and
lean principles. A model of work design is then proposed to test the relationship between
the identified practices and to understand the effect of those practices on the employees’
performance and their quality of work life.
1.1.1. Research question 1
This research question is conceptualized based on the definition of lean
production proposed by Shah and Ward (2007). They defined lean as “an integrated
socio-technical system whose main objective is to eliminate waste by concurrently
reducing supplier, customer and internal variability”. The key word in this definition,
“integrated socio-technical system,” provides an answer to the question raised by
Dankbaar (1997) – can STS be subsumed under the lean production approach? However,
apart from this definition, there is no research, empirical or anecdotal, that provides an

8
explanation of how these two different approaches (i.e. lean and STS) can be combined
together in terms of an integrated work design.
At best, studies by Niepce and Molleman (1998) and Dankbaar (1997) evaluated
lean production against the STS design principles proposed by Cherns (1987). The results
of this comparison showed irreconcilable differences between the two approaches. A
study by Manz and Stewart (1997) provided a theoretical model which addressed the
potential for synergistic integration of the STS and lean practices to attain organizational
flexibility and stability. However, they conclude that “a clear understanding of the
theoretical principles underlying both STS and TQM can help researchers focus more on
the integration of these two important approaches” (pg. 68). This study identifies work
practices based on the approach used by Liu et.al. (2006). Thus the research question:
What work practices integrate the socio-technical systems and lean production
approaches to organizational work design within manufacturing?
1.1.2. Research question 2
Critics of LP argue that lean is not any different from the Tayloristic approach
(Bruno & Jordan, 2002; Dankbaar, 1997; Berggren, 1994; Babson, 1993). They refer to
LP as “High-Fordism” (Dohse et.al., 1985), “Neo-Taylorism” (Dankbaar, 1997), or
“mean production” (Babson, 1993). In fact, according to most critics, LP has revamped,
intensified, or maintained some of the defining elements of Taylorism, and has lead to a
lower quality of work life (Parker, 2003; Dankbaar, 1997). For example, the multiple
tasks are variations of similar simple jobs with shorter training requirements, representing
multi-tasking rather than multi-skilling (Delbridge et.al., 2001). Employee participation

9
in decision making is suggested to be very limited (Berggren, 1994). Team working
environment, portrayed as being positive by advocates, has been argued by critics to
exploit peer pressure to facilitate the process of intensification (Bruno & Jordon, 2002,
Babson, 1993).
On the contrary, proponents of the STS approach argue that optimization of the
social elements (human interaction) with the technical elements (processes, technology)
within an organization can lead to humanization of working conditions and improve the
quality of work life for employees (Hyer et.al., 1999; Applebaum, 1997; Trist &
Bamforth, 1951). Thus, if LP and STS approaches have two different perceived
outcomes, it is important to understand the effects of the integrated work design on the
quality of work life of employees. Thus the research question: What are the effects of
the identified organizational work practices on employees’ quality of work life?
1.1.3. Research question 3
Proponents of LP have touted unanimously that implementing lean practices has
usually resulted in improved employee performance regarding quality, delivery
reliability, productivity, and cost (Narasimhan et.al., 2006; Shah and Ward, 2003;
McLachlin, 1997; Sohal, 1996; Katayama & Bennet, 1996; Krafcik, 1988). Critics of
STS, on the other hand, have doubts about the sustainability of employee performance
when using the STS approach (Kuipers et.al., 2004; Womack et.al., 1990; Womack &
Jones, 1996). Since there are concerns about performance outputs between LP and STS
approaches, it is important to understand what effect the integrated work practices have

10
on employee performance. Thus the research question: What are the effects of the
identified organizational work practices on employee performance?
1.1.4. Research question 4
The increased use of work groups (teams) in the STS and LP approaches to work
design requires that greater importance be given to the design and implementation of the
appropriate level of task interdependence (Wageman, 1995; Saavendra et.al., 1993;
Thompson, 1967). More specifically, since the focus on work performance in
organizations has shifted from individuals to teams (Liker, 2004; Shah and Ward, 2003;
Sohal & Egglestone, 1994), it is imperative that managers consider task interdependency
when evaluating employee productivity (Treville and Antonakis, 2006; Seibert et.al,
2004; Kozlowski and Bell, 2003). To this end, this study will assess the effect of task
interdependence on the relationship between empowerment and employee performance.
Thus the research question: How does task interdependence affect employee
performance?
1.3. Structure of the dissertation
The remainder of this dissertation is organized as follows. Chapter two provides a
literature review of three different research streams that are pertinent to the formulation
of the research model. The bulk of this chapter consists of an extensive review of STS
and lean literature. Organizational behavior and design literature is used to identify work
practices that affect quality of work life and employee performance. Specifically, it
focuses on the following work practices are discussed: middle management support,

11
employee involvement, employee empowerment, and task interdependence. Operations
management literature is used to identify and describe commonly used technical
practices. Human resource management literature is used to review the quality of work
life outcome.
Chapter three provides the theoretical arguments for the conceptualization of the
research model. It contains the research model, which illustrates the relationships
between the identified work practices and the two outcomes (i.e. employee performance
and quality of work life). Lastly, a rationale for each hypothesis in this research model is
provided.
Chapter four includes the research design, with details of the qualitative and
quantitative procedures and methods used to test the research model. More specifically, it
contains information on the unit of analysis, key informant, target sample frame, sample
size, and the method for survey administration. In addition, this chapter also contains the
description of measures for constructs used in the research model.
Chapter five contains the results of the data analyses. More specifically, it
contains the description of the respondent sample, assessment of the constructs
measurement properties (i.e. construct validity, reliability, descriptive statistics) and
issues related to potential problems due to common method bias. In addition, this chapter
also contains the assessment of the structural model and the results of the hypotheses
tested in the model.
Finally, chapter six contains a summary of this dissertation. More specifically, it
contains the key findings from the data analyses, the contribution of this study to

12
academics and practitioners. Finally, it also contains the limitations and directions for
future research, and the concluding thoughts of the author.

13
CHAPTER 2. LITERATURE REVIEW
2.1. Socio-technical systems
2.1.1. Origins of socio-technical systems
The socio-technical systems (STS) approach to organizational work design was
developed in the early fifties at the Tavistock Institute of Human Relations in United
Kingdom, as a result of the labor unrest and the disappointing productivity in the British
coal mines (Dankbaar, 1997; Trist & Bamforth, 1951). The goal of this approach was to
propose a work design that achieved two values: the humanization of the workplace by
redesigning of jobs, and the democratization of the workplace to enhance organizational
performance (Emery, 1959). The STS approach immediately found home in Europe, as
there was a lack of ‘quality of working life’ value at the time, and the labor and
management were always in adversarial modes.
Different groups in Europe became interested in this new approach for different
reasons. As the region’s manufacturing industry rebuilt and expanded after World War II,
companies were faced with severe labor problems (e.g. difficulty obtaining and retaining
staff). The engineers and technologists were presented with new design options which
involved development of flexible and friendly production systems. Ergonomists started
investigating the man-machine interaction. These fertile conditions allowed for the
research, development and propagation of the STS approach to work design.
The STS approach to work design permeated several European countries during
the early sixties and seventies. In Norway, as the result of a three-phased program for the
implementation of STS, a law on working conditions was established that gave workers

14
the right to demand jobs based on the STS principles of good work practice. Sweden
followed suit and enacted a law that democratized working life. The French government
introduced legislation requiring employers to demonstrate how they had improved
working conditions and how they proposed to improve them further. A program for
humanization of work was introduced by the German ministry of labor and of science and
technology that emphasized the development of standards and minimum requirements for
machines and workplaces, the development of technologies to meet human requirements,
and models of organization of work based on the STS analysis used in Britain and
Norway (for more details see Mumford, 2006).
In the seventies, the decline in U.S. productivity due to unsatisfied employees in
the seventies aroused interest in the STS approach to organizational design (Mumford,
2006). Government and private foundations funded organizations such as the Center for
Quality of Working Life, Work in America Institute, and American Productivity Center
to foster labor-management cooperation in organizational change, and to conduct
research on national policies and issues related to quality of work life (Taylor & Felten,
1993). In addition to these organizations, many industries experimented with this
approach to improve their continuous processes; the results of which were mixed (Taylor
& Felten, 1993).
Socio-technical systems provide a conceptual framework for the identification
and management of human factors in technical environments (Trist, 1981; Trist &
Bamforth, 1951), and a methodology for the redesign of work practices in an
organization to enable more effective integration of human and technological resources

15
(Cherns, 1979, 1987; Cleggs, 2000). The STS approach emphasizes the autonomous
work groups as the basic unit of organizational design and highlights the unity of
preparation, execution, and control at the lowest possible level in an organization. An
extensive review of organizational design literature reveals that the STS approach has
never been operationally defined (Walker et.al., 2008). At best, it has been described as a
holistic ‘open systems’ approach to organizational work design (Emery, 1959;
Bertalanffy, 1950).
Researchers have taken two approaches to explaining STS. One set of researchers
has described STS as an aggregation of interacting parts in an organization - social
subsystem, technical subsystem, and environmental subsystem (Trist & Bamforth, 1951;
Emery, 1959; Taylor & Felten, 1993). The other set of researchers has described STS as a
set of principles (Davis, 66; Cherns, 1976, 1987; Clegg, 2000). The “interacting parts”
description provides insight into ‘what’ elements of work design that make up the social
subsystem and the technical subsystem. As a set of principles, STS provides insight into
‘how’ an organization achieves synergy between its technical and social systems.
2.1.2. STS as an aggregation of interacting parts
Various work models based on the STS approach consider that organizations are
made up of three components: social subsystem, technical subsystem, and environmental
subsystem. As seen in Table 2.1, the social subsystem encompasses individuals’
aptitudes, attitudes, beliefs, and relationships, both within and between groups (Carayon,
2006; Shani et.al., 1992; Pasmore, 1988). The technical subsystem encompasses how
things get done. More specifically, it consists of tools, techniques, devices, artifacts,

16
methods, configurations, procedures, technology, and knowledge used by the individuals
in an organization to acquire inputs, and transform inputs into outputs (Wilson, 2000;
Smith & Carayon, 1995; Shani et.al, 1992). The environmental subsystem consists of
several subsystems (Pasmore, 1988). It frames and balances the social and technical
subsystem interfaces with various internal and external stake holders, such as internal
politics, physical environment, organizational conditions, customers, competitors,
government, regulators, and societal and cultural pressures.

17
Table 2.1 Work models based on the STS approach
Authors Components of STS
Social Subsystem Technical Subsystem Environmental Subsystem
Wilson, 2000
People interact with…..
• Other people (cooperative interaction)
• Remote agents (temporal and spatial interaction)
• Supply chain (logistical interaction)
• Task • Hardware and
software (interface interaction)
• Structure, policy, and roles (organizational interaction)
• Environment (setting interaction)
• Society, finance, and politics (contextual interdependence)
Smith & Carayon, 1995 Individuals interact with…
• People • Task • Tools/technology
• Physical environment
• Organizational conditions
Hendrick & Kleiner, 2001
• Personnel sub-system
• Technological subsystem
• Task and organizational design
• Internal and external environment
Rasmussen, 2000
• Staff involved in planning work
• Management plans operations and supplies resources
• Productive processes and work performed by operator
• Company interacting with various regulations
• Government Moray, 2000 • Individual
behavior • Team and group
behavior
• Physical devices and physical ergonomics
• Organizational and management behavior
• Legal and regulatory rules
• Societal and cultural pressures
Adapted from Carayon (2006)

18
Mutual causality. It is seen that the social and the technical subsystems are
mutually independent with respect to their origins. The social subsystem follows the
principles of human sciences (e.g. sociology & psychology), while the technical
subsystem follows the laws of natural sciences (e.g. chemistry, physics & mathematics)
(Baba & Mejabi, 1997). However, according to Trist (1981), the two systems are
correlated, in that one needs the other for the transformation of an input into an output.
Thus, while the systems are causally independent, they are interdependent in action.
Joint optimization. The proponents of the STS approach to work design believe
that the overall performance of the system depend not on the optimization of a single
subsystem, but rather the joint optimization of the social with the technical subsystems
within the context of the given environmental subsystem (Baba & Mejabi, 1997, Taylor
& Felton, 1993; Taylor & Asadorian, 1985; Carayon, 2006). Figure 2.1 illustrates this
concept of joint optimization. The combined optimum value for the integrated socio-
technical system is greater than the individual optimum value of each system taken
separately.

19
Adopted from Taylor and Asadorian (1985)
Figure 2.1. Joint optimization of the STS approach
2.1.3. STS as a set of principles
In order to design a work system which jointly optimizes the social and technical
subsystem within an organization, researchers articulated the STS approach to
organizational work design through a set of principles (Cherns, 1976, 1987; Trist, 1981;
Clegg, 2000). Cherns (1976) compiled a set of nine principles based on the concepts
distilled from the early work of researchers at the Tavistock Institute of Human Relations
(Trist & Bamforth, 1951; Emery, 1959, Emery & Trist, 1972) to facilitate in work design
based on the STS approach. In order to incorporate the changes in the business climate
over time, Cherns amongst others (Trist, 1981; Clegg, 2000) revisited the principles
articulated to facilitate the joint optimization of the social and technical subsystem within
an organization. These researchers believed that a new or revised set of principles was

20
needed to reflect the STS approach to work design due to the effect of globalization,
newer technologies, and newer breed of workers.
Trist (1981) extended the earlier work of Cherns by providing clarity for STS
principles according to the level of implementation (e.g. work system, organizational, or
societal). Clegg (2000) explicitly provides principles that capture the design issues based
on these different levels of implementation. The meta-principles provide a systemic
worldview for design considerations, the content-principles focuses on specific aspects of
the content of the new system, and finally the process-principles emphasize an overall
process of design.
Cherns (1987) revised his earlier set of principles by including two new principles
(power and authority, and transitional organizations), while removing one (design and
human values). He suggested that this latter principle underpins all of the other principles
and hence needed to be dropped. The principle of power and authority was added to make
sure that top management does not misuse information or take charge of a situation
remotely; instead, they should provide people at the forefront with not only access to
pertinent resources, but also with the authority to command them. The principle of
transitional organization emphasizes that members of the design team are engaged in the
process of change within an organization.
2.1.3.1. STS principles based on the works of Cherns
Compatibility. This principle emphasizes that the systems design process should
be consistent with the goals of the design (Cherns 1976, 1987). The design process
should involve employee participation; and more importantly, the responsibility for
21
planning and designing of the system should rests with the people who manage and use it
(Hyer et.al., 1999). Being a participatory process, conflicts will arise as it is difficult to
satisfy all aspects of the design objectives. These conflicts can be resolved through
consensus, wherein each participating member provides rationale and assumptions to
either support their point of view or refute someone else’s. The degree of compatibility
between the process and the desired outcome achieved through the participation of
employees determines how well the other principles are implemented.
Minimum critical specification. This principle deals with specifying the ends but
not the means while undertaking a task. This principle has two aspects. Firstly, specify no
more than what is absolutely essential. Secondly, identify only what is essential and
critical to the successful completion of the task (Cherns, 1976, 1987). In other words,
determine ‘what’ has to be done, and then ‘how to do it’ should be left to the individuals
or the team performing the task. This approach encourages employees to use their
creativity and previous experiences to adapt to circumstances (Huber & Brown, 1991;
Beglund & Karltun, 2007). Once the performance criteria are set, much of the detailed
design should be determined by the employees who complete the task (Hyer et.al., 1999).
Variance control. This principle suggests that the unexpected deviations from the
standard operation procedures, plans, or routines should be controlled as close as possible
at its point of origin (Cherns, 1987). Cherns re-named this principle from its earlier name
‘sociotechnical criterion’ to incorporate and bring to surface the inefficiencies in an
organizations’ method of controlling key variances, and also lay emphasis on how to
improve it. Variances result from the inability of employees to either identify the cause of
22
the variance or correct the cause. Hence work systems should be designed such that
errors can be identified, controlled and corrected before they are fed downstream (Closs
et.al., 2008; Hyer et.al., 1999). For example, quality need not be inspected in a product; it
needs to be built into the product (Huber & Brown, 1999).
Boundary location. This principle states that boundaries, be they structural or
just an artificial demarcation, should be determined based on a logical process criterion
(Hyer et.al., 1999; Huber & Brown, 1991; Cherns, 1987). The boundary location should
be determined such that it does not impede the sharing of information, knowledge and
learning within an organization. The boundaries should not be drawn in the middle of a
process; rather they should encompass tasks that are temporally, sequentially, and
technically related to each other (Carayon, 2006; Hyer et.al., 1999). In other words, the
structures should fit the process and not vice versa (Clegg, 2000).
Information flow. This principle refers to the flow of work related information to
individuals who need it most to complete their task(s) (Cherns, 1987; Hyer et.al., 1999).
Information flows should allow for three basic purposes: (1) controlling - help monitor
the behavior of workers; (2) recording - provide management with comprehensive and
detailed information of various operations within the plant/department/work unit; and (3)
actionability – provides a feedback mechanism to control for variances (Huber & Brown,
1991). Depending on its purpose, information flow should be directed towards those who
need it first and to be able to act on it (Cherns, 1987).
Power and Authority. This principle refers to the ability of employees to access
and exercise authority over resources in order to carry out their responsibilities (Cherns,

23
1987). In addition to authority and power, this principle also focuses on the issue of
ownership of responsibilities and accountability of actions. Employees are made
responsible for completing a task successfully, while also being held accounTable for the
appropriate use of the resources to complete the task (Closs et.al., 2008).
Multi-functionality. This principle refers to the practice of developing worker
skills through training so that they could be made responsible for multiple task(s) within
their unit (Cherns 1976, 1987). The workers are not seen as expendable and functional
redundancy can be reduced by having multiple task allocation. Organizations in fast
changing markets needing product and process flexibility focus on the multi-
functionality of their workforce (Huber & Brown, 1991; Closs et.al., 2008).
“mechanistic’ organizations would achieve flexibility by hiring specialists and experts,
while ‘organic’ organizations would achieve flexibility through training employees to
be able to perform multi-tasks (Cherns (1987).
Support congruence. This principle refers to the social support structure that
should be designed to reinforce the behaviors which the organization structure is
designed to elicit (Cherns, 1976, 1987). Social support structures such as reward systems,
the selection process, training policies, conflict resolution mechanisms etc should be
consistent with the objectives that govern the design of the work system (Hyer et.al.,
1999). As newer systems and subsystems assimilate into older pre-existing ones, the
process of change can be made smooth for employees by having the appropriate support
structures (Closs et.al., 2008).

24
Transitional Organizations. This principle refers to the transitional process of
redesigning an organization from an older traditional system to a newer philosophy of
management that is based on socio-technical systems using design teams (Cherns, 1987).
The design team and its processes are viewed as vehicles of transition and it is important
that the design team and the processes therein involved in the change, do embody the
values of socio-technical systems principles (Closs et.al., 2008). The period of transition
requires a lot of planning and design. More importantly, one must be careful that
‘experts’ do not exclude users of the system while designing and implementing it. This
could lead to loss of a vital learning opportunity for users who end up using the new
system.
Incompletion. This principle refers to the efforts made to examine, critique, and
improve a system the moment it is implemented. Systems design is an iterative process.
That is, there is no such thing as a final design (Cherns, 1987). At the end we are back at
the beginning. There is no state of equilibrium. Stability is desired, but the organization
must continue to review and revise its design to reflect the appropriate changes due to the
changing environment (Huber & Brown, 1991, Closs et.al., 2008). There is always a
better way of doing things. Everyone must be able to appreciate that the design is never
finished – it is always incomplete.
2.1.3.2. STS principles – based on the works of Clegg
Design is systemic. This principle states that there are certain interdependencies
between the social and technical subsystem that may not be apparent when designing a
new system. There may be unintended consequences in the social and/or technical

25
subsystem for systems design change initiatives in an organization. According to Clegg
(2000), “some of the consequences may only become obvious when the system is in
operation.”
Values and mindset are central to design. This principle focuses on the notion
that system designers should consider employees as assets (and not costs), while
technologies (and techniques) are the tools to support employees in completing their
task(s). Designers should create a system that seeks out an appropriate balance between
human and technological activities. According to Clegg (2000), employees should not be
designed out of the system as soon it is technologically feasible; and a command and
control approach should not be adopted to manage them when it is not possible to design
them out of the system. Instead, one must challenge the existing status quo by asking
questions such as: “why are we using technology to undertake this task?”, “What are the
roles of human in this system?”, “what alternative ways are there of configuring the
work?”
Design involves making choices. This principle emphasizes that choices exists
on all dimensions in the design of a sociotechnical system (Klein, 1994) and that they are
not necessarily independent of each other. For example, a decision choice made in the
technical subsystem may influence the social subsystem and vice versa. Being dependent
does not mean that these choices are deterministic. A choice is one area does not fully
determine a choice in another. According to Clegg (2000), “choices constrain (but do not
determine) other choices”.

26
Decision should reflect the needs of the business, its users and their managers.
This principle insists on evaluating a system in terms of how well it meets the current
needs of the users, the managers and most importantly the business. Business needs may
change over time as a result of changes in the market place and changes in the strategic
direction. Users and managers need may change over time as they develop new needs and
sometimes they may not even know what they want. According to Clegg (2000), a system
that focuses on the needs of the business, the managers and its users’ has a better a
performance than companies that do not.
Design is an extended social process. This principle states that systems design is
not a ‘one-off’ thing that has a definite ending. The process of systems design continues
beyond its implementation and throughout its use. People, who use, maintain, evaluate,
and upgrade the system, continuously interpret it, amend it, massage it, make adjustments
as they see fit, and eventually (re-)configure it to accomplish their task(s). This principle
also brings out the social nature of the design process, in which various stakeholders
(internal to an organization) help shape and moderate design choices over time.
According to Clegg (2000), “different people will interpret the system in different ways,
and there needs to be structures and mechanisms through which views can be aired,
recognized, and recorded.”
Design is socially shaped. This principle is an extension of the above principle. It
makes explicit that design is shaped by a range of social partners over time. In the earlier
principle, the stakeholders referred to people within an organization (i.e internal
stakeholders), however in this principle stakeholders could be external to the

27
organization. In addition to external stakeholders, systems design could be shaped due to
the following: fad and fashion of the time, pursuit to lead, or respond to market and
competitive pressures, and government mandates.
Design is contingent. This principle acknowledges that design choices are
subject to contexts and do not have universal applicability. There is no ‘one best way’.
System designers must consider under what circumstances, systems design would
improve overall performance before designing and implementing a new system.
Core processes should be integrated. This principle emphasizes the importance
of designing integrated core processes. The boundaries of the core processes should be
based on logical process criterion before considerations of how they will be managed,
controlled, and supported (Cherns, 1976, 1987). Structure fits the process, and not vice
versa (Clegg, 2000).
Design entails multiple task allocations between and amongst humans and
machines. This principle focuses on identifying the contingencies under which the
following forms of work organizations are optimal: task allocation amongst humans, task
allocation between hardware and software, and task allocation between humans and
machines. System designers should conduct a feasibility study to determine which form
of work organization fits in a given situation. They should calculate the cost of
automation, find out the health and safety implications of allocating decisions, and
determine the characteristics of the task itself before implementing a particular form of
work organization.

28
System components should be congruent. This principle emphasizes on the set
of working arrangements that are needed to be congruent with the goals of the new
system and its practices. The working arrangements not only include the social support
structure (e.g., payment and reward system, selection system, work measurement system,
performance assessment system) but it also considers the technical support structure (e.g.,
information and control system). According to Clegg, these working arrangements do not
necessarily influence the outcomes of the new system, but that the new system could get
assimilated into the older system and its set of working arrangements.
Systems should be simple and make problems visible. This principle focuses on
the concerns regarding the ease of use, ease of understanding, and learnability of a new
system. Systems should not only be designed such that they are simple to explain and
communicate, but also are very powerful in their effects. This principle also suggests that
once a problem is detected, resources should be allocated immediately to resolve the
quality issue.
Problems should be controlled at source. This principle states that any
deviations from the ideal state should be controlled at its point of origin (Cherns, 1976,
1987). According to Clegg, the need to control problems at their source, allows for
people to take control over problems they face. They learn to perform better through
exerting control and by anticipating and solving problems.
The means of undertaking tasks should be flexibly specified. This principle
emphasizes instructions that are given to the employees to perform a certain task. Specify

29
no more than that which is absolutely essential. According to Clegg (2000), “whilst the
ends should be agreed and specified, the means should not”.
Design practice is itself a sociotechnical system. This principle states that design
teams that undertake design projects should themselves be designed in accordance to the
STS principles. The design process itself is subjected to both social and technical
changes.
Systems and their design should be owned by their managers and users. This
principle emphasizes the relationship between the notion of ownership and appropriation
of a new system within an organization. It is found that different forms of expertise are
involved at different stages, undertaking different activities while designing and
implementing a new system. According to Clegg (2000) the performance of the new
system is best when the same person is responsible for the design, implementation, and
use.
Evaluation is an essential aspect of design. This principle refers to the concept
of systematically evaluating a new system against the original goals it was supposed to
achieve. The evaluation should encompass a wide range of social, technical, operational
and financial criteria. More importantly, evaluations should be viewed as an opportunity
for learning Clegg (2000).
Design involves multidisciplinary education. This principle focuses on the
relationship between the effectiveness of a new system design with the amount of
knowledge possessed by the team that designed it. The effectiveness of a new system is
only as good as the knowledge possessed by the team designing it (i.e. a team having

30
partial knowledge will design a system that is only partially effective). Multi-disciplinary
education allows members of a team to educate each other in the complexities of designs,
and also foster creative and innovative solutions by providing a multi-disciplinary
understanding of design need.
Resources and support are required for design. This principle refers to the
investment in resources to design a new system. Resources include elements from both,
the social (e.g., time, effort, knowledge, expertise and skills of employees) and the
technical (e.g., method, tools, techniques, design structures and mechanisms) subsystem
within an organization. According to Clegg (2000), resources related to time and
expertise become crucial when they are invested in the design of a new system which is
owned and appropriated by the people who will use and manage it.
System design involves political processes. This principle highlights the need to
recognize the political nature of change. Various stakeholders of a given system are
always concerned over its design and implementation, management and use, and
evaluation changes. According to Clegg (2000), “different perspectives on change should
be respected and need to be addressed”. In addition, certain mechanisms are put in place
to handle the debate on the different perspectives of change.
2.1.4. Comparison between Cherns’ (1987) and Cleggs’ (2000) STS principles
Based on an extensive review of the STS literature, works of Cherns (1976, 1987)
and Clegg (2000) stand out as they provide a comprehensive set of principles for
designing and implementing organizational work design systems based on the joint
optimization of the social and technical subsystems within an organization. These

31
principles can be applied at both strategic and operational levels in an organization (Hyer
et.al., 1999; Berglund & Karltun, 2007; Closs et.al., 2008). However a careful
examination of Cherns (1987) and Clegg (2000) set of design principles reveal that these
principles are in no way blueprints or design rules for strict adherence for the
development of a socio-technical system. Instead these principles are for the most part,
prescriptive and are offered as a checklist for work system design.

32
Table 2.2 Theoretical comparison of STS principles based on works of Cherns (1987) and Clegg (2000)
Design Principles Clegg (2000) Cherns (1987) P# Meta-Principles P# Content-Principles P# Process-Principles
Compatibility: The process of designing a system must be compatible with the goals of the design
1
3
7
Design is systemic
Design involves making choices
Design in contingent
9 Design entails multiple task allocations between and amongst humans and machines
16
15
Evaluation is an important aspect of design
Systems and their design should be owned by their managers and users
Minimal critical specification: In the design of jobs, specify no more than what is absolutely essential Variance Control: Work is designed to control variation (deviation from the ideal) as close as possible to its source
-
11
12
13
Systems should be simple and make problems visible
Problems should be controlled at source
The means of undertaking tasks should be flexibly specified
-
Boundary condition: This should be determined based on logical process critereon Information flow - Work related information flows to one who needs it most to complete their task(s)
-
8 Core processes should be integrated
-
Power and Authority: Ability of employees to access and exercise authority over pertinent resource (technical & Social) to carry out responsibilities
2 Values and mindsets are central to design
-
18 Resources and support are required for design

33
Support Congruence: Social support structures such as reward systems, selection process, training policies, conflict resolution mechanisms, work measurement and performance assessment is designed to re-inforce behaviors which the organization structure is designed to elicit
-
10 System component should be congruent
-
Transitional organization: Involve people who use the system to re-configure the old system into a newer more effective and user friendly system
5
6
Design is an extended social process
Design is socially shaped
-
14
Design practice is itself a sociotechnical system
Incompletion: Examine, critique and improve the system the moment it is implemented
4 Design should reflect the needs of the business, its users and their managers
- -
Multi -functionality: Workers are made responsible for multiple tasks within their unit
- -
-
-
- -
17 19
Design involves multidisciplinary education
Systems design involves political processes

34
Table 2.2 demonstrates how Clegg’s (2000) set of meta-principles, content-
principles, and process-principles for organizational design are not free standing. These
principles can be associated with Cherns’ (1987) set of ten design principles. Cherns
principle of compatibility is associated with the following meta-, content-, and process-
principles suggested by Clegg: design is systemic, design involves making choices,
design is contingent, design entails multiple task allocations between and amongst
humans and machines, evaluation is an essential aspect of design, and system and their
design should be owned by their managers and users. Cherns principle of power and
authority is associated with the following meta- and process- principle suggested by
Clegg: values and mindsets are central to design and resources and support are required
for design. Cherns principle of support congruence and information flow is associated
with Clegg’s content principle, system component should be congruent. Cherns principle
of incompletion is associated with Clegg’s meta-principle of design should reflect the
needs of the business, its users and their managers. Cherns principle of transitional
organizations is associated with the following meta- and process principles suggested by
Clegg: Design is an extended social process, design is socially shaped, and design
practice is itself a sociotechnical system. Cherns principle of boundary location is
associated with Clegg’s content principle of core processes should be integrated. Cherns
principle of minimum critical specification and variance control is associated with the
following content principles suggested by Clegg: systems should be simple and make
problems visible, problems should be controlled at source, and the means of undertaking
task should be flexibly satisfied. Clegg’s process principle of design involving

35
multidisciplinary education and systems design involves political process is not explicitly
mentioned in Cherns set of 10 design principles.
2.2. Lean production perspective
2.2.1. Origins of lean production
Lean production can be traced back to the Toyota Motor Company and Toyota
Production System (Holweg, 2007; Shah & Ward, 2007; Ohno, 1988). Formed out of
sheer necessity rather than by intended design, Toyota Production System (TPS) evolved
as an alternative to the then existing mass production system (Ohno, 1988). TPS was
Toyota’s response to overcome the three daunting challenges it faced after World War II:
1) catering to the needs of a domestic market which was not only small but demanded
high product variety, 2) inability of the capital starved company to make huge
investments in western technologies, and 3) competing with well-established foreign
brands such as General Motors and Ford (Cusumano, 1985). This concept proved very
successful and came to be generalized as lean production.
In an endeavor to produce large variety in small volumes, reduce costs and
eliminate waste, Ohno (1988) laid the foundation of TPS by implementing ‘just-in-time
production’ (JIT) and ‘autonomation’. The concept of JIT emphasized low-cost
production through the elimination of waste in the system, and the concept of
autonomation – automation with a human touch – recognized the diligence and ability of
the workforce by entrusting them with greater responsibility and authority. Ohno applied
his ‘common-sense approach’ to the then existing method of mass production. He argued

36
that production in large batches resulted in higher inventory, larger warehousing needs,
tied-up capital, and most importantly, made it difficult to accommodate customer
preference for product diversity (Holweg, 2007). To resolve these issues, Ohno initiated
production in small batch sizes. Shingo’s development of the concept of single minute
exchange of dies (SMED) made it economical to produce in small batch sizes and
facilitated in the implementation of the TPS.
TPS was an implicitly communicated production system which remained internal
to Toyota plants until the mid-sixties. It was formally documented for the first time when
Toyota rolled out the ‘Kanban’ system to its suppliers in Japan. The western world began
noticing Toyota Motor Company in the early eighties when the International Motor
Vehicle Program (IMVP) published a report stating the rising threat of Japanese
automobile imports in the United States. It was during the phase-2 of the IMVP research
that practitioners and academicians became aware of TPS.
Aimed at describing and measuring the gap between the western ‘mass
production’ system and TPS, this research provided valuable insight into the
manufacturing practices of TPS and found evidence that TPS outperformed the western
‘mass production’ systems. A study conducted by Krafcik (1986) as part of the IMVP
research showed that the NUMMI plant, a joint venture between GM and Toyota,
achieved a productivity level more than 50% higher than that of any other GM plant with
similar technology in the U.S. In a follow-up study, Krafcik (1988) used the word “lean”
instead of the IMVP terminology of “fragile” to classify companies according to their
production management philosophy. Subsequently, Womack et.al., (1990) used the term

37
“lean production” to contrast TPS with the Western “mass production” system in their
book, “The Machine that Changed the World”. Figure 2.2 summarizes the development
and recognition of lean production.
Toyota Motor Company formally formed
Ohno Joins the automobile business and implemented the foundations of the Toyota Production System (TPS)
Toyota Motor Company split after World War II
Shingo is hired as an external consultant and develops the concept of SMED
Formal documentation of TPS when Kanban systems rolled out to suppliers
1937 1948 1950 1955 1965
Oil Crisis
1973 IMVP phase-1 research initiated
Conclusion of the IMVP research published in the book "Future of the Automobile"
IMVP phase-2 research initiated
International assembly benchmarking results presented by Krafcik
The IMVP benchmarking terminology 'fragile' was replaced by the term 'lean'
1979 1984 1985 1986 1988 Womack et.al. wrote the book, "Machine that changed the world" and popularized the concept of TPS as "Lean production" 1980
Figure 2.2. Timeline depicting the origin of lean production
The 80’s and 90’s saw a rise in both the conceptual and empirical understanding
of the TPS concept. This provided valuable insights into different aspects of lean
production, especially its practices. The works of Monden (1983), Pegels (1984); Lee &
Ebrahimpou (1984); Schonberger (1986), Ohno (1988), Barker (1994), and Spear &
Bowen (1999) introduced the broad concept of JIT and the practices therein to the
western world. Monden (1983) provided a list of JIT practices related to the shop floor

38
activities. Pegels described aspects (practices) of TPS which were applicable to the
assembly lines. Lee & Ebrahimpour described the practices needed for the
implementation of JIT. Schonberger (1986) stressed many of the same shop floor
practices as Monden and also included employee involvement, preventative maintenance,
and quality. Barker described a structured method to create and evaluate a value stream
map to differentiate between value and non-value added activities. Spear & Bowen
(1999) decoded the DNA of the TPS and proposed a set of four rules which emphasized
the usage of certain lean practices.
Empirical research on the TPS concept provided insights into its dissemination
into the manufacturing sector throughout the world. The work of Voss & Robinson
(1987), Suzaki (1985), and Sohal (1996) identified the JIT practices used in the UK, U.S.,
and Australia. Sakakibara et.al. (1993) provided a theoretical framework identifying 16
dimensions of JIT, along with a theoretically validated survey instrument. Karlsson &
Ahlstrom offered a model that operationalized the different principles of lean to study
change processes when implementing lean in an organization.
As shown in Table 2.3, there is no consensus on a consistent set of lean practices.
There is a varying degree of frequency that each of the practices and techniques selected
are considered in the studies reviewed. The practice of pull systems, production leveling,
production layout, setup time reduction, and cross functionality are included most often,
while that of lean accounting, Hoshin planning and empowerment are referenced least
frequently in the literature. Lean production came to mean different things to different
people (e.g., managers, academics, and consultants).

39
Table 2.3 Commonly cited lean practices and techniques in operations management literature
Practices Techniques Mo
nden
(1
983
)
Lee
& E
bra
him
pou
r (1
984
)
Peg
els
(198
4)
Su
zaki
(1
985
)
Sch
onb
erg
er (
198
6)
Fin
ch &
Co
x (1
986
)
Vo
ss &
Ro
bin
son
(19
87)
Bar
ker
(199
4)
So
hal
(1
996
)
Kar
lsso
n &
A
hls
tro
m (
1996
)
Sak
akib
ara
et.a
l.
(199
7)
McL
ach
lin (
199
7)
Ko
ufte
rou
s et
.al.
(199
8)
Wh
ite e
t.al
. (1
999)
Sp
ear
& B
ow
en (
199
9)
Lean Accounting Practices
Visual management, Value stream management,
x x
Hoshin (kanri) planning
PDCA cycle, Nemawashi, Catchball, A3 thinking,
x x
Standardized work Standard cycle times, Standard routings, Standard processing
x x x
Pull production Kanban x x x x x x x x X
Continuous flow Lot size reduction x x x x x
Heijunka – Production Leveling
Level by volume, product type, or product mix
x x x x x x x x
Production Layout Cellular Manufacturing x x x x x x x x x x x x Total productive maintenance
Predictive and preventative maintenance
x x x x x x x x
Setup time reduction SMED, Rapid tool setting
x x x X x x x x x x x
Zero defects Poka Yoke x x x x x x Visual Control Andon, 5S technique x x x x
Continuous improvement
Go see for yourself "Genchi Genbutsu"
x x x x
Cross functional work practice
Machine utilization Cross training
x x x x x x x x x

40
Academicians and practitioners in the early part of the twenty first century
focused their attention on providing an operational definition for lean production that
would alleviate problems arising from a lack of common definition (Shah & Ward, 2007;
Dennis, 2007; Narasimhan et.al., 2006; Treville & Antokanis, 2006; Bonavia & Marin,
2006; Hopp & Spearman, 2004; Liker, 2004; Shah & Ward, 2003; Womack & Jones,
1996). Researchers developed good working definitions of lean production; however,
they defined lean from two different points of view. One defined lean from a
philosophical approach, wherein the focus was on its principles and overarching goals
(Treville & Antonakis, 2006; Narasimhan et.al., 2006; Dennis, 2007; Liker, 2004; Hopp
& Spearman, 2004; Womack & Jones, 1996). The other point of view was based on a set
of management practices and techniques that can be directly observed (Shah & Ward,
2003; Li et.al., 2005; Bonavia & Marin, 2006).
2.2.2. Philosophical approach to lean
As seen in Table 2.4, the common theme across principles identified by
researchers defining lean from a philosophical approach is that of elimination of ‘waste’.
Hopp and Spearman (2004) bring in clarity to the term ‘waste’ by explicitly
distinguishing between the obvious ‘waste’ resulting from overproduction, waiting,
transportation, inappropriate processing, excess inventory, excess motion, and defects,
and the less obvious ‘waste’ resulting due to variability. Treville and Antonakis (2006)
and Narasimhan (2006) concur with Hopp and Spearman’s approach to identify and
eliminate waste. Treville and Antonakis also emphasize the value of respecting workers
in an organization.

41
Table 2.4 Lean definitions based on a philosophical approach
Authors Definition of lean
Hopp & Spearman (2004)
Production of goods or services is lean if it is accomplished with minimal buffering cost (i.e., inventory, capacity, and time) costs Principle: • Reduction in the buffering cost
Treville & Antonakis (2006)
Lean production is an integrated manufacturing system that is intended to maximize the capacity utilization and minimize the buffer inventories of a given operation through minimizing system variability (related to arrival rates, processing times, and process conformance to specifications) Principle: • Maximize capacity utilization • Reduce buffering cost (inventory reduction) • Respect for workers
Narasimhan et.al. (2006)
Production is lean if it is accomplished with minimal waste due to unneeded operations, inefficient operations, or excessive buffering in operations Principle: • Minimizing waste by reducing unneeded operations • Minimize excessive buffering
Dennis (2007) Lean Production is doing more with less - less time, less space, less human effort, less machinery, less materials-while giving customers what they want Principle: • Provide customers with high quality products at low costs in short lead times • Produce the right item at the right time in the right quantity • Strive to have automation with a human intelligence

42
• Standardization and stability of processes during production • Engage workers in production planning and problem solving
Liker (2004) No definition provided…. "lean is a philosophy that is defined by a set of guiding principles (Lander & Liker, IJOP, 2007, pp 3696) Principle: • Base management decisions on a long term philosophy even at the expense of short term gains • Create continuous process flow to bring problems to the surface • Use "pull" systems to avoid overproduction • Level out the workload • Standardized tasks are the foundations for continuous improvement and employee
empowerment • Use visual control so no problems are hidden • Use only reliable thoroughly tested technology that serves your people and process • Develop exceptional people and teams who will follow your company's philosophy • Respect your extended network of partners and suppliers by challenging them and helping them
improve • Go and see for yourself to thoroughly understand the problem • Become a learning organization through relentless reflection and continuous improvement
Womack & Jones (1996)
Lean is defined as a five step process which consists of defining customer value, defining the value stream, making it "flow", "pulling" from the customer back, and striving for excellence Principle: • Specify value for the customer • Identify the value stream for each product • Make product flow without interruptions • Produce only what is pulled by the customers just in time • Pursue perfection by complete elimination of waste
43
The principles suggested by Womack and Jones (1996) are the most frequently
cited list of lean principles found in the literature. However, these principles do not
include an emphasis on the individuals that make up the social subsystem that facilitates
the implementation and management of lean production itself. Liker (2004) extended the
works of Womack and Jones (1996) by explicitly including the ‘people focus’ in his
principles. According to Liker, an organization is ‘lean’ not when it uses a variety of TPS
tools, but when it develops appropriate lean principles and practices them diligently.
Dennis (2007) provided a set of six simplified, yet comprehensive, lean principles that
stemmed from the “house of lean” (Japanese Management Association, 1980), a visual
description of the TPS. These principles differ from the earlier works of Womack &
Jones (1996) and Liker (2004), in that they specifically focus on shop floor practices of
lean production.
2.2.3. Practical approach to lean
As seen in Table 2.5, researchers (Bonavia & Marin, 2006; Li et.al., 2005; Shah &
Ward, 2003) have also defined lean production in terms of the management practices
used to eliminate waste.

44
Table 2.5 Lean definitions based on a practical approach
Authors Definition of Lean
Shah & Ward (2003) Lean Production is a multidimensional approach that encompasses a wide variety of management practices that can work synergistically to create a streamlined high quality system that produces finished products at the pace of customer demand with little or no waste
Practice: • Lot size reduction, continuous flow, pull production, setup time reduction (JIT bundle) • Continuous improvement, quality management (TQM bundle) • Predictive and preventative maintenance (TPM bundle) • Self directed work teams, cross functional employees(HRM bundle)
Li et.al. (2005) The practice of eliminating waste (cost, time etc) in a manufacturing system, characterized by reduced setup times, small lot sizes, and pull production Practice: • Setup time reduction, pull production, continuous quality improvement, lot size reduction
Bonavia & Marin (2006)
Set of techniques and tools designed to increase business competitiveness by systematically eliminating all kinds of waste Practice: • Cross functional employees, quality circles • Cellular manufacturing, group technology, setup time reduction, production leveling, pull
system • Total productive maintenance • Quality control, standardized work, visual control

45
It is worth noting that every researcher has identified a set of different practices to define
lean. A study by Shah & Ward (2003) explains the multi-dimensionality of lean
production by providing a comprehensive list of management practices. These practices,
depending on their function, were then categorized into one of four bundles: Just-In-
Time (JIT), Total Quality Management (TQM), Total Productivity Management (TPM),
and Human Resource Management (HRM). Li et.al. (2005) defined lean based only on
the JIT and TQM bundles. Bonavia and Marin (2006) corroborate the findings of Shah &
Ward (2003), that lean production is a multi-dimensional concept and to achieve the true
benefits of lean production, organizations must implement appropriate practices from all
four bundles.
2.2.4. Reconciling the philosophical and practical approaches to lean
Lean principles provide an understanding of why things are done, and a basis for
judging whether an organization’s progress is consistent with those principles. However,
the principles are abstract in nature; they are descriptive fundamental assumptions that
are accepted as truth and used as a basis for reasoning. Practice, on the other hand, is the
observable facet of principles and is conceived as activities or sets of activities that help
achieve the principles (Dean & Bowen, 1994). Hence, in order to fully understand lean
production, it is not only important that we understand the principles, but it is imperative
that we understand the practices and techniques therein.
Shah and Ward (2007) bridged the definitional gap between the philosophical and
practical approaches to lean by explicitly defining lean as both a principle and a set of
practices (Table 2.6). They define lean as “an integrated socio-technical system whose

46
main objective is to eliminate waste by concurrently reducing or minimizing supplier,
customer, and internal variability”. This definition allows for both the philosophical
theme of reducing waste and eliminating variability, and also for the social and technical
practices needed to achieve the philosophical objective.
Table 2.6 Lean production defined as a principle and a practice
Shah & Ward (2007)
Lean production is an integrated socio-technical system whose main objective is to eliminate waste by concurrently reducing or minimizing supplier, customer, and internal variability Principle Associated Practice Eliminate waste (obvious and not so obvious)
Minimizing supplier, customer, and internal variability
2.2.5. Principles of lean production
Researchers accept the fact that lean production has become a common if not an
integral part of the manufacturing landscape all across the globe in the last couple of
decades (Voss & Robinson, 1987; Sohal and Egglestone, 1994; Karlsson & Ahlstrom,
1996; Pannizzolo, 1998; Sanchez & Perez, 2001; Shah & Ward, 2003; Hopp &
Spearman, 2004). The benefits of lean implementation are well accepted by both
academicians and practitioners’ alike (Krafcik, 1988; Womack et.al., 1990; Sohal, 1996;
Shah & Ward, 2003; Spear, 2004; Liker, 2004; Browning & Heath, 2009). In this section
we will review the most widely applied lean production principles that are instrumental in
companies achieving the benefits from implementing lean production. These principles
provide an understanding of why things are done, and a base for judging whether the
progress made is consistent with those principles in an organization.

47
2.2.5.1. Lean principles based on the works of Womack & Jones
Womack & Jones (1996) proposed five principles which formed the early
foundation of lean implementation in the western world. According to them: (1) specify
value for the customer, (2) identify the value stream for each product to distinguish
between value added and non value added activities, (3) make the product flow without
interruptions, (4) let customer pull value from the producer, and (5) pursue perfection by
complete elimination of waste. These five principles were specified at a philosophical
level, and could be applied to different business contexts.
Specify value for the customer. Specifying “value” for the customer is a critical
starting point for lean thinking. “Value” can only be defined by the customer. It is
meaningful when expressed in terms of a specific product (e.g., goods or service), which
meets customers’ needs at a specific price and at a specific time. In a manufacturing
organization, “value” added may involve any activity that increases the market form or
function of the product, for which the customer is willing to pay.
Identify the value stream for each product. Organizations that recognize “value”
in terms of their customer expectations need to next focus on identifying the value stream
for each of their product. Value stream defined as, “specific activities required to design,
order, and provide a specific product, from concept to launch, order to delivery, raw
material into to finished goods into the hands of the customer” (Womack & Jones, 1996),
helps distinguish the value adding activities from the non value adding activities for each
product being manufactured. Three types of activities need to be evaluated while
analyzing a value stream – one kind adds value, and the other two are wastes (type 1 and

48
type 2). The value added activities are those that unambiguously create “value” for the
customer. Type 1 waste, include activities that create no “value”, but are necessary to
maintain operations, by assisting the operators, managers, or stake holders (inventory
clerk, maintenance department, accounting department). Type 2 wastes, include activities
that create absolutely no value and can be avoided (e.g. rework, scrap, waiting times).
Make the product flow without interruptions. A value stream that provides
customer “value” is just not sufficient. Organizations need to focus on achieving an
uninterrupted flow of material through the entire value chain. Flow is often interrupted by
poor process visibility, long changeovers times, unexpected machine breakdowns or poor
cooperation with suppliers. Uninterrupted product flow defined as, “a progressive
achievement of tasks along the value stream so that a product proceeds from design to
launch, order to delivery and raw materials into finished goods for the customer with no
stoppages, scrap or backflows” (Womack & Jones, 1996) helps ensure continuous flow.
In order to achieve uninterrupted product flow, Womack and Jones suggest that one
should move away from the traditional large batch and queue approach to production.
Let customer pull value from the producer. Having developed a value stream
which facilitates uninterrupted product flow, organizations should make sure that
production matches with the pace of the customer demand. Customer demand, thus acts
as a trigger mechanism for production to start. Organizations need to make sure that they
produce only what the customer needs (in terms of both quantity and timing). This pull
mechanism defined as, “a system of cascading production and delivery instructions from
downstream to upstream in which nothing is produced by the upstream supplier until the

49
downstream customer signals a need” (Womack & Jones, 1996) makes certain that
unnecessary inventory buildup is avoided.
Pursue perfection by eliminating all kinds of “waste”. Once the above
principles are in place and organizations can sustain them, they should strive to maximize
the value for the customer by pursuing perfection, i.e. develop routines that continuously
help minimize the non value added activities (both type 1 and type 2). The pursuit of lean
is a never ending process. There will always be activities that may be considered waste in
the value stream.
2.2.5.2. Lean principles based on the works of Liker
Liker (2004) in his book, “The Toyota Way”, extended the works of Womack and
Jones (1996) by explicitly including the ‘people focus’ in his principles. He described
lean production using a list of fourteen principles based on his experiences at different
Toyota plants. Liker’s study emphasized that using a variety of TPS tools is not
considered as being lean, but it is about developing the principles that are right for the
organization and diligently practicing them that makes an organization lean.
Base your management decisions on a long term philosophy, even at the
expense of short term financial goals. This principle focuses on long term thinking.
Managing decisions based on a long term philosophy, even at the expense of short term
financial goals forms the bedrock for all other principles, as it determines the kind of
decisions organizations will take in given situations. Organizations should develop a
mission which creates value for its customer, employees, and the society as a whole. This

50
way of thinking helps organizations create a constancy of purpose and hence everything
the organization does is subjugated to this guiding principle.
Create continuous process flow to bring problems to the surface. This principle
focuses on the elimination of waste resulting from waiting, transportation, and
inappropriate processing (Shingo, 1992). Continuous flow results in the lowering of cycle
time by minimizing the inter-operation time (queue and waiting) between tasks. This
results in bringing to surface the inefficiencies in the system. Problems surface in a
continuous flow process since there are no capacity, inventory, and time buffers to hide
the inefficiencies in the process. Thus creating a continuous flow is an essential principle
for organizations that want to start their journey to becoming lean.
Use “pull” systems to avoid overproduction. This principle focuses on the
elimination of waste resulting from overproduction. Customer orders which initiate
production form the basis for pull production. The purest form of pull production is
illustrated in the previous principle of continuous flow (a.k.a one piece flow) wherein a
product is manufactured only at the moment it is needed in the shortest cycle time
possible. However in instances when one-piece flow is not possible because processes are
too far apart or the cycle times to perform the operations vary a great deal, organizations
must resort to the principle of pull, i.e. provide customer with what they need, when they
need it, and in the amount they need it. Rother and Shook (1999) suggest that, “flow
where you can, pull where you must”.
Level out the workload (heijunka). This principle focuses on the elimination of
waste resulting from the production variability (Sugimori et.al., 1977). The principle of

51
“Heijunka” suggest that production should be leveled in terms of both volume and
product mix. This can be achieved when production is not be based on the actual flow of
customer orders, but based on the total volume of orders placed in a certain time period.
Thus a leveled out workload results in producing the same amount and mix each day.
Build a culture of stopping to fix problems, to get quality right the first time.
This principle focuses on the elimination of waste resulting from defective parts being
produced, and is the second pillar of the TPS – Jidoka (Ohno, 1988). This principle
emphasizes the importance placed on the culture to stop the line in case of defective parts
being produced. In case of machines, built-in devices will automatically stop the machine
when it detects a problem, while in case of humans, they are given the authority to push a
button or pull cords – “andon cords” which can bring a machine or an entire line to a
stop. The machine or the line remains shut until the root cause of the problem has been
resolved. This culture of stopping the machine/production line makes certain that
defective parts are not sent downstream.
Standardize tasks are the foundations for continuous improvement and
employee empowerment. This principle focuses on the elimination of waste resulting
from the inappropriate processing and variability due to different work methods.
Standardization of the activities (tasks), connections, and production flows, lead to
flexibility, adaptability, and creativity (Spear & Bowen, 1999). Whenever a standard is
specified, an implicit hypothesis is created. This hypothesis is then tested to see if it is
supported. This process of testing new hypotheses eventually leads to continuous

52
improvement. In addition the ability of employees to experiment with already set
standards, leads to employee empowerment.
Use visual control so no problems are hidden. This principle focuses on the
elimination of waste resulting from unnecessary motion and defective parts being
produced. Visual control makes certain that the information regarding processes,
equipment and inventory buildup is not only visually observable, but it is also easily
accessible. This can be achieved when the visual indicators are placed close to the work
areas. Being able to detect any deviations from the standards quickly results in improved
productivity, reduced defects and mistakes, improves safety and most importantly
facilitates communication between workers.
Use only reliable, thoroughly tested technology that serves your people and
processes. This principle focuses on valuing people over technology. Adoption of a new
technology must support the people, processes, and the values of the organization, and
not displace or replace them. Before implementing a new technology it must be
thoroughly evaluated against existing processes to determine if it does not conflict with
the organization’s philosophy and operating principles. If pilot proves that the new
technology does not conflict with the existing processes and more importantly, it adds
“value”, it is quickly implemented after a process of consensus analysis involving all the
stake holders affected by the new technology.
Grow leaders who thoroughly understand the work, live the philosophy, and
teach it to others. This principle focuses on tapping the human potential available within
the organization, i.e. growing leaders from within the organization rather than bringing

53
them from outside. People within an organization, who thoroughly understand the
culture, when chosen to be leaders provide the same constancy of purpose as their
predecessors. These people make an effort to support the same culture year after year and
train the subordinates to live by the same philosophy, they live by so as to create an
environment for a learning organization. This results in laying the groundwork for
genuine long term success.
Develop exceptional people and teams who will follow your company’s
philosophy. This principle also focuses on the tapping of the human potential, however
in this case the human potential is obtained externally (new job applicants). After a
thorough screening process, they are groomed internally through training to fit the
organizations culture. Training involves developing both the individual’s technical
knowledge and other broad range of skill required to do the job, and his ability to work
on a team. Organizations investing in people, in return get a committed worker and team
player who shows up every day on time and is motivated to continually improve the
process.
Respect your extended network of partners and suppliers by challenging them
and helping them improve. This principle focuses on elimination of waste resulting from
supplier variability. Organizations that not only respect but also help their suppliers
improve by challenging them, grow together to mutually benefit in the long term.
However care should be taken in indentifying a supplier. The supplier selected must
prove their sincerity and commitment to the organizational goals and objectives. Once
selected the supplier is not replaced except for the most egregious behavior.

54
Go and see for yourself to thoroughly understand the situation. This principle
emphasizes on the need to get on to the shop floor and see for one’s self how work
methods and work processes are executed and implemented. Individuals should think and
speak based on personally verified data and information. Do not rely on others for
information. The process of problem solving is best executed when one goes to the root
cause of the problem by visiting the actual place (Gemba) where it occurred to resolve it.
Make decisions slowly by consensus, thoroughly considering all options,
implement decisions rapidly. This principle includes an important process of
“nemawashi”, i.e. focus on the approach of how one arrives at a decision, let alone the
quality of the decision. Decisions are made only after covering all the facts, alternatives,
and consulting with the people who will be affected by the outcome of the decision.
Involving a broad range of people in decision making is a tough task, however when
consensus is achieved, the implementation process is quick and smoother.
Become a learning organization through relentless reflection and continuous
improvement (Kaizen). This principle focuses on learning by establishing a process for
continuous monitoring (Hansei) and continuous improvement (Kaizen). Learning
organizations do not adopt and develop new skills, but instead, they put a second level of
learning which focuses on learning how to learn new skills, knowledge and capabilities
(Senge, 1990). This is achieved when organizations view errors as opportunities for
learning (Spear & Bowen, 1999), take corrective actions immediately and distribute the
knowledge about each experience broadly.

55
2.2.5.3. Lean principles based on the “House of Lean”
Dennis (2007) in his book, “Lean Production Simplified”, described lean
production based on the illustration of the ‘house of lean production’ (referred to as the
‘house’, hereafter). This description of lean production differs from the earlier works of
Womack & Jones (1996) and Liker (2004) because it is specifically aimed at the shop
floor practices of lean. As shown in Fig 2.3, the description of the different parts of the
“house of lean production” can be drawn on to develop lean principles which are
applicable at the shop floor level.
Adapted from Japanese Management Association (1980)
Figure 2.3. House of lean production
Jidoka Just-in- time
Goal
Standardization and Stability
Employee Involvement
Base production decision to meetcustomer expectations
Build a culture of participatory
management that engage and involve employees in decision making
which affect their jobs
Focus on labor utilization rather
than machine utilization
Process stability and standardization are the foundations for
continuous improvements
Create a
production system that produces
the right component part at the
right time in the right quantity
Stop
production so that
production
never stops

56
Base production decision to meet customer expectations. The roof of the
‘house’ represents the goals of an organization in terms of the quality, costs, delivery
time of its products, safety of its employees, and environmental obligations. Lean
production is not a complex idea; however its implementation which allows organizations
to achieve high product quality at low cost, in the shortest time possible by eliminating
waste and maintaining employee safety and environmental obligations requires not only
time, but also money. Production decisions may involve changes in equipment and/or
equipment layout, additional training for employees and more importantly a change in the
management culture. Thus implementation of lean production requires planning for the
long term and is always subjugated to fulfilling the needs and expectations of the
customers.
Process stability and standardization are the foundations for continuous
improvements. The foundation of the ‘house’ represents standardization and stability of
the production processes within an organization. Standardization is a tool for developing,
confirming, and improving the set of steps or actions of a particular task/process with
clearly defined goals. Standardization of the task/process allows for repeatability of the
task/process by providing clear start and end points for each process; preserving the
know-how and expertise to accomplish the task; assessing the current condition to
identify problems through checkpoints in the process; and providing a basis for employee
training (Spear & Bowen, 1999). Process improvements within an organization cannot
occur without stability. In order to achieve stability one must create standards. However,
standards which are not stable are worthless. Hence stability without standardization and

57
standardization without stability are meaningless terms. Together these terms help
identify the ‘muda’ or waste in the system so that we can continually improve our
processes.
Create a production system that produces the right component part at the right
time in the right quantity. One of the two pillars of the ‘house’ is the concept of Just-in-
time (JIT) production system. The JIT production system is designed for efficient, quality
production with an emphasis on the idea of customer pull so that there is a value flow
rather than material flow through the system. It is a production system which focuses on
lot-less production and strives to have one unit of work-in-progress at any moment in
time. The production lead times are greatly shortened by having all processes to produce
the necessary parts at the necessary time and in the necessary quantity, while having only
the minimum stock on hand necessary to hold the process together.
Stop production – so that production never stops. The second pillar of the
‘house’ is the concept of jidoka or autonomation (i.e. automation with a human mind).
This concept reflects the idea that intelligent workers and machines can identify errors
and can take quick counter measures to fix it. Jidoka lays’ a strong emphasis on defect
prevention and considers it okay to stop the production line to eliminate the root causes
of the defects.
Build a culture of participatory management that engage and involve employees
in decision making which affect their jobs. The heart of the ‘house’ is the concept of
employee involvement. Ohno very early in his career realized the importance of engaging
and involving employees in the process of production planning and problem solving. He

58
believed that employee involvement helps develop the capabilities of the employees and
improves the prospect for long term success. In order to successfully handle today’s
rapidly changing markets and technological needs companies need to be flexible and
creative. No amount of investment in technology alone will help companies achieve that
flexibility and creativity, if the employees are not involved in the decision making
processes.
Focus on labor utilization rather than machine utilization. The final principle is
borne out of the concept of Jidoka or ‘autonomation’ and just-in-time production. With
autonomation, there is no need for workers to stand by a machine as they are designed to
stop automatically or emit signals when defects occur or the required quantity has been
produced. In a just-in-time production system the machines need not be utilized as much
as they would in a mass production system. In order to compensate this loss of machine
utilization, organizations focus their efforts on maximizing the use of labor. Since
autonomation helps separate the workers from the machines and a worker can operate
more than one machine, it is reasonable for organizations to sacrifice machine utilization
in lieu of labor utilization.
2.2.6. Comparison between principles based on the works of Womack & Jones (1996), Liker (2004), and Dennis (2007)
A careful comparison between the three different sets of principles reveals that the
all of the lean principles suggested by Womack & Jones (1996) can be associated with
the lean principles developed by Dennis (2007). However, not all of Liker’s (2004)
principles can be matched to Dennis’s (2007). One possible explanation for this is that

59
Liker (2004) provides principles for both strategic and shop floor lean implementation,
while Dennis’s (2007) principles focus primarily on shop floor lean implementation.
Table 2.7 details how the principles of Liker (2004) and Womack and Jones (1996)
match to the six principles that Dennis (2007) conceptualized from the “House of Lean”.

60
Table 2.7 Matching lean principles by Liker and Womack & Jones to lean principles by Dennis
Principles based on Dennis (2007) Principles based on Liker (2004) Principles based on Womack & Jones (1996)
Match 1 Base production decisions to meet customer expectations
Base Management decisions on a long term philosophy, even at the expense of short term financial goals
Specify value for the customer
Match 2
Process stability and standardization are the foundations for continuous improvements
Standardized tasks are the foundations for continuous improvement and employee empowerment
Become a learning organization through relentless reflection and continuous improvement
Identify the value stream for each product
Match 3
Create a production system that produces the right component part at the right time in the right quantity
Create continuous process flow to bring problems to the surface
Use "pull" systems to avoid overproduction
Level out the workload
Make product flow without interruptions
Let customer pull value from the producer
Match 4
Stop production - so that production never stops
Build a culture of stopping to fix problems, to get quality right the first time
-
Match 5
Build a culture of participatory management that engage and involve employees in decision making which affect their jobs
Make decisions slowly by consensus, thoroughly considering all options, implement decisions rapidly
Develop exceptional people and teams who will follow your company's philosophy
-
Match 6 Focus on labor utilization and not machine utilization
Use only reliable thoroughly tested technology that serves your people and processes
-
Use visual control so no problems are hidden* Go and see for yourself to thoroughly understand the situation* Grow leaders who thoroughly understand the work, live the philosophy, and teach it to others** Respect your extended network of partners and suppliers by continually challenging them and helping them improve***
-
* This is more of a practice than a principle ** This is a lean principle at the strategic level involving top level human resource management decisions *** This principles extends beyond the shop floor and is external to an organization

61
Match 1. These principles form the bedrock for all other principles. These
principles emphasize that everything one does in a lean organization should be
subjugated to the needs and expectations of the customer. Production decisions or
management decisions must be made after considering customers’ “value” proposition of
goods or services (Womack & Jones, 1996), even if it means to forego financial gain in
the short term (Liker, 2004).
Match 2. These principles focus on the establishment of standards and
continuous improvement once the standards are stable. The establishment of standards
not only helps eliminate wastes resulting from inappropriate processing (Liker, 2004,
Womack & Jones, 1996), but also allows for identifying the value stream for each
product (Womack & Jones, 1996). Once standards are stabilized, they are explicitly
stated as hypotheses, which can then be tested. The hypotheses form the basis of
scientific learning and facilitate in the process of continuous improvement resulting in the
elimination of waste (Liker, 2004; Womack & Jones, 1996).
Match 3. These principles emphasize value flow rather than material flow in the
production system. Customer demand acts as a trigger mechanism for production to start
and dictates which items need to be produced, as well as their quantity and timing, to
avoid overproduction (Liker, 2004; Womack & Jones, 1996). Making product flow
without interruptions (i.e. continuous flow) is the purest form of a pull system. It focuses
on producing parts in the shortest cycle time possible by applying good scheduling
techniques and eliminating waiting time. Thus resulting in bringing system inefficiencies
come to the surface (Liker, 2004).
62
Match 4. These principles aim to reduce or eliminate waste resulting from the
production of defective parts. A machine or production line is stopped until the root
cause of the problem is resolved. This practice makes certain that defective parts are not
sent downstream, and that the same problem does not recur (Liker, 2004).
Match 5. These principles stress the importance of treating employees with
respect and making full use of their capabilities and potential (Ohno, 1988). The process
of “nemawashi” refers to the involvement of employees in the decision making process
when it affects their jobs. This process focuses on the approach to decision making rather
than the outcome and quality of the decisions (Liker, 2004).
Match 6. These principles suggest that companies should value people over
technology. Technology must support the people, processes, and the values of the
organization, and not displace or replace them. It is important that a new technology be
tested and evaluated against existing processes to determine if it conflicts with the
organization’s philosophy and its operating principles. If it does, then labor utilization
should prevail over machine utilization.
2.3. Work design practices
2.3.1. Middle management support
There is absolute agreement amongst academicians and practitioners that any new
initiative within an organization cannot be successful without the support of its top
management (Ahire et.al., 1996; Anderson et.al., 1994; Flynn et.al., 1994). However in
some cases, programs have failed even with this support. Amongst many possible

63
explanations, middle management support seems to be a strong candidate (Pappas et.al.,
2003; Facteau et.al., 1995; Brennan, 1991). It is middle management support that is
crucial in translating the organizational policies and top management directives into
practices and action.
Middle management support, similar to top management support, comes in three
forms: interpersonal relations, information processing, and decision making (Mintzberg
1973). The difference is that the former views work on an operational level and has a
short-term outlook, whereas top management support has a broader, more strategic focus
and a long-term outlook. In addition, middle management support serves two
instrumental roles of providing pertinent information to top management and executing
strategies formulated by them (Hrebiniak, 1984).
Middle management, which represents the middle of an organization, is the
crucial link between individual employees/teams and top management directives
(Balogun, 2003; Mintzberg et.al., 2003; Likert, 1961). It connects an organization’s
strategic and operational levels through the process of mediation, negotiation, and
interpretation activities (Balogun & Johnson, 2004). In a study by King et.al. (2001),
middle management support is viewed as a catalyst that identifies, develops, and
formulates operational strategies according to top management’s organizational
strategies, leading to improved performance.
From a change theory perspective, middle management support is crucial to
initiate, create, and sustain organizational change (Oshry, 1999). Top management does
not manage change; it enables middle management to understand why the change is

64
needed, solicits input on how to achieve this change, and allows them to communicate
this change to their workers (O’Toole, 1995). Top management expects middle
management to provide the oversight and guidance needed to create the requisite
collaboration and teamwork (Kuo-Wei, 2005) by interpreting top management objectives,
managing the change, and encouraging learning throughout the organization (Mintzberg
et.al., 2003; Balogun & Johnson, 2004). More importantly, middle management support
is crucial in maintaining clarity of the message through a top-down hierarchy. If clarity or
sincerity is compromised, the say/do gap begins to widen (Senge, 1990).
Middle management support has become recognized as a critical source to
organizational success (Huy, 2001). They help support top management’s organizational
strategic direction by championing alternatives at the operational levels (Burgelman,
1983), synthesizing information based on internal and external events (Westley, 1990)
and implement top management’s strategy. Through consensus building (Rue & Byars,
2003; Pappas et.al., 2003), middle management facilitates the implemention of actions
and decisions that align with the advocated vision of top management (Senge, 1990;
Valentino, 2004). In a study by Kraut et.al., (1989), the most important tasks for middle
management involve planning and allocating resources among different groups,
coordinating interdependent groups, and managing group performance within their span
of control. In the traditional organizational hierarchical structure, middle management
supports the resolution of internal conflicts, ensures standards are satisfied throughout
operational units, and supports hierarchical flow of information (Mintzberg et.al., 2003).

65
For the purpose of this study, middle management support is defined as a set of
managerial activities that facilitate the provision of resources and communication of top
management directives to employees to improve organizational performance.
2.3.2. Employee participation versus employee involvement
A review of organizational behavior and human resource management literature
reveals that “employee involvement”, “employee participation”, and “participative
decision making” have been used interchangeably in many instances (Lawler, 1991;
Cotton, 1993; Marshall & Stohl, 1993; Glew et.al., 1995; Shadur et.al., 1999). As the
latter two terms are similar, employee participation and employee involvement are
distinguished further to provide clarification.
2.3.2.1. Employee participation
“Employee participation” is concerned with shared decision making in the work
environment (Mitchell, 1973). Over the years, employee participation has come to mean
different things to different people. As seen in Table 2.8, not only has it been
conceptualized in numerous ways, but when implemented in a laboratory or
organizational setting, it brings diverse outcomes based on the innumerable methodology,
participation processes and forms used to measure it (Locke & Schweiger, 1979; Miller
& Monge, 1986; Guzzo et.al., 1985; Cotton et.al., 1988; Leana et.al., 1990).

66
Table 2.8 Meta-analyses of employee participation studies
Author Conceptualization
Context of Study
Type of Setting Outcomes
Locke & Schweiger (1979)
Based on Methodology
Laboratory Studies
Co-relational field studies
Multivariate experimental field studies
Controlled experimental field studies
No effect on productivity and satisfaction
No effect on productivity, slight effect on satisfaction
Difficult to determine of the results were due to participation
Positive effect on satisfaction, however not consistently
Miller & Monge (1986)
Based on Participation Process
Cognitive Model
Affective model
Contingency Model
Stronger relationship with productivity as opposed to satisfaction
Strong correlation between participation and satisfaction
No effect on productivity and satisfaction

67
Cotton et.al. (1988) Based on form Participation in work decisions
Consultative participation
Short term participation
Informal participation
Employee ownership
Representative participation
Positive effect with performance and mixed effect with satisfaction
Inconclusive effect with both performance and satisfaction
No effect on both performance and satisfaction
Positive effect with both performance and satisfaction
Positive effect with both performance and satisfaction
No effect on performance and satisfaction
Guzzo et.al. (1985) Based on participation programs
Training and instruction, Goal setting
Socio-technical intervention
Financial compensation
Strongest positive effect on productivity improvement
Positive effect on productivity, however not

68
Recruitment and selection, Appraisal and feedback, Management by objectives
Work re-design, Decision making techniques, Supervisory methods, Work rescheduling
Kind and size of organization
Multiple program implementation
statistically significant
positive effect on productivity for smaller sized, governmental kinds of organization rather than larger managerial/professionally run organizations
Combined effect is not as great as the simple sum of the their separate effects

69
Locke & Schweiger (1979) were the first researchers to take a comprehensive
look at the participation management literature. They reviewed 50 studies with
“satisfaction” and “productivity” as the criterion variables. Their study divided the extant
literature into four general categories based on the methodology used: laboratory studies,
correlational field studies, multivariate experimental field studies, and univariate
(controlled) experimental field studies. While they concluded that employee participation
did not relate to productivity, they did find that employee participation increased
employee satisfaction in approximately 60% of their reviewed studies. Miller & Monge
(1986) found fault with the classification system of Locke & Schweiger (1979), stating it
was too general to provide any meaningful information on the strength of the relationship
between participation, productivity and satisfaction. They criticized Locke and
Schweiger’s (1979) work for not attempting to detect the systemic differences in the
studies that found participation to be superior as compared to those who found it inferior.
In their study, Miller and Monge (1986) focused on variables, identified from the
cognitive2, affective3 and contingency4 models, that may have moderated the relationship
between employee participation and the outcomes of satisfaction and productivity.
Participation had no effect on productivity and satisfaction when using the contingency
model, and there were varying degrees of positive relationship between participation and
productivity and satisfaction when using the cognitive and affective models. 2 Concerned with the meaningful utilization of employees capabilities and views satisfaction as a by-
product of the participation process (Miles and Ritchie, 1970) 3 Concerned with the participation and consulting activities of employees to satisfy the egoistic needs so
that they will be more cooperative to management decisions (Miles and Ritchie, 1970) 4 Concerned with a variety of factors such as individuals’ personality, particular decision situations, nature
of relationships between individuals, job levels, individuals’ values participating in organizational decision
making (Vroom, 1960)

70
Cotton et.al. (1988) provided a classification scheme, based on the works of
Dachler and Wilpert (1978), that identified the various forms of participation. More
specifically, participation in work decisions, informal participation, and employee
ownership had a positive effect on productivity and satisfaction. Short term participation
and representative participation had no effects on productivity and satisfaction.
Consultative participation offered inconclusive results. Leana et.al. (1990), however,
rejected the conclusions of Cotton et.al., noting that generalization was not possible due
to methodological inconsistencies within their study. The issue of questionable
methodologies was also raised by Wagner and Gooding (1987), who found that studies
using questionable methodologies led to stronger findings for employee participation and
its relationship to productivity and satisfaction.
The divergence of outcomes for this research topic stems from a lack of
consensus among researchers as to what organizational phenomena, dimension, or event
should be labeled as “participation”. Many different techniques have been classified
under the employee participation rubric (Glew et.al., 1995; Coye and Belohlav, 1995).
There is no agreed upon definition of employee participation. Also, participative
programs have varying degrees of effect on different levels within an organization. Some
programs include only a few individuals or teams, whereas others may include whole
plants or corporations.
In order to address the confusion surrounding the concept of employee
participation, Lawler (1986) posited that researchers use a different perspective to study
the concept of employee participation. He introduced the concept of employee

71
involvement. With this conceptualization, researchers began to examine “how”
employees participate in programs rather than in “what” programs they participate. That
is, their focus shifted from describing the process to evaluating the underlying factors in
the employee participation process.
2.3.2.2. Employee involvement
Employee involvement is an action-oriented organizational process characteristic
that is used to manage organizational behavior (Coye & Belohlav, 1995). A review of the
employee involvement literature reveals that employee involvement interventions lead to
both higher productivity (Kaufman, 2003; Hanna et.al., 2000; Lawler et.al., 1995; Lawler
et.al., 1992) and improved quality of work life (Huse & Cummings, 1985; Riordan et.al.,
2005). Employee involvement is a bottom-up approach to management decision making,
in which employees are encouraged to participate in activities aimed at defining and
solving problems to improve their workplace (Shah & Ward, 2003; Ohno, 1988;
Sugimori et.al., 1977).
Employee involvement is defined as an approach to manage organizational
performance, in which employees have a sense of controlling their work, receive
information about their work and performance, and are rewarded for their performance
(Lawler et.al., 1992). The managerial practices that facilitate employee involvement
consist of four critical factors:
• information sharing – degree of downward and upward flow of information; • training – expertise and knowledge of the specific operations and organization
in general; • rewards – types of rewards and compensation used; and

72
• power sharing – type of power and the areas in which they are used.
For an employee involvement program to be successful, all four factors should be
integrated in parallel (Frey, 1993). Lawler and Bowen (1995) assert that:
Power without training, information, and rewards leads to poor decision making.
Information and training without power leads to frustration because employees
cannot use their expertise to make changes. Power, training, and information
sharing without reward for performance leads to lack of motivation, because
employees do not see any personal growth and retribution for their efforts. (p. ?)
Mohrman et.al. (1996) extended the works of Lawler and Bowen (1995) by studying the
employee involvement activities at Fortune 100 companies. They noted an increasing
trend to transfer employee involvement initiatives down to lower levels of the
organization using the four critical factors suggested by Lawler (1986).
Information sharing practice. This factor refers to a set of activities aimed at
facilitating the exchange of information about operational and administrative functions
with and between employees in an organization (Riordan et.al., 2005). Information
sharing occurs when employees at the lowest level in an organization have access to, are
directly provided with, or are providing others with information related to their work
activities (Denison, 1990; Lawler, 1986). The information shared should be accurate,
relevant and timely. When both upward and downward channels of information sharing
are in place, employees participate in a meaningful way and act responsibly, and they are
involved in organizational processes and functions that were previously handled only by
upper management (Randolph, 1995; Kouzes & Posner, 1987).

73
Training practice. This factor refers to a set of activities that provide specific
skill sets relevant to an employee’s work assignment in an organization (Sumukadas,
2005; Vandenberg et.al. 1999). Increasing organizational effectiveness depends on the
skill and knowledge acquired through training (Backeberg, 1995; Senge, 1990). Without
the right skills and knowledge, employees cannot do their jobs effectively (Lawler et.al.,
1992, 1995). The most frequently identified training practices for employee involvement
are cross training, team building, problem solving, safety, and job skills (Sumkadas,
2005; Shah and Ward, 2003; Brown et.al., 2000; Lawler et.al., 1992).
Reward practice. This factor refers to a set of activities aimed at linking rewards
directly to individual performance and business results (Lawler et.al., 1995). Reward
practices are used as tools to modify the behavior of employees in an organization
(Sumukadas, 2005). The type of reward is not as important as the process of rewarding.
The connection between rewards and performance must be visible to employees
(Vandenberg et.al., 1999). Finally, rewards must be tied to behavior, be valued, and be
achievable, in order to increase motivation and employee involvement (Lawler, 1986).
Power. The concept of power has been described in the literature in a number of
ways. Conger & Kanungo (1988) and Bacharach & Lawler (1980) found that the
perception of power was related to availability and control of information, and to access
to training. Kotter (1979) and Pfeffer (1981) concluded that the perception of power was
related to the locus of control. The greater the locus of control, the greater is the feeling
of power. Bowen & Lawler (1992) described power as the right to make decisions that
influence organizational direction and performance. For this study, power refers to the

74
ability of employees at the lowest level in the organizational hierarchy to participate in
decision making and to determine how best to implement decisions (Vandenberg et.al.,
1999).
2.3.3. Employee empowerment
Employee empowerment has been widely recognized as a potentially effective
work design practice to manage organizations (Seibert et.al., 2004; Menon, 2001; Bowen
and Lawler, 1992). It is, however, very different from employee involvement. The major
difference between these terms is in ‘transfer’ of decision making authority. In employee
involvement programs, management retains control, whereas in employee empowerment
programs the employees have, at least to some extent, more authority to control the
coordination, allocation, and improvement of functions associated with their task.
A review of the empowerment literature reveals that empowerment has been
classified as either structural or psychological (Seibert et.al., 2004; Mills and Ungson,
2003; Psoinos & Smithson, 2002; Randolph, 1995; Conger and Kanungo, 1988; Thomas
and Velthouse, 1990; Menon, 2001). As seen in Table 2.9, structural empowerment is
described in terms of the organizational structures, policies and practices that support
employee empowerment (Seibert et.al., 2004; Mills & Ungson, 2003; Psoinos &
Smithson, 2002; Randolph, 1995). Psychological empowerment is described in terms of
the specific cognitions an individual makes about their work environment (Conger &
Kanungo, 1988; Thomas & Velthouse, 1990; Menon, 2001).

75
Table 2.9 Perspectives on employee empowerment
Authors Empowerment Definition Dimensions
Str
uctu
ral E
mpo
wer
men
t
Seibert et.al. (2004)
A set of shared perceptions regarding the extent to which an organization makes use of policies, practices, and procedures to support empowerment
Information sharing, autonomy through boundaries, team accountability
Psoinos & Smithson (2002)
The decentralization of the decision making authority by delegating power to the staff to make and implement decisions
Improvements, problem solving, quality responsibility, planning and scheduling of work, equipment maintenance and repair
Randolph (1995)
As recognizing and releasing into the organization the power that people already have in their wealth of useful knowledge and internal motivation
Information sharing, goal setting, decision making rules, training, appraisal system, teamwork
Mills and Ungson (2003)
The horizontal decentralization of authority by delegating the decision making prerogatives to employees, along with the discretion to act on one's own
Psy
chol
ogic
al E
mpo
wer
men
t
Conger and Kanungo (1988)
A process of enhancing feelings of self efficacy among organizational members through the identification of conditions that foster powerlessness and through their removal by both formal organizational practices and informal techniques of providing efficacy information
Feelings of self efficacy
Thomas and Velthouse (1990)
Intrinsic task motivation Impact, Competence, Meaningfulness, Choice
Spreitzer (1995)
A motivational construct that is manifested in four cognitions: meaning, competence, self determination, impact
meaning, competence, self determination, impact
Menon (2001)
A cognitive state of mind that is characterized by a sense of perceived control, competence and goal internalization
Perceived control, Perceived competence, Goal internalization

76
According to the conceptualization of Thomas and Velthouse (1990) and
Spreitzer (1995), psychological empowerment is manifested as four cognitions:
Meaning. Defined as an “individual’s intrinsic caring about a given task”
(Thomas & Velthouse, 1990, p.674), meaning is the association of job value and purpose
with the ideals and standards of the individual. A stronger association results in a more
significant meaning. Tasks must be meaningful for employees to feel empowered.
Competence. Competence, defined as a “feeling of self-efficacy” (Conger &
Kanungo, 1988), refers to an individual’s belief in his/her capability to perform activities
with skill (Gist, 1987). Wood and Bandura (1989) documented four primary ways in
which self-efficacy can be instilled and strengthened:
• Mastery experiences – past successful performances increases beliefs about future capabilities;
• Modeling – effective techniques and strategies are observed and built into the repertoire of the person observing, thus enhancing the belief that they have the capability to manage future situations;
• Social persuasion – a realistic encouragement leads to greater expended efforts which results in likely successes; and
• Physiological states – Emotional arousal and tension can create both favorable and unfavorable outcomes.
Regardless of the method chosen, maximizing employees’ beliefs of self-efficacy is
important because without a sense of confidence in their abilities, employees feel
inadequate and unempowered.
Self-determination. This cognition is defined as “an individual’s sense of having
a choice in initiating and regulating actions” (Deci et.al., 1989). In other words,
individuals see themselves as initiators of their own behavior, free to select their desired
outcomes and corresponding means to achieve them. Self-determined employees see

77
themselves as being proactive rather than reactive (Spreitzer, 1995). They feel
empowered and take ownership of their behavior because it originates from within, rather
than being controlled from external sources.
Impact. Employees feel empowered when they perceive their behavior has an
effect on organizational outcome. Impact refers to “the degree to which an individual can
influence strategic, administrative, or operating outcomes at work” (Ashforth, 1989). A
lack of impact can lead to learned helplessness (Thomas and Velthouse, 1990). This can
result in reduced motivation and thus lead to a feeling of being unempowered.
Menon (2001) conceptualized empowerment on the premise that the psychological
experience of power underlies the feeling of empowerment. The sociological perspective
treats power as potential influence in the context of social interactions (Bacharach &
Lawler, 1980), while the psychological perspective treats power as motivating factors
(McClelland, 1975). Combining these perspectives, Menon (2001) conceived
empowerment to manifest itself in three dimensions: power as perceived control, power
as perceived competence, and power as being energized towards achieving the valued
goals of an organization. These dimensions of employee empowerment are used in this
study.
Perceived control. Perceived control, conceived from the sociological
perspective of power, occurs in situations in which power is treated as an internal urge, or
drive, to influence and control others and their work decisions (White, 1959). It reflects
Thomas & Velthouse’s (1990) cognitions of impact (i.e. ability to influence others to
effect organizational outcomes) and self-determination (i.e. autonomy in initiation and

78
continuation of work behaviors). For the purpose of this study, perceived control is
defined as an individual’s perception of autonomy in the scheduling of work,
performance of work, utilization of resources, and decision making (Menon, 2001).
Perceived competence. Stemming from the psychological perspective of power,
perceived competence is essential for the feeling of empowerment. An individual
believes that s/he can successfully meet routine task demands and any non-routine
challenges that might arise in the course of work (Menon, 2001). Perceived competence
occurs in a situation in which power is treated as a motivation factor that boasts one’s
feeling of self-efficacy to meet given situational demands (Wood and Bandura, 1989).
This belief of self-efficacy reflects Thomas and Velthouse’s (1990) cognition of
competence. For the purpose of this study, perceived competence is defined as an
individual’s self-efficacy and confidence with regards to role demands.
Goal internalization. Also grounded in the psychological perspective of power,
goal internalization is the energizing aspect of the psychological experience of
empowerment. It occurs in a situation in which power is treated as a motivating factor to
energize and strengthen one’s belief and action in the attainment of a mission or a valued
cause. This commitment in belief and action reflects Thomas and Velthouse’s cognition
of meaning. For the purpose of this study, goal internalization is defined as an
individual’s belief in the goals of the organization and his/her readiness to act on its
behalf (Menon, 2001).

79
2.3.4. Task interdependence
A review of organizational design and behavior literature reveals that
interdependence has been described in different forms: resource interdependence, task
interdependence, goal interdependence, and reward and feedback interdependence
(Wageman, 1995; Mitchell and Silver, 1990; Saavendra et.al., 1993; Wageman and
Baker, 1997; Hardin, 1968). In a more recent study, Barrick et.al. (2007) suggested that
interdependence can be categorized into two types. Structural interdependence is based
on the nature of the task or the technological requirements (Thompson, 1967).
Psychological interdependence is based on the social demand to work together in order to
achieve collective outcomes (e.g. goals and rewards) (Wageman, 1995).
Task interdependence is an important structural variable in organizational
behavior theories, especially those that focus on organizational design. Kiggundu (1983)
characterized task interdependence as being either initiated or received. Initiated task
interdependence occurs when an individual influences someone else’s task performance,
whereas received task interdependence occurs when an individual is influenced by
someone else’s task performance. Thompson (1967) and Saavendra et.al. (1993) used the
exchange of information and resources to categorize task interdependence as pooled,
sequential, or reciprocal.
Pooled task interdependence. Team members make a contribution to group
output without the need for direct interaction with other work group members. Typically,
members in the team have similar roles and do similar tasks. For example, the overall
output of a team making widgets in the drilling department is dependent on the individual

80
outputs of each member working on the same operation, but on different machines
without any direct interaction with each other.
Sequential task interdependence. A team member must act on a particular
operation before other members of the team can act on it to complete the remaining
operations needed to complete the whole task. Typically, members in the team have
different roles, performing different tasks in a pre-determined order (work sequence is
unidirectional). Most importantly, no one member completes the entire operation. For
example, the overall output of a team manufacturing shirts is dependent on the output of
each member working on the different operations (i.e. cutting, stitching, labeling, and
packaging) in a pre-determined sequence on different machines with direct interaction
with each other.
Reciprocal task interdependence. When the scope of an operation is too large,
team members must work simultaneously to complete it. One team member’s output
becomes another member’s input and vice versa. Generally team members have different
roles and often are specialists in performing specific tasks. Work sequence is bi-
directional and time-lagged. For example, in a search and rescue operation, team
members communicate location, status, and other vital information to coordinate their
efforts and complete the operation.
In organizational work design, task interdependence can vary along a continuum
from none (e.g. an individual task executed by one person who has all resources
necessary to complete it) to high (e.g. a collective task whose successful completion
depends on the input of multiple individuals). For the purpose of this study, task
81
interdependence is defined as the degree to which members within a work unit work
closely with each other and share material and expertise in order to complete a task.
2.3.5. Technical practices
The common themes across lean definitions in the previous section suggest that
the most important objective of lean production is the elimination of ‘waste’ and
reduction of variability. In this section we will review the most commonly used
practices5, both in the literature and in the industry that help in achieving the objectives of
elimination of ‘waste’ and reduction of variability on the shop floor. Table 2.10 provides
a summary of those technical practices that help eliminate the seven classical forms of
waste and reduce the variability due to processing time and customer demands.
5 Practices are the observable facets of principles. They are conceived as activities or a set of activities
(Dean & Bowen, 1994) since principles are too general and abstract for empirical research

82
Table
2.1
0 L
ean p
ractice
s asso
ciate
d w
ith typ
es o
f w
aste
Associated lean p
ractices T
ype of W
aste
Overproduction Making more than is required by the next process
Waiting Idle time created when waiting
Transportation Movement of materials or people around a plant that does not add value to the product
Inappropriate processing Any effort that adds no value to the product
Unnecessary inventory Any supply in excess through the manufacturing process
Unnecessary motion Movement of people or equipment around a plant that does not add value to the product
Defective parts Inspection and repair of materials in inventory
Untapped human potential Waste of not utilizing people to the best of their unique abilities
Variability Waste that is created by buffering for inventory, capacity, and time
Sta
ndardized w
ork
x
x
Pull production
x x
x
x
x C
ontinuous flow
x
x x
P
roduction smoothing
"He
ijunka"
x
x
Production la
yout
x
x
Total productive
ma
intena
nce
x
x
Se
tup time
reduction
x
x
Z
ero de
fects x
x
x
Visual control
x
K
aizen /C
ontinuous im
provem
ent
x
5-S
x

83
2.3.5.1. Standardized work
Standardized work defined as, “a set of formal, written work instructions for each
process” (Hill, 2010), lead to work that is highly specified as to its content, sequence,
timing, and outcome (Spear & Bowen, 1999; Lee & Ebrahimpour, 1984). Standardized
work practices help in eliminating waste resulting from inappropriate processing (e.g.,
overproduction and transportation) and achieving process stability by minimizing the
variability (e.g., inventory buffering) during production (Hill, 2010). It not only facilitates
in the organizational learning wherein the know-how and expertise is preserved, but also
assists in auditing, problem solving and improvements as standard work provides the
baseline against which processes can be measured against.
2.3.5.2. Pull production
In the classical JIT view, pull production is a practice that determines what should
be ordered, how much should be ordered, and when it should be ordered based on
customer demands. Hopp & Spearman’s (2004) definition of pull production distinguish
between pull and traditional push systems. Pull production defined as, “a practice that
explicitly limits the amount of work-in-process in a system” help manage material
movement in the system by a mechanism which triggers production at one work station
based on the current demand at the next work station (Voss & Robinson, 1987). Pull
production helps minimizing the waste resulting from overproduction (e.g., larger
inventory and work-in-progress, longer cycle times).

84
2.3.5.3. Continuous flow
Continuous flow is the ultimate goal of lean production. It is defined as, “a
practice that support the production and movement of small batches through a series of
processing steps with minimal inventory and almost no waiting between steps” (Hill,
2010). This practice helps eliminate the waste resulting from waiting (e.g., longer cycle
times), and inappropriate processing (e.g., transportation).
2.3.5.4. Production leveling “Heijunka”
Production leveling (a.k.a production smoothing, Heijunka) is defined as, “a
practice of distributing production volume and mix evenly over time” (Dennis, 2007).
Instead of running large batches of one of model after another, it is advised to run small
batches of many models over short periods of time. This practice results in producing the
same mix of products during each period (McLachlin, 1997). When achieved, this
practice will help minimize the production variability by eliminating the unnecessary
expediting, checking, and reworks (Suzaki, 1985).
2.3.5.5. Cellular manufacturing
A production layout refers to an “approach to organizing the physical
configuration of a facility based on the sequence of steps required to build a particular
product” (Hill, 2010). Lean operations support a physical layout of the production facility
that facilitates a one-piece process flow which is streamlined (Voss & Robinson, 1987;
Lee & Ebrahimpour, 1894). Cellular manufacturing is one such process in which
equipment and workstations are arranged in a sequence that supports a smooth flow of

85
materials and components through the process with minimum transport or delay (Suzaki,
1985). This practice helps eliminate the waste resulting from transportation and
unnecessary motion of men, machinery and material (Suzaki, 1985).
2.3.5.6. Total productive maintenance
Total productive maintenance is defined as, “a practice that ensures uninterrupted
and efficient use of equipment(s) through machine operator involvement” (Dennis, 2007).
Machine operators dedicate a portion of their day to both inspection and planned
equipment maintenance activities (Shah & Ward, 2007; White et.al., 1999). The machine
operators can identify and repair minor equipment problems to avoid future major
problems. This practice helps eliminate the waste due to waiting (e.g. longer cycle times)
and reduce production variability by making sure that there are no machine/equipment
breakdowns.
2.3.5.7. Setup time reduction
Setup time reduction is defined as, “a practice that reduces, simplifies, and or
eliminates the work required in changing over a machine’s setup time from one
component to the next component” (Finch & Cox, 1986). Changeovers are done in
minutes rather than hours (Shingo, 1983). Setup time reduction practices included
separating internal setups from external setups, and more importantly converting internal
setups into external setups wherever possible (Monden, 1983). Reduction in the setup
times helped eliminate waste due to overproduction (e.g. larger inventory) by facilitating
in the production of smaller batch sizes (Voss & Robinson, 1987).

86
2.3.5.8. Zero defects
Zero defects defined as, “a practice that is aimed at improving quality and
promoting error free production through employee empowerment” was developed by
Shingo (1983) in an effort to extend the concept of ‘Jidoka’. Sugimori et.al. (1977) in his
description of the JIT production system emphasized that workers were prevented from
taking non standard methods to keep the system from running. These procedures usually
resulted in accidents, troubles and or defects. Suzaki (1985) emphasized prevention of
defects rather than relying on inspection to detect them. This method put a check on the
transfer of any defective parts to the subsequent process. The ability to check for defects
at the source and stopping of the line to fix the problem resulted in the elimination of
inspection at the end of the line, and there was neither need for re-work nor any material
wastage (Stewart & Grout, 2001).
2.3.5.9. Visual control
It is a system that is designed to create a visual workplace wherein the work
environment is self explaining, self ordering, and self improving. Any out-of-standard
situation is immediately obvious and employees can take corrective action (s). Hill
(2010) defined visual control as, “a set of practices that is aimed to design systems that
have simple indicators and metrics that can be seen and understood almost immediately”.
This practice helps in the elimination of waste resulting from overproduction,
unnecessary inventory, and defective parts being produced (e.g. re-work).

87
2.3.5.10. Kaizen / continuous improvement
In order to sustain quality products and processes, organizations are always
looking out for ways to improve (Koufterous et.al.1998; Spear & Bowen, 1999; Hopp &
Spearman, 2004). Kaizen is defined as, “a practice that continuously strives to make
incremental improvements through worker involvement on an ongoing basis” (Hill,
2010). Achieving leanness in production is not a one-off effort, it is rather a journey.
Koufterous et.al. (1998) and Hopp & Spearman (2004) focus on continuous improvement
efforts as a means to achieve high levels of pull production through reducing defects and
eliminating the variability in the system while Spear and Bowen talk about how
continuous improvement efforts can be conducted in a scientific method under the
guidance of a teacher.
2.3.5.11. 5-S
5-S is a lean manufacturing practice that helps organizations sort, set in order,
shine, standardize, and sustain productive work environments. The first sub-practice,
“Sort” focuses on separating the necessary from the unnecessary and getting rid of the
unnecessary items. This is done through a visual method called as “red tagging”. A red
tag is placed on all items that are not required to complete a job in a given work area.
The second sub-practice, “Set in order” focuses on organizing the work area by making
sure that everything has a place and everything is in its place. The third sub-practice,
“Shine” focuses on keeping the work area clean and shining. The fourth sub-practice,
“Standardize” focuses on standardizing the best work practices once established in each

88
work areas. The fifth sub-practice, “Sustain” emphasizes on the importance of sustaining
the new standards once they are implemented and achieved.
2.4. Quality of work life
An extensive review of the organizational behavior literature reveals that there is
no consensus on the definition and operationalization of the term “quality of work life”
(QWL) (Rethinam and Ismail, 2008; Martel & Dupuis, 2006; Lewchuk et.al., 2001;
Sirgy, 2001; Loscocco & Roshelle, 1991; Nadler & Lawler (1983); Levine, 1983; Kohl
and Shooler, 1982). According to the early works of Nadler and Lawler (1983), QWL
was described using six definitions: (1) as a variable, (2) as an approach, (3) as a set of
methods, (4) as an ideology, (5) as everything, and (6) as nothing. As a variable, QWL
was measured as the individuals’ overall outcome of a job (Levine, 1983). As an
approach, QWL was defined as a program to improve cooperation between management
and the union to improve outcomes for both the individual and the organization
(Lewchuk et.al., 2001; Lippitt, 1978). As a set of methods, QWL was described as a
variety of organizational change levers such as work redesign, participation in decision
making, gainsharing, and team building (Martel and Dupius, 2006; Glaser, 1980). As an
ideology, QWL was defined in terms of the nature of the work and the worker’s
relationship to the organization. This definition not only included the methods to achieve
QWL, but also elaborated on why those methods were desirable, moral, and obligatory.
The last two definitions refer to QWL as a global concept; it was perceived as a panacea

89
for coping with grievance problems, quality problems, low productivity rates and just
about everything else.

90
Table 2.11 Quality of work life definitions
Author Definition Operationalization
Dispositional approach Structural approach
Glaser (1980) (none, only description)
breaking down traditional status barriers between management and production personnel, internally motivated,
Organizational commitment, competency development, challenging work, growth opportunities,
Nadler & Lawler (1983)
QWL is defined as a way of thinking about people, work, and organization
Idea of participation in organizational problem solving and decision making, reward systems,
Basic nature of work itself, physical work environment
Levine (1983) QWL is defined in terms of those aspects of work which make a difference to individuals
Social satisfaction needs, self esteem, equitable promotions, non work life balance
Variety in daily job routines, work challenges

91
Lau & May (1998)
QWL is defined as favorable conditions and environments of a workplace that supports and promotes employee satisfaction by providing employees with rewards, job security, and growth opportunities
Rewards, job security Growth opportunities
Sirgy et.al. (2001)
QWL is defined as employee satisfaction with a variety of needs through resources, activities, and outcomes stemming from participation in the work place
Satisfaction of health and safety needs, satisfaction of economic and family needs, satisfaction of social needs, satisfaction of aesthetic needs, satisfaction of knowledge needs, satisfaction of actualization needs, satisfaction of esteem needs
Martel & Dupius, 2006
QWL at a given time is defined as the condition experienced by the individual in his or her dynamic pursuit of his/her hierarchically organized goals within work domain …..
Participation in decision making affecting one’s own work, Autonomy in performance of duties, effectiveness at work, Feeling of belonging, Emotive
Time to perform duties, Fit between skills and type of work, Diversity of duties, Physical requirement needed to perform the duties, Work

92
power, competitiveness, relationship with colleagues, supervisor, and employer, Income and Income security, Clarity of role, Allocation of work during absence of other employees
environment, Equipment and tools needed for work facilities, Company policies concerning leave for family reasons, Possibility of advancement, Transfer, Work schedules,
Rethinam & Ismail (2008)
QWL is defined as the effectiveness of the work environment that transmit to the meaningful organizational and personal needs in shaping the values of the employees that support and promote health and well being, job security, job satisfaction, competency development and balance between work and non-work life
Job security, Job satisfaction, Work and non-work life balance
Health and well being, competency development

93
The different definitions and their operationalization can be categorized into two
broad categories: the dispositional approach and the structural approach (Kerce and
Booth-Kewley, 1993; Lawler, 1982). As shown in Table 2.11, in the dispositional
approach, QWL definitions are subjective. They are defined as a variable, which focuses
on the individual’s reaction to work and their personal consequences of their work
experience (Nadler & Lawler, 1983). These definitions are then operationalized based on
individuals’ culture and values (Sirgy et.al., 2001; Daniels, 2000). This approach assumes
that individuals may be predisposed to certain work attitudes and values (Staw et.al.,
1986) and that these attitudes and values can differ based on age, gender, culture, and
education. According to the structural approach, QWL definitions are objective. They are
defined as an approach or method, which focuses on the process by which the outcomes
for both the individual and the organization can be improved (Loscocco & Roschelle,
1991; Nadler & Lawler, 1983). These definitions are then operationalized based on
situational attributes, such as characteristics associated with an individuals’ job (Nadler &
Lawler, 1983; Levine, 1983).
A review of the definitions and their operationalization indicates that QWL is a
multi-dimensional construct made up of a number of interrelated factors that need careful
consideration to conceptualize and measure. In a study by Lau and May (1998), they
acknowledge that these factors need not be universal or eternal. The choice of the factors
included in a study depends on the intended context of each administration.
For the purpose of this study, QWL is defined as the condition experienced by
individuals that result from the effectiveness of their work environment (Martel &

94
Dupius, 2006; Rethinam & Ismail, 2008). The factors included in this study are: (1)
physical context, (2) psychosocial context, (3) job satisfaction, and (4) job security. The
physical context is defined as the organization’s physical environment that is likely to
influence the workers safety and health (Rethinam & Ismail, 2008; Martel & Dupius,
2006; Brown et.al., 2000; Nadler & Lawler, 1983). The psychosocial context is defined
as the individuals’ quality of social interaction with other employees in the organization
(Martel & Dupius, 2006; Sirgy et.al., 2001; Levine, 1983). Job satisfaction is defined as
the appraisal and feeling one has towards their job (Rethinam & Ismail, 2008; Sirgy et.al.,
2001). Job security is defined as the ability of the organization to provide stable full-time
employment, regardless of changes in the environment (Rethinam & Ismail, 2008; Sirgy
et.al., 2001; Lau & May, 1998).
2.5. Employee performance
A review of the operations management, human resources, and organizational
behavior literature reveal that researchers have proposed a wide variety of measures for
employee performance. The selection of these measures is based on the following
characteristics: relevance to objectives, ability to assess performance accurately;
simplicity of data collection and calculation; and impact on operational productivity
(Seibert et.al., 2004; Motowidlo et.al., 1997; Globerson & Riggs, 1989). The common
employee performance measures in operations management are based on the evaluation
of operational actions such as output quantity, quality of output, timeliness,
dependability, and flexibility (Spangenberrg & Theron, 2004; Ahmad & Schroeder, 2003;

95
Globerson & Riggs, 1989). The most widely used employee performance measures in
human resources and organizational behavior literature is based on behaviors which are
under individuals’ control, and which contribute to, or detract from, individual,
departmental, and/or organizational goal attainment (Parker, 2007; Campbell et.al.,
1993). Employee performance based on these individual behaviors can be measured as
either task or contextual performance.
Task performance is operationalized in one of two ways. It is measured as
performance based on task knowledge, which is measured as the individuals perceived
competence cognition. More specifically, it is individuals’ knowledge of facts and
principles related to their function(s) in the organization, and includes knowledge of
procedures, heuristics, and rules for processing information and making decisions about
matters related to their function(s). Task performance can also be measured as
performance based on task skill. Here, performance is measured in terms of individuals’
ability to use their skills and relevant technical knowledge to perform the necessary
actions, quickly, smoothly, and without error (Seibert et.al., 2004; Motowidlo et.al.,
1997).
Contextual performance is also operationalized in one of two ways. It is measured
as performance based on contextual knowledge, which refers to carrying out actions
known to be effective for handling situations that call for help and coordination with
others. More specifically, this is done by following organizational rules and procedures,
and by endorsing, supporting, and defending organizational objectives. Contextual
performance is also measured as performance based on contextual skill. Employee

96
performance is measured in terms of individuals’ ability to use their skills and relevant
technical knowledge to carry out actions known to be effective for handling situations
that call for help and to coordinate with others; following organizational rules and
procedures; endorsing, supporting, and defending organizational objectives. (Seibert
et.al., 2004; Motowidlo et.al., 1997).

97
CHAPTER 3. RESEARCH MODEL AND HYPOTHESES
This chapter provides the theoretical arguments used to conceptualize the
framework for the research model. This framework is used to evaluate whether lean
production, defined as an integrated socio-technical system, enhances employee
productivity and quality of work life. Following the research model are the hypotheses
tested in this study.
3.1. Conceptualization of the research model
The review of the LP and STS literature revealed a link between organizational
work practices and the principles of LP and STS. This section establishes the theoretical
rationale for the research model. Table 3.1 details how specific work practices are
associated with LP and STS principles.

98
Table 3.1 Work practices associated with LP and STS principles
Work Practice STS Principles Adopted from Cherns (1976, 1987)
Lean Principles Adapted from the "House of Lean" (2007)
Management Support Middle Management Support
Compatibility: The process of designing a system should be consistent with the goals of the design
Production decisions based on meeting customer expectations: Identify and address the critical production needs
Employee Involvement Information sharing practices Training practices Rewards practices
Information flow : Flow of work related information to individuals who need it most
Support Congruence: Social support structures such as reward systems, selection process, training policies, conflict resolution mechanisms designed to re-inforce behaviors which the organization structures is designed to elicit
Multi-functionality Work design should avoid highly fractionalized jobs; individuals should be trained to perform a range of tasks
Transitional organizations Involve the design team to transition into new systems based on the STS approach
Participatory management: Build a culture that engage and involve employees in decision making on decisions which affect their jobs/tasks Labor utilization Cross train workers so that they can perform multiple task(s)
Employee Empowerment
Minimal critical specification In the design of jobs, specify no more than what
Stop production Employees stop the production line to prevent defective parts from being transferred to the

99
Perceived Control Perceived Competence Goal Internalization
is absolutely essential
Power and Authority Ability of employees to access and exercise authority over resources to carry out responsibilities
subsequent process
Technical practices Standardized work Pull production Continuous flow production Production leveling Setup time reduction Total preventative maintenance Zero defects Visual control Kaizen 5-S Cellular Manufacturing
Variance control Work should be designed to control variances (deviations from the ideal place) as close to their sources as possible
Incompletion Examine, critique, and improve the system the moment it is implemented
Process stability and standardization are the foundations for continuous improvement Continuous improvement processes through which employees identify and then eliminate the 'waste' in the system
Just-in-time production Focus on customer pull so that there is value flow rather than material flow
Task Interdependence* Boundary location Boundaries should
be determined based on logical process criterion
-
* Is a work factor and not a work practice

100
3.1.1. Middle management support
Defined as a “set of managerial practices that facilitate in the implementation of
top management directives by providing resources and interpreting the top management
directives to employees to accomplish their task(s)” (Ramus & Steger, 2000), middle
management support is associated with the STS principle of compatibility and the LP
principle of Hoshin planning. Compatibility emphasizes the congruence between a
systems design and an organization’s long term objectives (Cherns, 1987). Planning for
and designing of the system should be the responsibility of the people who manage and
use it (Hyer et.al., 1999). The LP principle of ‘Hoshin kanri’ (a.k.a Hoshin planning)
refers to a process used to identify and address the critical business needs of an
organization by aligning company resources to achieve the organization’s long term
objective(s) (Dennis, 2007). Though it is top management who uses Hoshin planning to
develop a road map that has a starting point and a destination (i.e. long term objectives),
and also a plan for getting there (i.e. systems design), it is middle management support
that determines the plan’s success or failure.
The successful implementation of top management directives depends on how
well middle management manages daily operational activities, interprets the change for
themselves and their teams, and most importantly, communicates the interpretation to
their teams, in an endeavor to achieve the top management’s vision (Balogun & Johnson,
2004; O’Toole, 1995). Compatibility between the top management’s vision and its
execution can occur only if middle management supports the change and facilitates in
consensus building within their teams. This helps to align teams’ actions and decisions

101
with top management’s vision, thus increasing the likelihood of achieving that vision
(Rue & Byars, 2003).
3.1.2. Employee involvement practice
The work practice of employee involvement is defined as an approach that
emphasizes participatory organizational and management systems that involves
employees in production planning, problem solving, and decision making activities aimed
at the success of an organization (Lawler et.al., 1995). It is associated with the STS
principles of information flow, support congruence, multi-functionality, and transitional
organizations, and the LP principles of participatory management and labor utilization.
The information flow principle states that work related information should be
provided to individuals to complete their task(s). This information can be used by
individuals for the purposes of controlling, monitoring, record keeping, and action taking,
and should be directed towards those who need to act on it (Cherns, 1987). The principle
of support congruence states that organizations should provide for social support
structures such as appropriate reward systems and training opportunities in order to
reinforce the behaviors that the organization wants to elicit from its employees. The
principle of multi-functionality states that workers should be cross trained so that, when
the need arises, they can be made responsible for multiple tasks within the department.
The principle of transitional organizations states that design teams should involve
existing employees in the planning and design stage when transitioning into a newer
structure.

102
The LP principle of participatory management states that employees should be
engaged and involved in the process of production planning, execution, and problem
solving at all times (Ohno, 1988). Involving employees not only helps to develop their
capabilities but also to improve the organization’s chances of success in the long term.
The principle of labor utilization states that employees need not stand in front of an
automated machine to monitor its operations; instead, employees should be trained to
perform multiple tasks so that their time and capability is well utilized (Ohno, 1988).
Thus, employee involvement is a process characteristic of the job that allows
employees to participate in decision making that affects their jobs and in the designing of
new systems. Employees must be provided with timely and accurate work related
information in order to have meaningful and responsible participation. They are also
encouraged to participate by receiving appropriate support that reinforces behaviors the
organization wants to elicit at the time. Finally, organizations that focus on labor
utilization provide employees with multi-functional training so that they can be actively
involved in organizational activities while being able to perform a wide range of tasks.
3.1.3. Employee empowerment practice
The work practice of employee empowerment is defined as an “individuals’
cognitive state of mind which is characterized by a sense of perceived control, perceived
competence, and goal internalization” (Menon, 2001). It is associated with the STS
principle of minimal critical specification and authority, and the LP principle of stopping
production so that production never stops.

103
The STS principle of minimal critical specification states that management should
specify as little as possible about how jobs should be performed, so as to leave room for
employees to use their creativity (Hyer et.al., 1999). However, one must first identify
only what is essential and critical to the successful completion of the task(s), and only
that which is essential should be specified to the employees (Cherns, 1976; 1987). The
STS principle of authority states that employees should have the ability to access and
exercise power over resources in order to carry out their responsibilities (Cherns, 1987).
Employees are also made accountable for completing their task(s) with the appropriate
use of resources that they have access to and authority over (Closs et.al., 2008).
The LP practice of ‘stop production’ states that competent and well trained
workers using ‘autonomated’ machines are given the power to push a button or pull a
chord that can stop the entire production line when they first identify defects or any
variation from the standards. The line continues to remain shut down until the root cause
of the defect is resolved.
Thus, employee empowerment is a process in which competent, self motivated and
committed individuals expend high levels of effort, initiative, and persistence in
accomplishing their task(s). Organizations promote empowerment by designing jobs such
that employees are provided with no more information than what is absolutely essential.
The information provided is usually essential and critical to the successful completion of
the task(s). Employees at lower levels in the organization are given the control of and
access to resources to carry out their job responsibilities. They also have the authority to

104
stop a production line when a defective part is produced and not allow it to be moved to
the subsequent process until the root cause of the defect is corrected.
3.1.4. Technical practices
Technical practices include eleven commonly used practices that aim to
continuously eliminate all kinds of ‘waste’ by minimizing internal variability during
production (Shah & Ward, 2003; Hopp & Spearman, 2004). These practices are
representative of three bundles – just-in-time (JIT), total preventative maintenance
(TPM), and total quality management (TQM) – that were classified by Shah and Ward
(2003). The JIT bundle includes the practices of pull production, continuous flow,
production leveling, and setup time reduction. The TPM bundle includes total productive
maintenance practices. TQM bundle includes the practices of standardized work, kaizen,
zero defects, 5-S and visual control. The technical practices are associated with the STS
principles of variance control and incompletion, and the LP principles of continuous
improvement through stability and standardization and the principle of just-in-time.
The principle of variance control states that any unexpected deviations in the
output conformance should be controlled as close as possible to its point of origin
(Cherns, 1987). The work system should be designed such that it facilitates in the
identification, controlling and most importantly correcting the source of the error, so that
defective parts are not fed downstream (Closs et.al., 2008). The principle of incompletion
states that there is no such thing as a final design (Cherns, 1987). Systems design is an
iterative process. Stability is desired, but the organization must continue to review and

105
revise its design to reflect the appropriate changes to cope with the changing environment
(Closs et.al., 2008; Huber & Brown, 1991).
The principle of stability and standardization states that in order to achieve
stability one must create standards (Dennis, 2007). Stability can be achieved when the
workplace supports management through organization and standardization, to be able to
correct any deviations from the standard condition. In addition, machine operators’
ability to perform the basic equipment maintenance task(s) such as inspection, cleaning,
lubricating, and tightening of loose parts reduces machine breakdowns, minor machine
stoppages, minor and hidden machine failures, and improves operational stability
(Dennis, 2007). Standard are set in place through standardized work procedures. This
allows for repeatability by providing clear start and end points for each task(s) or
processes.
The principle of pull systems states that a work center must produce the right
component at the right time in the right quantity for the subsequent work center. For
example, the pull production practice eliminates the over production and reduction in the
work-in-process inventory, the continuous flow practices, set-up time reduction practices,
and production leveling practices aim to reduce the unnecessary delays in flow times by
elimination of unnecessary wait times. These JIT practices help in creating a pull system
which produces the right components at the right time in the right quantity. The
standardized work practices eliminate variances by standardizing work in terms of its
content, sequence, timing and outcome (Spear & Bowen, 1999). The total productive
maintenance practice maximizes equipment effectiveness and provides production

106
stability by preventing unexpected equipment breakdown. These TQM and TPM
practices help achieve stable and standardized production process. Zero defects and
visual management practices reduce (or eliminate) defective parts from being sent to
subsequent operations in the production process by sending a signal to stop production
until the root cause of the problem is resolved. These TQM practices facilitate the process
of variance control by detect and possibly rectifying any deviations from the ideal.
Kaizen practices help examine critique and continually improve processes the moment
they are implemented. This TQM practice reflects the notion that although
standardization and stability are desired, they are not the end all. Organizations
continually strive to review and revise its processes to adapt to the changing environment.
3.1.5. Task interdependence
Task interdependence is considered an important structural variable in
organization design literature. It is defined as the “degree to which members within a
work unit need to work closely with each other, share material, and expertise in order to
complete the given task” (Cummings, 1978). This structural variable is associated with
the STS principle of boundary location.
The principle of boundary location states that organizational boundaries should be
determined based on a logical process criterion, and not how it is supposed to be
managed. Structure should fit the process and not vice versa (Cleggs, 2000; Huber &
Brown, 1991). It is essential that the boundaries should be such that it does not impede
the sharing of information, knowledge and learning (Cherns, 1987). Boundaries which
impede either the sharing of information, knowledge, learning and/or resources lead to

107
interdependence. This interdependence could be caused by the manner in which
employee roles, skills and resources are differentiated and distributed within the
organization.
In the literature, degree and type of interdependence is categorized as either
structural (Saavendra et.al., 1993; Thompson, 1967) or psychological (McGrath et.al.,
2000; Wageman, 1995). Psychological interdependence, consists of goal interdependence
(manner in which goals are defined), reward and feedback interdependence (manner in
which performance is rewarded and feedback is given), are overlooked in making a direct
association with the STS principle of boundary location because even though these begin
with task requirements of work, they extend into the social demand to work together to
achieve collective outcomes such as goals and rewards (McGrath et.al., 2000). In this
study, we will focus on the structural type of interdependence.
3.2. Research model
The recent research on lean manufacturing suggests that lean is an integrated
social-technical system which encompasses a wide variety of management practices (i.e.
JIT, TQM, TPM & HRM practices) that work synergistically to create a streamlined high
quality system (Shah & Ward, 2003; 2007). The social subsystem comprises of
employees and encompasses their aptitudes, attitudes, beliefs, and their relationships both
within and between groups (Shani et.al., 1992; Pasmore, 1988; Emery, 1959). The
technical subsystem focuses on how things get done and consists of consists of tools,
techniques, procedures, and technology used by employees in an organization to acquire

108
inputs, and transform inputs into outputs (Hupp & Polak, 1995; Shani et.al, 1992; Emery,
1959). Figure 3.1 presents a theoretical model of an integrated lean production system.
This model operationalized the integration of the lean and STS principles. More
specifically, the model presented shows the relationship between the specific work design
practice and how it affects the quality of work life and employee performance.
Figure 3.1. Research model for lean work practice
In figure 3.1, the middle management support construct influences the
implementation of the three employee involvement practices considered in this study –
information sharing practice, reward practices, and training practices (Huy, 2001;
O’Crevy, 1998; Lawler et.al., 1995; Fisher, 1986). Employees can find themselves being
involved when the middle managers facilitate the information sharing practices by acting
as a conduit of communication between them and senior management (Mintzberg et.al.,
2003; Block, 2002; O’Toole, 1995). Middle managers, who by the virtue of their unique
Employee
Performance
Employee
Empowerment
Middle
Management
Support
Employee
Involvement
Usage of Lean
Technical Practice
Quality of
Work Life
Task
Interdependence
H3a
H1c
H5
H3cH4b
H1b
H2a
H2b
H1a
H6
H3b
H4a

109
position in the organizational hierarchy are closer to frontline employees than the senior
managers, can facilitate in building a consensus between employees to support senior
managements’ organizational strategic directions (Rue & Byars, 2003; Floyd &
Wooldridge, 1992). Middle managers can improve employee involvement initiatives by
providing employees appropriate training practices since they are in a better position to
know where and what their problems are on a day-to-day basis (Huy, 2001; Facteau et.al.,
1995). Middle managers can sustain the employee involvement initiative when
performance measures and reward practices are not in conflict with each other (Lawler
et.al., 1995). Middle managers attention to these contextual dynamics would determine
the success of any employee involvement initiative. Thus it is suggested that:
H1a: Middle management support is positively related to the employee
involvement practices
In figure 3.1, the middle management support construct creates and fosters a work
environment within an organization which promotes employees’ psychological
empowerment in terms of their feeling of perceived control, perceived competence and
goal internalization (Menon, 2001; Klagge, 1998; Hut & Molleman, 1998). Employees
feel empowered when middle managers enhance their feeling of perceived control by
delegating responsibility, promoting participation, and providing information and
resources (Kirkman & Rosen, 1999). Middle managers can create an environment which
not only allow for employees’ to be able to make a difference in their day-to-day work
outcomes, but also have the choice in making decisions about their actions at work
(Spreitzer, 1995). Perceived competence of employees can be strengthened when middle

110
managers actually use/implement their ideas and suggestions in the workplace. This
makes the employees feel more confident in their abilities and capabilities to perform
activities with skill (Spreitzer, 1995; Guzzo et.al., 1993). Middle managers formulate and
articulate the valued cause, objective or a vision for the future of the organization, which
helps frontline employees to judge them in relation to their own individual ideals and
standards (Spreitzer, 1995). In doing so, middle managers help align employees work
goals to the organizations’ goals and objectives by inspiring, energizing, and
communicating the high performance expectations of the management for them (Guzzo
et.al., 1993; Burns, 1978). Thus it is suggested:
H1b: Middle management support is positively related to employee
empowerment
As shown in figure 3.1, middle management support construct influences the
effectiveness of the four dimensions of quality of work life considered in this study –
physical context, social context, job security, and job satisfaction. Middle managers can
influence the employees’ physical context, more specifically, the safety and health issues
by making sure that physical work environment has all material elements needed for
employees to perform their work and non-work related activities without any safety or
health related inhibitions (Martel & Dupuis, 2006). The social interactions at work can be
increased when middle managers organize team building activities (e.g. regular team get-
together, family picnics, meetings to discuss individuals work related issues in a group,
etc). Organization changes such as downsizing and outsourcing have adverse effects on
employee loyalty, moral, motivation and job security. Since middle managers are closer

111
to the daily operations than senior managers, they can conceive, suggest, and set in
motion new ideas that the top managers may not have thought of (Huy, 2001), which may
result in sustaining or even creating of new jobs to implement and execute those new
ideas. In addition, middle managers could help foster an environment in the work place
which could be perceived by employees as interesting and stimulating (Rethinam &
Ismail, 2008). Thus it is suggested:
H1c: Middle management support is positively related to the quality of work
life of employees
As shown in figure 3.1, employee involvement practices contribute to the success
of the lean work design framework by supporting the process of employee empowerment
(Bowen and Lawler, 1992; Thomas & Velthouse, 1990). Empowerment can be achieved
when employees at the lowest hierarchical level have access to the “right mix” of
information (about processes, quality, customer feedback and organizational policies and
procedures), training (regarding all aspects related to work and work safety), and rewards
(tied to organizational results and ones’ own job performance). The information provides
a framework on which employees can make sense of the organizations goals and
objectives. They can then base their behavior and actions in a meaningful manner in work
activities beyond their immediate job duties (Lawler et.al., 1992). Training not only
allows employees to perform their jobs effectively and gives them a feeling of
competence (Lawler et.al., 1992), but in addition with the “right mix” of information it
also enables them to comprehend, and contribute by making appropriate decisions about
their work, thereby giving them a feeling of perceived control. Rewards which are tied to

112
employees’ behavior and performance always motivate them to perform better and get
involved. Thus it is suggested:
H2a: Employee involvement practices are positively related to employee
empowerment
As shown in figure 3.1, employee involvement practices contribute to the success
of organizational performance by promoting the usage of the specific technical practices
– standardized work, pull production, continuous flow production, production leveling,
setup time reduction, total preventative maintenance, zero defects, and visual control.
Organizations that promote employee involvement by providing information sharing
systems, appropriate and timely training, and awarding rewards which are linked to
individual/group and/or business performance can certainly motivate employees to use
certain technical practices (Sumukadas, 2005; Pun et.al., 2001; McLachlin, 1997; Lawler
et.al., 1992). Information sharing practices that provide accurate, timely, and relevant
information encourage employees to use the visual control practice (e.g. Andon, 5-S) as a
means to reduce and/or eliminate quality defects (Suzaki, 1985), pull production practice
as a means to reduce over-production of unwanted parts (Koufterous et.al., 1998),
continuous flow practices to reduce and/or eliminate the long wait and queue times (Shah
& Ward, 2003; Voss & Robinson, 1987), and production leveling practices to reduce lead
time, work-in-process inventory and stress, due to uneven workload for employees (Shah
& Ward, 2003; Koufterous et.al., 1998; Voss & Robinson, 1987). Training practices
provide opportunities for employees to build competencies in their jobs by learning how
to interpret and execute the standardized process instructions (Shah & Ward, 2003; Spear

113
& Bowen, 1999), practice setup time reduction techniques (Shah & Ward, 2003;
Sakakibara et.al., 1997; Voss & Robinson, 1987), perform machine maintenance to
reduce machine downtime (Shah & Ward, 2003; Koufterous et.al., 1998; Voss &
Robinson, 1987), and identify and eliminate sources of quality defects in operations
(Voss & Robinson, 1987). Reward practices foster an environment in an organization
which motivates employees to perform better than their previous ways by using the
technical practice of kaizen and continuous improvement (Shah & Ward, 2003;
Koufterous et.al., 1998; Voss & Robinson, 1987). Thus it is suggested:
H2b: Employee involvement practices are positively related to the usage of
technical practices
As shown in figure 3.1, employee empowerment can influence the four
dimensions of quality of work life considered in this study – physical context, social
context, job security, and job satisfaction. Organizations that encourage employee
empowerment by enhancing their feeling of perceived control, perceived competence,
and goal internalization will usually see an increased workforce commitment and
humanization of the workplace. This in turn, results in improved quality of work life
(Barling et.al., 2003; Podsakoff et.al., 1997; Cohen et.al., 1997).
The quality of work life based on the physical context (i.e. work place safety and health
issues) can be safer and healthier when employees feel that they are in control of their
physical work environment (Barling et.al., 2003; Brown et.al., 2000). Empowered
employees can influence work unit outcomes by taking ownership of the process
(Spreitzer, 1995; Ashforth, 1989), thereby making it safer, cleaner, and healthier for them

114
to work in. The quality of work life based on the social context (i.e. quality of social
interaction with colleagues at work) can be improved when competent employees interact
with co-workers to offer work related expertise and feedback, and share power and
authority to complete a task (Liden et.al., 2000). Organizational changes such as
downsizing, rightsizing, and outsourcing have adversely affected perceived job security.
The quality of work life based on the perception of job insecurity can be reduced if not
completely eliminated when employees feel a sense of perceived competence. Being
competent at one’s job makes an employee a valuable asset to the company and most
likely he will be able to keep his job longer. The quality of work life based on the job
satisfaction can be enhanced when employees feel a sense of goal internalization
(Treville & Antonakis, 2006; Liden et.al., 2000). Employees are satisfied when they feel
that the work they are doing is not only meaningful, but also challenging which may
provide opportunities for recognition in the future. Thus it is suggested:
H3a: Employee empowerment is positively related to the quality of work life
Organizations that encourage employee empowerment by enhancing employees
feeling of perceived control, perceived competence, and goal internalization are expected
to see higher levels of employee performance than organizations that do not (Sigler &
Pearson, 2000; Spreitzer, 1995). Employees who believe that they can have an impact on
their work through autonomous initiation and regulation of their own behavior, have the
necessary skills to do the job, and most importantly consider what they do at work to be
meaningful show a higher level of performance than ones that do not. Employees’ ability
to control and/or influence decisions that affect their work area can lead to improvement

115
in work quality. Employees’ competence in addition to the control can lead to an
increased productivity and dependability to meet given goals. The above outcomes are
only possible if the employee intrinsically cares about the task(s) at work. Thus it is
suggested:
H3b: Employee empowerment is positively related to improvement in
employee performance
As shown in figure 3.1, employee empowerment contributes to the success of
quality management programs in an organization by supporting the application of
specific technical practices considered in this study: standardization practice, pull
production practice, continuous flow practice, production leveling practice, setup time
reduction practice, total preventative maintenance practice, zero defects, visual control
practice, and continuous improvement practice. Empowered employees use either a
single technical practice or a combination of several technical practices to make
improvement in product and process design, participate in problem solving activities,
manage quality control responsibilities, maintain production levels, and schedule
equipment maintenance (Psoinos & Smithson, 2002; Powell 1995). Organizations that
encourage employee empowerment by enhancing their feeling of perceived control,
perceived competence, and goal internalization will usually see an increased usage of
technical practices.
Employees’ feeling of perceived control promotes the usage of certain technical
practices: pull production practice, zero defects, and visual control. Empowered workers

116
have the authority to stop the production line when defective parts are produced and keep
it shut down until the root cause of the error is identified and counter measures are put in
place (i.e. zero defects). Employees who work downstream, control inventory in the
system by requesting goods as and when they are needed from employees upstream (i.e.
pull production). Empowered employees have the authority to sort and discard materials
used on the shop floor; in addition, they can set protocols for signboards, walkways, and
protective clothing needed on the shop floor, and they can maintain a clean, organized
workplace (i.e. visual control).
Employees’ feeling of perceived competence promotes the usage of certain
technical practices: setup time reduction and total preventative maintenance. Empowered
workers have the appropriate training to reduce the set up times required when changing
from one operation to the next through practice and making special fixtures that convert
internal setups to external setups (i.e. setup time reduction). Empowered employees have
the training to perform basic equipment maintenance work such as inspection, cleaning,
lubricating, and tightening of machine components (i.e. total preventative maintenance).
Employees’ feeling of goal internalization promotes the usage of technical
practices. Empowered employees who not only ascribe to the organizations
goals/objectives, but also are ready to act on its behalf are likely to use technical
practices. To eliminate waste by maintaining and improving the production flow,
empowered employees will engage in continuous flow practice, pull production practice,
production leveling and setup time reduction practice (Shah & Ward, 2003). To sustain

117
and improve product and process quality, empowered employees implement work
standardization practice, zero defects, visual control practice, and continuous
improvement practices (Shah & Ward, 2003). To maximize equipment effectiveness,
empowered employees use total preventative maintenance practices (Shah & Ward,
2003). Thus it is suggested:
H3c: Employee empowerment is positively related to the usage of technical
practices
As shown in figure 3.1, technical practices are expected to improve employees’
performance through the systemic usage of techniques and tools in managing the
production flow activities, continuous improvement activities, and equipment
maintenance activities (Shah & Ward, 2003; Spear & Bowen, 1999; Koufterous, 1998;
Sakakibara et.al., 1993; Voss & Robinson, 1987; Suzaki, 1985; Sugimori et.al., 1977).
While some studies (Parker, 2003; Bruno & Jordan, 2002; Babson, 1993) suggest that
technical practices are not directly related to employee performance, other studies
(Lander & Liker, 2007; Shah & Ward, 2003, Suzaki, 1985) find evidence that the
technical practices have a significant impact on employee performance by managing the
production flow activities, continuous improvement activities, and equipment
maintenance activities. Production flow practices (such as continuous flow practice, pull
production practice, production leveling, and setup time reduction practices) improve
employee performance by facilitating the continuous reduction and eventual elimination
of all forms of waste, more specifically, the waste resulting from high work-in-progress
inventory and the waste resulting from unnecessary delays in flow time (Ohno, 1988).

118
Continuous improvement practices (such as standardization practice, zero defects, visual
control practices, and kaizen practices) improve employee performance by increasing
productivity and decreasing the quality defects in the production process (Grout &
Stewart, 2001; Spear & Bowen, 1999). The equipment maintenance practices (such as
planned, predictive, and preventative maintenance practices) improve employee
performance by facilitating in the maintenance of equipment(s) efficiency and
effectiveness and prevent any unplanned downtime, which may result in increased flow
times and reduced productivity and dependability (Sakakibara, 1997; Finch & Cox,
1986). Thus it is suggested:
H4a: Technical practices usage is positively related to the improvement in
employee performance
As shown in figure 3.1, technical practices are expected to improve employees’
quality of work life through the systemic usage of techniques and tools to facilitate in the
improvement and maintenance of safety and health issues in one’s workplace, allow for
team building opportunities, development of one’s personal skill, and achievement of a
feeling of job satisfaction (Rethinam & Ismail, 2008; Martel & Dupius, 2006; Sirgy et.al.,
2001; Brown et.al., 2000; Lau & May, 1998; Nadler & Lawler, 1983; Levine, 1983).
Technical practices such as 5-S and visual control help make the physical work
environment safer. These practices promote safety by making sure tools, raw materials,
and component parts are in its place and that the work environment is self explaining, and
self improving through visual cues. Technical practices such as pull production,
continuous flow production, and kaizen activities promote opportunities for social

119
interaction with colleagues at work. These practices support social interaction as team
members are required to communicate and coordinate their actions and task(s) with each
other. Technical practices such as zero defects, kaizen, and total productive maintenance
can lead to a feeling of job satisfaction. The practice of zero defects and total productive
maintenance, which empowers employees to take corrective action to make sure they
have error free production, could result in a feeling of satisfaction for a job well done.
The ability to participate in kaizen activities to resolve issues that have caused strife at
work could also result in a feeling of job satisfaction. In today’s work environment very
few companies can promise job security to their employees. However, employees that
adopt and routinely apply the technical practices in their daily work task(s) are more
likely not to be fired as opposed to employees that do not. Thus it is suggested:
H4b: Technical practices usage is positively related to the employee quality
of work life
As shown in figure 3.1, employees’ quality of work life is expected to influences
employee performance through the provision of a safer and cleaner physical work
environment, opportunities to socially interact with colleagues, assurance of job security,
and a feeling of job satisfaction (Phusavat et.al., 2009; Lau & May, 1998). A safer and
cleaner physical work environment reduces workplace related injuries, injury costs, and
days lost and helps improve employee productivity (Brown, 1996). Employees that do
not feel safe in their jobs are most likely to not do their jobs well (Das et.al., 2008).
Collegiality and social interactions at work can help improve employees’ relations with
each others at work so that they can collectively contribute to the accomplishment of

120
organizational objectives/goals by improving their own performance (Briscoe, 1980). The
assurance of job security is an important determinant of employee health, employee
turnover, and employee commitment. Healthier employees, who are committed to the
organization will perform better than employees who remain absent (due to illness, stress
etc) and are not as committed to the goals/objectives of the organization. While a study
conducted by Page & Wiseman, (1993) suggest that job satisfaction is not directly related
to employee performance, other studies (Vallario, 1997; Osterman, 1995) suggest that
improvements in employee performance can be achieved when the employees are
committed and satisfied. Thus it is suggested:
H5: Quality of work life is positively related to the improvement in
employee performance
As shown in figure 3.1, task interdependence alters the course and consequences
of employee empowerment in an organization (Somech et.al., 2009; Barrick et.al., 2007;
Bacharach et.al., 2006; Langfred, 2005). As tasks become highly interdependent, the
need for employees to interact and coordinate with each other increases (Wageman,
1995). This creates an opportunity for conflicts, which then result in lower employee
performance (Wilmont & Hocker, 2001; Guzzo & Shea, 1992). However as tasks become
less interdependent, employees work relatively independently of one another, without the
need to interact and coordinate with each other frequently. This results in improved
employee performance. Thus it is suggested:
H6: Task interdependence moderates the relationship between employee
empowerment and improvement in employee performance.

121
CHAPTER 4. RESEARCH METHODOLOGY
This chapter details the methods used to conduct research that aims to develop a
model for lean work practice that explains the inter-relationships between middle
management support, employee involvement, employee empowerment, technical
practices, and task interdependence with employee productivity and quality of work life.
The research design (i.e. unit of analysis, key respondent, target sample frame, sample
size, and survey administration) is explained first. The next section provides the
measurement items, along with a discussion of their underlying structure. The last section
contains the methods used for measurement and structural validation.
4.1. Research design
4.1.1. Unit of analysis
The unit of analysis in this study is a ‘team’. The respondents were asked to
answer the survey items with respect to their teams within the department. For the
purpose of this study, a team is defined as a group (more than two) of people associated
together at work or in an activity wherein each person has a distinct role (Bamforth,
Griffin, 2008).
4.1.2. Key respondent
For this study, survey respondents included floor supervisors, manufacturing
supervisors, production supervisors, and team leaders. By virtue of their hierarchical
position within their companies, these individuals were the most informed respondents.

122
They possessed sufficient understanding of middle management support for employee
involvement and empowerment initiatives, and direct knowledge of the extent to which
their shop floor employees were involved and empowered.
Key respondents in this study were also potentially aware of the quality of work
life of their employees, as they interact with them closely on a daily basis. Interviews
with operation managers confirmed this selection, as they agreed that supervisors of shop
floor employees would be the most informed respondents for this kind of study.
Triangulation of performance data is achieved by administering the survey to both
supervisors/team leaders and their reporting manager (i.e. the operations manager) within
the department.
4.1.3. Target sample frame
The population of interest in this study includes all manufacturing organizations
in the United States that can be identified with SIC codes 311 through 339. Since the
purpose of this study is to develop a model for lean work practice, the sample frame was
comprised of manufacturing plants in the United States having a minimum of fifty
employees. This threshold was chosen based on preliminary interviews with academic
experts in the field and with plant managers. Both groups agreed that a plant with less
than 50 employees most likely would not possess the organizational structure necessary
for testing the research model.
The target sample frame was selected from three sources:
1. Manufacturing plants with more than 50 employees were randomly selected from
the directory of the Association of Manufacturing Excellence (AME).

123
2. An online business directory called Jigsaw was used to identify and select
additional manufacturing plants within the United States.
3. Personal contacts and references from Clemson University faculty and alumni
were also used to identify and select manufacturing plants in the United States.
4.1.4. Sample size
To make sure that the statistical tests performed in this study will detect an effect
in the sample size when, in fact, a true effect exists in the population, the sample size has
to be adequate (Cohen, 1988). A review of the operations literature revealed that there is
no consensus on the exact number of responses needed for studies applying the SEM
technique for testing a structural model (Schumacker and Lomax, 2004; Mitchell, 1993).
According to Shah and Goldstein (2006), in a review of articles in the Journal of
Operations Management, sample size should be: 1) a minimum of 200, as a rule of
thumb, or 2) based on the number of observed variables, number of parameters to be
estimated, and adequate statistical power desired. Hence, a sample size of at least 200
responses was required for this study, in order to ensure that a true effect would be
detected within the population.
.

124
4.1.5. Pilot study administration
The pilot survey was administered online using Zoomerang6, a national market
research firm (www.zoomerang.com). This firm sent out the survey to its online panel
which fit with the key respondent profile and the sample target frame described earlier
(Sections 4.1.2 - 4.1.3). In order to gain better control over the target frame and ensure
that respondents answering the survey were the most well-informed individuals about the
survey items, the following screening questions were included in the survey:
• Which industry best represents your organization's major product from the list
provided?
• How many employees work at your plant?
• Please indicate the job that best describes your position in the organization?
• Do you work in manufacturing?
• How many years have you worked with this organization?
• Do you directly supervise shop floor employees / machine operators?
4.1.6. Final survey administration
For the final survey, a comprehensive list of 1300 potential respondents was
compiled from the AME directory, Jigsaw – online sales directory, and personal contacts
and references. This list contained individual’s names, their company names, e-mail ids,
and their job title. The final survey was administered to this list using the total design
methodology for e-mail surveys procedure suggested by Dillman’s (2000).
6 Zoomerang is a market research firm that has over 3 million members in its research panel. These
members are profiled across 500 attributes. Individuals that belong to this research panel have double
opted into the panel to participate in surveys. Double opt-in implies that the panelists sign up and are
given the opportunity to withdraw from the panel, ensuring that they do want to participate. Panelists are
provided with incentive points for each survey that they complete. Respondent quality in Zoomerang is
maintained and fraudulent behavior is curbed by monitoring the survey taking time and response pattern
for individual respondents.

125
Four rounds of e-mail correspondence were carried out with the potential
respondents. The first contact was made in the form of a brief e-mail asking potential
respondents if they would like to participate in the research study. Immediately following
their acceptance, an e-mail with the cover letter and the link to the online survey was sent
in a reply e-mail. One week later, a second contact was made through e-mail which
contained the same link to the online survey. Approximately, two weeks after sending the
survey link, a reminder e-mail (third contact) including the online survey link again was
sent to those who agreed to participate in the study, but had not yet completed the survey.
The fourth and final contact was made with respondents who did not respond to any of
the former contacts.
An indirect approach was also used to increase the response rate of the most
informed respondents. An initial contact was made first with the managers who were
associated with manufacturing in a plant. The titles sought for the purpose of this study
were operations manager, production manager, continuous improvement manager, and
manufacturing manager. These respondents received the link to the online survey, and
were asked to forward the link to one supervisor/team leader who directly reported to
them. The confidentiality of supervisor responses was maintained as their managers were
not given access to their responses.
4.2. Construct measurement
The measures for the constructs used in the study have either been adopted from
existing scales or newly created. An iterative process of pre-testing and pilot testing was
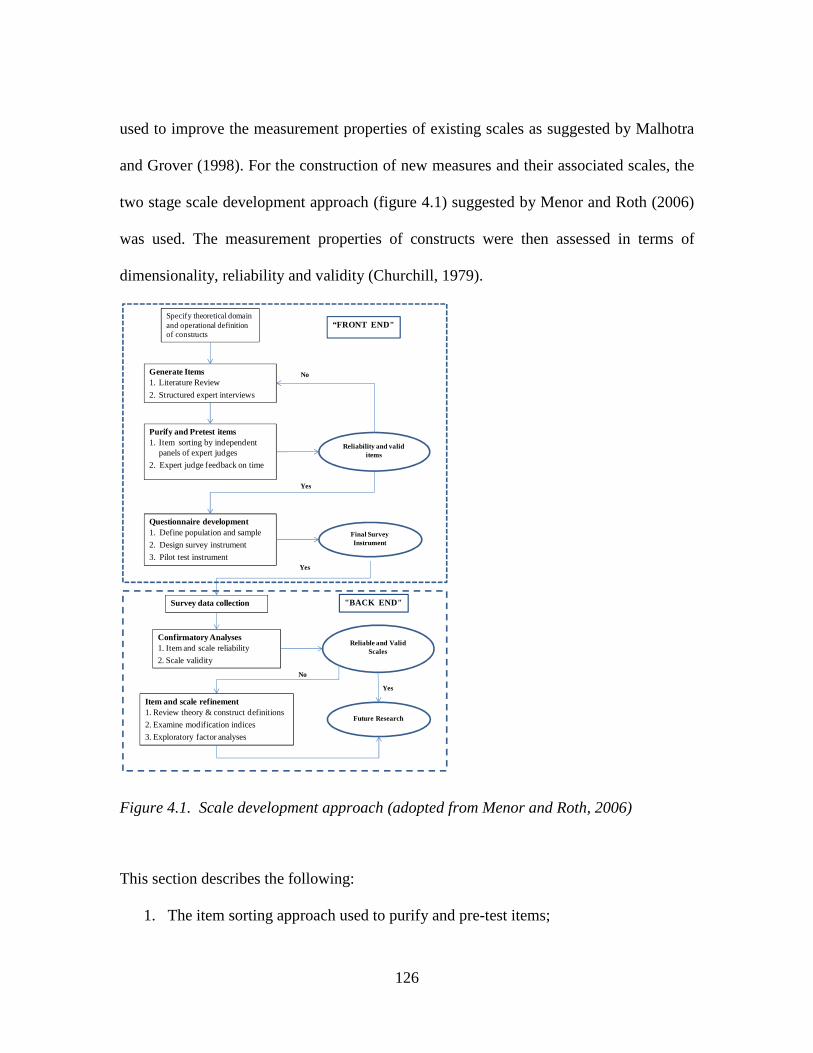
126
used to improve the measurement properties of existing scales as suggested by Malhotra
and Grover (1998). For the construction of new measures and their associated scales, the
two stage scale development approach (figure 4.1) suggested by Menor and Roth (2006)
was used. The measurement properties of constructs were then assessed in terms of
dimensionality, reliability and validity (Churchill, 1979).
Figure 4.1. Scale development approach (adopted from Menor and Roth, 2006)
This section describes the following:
1. The item sorting approach used to purify and pre-test items;
Reliable and Valid Scales
Specify theoretical domain and operational definition of constructs
Purify and Pretest items1. Item sorting by independent
panels of expert judges
2. Expert judge feedback on time
Questionnaire development1. Define population and sample
2. Design survey instrument
3. Pilot test instrument
Survey data collection
Confirmatory Analyses1. Item and scale reliability
2. Scale validity
Item and scale refinement1. Review theory & construct definitions
2. Examine modification indices
3. Exploratory factor analyses
Reliability and valid items
Final Survey Instrument
Future Research
Yes
No
Yes
Yes
No
"BACK END"
“FRONT END"
Generate Items1. Literature Review
2. Structured expert interviews

127
2. The measurement items used for the constructs in the research model;
3. The control variables used in the study; and
4. The approach to modeling and measuring the constructs.
4.2.1. Item to construct sorting
As shown in Figure 4.1, the construct definition and its multi-item scales were
subject to rigorous empirical scrutiny to establish their reliability and validity. Based on
an initial review of the literature, the theoretical domain and operational definitions were
identified for the constructs and their factors. Survey items were generated for the study
based on adaption of existing measurement items and creation of new items.
Measurement items were purified and pretested through several rounds of item
sorting exercises. The preliminary survey instrument was administered to undergraduate,
full-time MBA, executive MBA, and Ph.D. students in the operations management
program at Clemson University. It consisted of a definition for each construct used in the
study, and a randomized listing of all the measurement items. For each item sorting
round, students were asked to match each measurement item to the construct definition
that they deemed to be most appropriate. Each round of item sorting produced
independent samples of judgment-based, nominal data which was used to assess the inter-
rater reliability and substantive validity of the measurement items. In order to include an
item in the final survey, the raw inter-rater agreement percentages, along with Cohen’s k
value, must be greater than 0.65, as suggested by Moore and Benbasat (1991).
To improve the face validity of these measurement items, interviews with experts
(e.g. operations managers, supervisors, and machine operators) in the field were

128
conducted. An expert identified in this study was one that has the appropriate knowledge,
experience, and motivation to evaluate the following: relevance of the constructs of the
study to practice, degree to which each item captured its constructs, and degree of
difficulty to rate the selected measurement items. The identified experts were most
informed about recognizing the relationships between the work practices chosen in this
study. Based on the interviews with these experts, several items in the initial
questionnaire were revised to improve readability and to provide better coverage of the
construct content.
4.2.2. Measurement items
This section provides the definition and measurement items used for each
construct in the research model. Middle management support, task interdependence, and
employee performance were measured as first order constructs. Employee involvement,
employee empowerment, technical practice, and quality of work life were measured as
second order constructs, having multiple first order factors.
4.2.2.1. Middle management support
Middle management support is defined as a set of managerial practices that
facilitate in the implementation of top management directives by providing resources and
interpreting the top management directives to employees to accomplish their task(s)
(Ramus & Steger, 2000). The measures were adapted from Ramus and Steger (2002) and
from Schlesinger and Oshry (1984). These items are shown below:
• MMS1 - My manager spends time with me to explain my job priorities

129
• MMS2 - My manager provides me with the necessary resources to accomplish my tasks effectively
• MMS3 - My manager facilitates in the implementation of quality improvements in this department
• MMS4 - My manager provides me with the necessary resources to improve product quality
4.2.2.2. Employee involvement
Employee involvement is defined as an approach that emphasizes participatory
organizational and management systems that involves employees in production planning,
problem solving, and decision making activities aimed at the success of an organization
(Lawler et.al., 1995). This practice consists of three factors – information sharing,
reward, and training practices. The definitions and the measures of these factors are
provided below.
Information sharing practice. Information sharing practice is defined as a set of
activities aimed at facilitating the exchange of information about operational and
administrative functions with and between employees in an organization (Riordan et.al,
2005). Adapted from Riordan et.al. (2005), Denison, (1990), and Lawler et.al. (1995), the
items used in the study are as follows:
• IS1 - Information regarding company policies and procedures is shared with my team members
• IS2 - My team members receive regular feedback about their work quality • IS3 - My team members’ productivity details are shared with them on a
regular basis • IS4 - My team members are kept informed when something important occurs
in the department • IS5 - My team members share information about their work processes with
each other • IS6 - My team members share information regarding best practices with each
other • IS7 - My team members share their productivity data with each other
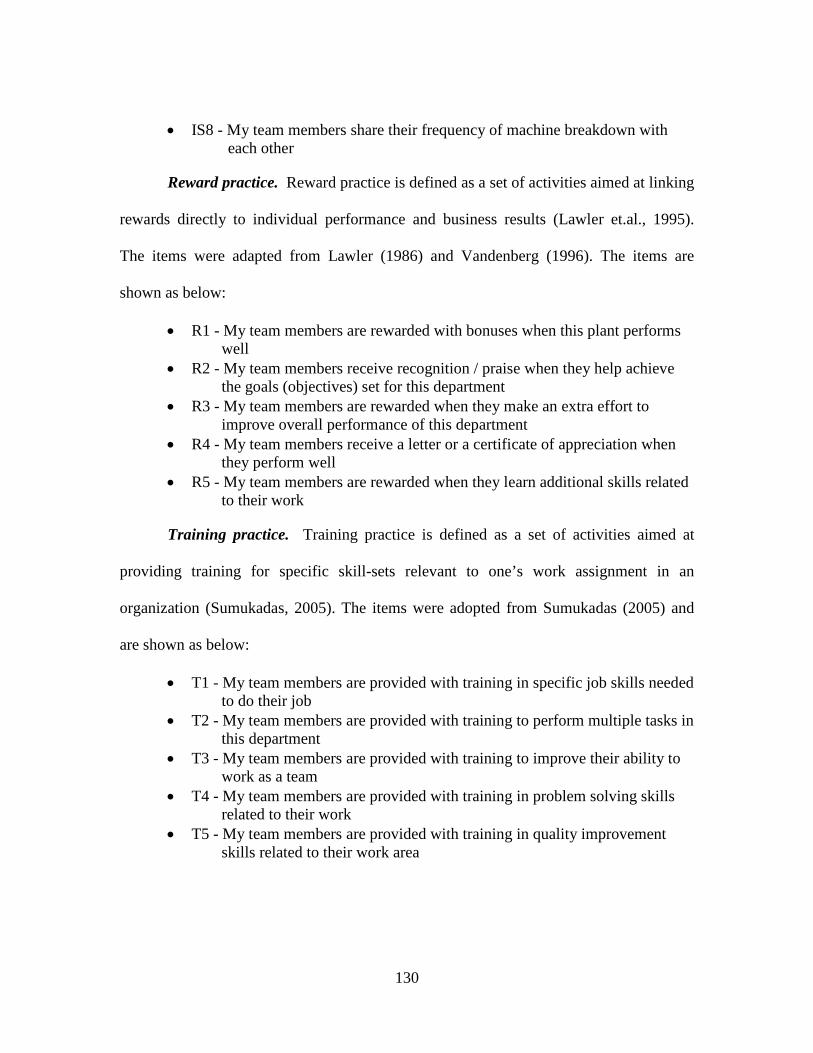
130
• IS8 - My team members share their frequency of machine breakdown with each other
Reward practice. Reward practice is defined as a set of activities aimed at linking
rewards directly to individual performance and business results (Lawler et.al., 1995).
The items were adapted from Lawler (1986) and Vandenberg (1996). The items are
shown as below:
• R1 - My team members are rewarded with bonuses when this plant performs well
• R2 - My team members receive recognition / praise when they help achieve the goals (objectives) set for this department
• R3 - My team members are rewarded when they make an extra effort to improve overall performance of this department
• R4 - My team members receive a letter or a certificate of appreciation when they perform well
• R5 - My team members are rewarded when they learn additional skills related to their work
Training practice. Training practice is defined as a set of activities aimed at
providing training for specific skill-sets relevant to one’s work assignment in an
organization (Sumukadas, 2005). The items were adopted from Sumukadas (2005) and
are shown as below:
• T1 - My team members are provided with training in specific job skills needed to do their job
• T2 - My team members are provided with training to perform multiple tasks in this department
• T3 - My team members are provided with training to improve their ability to work as a team
• T4 - My team members are provided with training in problem solving skills related to their work
• T5 - My team members are provided with training in quality improvement skills related to their work area

131
4.2.2.3. Employee empowerment
Employee empowerment is described as the specific cognitions an individual has
about their work environment. It is measured as the experience of power in terms of three
dimensions - perceived control, perceived competence, and goal internalization (Menon,
2001). The definitions and the measures of these dimensions are provided below.
Perceived control. Perceived control is defined as an individual’s perception of
autonomy in the scheduling of work, performance of work, utilization of resources, and
decision making (Menon, 2001). The items were adapted from Kanter (1983), Menon
(2000), and Keltmer et.al (2003). The items are shown below:
• PCTRL1 - My team member influence process changes that affect their work • PCTRL2 - My team members influence changes in their work methods • PCTRL3 - My team members influence the way in which tasks are completed
in their work area • PCTRL4 - My team members influence decisions about issues that affect their
work
Perceived competence. Perceived competence is defined as an individual’s self-
efficacy and confidence with regards to role demands (Menon, 2001). The items were
adapted from Conger and Kanungo (1987) and Menon (2001). These items are:
• PC1 - My team members are confident that they can do their job well • PC2 - My team members demonstrate competence in meeting their job tasks • PC3 - My team members have the capabilities to meet their job demands • PC4 - My team members have the ability to perform their jobs effectively

132
Goal internalization. Goal internalization is defined as an individual’s belief in
the goals of the organization and his/her readiness to act on its behalf (Menon, 2001). The
items were adapted from Menon (2001). These items are:
• GI1 - Working towards the goals (objectives) of this department is important to my team members
• GI2 - My team members are enthusiastic and ready to act towards achieving the goals (objectives) of this department
• GI3 - My team members are inspired by the goals (objectives) of this department
• GI4 - My team members are willing to help this department achieve its goals (objectives)
• GI5 - Achieving this department’s goals (objectives) is meaningful to my team members
4.2.2.4. Quality of work life
Quality of work life is defined as the condition experienced by individuals that
result from the effectiveness of their work environment (Martel & Dupius, 2006;
Rethinam & Ismail, 2008). It is a multidimensional construct. This study focuses on four
dimensions - physical context, social context, job security, and job satisfaction
(Cammann et.al., 1983). The definitions and the measures of these dimensions are
provided below.
Physical context. Physical context is defined as the organization’s physical
environment that is likely to influence the workers safety and health (Rethinam & Ismail,
2008; Martel & Dupius, 2006; Brown et.al., 2000; Nadler & Lawler, 1983). The items are
adapted from Brown et.al. (2000) and Martel and Dupius (2006). These items are:
• PHYC1 - The quality of air, lighting, and noise in my work area is satisfactory • PHYC2 - Safety protocols are enforced to prevent accidents in this department • PHYC3 - Health issues are considered when designing / changing the way
tasks are accomplished in this department

133
• PHYC4 - Eating areas within the plant are clean and hygienic • PHYC5 - Restrooms within the plant are clean and hygienic
Social context. Social context is defined as the quality of social interaction with
other employees in the organization (Martel & Dupius, 2006; Sirgy et.al., 2001; Levine,
1983). These items were adapted from Sirgy et.al. (2001) and Martel & Dupius (2006).
These items are:
• SC1 - My team members can always count on each other for support at work • SC2 - My team members have a good relationship with each other at work • SC3 - My team members are always willing to help each other when needed at
work • SC4 - My team members are friendly with each other at work • SC5 - My team members can talk frankly about their job with each other at
work
Job satisfaction. Job satisfaction is defined as the appraisal and feeling one has
towards their job. The items were adapted from Bacharach et.al.(1991) and Rethinam and
Ismail (2008). The items are:
• JSAT1 - My team members enjoy coming to work everyday • JSAT2 - My team members are satisfied with their job • JSAT3 - My team members enjoy performing their daily job activities • JSAT4 - My team members have very few complaints about their job
Job security. Job security is defined as the ability of the organization to provide
stable full time employment regardless of the changes in the environment. The items are
adapted from Rethinam and Ismail (2008). The items are:
• JS1 - My team members do not worry about losing their job • JS2 - My team members have job security within this organization • JS3 - My team members have job stability within this organization • JS4 - My team members’ jobs have not been affected by layoffs in this plant • JS5 - My team members’ job will not be affected by a recession

134
4.2.2.5. Task interdependency
Task interdependency is defined as the degree to which members within a work
unit work closely with each other and share material and expertise in order to complete a
task (Saavendra et.al., 1993; Thompson, 1967). The items were adapted from Saavendra
et.al., (1993) and are shown as below:
• TI1 - My team members work in groups to get the job done in this department • TI2 - My team members rely on each other to get the job done • TI3 - My team members frequently have to coordinate their efforts with each
other to complete their jobs in this department • TI4 - My team members work in groups to get the job done in this department
4.2.2.6. Technical practices
Technical practices are defined as a set of practices aimed at eliminating waste
and reducing buffers (i.e. capacity, inventory, and lead time) by minimizing internal
variability during production (Shah & Ward, 2007; Hopp & Spearman, 2004). These
practices are operationalized using ten indicators that were identified as the common
technical practices from an extensive review of the quality management literature, and
from interviews with operations managers at the AME conference (Kentucky, 2009). The
measures for these eleven indicators were adopted from Hill (2000). The definitions and
measures of these indicators are provided below.
Standardized work. Standardized work is defined as a set of discrete set of
formal, written work instructions for each process (Spear & Bowen, 1998). The items are:
• SP1 - My employees use well documented standardized operating procedures to complete their task
• SP2 - My employees receive standardized process instructions

135
Pull production. Pull production is defined as a practice that explicitly limits the
amount of work-in-process in the system (Hill, 2010). The items are:
• PP1 - My team members authorize and control production by using kanban cards, squares, containers, or space allocations
• PP2 - Production at one work station is initiated according to the demand at the next work station
Continuous flow. Continuous flow production is defined a practice of producing
and moving small batches (ideally, lot size of one) through a series of processing steps
with minimal inventory and almost no waiting between steps (Hill, 2010). The items are:
• CFP1 - My team members move materials in small batches through the production process with almost no waiting at work stations
• CFP2 - There is low waiting (queue) times observed for material flow through the production process
Production leveling. Production leveling is defined as a practice of distribution of
production volume and mix evenly over time (Hill, 2010). The items are:
• PL1 - My team members work on a schedule in which the production volume and mix are evenly distributed over time
• PL2 - Production schedules are level and stable
Cellular Manufacturing. Cellular manufacturing is defined as a practice in
which equipment and workstations are arranged in a sequence that allows for continuous
and smooth movement of material to produce products from start to finish in a single
process flow, while incurring minimal transportation, waiting, or delays (Hill, 2010). The
items are:
• CM1 - Workstations are arranged in a sequence to reduce transportation and delay of materials through the production process
• CM2 - Groups of machines are dedicated to processing parts that require similar sequence of operations

136
Total Productive Maintenance. Total productive maintenance is defined as a
practice that ensures uninterrupted and efficient use of equipments through operator
involvement (Hill, 2010). The items are:
• TPM1 - My team members dedicate a portion of each day to equipment inspection / maintenance activities
• TPM2 - Machine operators in this department can identify and repair minor equipment problems
Setup time reduction. Setup time reduction is defined as a practice that reduces,
simplifies, and or eliminates the work required in changing over machine setup from one
item to the next item (Hill, 2010). The items are:
• STR1 - My team members develop special tooling (fixtures) to reduce setup times
• STR2 - My employees prepare the set-up for the next operation while working on the current operation
Zero Defects. The practice of Zero Defects is defined as a technique that
improves quality and promotes error free production through employee empowerment
(Hill, 2010). The items are:
• ZD1 - My team members eliminate the root cause of problems when quality defects occur in their work areas
• ZD2 - My employees stop the machine (line) when they identify defective parts from being produced
Visual control. Visual control is defined as a visual design system that has
simple indicators and metrics that can be seen and understood almost immediately (Hill,
2010). The items are:
• VC1 - My team members visually display the production status for current operations at their work stations
• VC2 - Warning lights on (or near) a machine display the current status of that machine

137
Kaizen/continuous improvement. Kaizen is defined as a practice that
continuously strives to make incremental improvements through employee involvement
(Caffyn, 2001). The items are:
• K1 - My team members initiate continuous improvement activities in their work area on a regular basis
• K2 - Continuous improvement efforts are an ongoing process in this department
5-S. 5-S refers to a practice that helps organizations simplify, clean and sustain a
productive work environment (Hill, 2000). The items are:
• 5-S1 - My team members maintain a clean and well-ordered work place using "5-S" practices
• 5-S2 - My employees return tools and materials to their designated places once they are used
4.2.2.7. Employee performance
Employee performance is defined as an appraisal process in which the management
evaluates employees on how well they do their jobs compared with a set of standards
determined by the department / organization (Motowidlo et.al., 1997; Globerson &
Riggs, 1989). The measures were adapted from Ahmad and Schroeder (2003), and
Motowildo et.al. (1997).
• EP1 - My team members’ abilities to deliver work output on time has improved over the past three years
• EP2 - My team members’ productivity has improved over the past three years • EP3 - My team members absenteeism has decreased over the past three years • EP4 - My team members’ work quality has improved over the past three years • EP5 - My team members’ overall performance has improved over the past
three years • EP6 - My team members’ dependability in meeting this department’s goals
(objectives) has improved over the past three years

138
4.2.3. Control variables
A review of the operations literature suggest that size of plant, age of plant, union
representation and production process (i.e. job shop, batch shop, assembly line,
continuous flow production) should be included as controls for measuring employee
performance and quality of work life (Conti et.al., 2006; Shah & Ward, 2003; Cooney,
2002). Hence, in this study, questions were included in the survey to control for these
four variables. The control variables were operationalized as follows:
• Size of the plant – How many employees work at your plant? • Age of the plant – How many years ago did this plant open for production? • Union representation – Approximately what percentage of this plant’s employees
are represented by a union? • Production process – Please select the operation process of your major product at
your plant?
4.2.4. Construct identification and measurement
When using structural equation modeling, the underlying structure of the
constructs must be conceptualized before proceeding to their measurement (Howell et.al.,
2007). More specifically, the nature and direction of relationships between the constructs
and their indicators needs to be clarified. Indicators can either be reflective or formative
(Edwards & Bagozzi 2000). Reflective indicators represent reflections, or manifestations,
of a construct (Bollen 1989), while formative indicators form, or produce, their
associated construct (Fornell and Bookstein 1982).
According to Jarvis et al. (2003), constructs can be classified as formative or
reflective, based on the answers to the following four questions:
• What is the direction of causality between constructs and indicators?

139
• Are the indicators interchangeable? • Is there any covariation amongst the indicators? • Does the nomological net of the construct indicators differ?
Table 4.1 Criteria to determine the structure (e.g. reflective, formative) of the constructs
Reflective Scale
Formative Scale
Direction of causality • Do indicators define the characteristics of the
construct? No Yes
• Do changes in the indicator cause changes in the construct?
No Yes
• Do changes in the construct cause changes in the indicators?
Yes No
Interchangeability of indicators • Do the indicators share a common theme? Yes No • Does dropping an indicator alter the conceptual
domain of the construct? No Yes
Co-variation amongst indicators • Does a change in one of the indicators also
associated with a change in other indicators? Yes No
Nomological net • Do the indicators have the same antecedents and
consequences? Yes No
Based on the assessment of the conceptual structure of constructs, the investigation of the
causal relationships between indicators and constructs, and the analysis of previous
studies that measured similar constructs, the research model developed for this study is
comprised of all reflective constructs except for technical practice, which is modeled as a
formative construct.
Standard statistical procedures – Factor analysis and internal consistency
reliabilities – were used to validate indicators of reflective constructs (i.e. middle
management support, employee involvement, employee empowerment, task

140
interdependence, quality of work life, and employee performance). Guidelines for
measuring the formative construct (i.e. technical practice), however, are not as
straightforward. According to Diamantopoulos and Winklhofer (2001), successful index
construction for formative constructs relies on four critical issues:
• Content specification - The domain of content the index is supposed to capture
(Bagozzi, 1994);
• Indicator specification - The indicators must cover the entire scope of the
latent variable;
• Indicator collinearity - Care should be taken that the maximum variance
inflation factor for the indicators used in the study should be below the cut-off
threshold of 10 (Kleinbaum et.al., 1988); and
• External validity - use different dimensions to develop an index.
Failing to include any one of the eleven dimensions of technical practice would
change the composition of the formative construct. The conventional guidelines
regarding clarity, length, directionality, lack of ambiguity and avoidance of jargons are
also followed (DeVellis, 1991). An issue particular to formative indicators is that of
multicollinearity. Care is taken that the maximum variance inflation factor for the
indicators used in the study should be below the cut-off threshold of 10 (Kleinbaum et.al.,
1988). The criterion of external validity is necessary to ensure that the ten dimensions
relate to the construct (technical practice).
External validity is achieved through one of three procedures, as proposed by
Diamantopoulos and Winklhofer (2001). One procedure involves the usage of a global

141
item that summarizes the essence of the construct that the index purports to measure. The
second procedure involves the usage of some reflective indicators to assess the validity of
the proposed dimensions that form the formative construct. The third procedure
emphasizes the linkage of the formative construct with other reflective constructs with
which it would be expected to be linked (e.g., antecedents and/or consequences) to assess
the validity of the formative construct. In this study, the two latter procedures were used
to validate the formative construct of technical practice.
First, the validation of the technical practice construct was done by assessing its
relationship to the ten dimensions as a set. This takes into account the interrelationships
of the ten dimensions that aim to eliminate waste and reduce variability. Two reflective
indicators were included in the study to help estimate a multiple indicator and multiple
causes (MIMIC) model (Hauser & Goldberger, 1971; Joreskog & Goldberger, 1975) for
the validation of the technical practice construct. Specifically, the reflective indicators
are:
• My employees use lean practices on a regular basis in this department, and • There is a strong commitment to using lean practices at all levels in this
department.
These indicators represented the usage of and commitment to lean practices at all levels
within an organization, and they are necessary for the model identification purpose
(Bollen, 1989). Finally, if the overall model fit (e.g., CFI, RMSEA and χ2) of the MIMIC
model is acceptable, then there is enough support for the inclusion of the set of ten
dimensions that form the technical practice construct.

142
The second procedure focused on the nomological aspect of the model to validate
the construct of technical practice. This approach is useful when certain dimensions have
been eliminated from the original construct. According to Diamantopoulos and
Winklhofer (2001), this type of validation requires that: 1) information is gathered for at
least one construct other than the one captured by the formative construct, 2) this other
construct is measured by means of reflective indicators, and 3) a theoretical relationship
can be postulated between the constructs. Hence, in the research model, the formative
construct of technical practice was linked to the constructs of quality of work life and
employee performance, which were measured by reflective indicators.
4.3. Data validation
Several steps were taken to analyze the data within the framework of the research
model. After cleaning the data, the analysis was done in two phases. Figure 4.2 shows the
procedures for measurement and structural validation.

143
4.3.1. Initial data cleaning
Little’s MCAR (missing completely at random) test (Little and Rubin, 1987) was
conducted to check if the missing values in the data were occurring completely at random
(i.e. missing values on variable X are not related to missing values on variable Y). Since
there were values missing completely at random, they were imputed using the direct
maximum likelihood method with the expectation maximization algorithm (Byrne, 2006;
Allison, 2003). The data set with the imputed values was then evaluated for possible
outliers with univariate and multivariate analyses. If the observed data fell within ± 3 σ,
there was no evidence of univariate outliers. Eliminate outliers if the observation is
greater than ± 3σ (Cohen et.al., 2003). Next check for multi-variate outliers using the
Mahalanobis distance method (Cohen et.al., 2003). After the removal of all multivariate
Measurement Validity1. Non Response Bias
a. Early v/s late respondents
2. Common Method Biasa. Harman one factor testb. Marker variable c. Method factor
3. Triangulation
4. Unidimensionality
5. Reliability a. Internal consistency
6. Construct validitya. Convergent validityb. Discriminant validity
Structural Validity1. Hypothesis testing
a. Direct effectsb. Interaction effectc. Indirect effects
Figure 4.2 Data validation plan

144
outliers, Mardia’s (1970) normalized estimate was calculated to determine the extent of
normality of the data. This test assessed the degree of kurtosis in the data. When the
sample is very large and multivariately normal, a large Mardia’s coefficient value reflects
significant positive kurtosis and large negative values reflect significant negative kurtosis
(Byrne 2006). According to Bentler (2005), values greater than 5.0 indicated that the data
was not normally distributed.
4.3.2. Measurement validation
This section contains the details of the tests that will be conducted to validate the
measurement model. First and foremost, the data was cleaned and univariate and
multivariate descriptive statistics were obtained. More specifically, the data was checked
for missing values, and the type of distribution for all item level responses was identified.
Next, the authenticity of the source of the data was evaluated. This was done by
checking for non-response bias. Once the data and its sources were assessed, a
confirmatory factor analysis (CFA) was conducted to validate the factors used in the
study. Then the measurement properties (i.e., dimensionality, factor loading, reliability,
validity, and model fit) of the constructs were assessed (Menor & Roth, 2006). This was
followed by a check for any common method bias. Finally, tests were conducted to check
for agreement of responses between multiple raters surveyed in the study.
4.3.2.1. Non-response bias
Non-response bias refers to the difference in the outcome variables between those
who answered the survey and those who did not (Armstrong and Overton, 1977). The

145
greatest concern for an empirical researcher is their dependence on individuals
participating in a study. Low response rates are always a concern; not only do they result
in a smaller sample size, but they also can undermine the generalizability of the data
collected and lead to incorrect conclusions that are not generalizable to the entire
population (Rogelberg & Stanton, 2007; Rogelberg & Luong, 1998).
To assess the potential of non-response bias, late respondents were used as a
proxy for non respondents (Armstrong and Overton, 1977). Early and late respondents
were identified based on the dates the responses were received. More specifically, the
middle point of the data collection time frame was used as a cutoff point for
differentiating between early and late respondents. A Chi-square test was performed on
the control variables (i.e., size of plant, age of plant, unionization, and production
process) for the early and late respondents. A significance difference between the means
of the two groups indicates that there is response bias between early and late responders.
4.3.2.2. Common method bias
Common method bias refers to the variance that is attributable to the
measurement method rather than to the construct of interest (Lindell & Whitney, 2001;
Bagozzi & Yi, 1991; Buckley et. al., 1990). It results in a systemic measurement error
that has serious confounding influence on empirical results. This bias yields potentially
misleading conclusions, as it can inflate or deflate the observed relationship between a
predictor and criterion variable (Lindell & Whitney, 2001; Cote & Buckley, 1988;
Campbell & Fiske, 1959). In other words, common method bias may cause alternative
explanations for the observed relationships between the constructs of interest (Williams

146
& Brown 1994; Bagozzi & Yi, 1991; Feldman & Lynch 1988). In this study the problem
of common method bias is reduced, if not eliminated, by implementing several
procedural and statistical recommendations set forth by Podsakoff et.al. (2003).
Procedural approaches based on the design of the study. There are four methods
by which the design of this study eliminated and/or minimize the common method biases.
First, anonymity of respondents was maintained throughout the survey administration and
data collection process. Second, survey respondents were informed that there is no right
or wrong answer, thereby reducing their evaluation apprehension, and their likelihood to
edit their responses to be more socially desirable, lenient, acquiescent, or consistent with
how they think the researcher wants them to respond.
The other two procedural approaches to eliminate and/or reduce common method
bias involve the measurement items. The items were carefully constructed and tested with
both academicians and practitioners for their simplicity, readability and content coverage.
Randomizing the items in the survey eliminated any biases from priming effects, item-
context induced mood states, and any other biases related to the question context or item
embeddedness.
Usage of statistical controls. In addition to these procedural remedies, three
statistical controls were also employed to reduce any potential common method bias: 1.)
Harman one-factor test (Harman, 1976), 2.) a partial correlation procedure using a marker
variable7, and 3.) an unmeasured latent method factor.
7 Marker variable - A variable that is identified a-priori on theoretical grounds, that it should not be
related to any other variable in the study (Lindell and Whitney, 2001)

147
In the Harman one-factor test, all of the variables in the study were loaded into an
exploratory factor analysis and the un-rotated factor solution was examined to determine
the number of factors necessary to account for the variance in the variables. As the
number of variables increase, the likelihood of obtaining more than one factor also
increases. If no single factor emerges, then common method bias is not an issue.
In addition, a partial correlation procedure using marker variables (Lindell and
Whitney, 2001) was used to test for common method bias. A ‘marker variable’ describing
a dimension of the realms of experience (Pine II and Gilmore, 1998) was selected from
the tourism literature to control for common method bias. In particular, measurement
items for the “memory of an experience” was used to partial out the average correlation
between the marker variable and the other variables used in the study. The measurement
items for the marker variable “memory of an experience” are:
• MV1 - I have wonderful memories about my last vacation • MV2 - I will not forget my experience from my last vacation • MV3 - I remember many things about my last vacation
In this procedure, two models were evaluated to assess the potential effects of common
method bias. The first model contained items loaded onto their respective latent factors,
and the second model contained the same items loaded onto their respective latent factor,
and also onto the marker variable, memory of an experience. If the comparative fit index
(CFI) between the two models is less than 0.01, there is no significant difference between
the two models and hence common method bias is not an issue (Cheung and Rensvold,
2002).
148
To confirm the finding from the marker variable method, an unmeasured latent
method factor was included to test for common method bias. This procedure is the most
stringent, as it significantly improves the fit of the model by accounting for most of the
covariance observed in variables. In this procedure, two models were compared to assess
the potential effect of common method bias. The first model contained items loaded onto
their respective latent factors, and the second model contained the same items loaded
onto their respective latent factors, and also onto the first order common method factor.
The main advantage of this technique was that it did not require the identification and
measurement of the specific factor responsible for the method effects. In addition, this
technique modeled the effect of the method factor on the measures rather than on the
latent constructs they represented, and did not require the effects of the method factor on
each measure to be equal (Podsakoff et.al., 2003).
4.3.2.3. Agreement of multiple responses
A test for inter-rater agreement (IRA) was conducted to assess whether multiple
responses from the same plant agree with each other. Inter-rater agreement refers to the
absolute consensus in scores assigned by multiple raters to the target subject (James et.al.,
1993). The within-group index (Rwg) was used to evaluate inter-rater agreement. This
agreement index represents the interchangeability of the respondents. In this study Rwg
represented the interchangeability of the responses of the participating supervisors/team
leaders and their managers. A mean Rwg of 0.7 or greater indicates inter-rater agreement
(James et.al., 1993).

149
4.3.2.4. Unidimensionality
Since the analysis of reliability and construct validity is dependent on the
assumption of unidimensionality (Al-Hawari et.al., 2005; Nunnally and Bernstein, 1994),
a CFA was conducted to examine the unidimensionality of each factor in the model. This
test also helps to reduce the possibility of misspecifications (Gerbing and Anderson,
1988). A CFI of above 0.9 suggests satisfactory unidimensionality for the factors (Al-
Hawari et.al., 2005).
4.3.2.5. Reliability
As shown in Figure 4.1, data collected in the study is meaningless unless
measurement properties of the constructs are found to be reliable and valid. The internal
consistency (reliability) of the items was assessed through Cronbach’s Alpha, composite
reliability, and variance extracted to check if items ‘hanged together’. Typically,
reliability coefficients of Cronbach’s Alpha and composite reliability of 0.7 or greater are
considered adequate (Hair et.al., 1995; Nunnally & Bernstein, 1994; Nunnally, 1978),
while the variance extracted should be greater than 0.5 to indicate reliable constructs
(Hair et.al., 1995).
4.3.2.6. Construct validity
Construct validity lies at the heart of the scientific process, as it addresses the
question of what the instrument is actually measuring. Its two components are convergent
validity and discriminant validity. Together, they indicate whether the measures are

150
similar within themselves and yet sufficiently different from other measures (Malhotra
and Grover, 1998).
Convergent validity. Convergent validity evaluates the similarity, or
convergence, between items measuring the same theoretical construct. In other words, if
measures of constructs that theoretically should be related to each other are, in fact,
observed to be related to each other, then they are said to have convergent validity.
In this study, the convergent validity for each construct was assessed by
examining the relationship between each individual measurement item and its construct.
If the relationship between each measurement item and its construct was significantly
different from zero (Nunnally and Bernstein, 1994), convergent validity of the construct
was recognized. Eigen values of the constructs and fit indices of the final measurement
model were also determined. If the Eigen value of the construct was greater than 1.0,
there was sufficient evidence of convergent validity (Hair et.al., 1995). Finally, if the fit
indices (i.e. CFI and RMSEA) of the measurement model in which the constructs were
freely correlated met the recommended guidelines (CFI > 0.9 and RMSEA < 0.05),
convergent validity was established.
Discriminant validity. Discriminant validity refers to the degree to which each
construct’s measurement items are distinctly from each other. In other words, if measures
of constructs that theoretically should not be related to each other are, in fact, observed to
not be related to each other, then they are said to have discriminant validity. In this study,
a CFA was used to assess discriminant validity.

151
Two models were constructed for all possible pairs of the latent factors in the
study. In the first model, the covariance for each factor pair was freely estimated, while in
the second model, the covariance for each factor pair was fixed to 1.0. A significant
difference in the Chi-square values for the two models implies the distinctiveness of the
two constructs (Bagozzi et.al., 1991). In addition, the average extracted variance of the
two constructs was also calculated. If the average variance extracted (AVE) for the two
constructs exceeds the square of their standardized correlation, there is evidence to
suggest discriminant validity (Fornell & Larker, 1981).
4.3.3. Structural validation
Once the measurement properties of the constructs were found to be reliable and
valid, a structural model was built to test the interrelationships between middle
management support, social practices usage, technical practices usage, quality of work
life, and employee performance. Structural equation modeling (SEM) was used to test the
model and determine the significance of the structural paths among the constructs of the
hypothesized model. More specifically, the direct effects and indirect effects of the
hypothesized relationships were estimated.
The moderation hypothesis related to task interdependence and the relationship
between social practices usage and employee performance was tested based on the
guidelines prescribed by Kline and Dunn (2000) using SEM. In this approach, the items
for the task interdependence and social practices usage constructs were first mean
centered. Next, every item of each social practices usage factor was cross multiplied with
every item of the task interdependence factor. As shown in Figure 4.3, the outcome of

152
this process formed the moderator construct (i.e., social practice usage x task
interdependence). This moderator construct, along with the constructs of social practices
usage, task interdependence, and employee performance, was included in the structural
model. The significance of the direct effect of the moderator construct determined if the
interaction effect of task interdependence on social practice usage and employee
performance existed.
Figure 4.3 Procedure to test interaction effect
Variable 1
Moderator Variable
Variable 2
Criterion Variable
Item 1*
Item 2*
Item 3*
Item 4*
Item 7Item 1 * Item 3
Item 6
Item 5
Item 8Item 1 * Item 4
Item 9Item 2 * Item 3
Item 10Item 2 * Item 4
* Items are mean centered

153
CHAPTER 5. RESULTS
This chapter contains the results of the data analyses. More specifically, it
contains the results from the pre-testing, pilot testing and final survey phases of this
study. The pre-test results provide insight to the q-sort process that determined which
survey items to include in the pilot test. The pilot tests results help purify the survey
items such that they have high factor loadings and a high Cronbach’s alpha for the final
survey. This last phase provides results from the assessment of the measurement
properties of the constructs, and from the evaluation of the hypotheses proposed in this
study.
5.1. Pre-testing
Measurement items were purified and pretested through several rounds of item
sorting. Based on the q-sort exercises with students at Clemson University and the
interviews with experts, many items in the initial questionnaire were revised for easier
readability and better coverage of the construct content. The number of items that were
initially entered into the pre-testing process is listed in Table 5.1
Table 5.1 Number of items entering q-sort process
Construct Sub-construct # of items Middle Management Support 6 Employee involvement Information sharing 5 Rewards 4 Training 5 Power 4 Employee Empowerment Perceived control 7 Perceived competence 5

154
Each round of item q-sorting produced independent samples of judgment-based,
nominal data which was used to assess the inter-rater reliability of the measurement
items. For each construct, the item placement ratio’s from the final item sorting analysis
is presented in Table 5.2. Appendix A provides the hit rate for each measurement item in
the preliminary survey.
Table 5.2 Item placement ratios
Goal Internalization 5 Quality of Work life Physical context 5 Social context 5 Job satisfaction 4 Job security 4 Task Interdependence 5 Technical practice Standardization practice 2 Pull production 2 Continuous flow production 2 Production leveling 2 Setup time reduction 2 Total Productive maintenance 2 Zero Defects 2 Visual Control 2 5-S 2 Kaizen/Continuous Improvement 2 Cellular manufacturing 2 Employee Performance 7 Marker Variable 3
Total 96
Construct Sub-construct Ratio Middle Management Support 80 % Employee involvement Information sharing 76 % Rewards 88 % Training 96 % Employee Empowerment Perceived control 96 % Perceived competence 100 % Goal Internalization 100 % Quality of Work life Physical context 100 %

155
Since all item placement ratios are above the suggested cut-off of 70%, they indicate
adequate convergent and discriminant validity for each construct. In addition, the raw
inter-rater agreement percentages, along with the Cohen’s k value, were greater than 0.65
(sample calculation shown in Appendix B), which suggest that there is sufficient inter-
rater reliability (Moore and Benbasat, 1991). The next step was to pilot test the survey
instrument.
5.2. Pilot testing
The pilot test was based on a total of sixty usable responses obtained from
Zoomerang. The data obtained was then used to assess the preliminary psychometric
properties of the survey items. Table 5.3 provides the reliability statistics for each
construct used in this study. The sample size was not large enough to allow for testing the
model as a whole. Hence, the reliability statistics for each construct (Cronbach α) was
estimated using a two-factor CFA.
Table 5.3 Construct reliabilities based on pilot data
Psycho-social context 92 % Job satisfaction 100 % Job security 95 % Task Interdependence 87 % Technical practice 88 % Employee Performance 100 %
Construct Sub-construct Cronbach’s Alpha
Middle Management Support 0.88 Employee involvement Information sharing 0.59 Rewards 0.77

156
As seen in table 5.3, there was adequate confidence (i.e. Cronbach’s α value >
0.7) in the reliability of all but two scales, information sharing and task interdependence.
Since there was no theoretical basis to drop these scales, they were included in the final
survey. Thus, the final set of measurement items was selected based on the evaluation of
the factor loadings of items on their individual constructs. The four strongest items for
each construct were retained for final testing, while new items were written if a construct
had fewer than four items. After this purification process, 94 items (listed in Table 5.4)
were retained for the final study. Appendix A lists all of the preliminary measurement
items and identifies whether they were retained, dropped or added to the final survey.
Table 5.4 Number of items entering the final survey
Training 0.81 Employee Empowerment Perceived control 0.85 Perceived competence 0.86 Goal Internalization 0.83 Quality of Work life Physical context 0.78 Social context 0.71 Job satisfaction 0.89 Job security 0.79 Task Interdependence 0.52 Employee Performance 0.77 Marker variable 0.93
Construct Sub-construct # of items Middle Management Support 4 Employee involvement Information sharing – (top down) 4 Information sharing – (bottom – up) 4 Rewards 5 Training 5 Power 4 Employee Empowerment Perceived control 4 Perceived competence 4 Goal Internalization 5
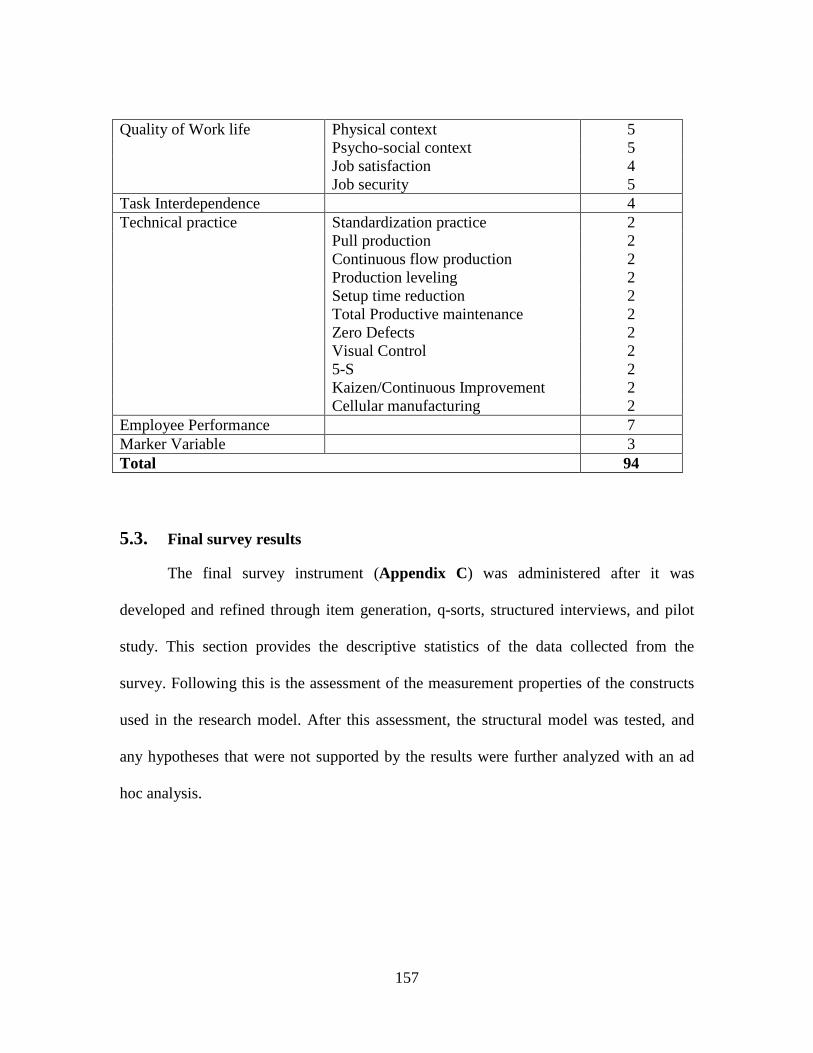
157
5.3. Final survey results
The final survey instrument (Appendix C) was administered after it was
developed and refined through item generation, q-sorts, structured interviews, and pilot
study. This section provides the descriptive statistics of the data collected from the
survey. Following this is the assessment of the measurement properties of the constructs
used in the research model. After this assessment, the structural model was tested, and
any hypotheses that were not supported by the results were further analyzed with an ad
hoc analysis.
Quality of Work life Physical context 5 Psycho-social context 5 Job satisfaction 4 Job security 5 Task Interdependence 4 Technical practice Standardization practice 2 Pull production 2 Continuous flow production 2 Production leveling 2 Setup time reduction 2 Total Productive maintenance 2 Zero Defects 2 Visual Control 2 5-S 2 Kaizen/Continuous Improvement 2 Cellular manufacturing 2 Employee Performance 7 Marker Variable 3 Total 94

158
5.3.1. Descriptive Statistics
5.3.1.1. Response rate
An initial e-mail contact was made with 1300 potential respondents, of which 325
e-mails bounced back. Of the valid 975 emails, 20 respondents refused to participate in
the study. Hence, of the remaining 955 valid email ids, 230 respondents participated (i.e.
completed the online survey) in the study. Thus, the response rate obtained for this study
is 24.08% (230/955). This response rate is considered adequate, as it is above the
suggested cut-off value of 20% (Malhotra & Grover, 2004; Dillman, 2000). A review of
the data set revealed that 26 of the 230 participating respondents had completed less than
50% of the survey; therefore, they were eliminated from the usable data set. This resulted
in a usable data set of 204 responses.
5.3.1.2. Initial data screening
The data set was first checked for univariate and multivariate outliers. Since
responses were within +/- 3σ of the mean value of responses, there were no significant
univariate outliers. The data was also checked for multivariate statistical outliers using
regression diagnostics (i.e. leverage statistics and Mahalanobis distance) in SPSS. Using
the process suggested by Kline (2005), four cases were identified as statistical outliers
and were eliminated from the data set. This resulted in a final, usable data set comprised
of 200 responses.
There were 181 missing values in the final, usable data set. These missing values
accounted for less than 0.01% of the total number of values obtained from the 200

159
responses. Little’s MCAR test, conducted in SPSS (v13.0), found that these 181 values
were missing completely at random (p > 0.05). Since the data was missing completely at
random, the values were imputed without violating the assumptions of MCAR (Allison,
2003). The direct maximum likelihood (ML) imputation method with the expectation
maximization (EM) algorithm was used to impute the missing values.
The multivariate analyses were then done on the final dataset. These analyses
indicate that there were issues with skewness and kurtosis. The analyses revealed that
there was negative skewness in the data as all item values are less than zero. This
suggests, that many observations in the survey were to the right on the measurement scale
(i.e., closer to strongly agree on the Likert scale). The analyses also revealed the values of
Kurtosis -3, were both greater and lower than items used in this study. This indicated that
the different items had a mix of high peaks and flat tails, and low peaks and thick tails.
Thus, suggesting different levels of kurtosis (see Appendix E details). Since there was no
theoretical reason to drop those items, they were retained for further analysis.
Finally, Mardia’s (1970) normalized estimate was examined to determine the
extent of normality of the data. The resulting value was greater than 5.0.This indicates
that the dataset had a non-normal distribution (Bentler, 2005). Thus, the Satorra-Bentler
scaled χ2 statistic (Satorra and Bentler, 1988), and the corresponding robust fit estimates
provided by EQS 6.1 (Byrne 2006) is used for all further statistical analyses.
Computation of the Satorra-Bentler χ2 statistic takes into account the model, the
estimation method, and the sample kurtosis values. The Satorra-Bentler χ2 statistic has
been shown to be the most reliable test statistic for evaluating mean and covariance

160
structure models under various distributions and sample sizes (Curran et al. 1996; Hu et
al. 1992).
5.3.1.3. Characteristics of sample data
The 200 usable data sets represent all types of manufacturing industries except
leather and allied products, and non-metallic mineral products. Table 5.5 details the
industry representation of the sample.
Table 5.5 Industry representation in sample data
Type of Manufacturing Industry Frequency % Cumulative %
Food manufacturing 23 11.5% 12%
Apparel manufacturing 5 2.5% 14%
Wood product manufacturing 5 2.5% 17%
Printing and related support activities 8 4.0% 21%
Petroleum and coal products manufacturing 3 1.5% 22%
Plastics and rubber products manufacturing 11 5.5% 28%
Fabricated metal products manufacturing 20 10.0% 38%
Computer and electronic product manufacturing 11 5.5% 43%
Transportation equipment manufacturing 17 8.5% 52%
Electrical equipment/appliance and component manufacturing 14 7.0% 59%
Textile mills 6 3.0% 62%
Leather and allied products 0 0.0% 62%
Paper manufacturing 6 3.0% 65%
Chemical manufacturing 14 7.0% 72%
Primary metal manufacturing 5 2.5% 74%
Non-metallic mineral products 0 0.0% 74%
Machinery manufacturing 12 6.0% 80%
Furniture and related product manufacturing 4 2.0% 82%
Miscellaneous manufacturing 36 18.0% 100%
Total 200 100%
161
As is evident from Table 5.6, the data sample represents a fairly even distribution
of the plant size (based on the number of employees) and the type of production process
(used to manufacture the most important product). It is also seen that the data sample
comes mostly from respondents who work in organizations that have implemented lean
practices. This limits the generalizability of the study, but it does improve the validity of
the study since the data sample includes organizations at different stages (i.e. the number
of years) of lean implementation.
Table 5.6 Organizational characteristics of sample data

162
As seen in Table 5.7, data was collected from a diverse pool of respondents. Half
of the respondents worked in plants that had lay-offs in the past two years, while the
other half did not. Of the 200 respondents, one-third had more than five years of
experience in their current plant, and two-thirds had between zero and five years of
Frequency % Cumulative % Plant Size (based on number of employees)
Less than 100 31 15.5% 15.5% Between 100 and 200 55 27.5% 43.0% Between 200 and 500 61 30.5% 73.5% Greater than 500 53 26.5% 100.0%
Total
200 100.0%
Age of the plant Between 0 and 7 years 9 4.5% 4.5% Between 8 and 20 years 38 19.0% 23.5% More than 20 years 153 76.5% 100.0%
Total
200 100.0%
Lean Implementation
Yes 184 92.0% 92.0% No 16 8.0% 100.0%
Total
200 100.0%
Number of Years of Lean Implementation
Between 0 and 3 years 94 47.0% 47.0% Between 4 and 7 years 64 32.0% 79.0% More than 7 years 42 21.0% 100.0%
Total
200 100.0%
Type of Production Process Job Shop process 26 13.0% 13.0%
Assembly Line Process 59 29.5% 42.5%
Continuous Flow Process 62 31.0% 73.5%
Batch Shop Process 53 26.5% 100.0%
Total 200 100.0%

163
experience. Also, one-third worked in plants with some union representation, while two-
thirds worked in plants with no unionization.
Table 5.7 Respondent characteristics of data sample
Frequency % Cumulative %
Respondent’s job title Team Leader 54 27% 27.0% Shop Floor Coordinator 4 2% 29.0% Shop Floor Supervisor 46 23% 52.0% Manufacturing Supervisor 30 15% 67.0% Production Supervisor 27 14% 80.5% Other 39 20% 100.0%
Total
200 100.0%
Lay-offs in the past two years
Yes 101 50.5% 50.5% No 99 49.5% 100.0%
Total
200 100.0%
Years of experience at this plant Between 0 and 5 years 136 68.0% 68.0% More than 5 years 64 32.0% 100.0%
Total
200 100.0%
Union representation in the plant
None 135 67.5% 67.5% Between 0 and 50% 17 8.5% 76.0% Between 50 and 100 % 30 15.0% 91.0% 100% 18 9.0% 100.0%
Total 200 100.0%
5.3.1.4. Test of non-response bias
The impact of potential non-respondent bias was assessed using wave analysis.
The sample data was split into two waves – early and late respondents – according to the
dates that the responses were received. The early respondent wave consists of 110
responses, while the late respondent wave consists of 90 responses. A one-way ANOVA

164
was run on two factors that could have impacted the response rate. As seen in Table 5.8,
the early and late respondent waves for middle management support and employee
performance show no differences, and they are not significant at the 0.05 level. This
suggests that there is no evidence of non-response bias.
Table 5.8 Assessment of non-response bias
N Mean S.D. F-value d.f. Sig.
Middle Management Support 1.56 198 0.213 Early Respondents 110 5.50 1.18 Late Respondents 90 5.69 0.94
Employee Performance 2.61 198 0.108
Early Respondents 110 5.58 1.05 Late Respondents 90 5.80 0.81
5.3.2. Assessment of measurement properties
In order to test the research model, it is important to assess the measurement
properties of the constructs to make certain they are both reliable and valid. In this
section, results of convergent validity and discriminant validity are presented. As
suggested by Churchill (1979), the items of the hypothesized constructs are empirically
assessed using Cronbach’s alpha value, factor loading, and model fit statistics. Having
assessed the validity and reliability of the items in the constructs, the hypothesized
constructs are evaluated for convergent and discriminant validity using structural
equation modeling (SEM). In this study, CFA analyses were done in EQS 6.1, a widely
used SEM software, to assess the measurement properties of the constructs and their
measurement items.

165
Before presenting the results of the assessment of the measurement properties, it
is important to discuss the requirements for using the SEM software. To obtain
meaningful results from the SEM analyses, the following five conditions were required.
Data type. The data used in SEM analysis must be ratio/interval type. In this
study, the measurement items for all constructs have an interval scale. The items are
measured on a 7-point Likert scale, which ranges from “strongly disagree” to “strongly
agree”.
Number of indicators. Ideally, there should be four indicators for each observed
construct. In certain cases, two indicators can also be used, if the researcher is confident
in the indicators’ validity and reliability (Bollen, 1989). There are a minimum of three
indicators for each construct used in the study.
Model identification. The model has to be over identified. In other words, it is a
model for which all the parameters are identified, and for which there are more known
than free parameters. In this study, the measurement and structural models are over-
identified, even with the addition of a method factor and a marker variable.
Data distribution. Multivariate normal data is preferred. Since the sample data
has a non-normal distribution, the Satorra-Bentler scaled Chi-square statistics,
corresponding robust fit estimates, and the robust standard errors were reported (Byrne,
2006; Bentler, 2005). This was done by using the ‘Robust’ option in EQS 6.1. The
statistics obtained are valid despite the violation of the normality assumption underlying
the estimation method suggested by Byrne (2006).

166
Sample size. The sample size should be sufficiently large (Shah & Goldstein,
2006). In this study, the sample size is adequate, as it meets the suggested cut-off of 200.
5.3.2.1. Convergent and discriminant validity
Convergent validity is assessed to determine the extent to which measurement
items for a given construct refer to only that construct and no other. Table 5.9 provides
the results of the two-factor CFA that was performed to determine the range of
confirmatory factor loadings for each item, along with its reliability scales (i.e.
Cronbach’s alpha and co-efficient Rho).
Table 5.9 Factor Loadings and Reliabilities
Factors No. of items
CFA Factor Loading Range
Reliability (Cronbach’s
alpha)
Reliability (Co-efficient
Rho) Middle Management Support 6 0.72 – 0.88 0.88 0.84 Information Sharing (Top- Down)
5 0.69 – 0.82 0.73 0.72
Information Sharing (Bottom – Up)
4 0.71 – 0.82 0.85 0.85
Reward Practice 5 0.83 – 0.94 0.88 0.87 Training Practice 4 0.69 – 0.90 0.84 0.80 Perceived Control 7 0.67 – 0.87 0.90 0.89 Perceived Competence 5 0.64 – 0.77 0.85 0.85 Goal Internalization 5 0.71 – 0.86 0.88 0.88 Task Interdependence 5 0.82 – 0.92 0.82 0.82 Physical Context 5 0.72 – 0.76 0.75 0.73 Social Context 4 0.70 – 0.81 0.69 0.70 Job Satisfaction 4 0.77 – 0.80 0.89 0.89 Job Security 5 0.64 – 0.85 0.82 0.83 Employee Performance 7 0.70 – 0.85 0.88 0.87 Marker Variable 3 0.78 – 0.89 0.88 0.88 Lean Practice Usage 2 0.78 – 0.85 0.82 0.80

167
The items retained after the two-factor CFA were then tested in the overall
measurement model, where all the constructs were freely correlated. The fit indices
suggest that the data fits the model well (Satorra-Bentler χ2 = 1020.05; d.f. = 861; CFI =
0.94; RMSEA = 0.037; 90% C.I. = 0.03, 0.04). As evident in Table 5.10, the standardized
factor loadings of all items meet the minimum recommended value of 0.70 (Fornell and
Larcker, 1981), except one item for task interdependence and one item for job security.
The values of the loading for these two items were between 0.6 and 0.7. The items were
retained, as there was no theoretical rationale to drop them.
Table 5.10 Factor Loadings
Item # Item Factor Loading
Middle Management Support
MMS2 My manager provides me with the necessary resources to accomplish my tasks effectively
0.84
MMS3 My manager facilitates in the implementation of quality improvements in this department
0.71
MMS4 My manager provides me with the necessary resources to improve product quality
0.85
Information Sharing (Top – Down)
IS1 Information regarding company policies and procedures is shared with my team members
0.80
IS4 My team members are kept informed when something important occurs in the department
0.70
Information Sharing (Bottom – Up)
IS5 My team members share information about their work processes with each other in this department
0.89
IS6 My team members share information regarding best practices with each other in this department
0.82
Reward Practices
R3 My team members are rewarded when they make an extra effort to improve overall performance of this department
0.89
R5 My team members are rewarded when they learn additional skills related to their work
0.87

168
Training Practices
T1 My team members are provided with training in specific job skills needed to do their job
0.74
T4 My team members are provided with training in problem solving skills related to their work
0.72
T5 My team members are provided with training in quality improvement skills related to their work area
0.81
Perceived Control PCTRL1 My team member influence process changes that affect their work 0.85 PCTRL2 My team members influence changes in their work methods 0.81
PCTRL3 My team members influence the way in which tasks are completed in their work area
0.74
PCTRL4 My team members influence decisions about issues that affect their work
0.85
Perceived Competence PC1 My team members are confident that they can do their job well 0.81 PC2 My team members demonstrate competence in meeting their job tasks 0.83 PC3 My team members have the capabilities to meet their job demands 0.79 Goal Internalization
GI1 Working towards the goals (objectives) of this department is important to my team members
0.83
GI2 My team members are enthusiastic and ready to act towards achieving the goals (objectives) of this department
0.78
GI3 My team members are inspired by the goals (objectives) of this department
0.79
GI4 My team members are willing to help this department achieve its goals (objectives)
0.80
Task Interdependence
TI1 My team members work in groups to get the job done in this department
0.87
TI2 My team members rely on each other to get the job done 0.63
TI4 My team members work in groups to get the job done in this department
0.81
Physical Context PHYC4 Eating areas within the plant are clean and hygienic 0.71 PHYC5 Restrooms within the plant are clean and hygienic 0.80 Social Context
SC1 My team members can always count on each other for support at work
0.75
SC4 My team members are friendly with each other at work 0.72

169
Job Satisfaction JSAT1 My team members enjoy coming to work everyday 0.88 JSAT3 My team members enjoy performing their daily job activities 0.91 Job Security JS1 My team members do not worry about losing their job 0.69 JS2 My team members have job security within this organization 0.83 JS3 My team members have job stability within this organization 0.81 JS4 My team members jobs have not been affected by layoffs in this plant 0.62 Marker Variable MV1 I have wonderful memories about my last vacation 0.91 MV2 I remember many things about my last vacation 0.84 MV3 I will not forget my experiences from my last vacation 0.77 Employee Performance
EP1 My team members’ abilities to deliver work output on time has improved over the past three years
0.85
EP4 My team members’ work quality has improved over the past three years
0.68
EP5 My team members’ overall performance has improved over the past three years
0.80
EP6 My team members’ dependability in meeting this department’s goals (objectives) has improved over the past three years
0.83
Technical practice LP1 My team members use lean practices on a regular basis 0.78
LP2 There is a strong commitment to using lean practices at all levels within this department
0.85
Discriminant validity is assessed to determine the extent to which the
measurement items for each construct are distinctively different from each other. Since
the survey sample data had a non-normal distribution, a scaled version of the Satorra-
Bentler pairwise Chi-square difference test - as opposed to the regular pairwise chi-
square test (Satorra & Bentler, 2001) - was used to evaluate discriminant validity for two
constructs at a time.

170
Two measurement models were compared. In the first model tested, all of the
constructs were freely correlated. In the second overall measurement model, correlation
the between two constructs (said not to be different) was constrained to unity, thus
suggesting that the items for the two constructs are measuring just one construct. The fit
of the first model was compared with the fit of the second model. A significant scaled
Satorra-Bentler pairwise Chi-square difference between the free and the fixed models
indicated discriminant validity among constructs.
This procedure revealed that employee involvement, consisting of information
sharing (top down), information sharing (bottom-up), rewards, and training practice, was
not significantly different from employee empowerment, consisting of perceived control,
perceived competence, and goal internalization practices. Thus, these two second order
constructs were re-modeled as just one second order construct (Figure 5.1). This new
construct, henceforth called “social practices usage”, now consists of the seven first order
factors from the original two constructs.

171
Figure 5.1. Revised research model
As shown in Table 5.11, the scaled version of the Satorra-Bentler pairwise Chi-square
difference test was performed again with the revised research model. The results of all
pairwise comparisons are significant (p < 0.05), indicating support for discriminant
validity.
Middle Management
Support
Employee PerformanceUsage of
Technical Practices
Quality of Work Life
Usage of Social
Practices
Information Sharing
(Top - down)
Information Sharing
(Bottom-Up)Training
Goal Internalization
Perceived Competence
Perceived Control
Physical Context
Social Context
Job Satisfaction
Job Security
H1a
H5
H4
H1b
H7
H3
H6
H2a
H2b
H8
Rewards
Task Interdependence
H9

172
Table 5.11 Assessment of discriminant validity
Constructs
Constrained Satorra-Bentler
Model χ2 (d.f. 801)
Constrained Normal Model
χ2 (d.f. 801)
Unconstrained Satorra-Bentler
Model χ2 (d.f. 800)
SB∆χ2 P-Value
Middle Management Support (MMS) with Social Practices (SP) 1028.1 1240.7 1020.0 15.03 0.000
Task Interdependence (TI) 1037.7 1249.9 1020.0 53.40 0.000 Technical practices (LP) 1025.2 1235.7 1020.0 7.17 0.007 Quality of work life (QWL) 1030.9 1243.6 1020.0 52.47 0.000 Employee Performance (EP) 1022.3 1232.6 1020.0 44.82 0.000
Social Practices (SP) with Task Interdependence 1027.3 1237.3 1020.0 50.27 0.000 Technical practices (LP) 1039.3 1251.8 1020.0 48.93 0.000 Quality of work life (QWL) 1028.3 1241.6 1020.0 8.91 0.002 Employee Performance (EP) 1038.7 1251.2 1020.0 47.18 0.000
Task Interdependence with Technical practices (LP) 1025.4 1235.5 1020.0 17.84 0.000 Quality of work life (QWL) 1031.2 1240.9 1020.0 24.28 0.000 Employee Performance (EP) 1039.6 1250.6 1020.0 21.42 0.000
Technical practices (LP) with Quality of work life (QWL) 1021.1 1232.4 1020.0 13.36 0.000 Employee Performance (EP) 1039.3 1251.8 1020.0 89.55 0.000
Quality of work life (QWL) with Employee Performance (EP) 1042.1 1270.5 1020.0 3.90 0.048
Unconstrained normal model χ2 = 1231.7 with 800 df

173
Convergent and discriminant validity is further assessed using the Fornell and
Larcker (1981) analysis. As shown in table 5.12, the average variance extracted (AVE)
for each of the new constructs was above the suggested cut-off of 0.5 (i.e. variance
explained by the construct is greater than the measurement error), thus suggesting
evidence of convergent validity. Moreover, the square root of AVE for each construct
was greater than all the inter-construct correlations, further suggesting evidence of
discriminant validity.

174
Table 5.12 Correlation and Average Variance Extracted
AVE MMS ISA ISB R T PCTRL PC GI TI PHYC SC JSAT JS EP MV LP
MMS 0.64 0.80
ISA 0.57 0.55 0.75
ISB 0.73 0.56 0.62 0.86
R 0.78 0.44 0.49 0.50 0.88
T 0.57 0.62 0.68 0.69 0.54 0.76
PCTRL 0.66 0.61 0.67 0.68 0.54 0.75 0.81
PC 0.66 0.44 0.49 0.50 0.39 0.54 0.54 0.81
GI 0.64 0.57 0.63 0.64 0.50 0.70 0.69 0.50 0.80
TI 0.60 0.46 0.64 0.65 0.51 0.71 0.70 0.51 0.65 0.78
PHYC 0.57 0.39 0.38 0.38 0.30 0.42 0.41 0.30 0.39 0.40 0.76
SC 0.54 0.57 0.55 0.56 0.44 0.61 0.60 0.44 0.56 0.59 0.44 0.73
JSAT 0.80 0.58 0.56 0.57 0.45 0.62 0.61 0.45 0.57 0.60 0.45 0.65 0.89
JS 0.55 0.55 0.29 0.28 0.29 0.23 0.31 0.31 0.23 0.29 0.30 0.22 0.33 0.74
EP 0.63 0.63 0.52 0.52 0.53 0.42 0.58 0.57 0.41 0.53 0.56 0.38 0.56 0.29 0.79
MV 0.71 0.71 0.00 0.00 0.00 0.00 0.00 0.00 0.00 0.00 0.00 0.00 0.00 0.00 0.00 0.84
LP 0.67 0.67 0.55 0.60 0.61 0.48 0.67 0.66 0.48 0.62 0.61 0.37 0.54 0.28 0.61 0.00 0.82
Note: Construct variance is shown on the diagonal.

175
5.3.2.2. Analysis of common method bias
The validity of the study was also analyzed by testing for common method bias.
Three statistical procedures were used to diagnose and control for common method bias:
Harman’s single factor test, a partial correlation procedure using a marker variable, and
use of a single unmeasured latent method factor (Podsakoff et.al., 2003).
The Harman’s single factor test extracted nine factors from the data that
correspond to the latent variables in this study. These factors account for 70.34 % of the
variance, with one factor accounting for 36.1%. No single factor accounted for a majority
of the covariance, suggesting that common method bias does not pose a severe threat to
the validity of the study.
Next, common method bias was assessed using the partial correlation procedure
with a marker variable of “memory of an experience”. Two models were compared
(Table 5.13) to assess the potential effects of the common method bias. Model 1
contained the items loaded onto their respective latent factors, and model 2 contained
items loaded onto their respective latent factors and also onto the first order marker
variable. When the two models are compared with each other, the Satorra-Bentler Chi-
square difference is found to be significant (p < 0.005). This implies that the marker
variable may have an impact on the validity of the study and it could lead to common
method bias.

176
Table 5.13 Results of partial correlation procedure
Without marker variable (Model 1)
With marker variable (Model 2)
Satorra-Bentler Chi-square difference
Satorra-Bentler Model 1 χ2
Model 1 χ2
df Satorra-Bentler Model 2 χ2
Model 2 χ2
Df SB∆χ2 ∆df P-Value
1026.80 1285.16 800 1146.36 1426.41 884 120.34 84 0.005
In addition to comparing the two models, the structural parameters of the model
with the marker variable were assessed. This revealed that the loadings on the factors are
much higher than the loadings on the marker variable (Table 5.14). The low factor
loading on the marker variable contradicted the Satorra-Bentler Chi-square difference
results. This inconclusive finding prompted the use of a more stringent procedure to test
for common method bias.
Table 5.14 Item loading based on marker variable
Item # Item Factor Loading
Marker Variable Loading
Middle Management Support Average Variance Extracted 0.65 0.01
MMS2 My manager provides me with the necessary resources to accomplish my tasks effectively
0.84 0.10
MMS3 My manager facilitates in the implementation of quality improvements in this department
0.71 0.13
MMS4 My manager provides me with the necessary resources to improve product quality
0.85 0.11
Information Sharing (Top – Down) Average Variance Extracted 0.57 0.01
IS1 Information regarding company policies and procedures is shared with my team members
0.80 0.12
IS4 My team members are kept informed when something important occurs in the department
0.70 0.06
Information Sharing (Bottom – Up)

177
Average Variance Extracted 0.73 0.01
IS5 My team members share information about their work processes with each other in this department
0.89 0.10
IS6 My team members share information regarding best practices with each other in this department
0.82 0.07
Reward Practices Average Variance Extracted 0.78 0.00
R3 My team members are rewarded when they make an extra effort to improve overall performance of this department
0.89 0.06
R5 My team members are rewarded when they learn additional skills related to their work
0.87 0.07
Training Practices Average Variance Extracted 0.57 0.04
T1 My team members are provided with training in specific job skills needed to do their job
0.74 0.07
T4 My team members are provided with training in problem solving skills related to their work
0.72 0.14
T5 My team members are provided with training in quality improvement skills related to their work area
0.81 0.30
Perceived Control Average Variance Extracted 0.66 0.04
PCTRL1 My team member influence process changes that affect their work
0.85 0.27
PCTRL2 My team members influence changes in their work methods
0.81 0.13
PCTRL3 My team members influence the way in which tasks are completed in their work area
0.74 0.18
PCTRL4 My team members influence decisions about issues that affect their work
0.85 0.23
Perceived Competence Average Variance Extracted 0.66 0.01
PC1 My team members are confident that they can do their job well
0.81 0.17
PC2 My team members demonstrate competence in meeting their job tasks
0.83 0.08
PC3 My team members have the capabilities to meet their job demands
0.79 0.07
Goal Internalization Average Variance Extracted 0.60 0.02
GI1 Working towards the goals (objectives) of this department is important to my team members
0.83 0.20
GI2 My team members are enthusiastic and ready to act 0.78 0.18

178
towards achieving the goals (objectives) of this department
GI3 My team members are inspired by the goals (objectives) of this department
0.79 0.12
GI4 My team members are willing to help this department achieve its goals (objectives)
0.80 0.05
Task Interdependence Average Variance Extracted 0.60 0.03
TI1 My team members work in groups to get the job done in this department
0.87 0.17
TI2 My team members rely on each other to get the job done 0.63 0.16
TI4 My team members work in groups to get the job done in this department
0.81 0.14
Physical Context Average Variance Extracted 0.57 0.02 PHYC4 Eating areas within the plant are clean and hygienic 0.71 0.17 PHYC5 Restrooms within the plant are clean and hygienic 0.80 0.14 Social Context Average Variance Extracted 0.54 0.02
SC1 My team members can always count on each other for support at work
0.75 0.14
SC4 My team members are friendly with each other at work 0.72 0.17 Job Satisfaction Average Variance Extracted 0.80 0.05 JSAT1 My team members enjoy coming to work everyday 0.88 0.18 JSAT3 My team members enjoy performing their daily job
activities 0.91 0.26
Job Security Average Variance Extracted 0.55 0.01 JS1 My team members do not worry about losing their job 0.69 -0.05
JS2 My team members have job security within this organization
0.83 0.11
JS3 My team members have job stability within this organization
0.81 0.04
JS4 My team members jobs have not been affected by layoffs in this plant
0.62 0.10
Employee Performance Average Variance Extracted 0.63 0.01
EP1 My team members’ abilities to deliver work output on time has improved over the past three years
0.85 0.04
EP4 My team members’ work quality has improved over the past three years
0.68 0.09

179
EP5 My team members’ overall performance has improved over the past three years
0.80 0.13
EP6 My team members’ dependability in meeting this department’s goals (objectives) has improved over the past three years
0.83 0.12
Technical practice Average Variance Extracted 0.67 0.03 LP1 My team members use lean practices on a regular basis 0.78 0.18
LP2 There is a strong commitment to using lean practices at all levels within this department
0.85 0.17
Finally, common method bias was assessed using a single unmeasured latent
method factor. Here, once again, two models were compared. Model 1 contained items
loaded onto their respective latent factors, and model 2 contained items loaded onto their
respective latent factors and also onto a first order unmeasured latent method factor.
When the two models were compared (Table 5.15) the Satorra-Bentler Chi-square
difference revealed that the latent method factor may have an impact on the validity of
the study and thus, common method bias may be an issue.
Table 5.15 Results of unmeasured latent method factor
Without unmeasured latent method factor (Model 1)
With unmeasured latent method factor (Model 2)
Satorra-Bentler Chi-square difference
Satorra-Bentler Model 1 χ2
Model 1 χ2
df Satorra-Bentler Model 2 χ2
Model 2 χ2
df SB∆χ2 ∆df P-Value
1026.80 1285.16 800 939.52 1137.66 759 73.54 41 0.000
In addition to comparing the two models, the structural parameters of the model with the
unmeasured latent method factor were assessed. This revealed that the loadings on the
method factor were unusually high. This indicates that there was a significant method
effect.

180
Table 5.16 Item loading based on unmeasured latent method factor
Item # Item Factor Loading
Method Factor
Loading Middle Management Support Average Variance Extracted 0.56 0.10
MMS2 My manager provides me with the necessary resources to accomplish my tasks effectively
0.77 0.33
MMS3 My manager facilitates in the implementation of quality improvements in this department
0.68 0.26
MMS4 My manager provides me with the necessary resources to improve product quality
0.78 0.34
Information Sharing (Top – Down) Average Variance Extracted 0.41 0.23
IS1 Information regarding company policies and procedures is shared with my team members
0.72 0.34
IS4 My team members are kept informed when something important occurs in the department
0.55 0.59
Information Sharing (Bottom – Up) Average Variance Extracted 0.50 0.25
IS5 My team members share information about their work processes with each other in this department
0..73 0.55
IS6 My team members share information regarding best practices with each other in this department
0.68 0.44
Reward Practices Average Variance Extracted 0.59 0.19
R3 My team members are rewarded when they make an extra effort to improve overall performance of this department
0.78 0.43
R5 My team members are rewarded when they learn additional skills related to their work
0.76 0.43
Training Practices Average Variance Extracted 0.45 0.20
T1 My team members are provided with training in specific job skills needed to do their job
0.55 0.50
T4 My team members are provided with training in problem 0.71 0.38

181
solving skills related to their work
T5 My team members are provided with training in quality improvement skills related to their work area
0.74 0.45
Perceived Control Average Variance Extracted 0.34 0.37
PCTRL1 My team member influence process changes that affect their work
0.49 0.72
PCTRL2 My team members influence changes in their work methods
0.57 0.60
PCTRL3 My team members influence the way in which tasks are completed in their work area
0.56 0.53
PCTRL4 My team members influence decisions about issues that affect their work
0.68 0.55
Perceived Competence Average Variance Extracted 0.47 0.20
PC1 My team members are confident that they can do their job well
0.72 0.40
PC2 My team members demonstrate competence in meeting their job tasks
0.71 0.44
PC3 My team members have the capabilities to meet their job demands
0.62 0.50
Goal Internalization Average Variance Extracted 0.45 0.23
GI1 Working towards the goals (objectives) of this department is important to my team members
0.65 0.53
GI2 My team members are enthusiastic and ready to act towards achieving the goals (objectives) of this department
0.79 0.31
GI3 My team members are inspired by the goals (objectives) of this department
0.61 0.49
GI4 My team members are willing to help this department achieve its goals (objectives)
0.61 0.54
Task Interdependence Average Variance Extracted 0.52 0.11
TI1 My team members work in groups to get the job done in this department
0.79 0.36
TI2 My team members rely on each other to get the job done 0.54 0.39
TI4 My team members work in groups to get the job done in this department
0.80 0.27
Physical Context Average Variance Extracted 0.55 0.07 PHYC4 Eating areas within the plant are clean and hygienic 0.71 0.19

182
PHYC5 Restrooms within the plant are clean and hygienic 0.77 0.32 Social Context Average Variance Extracted 0.45 0.08
SC1 My team members can always count on each other for support at work
0.67 0.29
SC4 My team members are friendly with each other at work 0.67 0.26 Job Satisfaction Average Variance Extracted 0.53 0.28 JSAT1 My team members enjoy coming to work everyday 0.70 0.55 JSAT3 My team members enjoy performing their daily job
activities 0.75 0.50
Job Security Average Variance Extracted 0.51 0.06 JS1 My team members do not worry about losing their job 0.70 0.11
JS2 My team members have job security within this organization
0.77 0.30
JS3 My team members have job stability within this organization
0.78 0.26
JS4 My team members jobs have not been affected by layoffs in this plant
0.59 0.22
Employee Performance Average Variance Extracted 0.49 0.18
EP1 My team members’ abilities to deliver work output on time has improved over the past three years
0.74 0.42
EP4 My team members’ work quality has improved over the past three years
0.75 0.15
EP5 My team members’ overall performance has improved over the past three years
0.72 0.39
EP6 My team members’ dependability in meeting this department’s goals (objectives) has improved over the past three years
0.59 0.59
Technical practice Average Variance Extracted 0.66 0.04 LP1 My team members use lean practices on a regular basis 0.83 0.06
LP2 There is a strong commitment to using lean practices at all levels within this department
0.80 0.27
In addition to the Satorra-Bentler scales Chi-square difference test, and estimating the
item loading on the unmeasured latent method factor, the model fit (i.e. CFI) value for the

183
model with the unmeasured latent method factor (model A) and without it (model B) was
also evaluated. Byrne (2006) suggests that since Chi-square differences are sensitive to
sample size, researchers must evaluate ∆CFI for the two models. As the ∆CFI of 0.013
(model A CFI = 0.951; model B CFI = 0.938) in this study was greater than the
recommended value of 0.01 (Cheung & Rensvold, 2002), we conclude that common
method bias was an issue. Hence for all further analyses, the unmeasured latent method
factor is included in the structural model to partial out any method factor.
5.3.3. Hypothesis testing
This section provides the structural properties of the hypothesized research model.
This is followed by the results of the analyses of direct effects and moderation effects of
the proposed hypotheses in the study. Lastly, post-hoc analyses provide possible
explanations for the proposed hypotheses that were not supported by the data.
5.3.3.1. Structural model
The measurement model was tested with all factors being freely correlated with
one another. The measurement items were loaded onto their respective factors and also
onto the unmeasured latent method factor. This was then included in the structural model
that was used to test the hypothesized research model. The moderator variable (i.e. task
interdependence) was excluded, as it was tested separately. The fit indices, as shown in
Table 5.17, suggest that the revised structural model fits the data well. The CFI fit index
is above the suggested cut-off of 0.90, and the RMSEA value is below the cut-off of 0.05
(Kline, 2005).

184
Table 5.17 Fit of the hypothesized structural model*
Satorra-Bentler Chi-Square (df)
CFI RMSEA
Measurement model 1020.05 (800) 0.95 0.037 Structural model 1295.17 (934) 0.91 0.044
* These models do not include the task interdependence construct
5.3.3.2. Analysis of direct effects
Figure 5.2 Hypothesized structural model with standardized path loadings
The result from this analysis is provided in four categories. First, the direct effect
of middle management support on social practice usage, technical practice usage,
employee performance, and quality of work life is presented. Second, the direct effect of
social practice usage of technical practice usage, employee performance, and quality of
Middle Management
Support
Employee PerformanceUsage of
Technical Practices
Quality of Work Life
Usage of Social
Practices
Information Sharing
(Top - down)
Information Sharing
(Bottom-Up)Training
Goal Internalization
Perceived Competence
Perceived Control
Physical Context
Social Context
Job Satisfaction
Job Security
0.31*
0.36*
0.24*0.62**
0.743*0.39*
0.61**
0.303
(0.055 **)
0.79*
0.23*
0.37**
ns Not significant at 0.05 level * Significant at 0.05 level** Significant at 0.01 level *** Significant at 0.001 level
Rewards
0.73*
H2b
Values in parenthesis are the unstandardized coefficients

185
work life is presented. Third, the direct effect of technical practice usage on employee
performance and quality of work life is presented. Fourth, the direct effect of quality of
work life on employee performance is presented. Table 5.8., provides a summary of the
results from the analyses. The structural model shown in Figure 5.2 provides the nature
(i.e. direction) and the standardized path loadings of the hypothesized direct relationships
in the study.
Table 5.18 Summary of direct effectsin the proposed model
Hypothesis Direct Effect Unstd.
Loading Std. Error
C.R. p-
value Supported
?
H1a Middle Management Support � Social Practices Usage
0.35 0.10 3.51 0.00 Yes
H2a Middle Management Support � Technical Practices Usage
-0.62 0.43 -1.45 0.15 No
H3 Middle Management Support � Improvement in Employee Performance
0.58 0.08 7.55 0.00 Yes
H4 Middle Management Support � Quality of Work Life
0.22 0.13 1.58 0.115 No
H5 Social Practices usage � Technical Practices Usage
5.220 0.97 5.16 0.00 Yes
H1b Social Practices Usage � Improvement in Employee Performance
-0.221 0.11 -2.10 0.01 Yes
H7 Social Practices usage � Quality of Work Life
-0.664 0.21 -3.18 0.00 No
H2b Technical Practices Usage � Improvement in Employee Performance
0.055 0.02 2.75 0.01 Yes
H6 Technical Practices Usage � Quality of Work Life
0.122 0.02 5.08 0.00 Yes
H8 Quality of Work Life � Improvement in Employee Performance
0.100 0.99 0.10 0.47 No

186
Direct effects of middle management support. In the study, middle management
support is proposed to have a direct effect on social practice usage, technical practice
usage, quality of work life and improvement in employee performance. More
specifically, hypothesis 1a proposed that middle management support is positively related
to the social practices usage. This hypothesis was supported ( β= 0.54, p < 0.001).
Hypothesis 2a proposed that middle management support is positively related to technical
practices usage. This hypothesis was not supported ( β= -0.064, p < 0.15). Hypothesis 3,
proposed a positive relationship between middle management support and improvement
in employee performance. This hypothesis was supported (β= 0.76, p < 0.001). Finally,
hypothesis 4 proposed a positive relationship between middle management support and
quality of work life. This hypothesis was not supported (β= - 0.18, p < 0.15). This
contradictory finding may be explained by conclusions from Sirgy et.al (2001) and
Martel and Dupius (2006), who found that employees’ perceptions of their quality of
work life change constantly, based on their immediate individual needs. In other words,
employees have changing dispositions to the dimensions (i.e. physical environment,
social context, job satisfaction, job security) of quality of work life. Therefore, middle
management support will not have a significant effect on individuals’ perceptions of their
quality of work life.
Direct effects of social practice usage. In this study, social practice usage is
proposed to have a direct effect on improvement in employee performance, technical
practice usage and employees’ quality of work life. More specifically, hypothesis 1b
proposed a positive relationship between social practice usage and improvement in

187
employee performance. This hypothesis was not supported. However, contrary to the
expectation, there was a significant negative relationship between the social practices
usage and employee performance (β= - 0.18, p < 0.04). To investigate this contradictory
finding, correlation analyses for all items of social practices, middle management
support, quality of work life, and employee performance were analyzed (Appendix D).
The bi-variate correlation between the constructs of social practice usage and
employee performance was found to be positive. Further the first order correlations
between middle management support and employee performance was much greater than
the correlation between social practice usage and employee performance. This suggests a
case of net suppression. The result of hypothesis 1b can now be interpreted as follows:
given that the level of middle management support remains constant, increasing the level
of social practices usage will have a negative impact on employee performance. Stated
differently, this means that increasing the usage of social practices does not automatically
translate into improved employee performance. Social practices usage will have a
positive impact on employee performance, only when we control for the level of middle
management support.
Hypothesis 5 proposed a positive relationship between social practices usage and
technical practices usage. This hypothesis was supported (β= 0.77, p < 0.0001). Finally,
hypothesis 7, proposed a positive relationship between social practices usage and
employees’ quality of work life. This hypothesis was not supported. However, contrary to
the expectation, there was a significant negative relationship between the social practices
usage and employee performance (β= - 0.664, p < 0.0001).

188
Direct effects of technical practice usage. In this study, technical practice usage
is proposed to have a direct effect on employees’ performance and quality of work life.
More specifically, hypothesis 2b proposed that technical practice usage is positively
related to improvement in employee performance. This hypothesis was supported (β=
0.30, p < 0.01). Hypothesis 6 proposed a positive relationship between usage of technical
practices and the employees’ quality of work life. This hypothesis was also supported (β=
0.99, p < 0.001).
Direct effects of quality of work life. In this study, hypothesis 8 proposed that
employees’ quality of work life is positively related to their improvement in performance.
Contrary to the expectation, this hypothesis was however not supported (β= - 0.007, p <
0.95).
5.3.3.3. Analysis of interaction effect
Hypothesis 9 proposed an interaction effect of task interdependence on the
relationship between social practice usage and improvement in employee performance.
The SEM analysis revealed that this interaction effect was insignificant (β= -0.017, p <
0.68). Thus hypothesis 9 was not supported. A detailed examination of the results reveals
that although task interdependence is not a significant moderator between these two
constructs, the data indicates that for low levels of task interdependence, employee
performance reduces as the usage of social practices increases. For high levels of task
interdependence, employee performance increases as social practices usage increases.

189
The insignificant interaction effect found in this study may be attributed to a
phenomenon called as the ceiling effect (Cohen et.al., 2003). More specifically, a careful
examination of the study sample revealed that 184 of the 200 respondents worked in
organizations that had implemented lean practices and therefore we suppose that they
heavily depended on teams. As a result of this sample characteristic, the variance in the
independent variable (i.e. task interdependence) could not be measured or estimated
above a certain level of dependency. Scores for task interdependence were bunched at the
upper level of the Likert scale. Hence future studies should collect data from firms that
have implemented a lean approach to work design, and also ones that have not.
5.3.3.4. Post-hoc analyses
Indirect effect. Indirect effects are the mediation effects in the hypothesized
research model (Figure 5.2) that were determined post-hoc using the Sobel test (Sobel,
1982). In this approach, “a” and “b” represented the unstandardized path loadings for
path X�Z and Z�Y respectively, for an overall path model represented as X� Z � Y.
In addition to the unstandardized path loadings, SEa and SEb represented the standard
error for paths X�Z and Z�Y respectively. The unstandardized indirect effects were
obtained by taking the product of the two unstandardized path loadings a and b, while the
standard error for the indirect effect SEab was calculated as √ b2SEa2 + a2SEb
2 . The Sobel
test statistic (a*b/SEab) was interpreted as the z-test for the indirect effect. Table 5.20
provides the results for the post-hoc propositions.

190
Table 5.19 Sobel test for indirect effects
Proposition Indirect Effect Mediating
effect Std. Error Z- Statistics p-value
P1 Middle Management Support � Social Practices Usage � Technical Practices Usage
1.763 0.61 2.901 0.003
P2 Middle Management Support � Social Practices Usage � Quality of Work Life
-0.223 0.11 -2.195 0.02
P3 Middle Management Support �Technical Practices Usage � Quality of Work Life
-0.076 0.06 -1.382 0.17
P4 Middle Management Support � Quality of Work Life � Employee Performance
-0.002 0.24 -1.611 0.10
P5 Middle Management Support � Social Practices Usage � Employee Performance
-0.078 0.04 -1.805 0.07
P6 Middle Management Support �Technical Practices Usage � Employee Performance
-0.034 0.03 -1.273 0.20
P7 Social Practices Usage �Technical Practices Usage � Quality of Work Life
0.613 0.17 3.620 0.00
P8 Social Practices Usage � Quality of Work Life � Employee Performance
0.007 0.00 2.841 0.003
P9 Social Practices Usage � Technical Practices Usage � Employee Performance
0.276 0.11 2.426 0.01
P10 Technical Practices Usage � Quality of Work Life � Employee Performance
-0.001 0.00 -5.077 0.000
Technical practices. This test aimed to determine if process type (i.e. assembly
line, batch shop, job shop, or continuous flow process) had an impact on the usage of
technical practices, which was measured as the following bundles: total quality
management (TQM), total preventative maintenance (TPM), and just-in-time (JIT). The
one-way ANOVA for process type and the technical practices usage (Table 5.21)
revealed no significant difference (α = 0.95). This result indicates that the production

191
process used by a plant (to manufacture its main product) has no influence on the specific
technical practices implemented in that plant.
Table 5.20 One-way ANOVA for process type and technical practices
Sums of Squares
Df Mean Squares
Fstat Significance
TQM bundle Between Groups 4.545 3 1.515 1.752 0.158 Within Groups 169.470 196 0.865 Total 174.014 199
TPM bundle Between Groups 7.642 3 2.547 1.055 0.369 Within Groups 473.313 196 2.415 Total 480.955 199
JIT bundle Between Groups 1.831 3 0.610 0.670 0.571 Within Groups 178.512 196 0.911 Total 180.344 199
This study confirmed the earlier findings of Shah and Ward (2003), that size of
the firm has an influence on the usage of technical practices (measured as the lean
bundles). Additionally, one-way ANOVA tests (Table 5.22) revealed which technical
practices are influenced by plant size.
Table 5.21 One-way ANOVA for Organizational Size and Technical Practice
Sums of Squares
Df Mean Squares
Fstat Significance
TQM bundle Between Groups 14.901 9 1.656 1.977 0.044 Within Groups 159.113 190 0.837 Total 174.014 199
TPM bundle Between Groups 25.486 9 2.830 1.180 0.310 Within Groups 455.487 190 2.397 Total 480.955 199
JIT bundle

192
Between Groups 10.908 9 1.212 1.359 0.209 Within Groups 169.436 190 0.892 Total 180.344 199
Test results for the TQM bundle were significant (α = 0.95). This indicates that plant
size influences the implementation of the technical practices of standardized work,
kaizen, zero defects, visual control, and 5-S. The analyses of the JIT and TPM bundles,
with respect to plant size, were not significant.

193
CHAPTER 6. SUMMARY AND CONCLUSION
This chapter discusses the contributions that this dissertation makes to the field of
operations management. Key findings from the data analyses are presented first, followed
by applications of this research to academia and the industry. Finally, this chapter
addresses limitations of the study and presents directions for future research.
6.1. Key findings
The key findings of this dissertation are presented with respect to the four
research questions posed in Chapter 1:
1. What work practices integrate socio-technical and lean approaches to
organizational work design within manufacturing?
2. What are the effects these organizational work practices have on the employee
quality of work life?
3. What are the effects these organizational work practices have on employee
performance?
4. How does task interdependence affect employee performance in
manufacturing?
6.1.1. Key finding 1: Integration of STS and lean principles
Based on a systemic method of comparing and then categorizing the STS and LP
principles which are based on a common overarching goals the principles are trying to
achieve, work practices were identified that could help in achieving those goals (see

194
section 3.1). The work practices identified thus reflected an integrated STS and LP
approach to work design. These work practices were middle management support, social
practices usage, and technical practices usage. Usage of social practices consists of
information sharing practice (both top-down information sharing and bottom–up
information sharing), reward practice, training practice, and practice of power manifested
as perceived control, perceived competence, and goal internalization. Usage of technical
practices consists of the lean practice bundles identified by Shah and Ward (2003) –
TQM bundle, TPM bundle, and the JIT bundle.
To provide a succinct explanation of the impact of the above identified work
practices on employees’ quality of work life and performance, a parsimonious model was
tested (Figure 6.1). This model contained only the significant direct effects of the
relationships proposed in the full model (Figure 5.2). The fit of this model (CFI - 0.91,
RMSEA – 0.044) was not significantly different than the fit of the full model (CFI - 0.91,
RMSEA – 0.044). Hence, we suggest that the parsimonious model succinctly describes
the relationships.

195
Figure 6.1 Significant paths in the research model
6.1.2. Key finding 2: Impact on quality of work life
The decomposition of the total effects of middle management, social practices
usage and technical practices usage as shown in Table 6.1, reveals that only technical
practices usage had a significant direct effect on employee’s quality of work life. Social
practices usage and middle management support had no direct significant effect on the
employees’ quality of work life. Social practices usage had a significant positive indirect
effect of quality of work life when mediated through technical practices usage. This
means that usage of technical practices, when complementing usage of social practices,
improves employees’ quality of work life. Furthermore, the indirect effect of the social
practice usage on quality of work life is greater than the direct effect of technical practice
usage on employees’ quality of work life. This suggests that both social practices and
Middle Management
Support
Employee PerformanceUsage of
Technical Practices
Quality of Work Life
Usage of Social
Practices
Information Sharing
(Top - down)
Information Sharing
(Bottom-Up)Training
Goal Internalization
Perceived Competence
Perceived Control
Physical Context
Social Context
Job Satisfaction
Job Security
H1a
H5
H3
H6
H2b
Rewards
0.043 (0.208)**
ns Not significant at 0.05 level * Significant at 0.05 level ** Significant at 0.0001 level

196
technical practices are needed to have a greater impact on the employees’ quality of work
life.
Middle management support like social practices usage also has a significant
positive indirect effect on the quality of work life when mediated through social practices
usage and technical practices usage. This supports prior findings in the literature that
when middle managers promote the usage of social practices (i.e. bi-directional
information sharing, providing access to relevant and appropriate training, instating a
reward structure, and empowering employees (Menon, 2001; Bowen & Lawler, 1992),
employees are more likely to utilize technical practices effectively. This leads to
improved working conditions and therefore, employees experience a better quality of
work life (Rethinam & Ismail, 2008; Treville & Antonakis, (2006); Sumukadas, 2005;
Shah & Ward, 2003; Pun et.al., 2001; Brown et.al., 2000).
Table 6.1 Total effect decomposition
Causal Variables
Endogenous Variables Social practices
usage Technical practices
usage Quality of work life
Employee Performance
Unstd. Unstd. Unstd. Unstd. Middle management support
Direct effect 0.41 - - 0.54 Indirect effect - 1.31 0.13 0.06 Total 0.41 1.31 0.13 0.60
Social practices usage Direct effect 3.203 - - Indirect effect - 0.32 0.14 Total 3.203 0.32 0.14
Technical practices usage Direct effect 0.1 0.04 Indirect effect - Total 0.1 0.04
* Effect of quality of work life on employee performance was non-significant

197
6.1.3. Key finding 3: Achieving employee performance
The decomposition of the total effects of middle management, social practice
usage and technical practice usage as shown in Table 6.1, reveal that middle management
support has both a significant positive direct and indirect effect on improvement in
employee performance. Technical practices usage also has a positive significant direct
effect on improvement in employee performance. Social practices usage and quality of
work life however, had no positive significant direct effect on employee performance.
Social practices usage infact has a significant positive indirect effect on improvement in
employee performance. Technical practices usage mediates the relationship between
social practices usage and improvement in employee performance. Furthermore, the
indirect effect of social practices usage on improvement in employee performance is
greater than the direct effect of technical practices usage on improvement in employee
performance. This suggests that, it is important to have both the social practices as well
as the technical practices to have a greater impact on improvement in employee
performance.
6.1.4. Key finding 4: Effect of task interdependence
In recent years, the focus of organizational work design has shifted from
individuals to teams (Liker, 2004; Shah & Ward, 2003; Sohal & Egglestone, 1994).
Tasks have become highly interdependent, and hence the need for employees to interact
and coordinate with each other has increased (Wageman, 1995). This interdependency
creates opportunities for conflicts, which can result in lower employee performance
(Wilmont & Hocker, 2001; Guzzo & Shea, 1992). Thus, task interdependence was

198
posited to have a moderation effect on improvement in employee performance (Treville
and Antonakis, 2006; Seibert et.al, 2004; Kozlowski & Bell, 2003). However, the
research results do not offer support for this claim.
6.2. Overall conclusions
6.2.1. Integration of the social and technical practices usage
Social practices usage has a significant indirect effect on both employees’ quality
of work life and improvement in employee performance. This effect is mediated through
the usage of technical practices. This suggests that organizations that promote the usage
of social practices by encouraging information sharing practices, training practices,
reward practices, and empowerment practice which is measured as power through
perceived control, perceived competence, and goal internalization has an effect on
employees’ quality of work life and improvement in employee performance only if
employees use the technical practices (i.e., the TPM, TQM, JIT bundles). This conclusion
supports the underlying methodology for the redesign of work practices based on the
socio-technical systems philosophy – to enable more effective integration of human and
technological resources (Cherns, 1979, 1987; Cleggs, 2000) – and the lean production
system – an integrated socio-technical system whose main objective is to eliminate waste
(Shah & Ward).
The above finding supports the definition of ‘lean production’ provided by Shah
and Ward (2007), in which they consider LP to be an integrated socio-technical system
that focuses on the usage of social practices to harness the benefits of the technical

199
practices. This finding also resonates with anecdotal comments made by practitioners.
For example AME president Ralph Keller, in his key note address at the AME annual
conference in Covington, KY (2009), acknowledged that the industry has now turned its
focus to the usage of social practices. According to him, the 80s and 90s was all about
using the technical practices alone, now it is the time to promote the usage of social
practices to gain benefit from the usage of technical practices and improving the workers
quality of work life in the process.
6.2.2. Implications of middle management support
Middle management support had a significant direct effect on the employee
performance. This implies that when middle managers provide employees with resources
to accomplish their task(s) and interpret the top management directives, have a significant
effect on the performance of their employees. However, middle management support had
no significant direct effect on the technical practice usage and the employees’ quality of
work life. Middle management support infact had a significant indirect effect on the
usage of technical practice and employees’ quality of work life.
Social and technical practice usage mediated the relationship between middle
management support and quality of work life, while technical practices mediated the
relationship between middle management support and employee performance. This
implies that the both social practice usage and technical practice usage is vital for middle
management support to have an impact on both the employees quality of work life and
the employee performance.

200
6.3. Contributions of research
This dissertation makes several contributions to both research and practice. Until
now, researchers studying lean production have defined and described lean production
primarily in terms of achieving the end goal – minimizing buffers, reducing variability,
and eliminating all kinds of waste (Dennis, 2007; Narasimhan et.al., 2006; Treville &
Antonakis, 2006; Bonavia & Marin, 2006; Li et.al., 2005; Hopp & Spearman, 2004;
Liker, 2004; Womack & Jones, 1996). Of these researchers, only Shah and Ward (2003)
defined and described lean production as a multi-dimensional approach that encompasses
a wide variety of management practices that work synergistically to create a high quality
management system. In 2007, they further refined their work by defining lean production
as an integrated socio-technical system; however, they only focused on the technical
practices. This study extends the research stream by operationalizing STS and LP
principles to identify both social and technical practices that reflect an integrated socio-
technical system. The developed model for lean design includes both social and technical
practices (along with middle management support) and explains how these practices
impact employees’ quality of work life and performance.
Secondly, this study is an answer to the call to research which focuses on
understanding the interaction between operations research and human behavioral research
(Bendoly et.al., 2006; Boudreau et.al., 2003; Manz & Stewart, 1997; Forza, 1996). The
empirical model developed for this study examined the integrated approach to work
design by including the effects of human considerations (i.e. usage of social practices) on
classical operations management results (i.e. employee performance), and operational
201
considerations (i.e. usage of technical practices) on classical human resource
management results (i.e. quality of work life).
Thirdly, while prior research in operations management has operationalized lean
production and described it in terms of its practices (Shah & Ward, 2003; Narasimhan
et.al., 2006), this study is the first to examine technical practices usage as a formative
construct. Shah and Ward (2003) classified the various technical practices into four
bundles (i.e. TPM, TQM, JIT, and HRM), it is clear that the items used to measure those
practices within each bundle do not share a common theme. There is little reason to
believe that all these practices are sampled from a common domain and are
interchangeable. Thus this research uses a measurement approach which presumes that
changes in the indicators cause variation in the construct, rather than the other way round.
The eleven technical practices of standardized work, pull production, continuous flow,
production leveling, cellular manufacturing, total productive maintenance, setup time
reduction, zero defects, visual controls, continuous improvement, and 5-S determine the
construct of technical practice usage. This method of measurement adds to the
understanding of technical practices usage within an organization.
Fourthly, this study demonstrates that middle management support is critical in
the implementation and sustenance of a lean system. Researchers need to measure the
level of middle management support when evaluating the factors that determine the
success of lean implementation.
In more recent years, practitioners’ focus within lean production has been
changing. During the 80’s and 90’s, they sought to implement the tools and practices of

202
lean. Now, they have come to realize that although tools are necessary, they are not
sufficient (Keller, R., 2009). The focus now is all about the “people” who use these tools
and the work practices that help facilitate in the usage of those tools. From a practical
stand point, this study describes specific and identifiable factors that can lead to improved
employee performance and quality of work life. In particular, it provides practitioners
with key ingredients necessary to successfully implement a true lean production system
which incorporates elements of both the social as well as the technical system. The social
system incorporates the middle management support, employee involvement practices,
and the empowerment initiatives. The technical system incorporates the practices used in
lean production (depending on the operational process within that plant).
6.4. Limitations of the study
A major limitation of this study is the use of a single respondent to measure both
independent and dependent variables. Supervisors’ were asked to assess their
organizations’ implementation of work practices based on the STS and LP approaches
(i.e. independent variable), and the same individual was also asked to assess the impact of
these work practices on their employees’ performance and quality of work life (i.e.
dependent variable). This self-reported data is a cause for common method bias. To
counter the effects of using a single respondent in this study, multiple responses from 54
companies were collected, and the analysis of inter-rater agreement revealed that there
was adequate reliability between the respondents (Ketokivi & Schroeder, 2004).
However, the limited sample size did not allow the use of multi-trait multi-method

203
(MTMM) analysis with the data. Hence, it was not possible to evaluate the whole data set
(of 200 responses) for common method bias.
The type of respondent chosen for this study also created a limitation. Since it was
not possible to access shop floor employees to complete the survey, their supervisors
were selected as the key respondents to answer survey questions on behalf of their
employees. According to organizational behavior and psychology literature, supervisors
generally believe that employees are treated more favorably than employees themselves
are actually treated (Lester, Turnley, Bloodgood, & Bolino, 2002). To account for this
limitation, a familiarity scale was developed to test how familiar the respondents (i.e.
supervisors) were with their shop floor employees.
The measures of the different technical practices used in this study (i.e. JIT,
TQM, and TPM bundles) limited our ability to fully understand: 1) how long have
employees been using the individual technical practices, and 2) how often employees use
these practices in their daily work task(s). Future research should assess the length of
time and frequency of technical practices usage in order to better measure this construct.
This study is unable to establish causality for the proposed model. The cross-
sectional survey used in this study does not allow for the examination of the possible
causal direction between quality of work life and performance of employees. Future
research should employ a longitudinal approach to more fully understand the causal
direction and possible reciprocal relationship between these two independent variables.
The insignificant interaction effect found in this study may be attributed to a
phenomenon called as the ceiling effect (Cohen et.al., 2003). Since the study sample

204
consisted of 184 respondents that worked for organizations that had implemented lean
practices and therefore were heavily depended on teams, the variance in the independent
variable (i.e. task interdependence) could not be measured or estimated above a certain
level of dependency.
6.5. Suggestions for future research
This study provides a stepping stone for several fertile areas for future research.
Conduct another cross sectional study with a revised survey to be able to measure
employees changing dispositions to the dimensions of quality of work life (i.e. physical
environment, social context, job satisfaction, job security). This may provide support for
the effect of quality of work life on employee performance. Also include plants that have
not implemented lean so as to test the effect of task interdependence on the relationship
between social practice usage and employee performance.
Next, conduct a multi-national study to test the validity of the model across
different cultures (e.g. India, Taiwan, and the U.S.). Also organizational culture has been
known to have an impact on many quality management initiatives (Zu, 2005). It is
important that we enhance our understanding of the impact of organizational culture (e.g.
Organizational Citizenship Behavior) on the implementation and the execution of the
work practices identified in this study. Future research should focus on how
organizational culture results in improved employee quality of work life and
performance.

205
Also conduct a multi-level case study to determine how this integrated approach
to work design impacts the quality of work life and performance of employees at
different level within an organization (e.g. middle manager, team leader, shop floor
employee).
Finally, investigate how service operations can leverage the usage of social and
technical practices by customers in the co-production of products. As service sectors
progresses towards the concept of mass customization, the usage of social practices and
technical practices will play an important role in impacting the business performance.
Hence researchers should undertake case studies to gain deeper insight into how the
above practices can be used in a co-production environment.

206
APPENDICES

207
APPENDIX A
Items dropped, retained, and added after pilot test
Scales used Hit Rate Middle Management Support My manager spends time with me to explain my job priorities 1.00 My manager provides me with the necessary resources to accomplish my task(s) effectively
0.88
My manager facilitates in the implementation of quality improvements in my department
0.90
My manager provides me with the necessary resources to improve product quality 0.75 My manager supports my efforts to improve my work quality * 0.60 My manager spends time with me to explain the department's goals (objectives) * 0.40 Information Sharing (Top – Down) Information regarding company policies and procedures is shared with my team members
0.88
My team members receive feedback about their work quality 0.86 My team members productivity is shared with them on a regular basis ** 0.86 My team members are alerted when something important occurs in the department **
0.71
Information Sharing (Bottom – Up) My team members report (record) their production quality data in a timely manner * 0.54 My team members share information about product quality issues with each other * 0.62 My team members report their productivity data in a timely manner * 0.65 My team members share information about their work processes with each other in this department **
0.75
My team members share best practices with each other in this department ** 0.76 My team members share their productivity data with each other in this department **
0.75
My team members share their frequency of machine breakdown with each other in this department **
0.75
Reward Practice My team members' pay increases are based on their job performance * 0.65 My team members receive recognition/praise when they help achieve the goals (objectives) set for this department
0.75
My team members are rewarded when they make an extra effort to improve overall performance of this department
1.00
My team members are financially rewarded when they learn additional skills related to their work
0.90
My team members are rewarded with bonuses when the business performs well **
1.00
My team members receive letters or certificate of appreciation when they 0.88

208
perform well ** Training Practice My team members are provided with training in specific job skills needed to do their work
My team members are provided with cross-training to perform other jobs within the department *
0.58
My team members are provided with training to improve their ability to work as a team
0.85
My team members are provided with training in problem solving skills related to their work
0.90
My team members are provided with safety training related to their work * 0.60 My team members are provided with training in quality improvement skills ** 0.88 Perceived Competence My team members demonstrate competence in meeting their job duties 1.00 My team members have the capabilities to meet their job demands 1.00 My team members have the ability to perform their jobs effectively 1.00 My team members are confident that they can do their job well 1.00 My team members are capable of doing their jobs well * 0.60 Perceived Control My team members influence process changes that affect their work 1.00 My team members influence changes in their work methods 1.00 My team members influence decisions about issues that affect their work 1.00 My team members influence their schedule for overtime hours * 0.45 My team members influence the way in which task(s) are completed in their work area **
0.90
My team members have influence over how their work schedule is created * 0.60 My team members influence managerial decisions that affect their work * 0.45 My team members influence the allocation of resources within this department * 0.62 Goal Internalization Working towards the goals (objectives) of this department is important to my team members My team members are inspired by the goals (objectives) of this department 1.00 My team members are willing to help this department achieve its goals (objectives) 1.00 My team members are enthusiastic about working towards the goals (objectives) of this department **
1.00
Achieving this department's goals (objectives) is meaningful to my team members 1.00 Achieving the goals (objectives) of this department is important to my team members * 1.00 Physical context The quality of air, lighting, and noise in my work area is satisfactory 1.00 Eating areas within the plant are clean and hygienic 1.00 Restrooms within the plant are clean and hygienic 1.00 Safety hazards are controlled/eliminated in my department * 0.65 Safety protocols are enforced strictly in this department ** 0.88

209
Workplace safety and health issues are taken seriously in this department * 0.65 Health issues are taken seriously in this department ** 0.88 Social Context My team members are satisfied with the quality of social interaction with their colleagues at work
0.70
My team members can always count on their colleagues for support at work** 0.75 My team members have a good relationship with their colleagues at work 0.88 My team members take an interest in each other’s well-being at work 1.00 My team members are always willing to help each other in this department** 0.90 My team members can talk frankly about their job with my each other at work 1.00 My team members treat each other with respect at work * 0.40 My team members are friendly with each other** 1.00 Job Satisfaction My team members enjoy coming to work everyday 1.00 My team members are satisfied with their job in this department 1.00 My team members enjoy performing the daily activities of their job 1.00 My team members have very few complaints about their job in this department 1.00 Job Security My team members do not worry about losing their job 1.00 My team members have job stability with this organization 1.00 My team members job will not be affected by a recession 1.00 This organization offers full-time employment * 1.00 My team members have job security with this organization ** 0.88 Lay-offs have not affected the jobs of my team members within this organization **
0.86
Task Interdependence My team members rely on one another to get the job done within the department 1.00 Different task(s) are performed sequentially by different team members in this department *
0.50
My team members work in groups to get the job done in this department ** 0.70 My team members need to work together to complete a job effectively 0.75 My team members share their resources (equipments) with each other to complete the job within the department **
0.86
My team members work together to complete a job within this department * 0.59 My team members frequently have to coordinate their efforts with other in the department to complete the job **
1.00
My team members perform different task(s) in a pre-determined order to complete the job *
0.62
Employee Performance My team members' ability to deliver work output on time has improved over the past three years
1.00

210
My employee absenteeism has decreased over the past three years 1.00 My team members' work quality has improved over the past three years 1.00 My team members' overall performance has improved over the past three years 1.00 My team members' dependability in meeting this department's goals (objectives) has improved over the past three years
1.00
My employee turnover rate has decreased over the past three years 1.00 My team members' productivity has improved over the past three years * 1.00 Marker Variable I have wonderful memories about my last vacation 1.00 I will not forget my experiences from my last vacation 1.00 I remember many things about my last vacation 1.00
* Items that were dropped after the pilot test
** Items that were added after the pilot test and used in the final large scale survey

211
APPENDIX B
Sample calculation for Cohen’s K value
Survey Items KEY J1 J2 J3 J4 J5 HIT Hit Rate
1 My employees are provided with cross-training to perform other jobs within the organization 4 4 4 4 4 12 4 80%
2 My employees need to coordinate their job activities with others to complete their jobs 12 12 12 12 12 12 5 100%
3 My employees are competent in their jobs 6 6 6 6 6 4 4 80%
4 My employees have to rely on one another to get the job done 12 12 12 6 12 12 4 80%
5 I have a good relationship with my colleagues at work 9 9 9 9 9 11 4 80%
6 My employees' promotions are based on their job performance 3 3 3 3 3 3 5 100%
7 My employees are provided with training to learn the safety protocols (procedures) related to their work 4 4 4 4 4 4 5 100%
8 Information regarding company policies and procedures are shared with my employees 2 2 2 2 2 2 5 100%
9 My employees receive recognition (praise) based on their job performance 3 3 3 3 3 3 5 100%
10 My employees have a great deal of control in how they do their work 5 5 5 5 6 5 4 80%
11 This organization uses many setup time reduction techniques 13 13 13 13 13 13 5 100%
12 My manager provides me with resources necessary to accomplish my task 1 1 1 1 1 1 5 100%
13 My employees are willing to help this organization achieve its goals 7 7 7 7 7 7 5 100%
14 I do not worry about losing my job 10 10 10 10 10 10 5 100%
15 I enjoy coming to work everyday 11 11 9 11 11 11 4 80%
16 My employees share their process quality data with others in the plant 2 2 2 2 2 2 5 100%
17 This organization uses many quality improvement techniques 13 13 13 13 13 13 5 100%
18 My employees share their product quality data with others in the plant 2 2 2 2 2 2 5 100%
19 My employees are provided with training in problem solving skills related
to their work 4 4 4 4 4 4 5 100%
20 I have job stability with this organization 10 10 10 10 10 10 5 100%

212
Counting Occurrences of Numbers Factors J1 J2 J3 J4 J5 1 1 1 1 1 1
2 3 3 3 3 3
3 2 2 2 2 2
4 3 3 3 3 3
5 1 1 1 0 1
6 1 1 2 2 0
7 1 1 1 1 1
8 0 0 0 0 0
9 1 2 1 1 0
10 2 2 2 2 2
11 1 0 1 1 2
12 2 2 1 2 3
13 2 2 2 2 2
Total Answered J1 J2 J3 J4 J5 20 20 20 20 20
Frequency of Number Chosen Factors J1 J2 J3 J4 J5
1 0.1 0.1 0.1 0.1 0.1
2 0.2 0.2 0.2 0.2 0.2
3 0.1 0.1 0.1 0.1 0.1
4 0.2 0.2 0.2 0.2 0.2
5 0.1 0.1 0.1 0.0 0.1
6 0.1 0.1 0.1 0.1 0.0
7 0.1 0.1 0.1 0.1 0.1
8 0.0 0.0 0.0 0.0 0.0
9 0.1 0.1 0.1 0.1 0.0
10 0.1 0.1 0.1 0.1 0.1
11 0.1 0.0 0.1 0.1 0.1
12 0.1 0.1 0.1 0.1 0.2
13 0.1 0.1 0.1 0.1 0.1
Summed Product of Marginal Probabilities 1&2 1&3 1&4 1&5 2&3 2&4 2&5 3&4 3&5 4&5
0.10 0.10 0.10 0.10 0.10 0.10 0.10 0.10 0.10 0.10

213
Agreement of Judge Pairs 1&2 1&3 1&4 1&5 2&3 2&4 2&5 3&4 3&5 4&5 1 1 1 0 1 1 0 1 0 0
1 1 1 1 1 1 1 1 1 1
1 1 1 0 1 1 0 1 0 0
1 0 1 1 0 1 1 0 0 1
1 1 1 0 1 1 0 1 0 0
1 1 1 1 1 1 1 1 1 1
1 1 1 1 1 1 1 1 1 1
1 1 1 1 1 1 1 1 1 1
1 1 1 1 1 1 1 1 1 1
1 1 0 1 1 0 1 0 1 0
1 1 1 1 1 1 1 1 1 1
1 1 1 1 1 1 1 1 1 1
1 1 1 1 1 1 1 1 1 1
1 1 1 1 1 1 1 1 1 1
0 1 1 1 0 0 0 1 1 1
1 1 1 1 1 1 1 1 1 1
1 1 1 1 1 1 1 1 1 1
1 1 1 1 1 1 1 1 1 1
1 1 1 1 1 1 1 1 1 1
1 1 1 1 1 1 1 1 1 1
Calculations 1&2 1&3 1&4 1&5 2&3 2&4 2&5 3&4 3&5 4&5
Fo = 19 19 19 17 18 18 16 18 16 16
TOT = 20 20 20 20 20 20 20 20 20 20
A = 1.0 1.0 1.0 0.9 0.9 0.9 0.8 0.9 0.8 0.8
Fc = 2.0 2.0 2.0 2.1 2.0 2.0 2.0 2.0 1.9 2.0
K = 0.9 0.9 0.9 0.8 0.9 0.9 0.8 0.9 0.8 0.8
Mean Cohen’s K = 0.9

214
APPENDIX C
Key respondent survey booklet
pg 1
PART – B Survey of Lean Production Practices
Survey Structure This questionnaire evaluates how lean work practices within manufacturing organizations
improves employees’ productivity and their quality of work life. It is designed in an easy to read
format and should take 15-20 minutes of your valuable time.
Target Respondent This questionnaire should be completed by a shop floor supervisor or a team leader associated with manufacturing in an organization. Optional $100 Visa gift card lucky draw If you fully complete and mail in this survey and you provide your contact information, you will be
entered into a $100 Visa gift card drawing. Three winners will be contacted at the end of this study
(September 30th, 2010).
What do you get for completing this survey * An executive summary of the results of this study will be provided to all participants free of
cost, upon request.
* This executive summary can be used to benchmark your plant's use of lean work practices, and their
impact on employees productivity and quality of work life, against other plant’s participating in this
survey.
Confidentiality * Full confidentiality of your responses will be maintained at all times in the study and in any published report.
* This survey is completely voluntary.
* Your survey responses are confidential and will not be shared with your manager. You will mail this survey directly to the researchers in the self-addressed return envelope provided.
If you have any questions about your rights as a research participant, you may contact the Office of
Research Compliance (Clemson University) at 864-656-6460.
If you need to get in touch with the researchers, you may contact Mohammed Raja at 864-508-0161 or
[email protected], and Dr. Lawrence Fredendall at 864-656-2016 or [email protected].

215
pg 2
1. Please select the industry that best represents your major product:
Furniture and related product manufacturing
Apparel manufacturing
Wood product manufacturing Printing and related support activities
Petroleum and coal products manufacturing Plastics and rubber products manufacturing Fabricated metal products manufacturing
Computer and electronic product manufacturing Transportation equipment manufacturing
Electrical equipment/appliance & component manufacturing Textile mills
Leather and allied products
Paper manufacturing Chemical manufacturing Primary metal manufacturing Non-metallic mineral products Machinery manufacturing Food manufacturing Miscellaneous manufacturing
2. Please select the operation process of your major product at your plant:
Job Shop– manufacturing standardized one of a kind of product in low volumes (e.g. Die Casting) Batch Process– manufacturing multiple products in low volumes (e.g. Printing Press) Assembly Line Process– manufacturing multiple products in high volumes (e.g. Automobile Mfg.) Continuous Flow Process– manufacturing highly standardized products in high volume (e.g. Beer Mfg.)
3. Please select how many employees work at your plant:
0-49 50−99 100−149 150−199 200−249 250−299 300-349 350−399 400−449 450−499 500+
4. Please select the job title that best describes your position in the organization:
Production manager Operations manager
Shop floor supervisor Team leader Other (please provide your title): ___________________________________________________

216
pg 3 5. Who do you directly supervise?
Shop floor supervisor
Team leader
Shop floor employees / Machine operators / Associates Other: ___________________________________________________________
6. Has this plant implemented lean production techniques (e.g. 5-S practice, visual control practice, standardized practice, setup time reduction practice, zero defects, cellular manufacturing, etc.)?
Yes No
7. How many years ago did the plant implement lean production techniques?
0-3 4−7 8−11 12−15 16−19 20+
8. How many years ago did this plant open for production?
0-3 4−7 8−11 12−15 16−19 20+
9. How many years have you worked in this organization?
0-2 3−5 6−9 10 +
10. How many years of work experience do you have in manufacturing?
0-2 3−5 6−9 10 +
11.11.11.11. Approximately what percentage of this plant’s employees are represented by a union?
0 25% 50% 75% 100%
12. How many shifts are operated per day at this plant?
1 2 3
13. Have there been layoffs in your department during the past 2 years?
Yes No 14. To ensure that survey responses are matched correctly for data analysis, please provide your manager’s full name:
Last Name: Last Name:
Your survey responses are confidential and will not be shared with your manager. You will mail
this survey directly to the researchers in the self-addressed return envelope provided.

217
pg 4 On a scale of 1-7, please circle the number that best indicates your level of agreement with each statement as it relates to your department.
Rating Scale
Workstations are arranged in a sequence to reduce transportation and delay of materials through the production process
1 2 3 4 5 6 7
The quality of air, lighting, and noise in my work area is satisfactory 1 2 3 4 5 6 7
My team members are satisfied with their job 1 2 3 4 5 6 7
My team members influence the way in which tasks are completed in their work area
1 2 3 4 5 6 7
I remember many things about my last vacation 1 2 3 4 5 6 7
My team members receive regular feedback about their work quality 1 2 3 4 5 6 7
My team members absenteeism has decreased over the past three years 1 2 3 4 5 6 7
My manager facilitates in the implementation of quality improvements in this department
1 2 3 4 5 6 7
My team members’ overall performance has improved over the past three years 1 2 3 4 5 6 7
My team members are provided with training in problem solving skills related to their work
1 2 3 4 5 6 7
My team members can talk frankly about their job with each other at work 1 2 3 4 5 6 7
My team members initiate continuous improvement activities in their work area on a regular basis
1 2 3 4 5 6 7
My team members participate in determining how best to implement management decisions in their work area
1 2 3 4 5 6 7
My team members are rewarded when they learn additional skills related to their work
1 2 3 4 5 6 7
My team members are rewarded when they make an extra effort to improve overall performance of this department
1 2 3 4 5 6 7
My team members have a good relationship with each other at work 1 2 3 4 5 6 7
Working towards the goals (objectives) of this department is important to my team members
1 2 3 4 5 6 7
I have worked with most of my team members for several years now 1 2 3 4 5 6 7
Achieving this department’s goals (objectives) is meaningful to my team members
1 2 3 4 5 6 7
My team members demonstrate competence in meeting their job tasks 1 2 3 4 5 6 7
1 2 3 4 5 6 7 Strongly Disagree Mildly Neither Mildly Agree Strongly Disagree Disagree Agree Agree
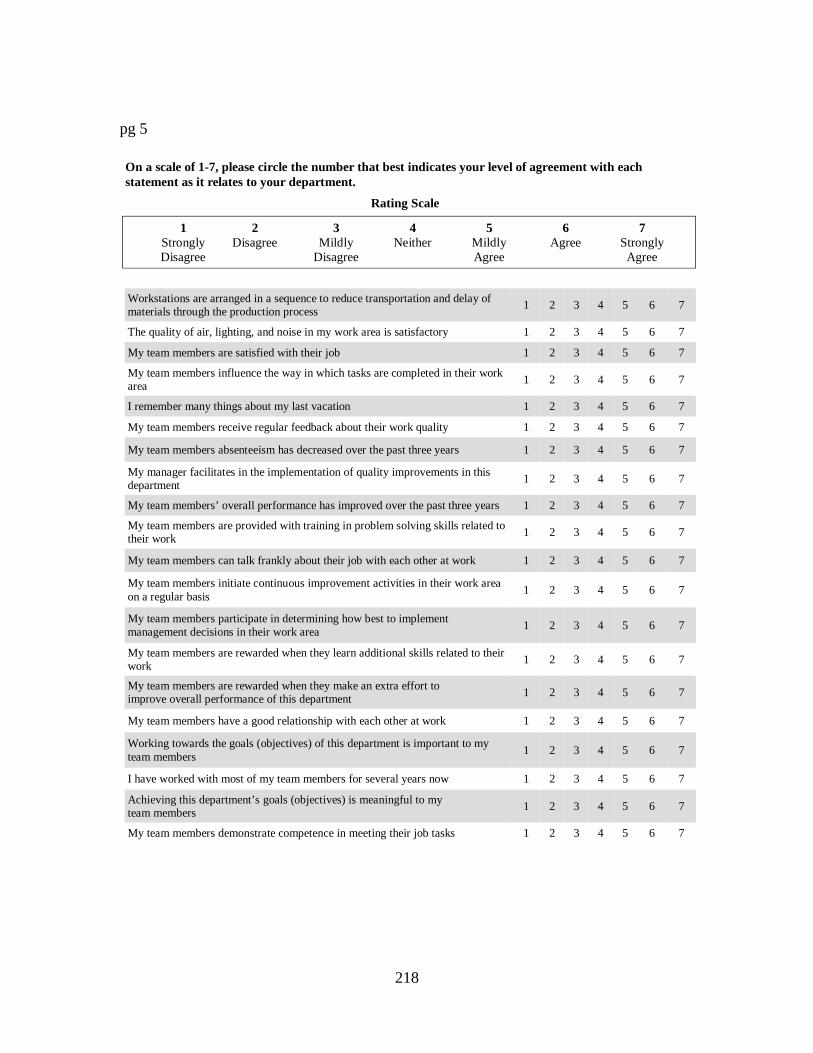
218
pg 5 On a scale of 1-7, please circle the number that best indicates your level of agreement with each statement as it relates to your department.
Rating Scale
Workstations are arranged in a sequence to reduce transportation and delay of materials through the production process
1 2 3 4 5 6 7
The quality of air, lighting, and noise in my work area is satisfactory 1 2 3 4 5 6 7
My team members are satisfied with their job 1 2 3 4 5 6 7
My team members influence the way in which tasks are completed in their work area
1 2 3 4 5 6 7
I remember many things about my last vacation 1 2 3 4 5 6 7
My team members receive regular feedback about their work quality 1 2 3 4 5 6 7
My team members absenteeism has decreased over the past three years 1 2 3 4 5 6 7
My manager facilitates in the implementation of quality improvements in this department
1 2 3 4 5 6 7
My team members’ overall performance has improved over the past three years 1 2 3 4 5 6 7
My team members are provided with training in problem solving skills related to their work
1 2 3 4 5 6 7
My team members can talk frankly about their job with each other at work 1 2 3 4 5 6 7
My team members initiate continuous improvement activities in their work area on a regular basis
1 2 3 4 5 6 7
My team members participate in determining how best to implement management decisions in their work area
1 2 3 4 5 6 7
My team members are rewarded when they learn additional skills related to their work
1 2 3 4 5 6 7
My team members are rewarded when they make an extra effort to improve overall performance of this department
1 2 3 4 5 6 7
My team members have a good relationship with each other at work 1 2 3 4 5 6 7
Working towards the goals (objectives) of this department is important to my team members
1 2 3 4 5 6 7
I have worked with most of my team members for several years now 1 2 3 4 5 6 7
Achieving this department’s goals (objectives) is meaningful to my team members
1 2 3 4 5 6 7
My team members demonstrate competence in meeting their job tasks 1 2 3 4 5 6 7
1 2 3 4 5 6 7 Strongly Disagree Mildly Neither Mildly Agree Strongly Disagree Disagree Agree Agree

219
pg 6 On a scale of 1-7, please circle the number that best indicates your level of agreement with each statement as it relates to your department.
Rating Scale
Safety protocols are enforced to prevent accidents in this department 1 2 3 4 5 6 7
My team members dedicate a portion of each day to equipment inspection / maintenance activities
1 2 3 4 5 6 7
My team members are willing to help this department achieve its goals (objectives)
1 2 3 4 5 6 7
My team members share information regarding best practices with each other in this department
1 2 3 4 5 6 7
My team members participate in the creation of their work schedules 1 2 3 4 5 6 7
My team members are provided with training to perform multiple tasks in this department
1 2 3 4 5 6 7
My team members turnover rate has decreased over the past three years 1 2 3 4 5 6 7
My team members receive recognition / praise when they help achieve the goals (objectives) set for this department
1 2 3 4 5 6 7
I have gotten to know my team members on a personal level over the years 1 2 3 4 5 6 7
My team members move material in small batches through the production process with almost no waiting at work stations
1 2 3 4 5 6 7
My team members share information about their work processes with each other in this department
1 2 3 4 5 6 7
My team member influence process changes that affect their work 1 2 3 4 5 6 7
Health issues are considered when designing / changing the way tasks are ac-complished in this department
1 2 3 4 5 6 7
My team members frequently have to coordinate their efforts with each other to complete their jobs in this department
1 2 3 4 5 6 7
My team members have the capabilities to meet their job demands 1 2 3 4 5 6 7
My team members’ productivity has improved over the past three years 1 2 3 4 5 6 7
My team members receive a letter or a certificate of appreciation when they perform well
1 2 3 4 5 6 7
My team members are kept informed when something important occurs in the department
1 2 3 4 5 6 7
1 2 3 4 5 6 7 Strongly Disagree Mildly Neither Mildly Agree Strongly Disagree Disagree Agree Agree

220
pg 7 On a scale of 1-7, please circle the number that best indicates your level of agreement with each statement as it relates to your department.
Rating Scale
My manager provides me with the necessary resources to accomplish my tasks effectively
1 2 3 4 5 6 7
My team members jobs have not been affected by layoffs in this plant 1 2 3 4 5 6 7
My team members are provided with training in specific job skills needed to do their job
1 2 3 4 5 6 7
My team members develop special toolings (fixtures) to reduce setup times 1 2 3 4 5 6 7
My team members are provided with training in quality improvement skills related to their work area
1 2 3 4 5 6 7
My team members eliminate the root cause of problems when quality defects occur in their work areas
1 2 3 4 5 6 7
My team members work in groups to get the job done in this department 1 2 3 4 5 6 7
My team members enjoy coming to work everyday 1 2 3 4 5 6 7
My team members’ abilities to deliver work output on time has improved over the past three years
1 2 3 4 5 6 7
My team members share their frequency of machine breakdown with each other in this department
1 2 3 4 5 6 7
There is a strong commitment to using lean practices at all levels within this department
1 2 3 4 5 6 7
I am familiar with my team members 1 2 3 4 5 6 7
My team members have job security within this organization 1 2 3 4 5 6 7
Any decisions implemented by my team members have to be approved by me first
1 2 3 4 5 6 7
My team members are inspired by the goals (objectives) of this department
1 2 3 4 5 6 7
My manager spends time with me to explain my job priorities 1 2 3 4 5 6 7
My team members are confident that they can do their job well 1 2 3 4 5 6 7
My team members’ opinion are given importance when managers make work decisions in this department
1 2 3 4 5 6 7
1 2 3 4 5 6 7 Strongly Disagree Mildly Neither Mildly Agree Strongly Disagree Disagree Agree Agree

221
pg 8
On a scale of 1-7, please circle the number that best indicates your level of agreement with each statement as it relates to your department.
Rating Scale
Answer to this question is voluntary: If you want to be eligible for a $100 Visa gift card drawing, please provide your name and e-mail:
Last Name: __________________ First Name: ________________________
E-mail: ____________________________________________________________________________
Three lucky winners will be contacted at the end of this study (September 30, 2010).
Please mail this survey immediately using the self-addressed return envelope provided.
Mailing address: Mohammed Raja 909 Georgetown Street Clemson, SC 29631
My team members’ productivity details are shared with them on a regular basis
1 2 3 4 5 6 7
I will not forget my experiences from my last vacation 1 2 3 4 5 6 7
My team members’ job will not be affected by a recession 1 2 3 4 5 6 7
My team members influence changes in their work methods 1 2 3 4 5 6 7
Information regarding company policies and procedures is shared with my team members
1 2 3 4 5 6 7
My team members enjoy performing their daily job activities 1 2 3 4 5 6 7
My team members’ dependability in meeting this department’s goals (objectives) has improved over the past three years
1 2 3 4 5 6 7
My team members share their tools/equipment with each other to complete their jobs in this department
1 2 3 4 5 6 7
My team members influence decisions about issues that affect their work
1 2 3 4 5 6 7
My team members use well documented standardized operating procedures to complete their tasks
1 2 3 4 5 6 7
My team members work in groups to get the job done in this department
1 2 3 4 5 6 7
1 2 3 4 5 6 7 Strongly Disagree Mildly Neither Mildly Agree Strongly Disagree Disagree Agree Agree
Thank you for completing this survey!

222
APPENDIX D
Correlation analyses for all items
Correlations
MMS ISA ISB T R PCTRL PCOMP GI PHYC SC JSAT JS EPERF
MMS 1.00
ISA 0.50 1.00
ISB 0.41 0.42 1.00
T 0.48 0.59 0.55 1.00
R 0.43 0.49 0.51 0.38 1.00
PCTRL 0.52 0.61 0.61 0.66 0.58 1.00
PCOMP 0.32 0.44 0.55 0.47 0.42 0.53 1.00
GI 0.52 0.52 0.54 0.56 0.54 0.62 0.41 1.00
PHYC 0.32 0.30 0.23 0.35 0.36 0.32 0.27 0.36 1.00
SC 0.43 0.33 0.53 0.39 0.42 0.40 0.35 0.52 0.28 1.00
JSAT 0.37 0.35 0.59 0.48 0.58 0.53 0.39 0.58 0.35 0.51 1.00
JS 0.24 0.17 0.18 0.32 0.28 0.30 0.15 0.23 0.14 0.18 0.35 1.00
EPERF 0.77 0.43 0.43 0.50 0.47 0.54 0.39 0.55 0.40 0.45 0.40 0.24 1.00
MMS TP SP QWL EP
MMS 1.00
TP 0.27 1.00
SP 0.54 0.69 1.00
QWL 0.24 0.54 0.08 1.00
EP 0.74 0.38 0.43 0.30 1.00

223
APPENDIX E
Univariate descriptive statistics
Statistic Std. Error Statistic Std. Error
MMS2 200 1 7.00 5.43 1.32 -1.34 0.17 1.69 0.34
MMS3 200 1 7.00 5.41 1.38 -1.09 0.17 0.87 0.34
MMS4 200 1 7.00 5.44 1.38 -1.27 0.17 1.17 0.34
IS1 200 1 7.42 6.09 0.98 -2.05 0.17 6.58 0.34
IS4 200 1 7.00 5.83 1.25 -1.83 0.17 3.93 0.34
IS5 200 3 7.00 5.52 0.97 -0.68 0.17 0.37 0.34
IS6 200 2 8.15 5.54 1.05 -0.80 0.17 0.83 0.34
R3 200 1 7.00 4.71 1.56 -0.63 0.17 -0.53 0.34
R5 200 1 7.00 4.31 1.57 -0.38 0.17 -0.85 0.34
T1 200 1 7.00 5.59 1.21 -1.45 0.17 2.70 0.34
T4 200 1 7.00 5.15 1.29 -0.89 0.17 0.55 0.34
T5 200 1 7.00 5.33 1.33 -1.18 0.17 1.21 0.34
PCTRL1 200 1 7.00 5.41 1.01 -1.13 0.17 2.34 0.34
PCTRL2 200 1 7.18 5.24 1.10 -1.08 0.17 2.01 0.34
PCTRL3 200 2 7.00 5.54 1.03 -1.04 0.17 1.33 0.34
PCTRL4 200 1 7.68 5.36 1.15 -1.29 0.17 2.34 0.34
PC1 200 3 7.00 5.96 0.77 -0.46 0.17 0.29 0.34
PC2 200 2 7.00 5.96 0.81 -0.72 0.17 1.76 0.34
PC3 200 2 7.52 6.09 0.89 -0.98 0.17 1.70 0.34
GI1 200 2 7.00 5.55 1.09 -0.69 0.17 0.48 0.34
GI2 200 3 7.22 5.48 0.97 -0.27 0.17 -0.30 0.34
GI3 200 1 7.00 5.18 1.16 -0.47 0.17 0.29 0.34
GI4 200 3 7.24 5.80 0.98 -0.45 0.17 -0.49 0.34
TI1 200 2 7.00 5.68 1.13 -1.21 0.17 1.63 0.34
TI2 200 2 7.00 5.83 1.10 -1.20 0.17 1.51 0.34
TI4 200 3 7.32 5.60 1.04 -0.83 0.17 0.53 0.34
PHYC4 200 1 7.00 5.47 1.35 -1.15 0.17 0.78 0.34
PHYC5 200 1 7.00 5.55 1.25 -1.10 0.17 0.92 0.34
SC1 200 3 7.00 5.61 0.92 -0.76 0.17 1.04 0.34
SC4 200 2 7.00 5.74 0.92 -0.88 0.17 1.50 0.34
SC5 200 2 7.00 5.91 0.92 -1.05 0.17 1.80 0.34
JSAT1 200 1 7.00 4.92 1.26 -0.63 0.17 0.20 0.34
JSAT3 200 1 7.00 5.07 1.13 -1.11 0.17 1.76 0.34
JS1 200 1 7.00 4.46 1.67 -0.55 0.17 -0.66 0.34
JS2 200 1 7.00 5.06 1.58 -1.04 0.17 0.53 0.34
JS3 200 1 7.00 5.49 1.34 -1.13 0.17 1.21 0.34
JS4 200 1 7.00 4.36 2.06 -0.22 0.17 -1.40 0.34
JS5 200 1 7.00 3.98 1.84 -0.07 0.17 -1.18 0.34
LP1 200 1 7.00 5.14 1.41 -1.19 0.17 1.29 0.34
LP2 200 1 7.00 5.18 1.43 -1.02 0.17 0.66 0.34
MV1 200 1 7.00 5.97 1.15 -1.50 0.17 3.04 0.34
MV2 200 1 7.00 5.91 1.30 -1.68 0.17 3.34 0.34
MV3 200 1 7.00 5.69 1.34 -1.24 0.17 1.52 0.34
EP1 200 2 7.00 5.59 1.10 -0.79 0.17 0.64 0.34
EP4 200 1 7.00 5.76 1.09 -1.18 0.17 1.97 0.34
EP5 200 2 7.00 5.58 1.00 -1.03 0.17 1.81 0.34
EP6 200 1 7.00 5.56 1.11 -0.93 0.17 1.23 0.34
Skewness Kurtosis
Descriptive Statistics
Std. DeviationMeanMaximumMinimumN

224
REFERENCES
Ahire, S.L., Golhar, D.Y., and Waller, M.A. (1996). Development and validation of TQM implementation, Decision Sciences, 27 (23-56).
Al-Hawari, M., Hartley, N., and Ward, T. (2005). Measuring banks' automated service quality: a confirmatory factor analysis approach. Marketing Bulletin, 16, 1-19.
Allison, P.D. (2003). Missing data techniques for structural Equation Modeling. Journal of Abnormal Psychology, 112 (4), 545-557.
Anderson, J.C., Rungtusanatham, M., and Schroeder, R.G. (1994). A theory of quality management underlying the Deming managament method. Academy of Management Review, 19, 472-509.
Applebaum, E. (1997). The impact of new forms of work organization on workers. Economic Policy Institute.
Armstrong, J.S., and Overton, T.S. (1977). Estimating non response bias in mail surveys. Journal of Marketing research, 14 (3), 396-402.
Ashforth, B. (1989). The experience of powerlessness inorganizations. Organizational Behavior and Human Decisions Processes, 43, 207-242.
Baba, M. and Mejabi. O. (1997). Advances in sociotechnical systems integration: Object oriented simulation modeling for joint optimization of the social and technical subsystem. Human Factors and Ergonomics in Manufacturing, 7 (1), 37-61.
Babson, S. (1993). Lean or Mean: The MIT model and lean production at Mazda. Labor Studies Journal, Summer.
Bacharach, D., Powell, B., Bendoly, E., and Richey, G. (2006). Organizational citizenship behavior and performance evaluations: exploring the impact of task interdependence. Journal of applied psychology, 91 (1), 193-201.
Bacharach, S., and Lawler, E. (1980). Power and politics in organizations. San Francisco, CA: Jossey-Bass.
Backeberg, P. (1995). The effects of level of training on employee perceived empowerment, commitment, and job performance. Unpublished masters thesis, University of Nevada, Las Vegas.

225
Bagozzi, R.P. (1994). Structural equation models in marketing research: basic principles. In Bagozzi, R.P. (Eds), Principles of Marketing Research. Malden, MA: Blackwell, 317-385.
Bagozzi, R.P., and Edwards, E.A. (2000). Goal-striving and the Implementation of Goal Intentions in the Regulation of Body Weight. Psychology and Health, 2000, 15, 255-270.
Bagozzi, R.P., Yi, Y., and Phillips, L.W. (1991). Assessing construct validity in organizational research. Administrative Science Quarterly, 36 (3), 421-458.
Balogen, J. (2003). From blaming the middle to harnessing its potential: Creating change intemediaries. British journal of management, 14, 69-83.
Balogen, J. and Johnson, G. (2004). Organizational restructuring and middle manager sensemaking. Academy of Management Journal, 47, 523-549.
Bamford, D., & Griffin, M. (2008). A case study into operational team-working within a UK hospital. International Journal of Operations and Production Management, 28 (3), 215-237.
Barker, R. (1994). The Design of Lean Manufacturing Systems Using Time-based Analysis. International journal of Operations and Production Management, 14 (11), 86-96.
Barling, J., Kelloway, K., and Iverson, R. (2003). High Quality Work, Job Satisfaction and Occupational Injuries. Journal of Applied Psychology, 88 (2), 276-283.
Barrick, M., Bradley, B., and Colbert, A. (2007). The moderating role of top management team interdependence: implication for real teams and working groups. Academy of Management Journal, 50 (3), 544-557.
Berggren, C. (1994). Nummi vs. Uddevalla. Sloan Management Review, Winter, 37-49.
Berglund, M., and Karltun, J. (2007). Human, Technology and Organizational aspects influencing the production scheduling process. International Journal of Production Economics, 110, 160-174.
Bertalanffy, V. (1950). The theory of open systems in physics and biology. Science, 111 (1), 23-29.
Block, P. (2002). The answer to how is yes: Acting on what matters. San Francisco, CA: Berrett-Koehler.
Bollen, K.A. (1989). Structural equation with latent variables. New York, NY: John Wiley and Sons.

226
Bonavia, T., and Marin, J. (2006). An empirical study of lean production in the ceramic tile industry in Spain. International journal of Operations and Production Management, 26 (5), 505-531.
Boudreau, J., Hopp, W., McClain, J., and Thomas, J. (2003). On the interface between operations and human resource management. Manufacturing and service operations management, 5 (3), 179-202.
Bowen, E., and Lawler, E. (1992). The empowerment of service workers: what , why, how, and when. Sloan Management Review, 31-39.
Brennan, M. (1991). Mismanagement and quality circles: how middle managers influence direct participation. Employee Relations, 13 (5), 22-32.
Briscoe, D. (1980). Organizational Design: Dealing with the Human Constraint. California Management Review, 23 (1), 71-82.
Brown, K. (1996). Work place safety: a call to research. Journal of Operations managemnt, 14, 157-171.
Brown, K., Willis, G., Prussia, G. (2000). Predicting safe employee behavior in the steel industry: development and test of sociotechnical model. Journal of Operations Management, 18, 445-465.
Browning, T., and Heath, R. (2009). Reconceptualizing the effect of lean on production costs with evidence from the F-22 program. Journal of Operations Management, 27 (1), 23-44.
Bruno, R. & Jordon, L. (2002). Lean Production and the Discourse of Dissent. Working USA, 6 (1), 108-134.
Buckley, M.R., Cote, J.A., and Comstock, S.M.(1990). Measurement errors in the behavioral sciences: The case of personality/attitude research. Educational and psychological measurement, 50, 447-474.
Burgelman, R.A. (1983). Corporate enterpreneurship and strategic management: insights from a process study. Management Science, 29 (12), 1349-1364.
Burke, M. J., and Dunlap, W. P. (2002). Estimating interrater agreement with the average deviation index: A user's guide. Organizational Research Methods, 5, 159-172.
Burns, J.M. (1978). Leadership. New York, NY: Harper & Row.
Byrne, B.M. (2006). Structural Equation Modeling with EQS (2nd eds) Mahwah, New Jersey: Lawrence Erlbaum

227
Carayon, P. (2006). Human Factors of complex sociotechnical systems. Applied ergonomics 37, 525-535.
Cherns, A. (1976). The principles of sociotechnical design. Human Relations, 29 (8), 783-792.
Cherns, A. (1987). Principles of sociotechnical design revisted. Human Relations, 40 (3), 153-162.
Cheung, G.W., and Rensvold, R.B. (2002). Evaluating goodness of fit indexes for testing measurement invariance. Structural Equation Modeling, 9 (2), 233-255.
Clegg, C.W. (2000). Sociotechnical prinicples for system design. Applied Ergonomics, 31, 463-477.
Closs, D., Jacobs, M., Swink, M., and Webb, G. (2008). Towards a theory of competencies for the management of product complexity: six case studies. Journal of Operations Management, 26 (X), 590-610.
Cohen, J., Cohen, P., West, S.G., and Aiken, L.S. (2003). Applied multiple regression/ correlation analysis for the behavioral sciences (3 eds). Mahwah, NJ: Lawrence Erlbaum Associates.
Cohen, S., Chang, L., and Ledford, G. (1997). A hierarchical construct of self-management leadership and its relationship to quality of work life and perceived work group effectiveness. Personnel Psychology, 50 (2), 275-308.
Conger, J., and Kanungo, R. (1988). The empowerment process: integrating theory and practice. Academy of Management Review, 13, 471-482.
Conti, R., Angelis, J., Cooper, C., Faragher, B., and Gill, C. (2006). The effects of lean production on worker job stress. International Journal of Operations and Production Management, 25 (9), 1013-1038.
Conti, R., Angelis, J., Cooper, C., Faragher, B., and Gill, C. (2006). The effects of lean production on worker job stress. International Journal of Operations and Production Management, 26(9), 1013-1038.
Cooney, R.(2002). Is lean a universal production system? Batch production in the automotive industry. International Journal of Operations and Production Management, 22 (10), 1130-1147.
Cote, J.A., and Buckley, R.M. (1988). Measurement Error and Theory Testing in Consumer Research: An Illustration of the Importance of Construct Validation. Journal of Consumer Research, 14 , 579-82.

228
Cotton, J., Vollrath, D., Froggatt, K., Hall, M., and Jennings, K. (1988). Employee participation: diverse forms and different outcomes. Academy of Management Review, 13 (1), 8-22.
Cotton, J.L. (1993). Employee Involvement: methods for improving performance and work attitudes. Sage Publications
Coye, R., and Belohav, J. (1995). An exploratory analysis of employee participation. Group and Organization Management, 20 (1), 4-17.
Cummings, T.G. (1978). Self-Regulating Work Groups: A Socio-Technical Synthesis. Academy of Management Review, 3 (3), 625-634.
Cusumano, M. (1985). The Japanese Automobile Industry: Technology Managament at Nissan and Toyota. Cambridge, MA: Harvard University Press.
Dachler, H., and Wilpert, B. (1978). Conceptual dimensions and boundaries of participation in organizations: a critical evaluation. Administrative Science Quarterly, 23 (1), 1-39.
Daniels, K. (2000). Measures of five aspects of affective well being at work. Human Relations, 53 (2), 275-294.
Dankbaar, B. (1997). Lean production: denial, confirmation or extension of sociotechnical systems design? Human Relations, 50 (5), 567-584.
Das, A., Pagell, M., Behm, M., and Veltri, A. (2008). Towards a theory of linkages between safety and quality. Journal of Operations Management, 26, 521-535.
Davis, L.E. (1966). The design of jobs. Industrial Relations, 6 (1), 21-45.
Dean, J., and Bowen, D. (1994). Management theory and total quality: improving research and practice through theory development. Academy of Management Review, 19 (3), 392-418.
Deci, E., Connell, J., and Ryan, R. (1989). Self determination in a work organization. Journal of Applied Psychology, 74 (4), 580-590.
Delbridge, R., Lowe, J., and Oliver, N. (2001). Shopfloor responsibilities under lean teamworking. Human Relations, 53 (11), 1459-1479.
Denison, D. (1990). Corporate culture and organizational effectiveness. New York, NY: Wiley.
Dennis, P. (2007). Lean production simplified, 2nd edition. New York, NY: Productivity Press.

229
DeVellis, R.F. (1991). Scale Development: theory and applications. Applied Social Research Methods Series, Vol. 26. Newbury Park: Sage
Diamantopoulos, A., and Winklhofer, H. (2001). Index construction with formative indicators: an alternative to scale development. Journal of Marketing Research 2001, 38 (2), 269–277.
Dillman, D. (2000). Mail and Internet surveys: the tailored design method. New York, NY: John Wiley and Sons
Dohse. K., Jurgens, U., Malsch, T. (1985). From Fordism to Tootism? The social organization of the labor process in the Japanese automobile industry. Politics and Society, 14 (2), 115-146.
Emery, F. (1959). Characteristics of socio-technical systems. In Emery, F. (ed.), The Emergence of a New Paradigm of Work. 1978, pp. 38–86.
Emery, F.E., and Trist, E.L. (1972 ). Towards a Social Ecology. New York, NY: Plenum Press.
Facteau, J., Dobbins, G., Russell, J., Ladd, R., and Kudisch, J. (1995). The influence of general perceptions of the training environment on pretraining motivation and perceived training transfer. Journal of Management, 21 (1), 1-25.
Feldman, J.M., and Lynch J.G Jr. (1988). Self-generated validity and other effects of measurement on belief, attitude, intention and behavior. Journal of Applied Psychology, 73, 421-435.
Finch, B., and Cox, J. (1986). An examination of just-in-time management for the small manufacturer: with an illustration. International Journal of Production Research, 24 (2), 329-342.
Fisher,K. (1986). Management roles in the implementation of participative management systems. Human Resources Management, 25 (3), 459-480.
Floyd, S., and Wooldridge, B. (1992). Middle management involvement in strategy and its associaton with strategic type: a research note. Strategic Management Journal, 13, 153-167.
Flynn, B.B., Schroeder, R.G., and Sakakibara, S. (1994). A framework for quality management research and an associated measurement instrument. Journal of Operations Management, 11, 339-366.

230
Fornell, C., and Bookstein, F. (1982). Two Structural Equation Models: LISREL and PLS applied to consumer exit-voice theory. Journal of Marketing Research, 19, 440-452.
Fornell, C., and Larker, D. (1981). Evaluating structural equation models with unobservable variables and measurement errors. Journal of Marketing Research, 18 (1), 39-50.
Forza, C. (1996). Work organization in lean production and traditional plants, what are the differences? International journal of operations and production management, 16 (2), 42-62.
Frey, R. (1993). Empowerment or else. Harvard Business Review, 71, 80-94.
Gefen, D. (2000). E-Commerce: the role of familiarity and trust. Omega 28,725-737.
Gerbing, D.W., and Anderson, J.C. (1988). An updated paradigm for scale development incorporating unidimensionality and its assessment. Journal of Marketing research, 25, 186-192.
Gist, M. (1987). Self efficacy: implications for organizational behavior and human resources management. Academy of Management Review, 12 (3), 472-485.
Glew, D., O'Leary, A., Griffin, R., and Fleet, D. (1995). Participation in Organizations: A preview of the issues and proposed framework for future analysis. Journal of Management, 21 (3), 395-421.
Guzzo, R., Jette, R., and Katzell, R. (1985). The effects of psychologically based intervention programs on worker productivity: meta analysis. Personnel Psychology, 38, 275-291.
Hair, J., Anderson, R., Tatham, R., and Black, W. (1995). Multivariate data analysis with readings, 4th eds. Upper Saddle River, NJ: Prentice-Hall International.
Hanna, M., Newman, W., and Johnson, P. (2000). International Journal of Operations and Production Management, 20 (2), 148-165.
Harmon, H.H. (1976). Modern Factor Analysis (3rd eds). Chicago, University of Chiacago Process .
Hayes, R. H., and Wheelwright, S. C. (1979). Link manufacturing process and product life cycles. Harvard Business Review, (January-February), 133-140.
Hill, A. (2010). The Encyclopedia of operations management. Eden Prairie, MN: Clamshell beach press.

231
Holweg, M. (2007). The genealogy of lean production. Journal of Operations Management, 25 (2), 420-437.
Hopp, W. and Spearman, M. (2004). ToPull or Not to Pull: What is the Question? Manufacturing and Service Operations Management, 6 (2), 133-148.
Howell, R., Breivik, E., and Wilcox, J. (2007). Reconsidering Formative Measurement. Psychological Methods, 12 (2), 205-218.
Hrebiniak, L. (1984). Implementing Strategy, Macmillan, New York.
Hu, L., and Bentler, P.M. (1999). Cutoff criteria for fit indexes in covariance structure analysis: conventional criteria versus new alternatives. Structural Equation Modeling: A Multidisciplinary Journal, 6, 1–55.
Huber, V.L., and Brown, K. (1991). Human resource issues in cellular manufacturing: A sociotechnical analysis. Journal of Operations Management, 10 (2), 138-159.
Hupp, T., and Polak, C. (1995). Designing work groups, jobs and work flow. San Francisco, CA: Jossey-Bass
Huse and Cummings (1985). Organization development and change. Western Publishing Company.
Hut, and Molleman (1998). Empowerment and team development. Team Performance Management Journal, 4, 53-66.
Huy, Q. In praise of middle manager. (2001). Harvard Business Review, 79 (8), 72-79.
Hyer, N., Brown, K., and Zimmerman, S. (1999). A sociotechnical systems approach to cell design: case study and analysis. 17, 179-203.
James, L., Demaree, R., and Wolf, G. (1993). An assessment of within group inter rater agreement. Journal of Applied Psychology, 78, 306-309.
Jarvis, C.B., Mackenzie, S.B., and Podsakoff, P.M. (2003). A critical review of construct indicators and measurement model misspecification in marketing and consumer research. Journal of consumer research, 30 (2), 199-218.
Jones, O. (2000). Scientific Management, Culture and Control: A first hand account of Taylorism in Practice. Human Relations, 53 (5), 631-653.
Karlsson, C., and Ahlstrom, P. (1996). Assessing change towards lean production. International Journal of Operations and Production Management, 16 (2), 24-41.

232
Katayama, H., and Bennett, D. (1996). Lean production in a changing competitive world: a Japanese perspective. International Journal of Operations and Production Management, 16 (2), 8-23.
Kaufman, B. (2003). High level employee involvement at Delta airlines. Human Resource Management, 42 (2), 175-190.
Kerce, E. W., and Kewley, S.B. (1993). Quality of work life surveys in organizations: Methods and benefits. In Sage Focus (eds.). Improving Organizational Surveys: New Directions, Methods, and Applications. Thousand Oaks, CA: Sage Publications,188–209.
Kiggundu, M. (1983). Task interdependence and job design. Organizational behavior and human performance, 31, 145-172.
King, W., Fowler, S., and Zeithaml, C. (2001). Managing organizational competencies for competitive advantage: The middle management edge. Academy of Management Executive, 15 (2), 95-106.
Kirkman, B.L., and Rosen, B. (1999). Beyond self management: antecedents and consequences of team empowerment. Academy of Management Journal, 42, 58-74.
Klagge, J. (1998). The empowerment squeeze-views from the middle management position. Journal of Management development 17 (8).
Klein, J.A. (1994). The human cost of manufacturing reform. Harvard Business Review, 67 (2), 60-66.
Kohl, M., and Schooler, C. (1982). Job Conditions and Personality: A longitudinal assessment of their reciprocal effects. Americal Journal of Sociology, 87 (6), 1257-1286.
Kotter, J. (1979). Power in management. New York, NY: Amacon.
Koufterous, X., Vonderembse, M., and Doll, W. (1998). Developing measures of time based manufacturing. Journal of Operations Management, 16 (X), 21-41.
Kouzes, J., and Posner, B. (1987). The leadership challenge. San Francisco, CA: Jossey-Bass.
Kozlowski, S., and Bell, S. (2003). Work groups and teams in organizations. In Borman, W., Iigen, D., and Klimoski, R. (Eds), Handbook of psychology: Industrial and organizational psychology, 12, 333-375, London: Wiley.

233
Krafcik, J. (1986). Learning from NUMMI. IMVP Working Paper. Massachusetts Institute of Technology, Cambridge, MA
Krafcik, J. (1988). Triumph of the lean production system. Sloan Management Review, 30 (1), 41-52.
Kraut, A., Pedigo, P., McKenna, D., and Dunnette, M. (1989). Academy of Management 3 (4), 286-293.
Kuipers, B., Witte, M., and Zwaan, A. (2004). Design or development? Beyond the LP-STS debate; inputs from a volvo truck case. International Journal of Operations and Production Management, 24 (8), 840-854.
Kuo-Wei, L. (2005). Managerial Thinking in the 21st Century. Journal of American Academy of Business, 6 (1), 195-199.
Langfred, C. (2005). Autonomy and performance in teams: the multilevel moderating effect of task interdependence. Journal of Management, 31 (4), 513-529.
Lau, R., and May, B. (1998). A Win-Win Paradigm for Quality of Work Life and Business Performance. Human Resource Development Quarterly, 9 (3).
Lawler, E. (1982). Strategies for improving the quality of work life. American Psychologist, 37, 486-493.
Lawler, E. (1986). High involvement management. San Francisco, CA: Jossey-Bass.
Lawler, E. (1991). High involvement management. John Wiley & Sons Inc.
Lawler, E., Mohrman, S., and Ledford, G. (1992). Employee involvement and total quality management. San Francisco, CA: Jossey-Bass.
Lawler. E., Mohrman, S., and Ledford, G. (1995). Creating high performance organizations. San Francisco, CA: Jossey-Bass.
Leana, C., Locke, E.A., Schweiger, D. (1990). Fact and fiction in analyzing research on participative decision making: a critique of Cotton, Vollrath, Froggatt, Hall, and Jennings. Academy of Management Review, 15 (1), 137-146.
Lee, S., and Ebrahimpour, M. (1984). Just-in-Time production system: some requirements for implementation. International Journal of Operations and Production Management, 4 (4), 3-15.
Levine, M. (1983). Self developed QWL measures. Journal of Occupational Behavior, 4 (1), 35-46.

234
Lewchuk, W., Stewart, P., and Yates, C. (2001). Quality of working life in the automobile industry: a Canada-UK comparitive study. New Technology, Work and Employment, 16 (2), 72-87.
Li, S., Rao, S., Ragu-Nathan, T., and Ragu-Nathan, B. (2005). Development and validation of a measurement instrument for studying supply chain management practices. Journal of Operations Management, 23, 618-641.
Liker, J. (2004). The Toyota Way: 14 Management Principles from the World's Greatest Manufacturer. New York, NY: McGraw Hill.
Likert, R. (1961). New Patterns of Management. New York, NY: Mcgraw-Hill.
Lindell, M., and Whitney, D. (2001). Accounting for common method variance in cross sectional research designs. Journal of applied Psychology, 86 (1), 114-121.
Linden, R.C., Wayne, S.J., and Sparrowe, R. (2000). An examination of the mediating role of psychological empowerment on the relationships between job, interpersonal relationships, and the work outcomes. Journal of Applied Psychology, 85, 407-416.
Lippitt, G.L. (1978). Quality of Work Life: Organization renewal in action. Training and development journal, 32 (7), 4-7.
Little, R, J., and Rubin, D.A. (1987). Statistical Analysis with missing data. New York, NY: John Wiley and Sons
Liu, G., Shah, R., Schroeder, R. (2006). Linking work design to mass customization: a sociotechnical systems perspective. Decision Sciences, 37 (4), 519-545.
Locke, E.A., and Schweiger, R.A. (1979). Participation in decision making: one more look. Research in organizational behavior, 1, 265-339.
Loscocco, K. A., and Roschelle, A.R. (1991). Influences on the quality of work and nonwork life: two decades in review. Journal of Vocational Behavior, 39, 182–225.
MacCullum, R.C., and Browne, M.W. (1993). The use of casual indicators in covariance structure models: Some practical issues. Psychological Bulletin, 114 (3), 533-541.
Malhotra, M., and Grover, V. (1998). An assessment of survey research in POM: from constructs to theory. Journal of Operations Management, 16, 407-425.
Manz, C. and Stewart, G. (1997). Attaining flexibile stability by integrating total quality management and socio-technical systems theory. Organization Science, 8 (1), 59-70.

235
Mardia, K.V. (1970). Measures of multivariate skewness and kurtosis with applications. Biometrika, 57 (3), 519-530.
Marshall, A., and Stohl, C. (1993). Participating as participation. Communication Monographs, 60, 137-157
Martel, J.P., and Dupuis, G. (2006). Quality of work life: theoretical and methodological problems, and presentation of a new model and measuring instrument. Social Indicators Research, 77, 333-368.
McClelland, D.C. (1975). Power: The inner experience. New York, NY: Irvington Press.
McGrath, J. E., Arrow, H., and Berdahl, J. L. (2000). The study of groups: Past, present and future. Personality and Social Psychology Review, 4, 95–105.
McLachlin, R. (1997). Management initiatives and just-in-time manufacturing. Journal of Operations Management, 15, 271-292
Menon, S. (2001). Employee Empowerment: an integrative psychological approach. Applied Psychology: An international Review, 50 (1), 153-180.
Menor, L., and Roth, A. (2006).
Miller, K., and Monge, P. (1986). Participation, satisfaction, and productivity: a meta analytic review. Academy of Management Journal, 29 (4), 727-753.
Mills, P., and Ungson, G. (2003). Reassessing the limits of structural empowerment: organizational constitution and trust as controls. Academy of Management Review, 28 (1), 143-153.
Mintzberg, H. (1973). The nature of managerial work. New York, NY: Harper and Row.
Mintzberg, H., Lampel, J., Quinn, J., and Ghoshal, S. (2003). The strategy process: concepts, contexts, cases. Upper Saddle River, NJ: Prentice Hall.
Mitchell, T. (1973). Motivation and participation: an integration. Academy of Management Journal, 16 (4), 670-679.
Mitchell, T., and Silver, W. (1990). Individual and group goals when workers are interdependent: effects on task strategy and performance. Journal of Applied Psychology, 75, 185-193.
Mohrman, S., Lawler, E., and Ledford, G. (1996). Do employee involvement and TQM programs work? Journal for quality and participation, 1 (1), 6-10.

236
Monden, Y. (1983). Toyota Production Systems. Norcross, GA: Industrial engineering and management press.
Monden, Y. (1993). Toyota Management System. Portland, OR: Productivity Press.
Moore, G. C., and Benbasat, I. (1991). Development of an instrument to measure the perceptions of adopting an information technology innovation. Information Systems Research, 2 (3), 173-191.
Motowidlo, S., Borman, W., Schmit, M. (1997). A theory of individual differences in Task and Contextual Performance. Human Performance, 10 (2), 71-83.
Mumford, E. (2006). The Story of Socio-technical design: reflections on its succesess, failures and potential. Information Systems Journal, 16, 317-342.
Nadler, D., and Lawler, E. (1983). Quality of work life: perspectives and directions. Organizational dynamics, Winter, 20-30.
Narasimhan, R., Swink, M., and Kim, S.W. (2006). Disentangling leanness and agility: An empirical investigation. Journal of Operations Management, 24, 440-457.
Niepce, W. and Molleman, E. (1998). Work design issues in lean production from a sociotechnical systems perspective: Neo Taylorism or the next step in sociotechnical design? Human Relations 51, 259-287.
Nunnally, J.C. (1978). Psychometric theory, 2nd eds. New York, NY: McGraw-Hill.
Nunnally, J.C., and Bernstein, I.H. (1994). Psychometric theory, 3rd eds. New York, NY: Mcgraw-Hill
O'Creevy, M. Employee involvement and the middle manager: evidence from a survey of organizations. Journal of Organizational Behavior, 19 (1), 67-84.
Ohno, T. (1988). Toyota Production System: Beyond Large Scale Production. Cambridge, MA: Productivity Press.
Oshry, B. (1999). Leading systems: Lessons from the power lab. San Francisco, CA: Berrett-Koehler.
Osterman, P. (1995). Skill, Training, and Work Organization in American Establishments. Industrial Relations, 34 (2), 125-146.
O'Toole, J. (1995). Leading change : overcoming the ideology of comfort and the tyranny of custom. San Francisco, CA : Jossey-Bass Publishers

237
Page, N.R., and Wiseman, R.L. (1993). Supervisory behavior and worker satisfaction in the United States, Mexico and Spain. Journal of Business Communications, 30 (2), 161-180.
Panizzolo, R. (1998). Applying the Lessons learned from 27 lean manufacturers, The relevance of relationship management. International Journal of Production Economics, 55, 223-240.
Pappas, J., Flaherty, K., and Wooldridge, B. (2003). Achieving strategic consensus in the hospital setting: A middle management perspective. Hospital Topics: Research and perspective on healthcare, 81 (1), 15-22.
Parker, S. (2003). Longitudinal effects of lean production on employee outcomes and the mediating role of work characteristics. Journal of applied psychology, 88 (4), 620-634.
Pasmore, W. A. (1988). Designing effective organizations: The sociotechnical systems perspective. New York, NY: Wiley.
Pegels, C. (1984). The Toyota Production System - Lessons for American management. International Journal of Operations and Production Management, 4 (1), 3-11.
Pfeffer, J. (1981). Power in organizations. Marshfield, MA: Pitman.
Phusavat, K., Anussornnitisarn, P., Rassameethes, B., and Kess, P. (2009). Productivity improvement: impacts from quality of work life. International Journal of Management and Enterprise Development, 6 (4), 456-478.
Pine II and Gilmore (1998). “Welcome to the experience economy”, Harvard Business Review, Vol. 76, July-August, pp. 97-105.
Podsakoff, P., Ahearne, M., and MacKenzie, S.B. (1997). Organizational citizenship behavior and the quantity and quality of work performance. Journal of Applied Psychology, 82 (2), 262-270.
Podsakoff, P.M., Mackenzie, S.B., Lee, J.Y., and Podsakoff, N.P. (2003). Common method biases in behavioral research: a critical review of the literature and recommended remedies. Journal of applied psychology, 88 (5), 879-903.
Powell, T.C. (1995). Total Quality Management as competitive advantage: A review and empirical study. Strategic Management Journal, 16 (1), 15-37.
Psoinos, A., and Smithson, S. (2002). Employee empowerment in manufacturing: a study of organizations in the UK. New Technology, Work and Employment, 17 (2), 132-148.

238
Pun, K., Chin, K., and Gill, R. (2001). Determinants of employee involvement practices in manufacturing enterprises. Total Quality Management, 12 (1), 95-109.
Ramus, C., and Steger, U. (2000). The roles of supervisory support behaviors and environmental policy in employee ecoinitiatives at leading edge european companies. Academy of Management Journal, 43 (4), 605-626.
Randolph, W. (1995). Navigating the journey to empowerment. Organizational Dynamics, 23 (4), 19-32.
Rethinam, G., and Ismail, M. (2008). Constructs of quality of work life: a perspective of information and technology professionals. European Journal of Social Sciences, 7 (1), 58-70.
Riordan, C., Vandenberg, R., and Richardson, H. (2005). Employee involvement climate and organizational effectiveness. Human Resource Management, 44 (4), 471-488.
Rogelberg, S.G., and Stanton, J.M. (2007). Understanding and dealing with organizational survey non response. Organizational research methods, 10 (2), 195-209.
Rother, M., and Shook, J. (1999). Learning to See: Value Stream Mapping to add value and eliminate muda. Brookline, MA: Lean Enterprise Institute, Inc.
Rue, L.W., and Byars, L.L. (2003). Management: Skills and application (10th eds). New York, NY: McGraw-Hill.
Saavedra, R., Earley, C., and Dyne, V.L. (1993). Complex interdepence in task performing groups. Journal of applied psychology, 78 (1), 61-72.
Sakakibara, S., Flynn, B., Schroeder, R., and Morris, W. (1997). The impact of just-in-time manufacturing and its infrastructure on manufacturing performance. Management Science, 43 (9), 1997.
Sanchez,M., and Perez, M. (2001). Lean indicators and manufacturing strategies. International Journal of Operations and Production Management, 21 (11), 1433-1451.
Satorra, A.C., and Bentler, P.M. (1988). Scaling corrections for Chi-square statistics in covariance structure analysis. Proceedings of the business and economics sections, Alexandria, VA: American statistical association.
Schonberger, R.J. (1986). World Class Manufacturing: The lessons of simplicity applied. New York, NY: Free Press.

239
Schumacker, R.E., and Lomax, R.G. (2004). A beginners guide to structural equation modeling. Mahwah, NJ: Lawrence Erlbaum.
Seibert, S., Silver, S., and Randolph, W. (2004). Taking empowerment to the next level: a multiple level model of empowerment, performance, and satisfaction. Academy of Management Journal, 47 (3), 332-349.
Senge, P. (1990). The fifth discipline: the art and practice of the learning organization. New York, NY: Currency Doubleday
Shadur, M., Kienzle, R., and Rodwell, J. (1999). The relationship between organizational climate and employee perceptions of involvement: the importance of support. Group organization management, 24 (4), 479-503.
Shah, R. & Ward, P. (2003). Lean Manufacturing: Context, practice bundles, and performance. Journal of Operations Management, 21, 129-149.
Shah, R. & Ward, P. (2007). Defining and developing measures of lean production. Journal of Operations Management, 25, 785-805.
Shah, R., and Goldstein, S.M. (2006). Use of Structural Equation Modeling in Operations Management Research: Looking back and Forward. Journal of Operations Management, 24 (1), 148-169.
Shani, A.B., Grant, R., Krishnan, R., and Thompson, E. (1992). Advanced Manufacturing Systems and Organizational Choice: Sociotechnical Systems Approach. California Management Review, 34 (4), 91-111.
Shingo, S. (1983). A revolution in manufacturing: the SMED system. Japanese Management Association, Japan
Shingo, S. (1992). The Shingo Production Management System. Cambridge, MA: Productivity Press.
Sigler, T., and Pearson, C. (2000). Creating an empowering culture: examining the relationship between organizational culture and perceptions of empowerment. Journal of Quality Management, 5 (1), 27-52.
Sirgy, J., Efraty, D., Siegel, P., and Lee, D. (2001). A new measure of quality of work life (QWL) based on need satisfaction and spillover theories. Social Indicators Research, 55, 241-302.
Smith, M., and Carayon, P. (1995). New technology, automation, and work organization: stress problems and improved technology implementation. International Journal of Human Factors Manufacturing, 5 (1), 99-116.

240
Sohal, A. (1996). Developing a lean production organization: an Australian case study. International Journal of Operations and Production Management, 16 (2), 91-102.
Sohal, A., and Egglestone (1994). Lean production: Experience among australian organization. International Journal of Operations and Production Management, 14 (11),35-51.
Somech, A., Desivilya, H., and Lidogoster, H. (2009). Team conflict management and team effectiveness: effects of task interdependence and team identification. Journal of Oprganizational Behavior, 30, 359-378.
Spear, S. (2004). Learning to lead at Toyota. Harvard Business Review, May, 78-86.
Spear, S. and Bowen, K. (1999). Decoding the DNA of the Toyota Production System. Harvard Business Review, September-October.
Spreitzer, G. (1995). Psychological Empowerment in the workplace: dimensions, measurement, and validation. Academy of Management Journal, 38 (5), 1442-1465.
Staw, B., Bell, N., and Clausen, J. (1986). The dispositional approach to job attitudes: a lifetime longitudinal test. Administrative Science Quarterly, 31 (1), 56-77.
Stewart, D., and Grout, J. (2001). The human side of mistake proofing. Production and Operations Management Journal, 10 (4), 440-459.
Sugimori, Y., Kusonoki, K., Cho, F., and Uchikawa, S. (1977). Toyota Production System and Kanban system, materialization of JIT and respect for human system. International Journal of Production Research, 15 (6), 553-564.
Sumukadas, N. (2005). Employee involvement: a hierarchical conceptualization of its effect on quality. International Journal of Quality and Reliability Management, 23 (2), 143-161.
Suzaki, K. (1985). Japanese manufacturing techniques: their importance to U.S. manufacturers. Journal of Business Strategy, 10 - 19.
Taylor, F.W. (1911). The principles of scientific management. New York, NY: Harper & Row.
Taylor, F.W. (1947). Shop Management and Principles of Scientific Management. New York, NY: Harper and Row.
Taylor, J. and Asadorian, R. (1985). The implementation of excellence: STS Management. Industrial Management 27 (4), 5-15.

241
Taylor, J. and Felten, D. (1993). Performance by design: sociotechnical systems in north america. Englewood Cliffs, NJ: Prentice Hall.
Thomas, K., and Velthouse, B. (1990). Cognitive elements of empowerment: an interpretive model of intrinsic task motivation. Academy of Management Review, 15, 666-681.
Thompson, J. (1967). Organizations in action. New York, NY: McGraw-Hill.
Treville, S., and Antonakis, J. (2006). Could lean production job design be intrinsically motivating? Contexual, configural, level of analysis issues. Journal of Operations Management, 24 , 99-123.
Trist, E. (1981). The evolution of sociotechnical systems: A conceptual framework and a action research program. Summer.
Trist, E. and Bamforth, K. (1951). Some social and psychological consequences of the longwall method of coal mining. Human Relations, 4(1), 3-38.
Valentino, C.L., and Brunell, F. (2004). The role of middle managers in the transmission and integration of organizational culture. Journal of Healthcare Management, 49 (6), 393-404.
Vallario, M. (1997). Work life programs. Compensation and Benefits Management, 13 (3), 25-30.
Vandenberg, R., Richardson, H., and Eastman, L. (1999). The impact of high involvement work processes on organizational effectiveness: a second order latent variable approach. Group Organization Management, 24 (3), 300-339.
Voss, C., and Robinson, S. (1987). Application of Just-in-Time manufacturing techniques in the United Kingdom. International Journal of Operations and Production Management, 7 (4), 46-52.
Wageman, R. (1995). Interdependence and group effectiveness. Administrative science quarterly, 40 (1), 145-180.
Wageman, R. , and Baker, G. (1997). Incentives and cooperation: the joint effects of task and reward interdependence on group performance. Journal of Organizational behavior, 18, 139-158.
Wagner, J., and Gooding, R. (1987). Shared influence and organizational behavior: a meta analysis of situational variables expected to moderate participation-outcome relationships. Academy of Management Journal, 30 (3), 524-541.

242
Walker, G., Stanton, N., Salmon, P. Jenkins, D. (2008). A review of sociotechnical systems theory: a classic concept for new command and control paradigms. Theoretical issues in ergonomics science, 9 (6), 479-499.
Waterson, P., Gray, M, and Clegg, C. (2002). A Sociotechnical Method for Designing Work Systems. Human Factors, 44(3), 376-391.
Westley, F. (1990). Middle managers in strategy: microdynamics of inclusion. Strategic management journal, 11 (5), 337-351.
White , R., Pearson, J., and Wilson, J. (1999). JIT Manufacturing: a survey of implementations in small and large U.S. manufacturers. Management Science, 45 (1), 1-15.
White R. (1959). Motivation reconsidered: the concept of competence. Psychological Review, 66 (5), 297-333.
William, L.J., and Brown, B.K. (1994). Method variance in organizational behavior and human resources research: effect on correlation, path coefficients, and hypothesis testing. Organizational behavior and Human Decision Processes, 57, 185-209.
Wilmont, W., and Hocker, J.L. (2001). Interpersonal conflict. New York, NY: McGraw-Hill.
Wilson, J. (2000). Fundamentals of ergonomics in theory and practice. Applied ergonomics, 31 (6), 557-567
Womack, J. and Jones, D. (1996). Lean Thinking. Free Press.
Womack, J., Jones, D., and Roos, D. (1990). The Machine That Changed the World : The Story of Lean Production. New York, NY: Rawson Associates.
Wood, R., and Bandura, A. (1989). Social cognitive theory of organizational management. Academy of Management Review, 14 (3), 361-384.
Related Documents