Lean Leadership for Healthcare Ron Bercaw President and Sensei October 10, 2014 1 THIS IS COMMERCIAL MATERIAL THAT HAS BEEN DEVELOPED AT PRIVATE EXPENSE. THE USE, MODIFICATION, REPRODUCTION, RELEASE, DISPLAY AND DISCLOSURE OF THIS COMMERCIAL MATERIAL SHALL BE IN STRICT ACCORDANCE WITH STANDARD LICENSE TERMS. UNPUBLISHED -- RIGHTS RESERVED UNDER THE COPYRIGHT LAWS OF THE UNITED STATES

Welcome message from author
This document is posted to help you gain knowledge. Please leave a comment to let me know what you think about it! Share it to your friends and learn new things together.
Transcript

Lean Leadership for Healthcare
Ron Bercaw
President and Sensei
October 10, 2014
1
THIS IS COMMERCIAL MATERIAL THAT HAS BEEN DEVELOPED AT PRIVATE EXPENSE. THE USE,
MODIFICATION, REPRODUCTION, RELEASE, DISPLAY AND DISCLOSURE OF THIS COMMERCIAL
MATERIAL SHALL BE IN STRICT ACCORDANCE WITH STANDARD LICENSE TERMS. UNPUBLISHED --
RIGHTS RESERVED UNDER THE COPYRIGHT LAWS OF THE UNITED STATES
Putting the subject into context
2
How to “do” Lean
in healthcare
How to “lead” Lean
in healthcare

Agenda
• Linking Improvement to Corporate Strategy
• The Improvement Roadmap
• Getting Ready
• Accelerate Improvement• Accelerate Improvement
• Sustain Improvement
• Leadership Behaviors to Ensure Success
• Mitigating Risk
3

I. Linking Improvement to Corporate Strategy
• Why is this Essential?
• Key Steps in Linking Improvement
to Strategy
• Establish the Vision
• Select True North Measures• Select True North Measures
• Establish Improvement Priorities
• Implement Improvement Priorities
• Review Process and Results
4

The Importance of Linking
Improvement to StrategyIt is very difficult to impossible to improve all areas of an organization simultaneously.
Begin improvement in the areas that best enable you to meet your key strategic outcome
measures.
Each team requires time and attention from your leadership, staff and medical staff.
Focus on the high leverage areas to maximize your return on your investment.
5
The effort to change a process with minimal return is the same as the effort to change a
process with a large return. Allow your middle/line management and medical leadership
to focus on the areas of highest return.
Change takes time. Do not waste precious days, weeks, and months on areas not directly
aligned to your strategy.
All staff and medical staff should be able to immediately see the correlation between
improvement and attaining your strategy. This gives the team a sense of purpose and
shows them how they fit into the big pig picture.

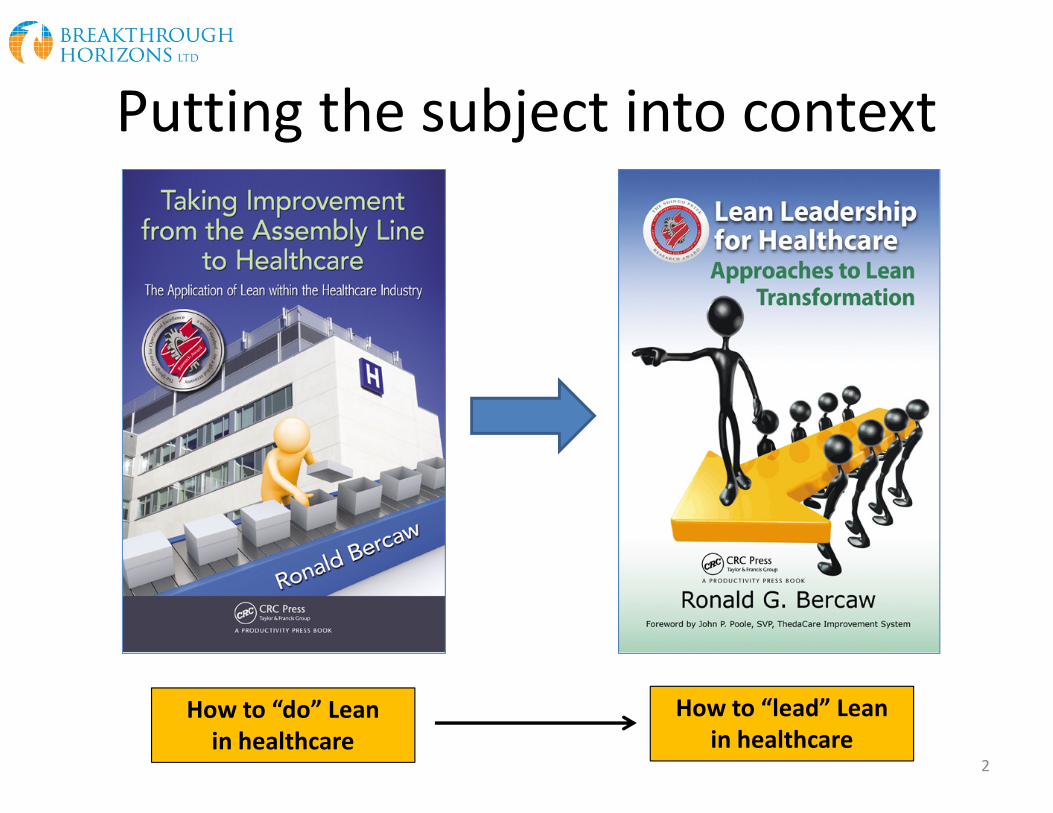
Step 1: Establish the Vision
Use the voice of the customer to set your organizational
vision
• Measure performance as aligned to how your customer
measures performance
• Develop and deploy targets that deliver value to your Develop and deploy targets that deliver value to your
customer
6
What Does Your Customer Expect?
7

Step 2: Establish True North MeasuresTrue North Category True North Measure Definition True North Measure in Healthcare
People Staff Morale or Staff
Engagement
Staff and Medical Staff Morale or
Engagement
Quality Defects Per Unit of Service or
Process Outcomes Related to
Meeting the Customer’s
Requirements
Service Quality – Patient and Family
Satisfaction
Outcome Quality – Measures of
Clinical Outcomes, and Patient Safety
Process Quality – Measures of Defects Process Quality – Measures of Defects
Per Unit of Service
Delivery Lead Time for Goods and
Services From Customer Need
Identified to Customer Need
Met Expressed in Time
(Minutes/Hours/Days)
Measures of Access Including Lead-
times for Services and Wait-times
Between Services
Cost Hours or $ Consumed Per Unit
of Service. Typically a Measure
of Productivity
Hours or Dollars Consumed Per Unit
of Service
Growth Increases in Revenues or
Volumes
Increases in Revenues or Volumes
8

Example – True North MeasuresTrue North Category Strategic Direction True North Measure
People Create a Working Environment
that Inspires our Staff and
Medical Staff
Have 100% of our Staff and Medical
Staff Engaged in Verifiable
Improvement by the End of Fiscal Year
2015.
Quality • Eliminate Un-necessary
Mortality And Morbidity
• Provide Patient/Family
Centered Care
• Reduce Hospital Acquired Infections
by 80% by December 2014
• Improve Patient Satisfaction Scores
by 15% by December 2014Centered Care by 15% by December 2014
Delivery Reduce Needless Patient
Waiting
Reduce Wait Times for our Five Major
Service Lines by 50% by June 2014.
Cost Become a Benchmark, Low
Cost Service Provider
Operate in the 98th Percentile as a Low
Cost Service Provider in all Five of our
Major Service Lines by the End of the
Fiscal Year in 2015.
Growth Increase Access to all of our
Service Lines
Grow Each Service Line in Visits/Cases
by 10% per Year Ending December 31,
2015
9

Step 3: Select Improvement Priorities
A B C D
True North
CriteriaWeight Ranking Ranking Ranking Ranking
Quality 20 5/100 8/160 1/20 4/80
Use a Pugh Analysis to determine the areas of key leverage
10
Delivery 45 5/225 8/360 1/45 3/135
Cost 35 6/210 2/70 10/350 1/35
Growth 10 7/70 0/0 1/10 2/20
100 605 590 425 270
In this example, we can see that A has more leverage
against the outcomes than does the project D

Step 4: Implement Improvement Priorities
11

Use a Value Stream Approach to Select Discrete Improvements
From a current state
Month 1 Month 2 Month 3 Month 4 Month 5
Quick
Wins
Projects
Kaizen
Events
To an improved state
With Prioritized
Action Plans
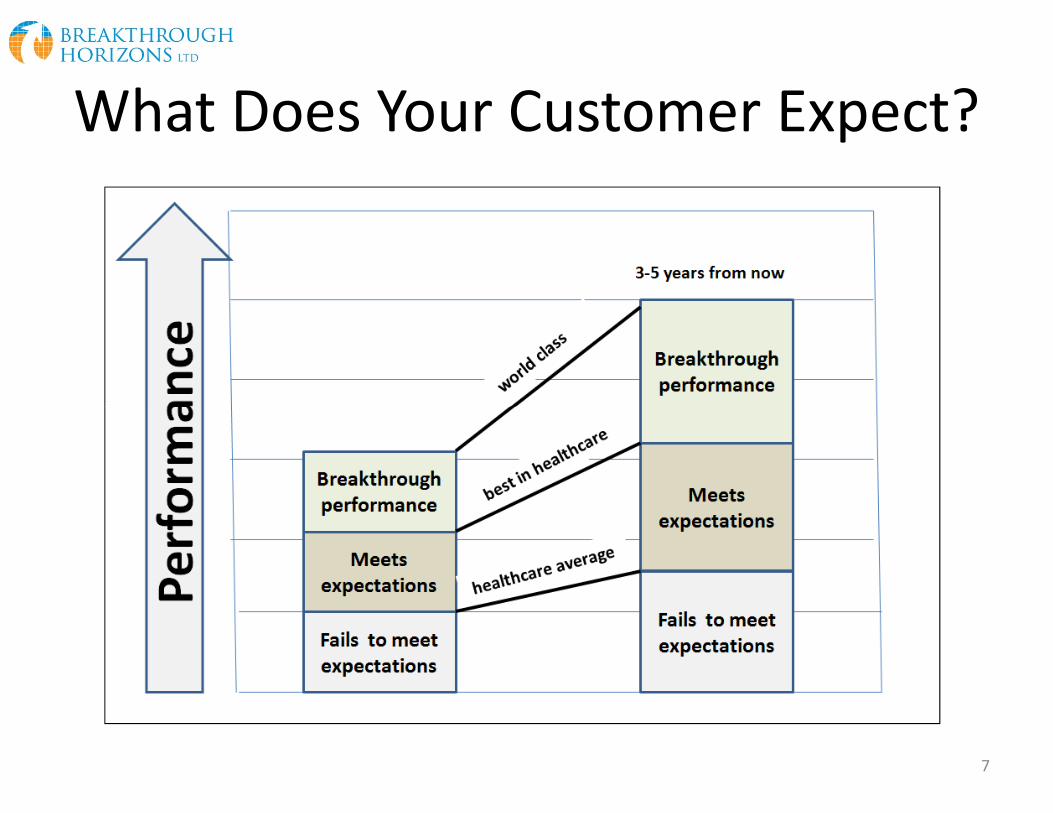
Step 5: Review Process and ResultsPerform a Monthly Review
Agenda ItemPercentage of
Agenda Time
Review Budget Performance 10%
Review Implementation Review Implementation
Actions, Results, and
Countermeasures
65%
New Product/
Service/Construction/
Development
10%
People / Organizational Issues 10%
Other 5%

CountermeasuresCountermeasures Sheet
Objective
Date of Review
Insert Pareto Chart Here -
The pareto chart is a f requency chart
detailing the reasons why the target was missed
Insert Historical Trend Chart Here -
The trend chart should show past performance the the golal fo the objective
14
Problem Statement:
Countermeasures Who When

Complete an Annual Review
Deployment Objective Review / Assessment
Objective 1
Objective 2
Objective 3
15
Objective 4
Objective 5
= Objective met
= Objective not met, but performance improved(shade in relative performance)
= Performance was worse than baseline

Improvement Cycle - Linking Strategy
to Improvement
Vision
Monthly and
16
True North Measures
Select Improvement
Priorities
Deploy Improvement
Priorities
Monthly and Annual Review
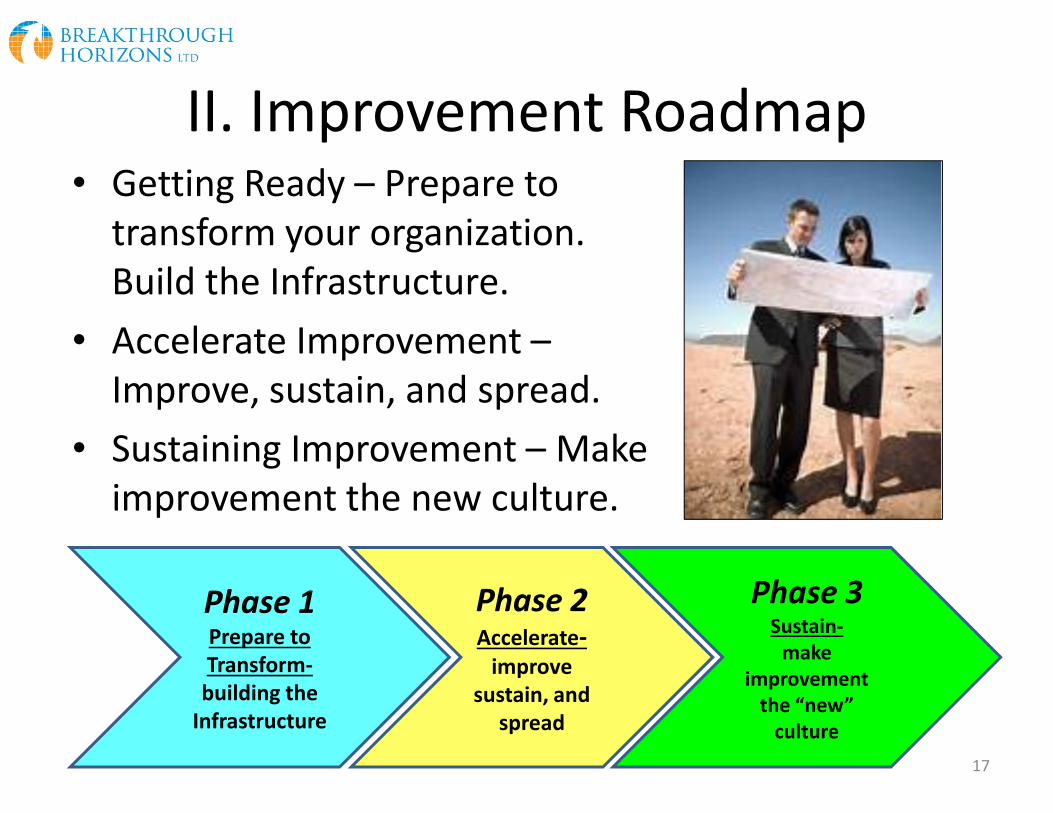
II. Improvement Roadmap• Getting Ready – Prepare to
transform your organization.
Build the Infrastructure.
• Accelerate Improvement –
Improve, sustain, and spread.Improve, sustain, and spread.
• Sustaining Improvement – Make
improvement the new culture.
17
Phase 1Prepare to
Transform-
building the
Infrastructure
Phase 2Accelerate-
improve
sustain, and
spread
Phase 3Sustain-
make
improvement
the “new”
culture
Key Steps in Getting Ready Phase
1. Select your change agent
2. Get informed
3. Get help
4. Establish a steering committee4. Establish a steering committee
5. Train your internal experts
6. Develop and deploy a
communication strategy
18

Key Steps in The Acceleration Phase1. Establish Value Stream Governance and Set
Up Your Value Stream Performance System
2. Utilize A3 Thinking to Realize Improvement
3. Sustain Improvement and Manage Visually
4. Capture the Savings
5. Spread Lean Thinking Across the Organization5. Spread Lean Thinking Across the Organization
6. Support Your Change with Ongoing Training
and Coaching
19
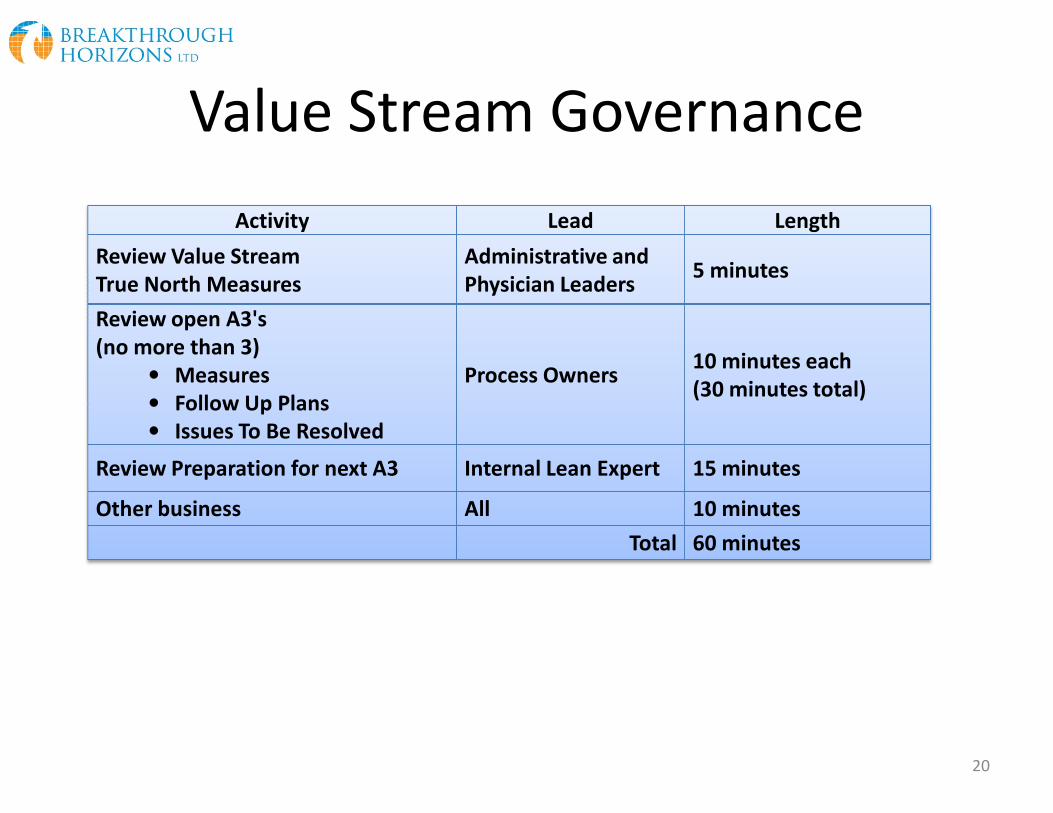
Value Stream Governance
Activity Lead Length
Review Value Stream
True North Measures
Administrative and
Physician Leaders5 minutes
Review open A3's
(no more than 3)
• Measures
• Follow Up Plans
Process Owners10 minutes each
(30 minutes total)• Follow Up Plans
• Issues To Be Resolved
Review Preparation for next A3 Internal Lean Expert 15 minutes
Other business All 10 minutes
Total 60 minutes
20

Monitor Value Stream Performance System
21

Utilize A3 Thinking – Get ResultsMetric Before Goal to Date % Change
Morale/Staff Engagement-
Implemented Ideas
0 300 127 undefined
Safety & Quality-
Left Without Being Seen
1.7% .2% .2% 88%
Patient Experience-
Likelihood to Recommend
61.1% 70% 69% 11%
22
Likelihood to Recommend
Patient Experience –
Time in the Waiting Room
10 minutes 0 minutes 4 minutes 60%
Patient Experience-
Usage of Hallway Beds
452
encounters
N/A 134
encounters
70%
Financial Stewardship-
Cost per unit of service
$170.17 $159.62 $156.00 6%
Actual Financial Impact $759,374
Forecasted Annualized
Financial Impact
$1,462,854
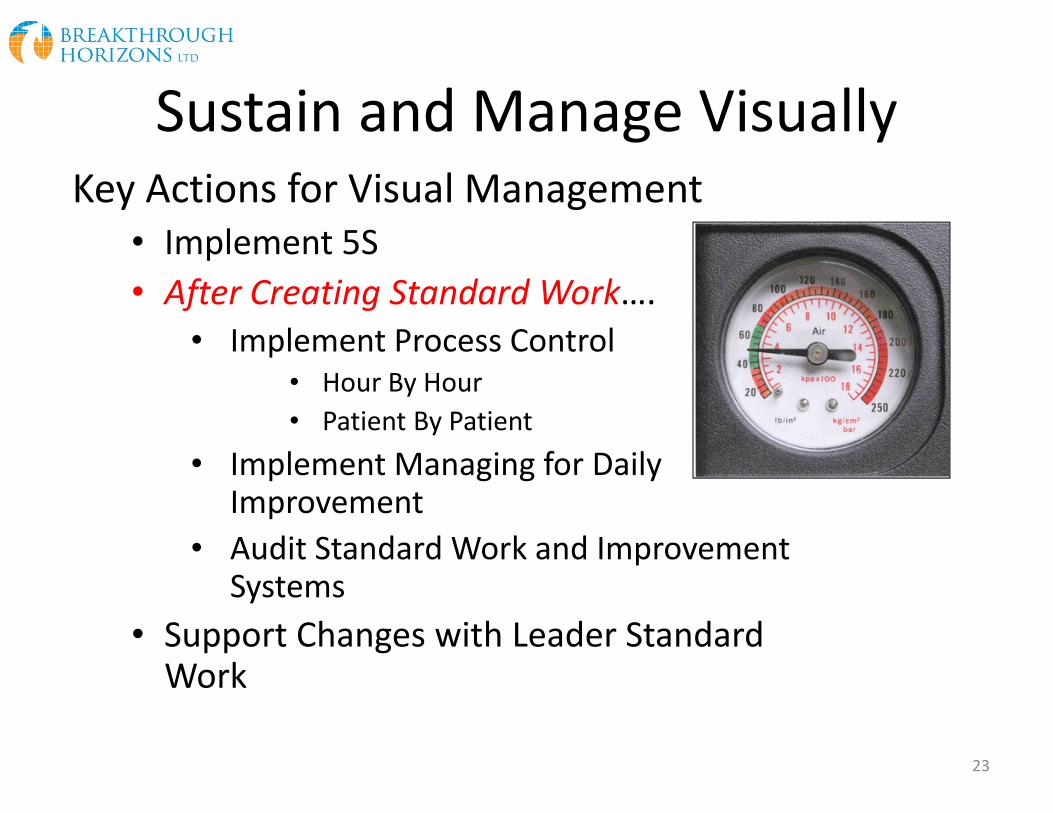
Sustain and Manage VisuallyKey Actions for Visual Management
• Implement 5S
• After Creating Standard Work….
• Implement Process Control
• Hour By Hour
• Patient By Patient• Patient By Patient
• Implement Managing for Daily Improvement
• Audit Standard Work and Improvement Systems
• Support Changes with Leader Standard Work
23

5S
BeforeAfter
24
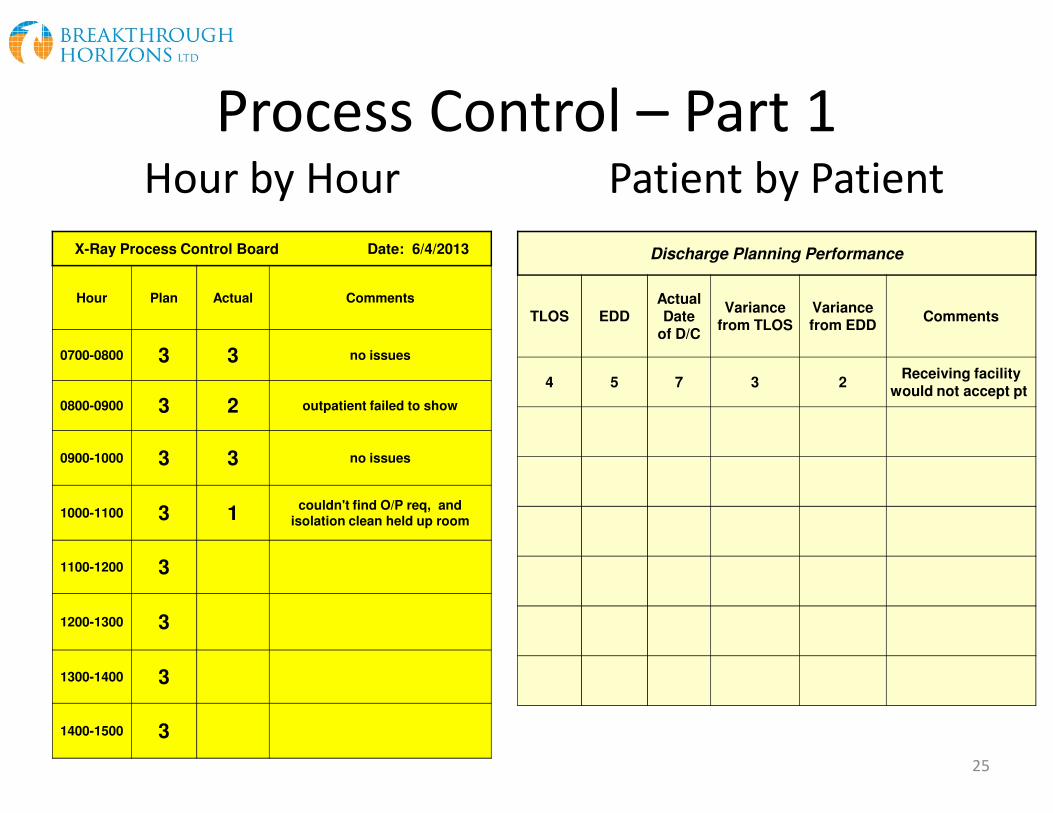
Hour by Hour
X-Ray Process Control Board Date: 6/4/2013
Hour Plan Actual Comments
0700-0800 3 3 no issues
0800-0900 3 2 outpatient failed to show
Patient by Patient
Discharge Planning Performance
TLOS EDDActual Date
of D/C
Variance from TLOS
Variance from EDD
Comments
4 5 7 3 2Receiving facility
would not accept pt
Process Control – Part 1
25
0800-0900 3 2 outpatient failed to show
0900-1000 3 3 no issues
1000-1100 3 1couldn't find O/P req, and
isolation clean held up room
1100-1200 3
1200-1300 3
1300-1400 3
1400-1500 3

Process Control - Part 2Frequency Chart
28
27
26
25
24
23
22
21
20
19
18
17
16
Fre
quency
15
14
13
12
11
10
9
8
7
6
5
4
3
2
1
reason for variance 26

Process Control - Part 3Action Plans
Issue Countermeasure Who When Status
27

Managing for Daily Improvement
28

Task Audits (Kamishibai)
Frequency Chart : Month ______________
28
27
26
25
24
23
22
21
Fre
qu
en
cy
20
19
18
17
16
15
14
13
12
29
Fre
qu
en
cy
12
11
10
9
8
7
6
5
4
3
2
1
1 2 3 4 5 6 7 8 9
10
11
12
13
14
15
16
17
Card Number

K- Card Template
30

Standard
Work
To Do
Improvements
Activities
Flow interrupters,
Daily notes and
observations
Requests for follow-up
Changes
Discussions

Putting It Together
Kamishibai
Process Control
Create Process Standard Work
Managing for Daily
Improvement
5SLeader
Standard Work
Actual Conditions
32
Managing
Visually

Capture the Savings
Hard $Future
Revenue
Cost
Avoidance
Soft
Savings
33
Who Keeps Score?

Spread Lean ThinkingSpread Approach Advantages Considerations
Introducing
Additional Value
Streams
• Buy-in from the start as current
conditions, future conditions and
action plans are generated
• Engages many more team members in
• improvement
• New innovation with each
opportunity
• May be more resource intensive than
replication approach
• Can take longer than a replication
approach
• Requires more infrastructure (skilled
facilitators) within your organization
opportunity
• Tailored improvement plans for each
value stream
Replication of
tools, process
and artifacts
• Leverages tested solutions
• Training key points are defined
• Solutions are based on lean principles
• More rapid approach
• Design resources are not consumed
• Usually we are replicating a product
and not the thinking
• Less buy-in to someone else’s
solutions
• Limits new ideas and innovation
• Difficult in “not invented here”
environments
• Project management resources are
needed to manage the change 34

Key Steps in Sustaining Phase
• Capacity Building
• Improve Leadership Processes
• “Lean out” all the areas you wouldn’t
normally think aboutnormally think about
35
Improvement / Change is embedded
into the corporate culture
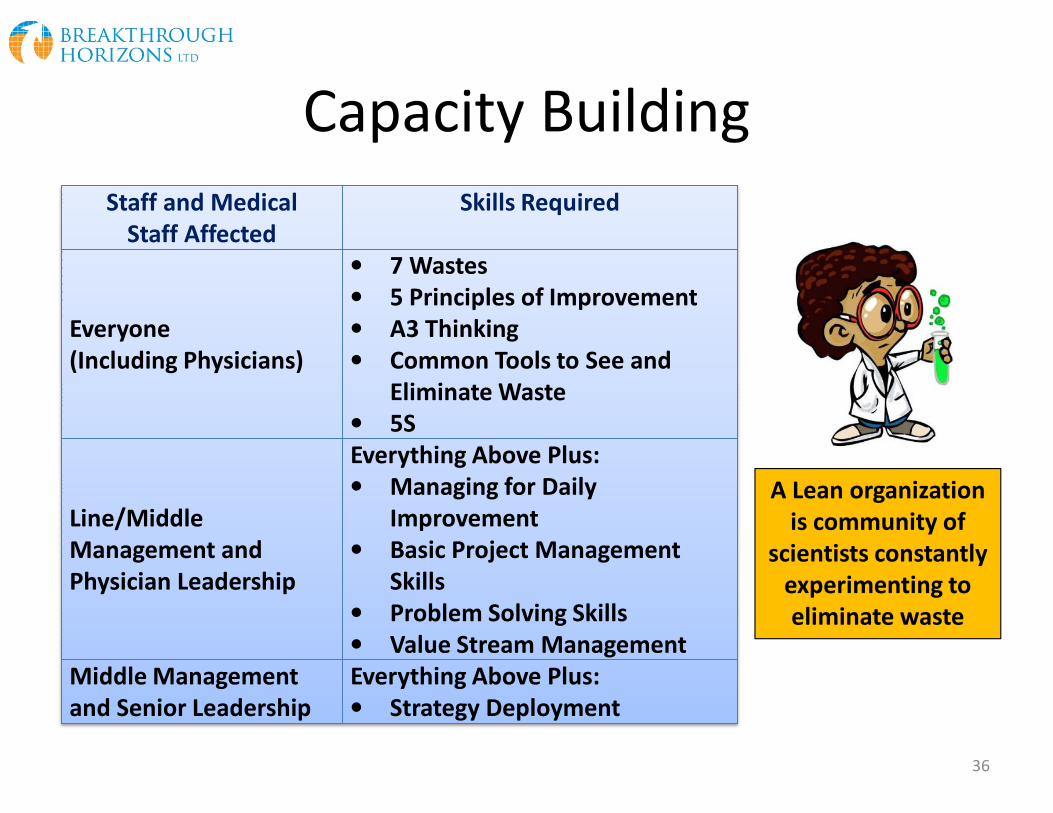
Capacity Building
Staff and Medical
Staff Affected
Skills Required
Everyone
(Including Physicians)
• 7 Wastes
• 5 Principles of Improvement
• A3 Thinking
• Common Tools to See and
Eliminate Waste
• 5S• 5S
Line/Middle
Management and
Physician Leadership
Everything Above Plus:
• Managing for Daily
Improvement
• Basic Project Management
Skills
• Problem Solving Skills
• Value Stream Management
Middle Management
and Senior Leadership
Everything Above Plus:
• Strategy Deployment
36
A Lean organization
is community of
scientists constantly
experimenting to
eliminate waste

Lean Leadership Processes
• Strategic Planning
• Strategy
Deployment
• Improvement
X-Matrix
• Improvement
Governance
• Committee
Management
37
A3
VOC
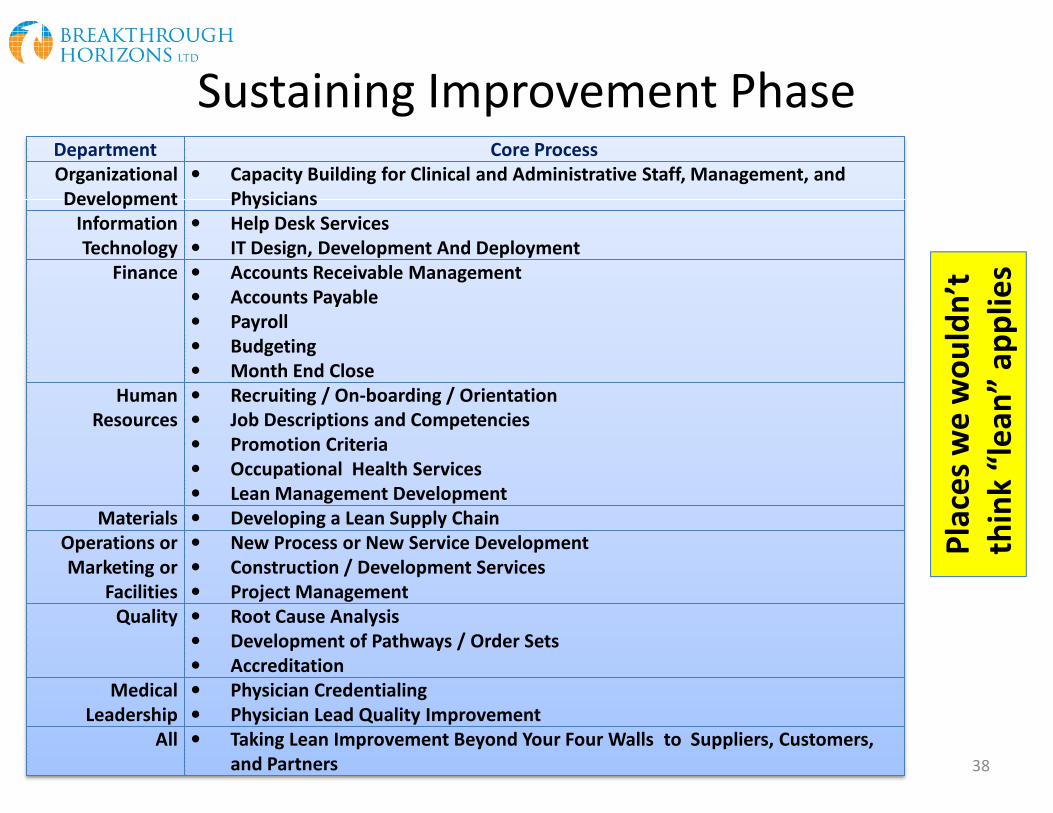
Sustaining Improvement PhaseDepartment Core Process
Organizational
Development
• Capacity Building for Clinical and Administrative Staff, Management, and
Physicians
Information
Technology
• Help Desk Services
• IT Design, Development And Deployment
Finance • Accounts Receivable Management
• Accounts Payable
• Payroll
• Budgeting
• Month End Close
Human
Resources
• Recruiting / On-boarding / Orientation
• Job Descriptions and Competencies
Pla
ces
we
wo
uld
n’t
thin
k “
lea
n”
ap
pli
es
38
Resources • Job Descriptions and Competencies
• Promotion Criteria
• Occupational Health Services
• Lean Management Development
Materials • Developing a Lean Supply Chain
Operations or
Marketing or
Facilities
• New Process or New Service Development
• Construction / Development Services
• Project Management
Quality • Root Cause Analysis
• Development of Pathways / Order Sets
• Accreditation
Medical
Leadership
• Physician Credentialing
• Physician Lead Quality Improvement
All • Taking Lean Improvement Beyond Your Four Walls to Suppliers, Customers,
and Partners
Pla
ces
we
wo
uld
n’t
thin
k “
lea
n”
ap
pli
es

Leadership Behavior Why Necessary
Participate Full Time on a 3 Day
Value Stream Analysis and a 4
Day Kaizen Event
• Demonstrates Commitment to the Approach
• This is the Best Way to Learn the Tools
• This is the Best Way to Learn How the Kaizen Experience
Changes the Culture While Compressing the Timeline for
Results
Learn the tools
• Everyone in the Organization Needs the Ability to Not to
Think Lean, But to Actually Use the Tools to See and
Eliminate Waste
IV. Leadership Behaviors to Ensure Success
39
Eliminate Waste
Walk the Value Streams
• Perform Gemba walks
• Changes the Role of the Leader from "Manager" to Coach
• Best Lean Approach to Develop Subordinates
• Gives Leadership Visibility in "Gemba" to Show
Importance to Staff and Medical Staff
• Gemba is the Source of All Facts. Going there Eliminates
Jumping to Conclusions and Problem Solving in the
Conference Room
Commit the Appropriate
Resources to be Successful
• Shows Commitment to Continuous Process Improvement
• Reprioritizes Less Important Activity, Allowing
Management Wiggle Room for Process Improvement
Activities
Transformation occurs when leadership thinks, acts, and behaves differently

Leadership Behavior Why Necessary
Hold Individuals and Teams
Accountable (Staff,
Management, and
Physicians)
• Address Antibodies
• Shows Respect For People
• Ensures Standard Work is Followed. Implementing and
Following Standard Work is the Way Organizations
Improve and Sustain.
• Ensures Consistency in How Staff and Medical Staff are
Treated
• Makes Visible Those Who Choose Not to Participate in
Process Improvement Activity
• Separates Personality Based Actions and Process Based
Leadership Behaviors to Ensure Success (con’t)
40
• Separates Personality Based Actions and Process Based
Actions
Redeployment versus
Unemployment
• Shows Respect for People
• Demonstrates that Team Members Will Not Lose Their
Job as a Result of Participating in Process Improvement
Activities
Demand and Monitor Results
• Aligns with the Lean Pillar of Continuous Improvement
• Shows Respect for People by Stretching their
Capabilities
• Helps Develop Management and Staff by Staying
Involved with the Process and Results
Believe • Greatness is Available to Everyone, but comes faster to
those who expect it

V. Mitigating Risk
1. Allowing too much complacency
2. Failing to create a powerful coalition
3. Underestimating the power of vision
4. Under-communicating the vision by a factor of 10
5. Permitting obstacles to block the new vision
41
5. Permitting obstacles to block the new vision
6. Failing to create short term wins
7. Declaring victory too soon
8. Neglecting to anchor the changes firmly in the
new corporate culture
8 Common Errors to Organizational Change Efforts

Avoid Common MistakesOrganizational
Mistake
Lean Transformation Roadmap
Risk Mitigation Activities
Allowing Too Much
Complacency
• Establishing True North Measures with Double Digit
Improvement
• Visual Management
• Managing for Daily Improvement
• Kaizen Rapid Cycle Improvement
• A3 Thinking
Failing To Create A • Enterprise Transformation Steering Committee
42
Failing To Create A
Powerful Coalition
• Enterprise Transformation Steering Committee
• Value Stream Steering Committee
Underestimating
The Power Of
Vision
• Deploying Hoshin Kanri
• Communication Strategy
• Value Stream Analysis
Under-
communicating The
Vision By A Factor
Of 10
• Communication Strategy
• Measurement Capture
• Physician Engagement Strategy
• Kaizen Report Outs
• Lean Capacity Building

Avoid Common MistakesOrganizational Mistake Lean Transformation Roadmap
Risk Mitigation Activities
Permitting Obstacles to
Block The New Vision
• Executive Sponsor
• Enterprise Transformation Steering Committee
• Value Stream Steering Committee
• Daily Team Leader Meetings During Kaizen Events
• Leadership Standard Work
• Visual Management
• Managing for Daily Improvement
• Enterprise Wide Engagement• Enterprise Wide Engagement
• Gemba Walks
Failing to Create Short
Term Wins
• Value Stream Rapid Improvement Plans with Quick Wins
• Kaizen Rapid Cycle Improvement
• A3 Thinking
• Managing for Daily Improvement
• Measurement Capture
Declaring Victory Too
Soon
• True North Measures
• Deep Versus Wide Pace of Change
• Visual Management
• Managing for Daily Improvement
• Value Stream Mapping and Analysis
Neglecting to Anchor the
Changes Firmly in the
New Corporate Culture
• Chapter 5, "Make Organizational Improvement the New Culture"
Addresses How to Prevent this Common Error.43

Why do organizations take the risk?
Benchmarks for World Class• 1 - 2% per month productivity
improvement
• 2 - 4% per month improvement in inventory turns
• 25 - 50% year over year reduction in • 25 - 50% year over year reduction in cost of quality
• 99% + fill rate to true customer demand
• Lead-time in hours/days versus weeks and months
44...Because they are pursuing these results
Agenda / Learning Objectives
�Linking Improvement to Corporate Strategy
�The Improvement Roadmap
� Getting Ready
� Accelerate Improvement� Accelerate Improvement
� Sustain Improvement
�Leadership Behaviors to Ensure Success
�Mitigating Risk
45
Related Documents