1 Lean IT Foundation Training Supporting publication May 2013 Version 2.0 Authors: Niels Loader, Dragana Mijatovic and Hans Kompier Quint Wellington Redwood

Welcome message from author
This document is posted to help you gain knowledge. Please leave a comment to let me know what you think about it! Share it to your friends and learn new things together.
Transcript

1
Lean IT Foundation Training Supporting publication May 2013 Version 2.0 Authors: Niels Loader, Dragana Mijatovic and Hans Kompier Quint Wellington Redwood

2
Introduction
In putting together the Lean IT Foundation, we aim to provide a broad and practical basis for people wishing to gain
knowledge about Lean and how it can be applied to IT. A large part of the information is clearly dealt in the reference
materials. However, some aspects have been brought together from various sources. Adding all of these sources to the list
of references would make the list excessive for a Foundation‐level course. This publication aims to fill these gaps,
particularly in the Performance, Organization and Behaviour & Attitude dimensions. Where possible, we provide references
to other publications for further reading.
The call for applying Lean principles to IT organizations had been growing since the early 1990’s and, after decades
of application and development of the Lean philosophy within production industries, the principles were transferred
to service organizations. The key driver behind this development was the continued inability of IT to deliver the
required services in the right way. Despite the IT‐initiated attempts at improvement through maturity or process
models, IT has continued to underperform in the eyes of businesses.
The problem is that these same businesses have, year‐on‐year, become more dependent on their IT. As a result, in
organizations where Lean had been applied to the primary business, it was thought that if it worked for the primary
business, it could work for IT too. As we will see, the thought is correct but the application of Lean to IT requires
some adaptation for it to be successful. First, we explain the key principles of Lean as a starting point from which to
explore other aspects of Lean IT.
The first issue we find is that there is no clear definition of what Lean IT actually is. We have therefore chosen a
widely available source, Wikipedia (2011), as the source for our definition:
“Lean IT is the extension of lean manufacturing and lean services principles to the development and management of
information technology products and services. Its central concern, applied in the context of IT, is the elimination of
waste, where waste is work that adds no value to a product or service.”
Key principles of Lean
The essence of Lean is delivering value to customers and continuously improving the ability to do this. This is a
simple statement but one with far‐reaching consequences. The landmark publication on the philosophy of Lean,
Lean Thinking (Womack and Jones, 1996)i, details the key principles of Lean:
1) Value is defined by the customer (“voice of the customer”) and represents the requirements that a customer
has regarding the product or service delivered. The key aspect of the value of a product or service is its ability to
help an organization to deliver value to its customers.
2) Value is delivered through a Value Stream. This is an end‐to‐end process triggered by the customer that ensures
the delivery of the required value as quickly as possible.

3
3) In order for a value stream to deliver value, it must have Flow. This means that the activities must follow each
other with minimal interruptions and minimal intermediate stockpiles. This means designing the flow such that
each unit that enters the flow is carried out to its conclusion without interruption.
4) It is also vital that the customer can trigger the value stream when the value is required. This is the essence of
Pull. For service industries (like IT), this is less
problematic than for production industries,
since the service is consumed as it is produced
and is generally started when requested by
the customer.
5) Last but not least, Lean aims for Perfection.
This does not mean that multiple quality
controls need to be in place, causing delays. It
means that each actor in the value stream
must know his/her task and the associated
quality requirements. This aspect also ensures that there is a focus on continuously improving the ability to
deliver value. Transparency helps the aim for perfection because transparency ensures useful feedback, and
feedback is required to understand where delivery does not meet expectations.
Characteristics of Lean IT
Why has Lean been so successful in manufacturing industries? Manufacturing deals principally with machines that create
products. Increasingly the human factor is removed from the production equation; robots, automated processes,
machinery are all aimed at removing the variability of humans and ensuring constant quality. Machines are designed for
efficiency, i.e. they create large amounts of products at a speed that humans cannot match. Unfortunately, in the process,
they tend to produce more waste than humans (who adapt quickly to re‐use or reduce waste). The machines are
subsequently tuned to ensure that they work better, producing more products per hour or less waste per product. This is
(in general) a rational, scientific process which deals with tangible products that are produced in a predictable, structured
manner. It is also relatively easy to measure how the products are made. After many improvement iterations, the goal is to
eke out 1 or 2% improvement each time. These characteristics explain why the Six Sigma methodology has developed
within the manufacturing industry.
Compare this with an IT organization and we find different challenges. First, an IT service is an intangible entity. Even the
core of the service, the software, is not something you can pick up and look at. It is only by installing it and using it that the
value can be understood. To a large extent, IT is unpredictable: we do not know when it will fail; we do not know how it
needs to be improved. Within IT, we are also not used to measuring the service as a whole. We measure the performance
of machines but that is only part of the service. The “people” part remains largely unmeasured. This is precisely where IT
differs from manufacturing: the most critical component is still the people delivering the service. The software industry
continues to make inroads into reducing the people effect, but people still make up a substantial part of the where the IT
4
service can fail.
Applying Lean to IT is thus a different proposition. It is about applying Lean to people, not machines. Aiming for perfection
means raising the level of professionalism of the people involved. This means improving their ability to solve problems,
their ability to work autonomously and in a team, and improving their mastery of the subject matter. Aside of skills
training, this means taking on a new mindset focused on value, value streams, flow, pull and perfection.
Dimensions
The Lean principles have far‐reaching consequences for all organisations that wish to integrate the principles into
their daily work. In order to make the analysis and improvement of the a more manageable prospect, we have
chosen to define dimensions within which a variety of considerations and tools are positioned. The dimensions of
Lean IT are Customer, Process, Performance, Organisation and Behaviour & Attitude.
• Customer deals with all aspects of understanding the customer and the value they are seeking and includes
tools such as Voice of the Customer and Critical to Quality
• Process looks at how value is delivered through Value Streams, integrating the principles of flow, pull and
perfection. Tools used are SIPOC (Supplier‐Input‐Process‐Output‐Customer) and Value Stream Mapping
(VSM) to ensure that a process is correctly scoped (SIPOC) and detailed with the addition of quantitative data
(VSM). The VSM is subsequently used to identify where there is waste in the process.
• Performance is a key aspect of Lean. From our understanding of the customer value and process, we can
determine the performance measures needed to understand, manage and steer the performance of the
organization. Key aspects are defining Key Performance Indicators, understanding and measuring the use of
time within an IT organization (using Operational Process Efficiency – OPE) and, lastly, identifying the
availability and requirements for the skills and knowledge of the workforce.
• Organisation investigates the aspects needed to ensure that we can steer the organization. This includes
Visual Management techniques supplemented with the Performance Dialogue. Also, we need to decide how
to organize people for maximum value delivery to customers. This means understanding the effect of silo‐ed
organisations versus organizing for customer‐orientation • Behaviour and Attitude has been found to be one of the most important success factors for Lean (and Lean
IT) implementations. There is a multitude of tools available in the literature to help steer behaviour. The first
step is understanding the key characteristics of Lean behaviour for everybody within the organization and for
the people in leadership positions in particular. It is vital to understand how expectations can cause
disappointment and disillusion with the improvements that Lean IT is supposed to deliver.
Customer
John Bicheno (2008) sums up the various definitions of value in his book The Lean Toolbox for Service Systems from an
economic definition of value to qualitative definitions. This shows how illusive the concept of value can be. In order to
5
make value more concrete and usable, it is useful to understand what types of customer value there are. Value tends
to be described by adjectives that indicate the importance of particular attributes of a product or service. In some
cases, these are measurable. And even if they are measurable, the customer takes a relative view of what the
suitable level is in order to perceive value.
As an example, we can take the value requirement “cheap”. This word alone begs a whole host of questions: What is
the product or service? What does the product or service mean to the customer? Does it help the customer to
generate more business? What is the market price for similar products or services? And so on.
In the previous example, “cheap” could be replaced by any number of characteristics for products and services. Examples
for products are performance, conformance, timeliness, reliability, serviceability, durability, aesthetics, reputation and
completeness. These come on top of the requirement for specific features. Similarly for services, a customer might define
the following types of value: Competence, reliability, accuracy, responsiveness, access, courteous, communication,
credibility, understanding, pricing. Some of the types of value of services and products may be the same but there are also
differences. The key message is that understanding and defining the value required by the customer is not as easy as it may
seem, especially when it comes to working out exactly what the customer is looking for when they say (for example): “it’s
got to be responsive”.
Performance
Every Lean publication mandates the need for performance and its measurement. Performance, like all other dimensions of
Lean, starts with the customer. The first step is to go back to our Voice of the Customer, more specifically the Critical to
Quality. The CtQ tree gives us a direct link to the things we should be measuring. But even the CtQ can contain too many
“things to manage”. We need to choose the right indicators.
There is a set of performance measures, Key Performance Indicators – or KPIs – that measure the performance of an key
organizational objective. A KPI should be defined according to SMART which means is should be: Specific, Measureable,
Achievable, Realistic and Time‐bound. A KPI supports the execution of the strategy; all other indicators can be referred to
as performance indicators or metrics. KPIs cascade from the strategic to the operational level, i.e. each level of the
organisation can directly state how they contribute to the achievement of the goal reflected by the KPI. The measure must
be consistent across the organization. At the same time, a KPI should be controllable by the team that is being measured
according to the KPI. A measurement procedure is available to ensure that everyone measure the KPI in the same way.
Lastly, as with the organisational goals that should be focused on the longer term, KPI should be long lasting. In this way,
performance can be consistently tracked over a longer period of time allowing the organisation to see whether
improvement measures have a sustained impact.
Once we have performance indicators, we need to make them work for us. What tools can we use to visualize performance
so that we are constantly aware of its importance and prompted to do the right things. This is about giving all levels of the

6
organization the tools to be in control of their own performance. This means ensuring that measurements become part of
the organisational or team Plan‐Do‐Check‐Act cycle. We also need to ensure that measurements become one of the
aspects of Visual Management, which we will deal with later in this document.
Within an IT organization, the key component for delivering the performance that customers require is people. It is people
who decide which technology choices to make. It is people who design, deliver and manage IT services. Breaking down the
“people” component, we find that it is all about ensuring the availability of the right amount of skills (and attitude) at the
right time.
The aspect of people can be subdivided into two key components. When we hire a person, we are in essence “buying” skills
and knowledge for a specific amount of time. Time is therefore the key production factor within IT, since it is only through
the skills and knowledge of the people that the money spent on technology (hardware and software) can be put to good
use.
Lean IT requires an intimate knowledge of time usage within the IT organisation. We need to understand how time is used,
particularly related to the delivery of value. We can define time based on the activity that is being carried out, in one of the
following three categories: Value‐Add, Necessary Non‐Value‐Add and Non‐Value Add. We can analyse the use of time
through the Lean concept of Operational Process Efficiency (or OPE). With this tool, we gain a detailed understanding of
what time is spent on. This helps us to identify areas of waste. The time measured in an OPE analysis is based on and can
provide input for the (activities of the) key Value Streams in which people work.
Skills and Knowledge
The second measurable part of people are their skills and knowledge. The vital aspect here is to understand whether the IT
organisation has access to the right amount of skills and knowledge to provide the value that customers expect from IT.
In this paragraph we explain the Lean IT instruments used to develop people and build competencies with the Skills and
Knowledge matrix and performance dialogue. To improve the performance of a team or department and to develop a
group of people, we need to understand their current capabilities. The objective of the Skills and Knowledge instrument is
to develop the people in the team such that they acquire skills and knowledge that are in line with customer demand.
One of the elements of waste is the lack of flexibility to follow customer demand because employees do not have the rights
skills available. For example: a company’s customer requires more Oracle than IBM expertise, but the IT team cannot
match the Oracle demand. The customer migrated to Oracle and the company did not follow at the same speed. The
consequence is that the company has IBM‐skilled people who are under‐utilized due a lack of the right skills.
7
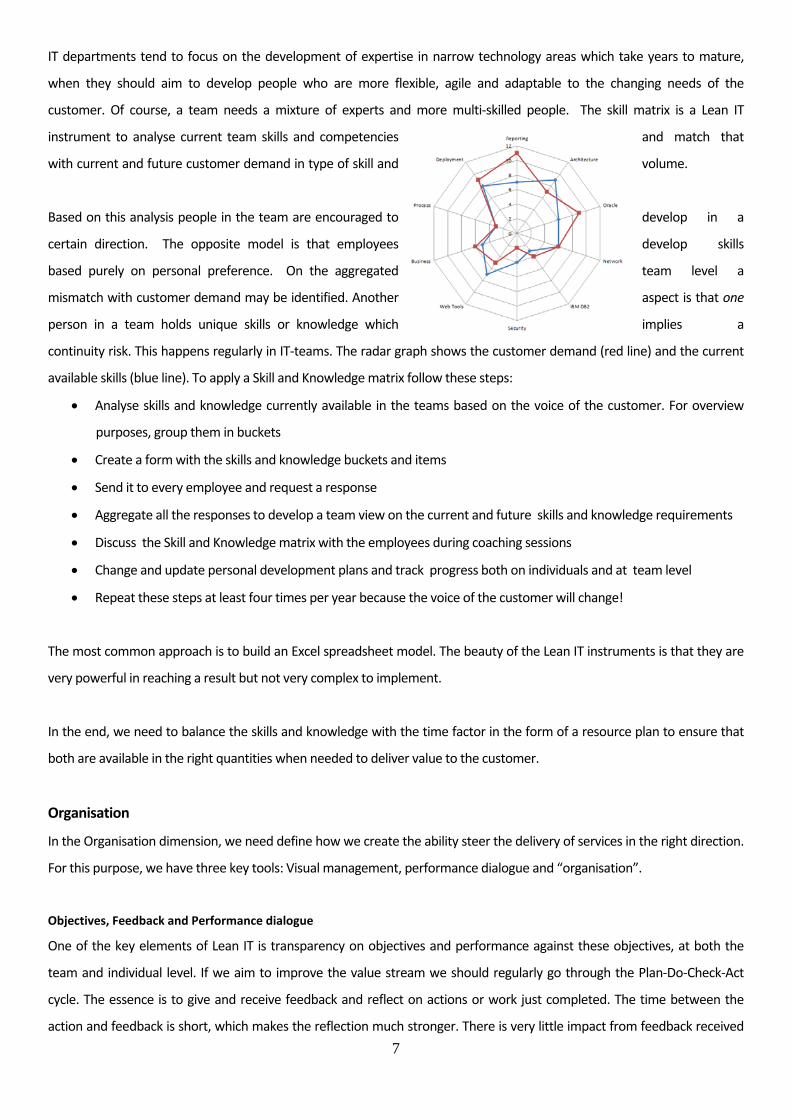
IT departments tend to focus on the development of expertise in narrow technology areas which take years to mature,
when they should aim to develop people who are more flexible, agile and adaptable to the changing needs of the
customer. Of course, a team needs a mixture of experts and more multi‐skilled people. The skill matrix is a Lean IT
instrument to analyse current team skills and competencies and match that
with current and future customer demand in type of skill and volume.
Based on this analysis people in the team are encouraged to develop in a
certain direction. The opposite model is that employees develop skills
based purely on personal preference. On the aggregated team level a
mismatch with customer demand may be identified. Another aspect is that one
person in a team holds unique skills or knowledge which implies a
continuity risk. This happens regularly in IT‐teams. The radar graph shows the customer demand (red line) and the current
available skills (blue line). To apply a Skill and Knowledge matrix follow these steps:
• Analyse skills and knowledge currently available in the teams based on the voice of the customer. For overview
purposes, group them in buckets
• Create a form with the skills and knowledge buckets and items
• Send it to every employee and request a response
• Aggregate all the responses to develop a team view on the current and future skills and knowledge requirements
• Discuss the Skill and Knowledge matrix with the employees during coaching sessions
• Change and update personal development plans and track progress both on individuals and at team level
• Repeat these steps at least four times per year because the voice of the customer will change!
The most common approach is to build an Excel spreadsheet model. The beauty of the Lean IT instruments is that they are
very powerful in reaching a result but not very complex to implement.
In the end, we need to balance the skills and knowledge with the time factor in the form of a resource plan to ensure that
both are available in the right quantities when needed to deliver value to the customer.
Organisation
In the Organisation dimension, we need define how we create the ability steer the delivery of services in the right direction.
For this purpose, we have three key tools: Visual management, performance dialogue and “organisation”.
Objectives, Feedback and Performance dialogue
One of the key elements of Lean IT is transparency on objectives and performance against these objectives, at both the
team and individual level. If we aim to improve the value stream we should regularly go through the Plan‐Do‐Check‐Act
cycle. The essence is to give and receive feedback and reflect on actions or work just completed. The time between the
action and feedback is short, which makes the reflection much stronger. There is very little impact from feedback received

8
on work completed weeks ago. What were the exact conditions? The perceptions will be quite different. So, improving
performance and developing people feedback and reflection are the key instruments.
In a Lean transformation, a lot of attention is given to teaching people how to give and receive constructive feedback. In
Lean IT several moments for reflecting on achieved performance are defined. Firstly, at the start of the day, we briefly
discuss the previous day’s results and issues. Secondly, at the start of the week, the team’s performance during the
previous week is discussed. Thirdly, performance is discussed between the manager and the employee during the
performance dialogue. So, what is new here? Almost all companies have 1‐to‐1, manager‐employee meetings. Usually,
however, those meetings are unstructured and only the current daily things are discussed. It becomes more of a social
meeting to build the working relationship between manager and employee. Of course this is fine, but not sufficient if
improvement is required.
The performance dialogue brings together a number of Lean behaviours in a single meeting: Goal‐setting based on an
integral and factual view of the work, providing support, giving feedback, showing respect. Three topics are discussed in a
performance dialogue:
1) New and ongoing objectives should be discussed between manager and employee. What are the mutual expectations
and how are these defined? Unclear expectations are the most common cause for disagreement between manager
and employee. In the performance dialogue specific defined objectives are discussed and agreed. These objectives
should (again) be SMART. To do this, the manager should be knowledgeable about the daily operation of their team.
That is one of the reasons that a manager should spend fifty per cent of the time with the team in the workplace. A
Lean manager cannot be in meetings all day.
2) The manager offers support to the employee for the achievement of their objectives. What does the employee need
to achieve these objectives? How can the manager facilitate this? The manager has the role of a coach to help the
employee and discuss how they can achieve the objectives.
3) Constructive feedback and suggestions for improvement are given. The manager will have observed the employee
while working. The manager then gives feedback on how the employee performed or behaved, with the intention of
developing the employee. Ideally this happens in a climate of trust and respect. This is difficult to achieve but essential
for building a high performance organization. Like As the chairman of Toyota once said: “Build people first, then cars”
A performance dialogue can be a one‐to‐one discussion, but carrying out a day start or a week review is also a form
of performance dialogue. The ability to do performance dialogues effectively is a key skill of anyone working in a
Lean environment.
Organizing Lean IT
When looking at how to deploy people within IT in such a way that they are facilitated in delivering value, the
principles for organizing are customer orientation and speed of communication.
9
Why should an IT organizations be customer‐oriented? Traditionally, IT organisations have been technology‐centric.
This has led to the impression that IT organisations are essentially not interested in what customers want, only in
how to ensure the technology works. In the current world, IT organisations must respond quickly to the needs of
their customers. In order to do this they must gain a customer‐centric focus. This does not necessarily mean that
they should be organised in customer teams, but it does mean that the orientation through the IT Value Streams
must have a strong customer component. One of the ways of doing this is to ensure that frontline employees are
empowered to understand and deliver the value required by customers without having to gain permission from
management.
When an issue exceeds the mandate of the frontline employee, there must be an efficient information cascade to
ensure that the request for support gets to the correct hierarchical level as quickly as possible. And that the
“support” is delivered as soon as possible.
Visual Management
In order to improve performance, early feedback and the knowledge of what is happening are key elements of
operational management. The biggest change when transforming to Lean IT is the introduction of Visual
management ‐ upon entering a workspace or office the presence of boards indicates a Lean team. The concept of
Lean Visual Management is extensively covered in “Creating a Lean Culture” by David Mann (2010).
A Lean team uses three boards to manage the operation: the day board, the week board and the improvement
board. The objective of Visual management is real time updates, sharing of lessons learned, and reflection/feedback
on work done the previous day. Visual management creates transparency in the status and progress of the work. The
benefit of the system is that it is always clear what is going on in the team or department.
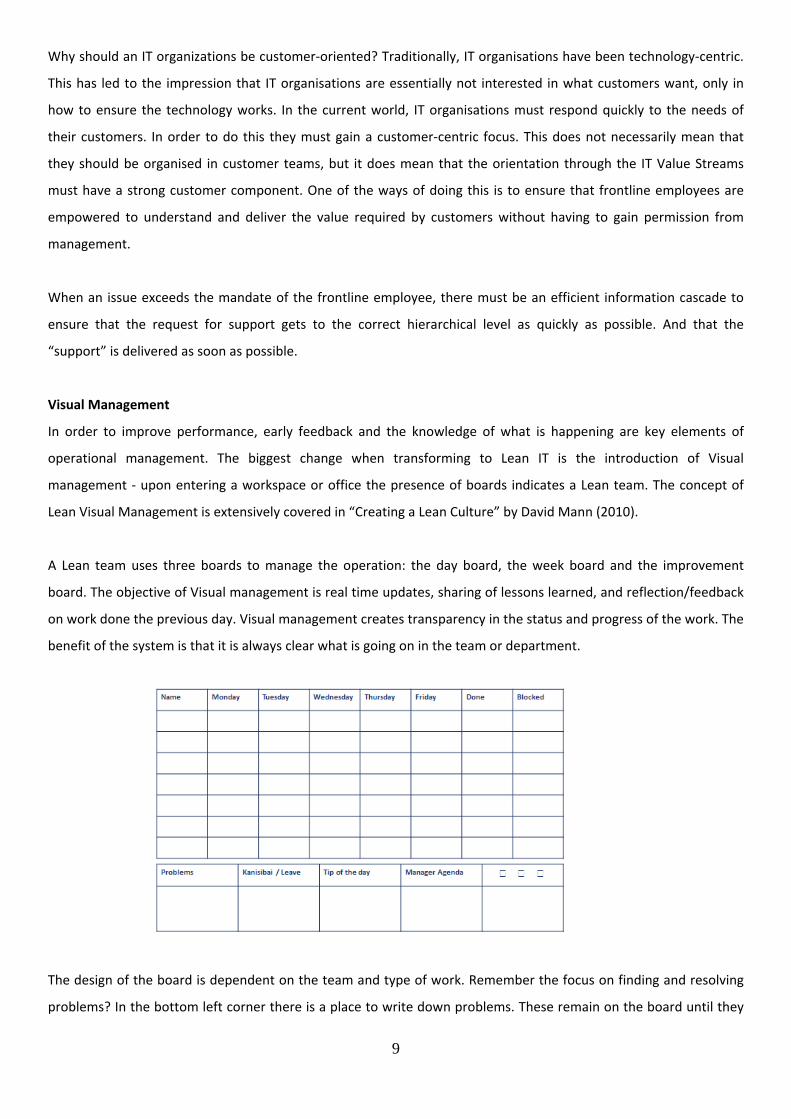
The design of the board is dependent on the team and type of work. Remember the focus on finding and resolving
problems? In the bottom left corner there is a place to write down problems. These remain on the board until they
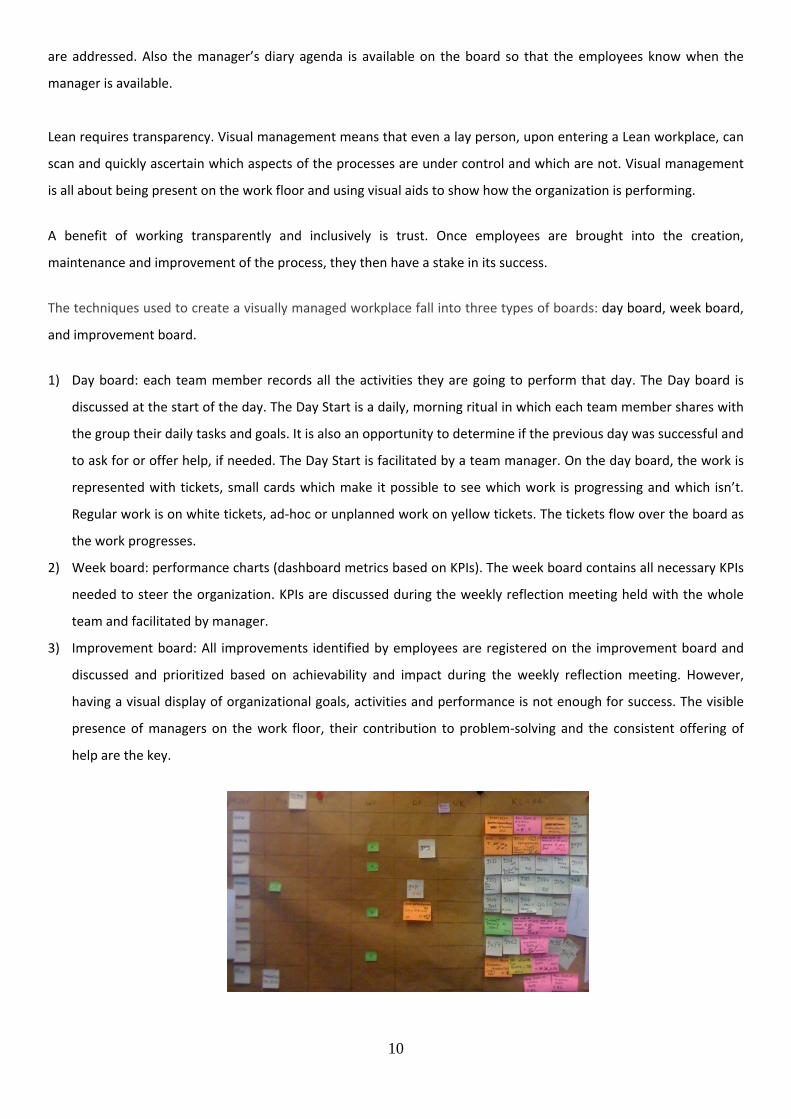
10
are addressed. Also the manager’s diary agenda is available on the board so that the employees know when the
manager is available.
Lean requires transparency. Visual management means that even a lay person, upon entering a Lean workplace, can
scan and quickly ascertain which aspects of the processes are under control and which are not. Visual management
is all about being present on the work floor and using visual aids to show how the organization is performing.
A benefit of working transparently and inclusively is trust. Once employees are brought into the creation,
maintenance and improvement of the process, they then have a stake in its success.
The techniques used to create a visually managed workplace fall into three types of boards: day board, week board,
and improvement board.
1) Day board: each team member records all the activities they are going to perform that day. The Day board is
discussed at the start of the day. The Day Start is a daily, morning ritual in which each team member shares with
the group their daily tasks and goals. It is also an opportunity to determine if the previous day was successful and
to ask for or offer help, if needed. The Day Start is facilitated by a team manager. On the day board, the work is
represented with tickets, small cards which make it possible to see which work is progressing and which isn’t.
Regular work is on white tickets, ad‐hoc or unplanned work on yellow tickets. The tickets flow over the board as
the work progresses.
2) Week board: performance charts (dashboard metrics based on KPIs). The week board contains all necessary KPIs
needed to steer the organization. KPIs are discussed during the weekly reflection meeting held with the whole
team and facilitated by manager.
3) Improvement board: All improvements identified by employees are registered on the improvement board and
discussed and prioritized based on achievability and impact during the weekly reflection meeting. However,
having a visual display of organizational goals, activities and performance is not enough for success. The visible
presence of managers on the work floor, their contribution to problem‐solving and the consistent offering of
help are the key.
11
Both team and individual performance are openly discussed. There is often a great deal of initial resistance and “yes,
but…” responses to criticism. This is why management needs to back up any criticism with real data. It is important
that the manager constantly clarifies and directs change in order to make daily improvements. Managers and
employees should hunt for problems and find solutions together in order to maintain the spirit of co‐operation. In
this way, managers can actually steer the organization in the direction desired.
Lean Leadership
Lean Leadership is much more than managing a Lean Transformation. Lean leadership is the behaviour and attitude
necessary for a Lean organization. Many managers are excited about Lean and they want to "lead by example", i.e.
walk the walk and talk the talk. Often they are able to apply Lean instruments but do not know exactly what Lean
behaviour means. The right leadership behaviour and day‐to‐day modelling are crucial for the long‐term success of
Lean and continuous improvement.
What is Lean behaviour and attitude? It is very simple. As the Chairman of Toyota once said, “Go see. Ask why. Show
respect.” An in‐depth discussion of Lean Leadership can be found in “Creating a Lean Culture” (Mann, 2010). The
essential difference between attitude and behaviour is that attitude determines the way people approach the
situations they meet and behaviour is how they react, i.e. what they do as a result of an occurrence. Lean attitude
includes a series of “beliefs” such as improvement is always possible, possibilities rather than limitations, together
we can achieve more than alone. Behaviour follows these beliefs in that people will go looking for waste, will treat
people with respect and share knowledge based on these attitude characteristics.
What makes a Lean transformation a long‐term success? When an organization starts with Lean, the first
improvement proposals are often revolutionary. These are often quite quickly identified and these quick wins are
swiftly implemented. At the start, the success of Lean is particularly visible. As time goes by and many improvements
are identified and implemented, it becomes more difficult to identify new improvement opportunities. The low
hanging fruit is taken (or “quick wins”). This leads to comments such as “we’re finished with Lean; there’s nothing
left to improve”. Generally, people forget that each per cent improvement is an improvement. Organizations like
Toyota do so well because they improve each year with a two per cent increase in productivity. Remember that
Toyota is more than fifty years down the road with Lean. That is a lot of improvement!
How do organizations succeed in integrating the Lean way of thinking into a long‐term source of success and truly
adopt a continual improvement attitude? One of the key challenges is for Lean principles to become an integral part
of the paradigm used by managers for steering the organization. This means that the consistent set of models and
theories used as the thought framework (= paradigm) to steer reality must be enriched with Lean principles and
methods. Lean, as part of the management paradigm for IT organizations, means managing based on the results
produced for the customer; is the customer actually satisfied? The Lean transformation means a significant change in
the way managers and employees do their work. We all know how difficult it is to change our behaviour!
12
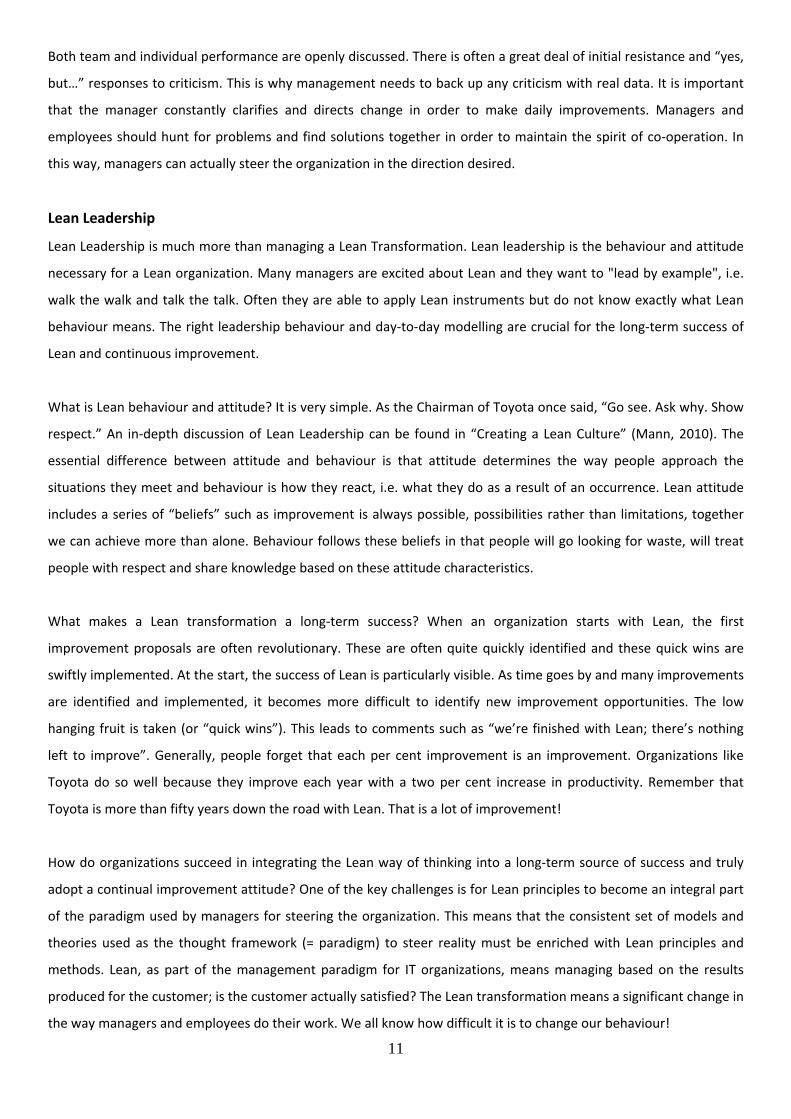
Changing behaviour and attitude is always related to people’s expectations of what the change will bring them.
Expectations follow a generic development when new working practices are introduced. The figure below shows this
generic development.
In every change, people’s expectations of the results start by moving from low to very high as they see that the
change can provide the improvements desired. Unfortunately, these improvements tend to be the “low‐hanging
fruit” and then it becomes more difficult improvements need to be tackled. These do not invariably lead to success
and people become despondent regarding the change. This despondency is known as the “Valley of Despair”. It is
then the role of management to show constancy of purpose in seeking to remove waste from the IT organisation and
provide more value to customers. This is the way out of the Valley of Despair to more realistic expectations
regarding what Lean IT can deliver.
References Lean Thinking, James P. Womack and Daniel T. Jones, Simon and Schuster, 1996 The Lean Toobox for Service Systems, John Bicheno, PICSIE books, 2008 Creating a Lean Culture, David Mann, CRC Press, 2010
13
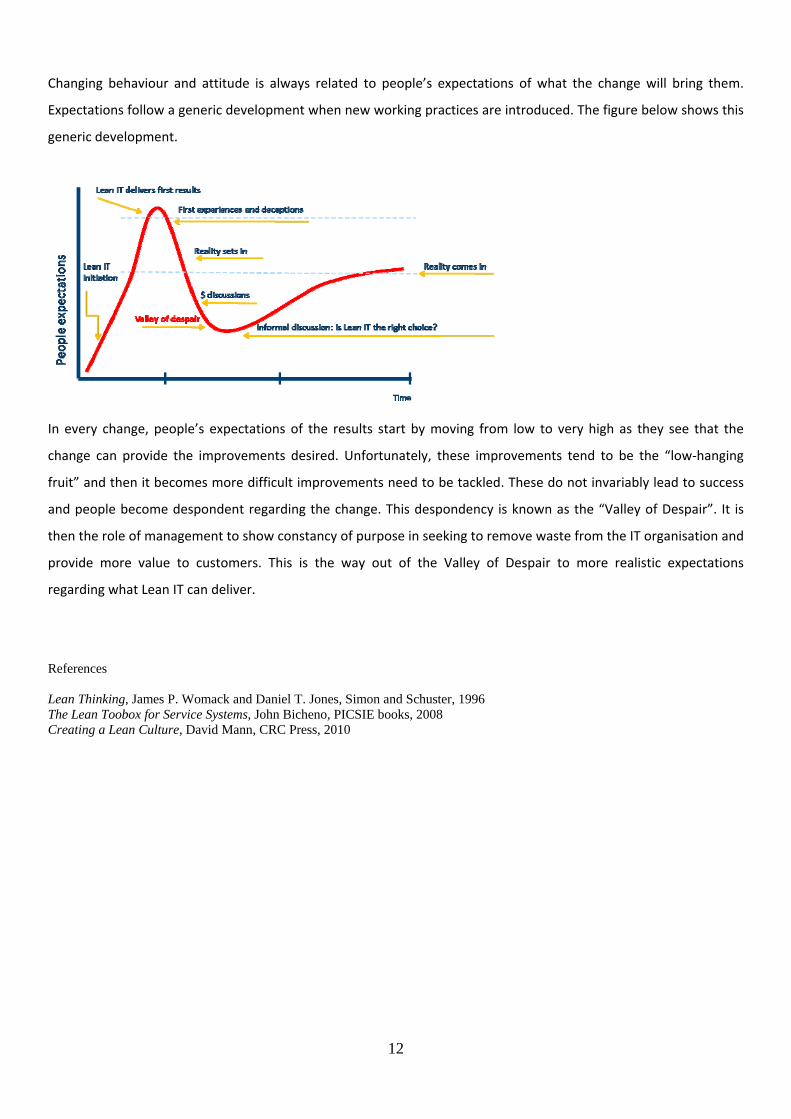
Glossary
Term Description
Batch and Queue
A Push production model where products are created before customer demand and in a certain quantity at production cycle. After production the products are stored (queued) in stock until the customers demand is received.
Behaviour and Attitude The way people think and act. Cause and Effect Diagram See Fishbone diagram. Change Over Time Time needed to reconfigure a machine between two different products Common cause variation Sources of variation in a process that are inherent to the process, also
referred to as noise. Continual Improvement Ongoing process in an organization with the objective to find, resolve and
share solutions to problems. The objective is achieve perfection, in other words to improve value streams, product and customer value. A philosophy of frequently reviewing processes, identifying opportunities for improvement, and implementing changes to get closer to perfection.
Cost of Poor Quality The price you have to pay for poor quality products or services. For example claims, fines and loss of customer confidence.
Critical to Quality Critical to Quality is an attribute of a part, assembly, sub‐assembly, product, or process that is literally critical to quality or, more precisely, has a direct and significant impact on its actual or perceived quality.
Customer The person or group of people who use your product or service OR the person next in line in the value stream.
Customer Value The economic worth of a product or service to somebody else: the customer. A capability provided to a customer at the right time at an appropriate price, as defined by the customer. The more a product or service meets a customer’s needs in terms of affordability, availability and utility, the greater value it has. Thus, a product with true value will enable, or provide the capability for, the customer to accomplish his objective.
Cycle‐time The time elapsed before the production or service cycle repeats itself. Day board Whiteboard used to share information and updates within the team. The
Day board is used during the Day start. Defect Output of a process that does not meet requirements. For example a
product that does not function as specified. Defects generate rework. DMAIC Acronym for the five steps in problem solving with Kaizen, i.e.: Define,
Measure, Analyze, Improve and Control. Failure Stream Opposite of a value stream. A failure stream does not add value to the
customer. For example, resolving an IT incident. First in First Out (FIFO) Work is processed on a’ first come, first served’ approach. Fishbone diagram The fishbone diagram identifies many possible causes for an effect or
problem. It can be used to structure a brainstorming session. Five “Whys.” A root‐cause analysis tool used to identify the true root cause of a problem.
The question “why” is asked a sufficient number of times to find the fundamental reason for the problem. Once that cause is identified, an appropriate countermeasure can be designed and implemented in order to eliminate re‐occurrence.
Flow The smooth, uninterrupted movement of a product or service through a series of process steps. In true flow, the work product (information, paperwork, material, etc.) passing through the series of steps never stops.
Improvement Board Whiteboard that presents current problems and the follow‐up to resolving or addressing that problem.

14
Inflexibility Inability to meet customer demand with a certain resource. For example, you have sufficient employees but they do not have the right skills to work on the current customer demand.
Input In a process used or transformed resources, this sometimes references the X's or input variables.
Inventory All components, work in process, and finished products not being processed but stored and waiting.
Ishikawa diagram See Fishbone diagram. IT Outcome The delivery of IT products or services to the business (customer). Just‐in‐time A system for producing and delivering the right items at the right time in the
right amounts. Just‐in‐Time approaches just‐on‐time when upstream activities occur minutes before down‐stream activities, so single‐piece flow is possible.
Kaizen An improvement philosophy in which continuous incremental improvement occurs over a sustained period of time, creating more value and less waste, resulting in increased speed, lower costs and improved quality. When applied to a business enterprise, it refers to ongoing improvement involving the entire workforce including senior leadership, middle management and frontline workers. Kaizen is also a philosophy that assumes that our way of life (working, social or personal) deserves to be constantly improved.
KPI Key Performance Indicator, a measure indicating a key performance metric of a process, condition or state. A KPI should be in line with the strategy, long lasting, and consistent in the cascade from top to operational level.
Last in First Out (LIFO) Work is processed in a ‘last arrived, first handled’ approach. Lead Time The time needed between the customer placing the order and the product
or service delivery. Machine Time The time a machine is working on a product. Metric A measurable characteristic of a variable that is regarded a performance
indicator. MIFA Material and Information Flow, see Value Stream Mapping. Motion People or equipment moving or walking more than is required to perform
the processing. Muda A Japanese word for waste. See Non‐value‐added and Waste. Necessary non‐value‐added Activities that add no value from the customer’s perspective but are
required in order to operate the business. This could include legal and regulatory requirements as well as certain internal business processes which would put the business at risk if eliminated in today’s environment.
Non‐value‐added Activities that add no value from the customer’s perspective nor are they necessary to properly run the business. These activities are often legacy in nature (“we’ve always done it that way”).
Operational Process Efficiency Operational Process Efficiency refers to the degree of efficiency of a process (or set of processes) whether it relates to the level of success of processing within an organization, the cost‐effectiveness of a market, or the erosion of income by expense.
Organization Lean IT is structured in five dimensions. Organization is the dimension that covers all aspects related to the way the company is structured.
Output Products or services created as a result of a value stream or process. Over Processing Type of waste. It means doing the work better than requested by the
customers. Also referred to as gold‐plating. Over Production Type of waste. It means producing more than requested by the customer. Parallel Lines Number of lines of production that can operate in parallel. For example 3
cashiers in a supermarket handling customers at the same time. Pareto diagram Bar chart showing the causes of problem or condition order from large to
small contribution. Effective tool to show what the big contributors to the

15
problem are.
Perfection A key objective of Lean to bring a product or service into a state where the number of defects is zero or as close as possible to zero. Relates to continual improvement.
Performance Performance is the ability to achieve defined goals in time, related to customer value.
Performance Dialogue Conversation between to two people where three topics are discussed. A performance dialogue defines an objective, offers support, and evaluates achieved results. For example a Performance Dialogue between manager and employee.
Problem Board See Improvement board. Process A series of actions that must be performed correctly in the correct sequence
at the correct time to create value for a customer. Process Throughput The number (volume) of products or services that a process can produce
within a timeframe. Process Throughput Analysis A tool to perform a process analysis with the objective of calculating process
output, e.g. process throughput and constraints. Used to improve the capacity of a process.
Pull A system of cascading production and delivery instructions from downstream to upstream activities in which nothing is produced by the upstream supplier until the downstream customer signals a need.
Push Push Production. A system where an upstream process produces as much as it can without regard to the actual requirements of the next process and sends them to the next process whether they have capacity to begin work or not. Push Production typically results in queues of work building up, which result in delays.
Re‐work Activities required to fix defects of a product or service produced by a process to meet the requirements
Root cause analysis Studying the fundamental causes of a problem, as opposed to analysing symptoms.
Skills and Knowledge matrix Skills and Knowledge matrix is used to steer team development to meet skills demand. The objective is that team skills are aligned with the customer demand for those skills.
Takt Time The pace at which work must be completed to meet customer demand. To calculate, divide the available work time by the customer demand for that period. For example, if a call centre receives 900 calls per shift, and there are 27,000 seconds of available work time, the takt time is 30 seconds per call. Therefore, one call must be completed every 30 seconds to meet customer demand. Takt, a German word meaning pace, is the heartbeat of any Lean system. Process Time divided by Takt Time yields the number of workers required to support a specific product.
Transportation Movement of products in a factory. It is a type of waste if products are transported more the strictly needed.
Trend A gradual, systematic change of a metric over time Unit of Work Describes the unit (the thing) that goes through the process, for example
incidents, cars, designs etc. Value Stream The specific activities required to design, order, and provide a specific
product or service from the point of product (or service) concept, through launch, ordering raw materials, production and placing the product (or service) in the hands of the customer. From a shareholder’s perspective the Value Stream could also include the steps and time required until the receipt of revenue.
16
Value Stream Mapping (VSM) A technique used to analyse the flow of materials and information currently required to bring a product or service to a consumer. A visual representation of all of the process steps (both value‐added and non‐value‐added) required to transform a customer requirement into a delivered good or service. A VSM shows the connection between information flow and product flow, as well as the major process blocks and barriers to flow. VSMs are used to document current state conditions as well as design a future state. One of the key objectives of Value Stream Mapping is to identify non‐value adding activities for elimination. Value Stream Maps, along with the Value Stream Implementation Plan are strategic tools used to help identify, prioritize and communicate continuous improvement activities.
Value‐add Activities that add value in the eyes of the customer. The customer is willing to pay for this work.
Variability Variation in the output of a process in quality and demand volume. Voice of the Business (VOB) Defines the needs and requirements of the most important stakeholders
from the organization, for example market share, growth and profitability. Voice of the Customer (VOC) Term to describe the in‐depth process of capturing a customer's
expectations, preferences and aversions with the objective to create products or services that that meet the customer’s needs and preferences.
Waiting Time Waiting for the next production step to begin. Waste Any activity that consumes resources but does not provide value as defined
by the customer. Also referred to as Muda or Non‐value‐adding activities. Week board Whiteboard used to share information about the team’s performance over
the previous week, and objectives for the coming week. Work in Progress (WIP) Number of items worked on (in progress) in the process.
Related Documents