375 Bridgeport Ave. Shelton Connecticut 06484 Tele 203.225.0451 Lean Daily Management Systems Sustained Improvement through Employee Engagement Iowa Lean Consortium Des Moines, Iowa Presenter: Brijesh (BK) Malhotra October 30 th , 2019 Session A4 11:00am – 12:15pm Session C9 3:00pm – 4:15pm

Welcome message from author
This document is posted to help you gain knowledge. Please leave a comment to let me know what you think about it! Share it to your friends and learn new things together.
Transcript
375 Bridgeport Ave. Shelton Connecticut 06484 Tele 203.225.0451
Lean Daily Management SystemsSustained Improvement through Employee Engagement
Iowa Lean ConsortiumDes Moines, Iowa
Presenter: Brijesh (BK) Malhotra
October 30th, 2019
Session A4 11:00am – 12:15pmSession C9 3:00pm – 4:15pm

375 Bridgeport Ave. Shelton Connecticut 06484 Tele 203.225.0451
Introduction …
• Senior Consultant at Productivity Inc. – 4 Years• Director, Continuous Improvement – Hershey Chocolate – 3 years• Wm. Wrigley Jr. Co. – Total 18 years - (USA, EU, Asia)
– 6 Years as a E2E Supply Chain Director– 2 Years Global CI – 10 years in Plant roles
• Merchant Marine Engineer – 10 years
375 Bridgeport Ave. Shelton Connecticut 06484 Tele 203.225.0451
Objectives for today …
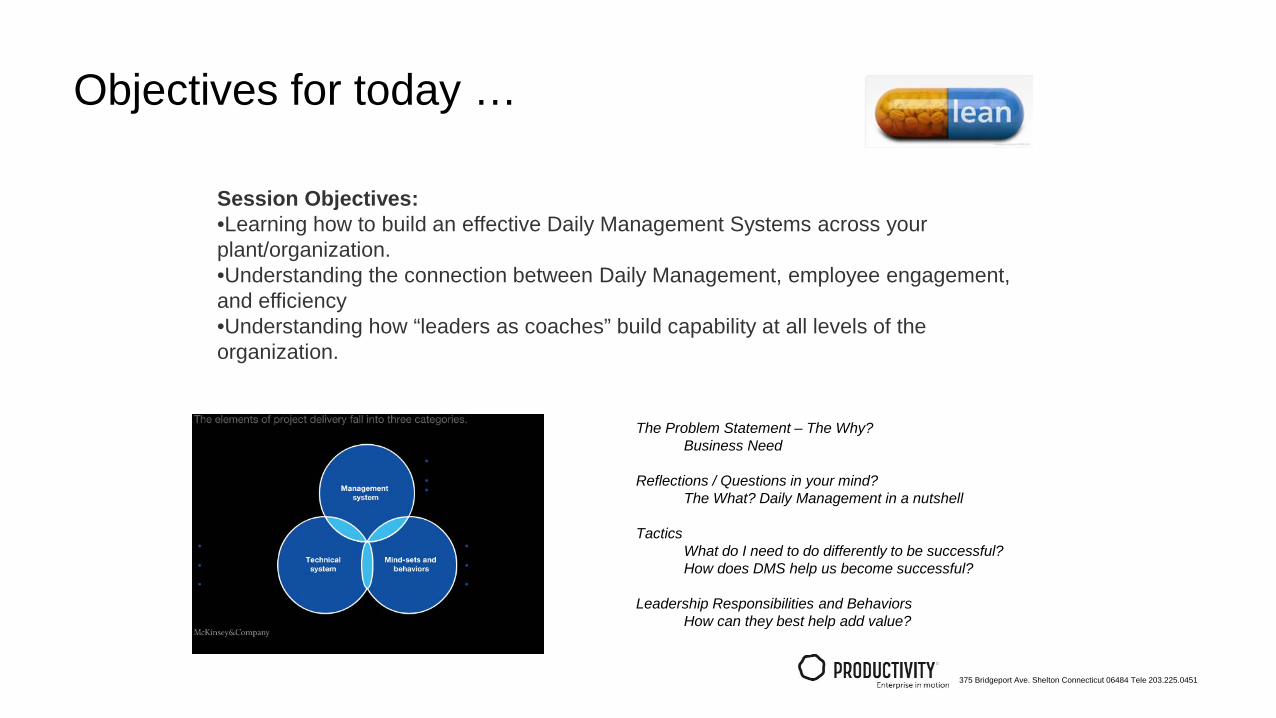
Session Objectives:•Learning how to build an effective Daily Management Systems across your plant/organization.•Understanding the connection between Daily Management, employee engagement, and efficiency•Understanding how “leaders as coaches” build capability at all levels of the organization.
The Problem Statement – The Why?Business Need
Reflections / Questions in your mind?The What? Daily Management in a nutshell
TacticsWhat do I need to do differently to be successful?How does DMS help us become successful?
Leadership Responsibilities and BehaviorsHow can they best help add value?
375 Bridgeport Ave. Shelton Connecticut 06484 Tele 203.225.0451
I am working hard to make this happen …
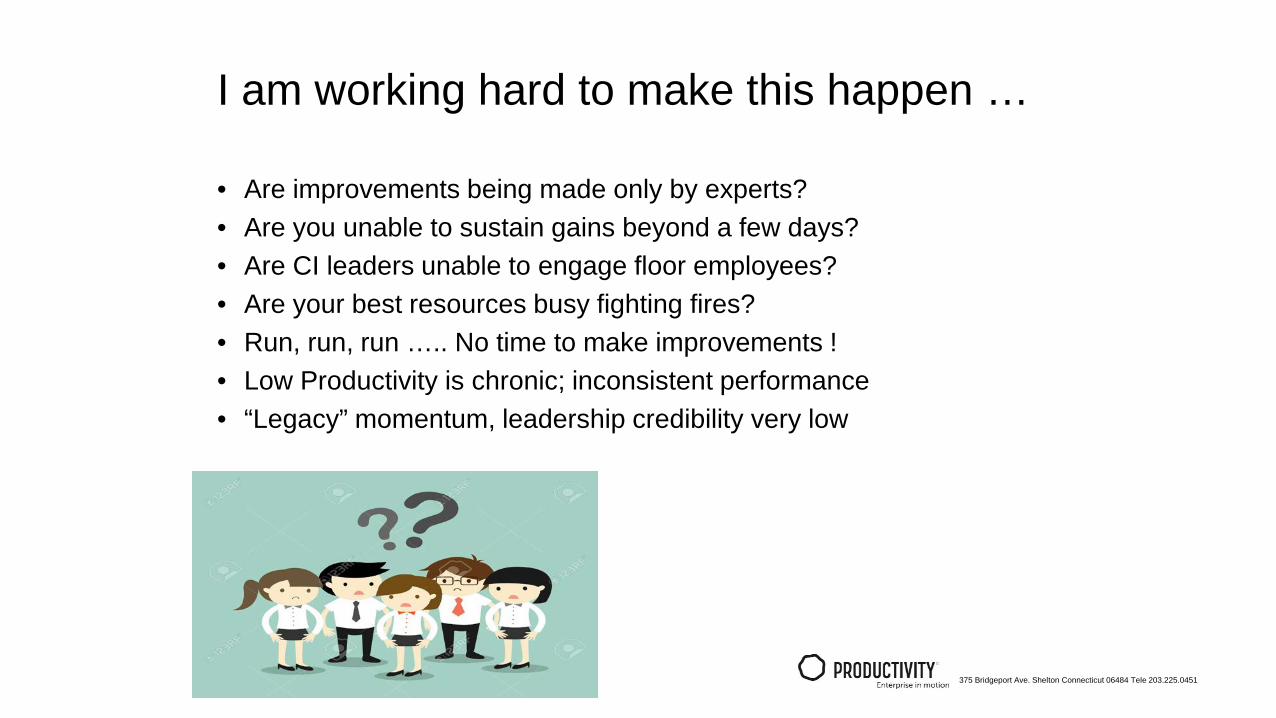
• Are improvements being made only by experts?• Are you unable to sustain gains beyond a few days? • Are CI leaders unable to engage floor employees?• Are your best resources busy fighting fires?• Run, run, run ….. No time to make improvements !• Low Productivity is chronic; inconsistent performance • “Legacy” momentum, leadership credibility very low
375 Bridgeport Ave. Shelton Connecticut 06484 Tele 203.225.0451
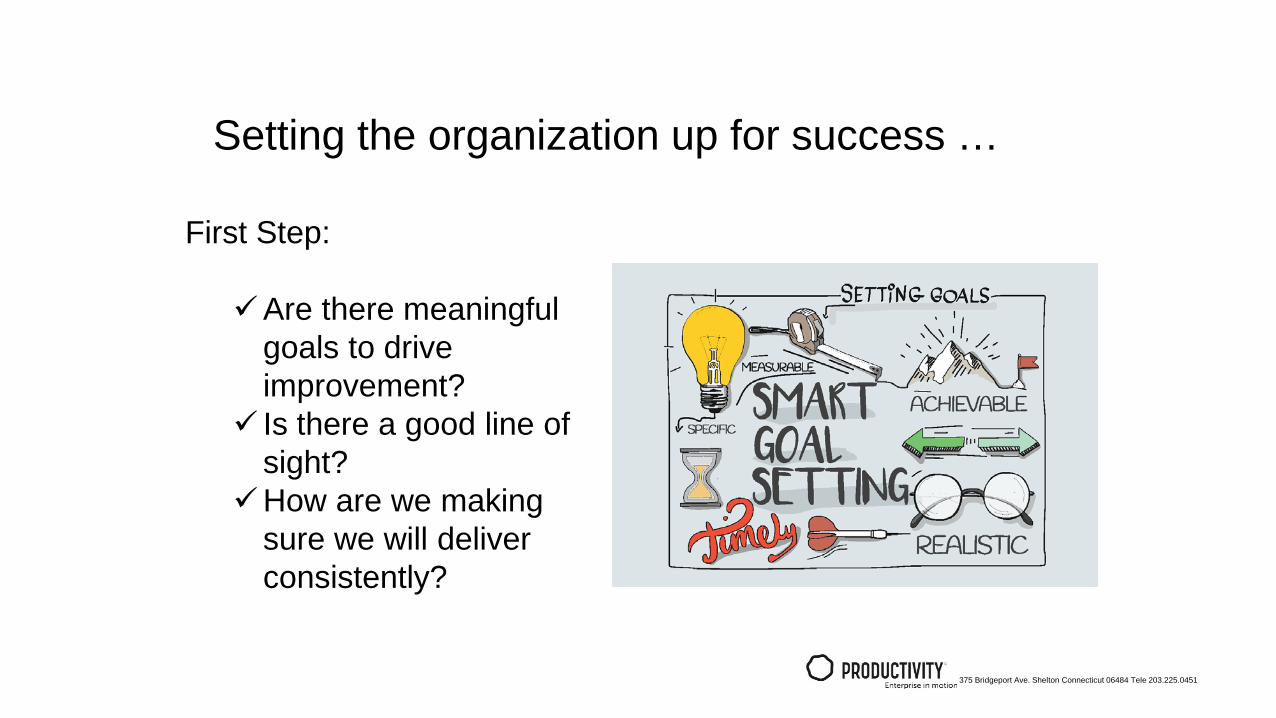
First Step:
Are there meaningful goals to drive improvement?
Is there a good line of sight?
How are we making sure we will deliver consistently?
Setting the organization up for success …

375 Bridgeport Ave. Shelton Connecticut 06484 Tele 203.225.0451
Aligns the Organization on solving what matters mostProvides a Sense of Purpose for all
Strategy (Policy) Deployment

375 Bridgeport Ave. Shelton Connecticut 06484 Tele 203.225.0451
Danaher Strategy Example …

375 Bridgeport Ave. Shelton Connecticut 06484 Tele 203.225.0451
CustomerQCD
Objectives
Integrated goals across the organization …
Sales Customer Service
R&D QualityMarketing
New KPI’s: … New KPI’s: …
Supply Chain Production
New KPI’s: … New KPI’s: … New KPI’s: … New KPI’s: … New KPI’s: …
All functions, departments, processes and people must constantly improve

375 Bridgeport Ave. Shelton Connecticut 06484 Tele 203.225.0451
Business Model, Vision and Strategy
Level 0Executive committee
How much(Impact)
Strategic Actions
Target(How much)
Level 1: VP/Directors
and their teams
AS(What)
Initiatives (How)
How much(Target)
How much
(Impact)
Level 2: Managers and team members
Initiatives(What)
Actions (How)
How much(Impact)
How much (Target)
KVD(What)
catchball
The Strategy Deployment CascadeCreate a Compelling Business Need (CBN)

375 Bridgeport Ave. Shelton Connecticut 06484 Tele 203.225.0451
10
The Catchball – Employee Engagement 101
• TOP DOWN– Proposed objectives and
milestones are presented– Employees:
• construct their own initiatives and milestones• give constructive feedback• present new facts and information
• BOTTOM UP– Proposed initiatives /
plans & milestones are presented
– Managers• give constructive feedback• present new facts and information• revise their own Matrix
• The result of catchball is team alignment at the operational level through the chartering, linking, and networking of teams

375 Bridgeport Ave. Shelton Connecticut 06484 Tele 203.225.0451
CBN* targets shoot for stretch improvements across all categories
Example: Plant / Unit XYZ
Create CBN goals
Metric Baseline3-year goal Rationale
Safety DART rate 3.52 0.52 25% reduction from Plant / Unit XYZ best
performance (0.69 in 2012) 2nd best in network, Monterrey (0.11)
Quality Consumer complaint ratio 2.40 1.7 Surpass Plant / Unit ABC becoming
number 4 in the network
CostLbs / labor hr 5.30% 3.2%
50% YoY reduction in stops 30% reduction in breakdowns 50% reduction in changeover time
40% reduction in In- Process defects 25% reduction in Re-work
Waste & overweight 124.93 152.79
Delivery Case fill rate 97.3% 98.5% Return to 2010 level sustained 98.5% case fill rate for the full year
Engagement Engagement score 46.7% 65%
11% annual increase by focusing on low performing categories
Surpass 2014 US manufacturing score of 54.2%
*CBN – Compelling Business Need

375 Bridgeport Ave. Shelton Connecticut 06484 Tele 203.225.0451
Principles of Strategy Deployment
From vision to daily work Can every member of your organization
explain the strategic objectives? Can they describe the link between their
daily work and the strategic objectives? Does everyone understand the metrics
they are working to improve? How do we progress beyond our daily
work?
A strong Daily Management System helps execute to achieve this “line of sight” ……
375 Bridgeport Ave. Shelton Connecticut 06484 Tele 203.225.0451
Strategy Deployment is great but ….

375 Bridgeport Ave. Shelton Connecticut 06484 Tele 203.225.0451
So let’s check a few “culture” boxes first ..Lean is a culture, not a set of tools
Serve value adding process owners – improve their work life Push decision making, ownership down to workplace Build capable, autonomous leaders in the organization Build a larger Problem Solving community through standards, tools
Embed real time analytics into Daily Work flows Stay laser focused on measures that matter Communicate information in an easy, visual way
Rewards and recognition

375 Bridgeport Ave. Shelton Connecticut 06484 Tele 203.225.0451
DMS aligns to Change Management Process framework
Daily Direction
Resources
Tools / Methods
375 Bridgeport Ave. Shelton Connecticut 06484 Tele 203.225.0451
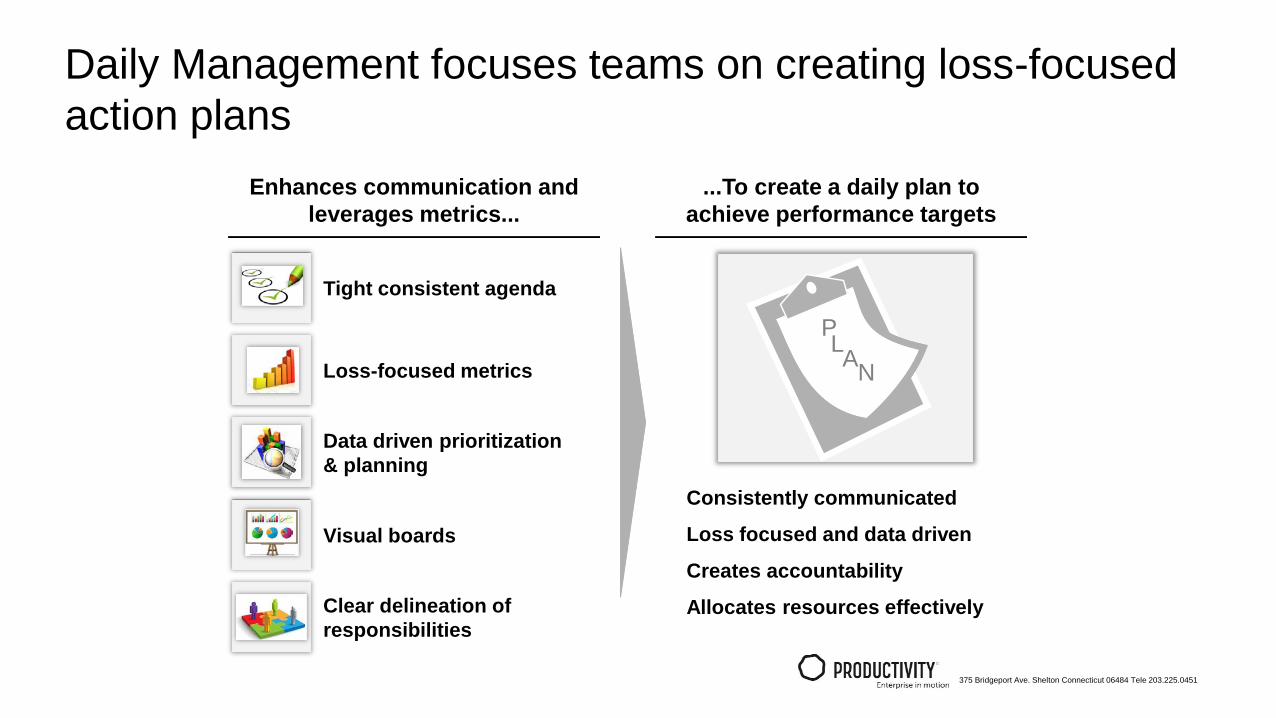
Daily Management focuses teams on creating loss-focused action plans
Tight consistent agenda
Loss-focused metrics
Data driven prioritization & planning
Visual boards
Clear delineation of responsibilities
Consistently communicated
Loss focused and data driven
Creates accountability
Allocates resources effectively
PLAN
Enhances communication and leverages metrics...
...To create a daily plan to achieve performance targets

375 Bridgeport Ave. Shelton Connecticut 06484 Tele 203.225.0451
From Reactive to Proactive ……Lean is a 80% cultural, 20% tools
• Undefined goals • Reacting / Fire fighting • Problems are hidden, no
data• Few experts solve problems• Blame, disengagement • Tribal knowledge• No room for new ideas,
change
• Measureable Objectives• Proactive management • Managing to standards• Problems are visible • Data-based problem solving • Leaders on floor solving
problems• Everyone is engaged in
solutions
375 Bridgeport Ave. Shelton Connecticut 06484 Tele 203.225.0451
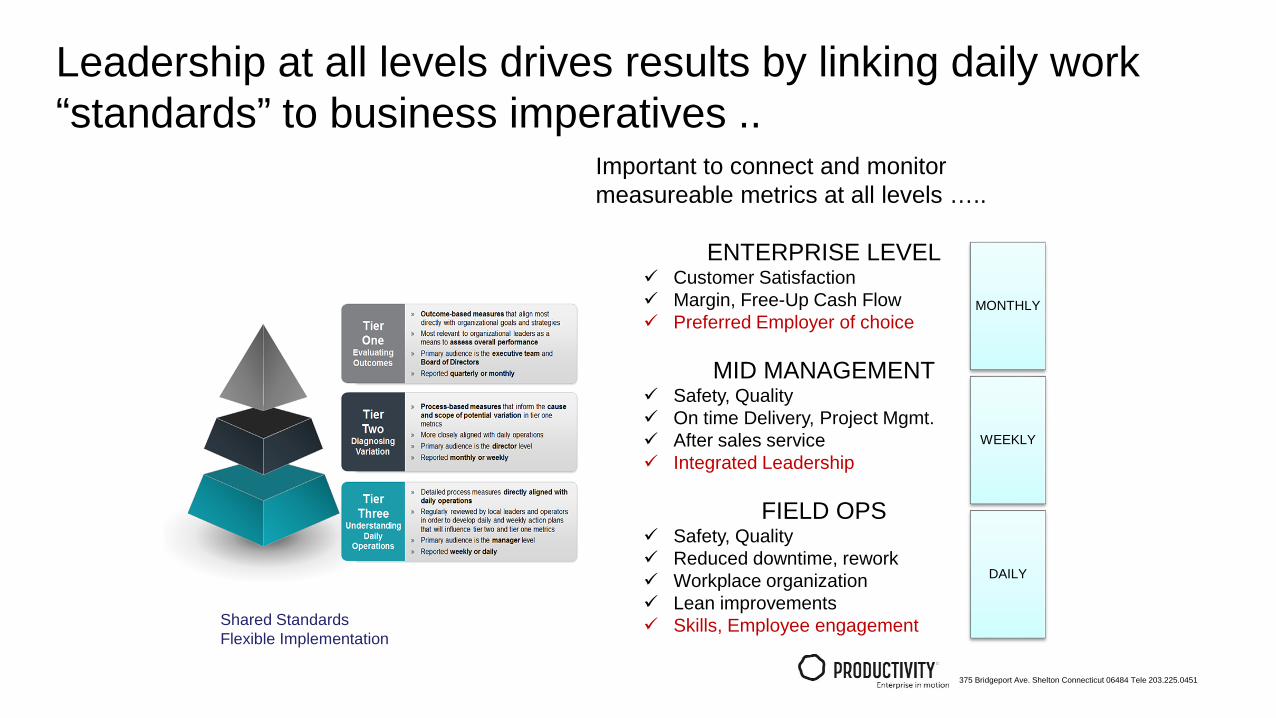
Leadership at all levels drives results by linking daily work “standards” to business imperatives ..
Important to connect and monitor measureable metrics at all levels …..
ENTERPRISE LEVEL Customer Satisfaction Margin, Free-Up Cash Flow Preferred Employer of choice
MID MANAGEMENT Safety, Quality On time Delivery, Project Mgmt. After sales service Integrated Leadership
FIELD OPS Safety, Quality Reduced downtime, rework Workplace organization Lean improvements Skills, Employee engagement Shared Standards
Flexible Implementation
MONTHLY
WEEKLY
DAILY
375 Bridgeport Ave. Shelton Connecticut 06484 Tele 203.225.0451
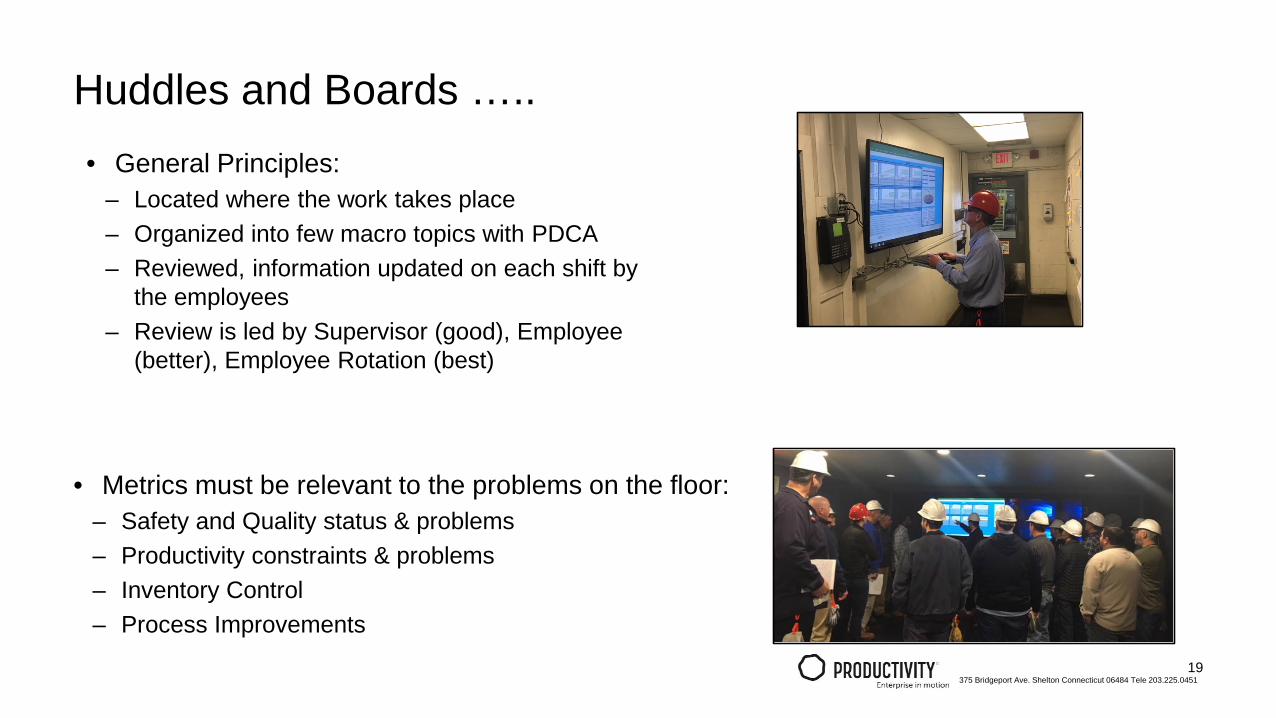
Huddles and Boards ….. • General Principles:
– Located where the work takes place– Organized into few macro topics with PDCA– Reviewed, information updated on each shift by
the employees– Review is led by Supervisor (good), Employee
(better), Employee Rotation (best)
19
• Metrics must be relevant to the problems on the floor:– Safety and Quality status & problems– Productivity constraints & problems– Inventory Control– Process Improvements

375 Bridgeport Ave. Shelton Connecticut 06484 Tele 203.225.0451
Daily Accountability• DMB’s allow anyone to know how the team is doing & what
needs to be worked on:
• …what went right today, what went wrong?• …what did we learn today?• …what are we going to do tomorrow to make it better?• …what help do we need?
20
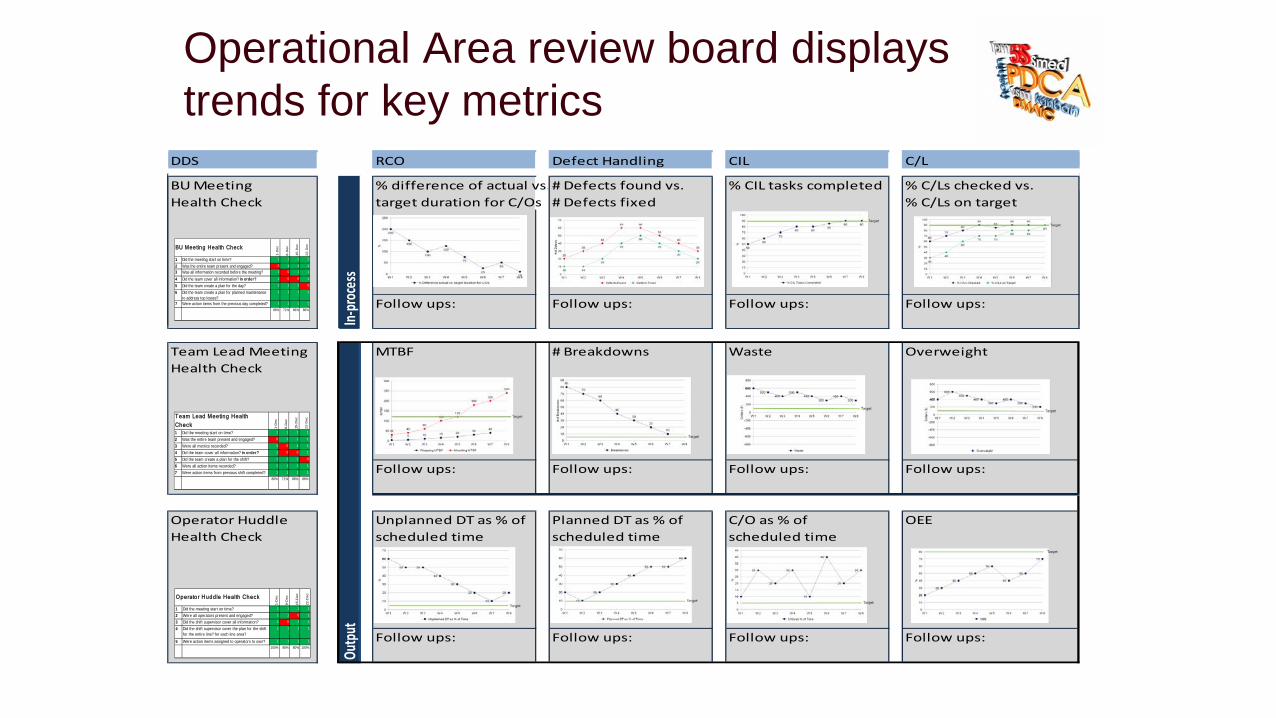
DDS Defect handling CIL C/L RCO
BU Meeting # Defects found vs. % CIL tasks completed % C/Ls checked vs. % difference of actual vs.Health Check # Defects fixed % C/Ls on target target duration for C/Os
Follow ups: Follow ups: Follow ups: Follow ups:
Team Lead Meeting MTBF # Breakdowns Waste OverweightHealth Check
Follow ups: Follow ups: Follow ups: Follow ups:
Operator Huddle Unplanned DT as % of Planned DT as % of C/O as % of OEEHealth Check scheduled time scheduled time scheduled time
Follow ups: Follow ups: Follow ups: Follow ups:
In-pr
oces
sOu
tput
DDS RCO Defect Handling CIL C/L
BU Meeting % difference of actual vs.# Defects found vs. % CIL tasks completed % C/Ls checked vs.Health Check target duration for C/Os # Defects fixed % C/Ls on target
Follow ups: Follow ups: Follow ups: Follow ups:
In-pr
oces
s
1-D
ec
8-D
ec
15-D
ec
22-D
ec
1 Did the meeting start on time? 1 1 1 1
2 Was the entire team present and engaged? 0 1 1 1
3 Were all metrics recorded? 1 0 1 1
4 Did the team cover all information? in order? 1 0 0 1
5 Did the team create a plan for the shift? 1 1 1 0
6 Were all action items recorded? 1 1 1 1
7 Were action items from previous shift completed? 1 1 1 1
86% 71% 86% 86%
Team Lead Meeting Health Check
1-D
ec
8-D
ec
15-D
ec
22-D
ec
1 Did the meeting start on time? 1 1 1 1
2 Were all operators present and engaged? 1 1 0 1
3 Did the shift supervisor cover all information? 1 0 1 1
4 Did the shift supervisor cover the plan for the shift for the entire line? for each line area?
1 1 1 1
5 Were action items assigned to operators to own? 1 1 1 1
100% 80% 80% 100%
Operator Huddle Health Check
1-D
ec
8-D
ec
15-D
ec
22-D
ec
1 Did the meeting start on time? 1 1 1 1
2 Was the entire team present and engaged? 0 1 1 1
3 Was all information recorded before the meeting? 1 0 1 1
4 Did the team cover all information? in order? 1 0 0 1
5 Did the team create a plan for the day? 1 1 1 0
6 Did the team create a plan for planned maintenance to address top losses?
1 1 1 1
7 Were action items from the previous day completed? 1 1 1 1
86% 71% 86% 86%
BU Meeting Health Check
Operational Area review board displays trends for key metrics

Dashboard records historical data for key metrics and tracks progress toward meeting targets
Line 1 Metric DashboardWeek 1 2 3 4 5 6Week Ending 1/4/2015 1/11/2015 1/18/2015 1/25/2015 2/1/2015 2/8/2015
In Process Measures Units Target: Comments:Time Spent on Changeovers hours Standard Hours 38 25 42 4 44 Completed 5 changeovers and an allergen clean.Time Scheduled for Changeovers (Standard Hours) hours 32 21 36 4 38
Time Scheduled for Changeovers (Using 2014 Avg durations) hours 51 36 56 5 62
Defects Found count 37 28 20 22 9 Notifications entered for fixing remaining defects.
Defects Fixed count Defects Found 9 19 13 11 6% of Defects that were Fixed % 100% 24% 68% 65% 50% 67%% CILs Completed % 100% 69% 89% 81% 90% 100% CILs scheduled at standard times on each shift.
% Centerlines Checked % 100% 60% 97% 100% 85% 92% 84% Scheduling huddles to discuss CL completion in the first hour of production. This will help avoid misses on short runs.% Centerlines on Target % 100% 48% 72% 93% 95% 90% 88%
Output Measures Units Target: Comments:MTBF Wrapping min TBD 1.97 1.90 3.08 3.51 2.62 2.46 MTBF was driven down by the large number of
changeovers and start-ups.MTBF Molding hours TBD 2.60 2.00 3.36 2.72 1.09# Breakdowns count 0 21 7 4 8 5 Top breakdown was wrapper #3 date coder.
OEE 2 % 62% 65.8% 54.7% 48.9% 48.5% 66.4% 34.5% Lower OEE driven by weather related downtime and changeovers.Line Efficiency % >100% 86.5% 112.0% 94.0% 107.2% 94.4% 111.2%
Training Progression - % Complete Units Target: Comments:Defect Handling % 100% 63.0% 67.0% 69.0%CILs % 100% 47.0% 49.0% 49.0%Centerlines % 100% 55.0% 69.0% 69.0%Changeovers % 100% 63.0% 63.0% 63.0%Business Impact Units Comments:Waste USD $195 $4,978 $2,496 $112 ($19,331) $12,260 Large waste positivity due to running Canadian items. We
continue to trend very well on OW%.Overweight USD $583 $1,031 $2,982 $2,300 $2,591 $1,572 Direct Labor Efficiency Variance USD ($1,569) $1,442 ($1,140) $2,323 ($1,803) $1,393 Changeover Time Reduced vs. Standard USD ($1,515) ($1,176) ($1,325) $0 ($1,416)Changeover Time Reduced vs. 2014 Average1 USD $3,448 $3,109 $4,117 $220 $4,824
Total USD ($791) $5,936 $3,162 $3,410 ($18,543) $13,809 Cumulative Total YTD ($791) $5,145 $8,307 $11,717 ($6,826) $6,983
375 Bridgeport Ave. Shelton Connecticut 06484 Tele 203.225.0451
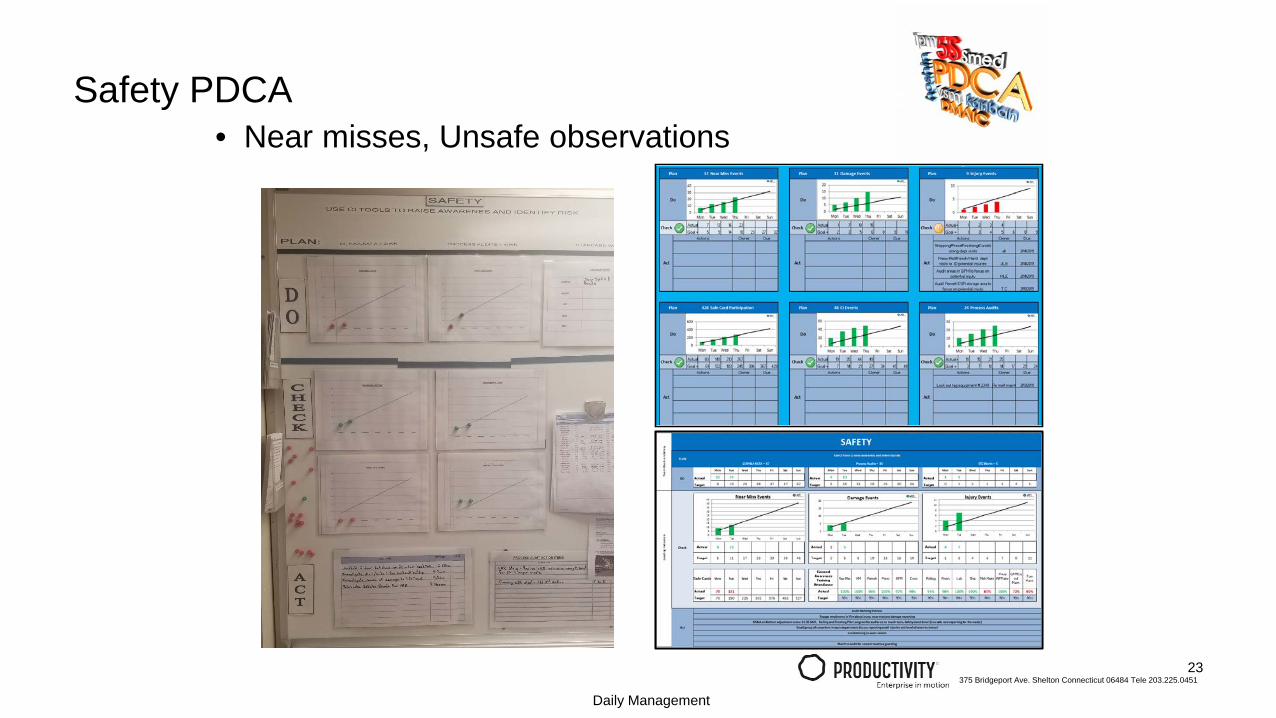
Safety PDCA• Near misses, Unsafe observations
23
Daily Management

375 Bridgeport Ave. Shelton Connecticut 06484 Tele 203.225.0451
375 Bridgeport Ave. Shelton Connecticut 06484 Tele 203.225.0451

375 Bridgeport Ave. Shelton Connecticut 06484 Tele 203.225.0451
How do I audit the DMB?
• Do actions specifically close the gap between actual & plan?• Are metrics presented in a visual way & can be understood by
someone outside the department?• Are the metrics relevant to the problems and aligned through to all
the process owners?• Do employees from upstream/downstream attend the DMB check?• Does peer coaching or teaching occur?• Are countermeasures included in standards and communicated?
26

375 Bridgeport Ave. Shelton Connecticut 06484 Tele 203.225.0451
Quality - Right First Time PDCA• Defects, Yield, Scrap, Errors
27
Daily Management
Daily 1 0 0 0 0 0 0 0 1 1
WTD 1 1 1 1 1 1 1 1 2 3
Goal 0 0 0 1 1 1 2 2 2 2 3 3 3 4
Act
TAKE BOX 93 & 96 TO MACHINE SHOP TO CHECK CYLINDERS
Action Owner
Check stopper rods setups J.F
DS
Plan Stopper Rod DDR's per week
Do
Check
4Less than
0112233445
F day F nt S day S nt S day S nt M day M nt T day T nt W day W nt T day T nt

375 Bridgeport Ave. Shelton Connecticut 06484 Tele 203.225.0451
Customer Service PDCAProductivity, Changeovers, Schedule Adherence
• Connects status of product throughput vs. plan
28
Non-Ops Examples:• Finance – Good management of cash• Human Resources – Open positions filled to
meet staffing requirements• Engineering – Capital projects closed on time
to budget
375 Bridgeport Ave. Shelton Connecticut 06484 Tele 203.225.0451
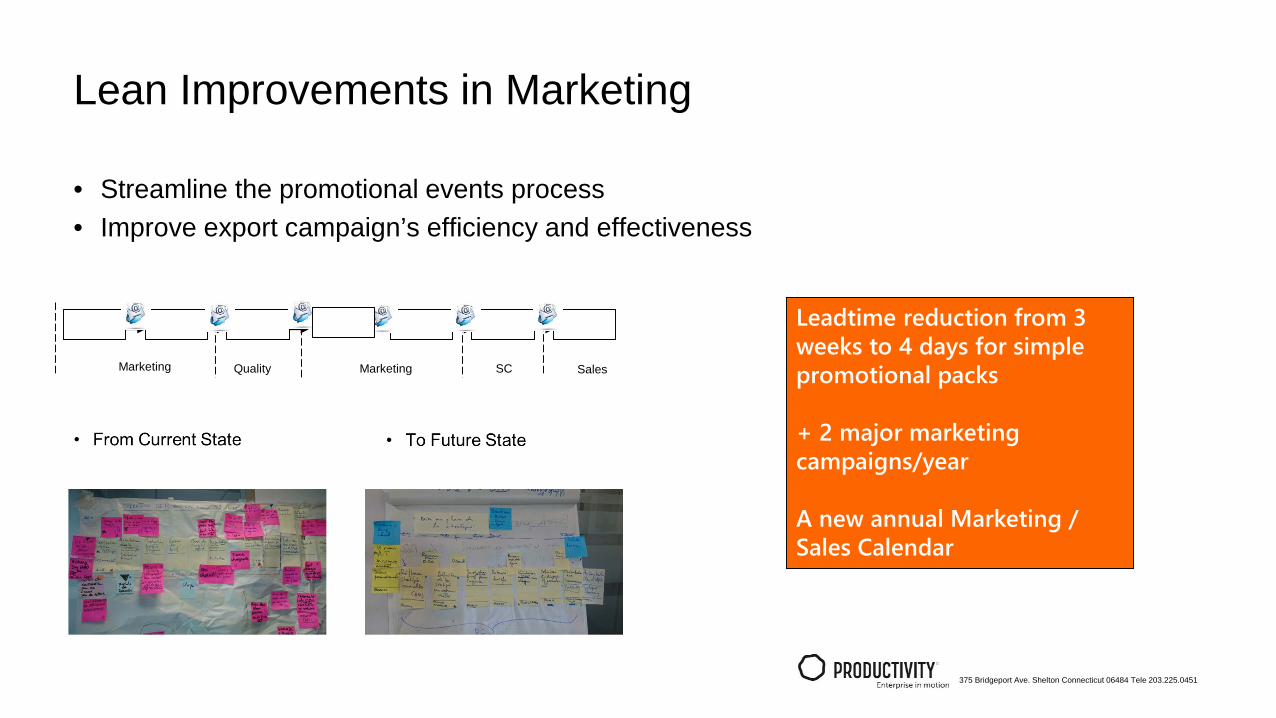
Lean Improvements in Marketing
• Streamline the promotional events process• Improve export campaign’s efficiency and effectiveness
Leadtime reduction from 3 weeks to 4 days for simple promotional packs
+ 2 major marketing campaigns/year
A new annual Marketing / Sales Calendar
Marketing Quality Marketing SC Sales

Daily Management can be implemented in each Department: Customer Service – Laboratory – Marketing and Sales – HR – Finance …
375 Bridgeport Ave. Shelton Connecticut 06484 Tele 203.225.0451
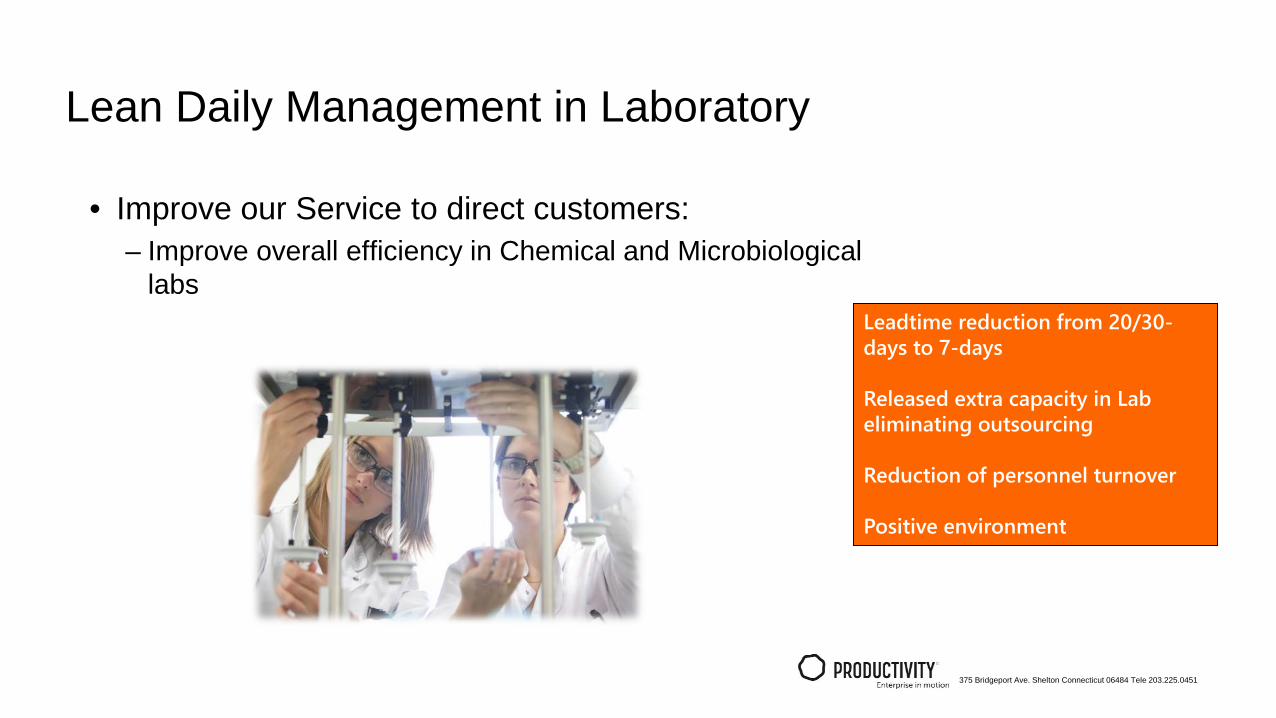
Lean Daily Management in Laboratory
• Improve our Service to direct customers:– Improve overall efficiency in Chemical and Microbiological
labsLeadtime reduction from 20/30-days to 7-days
Released extra capacity in Labeliminating outsourcing
Reduction of personnel turnover
Positive environment
375 Bridgeport Ave. Shelton Connecticut 06484 Tele 203.225.0451
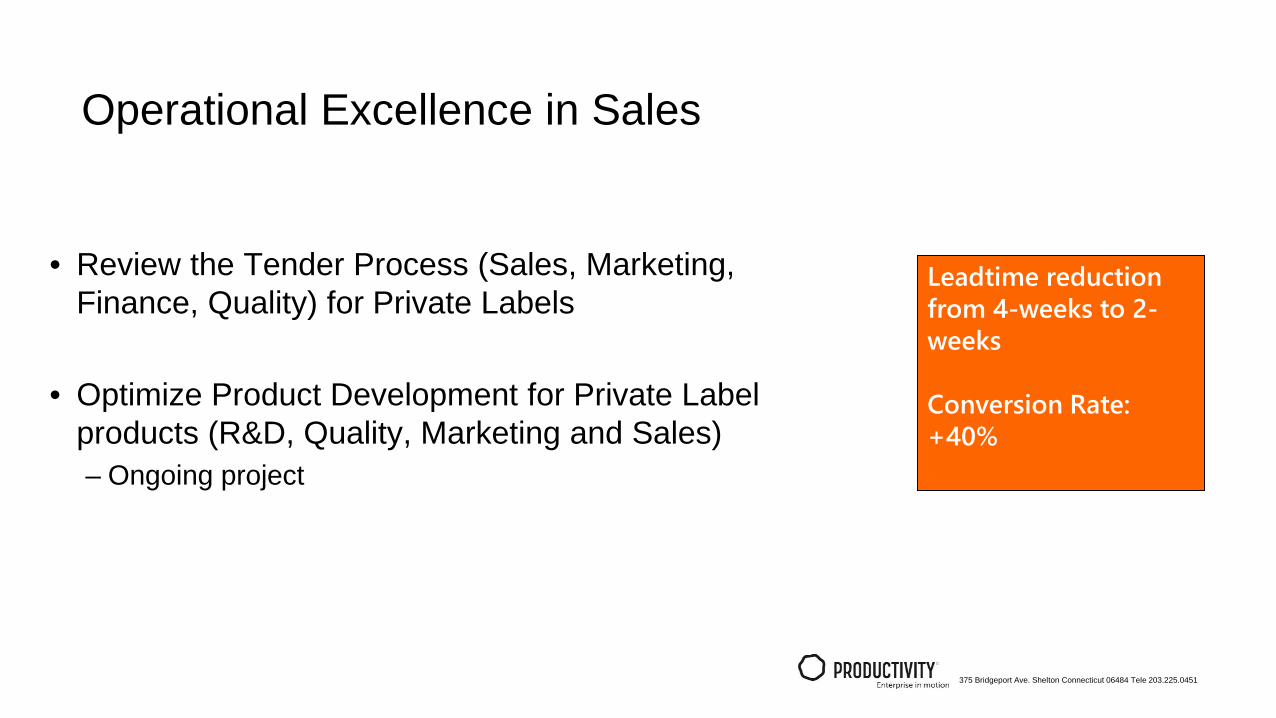
Operational Excellence in Sales
• Review the Tender Process (Sales, Marketing, Finance, Quality) for Private Labels
• Optimize Product Development for Private Label products (R&D, Quality, Marketing and Sales)– Ongoing project
Leadtime reduction from 4-weeks to 2-weeks
Conversion Rate: +40%

375 Bridgeport Ave. Shelton Connecticut 06484 Tele 203.225.0451
Lean in HR>The Challenge: reduce time spent in
administrative activities (from beginning to the end of employee contract) to increase time available for Business and managers support.
Creation of shared standards
Reduction of anomalies and leadtimeon payrolls
Introduction of new software
Full compliance to legislation for all contracts
HR backup teams between sites…

375 Bridgeport Ave. Shelton Connecticut 06484 Tele 203.225.0451
Role of Leadership ….
• Understand the customer, their needs for the foreseeable future• Declare a “Compelling Business Need” with aggressive 2-3 year goals for
improvement (Safety, Quality, Service, Cost, Employee Engagement)• Cascade these goals as the only goals with which to measure organizational
performance• “Front load” top talent, $$, capital at every site to assist / deploy the
methodologies• Be accountable to the results, metrics directly linked to Lean results• Institutionalize tools and terminology and apply them in daily work
375 Bridgeport Ave. Shelton Connecticut 06484 Tele 203.225.0451
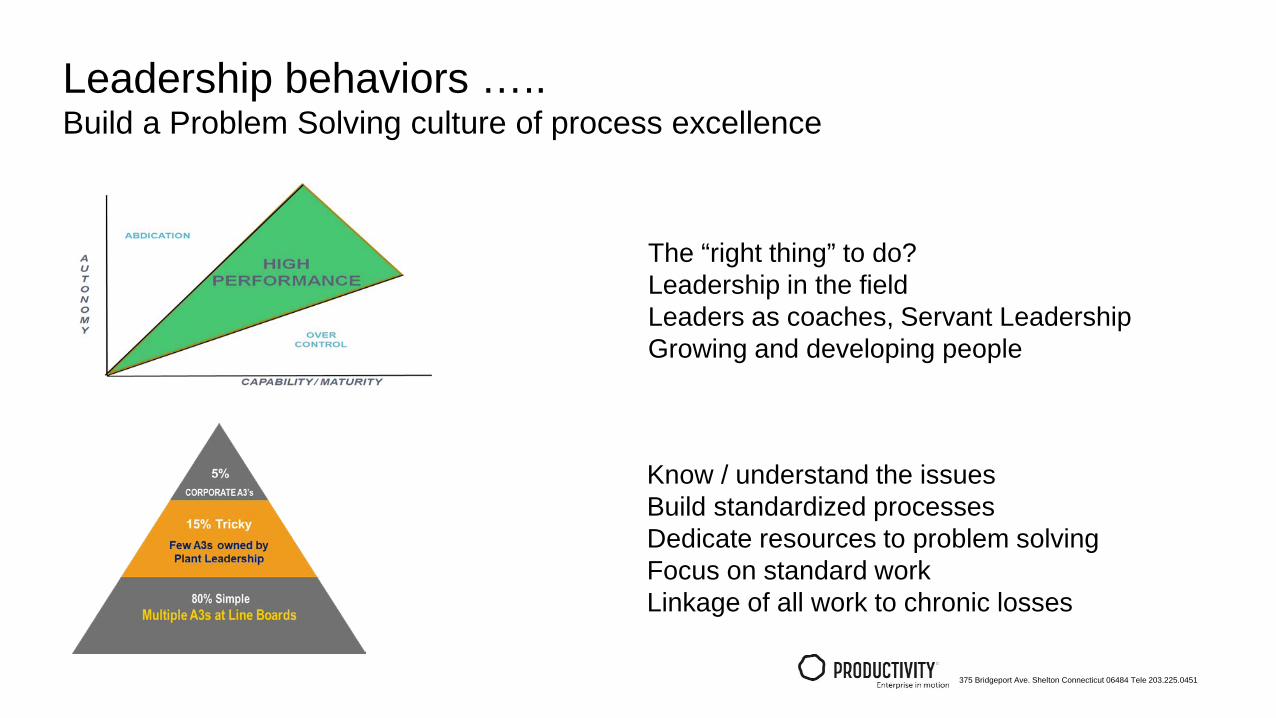
Leadership behaviors …..Build a Problem Solving culture of process excellence
The “right thing” to do? Leadership in the fieldLeaders as coaches, Servant Leadership Growing and developing people
Know / understand the issuesBuild standardized processesDedicate resources to problem solving Focus on standard workLinkage of all work to chronic losses

375 Bridgeport Ave. Shelton Connecticut 06484 Tele 203.225.0451
Leadership Behaviors - Servant Leadership Invert the Org Chart, Build a Problem Solving culture

375 Bridgeport Ave. Shelton Connecticut 06484 Tele 203.225.0451
Leadership Behaviors - Daily Management
Leadership must show daily routines that take care of the people whotake care of the customers
Leaders as teachers, going into the workplace with purpose
Daily rigor, structured communication, and ever evolving standard work
Ensure that leadership aspirations are directly aligned with daily work

375 Bridgeport Ave. Shelton Connecticut 06484 Tele 203.225.0451 Title of Presentation
38
375 Bridgeport Ave. Shelton Connecticut 06484 Tele 203.225.0451
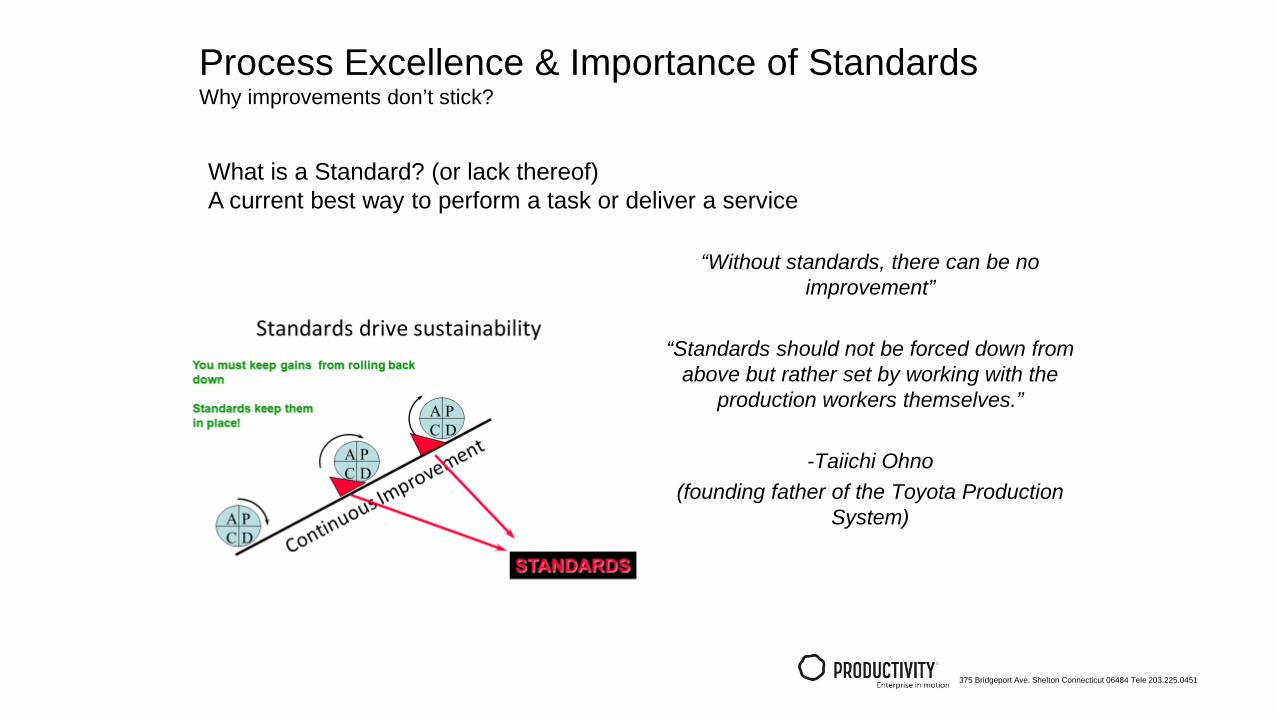
Process Excellence & Importance of StandardsWhy improvements don’t stick?
“Without standards, there can be no improvement”
“Standards should not be forced down from above but rather set by working with the
production workers themselves.”
-Taiichi Ohno(founding father of the Toyota Production
System)
What is a Standard? (or lack thereof)A current best way to perform a task or deliver a service
375 Bridgeport Ave. Shelton Connecticut 06484 Tele 203.225.0451
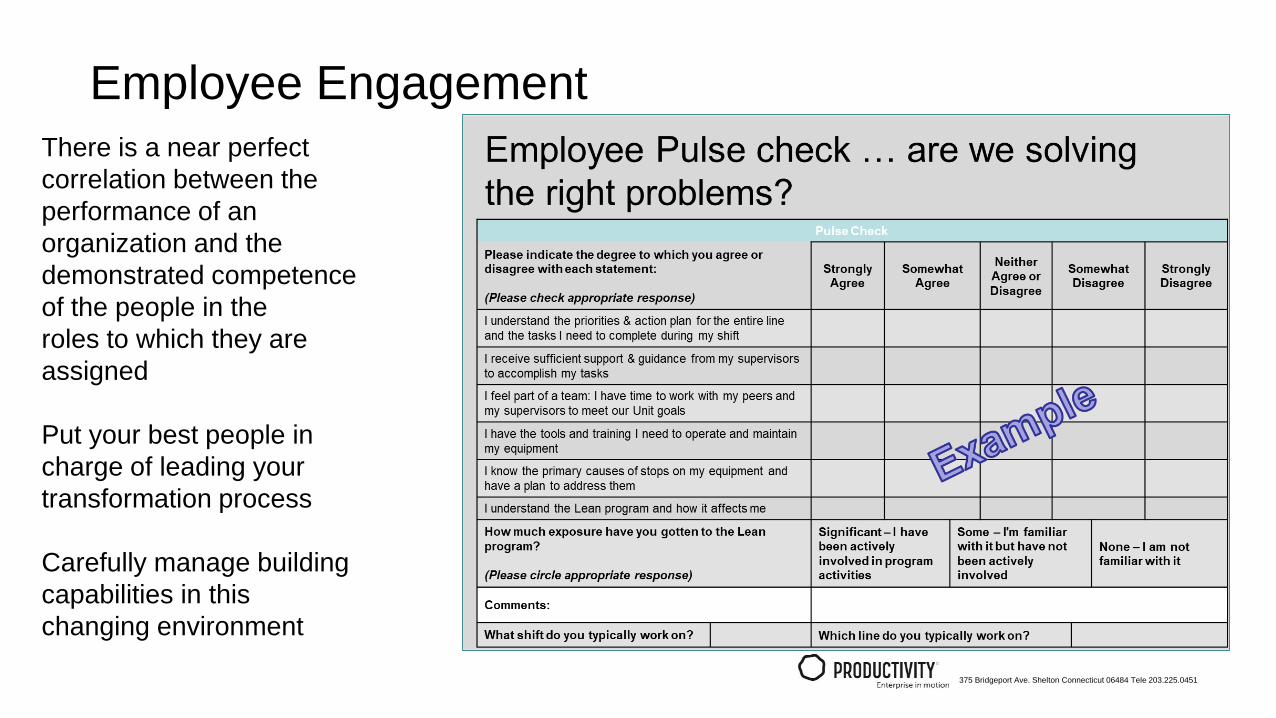
Employee EngagementThere is a near perfect correlation between the performance of an organization and the demonstrated competence of the people in theroles to which they are assigned
Put your best people in charge of leading your transformation process
Carefully manage building capabilities in this changing environment

375 Bridgeport Ave. Shelton Connecticut 06484 Tele 203.225.0451
Q&A
Related Documents