This article was downloaded by: [Univ Studi Basilicata] On: 05 July 2012, At: 03:17 Publisher: Taylor & Francis Informa Ltd Registered in England and Wales Registered Number: 1072954 Registered office: Mortimer House, 37-41 Mortimer Street, London W1T 3JH, UK Plant Biosystems - An International Journal Dealing with all Aspects of Plant Biology: Official Journal of the Societa Botanica Italiana Publication details, including instructions for authors and subscription information: http://www.tandfonline.com/loi/tplb20 Leaf area, light environment, and gas exchange in Montepulciano grapevines trained to Tendone trellising system P. Giorio a & V. Nuzzo b a Consiglio Nazionale delle Ricerche – Istituto per i Sistemi Agricoli e Forestali del Mediterraneo (CNR-I.S.A.FO.M.), via Patacca, 85, 80056 - Ercolano, Naples, Italy b Dipartimento di Scienze dei Sistemi Colturali, Forestali e dell'Ambiente, Università degli Studi della Basilicata, Viale dell'Ateneo Lucano, 10, 85100, Potenza, Italy Version of record first published: 04 Jul 2011 To cite this article: P. Giorio & V. Nuzzo (2012): Leaf area, light environment, and gas exchange in Montepulciano grapevines trained to Tendone trellising system, Plant Biosystems - An International Journal Dealing with all Aspects of Plant Biology: Official Journal of the Societa Botanica Italiana, 146:2, 322-333 To link to this article: http://dx.doi.org/10.1080/11263504.2011.557095 PLEASE SCROLL DOWN FOR ARTICLE Full terms and conditions of use: http://www.tandfonline.com/page/terms-and-conditions This article may be used for research, teaching, and private study purposes. Any substantial or systematic reproduction, redistribution, reselling, loan, sub-licensing, systematic supply, or distribution in any form to anyone is expressly forbidden. The publisher does not give any warranty express or implied or make any representation that the contents will be complete or accurate or up to date. The accuracy of any instructions, formulae, and drug doses should be independently verified with primary sources. The publisher shall not be liable for any loss, actions, claims, proceedings, demand, or costs or damages whatsoever or howsoever caused arising directly or indirectly in connection with or arising out of the use of this material.

Welcome message from author
This document is posted to help you gain knowledge. Please leave a comment to let me know what you think about it! Share it to your friends and learn new things together.
Transcript
This article was downloaded by: [Univ Studi Basilicata]On: 05 July 2012, At: 03:17Publisher: Taylor & FrancisInforma Ltd Registered in England and Wales Registered Number: 1072954 Registered office: Mortimer House,37-41 Mortimer Street, London W1T 3JH, UK
Plant Biosystems - An International Journal Dealingwith all Aspects of Plant Biology: Official Journal of theSocieta Botanica ItalianaPublication details, including instructions for authors and subscription information:http://www.tandfonline.com/loi/tplb20
Leaf area, light environment, and gas exchange inMontepulciano grapevines trained to Tendone trellisingsystemP. Giorio a & V. Nuzzo ba Consiglio Nazionale delle Ricerche – Istituto per i Sistemi Agricoli e Forestali delMediterraneo (CNR-I.S.A.FO.M.), via Patacca, 85, 80056 - Ercolano, Naples, Italyb Dipartimento di Scienze dei Sistemi Colturali, Forestali e dell'Ambiente, Università degliStudi della Basilicata, Viale dell'Ateneo Lucano, 10, 85100, Potenza, Italy
Version of record first published: 04 Jul 2011
To cite this article: P. Giorio & V. Nuzzo (2012): Leaf area, light environment, and gas exchange in Montepulciano grapevinestrained to Tendone trellising system, Plant Biosystems - An International Journal Dealing with all Aspects of Plant Biology:Official Journal of the Societa Botanica Italiana, 146:2, 322-333
To link to this article: http://dx.doi.org/10.1080/11263504.2011.557095
PLEASE SCROLL DOWN FOR ARTICLE
Full terms and conditions of use: http://www.tandfonline.com/page/terms-and-conditions
This article may be used for research, teaching, and private study purposes. Any substantial or systematicreproduction, redistribution, reselling, loan, sub-licensing, systematic supply, or distribution in any form toanyone is expressly forbidden.
The publisher does not give any warranty express or implied or make any representation that the contentswill be complete or accurate or up to date. The accuracy of any instructions, formulae, and drug doses shouldbe independently verified with primary sources. The publisher shall not be liable for any loss, actions, claims,proceedings, demand, or costs or damages whatsoever or howsoever caused arising directly or indirectly inconnection with or arising out of the use of this material.

Leaf area, light environment, and gas exchange in Montepulcianograpevines trained to Tendone trellising system
P. GIORIO1 & V. NUZZO2
1Consiglio Nazionale delle Ricerche – Istituto per i Sistemi Agricoli e Forestali del Mediterraneo (CNR-I.S.A.FO.M.), via
Patacca, 85, 80056 - Ercolano, Naples, Italy and 2Dipartimento di Scienze dei Sistemi Colturali, Forestali e dell’Ambiente,
Universita degli Studi della Basilicata, Viale dell’Ateneo Lucano, 10, 85100 - Potenza, Italy
AbstractCanopy light interception (CPFDInt), spectral irradiance, leaf water potential, gas- exchange and optical properties weremeasured in an irrigated vineyard (Vitis vinifera L. cv Montepulciano) trained to the so-called tendone system in which leafarea index (LAI) was varied by means of 50% (T50) or 75% (T75) cluster removal. The 20.5 t ha71 yield in the unthinnedtreatment (UT) decreased by only 36% in T50 and by 52% in T75. LAI and CPFDInt similarly increased until summerpruning when LAI was 1.75 m2 m72 in UT, and 25.6% or 62.2% higher in T50 and T75, respectively. The two thinnedtreatments had only 12.4% higher CPFDInt than in UT (1167.1 mmol m72 s71) due to the increased leaf self-shading. Thered-to-far red ratio (R: FR) was as low as 0.10 below the canopy. Light-saturated CO2 assimilation (Amax) in June averaged14.4 mmol m72 s71 in sun-exposed leaves, and 7.6 mmol m72 s71 in shade leaves. By contrast, the apparent quantum yieldof CO2 assimilation (fe) was not significantly affected by leaf position, averaging 0.029 and 0.070 mol mol71 in June andOctober, respectively. Middle and low canopy leaves had only 27 or 6%, respectively, of the top canopy leaves actual CO2
assimilation rate.
Keywords: Radiation capture, leaf photosynthesis, stomatal conductance, A/Q curve, spectral irradiance
Abbreviations: A, net CO2 assimilation rate; CPFDInt, canopy light interception; F, spectral irradiance; gs,stomatal conductance to water vapor; LAI, leaf area index; PFD, photosynthetically active photon flux density; LCP,light compensation point; Rd, dark respiration; R:FR, red-to-far red ratio; cl, leaf water potential; fe, apparentquantum yield of CO2 assimilation; a, absorptance; t, transmittance; r, reflectance
Introduction
Vine dry matter accumulation is largely driven by
canopy photosynthesis, which is strongly determined
by leaf area and its capacity to intercept and use solar
radiation (Kliewer & Dokoozlian 2005). Since the
early 1960s, a threshold for annual crops has been
reported beyond which leaf area index (LAI, m2
m72) is no longer linked to dry matter production
because of the mutual shading among leaves in the
canopy profile. Since then, solar radiation inter-
cepted by the canopy has been used as a robust
estimation of crop dry mass production (Monteith
1994). In contrast to light interception, LAI above a
certain threshold results in a large over-estimation of
the actual canopy source potential in vineyards, as in
annual crops. The increase in vineyard light inter-
ception is strictly correlated with LAI during the
early shoot-growing season, while later this relation-
ship persists in conventional pruning (CP) systems,
but is disrupted in minimal pruning systems as leaves
undergo mutual self-shading (Intrieri et al. 2001). In
fact, training and trellising systems strongly affect
vineyard canopy–light interaction (Smart 1973,
1985; Dokoozlian & Kliewer 1995).
Shade canopy experiments have shown eco-phy-
siological adaptation of grapevine leaves to the
radiation regime. The light response of leaf photo-
synthesis (A/Q curve) in simple cordon grapevines
grown under shaded environments showed increased
apparent quantum yield of CO2 assimilation (fe, mol
mol71) and decreased light-saturated CO2
Correspondence: P. Giorio, Consiglio Nazionale delle Ricerche Istituto per i Sistemi Agricoli e Forestali del Mediterraneo (CNR-I.S.A.FO.M.), via Patacca,
85, 80056 - Ercolano, Naples, Italy. Email: [email protected]
Plant Biosystems, Vol. 146, No. 2, June 2012, pp. 322–333
ISSN 1126-3504 print/ISSN 1724-5575 online ª 2012 Societa Botanica Italiana
http://dx.doi.org/10.1080/11263504.2011.557095
Dow
nloa
ded
by [
Uni
v St
udi B
asili
cata
] at
03:
17 0
5 Ju
ly 2
012
assimilation (Amax, mmol m72 s71), dark respiration
(Rd, mmol m72 s71), light compensation point
(LCP, mmol m72 s71), and saturating photosyn-
thetic photon flux density (PFD, mmol m72 s71)
compared to vines grown under full light (Palliotti
et al. 2000). As a consequence, most canopy
photosynthesis is due to direct light absorbed by
the exterior canopy leaves (Smart 1974). Thus, the
trade-off between light interception and the photo-
synthetic light response within the different canopy
leaf layers determines the overall conversion effi-
ciency of solar energy into chemical energy, namely
the vine potential productivity.
The Italian tendone (large tent) is an overhead
horizontal undivided canopy trellising system quite
common in southern Italy for both wine- and table-
grape production (de Palma & Novello 2004; Rana
et al. 2004). This system was developed, around the
end of the 19th century, from the capanna (hut)
system, a pergola type system used in central Italy
(Fanelli 1965). These systems were designed to reduce
the number of vines per hectare in order to allow for
soil mechanization, avoid physical contact of table
grape berries with leaves, shoots and tendrils, protect
clusters from sunburn, heavy showers and hail, and
protect canes from freezing or snow (Fanelli 1965).
Tendone canopies achieve a full surface ground cover
(Smart 1985). Under these conditions, all the incom-
ing light hits the canopy surface while virtually no
direct light can reach the ground. In rectangular
canopies, this feature can only be approximated by
minimizing the distance between vines (Smart 1973).
On the other hand, the leaf area directly exposed to
solar radiation is minimized in horizontal canopies as
compared with other trellising systems, which is the
opposite of what is required to increase light energy
available for photosynthesis so as to enhance yield
(Smart 1973, 1974, 1985). Not surprisingly, vineyards
with moderate shoot vigour resulting in open canopies
were given the best ratings in the 80-point scoring-
system evaluation of vineyard balance (leaf area- to-
yield ratio) and potential fruit quality (Smart &
Robinson 1991; Kliewer & Dokoozlian 2005). As
regards direct solar radiation, in the tendone system
there is no mutual shading between leaves in different
outer-surface canopy zones during the daytime, but
only a continuous lower leaf layer shading by upper
layers. Compared with the top surface leaves, the lower
shoot leaves in tendone canopies actually experience,
during most of their mature life, a shaded environ-
ment, which can be described by both the spectrum of
radiation and the red- to-far red (R: FR) ratio
(Dokoozlian & Kliewer 1995). Summer pruning is a
standard operation adopted in tendone canopies. Such
a technique reduces leaf shading to facilitate ventilation
in the fruit zone (de Palma & Novello 2004), controls
excessive cluster shading, and avoids contact of table
grapes with other organs. Cluster- and leaf-shading in
wine grape vineyards clearly may have negative effects
on yield, berry composition, and wine quality (Smart
1985; Morrison & Noble 1990). However, a shaded
environment in the fruit-zone, when not excessive, can
have positive effects on table grape ripening since it
prevents irregular berry skin pigmentation and sun-
burn (de Palma & Novello 2004).
Grapevines trained to tendone are considered
capable of good yields (Fanelli 1965; de Palma &
Novello 2004). However, despite the relevant eco-
nomic importance of such vineyards in southern Italy
(Rana et al. 2004), there is little or no literature on
canopy light interception (CPFDInt), light response
of leaf photosynthesis, and the effect of leaf position
within tendone vineyards.
In a red wine grape (cv Montepulciano) commer-
cial vineyard trained to tendone in southern Italy, LAI
evolution was varied by means of early cluster
thinning, which also affected the yield. We studied
CPFDInt in relation to LAI, light quality along the
canopy profile, and the photosynthetic light response
(A/Q curve), and optical properties in both sun-
exposed and shade leaves.
Materials and methods
Vineyard information and experimental design
The trial was carried out in 2002 in a drip-irrigated
6-year old Vitis vinifera L. cv Montepulciano vine-
yard with plants grafted on V. berlandieri Planch. x V.
rupestris Scheele (1103 P). The experimental site was
in the Metaponto (MT) plain of southern Italy (N
408 200, E 168 480, elevation 50 m asl). The soil was a
clay-loam, classified as a ‘‘typic haploxealf fine
loamy, mixed, semiactive, thermic’’ with depths of
2 m or more. The vineyard had rows oriented SE to
NW (2208 390) with vines spaced 2.5 m6 2.5 m,
giving a plant density of 1600 vines per hectare. The
vines with two arms, and two canes per arm, were
pruned to 10 buds per cane, and trained to the
tendone system, forming a complete overhead canopy
with free-standing shoots. The vine trunks were tied
to vertical tutors used to support a horizontal wire
grid, thus allowing shoots to spread above all over the
ground surface at a height of 1.8–2.2 m where most
of the leaf area was found.
Three cluster thinning treatments were established
in 2001 and repeated in 2002 immediately after fruit
set as follows: the unthinned (UT) control having
about two clusters per shoot, and two thinned
treatments having one cluster per shoot (T50) or
one cluster per two shoots (T75). The three thinning
treatments were imposed in a randomized complete
block design. There were three replicates for each
treatment in two adjacent rows (15 vines/row)
Light environment and gas exchange in Tendone grapevines 323
Dow
nloa
ded
by [
Uni
v St
udi B
asili
cata
] at
03:
17 0
5 Ju
ly 2
012

with five vines per replicate. On 6 July 2002 (berry
pea-sized), the vineyard was subjected to a standard
summer pruning operation by the partial removal of
most shade-leaves, unproductive shoots, and the
vigorous basal lateral shoots. In the previous year, the
same vines had been subjected to the same cluster
thinning and summer pruning.
Meteorological data were obtained from a station
of the ‘‘Agenzia Lucana per lo Sviluppo ed Innova-
zione in Agricoltura’’ located 15 km away. We chose
an irrigated vineyard, and monitored leaf water
potential to make our results comparable with other
experiments.
Yield and leaf area estimation
Clusters were harvested when the average soluble
solids of the vineyards were about 208 Brix as
determined by the ordinary criteria of the Metaponto
plain, and were counted and weighed on a vine-by-
vine basis. Soluble solids were determined from berry
juice by using a hand-held model MT032ATC
refractometer (TCW Equipment, Saint Helena, CA).
Canopy leaf area evolution was estimated by
combining destructive and non-destructive methods.
We discriminated between main and laterals shoot
stems as they are differently affected by cluster
thinning, though such an effect is not investigated in
this article. At flowering, the total stem length (TSLf)
of both main and lateral stems of all shoots were
separately measured in vivo in each of nine vines per
treatment. From May to harvesting time, 6 to 8
shoots per treatment were collected, stored at about
38C in suitable protective bags, and quickly brought
to the laboratory to measure main and lateral stem
lengths (SL), and one-sided surface area of all leaves
on each stem (LA) by means of a Li-3100 photo-
metric area-integrating meter (LiCor, Lincoln, NE,
USA). A linear regression analysis was applied to the
relationship between LA and SL, which gave an R2
higher than 0.8. In addition, 6 to 8 more shoots per
treatment were selected and tagged to increase the
shoot number used to assess the ratio between stem
length at flowering (SLf) and during the season (SLi).
TSL in each vine during the season (TSLi) was
calculated as TSLi¼TSLf6SLi/SLf. Plant leaf area
(PLA) during the season was calculated as
PLA¼ ai6TSLi þ bi (where ai and bi are the
parameters of the linear regression as above), for
both main and lateral stems, which were summed
and then converted to LAI on the basis of the
vineyard plant density.
Light interception
Measurements of the PFD (expressed as mmol m72
s71, and taken from 400 to 700 nm) were carried out
around noon on cloudless days from May to Septem-
ber by using a linear Accupar 80 ceptometer (Decagon
Device Inc., Pullman, WA, USA). The ceptometer
had 80 sensors spaced at 1-cm intervals, and was
programmed to average readings of every 10 sensors
before logging data. The PFD transmitted through the
canopy (PFDT) was measured at 0.25 m above the
soil surface over a grid of 0.16 0.2 m2 across the area
allocated to three vines to obtain four replicates of the
incident light-intercepting canopy surface unit of 0–
1.25 m across, and 0–2.50 m along the row from the
vine trunk. Measurements were completed within
15 min for each treatment. The canopy transmitted
light, CPFDT, was obtained as the average of PFDT
over the grid points. The incident PFD (PFDI) was
calculated as the mean of 10 PFD measurements taken
above the canopy during PFDT measurements.
Intercepted PFD (PFDInt) for each point on the grid
was calculated as PFDI7PFDT. Diffused and re-
flected components were not considered. The canopy
intercepted light, CPFDInt, was obtained as the
average of PFDInt over the grid points, whereas the
fractional light interception, fi, was calculated as
CPFDInt/PFDI.
Light quality
The spectral distribution of solar radiation was
measured with a Li-1800 spectro-radiometer (Li-
Cor, Lincoln, NE, USA) equipped with the cosine
corrected sensor. The spectrum from 330 to 1100
nm was scanned every 2 nm wavelength. Data
measured were expressed as spectral irradiance (F,
W m72 nm71) or quanta flux density (Q, mmol m72
s71). The spectrum data were used to calculate the
R: FR ratio of quanta wavebands (654–666 nm, and
724–736 nm, respectively). Measurements were
taken on two sunny days after summer pruning on
five vertical positions: over the top canopy (2.2 m
height), two heights within the foliage (2.0 and
1.8 m), and two heights below the foliage (1.6 and
1.4 m) at 0.5 m from the vine along the row line. At
harvest, on shade- and sun-exposed mature non-
senescent leaves, spectral parameters were measured
from 400 to 900 nm, scanned each 2 nm, using the
same spectro-radiometer as above equipped with an
integrating sphere.
Leaf gas exchange and water potential
The light response of leaf net photosynthesis (A/Q
curve) was assessed by measuring steady state CO2
assimilation (A, mmol m72 s71) at 16 points in the
PFD range from 2000 to 0 mmol m72 s71 using a
portable Li-6400 photosynthesis system (Li-Cor,
Lincoln, NE, USA) equipped with a leaf chamber
36 2 cm2 wide. Light was provided by an artificial
324 P. Giorio and V. Nuzzo
Dow
nloa
ded
by [
Uni
v St
udi B
asili
cata
] at
03:
17 0
5 Ju
ly 2
012
red LED source emitting at 670 nm. An external
bottled 12 g CO2 source was used to infiltrate the
leaf chamber with air at a constant 370 mmol mol71
CO2. The various gas-exchange parameters were
calculated by the instrument software on the basis of
the von Caemmerer and Farquhar (1981) model.
Using the software Photosyn Assistant (Dundee
Scientific, Dundee, Scotland), A/Q curve data were
fitted to a non-rectangular hyperbola model func-
tion, in which the apparent quantum yield of CO2
assimilation (fe, mol mol71) was the initial curve
slope, the light-saturated assimilation (Amax) was the
upper asymptote, and the light compensation point
(LCP, mmol m72 s71) and the dark respiration
(Rd, mmol m72 s71) were the axis intercepts.
Mature shade-leaves near a cluster in the low canopy
and well-exposed mature leaves at the canopy top were
selected for measurements in three vines per treat-
ment. The A/Q curves were carried out between 10:00
and 14:30 h solar time as each curve took about
30 min to be completed. After A/Q curve determina-
tion, the leaves were cut and enclosed in a bag filled
with breath air to avoid any significant loss of vapor,
and then leaf water potential (cl, MPa) was immedi-
ately measured by means of a Scholander pressure
bomb (PMS Instruments, Corvallis, OR, USA).
Statistical analysis
Data were submitted to analysis of variance using
SigmaStat 3.0.1 software (SSPS, Inc., Chicago, IL,
USA). When warranted, the Student Newman–
Keuls test was used to compare the means. The
relationship between leaf area and shoot length was
established by regression analysis.
3. Results
Meteorological patterns and leaf water status
Meteorological patterns showed the typical Mediter-
ranean climate of southern Italy. The daily minimum
and maximum temperature in July were 20.3 and
32.28C, respectively, and both were the highest
values compared with other months. The average
daily reference evapo-transpiration estimated with
the Hargreaves equation was highest in June
(6.3 mm day71) and slightly lower in July and
August (data not shown).
Analysis of variance showed that Cl was signifi-
cantly affected by the leaf position factor while
neither the cluster thinning factor nor the first-order
interaction between the two factors were significant.
Mean comparisons were, therefore, performed be-
tween the two leaf positions within single sampling
dates. Cl was significantly lower in sun than shade-
leaves, both remaining quite stable with an overall
average value of 71.07 MPa in the sun-exposed
leaves and 70.87 MPa in the shade-leaves (Table I).
Yield, leaf area index and light interception
The cluster thinning treatment applied at fruit set
resulted in T50 and T75 vines having respectively
58% and 37% of 63.7 (control) clusters per vine at
harvesting time (Table II). The reduced cluster load
significantly affected yield, which decreased from
20.5 t ha71 (control) to 74% (T50) and 48% (T75).
The soluble solids in the berry juice were 2.6 kg per
vine (control), a halved content in the most thinned
T75 treatment, and a moderate reduction in T50, in
accordance with the yield reduction (Table II).
LAI increased during the growing season (Figure
1a) with the maximum value observed in early July
when it was 1.75 m2 m72 in UT, and 25.6% (T50)
and 62.2% (T75) higher. Any further increase in leaf
area was prevented by the ordinary summer pruning
that removed most of shade-leaves near the fruit zone
as well as some vigorous lateral shoots and unpro-
ductive shoots. This operation was quite strong and
uniform as it halved the leaf area in all treatments
(Figure 1a), a typical feature for commercial tendone
vineyards in the Metapontum plain. After pruning,
shoot growth allowed only a partial recovery of LAI
before a clear decrease due to late season leaf
senescence (Figure 1a).
As observed for leaf area, light interception
increased during the growing season. The maximum
radiation interception occurred in early July just
before summer pruning, when CPFDInt was
1167.1 mmol m72 s71 in UT and on average
12.4% (not statistically significant) higher in the
two thinned treatments (Figure 1b). After pruning,
there was a partial recovery followed by a decrease, as
found for leaf area.
Light quality
As expected, the tendone vineyard showed a lower
transmittance in the photosynthetically active wave-
Table I. Leaf water potential (Cl, MPa) of sun-exposed and shade-
leaves measured around midday from June to October 2002 as an
average of the three thinning treatments.
Month Sun-leaf Shade-leaf
June 71.11+0.031 a 70.84+ 0.027 b
July 70.85+0.058 a 7068+ 0.017 a
August 71.00+0.031 a 70.82+ 0.054 b
September 71.19+0.026 a 71.01+ 0.021 b
October 71.21+0.022 a 70.99+ 0.022 b
Note: The data are presented as mean+SEM (n¼15). Means in
the same row with the same letter are not significantly different
(SNK test; p� 0.05).
Light environment and gas exchange in Tendone grapevines 325
Dow
nloa
ded
by [
Uni
v St
udi B
asili
cata
] at
03:
17 0
5 Ju
ly 2
012
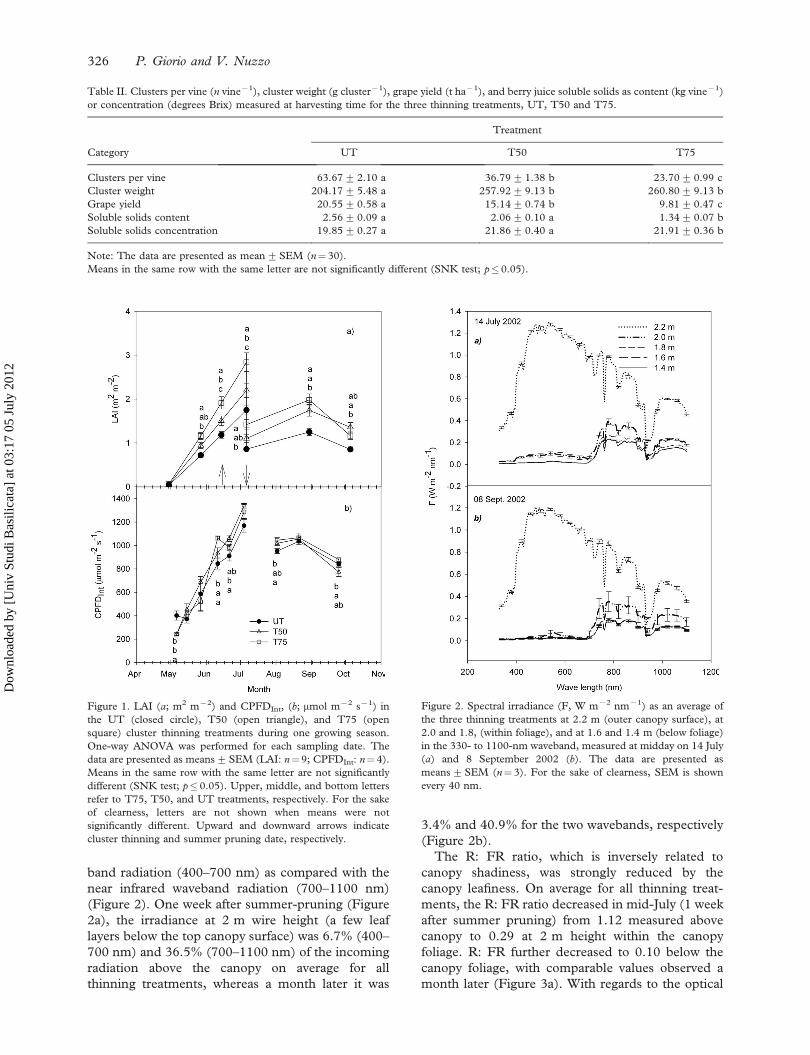
band radiation (400–700 nm) as compared with the
near infrared waveband radiation (700–1100 nm)
(Figure 2). One week after summer-pruning (Figure
2a), the irradiance at 2 m wire height (a few leaf
layers below the top canopy surface) was 6.7% (400–
700 nm) and 36.5% (700–1100 nm) of the incoming
radiation above the canopy on average for all
thinning treatments, whereas a month later it was
3.4% and 40.9% for the two wavebands, respectively
(Figure 2b).
The R: FR ratio, which is inversely related to
canopy shadiness, was strongly reduced by the
canopy leafiness. On average for all thinning treat-
ments, the R: FR ratio decreased in mid-July (1 week
after summer pruning) from 1.12 measured above
canopy to 0.29 at 2 m height within the canopy
foliage. R: FR further decreased to 0.10 below the
canopy foliage, with comparable values observed a
month later (Figure 3a). With regards to the optical
Table II. Clusters per vine (n vine71), cluster weight (g cluster71), grape yield (t ha71), and berry juice soluble solids as content (kg vine71)
or concentration (degrees Brix) measured at harvesting time for the three thinning treatments, UT, T50 and T75.
Category
Treatment
UT T50 T75
Clusters per vine 63.67+ 2.10 a 36.79+1.38 b 23.70+ 0.99 c
Cluster weight 204.17+ 5.48 a 257.92+9.13 b 260.80+ 9.13 b
Grape yield 20.55+ 0.58 a 15.14+0.74 b 9.81+ 0.47 c
Soluble solids content 2.56+ 0.09 a 2.06+0.10 a 1.34+ 0.07 b
Soluble solids concentration 19.85+ 0.27 a 21.86+0.40 a 21.91+ 0.36 b
Note: The data are presented as mean+SEM (n¼ 30).
Means in the same row with the same letter are not significantly different (SNK test; p�0.05).
Figure 1. LAI (a; m2 m72) and CPFDInt, (b; mmol m72 s71) in
the UT (closed circle), T50 (open triangle), and T75 (open
square) cluster thinning treatments during one growing season.
One-way ANOVA was performed for each sampling date. The
data are presented as means+SEM (LAI: n¼9; CPFDInt: n¼ 4).
Means in the same row with the same letter are not significantly
different (SNK test; p� 0.05). Upper, middle, and bottom letters
refer to T75, T50, and UT treatments, respectively. For the sake
of clearness, letters are not shown when means were not
significantly different. Upward and downward arrows indicate
cluster thinning and summer pruning date, respectively.
Figure 2. Spectral irradiance (F, W m72 nm71) as an average of
the three thinning treatments at 2.2 m (outer canopy surface), at
2.0 and 1.8, (within foliage), and at 1.6 and 1.4 m (below foliage)
in the 330- to 1100-nm waveband, measured at midday on 14 July
(a) and 8 September 2002 (b). The data are presented as
means+SEM (n¼ 3). For the sake of clearness, SEM is shown
every 40 nm.
326 P. Giorio and V. Nuzzo
Dow
nloa
ded
by [
Uni
v St
udi B
asili
cata
] at
03:
17 0
5 Ju
ly 2
012
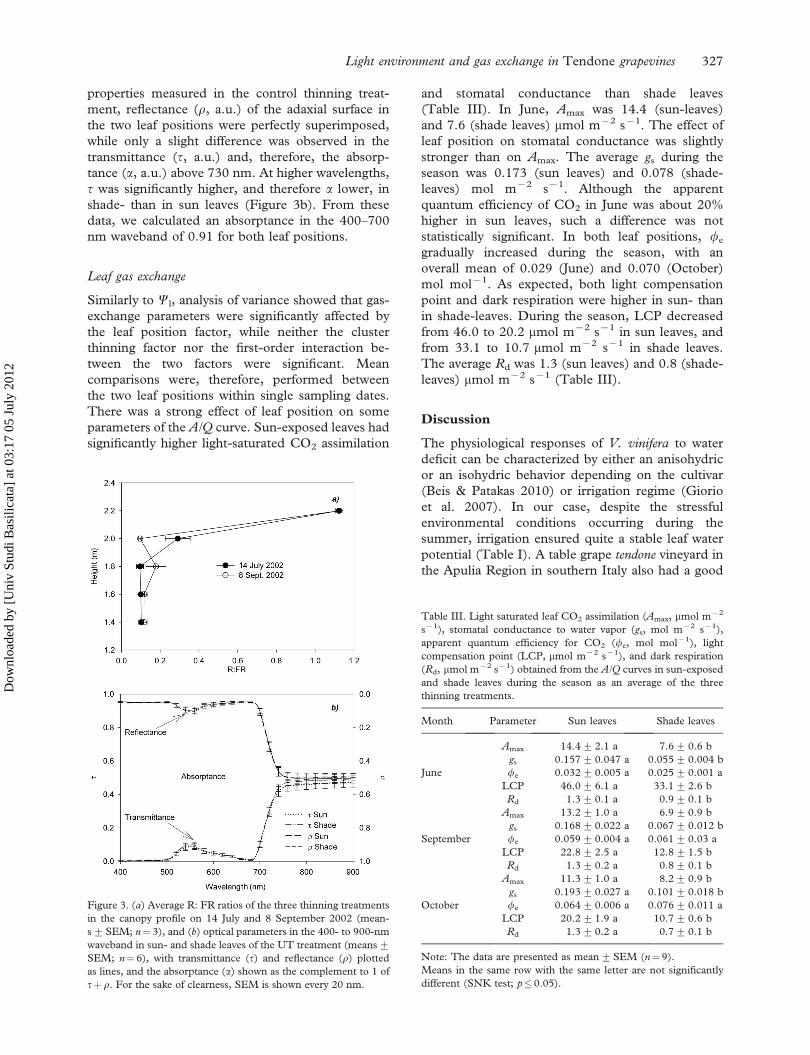
properties measured in the control thinning treat-
ment, reflectance (r, a.u.) of the adaxial surface in
the two leaf positions were perfectly superimposed,
while only a slight difference was observed in the
transmittance (t, a.u.) and, therefore, the absorp-
tance (a, a.u.) above 730 nm. At higher wavelengths,
t was significantly higher, and therefore a lower, in
shade- than in sun leaves (Figure 3b). From these
data, we calculated an absorptance in the 400–700
nm waveband of 0.91 for both leaf positions.
Leaf gas exchange
Similarly to Cl, analysis of variance showed that gas-
exchange parameters were significantly affected by
the leaf position factor, while neither the cluster
thinning factor nor the first-order interaction be-
tween the two factors were significant. Mean
comparisons were, therefore, performed between
the two leaf positions within single sampling dates.
There was a strong effect of leaf position on some
parameters of the A/Q curve. Sun-exposed leaves had
significantly higher light-saturated CO2 assimilation
and stomatal conductance than shade leaves
(Table III). In June, Amax was 14.4 (sun-leaves)
and 7.6 (shade leaves) mmol m72 s71. The effect of
leaf position on stomatal conductance was slightly
stronger than on Amax. The average gs during the
season was 0.173 (sun leaves) and 0.078 (shade-
leaves) mol m72 s71. Although the apparent
quantum efficiency of CO2 in June was about 20%
higher in sun leaves, such a difference was not
statistically significant. In both leaf positions, fe
gradually increased during the season, with an
overall mean of 0.029 (June) and 0.070 (October)
mol mol71. As expected, both light compensation
point and dark respiration were higher in sun- than
in shade-leaves. During the season, LCP decreased
from 46.0 to 20.2 mmol m72 s71 in sun leaves, and
from 33.1 to 10.7 mmol m72 s71 in shade leaves.
The average Rd was 1.3 (sun leaves) and 0.8 (shade-
leaves) mmol m72 s71 (Table III).
Discussion
The physiological responses of V. vinifera to water
deficit can be characterized by either an anisohydric
or an isohydric behavior depending on the cultivar
(Beis & Patakas 2010) or irrigation regime (Giorio
et al. 2007). In our case, despite the stressful
environmental conditions occurring during the
summer, irrigation ensured quite a stable leaf water
potential (Table I). A table grape tendone vineyard in
the Apulia Region in southern Italy also had a good
Figure 3. (a) Average R: FR ratios of the three thinning treatments
in the canopy profile on 14 July and 8 September 2002 (mean-
s+SEM; n¼ 3), and (b) optical parameters in the 400- to 900-nm
waveband in sun- and shade leaves of the UT treatment (means+SEM; n¼ 6), with transmittance (t) and reflectance (r) plotted
as lines, and the absorptance (a) shown as the complement to 1 of
tþ r. For the sake of clearness, SEM is shown every 20 nm.
Table III. Light saturated leaf CO2 assimilation (Amax, mmol m72
s71), stomatal conductance to water vapor (gs, mol m72 s71),
apparent quantum efficiency for CO2 (fe, mol mol71), light
compensation point (LCP, mmol m72 s71), and dark respiration
(Rd, mmol m72 s71) obtained from the A/Q curves in sun-exposed
and shade leaves during the season as an average of the three
thinning treatments.
Month Parameter Sun leaves Shade leaves
Amax 14.4+ 2.1 a 7.6+ 0.6 b
gs 0.157+ 0.047 a 0.055+ 0.004 b
June fe 0.032+ 0.005 a 0.025+ 0.001 a
LCP 46.0+ 6.1 a 33.1+ 2.6 b
Rd 1.3+ 0.1 a 0.9+ 0.1 b
Amax 13.2+ 1.0 a 6.9+ 0.9 b
gs 0.168+ 0.022 a 0.067+ 0.012 b
September fe 0.059+ 0.004 a 0.061+ 0.03 a
LCP 22.8+ 2.5 a 12.8+ 1.5 b
Rd 1.3+ 0.2 a 0.8+ 0.1 b
Amax 11.3+ 1.0 a 8.2+ 0.9 b
gs 0.193+ 0.027 a 0.101+ 0.018 b
October fe 0.064+ 0.006 a 0.076+ 0.011 a
LCP 20.2+ 1.9 a 10.7+ 0.6 b
Rd 1.3+ 0.2 a 0.7+ 0.1 b
Note: The data are presented as mean+SEM (n¼ 9).
Means in the same row with the same letter are not significantly
different (SNK test; p�0.05).
Light environment and gas exchange in Tendone grapevines 327
Dow
nloa
ded
by [
Uni
v St
udi B
asili
cata
] at
03:
17 0
5 Ju
ly 2
012
aptitude to maintain an optimal water status even
when soil water content was quite low (Rana et al.
2004).
The negative effect of cluster thinning on yield was
associated with a significant increase in the cluster
weight at harvest (Table II), a well-known partial
self-compensation effect of cluster growth (Naor
et al. 2002). Our control treatment yielding 20.5 t
ha71 of grapes indicated a relatively high productiv-
ity for the Montepulciano tendone vineyard compared
to the 17.5 t ha71 yield reported for Cabernet
Sauvignon trained to a double cordon system with 48
buds per vine that is quite similar to our experiment
(Chapman et al. 2004).
Cluster thinning can stimulate leaf growth due to
the altered source–sink relationship (Edson et al.
1995). Thompson seedless grapevines showed a 50%
increase in the dry weight of leaves grown after
cluster removal at anthesis compared to the un-
thinned control (Williams 1996). Similarly, LAI of
the most thinned tendone was 62% significantly
higher than the control. The same vines in our
tendone were submitted to cluster thinning in the
previous year. This could explain the evident
increased LAI in the thinned treatments even at the
time of cluster removal (Figure 1a) due to a possible
beneficial effect of the improved accumulation of the
carbohydrate reserves in the trunk and roots during
the previous year.
The evolution of vineyard leaf area during the
season was reflected by a parallel increase in the light
intercepted by the canopy until the summer pruning
(Figure 1). Leaf area sampling can result in a linear
LAI during the growing season, as it was for the VSP
vineyard reported by Weyand and Schultz (2006).
However, with our data sets restricted to the time
before summer pruning, the statistical comparison of
the regressions of LAI or CPFDInt vs DOY (day of
year) (R24 0.99 or R24 0.95, respectively) indi-
cated a unique curve for all three thinning treatments
for LAI (p5 0.0001) but not for CPFDint
(p5 0.1502) (data not shown). Just before summer
pruning when the canopy achieved maximum
vegetative growth (Figure 1), the light intercepted
by the cluster-thinned canopies was, in fact, only a
little higher (12.4%) than the control. Conversely,
LAI was significantly [25.6% (T50) and 62.2%
(T75)] higher than the 1.75 m2 m72 found in the
control. These results clearly indicate that early-
cluster thinning in tendone systems affected LAI with
no significant effects on light interception. LAI was,
therefore, a canopy size parameter that hardly
described the potential productivity of the tendone,
as already found for other trellising systems (Glad-
stone & Dokoozlian 2003).
The geometry of tendone implies the absence of any
shading of the exterior (sun) leaves during the
daytime, and with a LAI above or even quite below
one, a significant portion of the canopy consists of
shaded interior leaves. The ratio between PLA and
canopy sun-exposed surface area (SA) represents a
shade index within the canopy, with self-shading
certainly occurring when such a ratio is higher than
one (Smart 1985). This shade index equals the LAI
in horizontal canopies, which therefore should be
maintained at relatively low LAI as compared to
other training systems in order to achieve minimal
shading. By comparing 10 training systems, Smart
(1985) not surprisingly found that a tendone vineyard
was among those having the highest shade index
(PLA/SA), despite having the same or halved LAI
(equal to PLA/SA in this system), as compared with
the other training systems.
The leaf area per unit of canopy volume, the leaf
area density (LAD, m2 m73), in the tendone control
(UT) was about 4.4 m2 m73, with the calculation
restricted to the 1.8–2.2 m vertical layer in which
most leaves were localized. Such a high LAD
occurring over all the ground surface also accounts
for the fact that a further increase of up to 5.5 (T50)
or 7.1 (T75) m2 m73 was not accompanied by a
substantial increase in light interception because of
leaf self-shading.
In addition, we observed more vertical lateral
shoots in the most thinned vines compared to the
control. These shoots accounted for a further leaf
area increase not associated with a corresponding
linear increase in CPFDInt. A parallel increase in
light interception and leaf area until the achievement
of the maximum PLA (19 m2 per m of row, in a
single row experiment) was observed by Intrieri et al.
(2001) in a Sangiovese vineyard trained to a CP
system. Such a LAI was capable of achieving a
fractional light interception of 78% during the
daytime. Our results can be compared with data of
Intrieri et al. (2001), since light interception mea-
surements taken at midday do not substantially
underestimate daytime measurements (Charles-Ed-
wards and Lawn 1984; Sinclair and Muchow 1999).
From data in Figure 1b, we calculated a 75%
(unthinned) and 84% (thinned treatments) fi just
before summer pruning.
From the same data, we obtained the relative
frequency distributions of PFDInt classes in our
tendone that showed a seasonal pattern that was quite
different from the one reported by Weyand and
Schultz (2006) for conventional and minimal prun-
ing Sylvoz systems. In those canopies, low PFDInt
classes had larger proportions early in the season,
and decreased during the season in favor of inter-
mediate classes of light interception. In our case, we
observed such a decrease for the low classes early in
the season, but it was first followed by an increase in
the upper PFD classes occurring from end of May to
328 P. Giorio and V. Nuzzo
Dow
nloa
ded
by [
Uni
v St
udi B
asili
cata
] at
03:
17 0
5 Ju
ly 2
012

early July, before the peak of relative frequency
shifted toward the mid-classes in August (Figure 4).
This indicated that a certain number of clustered leaf
layers developed locally before further growth
allowed the free-standing shoots to spread out over
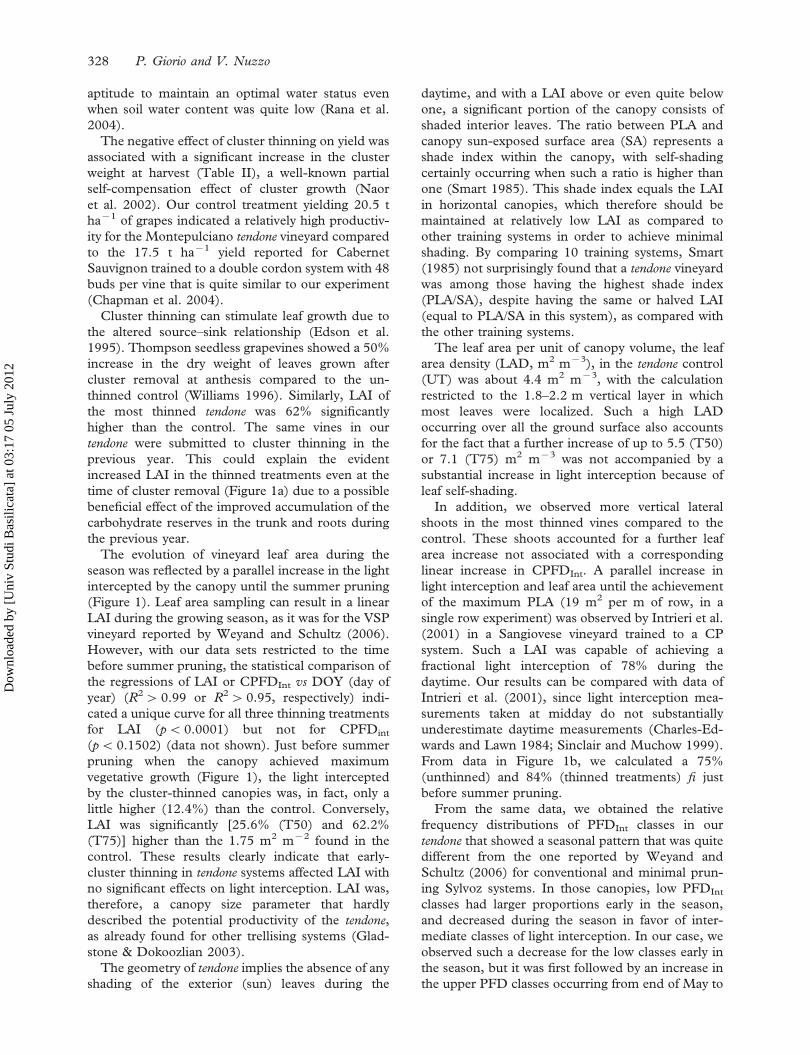
the remaining uncovered ground. The spatial and
temporal variations of PFDInt until the end of May
actually confirmed that ‘‘oil spot’’ thick zones
developed in the canopy preceding full ground
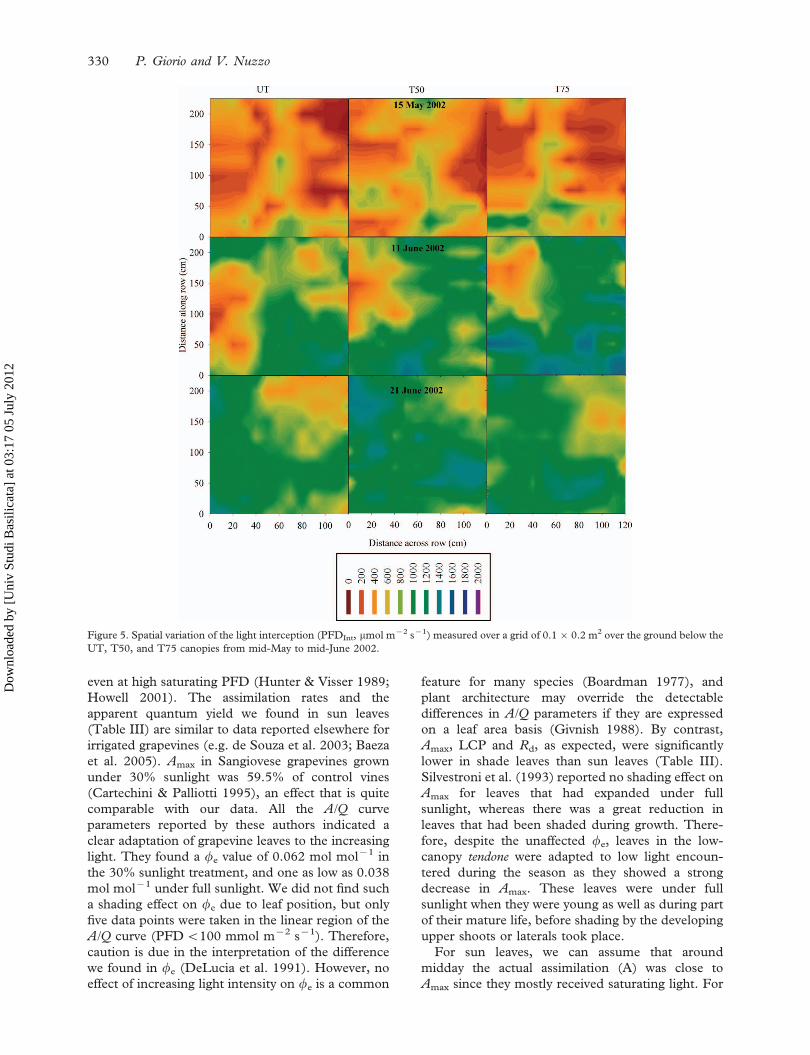
covering (Figure 5). Therefore, a significant leaf
self-shading occurred in the tendone canopy, starting
quite early in the season. Summer pruning caused an
abrupt halving of LAI, although we could not analyze
the resulting effect on light interception as the
subsequent measurements were carried out in
August when the canopy had already recovered to
full closure (cf. Figures 1 and 6). However, a high
shadiness within the tendone foliage was also clearly
indicated by the strong reduction in spectral irra-
diance at 2 m height, just below the canopy top, even
a week after summer pruning (Figure 2a).
In vertically divided TK2T systems (Smart 1988),
the R: FR ratio below canopy decreased to about 0.2
when shoot density increased from 5 to 20 shoots
m71, while such a (reciprocal) shade index remained
at about 0.1 in canopies trained up to 70 shoots m71,
indicating a clear saturating effect on shadiness at
moderate canopy shoot density. Our data similarly
indicate that few leaf layers in a tendone canopy were
sufficient to absorb most of PFD and to impose a
high shade on the lowest leaf layers (Figures 2 and
3a). Light interception and its distribution, and
therefore the shadiness along the vertical canopy
profile, is actually due to the canopy architecture, the
leaf area density, and the optical leaf properties. We
found an absorptance in the PFD waveband as high
as 0.91 in all mature non senescing leaves, slightly
higher than the upper limit of 0.85 to 0.90 reported
in grapevines by Schultz (1996). Tendone canopy has
an intrinsically low sun-exposed surface in compar-
ison with other trellising systems (Smart 1985), and
our data clearly indicate that it was subjected to a
strong self-shading during most of the season.
Gas exchange parameters were not affected by the
cluster level under our experimental conditions. It is
well known that shade and sun-exposed leaves show
different photosynthetic responses to light and that
Amax is lower in shade leaves than sun-exposed leaves
Figure 4. Relative frequency distribution of classes of light interception (PFDInt, mmol m72 s71) measured over a grid of 0.16 0.2 m2 over
the ground below the UT (closed circle), T50 (open triangle), and T75 (open square) canopies throughout the season.
Light environment and gas exchange in Tendone grapevines 329
Dow
nloa
ded
by [
Uni
v St
udi B
asili
cata
] at
03:
17 0
5 Ju
ly 2
012
even at high saturating PFD (Hunter & Visser 1989;
Howell 2001). The assimilation rates and the
apparent quantum yield we found in sun leaves
(Table III) are similar to data reported elsewhere for
irrigated grapevines (e.g. de Souza et al. 2003; Baeza
et al. 2005). Amax in Sangiovese grapevines grown
under 30% sunlight was 59.5% of control vines
(Cartechini & Palliotti 1995), an effect that is quite
comparable with our data. All the A/Q curve
parameters reported by these authors indicated a
clear adaptation of grapevine leaves to the increasing
light. They found a fe value of 0.062 mol mol71 in
the 30% sunlight treatment, and one as low as 0.038
mol mol71 under full sunlight. We did not find such
a shading effect on fe due to leaf position, but only
five data points were taken in the linear region of the
A/Q curve (PFD5100 mmol m72 s71). Therefore,
caution is due in the interpretation of the difference
we found in fe (DeLucia et al. 1991). However, no
effect of increasing light intensity on fe is a common
feature for many species (Boardman 1977), and
plant architecture may override the detectable
differences in A/Q parameters if they are expressed
on a leaf area basis (Givnish 1988). By contrast,
Amax, LCP and Rd, as expected, were significantly
lower in shade leaves than sun leaves (Table III).
Silvestroni et al. (1993) reported no shading effect on
Amax for leaves that had expanded under full
sunlight, whereas there was a great reduction in
leaves that had been shaded during growth. There-
fore, despite the unaffected fe, leaves in the low-
canopy tendone were adapted to low light encoun-
tered during the season as they showed a strong
decrease in Amax. These leaves were under full
sunlight when they were young as well as during part
of their mature life, before shading by the developing
upper shoots or laterals took place.
For sun leaves, we can assume that around
midday the actual assimilation (A) was close to
Amax since they mostly received saturating light. For
Figure 5. Spatial variation of the light interception (PFDInt, mmol m72 s71) measured over a grid of 0.160.2 m2 over the ground below the
UT, T50, and T75 canopies from mid-May to mid-June 2002.
330 P. Giorio and V. Nuzzo
Dow
nloa
ded
by [
Uni
v St
udi B
asili
cata
] at
03:
17 0
5 Ju
ly 2
012
shade leaves, we did not measure A at the actual
PFD experienced within the canopy. In order to
estimate the contribution of shade leaves to canopy
photosynthesis as compared with the sun leaves,
we modelled the actual assimilation in relation to
PFD on the basis of the A/Q parameters, and the
canopy profile PFD measured in mid-September.
Shade leaves in the middle of the canopy foliage
(2.0 m height) at a PDF of 106 mmol m72 s71
assimilated CO2 at a rate of 2.8 mmol m72 s71,
while shade leaves in the lower foliage (1.8 m
height) at PFD as low as 27 mmol m72 s71
assimilated at a rate as low a 0.6 mmol m72 s71.
These assimilation rates are 27% and 6%, respec-
tively, of the estimated rate (10.3 mmol m72 s71)
for sun leaves. In a globelet-trained Manto Negro
vineyard, Escalona et al. (2003) found an assimila-
tion rate of about 13 mmol m72 s71 in the top
canopy leaves, and around unit for the inner leaves,
Figure 6. Spatial variation of the light interception (PFDInt, mmol m72 s71) measured over a grid of 0.160.2 m2 over the ground below the
UT, T50, and T75 canopies from early July to end of September 2002.
Figure 7. Leaf CO2 assimilation (Aest, mmol m72 s71) response to
PFD (mmol m72 s71), i.e. A/Q curve, in the control treatment as
modelled on the basis of the parameters found in September 2002
as reported in Table III for sun- and shade leaves. CO2 assimilation
is estimated at the PFD actually measured in the canopy profile on
8 September 2002 for sun leaves (top of canopy) and shade leaves at
2.0 and 1.8 m height (within the foliage).
Light environment and gas exchange in Tendone grapevines 331
Dow
nloa
ded
by [
Uni
v St
udi B
asili
cata
] at
03:
17 0
5 Ju
ly 2
012
indicating the small contribution capacity of the
latter leaves to canopy photosynthesis. Leaves in the
lowest (fourth) layer of a tendone canopy showed a
daytime mean photosynthetic rate as low as one-
third of that observed in the top layer leaves (de
Palma & Novello 2004). Our estimations clearly
indicate the poor photosynthetic activity of shade
leaves in tendone canopies. On the basis of light
response curves, Smart (1974) actually predicted
that in dense vineyard canopies most of the
photosynthesis is due to direct light absorbed by
the uppermost canopy layers. Only when the
incoming light above a vineyard was not less than
2000 mmol m72 s71, the second leaf layer would
receive light at 200 mmol m72 s71, well above the
light compensation point (Howell 2001). Similarly,
Weyand and Schultz (2006) estimated that the top
canopy portions of the vineyard contributed to most
of the carbon budget. Same authors also concluded
that the increased sink size (higher yield in MP
vines as compared with VSP vines) had only a small
stimulating effect on leaf photosynthesis rate as it
was probably offset by the increased LAI. In our
tendone, cluster thinning induced a significant
increase in LAI, although we observed no signifi-
cant difference in the assimilation between the
thinning treatments. Our results indicated that
Montepulciano grapevines showed a morphological
response to the alteration of the sink/source ratio
that was not accompanied by a physiological
response.
In conclusion, the tendone vineyard showed a
parallel increase between LAI and light interception
during the growing season until the execution of
summer pruning. At that time, the tendone canopy
of the UT treatment was capable of intercepting 75%
of the incoming radiation. Early thinning treatment
induced a strong increase in leaf area, but a modest
insignificant increase in light interception because of
the high shading of the upper over lower leaf layers.
With the occurrence of canopy closure, shade leaves
had a lower light-saturated photosynthetic CO2
assimilation than leaves at the top of the canopy,
but with no significant differences in the apparent
quantum yield of CO2 assimilation. We estimated
that the rate of CO2 assimilation at the measured
PDF ranged from 6 to 27% of the rate estimated for
the top canopy leaves.
Acknowledgments
This research was carried out within the framework
of the Italian Ministry for Education, University and
Research (MIUR) PRIN project entitled ‘‘Meto-
diche innovative per lo studio dei rapporti tra
struttura della chioma, radiazione e bilancio del
carbonio in Vitis vinifera L.’’
References
Baeza P, Ruiz C, Cuevas E, Sotes V, Lissarrague J-R. 2005.
Ecophysiological and agronomic response of Tempranillo
grapevines to four training systems. Am J Enol Vitic 56: 129–138.
Beis A, Patakas A. 2010. Differences in stomatal responses and
root to shoot signalling between two grapevine varieties
subjected to drought. Funct Plant Biol 37: 139–146.
Boardman NK. 1977. Comparative photosynthesis of sun and
shade plants. Annu Rev Plant Physiol 28: 355–377.
Cartechini A, Palliotti A. 1995. Effect of shading on vine
morphology and productivity and leaf gas exchange character-
istics in grapevines in the field. Am J Enol Vitic 46: 227–234.
Chapman DM, Matthews MA, Guinard J-X. 2004. Sensory
attributes of Cabernet Sauvignon wines made from vines with
different crop yields. Am J Enol Vitic 55: 325–334.
Charles-Edwards DA, Lawn RJ. 1984. Light interception by grain
legume row crops. Plant Cell Environ 7: 247–251.
DeLucia EH, Shenoi HD, Naidu SL, Day TA. 1991. Photo-
synthetic symmetry of sun and shade leaves of different
orientations. Oecologia 87: 51–57.
de Palma L, Novello V. 2004. Leaf water use efficiency in a
‘‘Tendone’’ trained canopy: a contribute to the ecophysiolo-
gical characterization of a grapevine growing system. Acta
Hortic 664: 155–161.
de Souza CR, Maroco JP, dos Santos TP, Rodrigues ML, Lopes CM,
Pereira JS, et al. 2003. Partial rootzone drying: regulation of
stomatal aperture and carbon assimilation in field-frown grape-
vines (Vitis vinifera cv. Moscatel). Funct Plant Biol 30: 653–662.
Dokoozlian NK, Kliewer WM. 1995. The light environment
within grapevine canopies. I. Description and seasonal changes
during fruit development. Am J Enol Vitic 46: 209–218.
Edson CE, Howell GS, Flore JA. 1995. Influence of crop load on
photosynthesis and dry matter partitioning of Seyval grape-
vines. II. Seasonal changes in single leaf and whole vine
photosynthesis. Am J Enol Vitic 46: 469–477.
Escalona M, Flexas J, Bota J, Medrano H. 2003. Distribution of
leaf photosynthesis and transpiration within grapevine canopies
under different drought conditions. Vitis 42: 57–64.
Fanelli L. 1965. Il Tendone. Ramo Editoriale degli Agricoltori.
Roma. pp. 150.
Giorio P, Basile A, Sorrentino G, Albrizio R. 2007. Physiological
responses of ‘Falanghina’ grapevines in soils with different
water availability in southern Italy. Acta Hortic 754: 235–239.
Givnish TJ. 1988. Adaptation to sun and shade: a whole plant
perspective. Aust J Plant Physiol 15: 63–92.
Gladstone EA, Dokoozlian NK. 2003. Influence of leaf area
density and trellis/training system on the light microclimate
within grapevine canopies. Vitis 42: 123–131.
Howell GS. 2001. Sustainable grape productivity and the growth-
yield relationship: A review. Am J Enol Vitic 52: 165–174.
Hunter JJ, Visser JH. 1989. The effect of partial defoliation, leaf
position and developmental stage of the vine on the photo-
synthetic activity of Vitis vinifera, L. cv. Cabernet Sauvignon. S
Afr J Enol Vitic 10: 67–73.
Intrieri C, Poni S, Lia G, Gomez del Campo M. 2001. Light
interception, gas exchange and carbon balance of different
canopy zones of minimally and cane-pruned field grown
Riesling grapevines. Vitis 40: 123–130.
Kliewer WM, Dokoozlian NK. 2005. Leaf area/crop weight ratios
of grapevines: influence on fruit composition and wine quality.
Am J Enol Vitic 56: 170–181.
Monteith JL. 1994. Discussion: validity of the correlation between
intercepted radiation and biomass. Agric Forest Meteorol 68:
213–220.
Morrison JC, Noble AC. 1990. The effect of leaf and cluster
shading on the composition of Cabernet Sauvignon grapes and
on fruit and wine sensory properties. Am J Enol Vitic 41: 1–8.
332 P. Giorio and V. Nuzzo
Dow
nloa
ded
by [
Uni
v St
udi B
asili
cata
] at
03:
17 0
5 Ju
ly 2
012
Naor A, Gal Y, Bravdo B. 2002. Shoot and cluster thinning influence
vegetative growth, fruit yield and wine quality of ‘Sauvignon
blanc’ grapevines. J Am Soc Hortic Sci 127: 628–634.
Palliotti A, Cartechini A, Ferranti F. 2000. Morpho-anatomical
and physiological characteristics of primary and lateral shoot
leaves of Cabernet Franc and Trebbiano Toscano grapevines
under two irradiance regimes. Am J Enol Vitic 51: 122–130.
Rana G, Katerji N, Introna M, Hammami A. 2004. Microclimate
and plant water relationship of the ‘‘overhead’’ table grape
vineyard managed with three different covering techniques. Sci
Hortic 102: 105–120.
Schultz HR. 1996. Leaf absorptance of visible radiation in Vitis
vinifera, L.: Estimates of age and shade effects with a simple
field method. Sci Hortic 66: 93–102.
Silvestroni O, Poni S, Intrieri C, Fontana M. 1993. Effects of light
regimes on chlorophyll concentration and gas-exchange in Vitis
vinifera L. Vitis 48: 96–100.
Sinclair TR, Muchow RC. 1999. Radiation use efficiency. Adv
Agron 65: 215–265.
Smart RE. 1973. Sunlight interception by vineyards. Am J Enol
Vitic 24: 141–147.
Smart RE. 1974. Photosynthesis by grapevine canopies. J Appl
Ecol 11: 997–1006.
Smart RE. 1985. Principles of grapevine canopy microclimate
manipulation with implications for yield and quality. A review.
Am J Enol Vitic 36: 230–239.
Smart RE. 1988. Shoot spacing and canopy light microclimate.
Am J Enol Vitic 39: 325–333.
Smart RE, Robinson M. 1991. Sunlight into wine. A handbook for
winegrape canopy management. Australia: Winetitles, Ade-
laide. pp. 88.
von Caemmerer S, Farquhar GD. 1981. Some relationships
between the biochemistry of photosynthesis and the gas
exchange of leaves. Planta 153: 376–387.
Weyand KM, Schultz HR. 2006. Light interception, gas exchange
and carbon balance of different canopy zones of minimally
and cane-pruned field-grown Riesling grapevines. Vitis 45:
105–114.
Williams LE. 1996. Grape. In: Zamski E, Schaffer AA, editors.
Photoassimilate distribution in plants and crops: Source-sink
relationships. New York: Marcel Dekker, Inc. pp. 851–881.
Light environment and gas exchange in Tendone grapevines 333
Dow
nloa
ded
by [
Uni
v St
udi B
asili
cata
] at
03:
17 0
5 Ju
ly 2
012
Related Documents


![From Joyce Armstrong Carroll, Dr. JAC's Guide to Writing with … · 2018. 12. 6. · ..He [Papa] swept his hand toward the signaling Esperanza. (Circle grapevines, grapevines.) When](https://static.cupdf.com/doc/110x72/60357f62ea017562fc05cf79/from-joyce-armstrong-carroll-dr-jacs-guide-to-writing-with-2018-12-6-he.jpg)


