WCB Nova Scotia 2015 Annual Report LEADING THROUGH CHANGE

Welcome message from author
This document is posted to help you gain knowledge. Please leave a comment to let me know what you think about it! Share it to your friends and learn new things together.
Transcript

WCB Nova Scotia 2015 Annual Report
LeAding thRough chAnge

Fishing captain, Martin Edwards, discusses safety with one of his crew and Joe Grandy, Nova Scotia Community College instructor, at a man overboard drill in Eastern Passage. Mr. Edwards and many other fishermen across the province are helping to lead Nova Scotia’s fishing industry through significant cultural change by hosting and participating in safety demonstrations on wharves and fishing vessels within their own communities.
Fishing Safety Now, a plan by and for Nova Scotia’s fishing industry, launched in June 2015. It recommends a continued focus on these community-based, hands-on training exercises and awareness activities, among other recommendations now being implemented by industry.
our Vision
Nova Scotians – safe and secure from workplace injury.
our Mission
We set the standard for workplace injury insurance. We inform and inspire Nova Scotians in the prevention of workplace injury, but if it occurs, we support those whose lives it touches by championing a timely return to safe and healthy work.
table of contents
Year at a Glance . . . . . . . . . . . . . . . . . . . . . . . . . . . . . . . . . . . . . 1
Message from the Board of Directors . . . . . . . . . . . . . . . . . . . . . . . . . . . 3
Message from the Chief Executive Officer . . . . . . . . . . . . . . . . . . . . . . . . . 5
Message from the Client Relations Officer . . . . . . . . . . . . . . . . . . . . . . . . . 7
Plans and Progress . . . . . . . . . . . . . . . . . . . . . . . . . . . . . . . . . . . 9
Management’s Responsibility for Financial Reporting . . . . . . . . . . . . . . . . . . . 27
Management Discussion and Analysis . . . . . . . . . . . . . . . . . . . . . . . . . . 29
Independent Auditor’s Report . . . . . . . . . . . . . . . . . . . . . . . . . . . . . . . 41
Financial Statements . . . . . . . . . . . . . . . . . . . . . . . . . . . . . . . . . . . 42
Salaries and Benefits . . . . . . . . . . . . . . . . . . . . . . . . . . . . . . . . . . 54
Actuarial Certificate . . . . . . . . . . . . . . . . . . . . . . . . . . . . . . . . . . . 56
2015 Statistical Summary . . . . . . . . . . . . . . . . . . . . . . . . . . . . . . . . 57
Vision, Mission, Goals and Values . . . . . . . . . . . . . . . . . . . . . . inside back cover
Contact Information . . . . . . . . . . . . . . . . . . . . . . . . . . . . . . . . back cover
Year at a Glance(Dollar amounts in millions) 2015 2014 2013
Number of Covered Employers (Assessed and Self Insured) 18,800 18,700 18,700
Percentage of Labour Force Covered (Assessed and Self Insured) 73 73 72
Number of Claims Registered 23,933 24,505 24,581
Number of Compensable Time-Loss Claims Registered 6,014 5,953 6,034
Duration Index (in days) 108 102 99
Targeted Average Assessment Rate (per $100 of assessable payroll) $2.65 $2.65 $2.65
Actual Average Assessment Rate $2.67 $2.67 $2.66
Assessable Payroll (billions) $10.2 $10.0 $9.6
Assessment Revenue $314.2 $306.0 $296.8
Investment Income $69.7 $135.3 $190.2
Administration Costs $51.3 $50.1 $47.0
Legislated Obligations $15.2 $14.6 $12.6
Claims Costs Incurred $204.0 $202.6 $205.2
Comprehensive Income $72.6 $97.8 $52.2
Assets (billions) $1.6 $1.5 $1.4
Liabilities (billions) $2.0 $2.0 $1.9
Percentage Funded Ratio 80.6% 76.9% 71.4%
One-year Investment Returns 5.0% 10.4% 15.7%
Timeliness of First Payment to Injured Workers 70.8% 72.7% 75.5%(percentage of payments made within 15 days of injury – 12 month average)
Injury Rate: Time-Loss Claims per 100 Covered Workers 1.84 1.82 1.86
WCB Nova Scotia 2015 Annual Report 1

The WCB Nova Scotia Board of Directors consists of four employer and four worker representatives, along with a Chair and Deputy Chair. The Board is responsible for representing stakeholder viewpoints while considering the interests of the WCB and the system overall. (L-R, Back Row, Standing) Jeff Brett, Worker Representative; Betty Jean Sutherland, Worker Representative; Angus Bonnyman, Employer Representative; Janet Hazelton, Worker Representative; Duncan Williams, Employer Representative; Brad Fraser, Executive Corporate Secretary; (L-R, Front Row) Luc Erjavec, Employer Representative; Stuart MacLean, Chief Executive Officer; Rodney Burgar, Chair; Chris Power, Deputy Chair; Phillip Veinotte, Employer Representative.
2 WCB Nova Scotia 2015 Annual Report
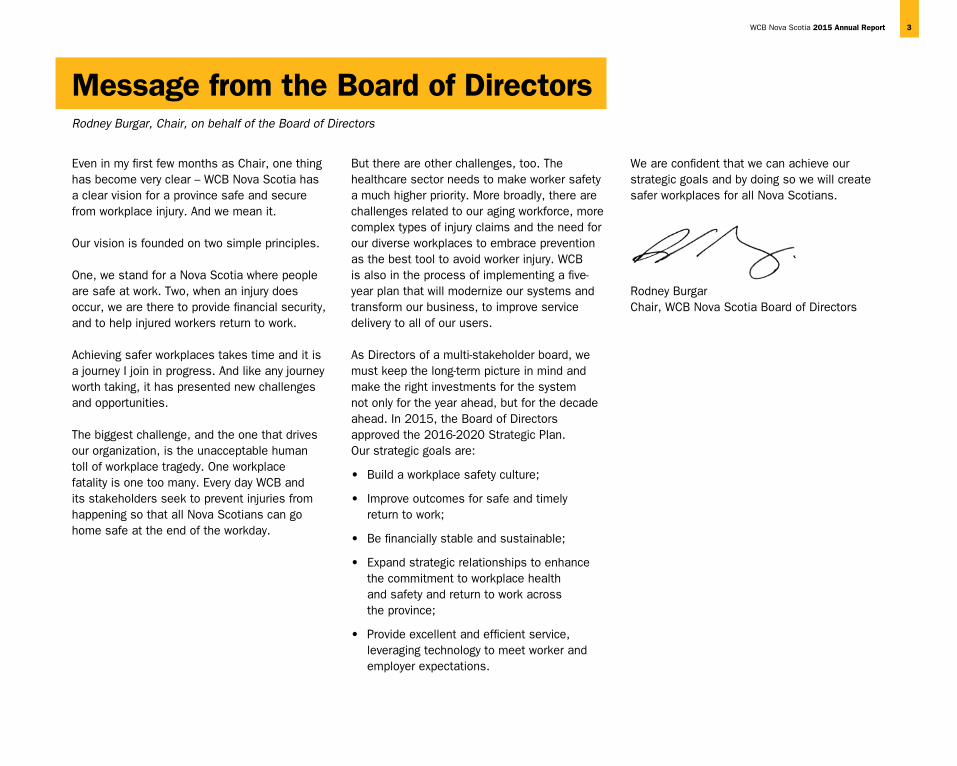
Message from the Board of DirectorsRodney Burgar, Chair, on behalf of the Board of Directors
Even in my first few months as Chair, one thing has become very clear – WCB Nova Scotia has a clear vision for a province safe and secure from workplace injury. And we mean it.
Our vision is founded on two simple principles.
One, we stand for a Nova Scotia where people are safe at work. Two, when an injury does occur, we are there to provide financial security, and to help injured workers return to work.
Achieving safer workplaces takes time and it is a journey I join in progress. And like any journey worth taking, it has presented new challenges and opportunities.
The biggest challenge, and the one that drives our organization, is the unacceptable human toll of workplace tragedy. One workplace fatality is one too many. Every day WCB and its stakeholders seek to prevent injuries from happening so that all Nova Scotians can go home safe at the end of the workday.
But there are other challenges, too. The healthcare sector needs to make worker safety a much higher priority. More broadly, there are challenges related to our aging workforce, more complex types of injury claims and the need for our diverse workplaces to embrace prevention as the best tool to avoid worker injury. WCB is also in the process of implementing a five-year plan that will modernize our systems and transform our business, to improve service delivery to all of our users.
As Directors of a multi-stakeholder board, we must keep the long-term picture in mind and make the right investments for the system not only for the year ahead, but for the decade ahead. In 2015, the Board of Directors approved the 2016-2020 Strategic Plan. Our strategic goals are:
• Buildaworkplacesafetyculture;
• Improveoutcomesforsafeandtimely returntowork;
• Befinanciallystableandsustainable;
• Expandstrategicrelationshipstoenhancethe commitment to workplace health and safety and return to work across theprovince;
• Provideexcellentandefficientservice,leveraging technology to meet worker and employer expectations.
We are confident that we can achieve our strategic goals and by doing so we will create safer workplaces for all Nova Scotians.
Rodney BurgarChair, WCB Nova Scotia Board of Directors
WCB Nova Scotia 2015 Annual Report 3

Employers whose top executives signed the initial Health and Safety Leadership Charter include (L-R):
• JasonShannon,COO,ShannexIncorporated• BruceChapman,GeneralManager,NorthernPulp• JohnYoung,GeneralManager,PCLConstructorsCanada• KenMacLean,MunicipalGroupofCompanies• MikeDunning,SobeysInc.• RickGibbs,President,NeutronFactoryWorks,BritishColumbia• SteveSnider,CEO,HalifaxHarbourBridges• StephaneTurbide,GeneralManagerofHalifaxOperations,
Pratt & Whitney• JoelCarroll,CEO,FalckSafetyServicesCanada• RayIvany,President,AcadiaUniversity• Jean-PaulDeveau,President,AcadianSeaplantsLtd.• CeceliaMacLellan,Director,ContactCentreOperations,StaplesInc.• DavidHoffman,Co-CEO,OxfordFrozenFoods• JanetKnox,CEO,NovaScotiaHealthAuthority
• MarcDube,PortHawkesburyPaper• TraceyKitch,CEO,IWKHealthAuthority• JohnKennedy,OperationsManager,IntertapePolymer• JackMiner,President,AtlanticCraneandMaterialHandling• FraserGray,VPManufacturing,TandusCentiva• StuartMacLean,CEO,WCBNovaScotia• BobHanf,PresidentandCEO,NovaScotiaPowerInc.• JeffMacLean,President,MichelinNorthAmerica(Canada)Inc.• RamonaLumpkin,President,MountSaintVincentUniversity. Signatoriesmissingfromphoto:DalhousieUniversity,DepartmentofLabourandAdvancedEducation,EmeraUtilityServices,HighLinerFoods,IMPGroup,KohltechInternational,SaintMary’sUniversity,ScotsburnIceCream Company.
4 WCB Nova Scotia 2015 Annual Report

WCB Nova Scotia faces change today that demands leadership like never before.
On the one hand, there are thousands fewer injuries, and hundreds of thousands fewer days lost to injury, than a decade ago. Driven by injury prevention and return to work outcomes from previous years, we saw a positive financial result this year. Our funded percentage has moved from 27 per cent funded in the early 1990s to more than 80 per cent today.
There is success, but there are also challenges. In 2015, we began to encounter tough realities about the impact of workplace injury, and we also dug in to necessary and unprecedented change.
Workplace injury continued to take too great a human toll in 2015. Eight people died in workplace tragedies, an increase from five the year before. There were also 19 chronic fatalities due to health problems and occupational disease. Zero is the only acceptable number of workplace fatalities. These deaths are stark reminders that our work must continue.
External factors are driving different prevention and return-to-work outcomes than we anticipated. Time-loss injuries are up slightly from 2014, but still more than 34 per cent lower than a decade ago. More days were lost due to injury in 2015, driven by complex musculoskeletal claims, and by claims returning to our system from external appeals.
There were pockets of incredible progress. Fishing, for example, is seeing a cultural refresh – that industry is working to make fishing safer for future generations. The Fishing Safety Now action plan is a major success.
Other sectors are struggling. Long-term care and home care face very real challenges. The healthcare industry as a whole pays more than $60 million in premiums, and much of that money could be going to patient care. More importantly, too many healthcare workers are off the job, not providing the care Nova Scotians need. Healthcare will be a focus for us in 2016.
All of this is why we must continue our journey, and continue to evolve. Our province faces changing industries, changing demographics, changing technologies and expectations. This change demands leadership.
We are leading through that change by improving the appeal system and writing easier-to-understand decisions. We are leading through that change by making a significant investment in business transformation – one we no longer have the option not to make. And perhaps most of all, we are leading through that change by continuing to champion workplace safety and return to work.
Guided by the Workplace Safety Strategy, we continue to work with our partners and with Nova Scotia workplaces – and especially with leaders. I was honoured to sign Nova Scotia’s first Health and Safety Leadership Charter on October 8, 2015 – an initiative led entirely by industry.
Change must continue. The status quo is unacceptable. Our 2016-2020 Strategic Plan sets out a refreshed vision. We are driven to continue on our mission, enabled by necessary business transformation.
We are fortunate to have the guidance of a visionary Board of Directors, now under the leadership of Rodney Burgar. I look forward to our continued work together. We were also fortunate to welcome Duncan Williams and Jeff Brett in 2015. As well, we said farewell last year to Dean Tupper, who moved on to other opportunities after serving for three years.
Over the long term, workplace injury’s impact is being reduced. The short-term challenges we saw this year will not stop our long-term progress. I am proud of what we accomplished in 2015. I look forward to what the future holds, as we continue our journey toward a Nova Scotia safe and secure from workplace injury.
Stuart MacLean, Chief Executive Officer
WCB Nova Scotia CEO Stuart MacLean signs the initial Health and Safety Leadership Charter
Message from the Chief Executive Officer
WCB Nova Scotia 2015 Annual Report 5

Each year on April 28th, Nova Scotia joins the rest of Canada and more than 80 countries worldwide to remember those who died, were injured or became ill because of their work. The Day of Mourning offers employees and employers the opportunity to publicly renew their commitment to improve health and safety in the workplace.
In2015,throughpartnershipwithNova Scotia Labour and Advanced Education, the Nova Scotia Federation of Labour, the WCB and Threads of Life, friends and family of Jamie Lapierre shared powerful stories in hopes that no one else experiences the loss they endured because of a workplace tragedy.
Day of Mourning ceremonies were held across the province. Estella Hickey (left), Threads of Life member and motherofKyleHickeywhodiedin a workplace tragedy at the age of 22, spoke at the ceremony at Province House. “For me, it is another day to rememberoursonKyle,takenawaysoyoung.Ibelieveeveryonethatgoestowork should come home at the end of the day to their loved ones,” she said.
The WCB helped recognize this important day through a web-based campaign that encouraged Nova Scotians to share stories of workplace loss and tragedy, and post expressions of remembrance.
6 WCB Nova Scotia 2015 Annual Report

WCB Nova Scotia strives to provide quality service to all stakeholders, in particular, workers and employers. Every communication from a stakeholder or a member of the public provides either an opportunity to recognize service excellence or a view as to how the WCB may improve service.
The role of the Client Relations Officer is described in Policy 10.3.1R, Quality of Service Assurance. Most inquiries I receive are from workers and MLA offices who are calling on behalf of a constituent, although employers and others are in contact with me throughout the year as well. In 2015, I received 37 formal complaints of which 20 were substantiated.
While the overall number of complaints is relatively low, workers who are in contact with my office often raise concerns about the time it takes to receive a case worker decision or for an appeal decision to be implemented. In such cases, workers may often feel they were not treated fairly by the system.
In responding to complaints, it is important that I listen to workers and employers to truly understand their issues and to do what I can to help them understand the WCB legislation and processes, while at the same time helping WCB employees learn from these experiences and grow in their responsiveness to customer needs. By doing so, I can determine whether a complaint is substantiated or not and respond accordingly. I look at the process that led to a decision through the lenses of fairness, truthfulness, reasonableness, honesty, clarity, equitability and impartiality.
In resolving service complaints, I encourage my colleagues to listen, be open-minded and ensure all parties feel they were heard and understood. I believe the more we listen to understand, the more knowledgeable we become, which in turn leads to better relationships and greater fairness.
Tim McInnisClient Relations Officer
Tim McInnis, Client Relations Officer
Message from the Client Relations Officer
WCB Nova Scotia 2015 Annual Report 7

In2015,employersinNovaScotiaseekingworkplaceinjuryinsurancecoveragewereabletoapplyforcoverageonlineforthefirsttime.Onlineregistrationisanotherexampleofhowwe’remakingiteasiertodobusinesswithus.Throughtheonlineemployerregistrationform,employerscanapply for workplace injury insurance quickly and easily. Since the new service launched in mid-February, 86 per cent of all new registrations have been completed online, many during evenings and on the weekends.
Johnny Wall, owner of Walls Metal Roofing in Bridgewater, registered for workplace insurance coverage using the new online registration tool. He runs his business primarily through his mobile devices and uses a Bluetooth printer to print estimates and invoices on site for his customers. The online registration capability saved him time and effort.
8 WCB Nova Scotia 2015 Annual Report

Plans and Progress
For WCB Nova Scotia, 2015 was a bridge year between strategic plans. It marked the midpoint of the Workplace Safety Strategy, and the first year of a journey of unprecedented change in the way we deliver service. It was a fast-paced year full of both rewarding accomplishments and new challenges.
Over the long term, there remains strong, encouraging progress in Nova Scotia with regard to the reduction of workplace injury’s impact. Since 2005 we have seen strong progress both in the number of injuries and days lost as a result of those injuries. There is incredible success in some sectors, but there are challenges in others. Our results were also impacted by factors outside of our control, and as a result we did not see the same progress as we have in recent years. Unfortunately, there was an increase in the number of work-related fatalities in 2015 – and the only acceptable number is zero.
The Ivany Report calls for change in Nova Scotia. Acknowledging that the status quo is no longer sustainable, the Now or Never report encourages us all to do our part to transform our province for the better.
In 2015, we introduced our new five-year Strategic Plan for 2016-2020. We continued to push for change in the workplace safety culture. We made changes to the way we deliver service, the way we administer drug coverage, and, perhaps most notably, to the way we make and write claim decisions. We continued our
focus on the fishing industry, which saw the launch of an industry-led action plan.
We also started to take significant steps to modernize the WCB so we can meet the changing business realities of the future. The changes include many enhancements that will bring our services and the way we deliver them in line with the expectations of those we serve, and they are driven by a fundamental objective to change Nova Scotia’s workplace safety culture.
Over the long term, there has been incredible progress in the reduction of time-loss claims, with about 3,000 fewer people being hurt on the job since 2005 – a 34 per cent decline. Again, looking back over the long term, we have also made strong progress in the amount of time on the job lost to workplace injury. While there were challenges in 2015 with prevention and return to work, there has been progress over time. Overall, workplace injury’s impact is declining when compared to historical trends – as a result, our actuaries have reduced their forecasts for the benefits owed into the future. This has contributed to a comprehensive income.
However, in 2015 we encountered realities that are different than we had anticipated, and some measures did not show the pace of improvement we had hoped. Significant
progress in some sectors was counterbalanced by declines in other sectors. In particular, there were challenges in long-term care and home care, and we saw a higher than usual number of slips, trips and fall injuries through a harsh winter.
These challenges, together with slower than expected workforce growth, contributed to outcomes different than we expected. Our injury rate – the number of workers who suffer a time-loss injury per 100 covered workers increased slightly to 1.84 and did not meet our target. The number of new time-loss claims increased slightly to 6,014. While this is not our desired outcome, we are encouraged by the long-term progress since we assumed the prevention mandate. In 2005, the injury rate was 2.90, and 9,046 Nova Scotians suffered a time-loss injury at work.
For the same reasons as above, together with some external appeals returning to our system, we saw a slowing of our progress in return to work. We saw an increase in the number of time-loss days paid per 100 workers. While the number of workers going on to receive long-term benefits has dropped significantly over the past several years, there was an increase in that number in 2015, and our balanced scorecard result for cost of new extended earnings replacement benefits (EERBs) was higher than our goal.
WCB Nova Scotia 2015 Annual Report 9

Balanced Scorecard Measures
Actual ‘14 Actual ‘15 Target ‘15 Target ‘16 Target ‘20
Service
Worker Satisfaction Index1 75% 72% 70% 70% 70%
Employer Satisfaction Index 79% 81% 70% 70% 70%
Operations
Time-loss injuries per 100 covered workers 1.82 1.84 1.80 1.83 1.70
Duration index – composite, in days 102 108 102 107 100
Time-loss days paid per 100 covered employees 226 236 222 231 202
Cost of New Extended Earnings Replacement Benefits ($M) 46.8 54.5 49.0 51.0 52.6
Return to Employability 96% 95% 96% 95% 95%
Employee
WCB Employee Satisfaction Index 73% 73% 70% 70% 70%
Financial
Claims payments for the last 3 years per $100 of assessable payroll (payment ratio)
$0.656 $0.657 $0.643 $0.636 $0.588
Administrative costs per $100 of assessable payroll (excluding prevention costs)
$0.38 $0.38 $0.39 $0.40 $0.42
Return on investment
8.8%
8.1%
Exceed Benchmark
Portfolio Return
Exceed Benchmark Portfolio Return
Five-year Rate of Return 9.6%
Five-year Target 9.1%1 The Worker Satisfaction Index does not include workers on long-term benefits or those with claims for little or no time loss.
39% OF ALL WORkERS WITH A time-loss injury IN 2015 were age 50+ – MORE THAN double 19% IN 2002.
10 WCB Nova Scotia 2015 Annual Report
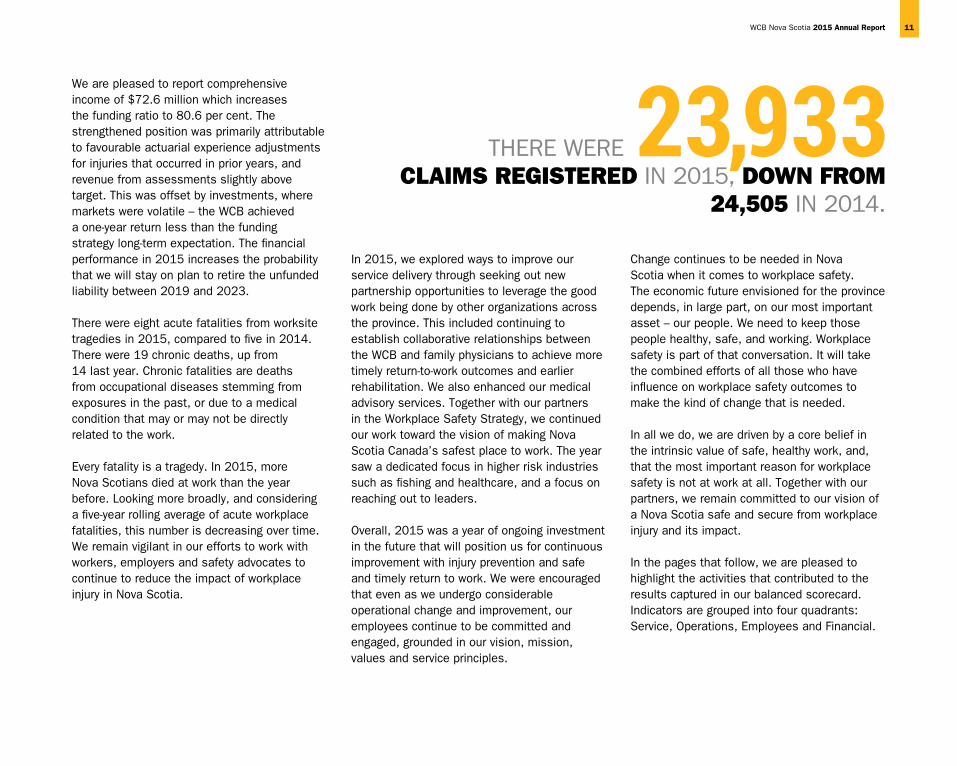
We are pleased to report comprehensive income of $72.6 million which increases the funding ratio to 80.6 per cent. The strengthened position was primarily attributable to favourable actuarial experience adjustments for injuries that occurred in prior years, and revenue from assessments slightly above target. This was offset by investments, where markets were volatile – the WCB achieved a one-year return less than the funding strategy long-term expectation. The financial performance in 2015 increases the probability that we will stay on plan to retire the unfunded liability between 2019 and 2023.
There were eight acute fatalities from worksite tragedies in 2015, compared to five in 2014. There were 19 chronic deaths, up from 14 last year. Chronic fatalities are deaths from occupational diseases stemming from exposures in the past, or due to a medical condition that may or may not be directly related to the work.
Every fatality is a tragedy. In 2015, more Nova Scotians died at work than the year before. Looking more broadly, and considering a five-year rolling average of acute workplace fatalities, this number is decreasing over time. We remain vigilant in our efforts to work with workers, employers and safety advocates to continue to reduce the impact of workplace injury in Nova Scotia.
In 2015, we explored ways to improve our service delivery through seeking out new partnership opportunities to leverage the good work being done by other organizations across the province. This included continuing to establish collaborative relationships between the WCB and family physicians to achieve more timely return-to-work outcomes and earlier rehabilitation. We also enhanced our medical advisory services. Together with our partners in the Workplace Safety Strategy, we continued our work toward the vision of making Nova Scotia Canada’s safest place to work. The year saw a dedicated focus in higher risk industries such as fishing and healthcare, and a focus on reaching out to leaders.
Overall, 2015 was a year of ongoing investment in the future that will position us for continuous improvement with injury prevention and safe and timely return to work. We were encouraged that even as we undergo considerable operational change and improvement, our employees continue to be committed and engaged, grounded in our vision, mission, values and service principles.
Change continues to be needed in Nova Scotia when it comes to workplace safety. The economic future envisioned for the province depends, in large part, on our most important asset – our people. We need to keep those people healthy, safe, and working. Workplace safety is part of that conversation. It will take the combined efforts of all those who have influence on workplace safety outcomes to make the kind of change that is needed.
In all we do, we are driven by a core belief in the intrinsic value of safe, healthy work, and, that the most important reason for workplace safety is not at work at all. Together with our partners, we remain committed to our vision of a Nova Scotia safe and secure from workplace injury and its impact.
In the pages that follow, we are pleased to highlight the activities that contributed to the results captured in our balanced scorecard. Indicators are grouped into four quadrants: Service, Operations, Employees and Financial.
THERE WERE claims registered IN 2015, down from
24,505 IN 2014.
23,933 WCB Nova Scotia 2015 Annual Report 11

OnNovember9th,morethan130ofNovaScotia’smostprominentleaders,representingpublicandprivateindustriesalongwithacademiaandlabour,cametogethertoigniteaconversationabouttheimportanceofworkplacesafetyandtheroleitplaysinourprovince’sfuture.ThethirdannualLeadershipMattersconferencewashostedbyKellyRegan,MinisterofLabourandAdvancedEducationandStuartMacLean,CEOofWCBNovaScotia.
DannyGraham,ChiefEngagementOfficerwithEngageNovaScotia(picturedabove)facilitatedthediscussions.
12 WCB Nova Scotia 2015 Annual Report
Service
Workplace Safety Strategy Leadership was a major focus in 2015, as we continued to implement the Workplace Safety Strategy.
Led by the One Nova Scotia Commission, Nova Scotia has established its strategy for a clear direction forward. For it to be successful, workplace safety needs to be accepted and embraced as a business priority.
Working with our partners at the Department of Labour and Advanced Education (LAE), we hosted the third annual Leadership Matters conference (see page 12).
We also began work on a leadership toolkit, focused on the role of leadership in safety management. This project connects with other work to understand current opinions and awareness of the Internal Responsibility System (IRS) among workers and employers in Nova Scotia with a view of elevating and increasing the understanding of this concept, a goal of the strategy.
Often, our success comes through inspiring others to action. That is why we were so pleased to be a part of the signing of Nova Scotia’s first Health and Safety Leadership Charter on October 8th, an initiative led by industry. In total, 30 executives from across Nova Scotia signed their names and committed to reducing injuries in their workplaces. A CEO Steering Committee is developing an action plan to grow participation in the Charter over time.
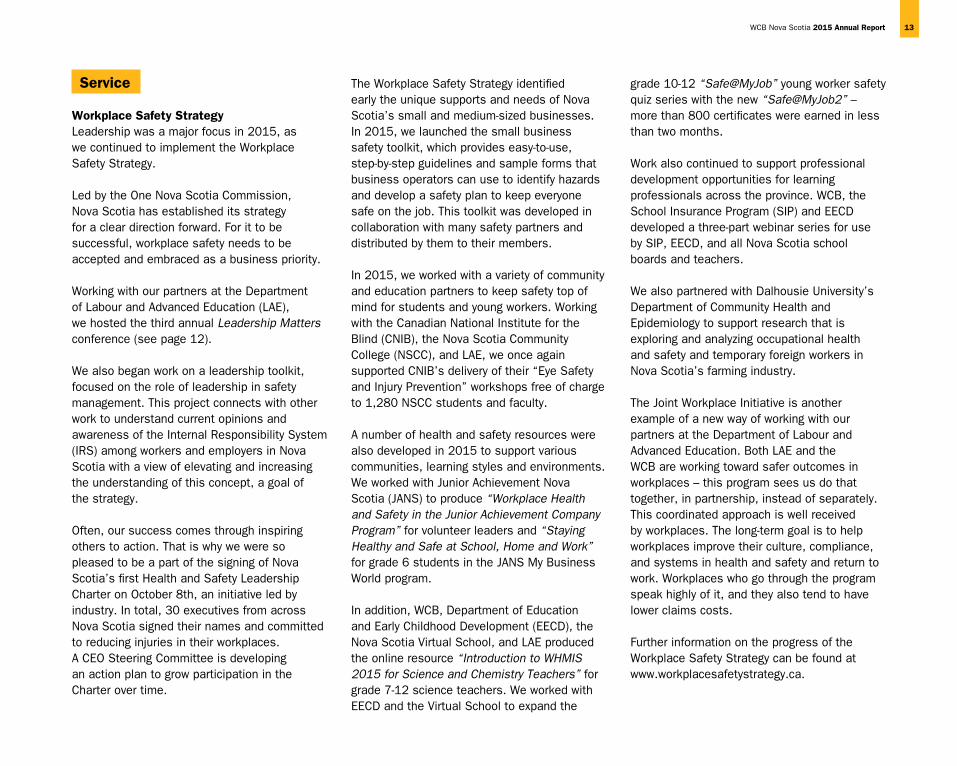
The Workplace Safety Strategy identified early the unique supports and needs of Nova Scotia’s small and medium-sized businesses. In 2015, we launched the small business safety toolkit, which provides easy-to-use, step-by-step guidelines and sample forms that business operators can use to identify hazards and develop a safety plan to keep everyone safe on the job. This toolkit was developed in collaboration with many safety partners and distributed by them to their members.
In 2015, we worked with a variety of community and education partners to keep safety top of mind for students and young workers. Working with the Canadian National Institute for the Blind (CNIB), the Nova Scotia Community College (NSCC), and LAE, we once again supported CNIB’s delivery of their “Eye Safety and Injury Prevention” workshops free of charge to 1,280 NSCC students and faculty.
A number of health and safety resources were also developed in 2015 to support various communities, learning styles and environments. We worked with Junior Achievement Nova Scotia (JANS) to produce “Workplace Health and Safety in the Junior Achievement Company Program” for volunteer leaders and “Staying Healthy and Safe at School, Home and Work” for grade 6 students in the JANS My Business World program.
In addition, WCB, Department of Education and Early Childhood Development (EECD), the Nova Scotia Virtual School, and LAE produced the online resource “IntroductiontoWHMIS2015forScienceandChemistryTeachers” for grade 7-12 science teachers. We worked with EECD and the Virtual School to expand the
grade 10-12 “Safe@MyJob” young worker safety quiz series with the new “Safe@MyJob2” – more than 800 certificates were earned in less than two months.
Work also continued to support professional development opportunities for learning professionals across the province. WCB, the School Insurance Program (SIP) and EECD developed a three-part webinar series for use by SIP, EECD, and all Nova Scotia school boards and teachers.
We also partnered with Dalhousie University’s Department of Community Health and Epidemiology to support research that is exploring and analyzing occupational health and safety and temporary foreign workers in Nova Scotia’s farming industry.
The Joint Workplace Initiative is another example of a new way of working with our partners at the Department of Labour and Advanced Education. Both LAE and the WCB are working toward safer outcomes in workplaces – this program sees us do that together, in partnership, instead of separately. This coordinated approach is well received by workplaces. The long-term goal is to help workplaces improve their culture, compliance, and systems in health and safety and return to work. Workplaces who go through the program speak highly of it, and they also tend to have lower claims costs.
Further information on the progress of the Workplace Safety Strategy can be found at www.workplacesafetystrategy.ca.
WCB Nova Scotia 2015 Annual Report 13
Fishing SafetyOn June 4th, Fishing Safety Now, a plan by and for Nova Scotia’s fishing industry was launched by the Safe at Sea Alliance – a group of fishermen, family members, industry, safety organizations, community leaders, and provincial and federal government representatives. The launch marked a major milestone and the culmination of close to two years of collaboration between the WCB, our partners at LAE, the Department of Fisheries and Aquaculture, the Fisheries Safety Association of Nova Scotia (FSANS) and the Nova Scotia Fisheries Sector Council (NSFSC) to create a long-term plan for change in collaboration with many other partners, industry members and federal and provincial government departments and agencies.
Fishing Safety Now outlines 33 recommendations to improve commercial fishing safety, including better awareness of practices and regulations, more safety training and education, and reviews of policies and processes for such things as weather forecasting and fisheries management. The plan demonstrates the importance and impact of working with industry to make a difference. The NSFSC and FSANS, two industry-based groups that played a key role in the plan’s development, are leading its implementation.
Throughout 2015, we continued to support change in this industry through awareness activities and man overboard drills to demonstrate the importance of personal protective equipment (PPE).
Internal Appeal Review ImplementationOver the past three years, guided by a partnership strategy, the WCB reviewed its role in the appeals system to explore opportunities to resolve issues earlier in the appeals process and mitigate appeals. We changed to a more collaborative and proactive approach for resolving appeal issues, and we began writing decisions in much plainer language.
This work, based on the input of our stakeholders and using a collaborative approach, is having an impact. The number of internal appeals is down to 1,313 in 2015 from 1,938 in 2012. In addition, written decisions are now easier to understand for workers and employers across Nova Scotia and appeals are regularly resolved with a final decision over 90 per cent of the time within 90 days.
Improving Prescription ManagementIn May, the WCB took steps to ensure injured workers have access to the medicine they need to effectively support their recovery and return to work at the right times and in safe amounts. The changes include a new authorization process administered through our partners at Medavie Blue Cross, aligning with current evidence and national and provincial best practices.
PrivacyPrivacy continued to be a top priority for the WCB in 2015. Our Privacy Advisory Committee met quarterly to assess the state of privacy within the organization and to seek opportunities to improve privacy practices and help prevent future breaches by reviewing any that occurred, examining the root causes and identifying trends. We were pleased to
host Catherine Tully, Information and Privacy Commissioner, during a quarterly meeting, and hear her comments on how she feels the WCB is a leading organization in the province when it comes to the protection of privacy and the management of access to information.
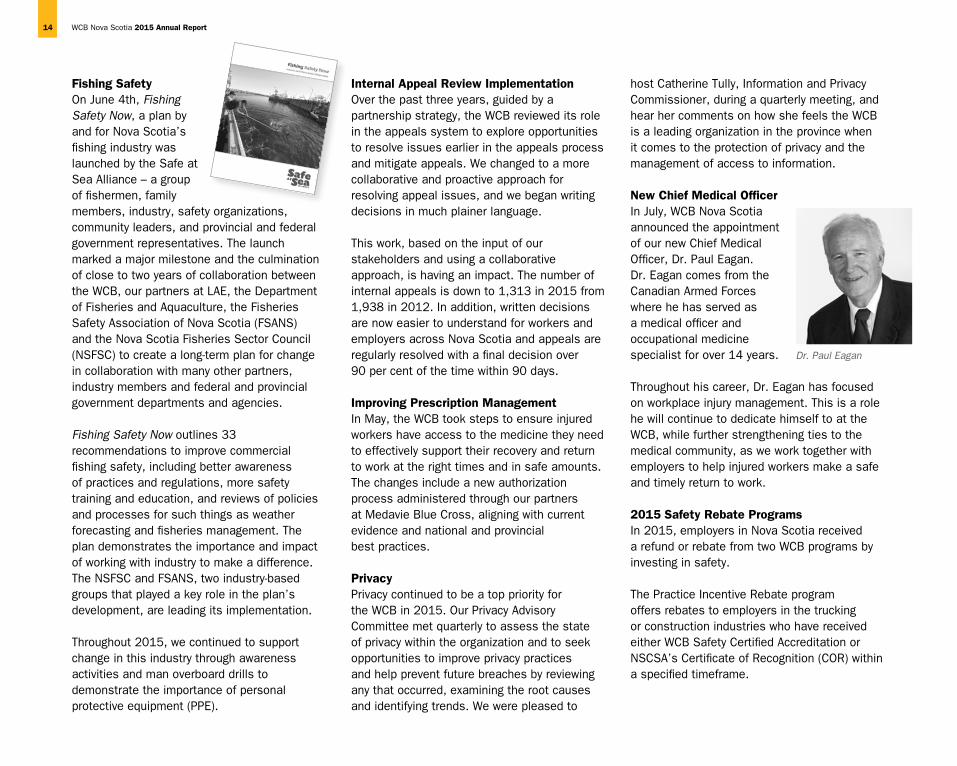
New Chief Medical OfficerIn July, WCB Nova Scotia announced the appointment of our new Chief Medical Officer, Dr. Paul Eagan. Dr. Eagan comes from the Canadian Armed Forces where he has served as a medical officer and occupational medicine specialist for over 14 years.
Throughout his career, Dr. Eagan has focused on workplace injury management. This is a role he will continue to dedicate himself to at the WCB, while further strengthening ties to the medical community, as we work together with employers to help injured workers make a safe and timely return to work.
2015 Safety Rebate Programs In 2015, employers in Nova Scotia received a refund or rebate from two WCB programs by investing in safety.
The Practice Incentive Rebate program offers rebates to employers in the trucking or construction industries who have received either WCB Safety Certified Accreditation or NSCSA’s Certificate of Recognition (COR) within a specified timeframe.
Dr. Paul Eagan
14 WCB Nova Scotia 2015 Annual Report
In 2015, rebates totaling $1.42 million were issued to 1,225 employers in the construction and trucking industries.
The Conditional Surcharge Refund Program encourages employers in a surcharge position to make investments in safety to reduce workplace injuries, which allows the employer the opportunity to apply for a refund for all or part of their surcharge premiums paid.
In 2015, based on surcharge premiums paid during 2014, 117 employers were eligible for refunds totaling $2.40 million. To date, we have refunded $1.02 million to 28 employers.
Service: Measures of SuccessOur success with service is based on feedback from those we serve. Every year we ask about 1,500 injured workers who receive the most frequent service and 1,000 employers to tell us about the service they received from the WCB. We use this information to find opportunities for improvement. The results of the survey are used to calculate satisfaction indices for both injured workers and employers. In 2015, both our injured worker and employer satisfaction indices were above target.
Service: OutlookIn 2016, WCB Nova Scotia will be an organization in a state of forward momentum. We will continue our progress in reducing the impact of workplace injury in our province through injury prevention and return to work. But just as important, we will also make significant and needed investments to transform our organization, so that we can meet the changing business realities of the future.
Our new 2016-2020 Strategic Plan is the product of months of consultation. Those stakeholder conversations confirmed our direction, but also made it clear that we have much to do. The new Strategic Plan calls for continued focus on injury prevention and return to work, toward financial sustainability. But it also makes it very clear that in order to reach those goals, we must continue to work with others and to work in new ways.
In 2016, our modernization journey continues, with the implementation of an online channel for workers, and a new, updated employer channel providing secure access to services and information not currently available. We will also make improvements to the way information is shared with health service providers, physicians, and hospitals to better leverage technology.
Working together with our partners at LAE, we will continue to deliver on the 2013-2017 Workplace Safety Strategy. A major focus will be healthcare, where the human and financial cost of workplace injury is unacceptable. We will also continue to enhance tools for small to medium businesses, complete a leadership toolkit, and enable and support the leadership of others in the Nova Scotia Health and Safety Leadership Charter, and Fishing Safety Now.
We will take a new targeted approach to how we reach out to larger workplaces in the province by focusing on specific areas that have been identified as challenges, namely sprains and strain injuries, slip, trip and fall injuries, and psychological injuries. We will work with our partners at LAE to ensure workplaces are aware of the supports available for first responders suffering psychological injuries after traumatic events.
As we continue to make important investments in our people, business processes and technology, and in the way we provide service, we will maintain our targets for service measures at 70 per cent.
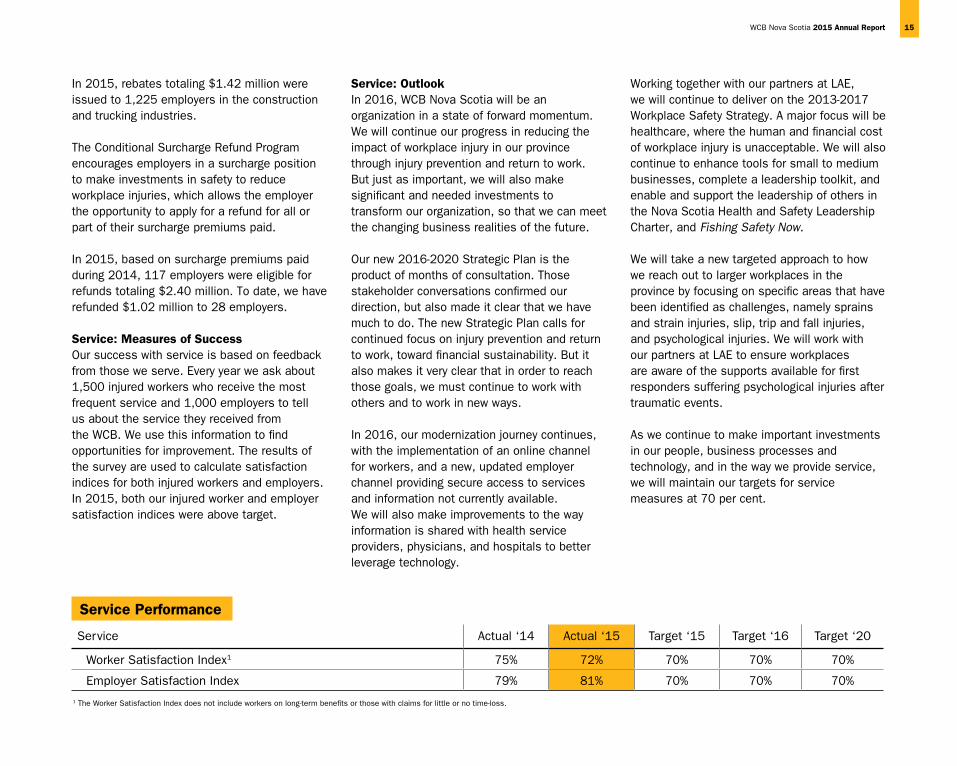
Service Performance
Service Actual ‘14 Actual ‘15 Target ‘15 Target ‘16 Target ‘20
Worker Satisfaction Index1 75% 72% 70% 70% 70%
Employer Satisfaction Index 79% 81% 70% 70% 70%
1 The Worker Satisfaction Index does not include workers on long-term benefits or those with claims for little or no time-loss.
WCB Nova Scotia 2015 Annual Report 15

In2015,wecontinuedtobuildworkplacesafetyawareness.Ourawarenesscampaign,WhatMattersMost,continuedtostrikeanemotionalchordwithNova Scotians, reminding them that the most important reason for making your workplace safe is not at work at all.
An extension of the campaign targeted organizational leaders who are in positions to inspire and influence safety practices in their workplaces. An inspirational video, business magazine print ads, and real-time online banners (above) were used to reach this important audience.
Workplace visits with an interactive photo booth also proved popular, and a “Safety Sticks” workplace kit was developed for employers targeting young workers. Social media activity continued with regular activity via Twitter, Facebook and blogs. We also began work on new material focused on return toworkwithourcounterpartsinNewBrunswick,PrinceEdwardIslandandNewfoundlandandLabrador.
16 WCB Nova Scotia 2015 Annual Report

Operations
Healthcare FocusAlmost 80 per cent of time-loss claims reported to WCB Nova Scotia by healthcare workers were musculoskeletal injuries (MSIs), and many of these injuries are linked to lifting, transferring and repositioning residents, patients and clients. Under the Soteria Strains initiative, a provincial strategy for healthcare workplace MSI injury prevention, the Safe Resident Handling and Mobility Program was implemented throughout healthcare and long-term care facilities in the province in 2015 (see page 25). As well, program resource materials were made available to healthcare professionals through its website at soteriahealth.ca.
Hospitals, long-term care homes and adult residential facilities are among the top five most violent places to work in Nova Scotia. The WCB continued to work with our healthcare partners at AWARE-NS (the Nova Scotia Health and Community Services Safety Association) to develop and deliver guidance and program materials to reduce the risk of injury due to violence and aggression in healthcare settings.
The Workplace Safety Strategy identifies healthcare as one of the sectors requiring particular focus to improve its workplace safety performance. The assessment rates for the home care and long-term care sectors are among the highest in the province which is the result of high injury frequency in these two sectors.
Working closely with our stakeholders and partners, we will begin to develop a healthcare strategy in 2016 that will position the healthcare sector for success over the next five years.
Social MarketingSee page 16 for an update on our workplace safety awareness efforts for 2015.
New Strategic PlanThe WCB Strategic Plan 2016-2020, released in May, sets out a bold course for evolution over the next five years. Our vision – Nova Scotians – safe and secure from workplace injury – is supported by five strategic goals that are critical to our long-term success:
• Buildaworkplace safety culture;• Improveoutcomesforsafe and timely
return to work;• Befinancially stable and sustainable;• Expand strategic relationships to enhance
the commitment to workplace health and safety and return to work across the province;
• Provideexcellent and efficient service, leveraging technology to meet worker and employer expectations.
The new plan validates our continued focus on injury prevention and safe and timely return to work, toward financial sustainability of the workers’ compensation system, and retains these foundations. It further underscores that to reach those goals we must continue to work with others and to engage workplaces in new ways.
But it also calls for change. Nova Scotians have told us we need to transform our business – processes, people and systems – into a modern, efficient and effective system that will meet the needs of those we serve. The improvements needed are significant, and they will allow the WCB to be more responsive and agile in the work we do, and will help to achieve the reductions in the impact of workplace injury Nova Scotia needs to see over the long term.
Achieving the plan’s outcomes will require all Nova Scotians coming together to achieve a common goal.
INJU
RY PREVENTION
RETURN TO W
OR
K
MO
DER
NIZ
ATIO
N
ST
RATE
GIC RELATIONSHIPS PROGRESS TO F
ULL F
UN
DIN
G
VisionNova Scotians – safe and secure from workplace
injury.
Expand strategic relationships to
enhance the commitment to
workplace health and safety and return to
work across the province.
Provide excellent and efficient
service, leveraging technology to meet
worker and employer
expectations.
Build a workplace
safety culture.
Be financially stable and
sustainable.
Improve outcomes for
safe and timely return to work.
WCB Nova Scotia 2015 Annual Report 17
2016 RatesIn September, we notified approximately 18,800 covered employers of their 2016 assessment rates. For the 12th year in a row, the average assessment rate remains stable at $2.65 per $100 of assessable payroll.
Safety associations in the province are influential in creating a positive impact on the reduction of injuries for their member organizations. This year, the construction industry increased their levy to ensure resources for prevention programming and continued success in reducing their industry’s injury rate.
Business TransformationOur stakeholders have told us we need to modernize in order to better meet their needs. We have listened. In the first full year of implementing the WCB’s business transformation, a number of significant milestones were achieved to provide even better service and to position the organization well as it moves on to bigger changes.
In December, the WCB launched two new service improvements for injured workers, employers and service providers.
• Anewphonesystemwithsecureself-servefeatures makes it easier for those we serve to access information. Callers can access some basic claim and account information, and make changes to their accounts. The service enhancement means that callers can access some information 24/7.
• Directdepositwasexpandedasasecurepayment option for more types of benefits – more workers are now able to receive their eligible benefits quickly and securely.
Stakeholders have been very clear that we must modernize. Our systems are 25 years old, and in need of replacement – updates are necessary if we are to meet our performance outcomes for injury prevention and return- to-work.
Every investment is weighed with a business case, and our Board of Directors is closely engaged throughout the whole process. These improvements come at a significant cost, but we no longer have the option not to make them. It is a necessary investment for our service to continue reducing the human and economic impact of workplace injury, and for us to achieve our overall business goals.
We are also in the process of implementing stronger knowledge management to better organize our information and make it easier for our teams to access what they need, when they need it. In 2016, we will also add online service channels, building on the basic employer account access that exists today, along with other related changes and process improvements, at a budgeted investment of $11 million.
In the future, we will explore improvements to the core claims and employer assessment systems, which will be a more significant investment. In other jurisdictions where similar systems have been replaced, the investment has been in the tens of millions of dollars.
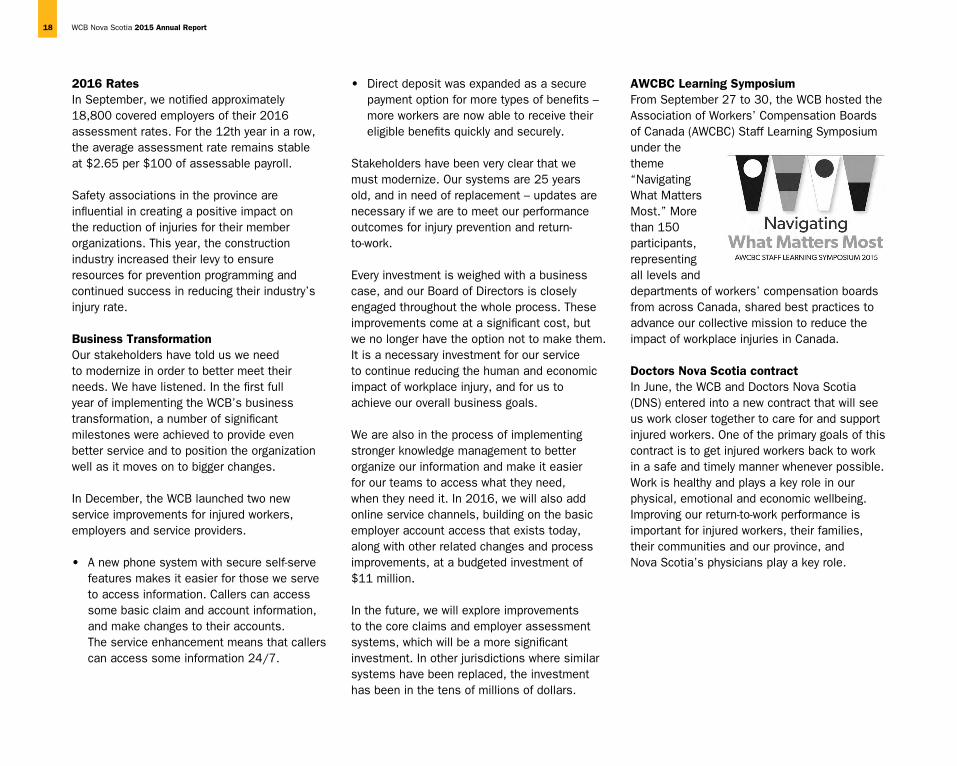
AWCBC Learning SymposiumFrom September 27 to 30, the WCB hosted the Association of Workers’ Compensation Boards of Canada (AWCBC) Staff Learning Symposium under the theme “Navigating What Matters Most.” More than 150 participants, representing all levels and departments of workers’ compensation boards from across Canada, shared best practices to advance our collective mission to reduce the impact of workplace injuries in Canada.
Doctors Nova Scotia contractIn June, the WCB and Doctors Nova Scotia (DNS) entered into a new contract that will see us work closer together to care for and support injured workers. One of the primary goals of this contract is to get injured workers back to work in a safe and timely manner whenever possible. Work is healthy and plays a key role in our physical, emotional and economic wellbeing. Improving our return-to-work performance is important for injured workers, their families, their communities and our province, and Nova Scotia’s physicians play a key role.
18 WCB Nova Scotia 2015 Annual Report

Operations: Measures of SuccessOverall, there has been incredible progress over the last several years. However, in 2015 we encountered realities that impacted the province’s injury rate. Significant progress in some sectors has been counterbalanced by declines in other sectors. We finished 2015 with an injury rate of 1.84, slightly higher than 2014, but still significantly less than the rate from just five years ago of 2.13.
There are also more time-loss days in our system than expected due to more days returning to our system from external appeals than anticipated. These are reflected in our composite duration index, and we achieved an index of 108 days, well above our target of 102. Some workplaces faced challenges with safe and timely return to work that led to more time-loss days paid. Days were also added to the system due to an increase of appeals on older claims and the continued adjustment to plain language decision writing.
In Nova Scotia, claims durations are longer than in many other provinces. We must work to help injured workers return to their jobs on a timely basis in 2016 and beyond, shifting focus in our social marketing from prevention to return to work, and integrating our messages into the fabric of our operations.
We continue to remain concerned about the number of workplace tragedies experienced in Nova Scotia. We will not waver in our focus on reducing workplace tragedies. We are encouraged by the increased focused effort by many of our safety partners, especially in
fishing and construction, and we will continue to support the implementation of the Fishing Safety Now plan to achieve better outcomes.
Operations: Outlook2016 marks year four of the Workplace Safety Strategy. Together with the Department of Labour and Advanced Education (LAE) and our many other partners, we continue to deliver on the goals of the strategy. In particular, we will continue to work to improve the workplace safety performance of high-risk sectors such as fishing and healthcare. This means leveraging our expertise and resources and continuing to actively seek out new partnership opportunities. We will also explore ways to enhance existing return-to-work programs and services.
Our operational plan for 2016 will support the goals and priorities set out in our new 2016-2020 Strategic Plan, building on the significant progress the WCB has made over the past number of years. It provides an opportunity to evolve our strategies to meet challenges related toitsfiveareasoffocus:injuryprevention;returntowork;progressingtofullfunding;strategic relationships and modernization.
We will guide the development of a healthcare sector strategy to further advance progress with injury prevention and return to work in the long-term care and home care sectors. This sector will be a major priority – it faces deep, challenging issues leading to unacceptable strain on workers and their families, at an unacceptable cost to employers. We will work with stakeholders to create a plan for a better way forward.
As well, we will enable the implementation of the Fishing Safety Now plan, in order to continue to influence health and safety outcomes in this sector.
As we work to reduce the impact of workplace injury on our province, the WCB will continue to transform our business to meet our long-term goals as well as worker and employer service expectations. As we do so, we will also continue to enhance our business processes and to support and empower employees as we cultivate a high performing team with the right skills, knowledge and aptitudes to achieve our strategic objectives.
In 2016, the WCB will continue striving toward full funding, with exciting organizational change and continued progress in injury prevention and return to work. Guided by the goals and strategies in the new five-year strategic plan, we will devote our energies to improve outcomes for workers and employers, and to ensure progress toward our long-term goals continues.
We are committed to making the changes that are needed so that we continue to do all we can to ensure every Nova Scotian comes home from work safe.
WCB Nova Scotia 2015 Annual Report 19

NovaScotia’stoporganizationalsafety honour – the Safety Award of Excellence – went to PrattandWhitneyCanada’sEnfield operation. Employees gather to celebrate the win with StephaneTurbide,FacilityGeneralManager, Pratt and Whitney, with Stuart MacLean, CEO of WCB NovaScotia,andKellyRegan,Minister of Labour and Advanced Education.
The Mainstay Awards, sponsored by WCB Nova Scotia and Department of Labour and Advanced Education, celebrate excellence in occupational health and safety, injury prevention and return-to-work programs.
In May 2015, 10 awards were presented at a ceremony in Halifax during North American Occupational Safety and Health (NAOSH) Week. Pratt and Whitney Canada’s Enfield Operation was awarded the Safety Award of Excellence.
Other recipients of 2015 Mainstay awards were: Linda Corkum (Nova Scotia Trucking Safety Association) – Safety AwardofExcellence,Individual;PeterKohlerWindowsandEntranceSystems–SafetyTransformation;TheNovaScotiaHealthResearchFoundation–SpecialAwardforSmallBusiness;ShawnTaylor(HalifaxWater)–IndividualSafetyChampion;HussmannCanada–EmployerSafetyChampion;TheShawGroupLimited–EmployerSafetyChampion;CumberlandHealthAuthority–EmployerReturntoWorkChampion;CanadaPostCorporation–EmployerReturntoWorkChampion;andConradLeLièvre(EngineersNovaScotia)–HealthandSafetyEducator.
The 2016 Mainstay Awards will be announced in May 2016 during NAOSH Week.
20 WCB Nova Scotia 2015 Annual Report

Employees
Competency Framework and Learning and Development StrategyIn 2015, we continued to evolve our existing processes and tools in order to position us for performance and service success. Along with new processes, technology and tools, the knowledge, skills and abilities of both leaders and front-line employees also need to evolve. As well, the nature of the work is changing. Competency Framework exploration and our interim Learning and Development Plan continue to enable employees in the short term while helping to inform our long-term strategy of hiring and developing the right people to enable performance outcomes.
Change LeadershipWe worked closely with our leadership team in 2015 to ensure we support our people through our business transformation. Ensuring leaders are prepared to guide their people, and their teams through this change is important in supporting employees, and in helping us maintain performance outcomes as we go through change.
AwardsIn 2015, WCB Nova Scotia was recognized as a Top Employer in Atlantic Canada and as a Top Employer in Nova Scotia. The Top Employer program recognizes the employers in each jurisdiction that lead their industries in offering exceptional places to work. This marks the eighth time the WCB has been recognized. As well, Stuart MacLean was named one Atlantic Canada’s Top 50 CEOs by Atlantic Business Magazine.
Health and SafetyIn 2015, an external WCB Safety Certified audit scored the WCB’s internal health and safety practices at 99 per cent. This score speaks to the incredible importance we place on the health and safety of our people.
Inspire AwardsThe Inspire Awards Program recognizes the exceptional efforts of our employees to make a difference for the people we serve, by living our values and demonstrating a commitment to achieving our priorities. Employees are nominated for this honour by their colleagues, and values-based awards are bestowed in three categories: Can-do Attitude, Safety Champion, and Caring and Compassionate.
The 2015 winners are:
• CaringandCompassionate– Marian MacDonald (Central Services) and Pam Harnish, Christa Larade, Shelley Oickle, Tracy Oickle, and Cherry Pittman (The Occupational Disease Team)
• SafetyChampion–KellyMacDonald(Partnerships) and Allison Himmelman (Communications)
• Can-doAttitude–LesleyStreatch (Central Services)
Operations Performance
Operations Actual ‘14 Actual ‘15 Target ‘15 Target ‘16 Target ‘20
Time-loss injuries per 100 covered workers 1.82 1.84 1.80 1.83 1.70
Duration index – composite, in days 102 108 102 107 100
Time-loss days paid per 100 covered employees 226 236 222 231 202
Cost of New Extended Earnings Replacement Benefits ($M) 46.8 54.5 49.0 51.0 52.6
Return to Employability 96% 95% 96% 95% 95%
WCB Nova Scotia 2015 Annual Report 21
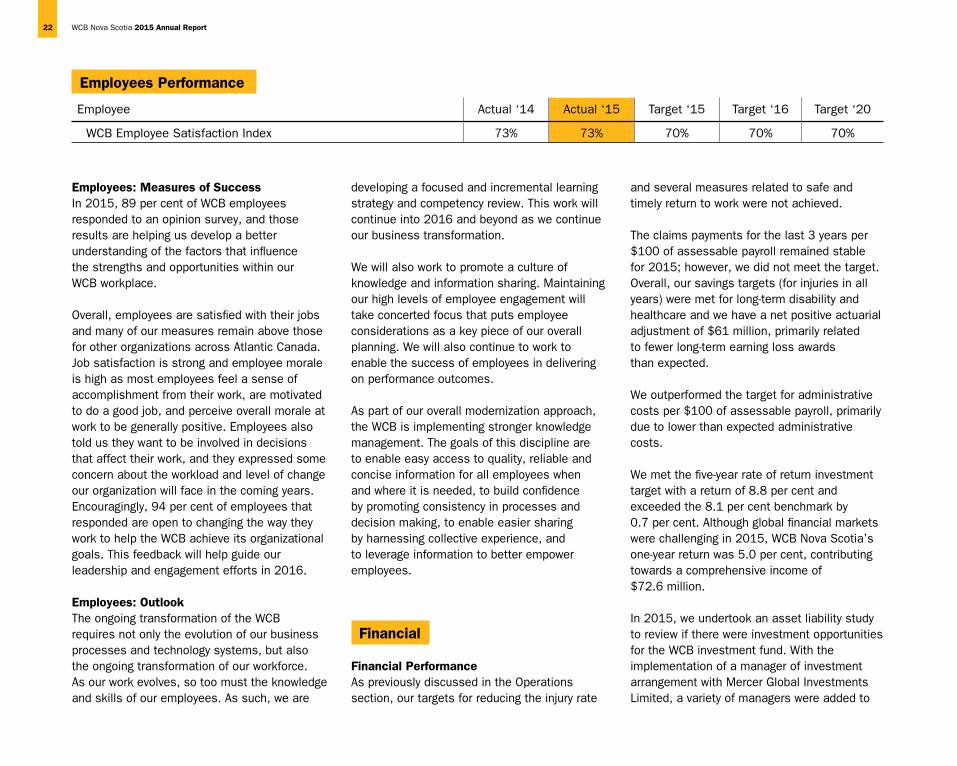
Employees: Measures of Success In 2015, 89 per cent of WCB employees responded to an opinion survey, and those results are helping us develop a better understanding of the factors that influence the strengths and opportunities within our WCB workplace.
Overall, employees are satisfied with their jobs and many of our measures remain above those for other organizations across Atlantic Canada. Job satisfaction is strong and employee morale is high as most employees feel a sense of accomplishment from their work, are motivated to do a good job, and perceive overall morale at work to be generally positive. Employees also told us they want to be involved in decisions that affect their work, and they expressed some concern about the workload and level of change our organization will face in the coming years. Encouragingly, 94 per cent of employees that responded are open to changing the way they work to help the WCB achieve its organizational goals. This feedback will help guide our leadership and engagement efforts in 2016.
Employees: Outlook The ongoing transformation of the WCB requires not only the evolution of our business processes and technology systems, but also the ongoing transformation of our workforce. As our work evolves, so too must the knowledge and skills of our employees. As such, we are
developing a focused and incremental learning strategy and competency review. This work will continue into 2016 and beyond as we continue our business transformation.
We will also work to promote a culture of knowledge and information sharing. Maintaining our high levels of employee engagement will take concerted focus that puts employee considerations as a key piece of our overall planning. We will also continue to work to enable the success of employees in delivering on performance outcomes.
As part of our overall modernization approach, the WCB is implementing stronger knowledge management. The goals of this discipline are to enable easy access to quality, reliable and concise information for all employees when and where it is needed, to build confidence by promoting consistency in processes and decision making, to enable easier sharing by harnessing collective experience, and to leverage information to better empower employees.
Financial
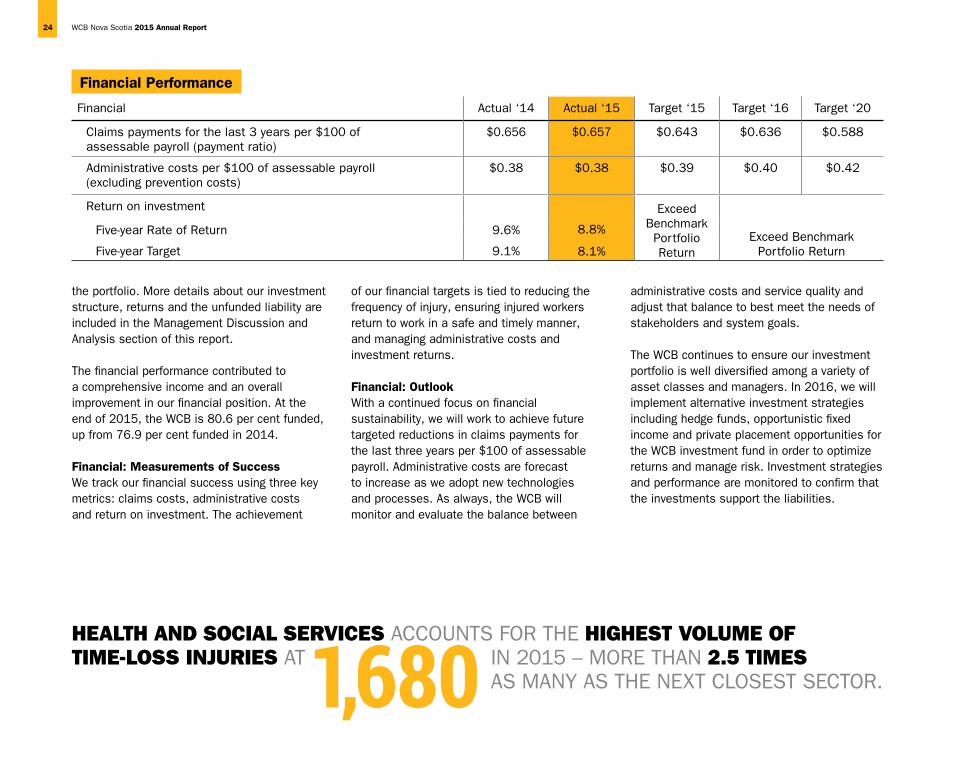
Financial PerformanceAs previously discussed in the Operations section, our targets for reducing the injury rate
and several measures related to safe and timely return to work were not achieved.
The claims payments for the last 3 years per $100 of assessable payroll remained stable for2015;however,wedidnotmeetthetarget.Overall, our savings targets (for injuries in all years) were met for long-term disability and healthcare and we have a net positive actuarial adjustment of $61 million, primarily related to fewer long-term earning loss awards than expected.
We outperformed the target for administrative costs per $100 of assessable payroll, primarily due to lower than expected administrative costs.
We met the five-year rate of return investment target with a return of 8.8 per cent and exceeded the 8.1 per cent benchmark by 0.7 per cent. Although global financial markets were challenging in 2015, WCB Nova Scotia’s one-year return was 5.0 per cent, contributing towards a comprehensive income of $72.6 million.
In 2015, we undertook an asset liability study to review if there were investment opportunities for the WCB investment fund. With the implementation of a manager of investment arrangement with Mercer Global Investments Limited, a variety of managers were added to
Employees Performance
Employee Actual ‘14 Actual ‘15 Target ‘15 Target ‘16 Target ‘20
WCB Employee Satisfaction Index 73% 73% 70% 70% 70%
22 WCB Nova Scotia 2015 Annual Report

Road travel presents one of the most significant hazards for WCB employees who frequently travel around the province serving workers and employers.
DuringNorthAmericanOccupationalSafetyandHealth(NAOSH)Week2015,employeesandmanagersatWCBNovaScotiawereinvitedtotesttheirdriving skills on a driving simulator. Events like this raise workplace health and safety awareness in an engaging, informative way.
Picturedaboveare(L-R)KimFraser,KenisseTrotmanandJulieRobichaud.
WCB Nova Scotia 2015 Annual Report 23
the portfolio. More details about our investment structure, returns and the unfunded liability are included in the Management Discussion and Analysis section of this report.
The financial performance contributed to a comprehensive income and an overall improvement in our financial position. At the end of 2015, the WCB is 80.6 per cent funded, up from 76.9 per cent funded in 2014.
Financial: Measurements of SuccessWe track our financial success using three key metrics: claims costs, administrative costs and return on investment. The achievement
of our financial targets is tied to reducing the frequency of injury, ensuring injured workers return to work in a safe and timely manner, and managing administrative costs and investment returns.
Financial: OutlookWith a continued focus on financial sustainability, we will work to achieve future targeted reductions in claims payments for the last three years per $100 of assessable payroll. Administrative costs are forecast to increase as we adopt new technologies and processes. As always, the WCB will monitor and evaluate the balance between
administrative costs and service quality and adjust that balance to best meet the needs of stakeholders and system goals.
The WCB continues to ensure our investment portfolio is well diversified among a variety of asset classes and managers. In 2016, we will implement alternative investment strategies including hedge funds, opportunistic fixed income and private placement opportunities for the WCB investment fund in order to optimize returns and manage risk. Investment strategies and performance are monitored to confirm that the investments support the liabilities.
HealtH and social services ACCOUNTS FOR THE HigHest volume of time-loss injuries AT IN 2015 – MORE THAN 2.5 times AS MANy AS THE NExT CLOSEST SECTOR.1,680
Financial Performance
Financial Actual ‘14 Actual ‘15 Target ‘15 Target ‘16 Target ‘20
Claims payments for the last 3 years per $100 of assessable payroll (payment ratio)
$0.656 $0.657 $0.643 $0.636 $0.588
Administrative costs per $100 of assessable payroll (excluding prevention costs)
$0.38 $0.38 $0.39 $0.40 $0.42
Return on investment
8.8%
8.1%
Exceed Benchmark
Portfolio Return
Exceed Benchmark Portfolio Return
Five-year Rate of Return 9.6%
Five-year Target 9.1%
24 WCB Nova Scotia 2015 Annual Report

Moving or handling people puts healthcare workers at risk every day. Almost 80 per cent of time-loss claims reported to WCB Nova Scotia by healthcare workersinvolvemusculoskeletalinjuries(MSIs).Manyarelinkedtothelifting,transferring,andrepositioningofresidents,patients,andclients.
A train-the-trainer workshop for the Safe Resident Handling Program was developed by WCB and delivered to long-term care homes throughout the provincein2015.
Picturedabove(L-R),WandaBezanson,DirectorofEnvironmentalServices,RosedaleHomesforSpecialCare,NewGermany;DarrylHaynes,TerritoryManager, The Stevens Company Limited and Deborah Atwood, Director of Care at Roseway Manor, Shelburne, participate in a Safe Resident Handling Program workshop at Harbourview Haven in Lunenburg.
In2016,workingcloselywithourstakeholdersandpartners,wewillcontributetothedevelopmentofastrategytoimproveworkplacesafety in healthcare.
WCB Nova Scotia 2015 Annual Report 25

Modernization is a key strategic goalinournew2016-2020Strategic Plan. Stakeholders have told us, very clearly, that we need to improve our systems. Our base systems are more than two decades old, and are at risk of not performing the way we need them to into the future.
In2015,wemadeimprovementsto our phone system. When employers, workers and service providers call WCB Nova Scotia, they are now able to access some basic claim and account information, and make changes to their account, using secure, self-serve options at any time. During our regular business hours, callers can speak to a person at any time by pressing zero.
Prior to launching the new features, we asked employers, service providers and injured workers from across the province to help us choose the new voice of our phone system. The clear favourite was Courtney Seibring, a voice actor from Halifax. Courtney is pictured to the right recording voice messages for the new phone system.
26 WCB Nova Scotia 2015 Annual Report

Management’s Responsibility for Financial Reporting
The financial statements of the WCB Nova Scotia are prepared by management, which is responsible for the integrity and fairness of the data presented, including significant accounting judgments and estimates. This responsibility includes selecting appropriate accounting principles consistent with International Financial Reporting Standards (IFRS).
In discharging its responsibility for the integrity and fairness of the financial statements, management maintains the necessary internal controls designed to provide reasonable assurance that relevant and reliable financial information is produced and assets are properly safeguarded. Internal audit service providers perform periodic audits designed to test the adequacy and consistency of the WCB’s internal controls.
The WCB’s Board of Directors has approved the financial statements included in this annual report. The Board of Directors is assisted in its responsibilities by the Finance, Audit and Risk Committee. This committee reviews and recommends approval of the financial statements and meets periodically with management, the independent actuaries, and the internal and external auditors concerning internal controls and all other matters relating to financial reporting.
The firm of Eckler Partners Ltd. has been appointed as independent consulting actuaries to the WCB. Their role is to complete an independent annual actuarial valuation of the benefits liabilities included in the financial statements of the WCB and to report thereon in accordance with accepted actuarial principles.
Ernst & young LLP, the external auditors of the WCB, have performed an independent audit of the financial statements of the WCB in accordance with auditing standards generally accepted in Canada. The Auditors’ Report outlines the scope of this independent audit and the opinion expressed.
Stuart MacLean Leo D. Mckenna, CPA, CAChief Executive Chief Financial Officer Officer
WCB Nova Scotia 2015 Annual Report 27
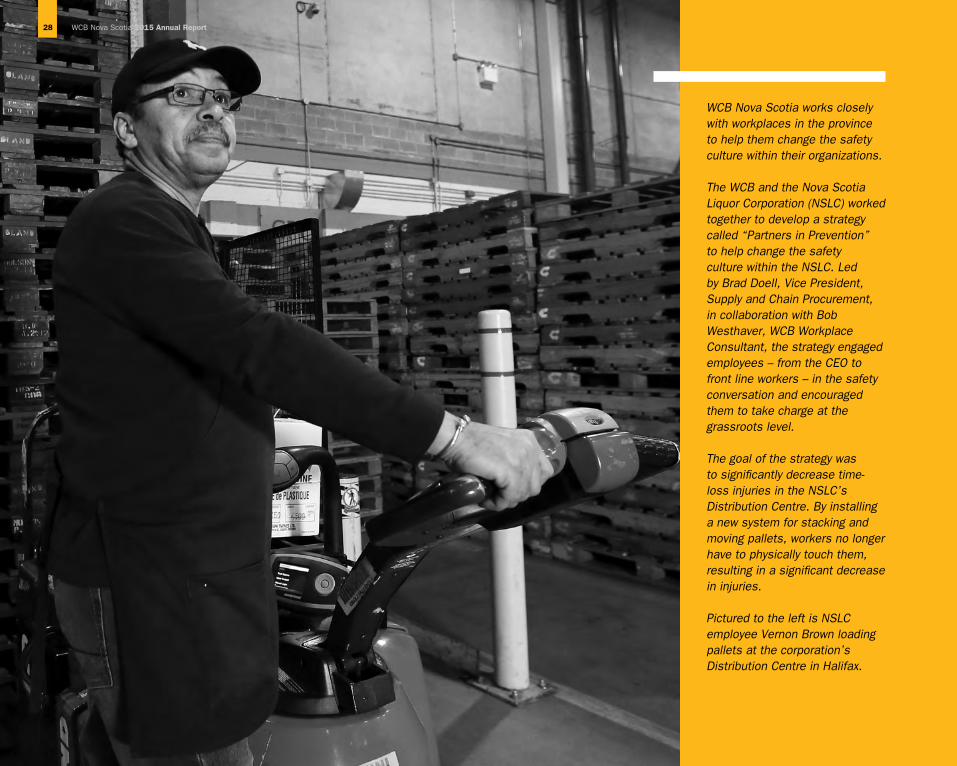
WCB Nova Scotia works closely with workplaces in the province to help them change the safety culture within their organizations.
The WCB and the Nova Scotia Liquor Corporation (NSLC) worked together to develop a strategy called “Partners in Prevention” to help change the safety culture within the NSLC. Led by Brad Doell, Vice President, Supply and Chain Procurement, in collaboration with Bob Westhaver, WCB Workplace Consultant, the strategy engaged employees – from the CEO to front line workers – in the safety conversation and encouraged them to take charge at the grassroots level.
The goal of the strategy was to significantly decrease time-lossinjuriesintheNSLC’sDistribution Centre. By installing a new system for stacking and moving pallets, workers no longer have to physically touch them, resulting in a significant decrease in injuries.
Pictured to the left is NSLC employee Vernon Brown loading palletsatthecorporation’sDistribution Centre in Halifax.
28 WCB Nova Scotia 2015 Annual Report
Management Discussion and Analysis
As an integral part of the annual report, the Management Discussion and Analysis (MD&A) provides further insight into the operations and financial position of the Workers’ Compensation Board (WCB). The discussion and analysis should be read in conjunction with the audited financial statements and supporting notes.
Forward-looking Information
This report contains forward-looking information and actual results may differ materially. Forward-looking information is subject to many risks and uncertainties as this information may contain significant assumptions about the future. Forward-looking information includes, but is not limited to, WCB goals, strategies, targets, outlook and funding strategy.
Risk and uncertainties about future assumptions include, but are not limited to, the changing financial markets, industry mix related to the covered work force in Nova Scotia, the economy, legislation, accounting standards, appeals and court decisions, and other risks which are known or unknown. We caution the reader about placing reliance on forward-looking information contained herein.
Statement of Financial Position
The WCB’s financial position was strengthened in 2015, despite challenging results on some key operational performance measures. This was the primarily the result of favorable actuarial adjustments, materializing from past successes.
Investments
Benefits for injuries occurring in a year are paid in the year of injury and, for some workers, for many years after the injury. The WCB maintains an investment portfolio to secure the payment of benefits in the future.
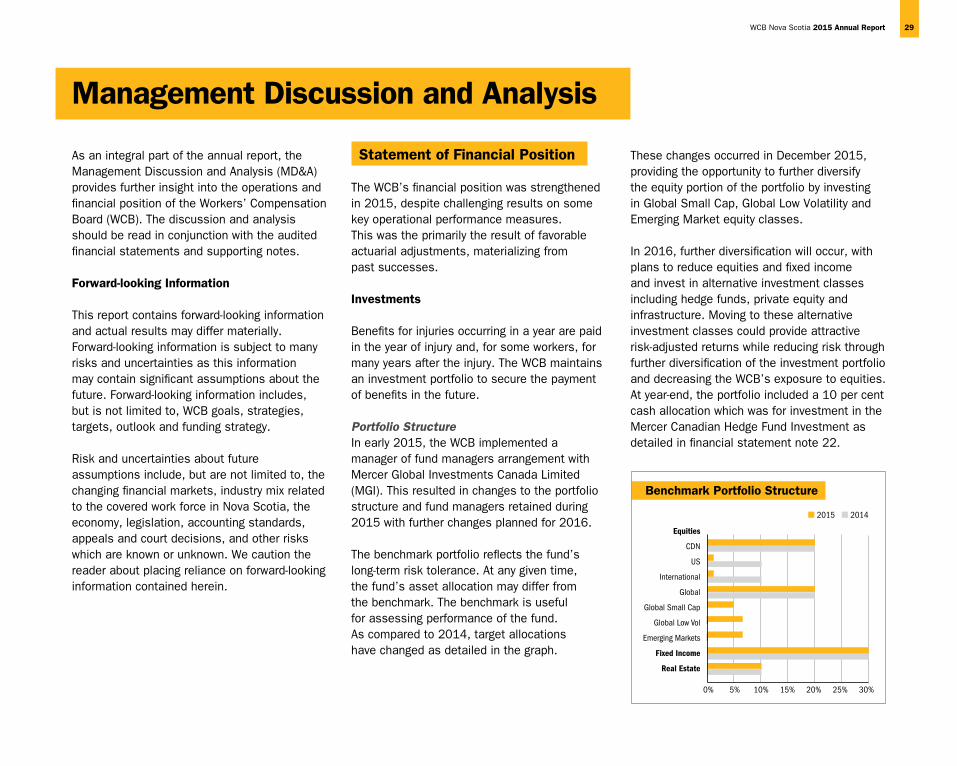
Portfolio Structure In early 2015, the WCB implemented a manager of fund managers arrangement with Mercer Global Investments Canada Limited (MGI). This resulted in changes to the portfolio structure and fund managers retained during 2015 with further changes planned for 2016.
The benchmark portfolio reflects the fund’s long-term risk tolerance. At any given time, the fund’s asset allocation may differ from the benchmark. The benchmark is useful for assessing performance of the fund. As compared to 2014, target allocations have changed as detailed in the graph.
These changes occurred in December 2015, providing the opportunity to further diversify the equity portion of the portfolio by investing in Global Small Cap, Global Low Volatility and Emerging Market equity classes.
In 2016, further diversification will occur, with plans to reduce equities and fixed income and invest in alternative investment classes including hedge funds, private equity and infrastructure. Moving to these alternative investment classes could provide attractive risk-adjusted returns while reducing risk through further diversification of the investment portfolio and decreasing the WCB’s exposure to equities. At year-end, the portfolio included a 10 per cent cash allocation which was for investment in the Mercer Canadian Hedge Fund Investment as detailed in financial statement note 22.
Equities
CDN
US
International
Global
Global Small Cap
Global Low Vol
Emerging Markets
Fixed Income
Real Estate
0% 5% 10% 15% 20% 25% 30%
■ 2015 ■ 2014
Benchmark Portfolio Structure
WCB Nova Scotia 2015 Annual Report 29
The WCB uses an active investment strategy where the investment manager is charged with exceeding the market index returns for all asset classes except fixed income. This is a change from 2014 where a passive investment strategy (the investment manager is charged with achieving market index returns) was in place for one-half of the Canadian equities, all of the fixed income investments and an active strategy were used for all other asset classes. The WCB continues to use a passive currency hedging overlay strategy with a hedge ratio of 50 per cent of the total foreign currency exposure.
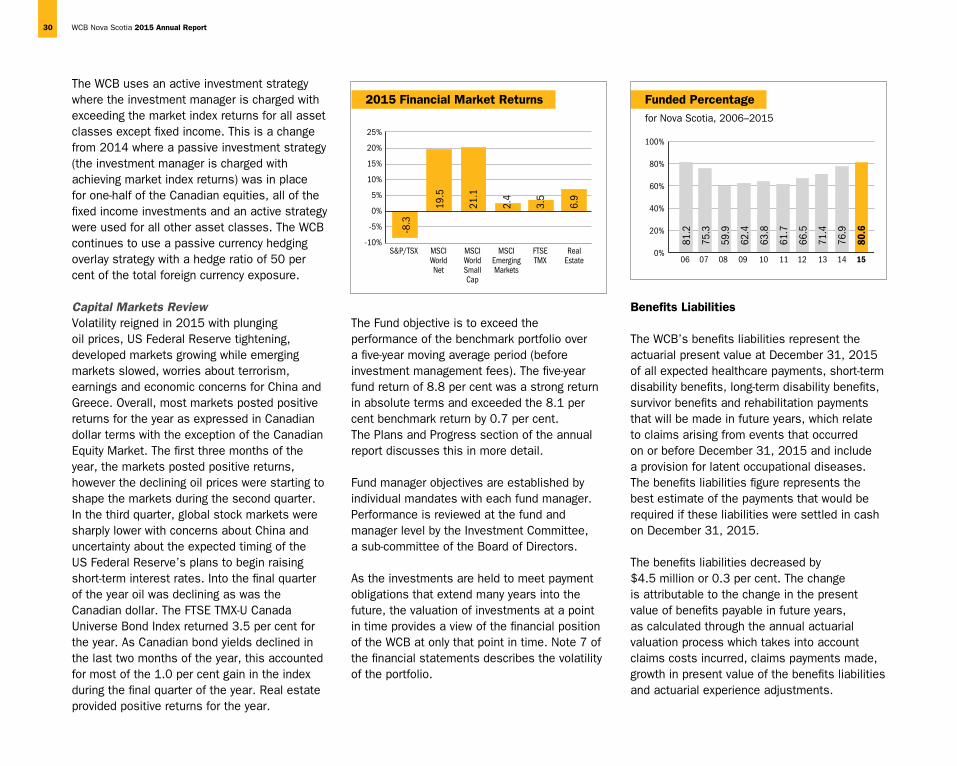
Capital Markets Review Volatility reigned in 2015 with plunging oil prices, US Federal Reserve tightening, developed markets growing while emerging markets slowed, worries about terrorism, earnings and economic concerns for China and Greece. Overall, most markets posted positive returns for the year as expressed in Canadian dollar terms with the exception of the Canadian Equity Market. The first three months of the year, the markets posted positive returns, however the declining oil prices were starting to shape the markets during the second quarter. In the third quarter, global stock markets were sharply lower with concerns about China and uncertainty about the expected timing of the US Federal Reserve’s plans to begin raising short-term interest rates. Into the final quarter of the year oil was declining as was the Canadian dollar. The FTSE TMx-U Canada Universe Bond Index returned 3.5 per cent for the year. As Canadian bond yields declined in the last two months of the year, this accounted for most of the 1.0 per cent gain in the index during the final quarter of the year. Real estate provided positive returns for the year.
The Fund objective is to exceed the performance of the benchmark portfolio over a five-year moving average period (before investment management fees). The five-year fund return of 8.8 per cent was a strong return in absolute terms and exceeded the 8.1 per cent benchmark return by 0.7 per cent. The Plans and Progress section of the annual report discusses this in more detail.
Fund manager objectives are established by individual mandates with each fund manager. Performance is reviewed at the fund and manager level by the Investment Committee, a sub-committee of the Board of Directors.
As the investments are held to meet payment obligations that extend many years into the future, the valuation of investments at a point in time provides a view of the financial position of the WCB at only that point in time. Note 7 of the financial statements describes the volatility of the portfolio.
Benefits Liabilities
The WCB’s benefits liabilities represent the actuarial present value at December 31, 2015 of all expected healthcare payments, short-term disability benefits, long-term disability benefits, survivor benefits and rehabilitation payments that will be made in future years, which relate to claims arising from events that occurred on or before December 31, 2015 and include a provision for latent occupational diseases. The benefits liabilities figure represents the best estimate of the payments that would be required if these liabilities were settled in cash on December 31, 2015.
The benefits liabilities decreased by $4.5 million or 0.3 per cent. The change is attributable to the change in the present value of benefits payable in future years, as calculated through the annual actuarial valuation process which takes into account claims costs incurred, claims payments made, growth in present value of the benefits liabilities and actuarial experience adjustments.
2015 Financial Market Returns
NEW CHART
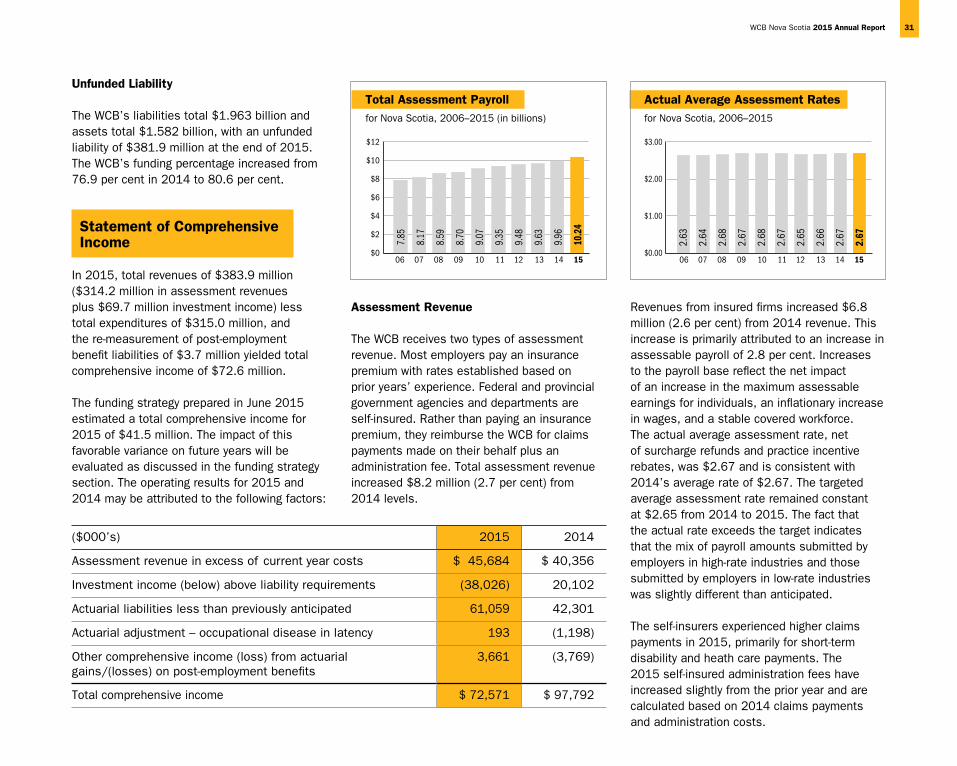
Funded Percentage
for Nova Scotia, 2006–2015
100%
80%
60%
40%
20%
0%06 07 08 09 10 11 12 13 14 15
Funded Percentagefor Nova Scotia, 2006–2015
81.2
75.3
59.9
62.4
63.8
61.7
66.5
71.4
76.9
80.6
25%
20%
15%
10%
5%
0%
-5%
-10%S&P/TSX MSCI
World Net
MSCIWorldSmall Cap
MSCIEmerging Markets
FTSE TMX
Real Estate
-8.3
19.5
21.1
2.4
3.5
6.9
30 WCB Nova Scotia 2015 Annual Report
Unfunded Liability
The WCB’s liabilities total $1.963 billion and assets total $1.582 billion, with an unfunded liability of $381.9 million at the end of 2015. The WCB’s funding percentage increased from 76.9 per cent in 2014 to 80.6 per cent.
Statement of Comprehensive Income
In 2015, total revenues of $383.9 million ($314.2 million in assessment revenues plus $69.7 million investment income) less total expenditures of $315.0 million, and the re-measurement of post-employment benefit liabilities of $3.7 million yielded total comprehensive income of $72.6 million.
The funding strategy prepared in June 2015 estimated a total comprehensive income for 2015 of $41.5 million. The impact of this favorable variance on future years will be evaluated as discussed in the funding strategy section. The operating results for 2015 and 2014 may be attributed to the following factors:
Assessment Revenue
The WCB receives two types of assessment revenue. Most employers pay an insurance premium with rates established based on prior years’ experience. Federal and provincial government agencies and departments are self-insured. Rather than paying an insurance premium, they reimburse the WCB for claims payments made on their behalf plus an administration fee. Total assessment revenue increased $8.2 million (2.7 per cent) from 2014 levels.
Revenues from insured firms increased $6.8 million (2.6 per cent) from 2014 revenue. This increase is primarily attributed to an increase in assessable payroll of 2.8 per cent. Increases to the payroll base reflect the net impact of an increase in the maximum assessable earnings for individuals, an inflationary increase in wages, and a stable covered workforce. The actual average assessment rate, net of surcharge refunds and practice incentive rebates, was $2.67 and is consistent with 2014’s average rate of $2.67. The targeted average assessment rate remained constant at $2.65 from 2014 to 2015. The fact that the actual rate exceeds the target indicates that the mix of payroll amounts submitted by employers in high-rate industries and those submitted by employers in low-rate industries was slightly different than anticipated.
The self-insurers experienced higher claims payments in 2015, primarily for short-term disability and heath care payments. The 2015 self-insured administration fees have increased slightly from the prior year and are calculated based on 2014 claims payments and administration costs.
($000’s) 2015 2014
Assessment revenue in excess of current year costs $ 45,684 $ 40,356
Investment income (below) above liability requirements (38,026) 20,102
Actuarial liabilities less than previously anticipated 61,059 42,301
Actuarial adjustment – occupational disease in latency 193 (1,198)
Other comprehensive income (loss) from actuarial gains/(losses) on post-employment benefits
3,661 (3,769)
Total comprehensive income $ 72,571 $ 97,792
NEW CHART
Total Assessment Payroll
for Nova Scotia, 2006–2015 (in billions)
$12
$10
$8
$6
$4
$2
$006 07 08 09 10 11 12 13 14 15
7.85
8.17
8.59
8.70
9.07
9.35
9.48
9.63
9.96
10.2
4
NEW CHART
Actual Average Assessment Rates
for Nova Scotia, 2006–2015
$3.00
$2.00
$1.00
$0.0006 07 08 09 10 11 12 13 14 15
2.63
2.64
2.68
2.67
2.68
2.67
2.65
2.66
2.67
2.67
WCB Nova Scotia 2015 Annual Report 31

Investment Income
Investment income is derived from the investment portfolio managed by external investment managers. Total investment income was $69.7 million for 2015, a decrease of $65.5 million (48.4 per cent) from 2014. In 2015, the annual investment return on the externally managed portfolio was 5.0 per cent compared to 10.4 per cent in 2014. While the 5.0 per cent was not a large absolute return and less than the 6.0 per cent in the fundingplanfor2015;thereturnexceeded the benchmark return of 4.5 per cent, resulting in added value of 0.5 per cent.
As a result of the transition to the manager of fund managers arrangement, holdings with former fund managers were sold and this explains the increase in realized gains of $232.7 million from 2014 and the conversion of unrealized gains to realized gains account for the declines in fair market values during the year. The WCB recognizes changes in market value of investments in the year of occurrence. Note 6 to the financial statements provides investment income details.
Claims Costs Incurred
Claims costs incurred are an estimate of the costs related to injuries which occurred in 2015. These estimates take into account both unreported claims and claims reported but as yet unpaid. The liabilities include a provision for the future cost of administering claims that occurred on or before December 31, 2015. The incremental change for occupational disease liabilities is accrued in 2015. The liability does not include an allowance for any changes
to present policies and practices or for the extension of new coverage types.
Claims costs incurred increased by $1.5 million (0.8 per cent) from 2014. Several factors influenced this aggregate result as discussed below.
Claims costs incurred for short-term disability increased 5.5 per cent in 2015 due to inflation and an increase in the average time injured workers were off the job. An increase in the injury rate per 100 covered workers from 1.82 in 2014 to 1.84 also put upward pressure on short-term disability costs.
The 0.3 per cent decrease in long-term disability costs resulted from a variety of factors. The volume and amount of new awards was the main driver of the cost decrease. In 2015, new permanent impairment awards had a lower average impairment rating and a larger portion of earnings loss was mitigated compared to 2014.
From 2011 to 2015, we saw significant reductions in Extended Earnings Replacement Benefits (EERB) volumes compared to those awarded in earlier years. In 2015, this sustained positive experience led to a decrease in the volume of long-term awards predicted from injuries that occurred in 2015 and prior years.
Healthcare costs increased 0.6 per cent in 2015, following payments that were approximately 3 per cent less than expected. The majority of the payment savings occurred in the early durations (i.e. recent injury years). For individuals whose injuries occurred five or more years in the past, payments were approximately as expected.
Survivor costs have decreased 13.8 per cent ($0.8 million) in 2015. Claim volumes and costs in this area fluctuate year to year, and are not necessarily indicative of a trend.
2015 2014
■ Short-term Disability $ 41,100 20.1% $ 38,975 19.3%■ Long-term Disability $100,791 49.4% $101,069 49.9%■ Survivor Benefits $ 4,790 2.3% $ 5,558 2.7%■ Healthcare $ 56,403 27.6% $ 56,080 27.7%■ Rehabilitation $ 947 0.5% $ 898 0.4%
Total Claims Costs Incurred
(in thousands)
32 WCB Nova Scotia 2015 Annual Report

Non-income rehabilitation costs are costs other than wage replacement benefits paid to workers in rehabilitation programs or workers receiving assistance with home or workplace modifications. In 2015, rehabilitation costs increased from 2014 by 5.5 per cent ($0.05 million). Fluctuations occur year to year in rehabilitation costs as significant costs incurred on a small number of claims have a notable impact.
Growth in Present Value of Liabilities, Change in Assumptions and Actuarial Experience Adjustments
The benefits liability is calculated based on historical claims payment data coupled with assumptions about future experience. The growth in the present value of benefits liabilities is the increase in the present value of prior years’ obligations due to an interest amount reflecting the time value of money. In 2015, this amount was $107.8 million or approximately 5.7 per cent of the benefits liabilities. This amount varies slightly by benefit category as the expected inflation component varies. Based on the long-term assumptions for inflation and investment returns, we expect growth to occur at approximately 6.0 per cent annually.
In 2015, there were no changes in actuarial assumptions. The assumed Consumer Price Index (CPI) rate was 2.5 per cent. The CPI at 2.5 per cent combined with the real rate of return on assets assumption of 3.5 per cent results in a gross rate of return of 6.0 per cent.
In 2015, there were favourable actuarial experience adjustments of $61.1 million. These adjustments represent the difference between what was predicted based on the actuarial assumptions and methods used in the prior valuation and what actually occurred in the year.
In 2015, the volume of new EERBs and survivor awards on insured claims was below the volume assumed in the actuarial assumptions resulting in a favorable adjustment of $35.4 million. Other factors such as decreases in anticipated inflation for awards in pay, mortality experience, future claims administration costs and other non-specified actuarial adjustments resulted in favorable adjustments totaling $25.7 million. We expect this experience to continue in the next few years and to result in continued favourable experience in long-term disability. The timing and magnitude of the savings is difficult to predict until a series of representative data emerges over the next few years.
Recent years have been producing fewer EERBs with 336 in 2015 compared to the 485 average from 2002 to 2005. For example, for injury year 2005, EERBs awarded as of December 31, 2006, the year following injury, totaled 68. For injury year 2014, EERBs awarded as of December 31, 2015, the year following injury, totaled 34.
The number of Permanent Impairment Benefits (PIB) awarded in 2015 was 22.5 per cent higher than in 2014, increasing from 1,187 to 1,454. Volumes continue to be substantially lower than in prior years when they peaked at close to 1,800 in 2007, however the volume of
new awards in 2015 was higher than the 1,225 awards predicted in the valuation assumptions.
Administrative Costs
Administrative expenditures in 2015 totaled $48.4 million, an increase of $0.9 million or 1.8 per cent from 2014. This is primarily due to increases in professional fees, projects and other administrative expenses partially offset by decreases in wages, travel and training expenses. We anticipate costs will increase in the next few years as we make important changes to become more modern and efficient to position our organization to meet challenges anticipated in future years.
Legislated Obligations
The WCB reimburses the Province of Nova Scotia for the operating costs of the Occupational Health and Safety Division of the Department of Labour and Advanced Education, the Workers’ Advisers Program and the Workers’ Compensation Appeals Tribunal. The WCB and the Province of Nova Scotia have different fiscal years. The WCB’s year-end is December 31, and the Province year-end is March 31. The WCB’s expenses for legislated obligations are estimates based on the forecasts of expenditures supplied by the Province of Nova Scotia. The legislated obligations expenses reported by the WCB and the amounts reported by the Province can vary significantly.
WCB Nova Scotia 2015 Annual Report 33

Statement of Cash Flows
Cash decreased in 2015 as cash utilized for benefit payments and operations was slightly more than the cash generated through assessments premiums.
Funding Strategy
The funding of the WCB involves the funding of current year injuries and ensuring that sufficient assets are available to fund benefits awarded in the past. In Nova Scotia, the invested assets are not currently sufficient to fund these past injuries and this shortfall is the unfunded liability. The funding strategy maps out our approach to eliminate this unfunded liability between 2019 and 2023. The WCB’s funding strategy encompasses assumptions about revenue from the covered workforce payroll base, operational results and investment returns.
The strategy relies on growth in the payroll base in order to collect sufficient funds to eliminate the unfunded liability. Each year premiums are collected from employers based on a targeted average rate of $2.65 per $100 of assessable payroll. In 2015, the portion of the $2.67 actual average rate required to fund the estimated cost of injuries that occurred in the year is $1.67 with administration and legislated obligations costs absorbing an additional $0.56. The remaining $0.44 is available to be applied to reduce the unfunded liability and any shortfall of investment income to liability growth. Since 2011, the breakdown of the average rate is as follows:
Another key assumption in the funding strategy is a substantial reduction in the cost of workplace injuries through prevention and return-to-work programs and through a five-year program of transformational change in the way we deliver service. The goal is to reduce the combined cost of current year injuries, administrative and legislated obligations from thecurrent$2.23to$2.06in2022;andtoeliminate the unfunded liability. In 2015, the
reduction targets for time-loss claims and the amount of time people were off work due to injury were not achieved. This adds costs to the system and requires focus for employers, workers, and healthcare providers to work as a team in fostering safe and timely return to work.
Another key component of the funding strategy is the return on invested assets. Returns have been encouraging in the past few years, with the annualized 10-year return as of December 2015 of 6.2 per cent exceeding the current long-term assumption of 6.0 per cent. In order to achieve our funding goals, investment returns must meet or exceed the growth in liabilities (currently 6.0 per cent) between now and when full funding is achieved.
The WCB’s annual revision of the funding strategy in June 2015 maintained our previously published estimate of full funding between 2019 and 2023. The funding period was partially based on an estimated total comprehensive income for 2015 of $41.4 million. Given the number of variables affecting the funding position, annual variances are
Breakdown of Average Rate
for Nova Scotia, 2011–2015
$3.00
$2.50
$2.00
$1.50
$1.00
$0.50
$0.002011 2012 2013 2014 2015
n Exceeds Current Year Costsn Administrative and Legislative Obligations
n Claim Costs Incurred
200%
150%
100%
50%
0%ON* NS QC NL NT/NU BC AB NB MB PE SK YT**
* Source: 2014 Sufficiency Report to Stakeholders (Fourth Quarter Report). ** Source: 2014 Yukon Wokers' Compensation Health and Safety Board Annual Report
70.9
76.9
99.5
112.
1
115.
9
129.
7
136.
0
137.
3
137.
8
147.
2
153.
3
160.
0
Funded Percentage
All Provinces, 2014 (AWCBC)
34 WCB Nova Scotia 2015 Annual Report

expected. The actual total comprehensive income for 2015 was $72.6 million. This is $31.2 million more than expected in the funding strategy. The 2015 variances include:• Investmentincome$22.0millionless
than expected.• Actuarialadjustment$31.1millionmore
than expected.• Growthinbenefitsliability$10.2million
less than expected • Claimscostsincurred$1.8millionless
than expected. • AssessmentRevenue$2.2millionmore
than expected.• AdministrativeandLegislativeObligations
costs $4.2 million less than expected, and • There-measurementofpost-employment
benefits resulted in a gain of $3.7 million.
While financial progress is encouraging, there are many factors influencing the funding strategy. All of the assumptions are based on long-term expectations. Annual investment returns by their nature are unpredictable, and short-term results will vary from the long-term expectations. Revenue from the covered workforce is dependent on economic activity and the size of the covered workforce. Claims experience can vary and note 11 of the financial statements details areas of uncertainty, including actuarial experience, which may have a significant impact on the WCB’s benefits liabilities and funding strategy.
Risk Areas
Given the nature of our operations, the WCB is inherently susceptible to risks that, if unmitigated, could lead to significant financial consequences. Benefit costs, investment returns, economic conditions, fraudulent activities and technology risk are all considerations that can affect the WCB’s performance and financial results.
Benefit Costs
Benefit costs are affected by injury rates and by claim durations. The average rate paid by employers for workplace injury insurance is affected by benefit costs. Over the past decade, there have been significant changes in the breakdown of benefits cost per $100 of assessable payroll. For example, benefits related to chronic pain had a significant impact on the volume of permanent impairment and extended earnings loss awards granted between 2005 and 2008. This had an impact on the volume of expected permanent awards from 2009 to 2013 resulting in a substantial
increase in LTD costs per $100 of assessable payroll during that period.
Additionally, and in response to claims for benefits related to chronic pain, investments were made in health care and administration to facilitate injury prevention and improve return-to-work outcomes. These investments led to a sustained period of decreasing short-term disability costs through reduced injury rates and decreasing average duration of injuries. In recent years, the cost of healthcare per $100 of assessable payroll has been decreasing as a result of decreases in the volume of injuries and enhanced contract management. In 2015, long-term disability costs continued to decrease. This is the result of reduced claim volumes over time and improved return-to-work outcomes and is expected to continue into the next several years.
In 2015, the portion of the rate used to fund current year claims costs decreased almost 2 per cent from $1.70 in 2014 to $1.67. Additionally the portion of the rate
Benefit Costs Per $100 of Assessable Payroll
n STD n LTD n Survivor n Health n Rehab
$2.00
$1.50
$1.00
$0.50
$0.002006 2007 2008 2009 2010 2011 2012 2013 2014 2015
WCB Nova Scotia 2015 Annual Report 35

used to fund the costs of administration and legislated obligation decreased slightly from $0.57 in 2014 to $0.56 in 2015. At $2.23, the combined system costs are down almost 2 per cent from 2014 leaving $0.44 to apply to the unfunded liability and any shortfall of investment income to liability growth. Over the next 10 years, the funding strategy contemplates a further 8 per cent reduction in system costs to $2.06 in the year full funding is achieved. Although forecasts are subject to revision to reflect emerging trends and experience, at present, we expect that reductions in the injury rate and claim durations will yield the required savings.
Injury Rate
The injury rate is one of the most significant drivers of benefit costs and the focus of the WCB’s attention for risk mitigation. At the end of 2015, the injury rate was 1.84 time-loss injuries per 100 covered workers and is up 1.0 percent from 1.82 in 2014.
As of December 31, 2015, there were approximately 3,100 fewer time-loss injuries than in 2005 reflecting an average annual decrease of almost 5.0 per cent since 2005. While this is significant progress, cost reductions did not occur as originally expected. This was partially because the majority of the decrease in injury volume over the last nine years was among lower-cost injuries, and because savings from long-term disability costs take longer to materialize. Long-term disability cost reductions started to emerge in 2014 and continued into 2015 as the volume of long-term awards is less than assumed in previous
valuations. This experience is expected to continue for the next several years and further long-term disability cost reductions should result.
Claim Durations
In Nova Scotia, injured workers stay on short-term benefits longer than in many other provinces and a higher proportion go on to receive long-term benefits. The WCB’s early intervention and return-to-work philosophy is anticipated to reduce claims costs incurred over time by shortening durations and reducing the number of workers going on to long-term disability.
Claim durations are significantly influenced by the persistence of injuries that occur in the workplace. For purposes of tracking performance and estimating future cost savings,claimsaredividedintotwocategories;over and under 10 weeks. In recent years, we have seen a significant reduction in the volume of time-loss injuries. However, the decrease
has occurred primarily in the shorter, low cost, low complexity claims. Future expected savings therefore reflect a slight change is the historical split of claims with 19 per cent of time-loss claims assumed to persist beyond 10 weeks compared to 18 per cent in prior years. In other words, higher costs, higher complexity claims are becoming a greater portion of the total. If the mix of claims trends further outside of historical levels, duration targets will not be met and the funding strategy may be impacted.
Investment Returns
The WCB’s assets are diversified among a variety of asset classes and fund managers in order to optimize returns and manage risk. External investment managers are expected to comply with the WCB’s Statement of Investment Policies and Objectives (SIPO) that outlines permissible investments. The SIPO is designed so the portfolio will secure payment of the long-term liabilities of the WCB.
Injury Rate
time-loss claims per 100 covered employees
Compensable Time-Loss Claims
3
2
1
011 12 13 14 15
2.02
1.96
1.86
1.82
1.84
8,000
6,000
4,000
2,000
011 12 13 14 15
6,61
6
6,34
1
6,03
4
5,95
3
6,01
4
36 WCB Nova Scotia 2015 Annual Report

Some risks cannot be directly controlled by the WCB. These risks include market volatility and interest rate changes. Investment returns that are different than the long-term expectation for returns in the funding strategy can have a significant impact on our funding position.
The funding strategy has a real rate of return assumption of 3.5 per cent. Analysis indicates that 3.5 per cent is a realistic real rate of return based on 10-year, 30-year and 75-year running averages. The real rate of return coupled with our long-term CPI assumption of 2.5 per cent, yields a nominal rate of 6.0 per cent. During 2015 an asset liability study was completed. One benefit of the study was confirmation of the reasonableness of the asset allocation strategy used to diversify the investment portfolio. Results of this study supported the current investment strategy and give us some confidence that a long-term investment return of 6.0 per cent is a reasonable expectation.
Economic Conditions
The benefits liabilities of the WCB are partially indexed to the Consumer Price Index (CPI) on an annual basis. Payments to benefit recipients are increased by one-half of the Nova Scotia Consumer Price Index at the beginning of each calendar year. Any change to this formula would impact our liabilities and costs. Significant fluctuations in CPI represent a risk to the WCB. While CPI has been fairly stable in recent years, the risk exists that CPI may fluctuate due to unforeseen economic developments. We are also susceptible to cost increases in the health care system where in recent years the rate of growth has been greater than general inflation.
Nova Scotia’s employment is expected to increase slightly in 2016. This is expected to have minimal impact on the WCB covered workforce. Slow growth or contraction of the economy could impact the funding strategy where the growth in payroll falls below the funding strategy expected level.
Fraud
The WCB provides workplace injury insurance to 18,800 employers and about 326,000 workers across Nova Scotia and uses the services of thousands of service providers. The significant volume and value of the monetary transactions that occur create a risk to the WCB of fraudulent activity by internal and external stakeholders. To proactively strengthen the management of this risk, the WCB performs data quality and integrity checks, implements internal controls, follows a policy framework, and employs a Special Investigations Unit.
Technology
The reliability of WCB’s information technology is crucial to supporting the organization’s operations and safeguarding personal records. A system failure or security breach are significant risks to the WCB. The organization has taken steps to mitigate these risks by investing in technology, maintaining backup systems and processes, developing staff expertise and having a disaster recovery plan for information technology purposes.
In support of our mission, the WCB has embarked on a comprehensive program of business transformation, which will position the organization to be more efficient and meet the challenges of the digital environment. This will take place over the next several years, and in other jurisdictions where similar systems have been replaced, the investment has been tens of millions of dollars.
Critical Accounting Policies and Estimates
The WCB follows International Financial Reporting Standards (IFRS). IFRS requires that management make assumptions and estimates. Financial statement Note 3 “Significant Accounting Policies” and Note 4 “Accounting Judgments and Estimates” outline the WCB’s significant accounting policies and estimates.
Significant policies include measurement of investment income and the valuation of the benefits liabilities. Reported investment income is affected by the changes in fair market values of the investments held. These changes in fair value are recorded directly in income in the period the changes occur. This adds to the volatility of reported investment income from year to year.
The benefits liabilities determined in the financial statements are estimated using many actuarial assumptions. The two most significant assumptions are the long-term discount rate and the long-term inflation rate and estimates
WCB Nova Scotia 2015 Annual Report 37
are highly sensitive to small changes in these assumptions. Measurement uncertainty is high because of the amount, timing, and duration of the benefits. Actual future results will vary from the actuarial valuation estimate and the variations could be material. A sensitivity analysis relating to insurance risk is included in Note 11 of the financial statements. A revised IFRS 4 Insurance Contracts standard is expected to be issued in 2016. The basis of accounting for the benefits liabilities could change to fair value through utilizing a market based discount rate. This change could impact the WCB’s financial results. The effective date is currently expected to be 2020 or thereafter.
Outlook
The WCB operates as a going concern. The funding strategy supports the WCB’s ability to remain financially sustainable while maintaining the system and balancing worker and employer needs.
The funding strategy plan reflects the balance struck between the level of benefits, rates
charged to employers and the WCB’s funding position. When financial results are different than the target, whether better or worse, the choice becomes: adjust benefits, adjust rates or lengthen or shorten the period over which the unfunded liability is eliminated. As the level of benefits is set by the Legislature, subject to interpretation by the Courts, the funding equation is not entirely within the control of the WCB as the neutral administrator.
In 2015, the funding position was strengthened, primarily attributable to favourable experience adjustments for injuries that occurred in prior years. The positive performance in 2015 increases the probability that we will be able to stay on plan and eliminate the unfunded liability between 2019 and 2023. Positive results are a step in the right direction and the focus will be to maintain momentum forward.
The Board of Directors will revisit the funding strategy as part of the annual budget process in June 2016. On an ongoing basis, the WCB weighs the views of stakeholders on a number
of topics, which includes conversations about the appropriate level of benefits, rates charged to employers and the WCB’s funding position.
The WCB recognizes that there will be variances from the funding strategy each year. The funding strategy contains numerous assumptions about future financial performance and spans many years. The length of the period, coupled with the number of assumptions, makes the funding strategy fairly sensitive to changes. Small changes in the early years potentially have a considerable impact in the later years.
Although the funding strategy clearly labels assumptions as such, many users may credit the strategy with more certainty and precision than warranted given the number and nature of assumptions it contains. Users should remember that the funding strategy is our best estimate of what will happen given the assumptions. As noted in previous annual reports and the funding strategy, actual results will differ from the projections and these differences may be material.
38 WCB Nova Scotia 2015 Annual Report

WCB Nova Scotia employees devote their time and money to help people in need in our communities.
ForMichelleGabriel,CaseManager,GovernmentandSelf-InsuredIntegratedService Team, helping others is a large part of her life. She has volunteered for morethan30charitiesinthepast20years. She chooses a charity a month, collecting money and other necessities, and reaches out to her WCB co-workers, who are always happy to contribute.
Formorethan10years,Michellehasspent her Sundays with a young man with special needs who lives in a group home. She takes him bowling, and to other activities.
Most recently, Michelle created an e-shower for a Syrian family sponsored by the church where she works in the soup kitchen. They came to Canada with a newborn and Michelle raised money and collected items to make sure the family had everything from a crib todiapers.Inthepicturetotheright,Michelle is dropping off the last load of items she has collected for the family.
“My WCB co-workers have been an unbelievable support to so many different organizations,” said Michelle. “It’sallalotoffun.Iamsoblessedwith this crew and all of the WCB support!”
WCB Nova Scotia 2015 Annual Report 39
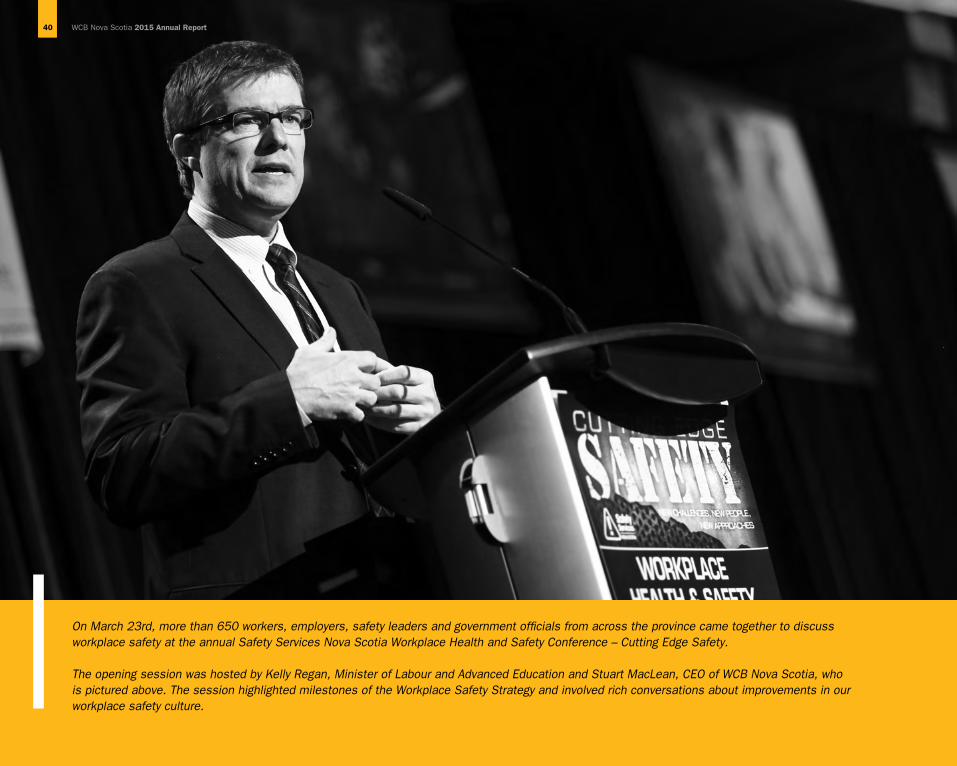
OnMarch23rd,morethan650workers,employers,safetyleadersandgovernmentofficialsfromacrosstheprovincecametogethertodiscussworkplace safety at the annual Safety Services Nova Scotia Workplace Health and Safety Conference – Cutting Edge Safety.
TheopeningsessionwashostedbyKellyRegan,MinisterofLabourandAdvancedEducationandStuartMacLean,CEOofWCBNovaScotia,whois pictured above. The session highlighted milestones of the Workplace Safety Strategy and involved rich conversations about improvements in our workplace safety culture.
40 WCB Nova Scotia 2015 Annual Report

Independent Auditors’ Report
To the Members of the Board of Directors Workers’ Compensation Board of Nova Scotia
We have audited the accompanying financial statements of the Workers’ Compensation Board of Nova Scotia, which comprise the statement of financial position as at December 31, 2015 and the statements of comprehensive income, changes in the unfunded liability, and cash flows for the year then ended, and a summary of significant accounting policies and other explanatory information.
Management’s responsibility for the financial statementsManagement is responsible for the preparation and fair presentation of these financial statements in accordance with International Financial Reporting Standards, and for such internal control as management determines is necessary to enable the preparation of financial statements that are free from material misstatement, whether due to fraud or error.
Auditors’ responsibilityOur responsibility is to express an opinion on these financial statements based on our audit. We conducted our audit in accordance with Canadian generally accepted auditing standards. Those standards require that we comply with ethical requirements and plan and perform the audit to obtain reasonable assurance about whether the financial statements are free from material misstatement.
An audit involves performing procedures to obtain audit evidence about the amounts and disclosures in the financial statements. The procedures selected depend on the auditors’ judgment, including the assessment of the risks of material misstatement of the financial statements, whether due to fraud or error. In making those risk assessments, the auditors consider internal control relevant to the entity’s preparation and fair presentation of the financial statements in order to design audit procedures that are appropriate in the circumstances, but not for the purpose of expressing an opinion on the effectiveness of the entity’s internal control. An audit also includes evaluating the appropriateness of accounting policies used and the reasonableness of accounting estimates made by management, as well as evaluating the overall presentation of the financial statements.
We believe that the audit evidence we have obtained is sufficient and appropriate to provide a basis for our audit opinion.
OpinionIn our opinion, the financial statements present fairly, in all material respects, the financial position of the Workers’ Compensation Board of Nova Scotia as at December 31, 2015 and the results of its operations and its cash flows for the year then ended in accordance with International Financial Reporting Standards.
Chartered Accountants Halifax, Canada March 17, 2016
WCB Nova Scotia 2015 Annual Report 41

Statement of Financial Position
asatDecember31(thousandsofdollars)
2015 2014
AssetsCash & cash equivalents $ 1,805 $ 3,804Receivables (Note 5 and 17) 28,190 25,378Investments (Note 6) 1,546,039 1,476,748Property and equipment (Note 8) 4,307 4,402Intangible assets (Note 9) 1,184 917
$ 1,581,525 $ 1,511,249
Liabilities and Unfunded LiabilityPayables and accruals $ 37,443 $ 33,801Lease liabilities 83 171Post-employment benefits (Note 10) 26,804 28,158Benefits liabilities (Note 11) 1,899,061 1,903,556
1,963,391 1,965,686
Unfunded liability (381,866) (454,437)
$ 1,581,525 $ 1,511,249
Commitments (Note 19)Capital Management (Note 21)Subsequent Events (Note 22)
Approved on behalf of the Board of Directors on March 17, 2016:
Rodney Burgar Angus BonnymanChair, Board of Directors Chair, Finance, Audit, and Risk Committee
Statement of Comprehensive Income
yearendedDecember31(thousandsofdollars)
2015 2014
RevenueAssessments (Notes 12 and 17) $ 314,187 $ 305,968Investment income (Note 6) 69,738 135,271
383,925 441,239
ExpensesClaims costs incurred (Notes 11, 16 and 17) 204,031 202,580Growth in present value of benefits liabilities and actuarial adjustments (Note 11) 46,512 74,066Administration costs (Notes 13, 17 and 20) 48,399 47,520System support (Note 14) 868 936Legislated obligations (Note 15) 15,205 14,576
315,015 339,678
Excess of revenues over expenses 68,910 101,561
Other comprehensive income (loss) Re-measurement of post- employment benefits (Note 10) 3,661 (3,769)
Total Comprehensive income $ 72,571 $ 97,792
The accompanying notes are an integral part of the financial statements.
42 WCB Nova Scotia 2015 Annual Report

The accompanying notes are an integral part of the financial statements.
Statement of Changes in the Unfunded Liability
yearendedDecember31(thousandsofdollars)
2015 2014
Unfunded liability excluding accumulated other comprehensive income Balance, beginning of year $ (444,927) $ (546,488)Excess of revenues over expenses 68,910 101,561
$ (376,017) $ (444,927)
Accumulated other comprehensive incomeBalance, beginning of year $ (9,510) $ (5,741)Other comprehensive income (loss) 3,661 (3,769)
$ (5,849) $ (9,510)
Unfunded liability end of year $ (381,866) $ (454,437)
Statement of Cash Flows
yearendedDecember31(thousandsofdollars)
2015 2014
Operating ActivitiesCash received from: Employers, for assessments $ 308,990 $ 301,706 Net investment income 284,984 75,321
593,974 377,027
Cash paid to: Claimants or third parties on their behalf (248,724) (243,241) Suppliers, for administrative and other goods and services (61,232) (59,361)
(309,956) (302,602)
Net cash provided by operating activities 284,018 74,425
Investing ActivitiesIncrease in investments, net (284,532) (75,474)Purchases of equipment and intangible assets (1,485) (1,506)
Net cash used in investing activities (286,017) (76,980)
Net (decrease) in cash and cash equivalents (1,999) (2,555)
Cash and cash equivalents, beginning of year 3,804 6,359
Cash and cash equivalents, end of year $ 1,805 $ 3,804
WCB Nova Scotia 2015 Annual Report 43

NOTES TO THE FINANCIAL STATEMENTSyearendedDecember31,2015(thousandsofdollars)
1. NATURE OF OPERATIONS
The Workers’ Compensation Board of Nova Scotia (WCB) is a board established by the Nova Scotia Legislature in 1917, under the Workers’ Compensation Act (Act), and is exempt from income tax. The address of the WCB’s primary operations is 5668 South Street in Halifax, Nova Scotia. Pursuant to the Act, the WCB strives to prevent workplace injury, but when it occurs, supports injured workers and their employers to achieve a timely return to safe and healthy work; administers the payment of benefits to injured workers and dependents; levies and collects assessment revenues from established classes of employers in amounts sufficient to cover the costs of claims and administration; and invests funds held for future benefit payments.
The current Act came into force February 1, 1996. Various amendments have since occurred to the Act and have received Royal Assent.
These financial statements were authorized for issue in accordance with a resolution of the Board of Directors on March 17, 2016.
2. BASIS OF PREPARATION
Statement of compliance These financial statements have been prepared in accordance with International Financial
Reporting Standards (IFRS). The principal accounting policies applied in preparation of these financial statements are set out below.
Going concern The WCB has assessed all relevant financial and economic indicators and has determined that
there is an ability to operate as a going concern, as supported by the funding strategy in place for the elimination of the unfunded liability.
Basis of measurement The financial statements have been prepared on the historical cost basis except for certain
financial instruments that are measured at fair value as explained in the significant accounting policies below. Historical cost is based on the fair value of the consideration given in exchange for assets.
These financial statements are prepared and rounded in thousands of Canadian Dollars unless otherwise stated.
3. SIGNIFICANT ACCOUNTING POLICIES
These financial statements have been prepared within the framework of the following accounting policies:
a) Cash and Cash Equivalents Money market instruments with original maturities of three months or less are considered to
be cash equivalents and are recorded at cost, which approximates fair market value.
Bank indebtedness includes the utilization of a line of credit. Cash advances from the line of credit bear interest at the bank’s prime interest rate less 1 per cent.
b) Assessments Revenue and Receivable Premiums are billed when employers report their employees’ insurable earnings for an applicable
assessment year. For employers who have not reported, premiums are estimated based on historical experience and any difference between actual and estimated premiums is adjusted in the following year. As a significant portion of premium income for the year is not received until after year-end, the amount recorded is a combination of actual and estimate based on statistical data. The difference between the estimate and the actual income received is adjusted to income in the following year. Historically, the difference has not been material.
c) Investments The investment portfolio consists of redeemable units in pooled funds. All portfolio investments
are designated as fair value through profit and loss. Realized gains and losses on the sale of investments and unrealized gains and losses arising from the change in the fair value of investments are recorded in investment income in the period in which they arise. All purchases and sales of portfolio investments are recognized on the date the trades are executed. Income from interest, dividends, distributions from pooled funds and investment foreign currency gains and losses are recognized as investment income in the period earned. These distributions are automatically reinvested within the pooled funds. Investment income is presented net of investment expenses.
The following determines fair value of investments:• Pooledfundunits(equitiesandfixedincome)arevaluedattheiryear-endnetassetvalues
as determined by the fund managers.• Thefairvalueofrealestatefundunitsisbasedonindependentpropertyappraisalsnet
of fund liabilities as determined by the fund manager.• Forwardforeignexchangecontractsarerecordedatthecurrentunrealizedgainorloss
position at year-end based on quoted market prices for the underlying currencies.
d) Property and EquipmentProperty and equipment is stated at cost, less accumulated depreciation and when applicable, write-downs for impairment. Depreciation is charged using the straight-line method over the estimated useful life of the asset. A useful life of 10 to 40 years is used for building components and from 5 to 20 years for furniture and facilities, equipment and computer hardware. With the exception of equipment under finance leases, in the year of acquisition, a half year’s amortization is taken. The useful lives of items of property and equipment are reviewed at each balance sheet date and adjusted if required.
Finance Leases Finance leases transfer to the WCB substantially all the risks and benefits of ownership of the
leased property. These leases are capitalized at the commencement of the lease at the fair value of the leased property or, if lower, at the present value of the minimum lease payments. Lease payments are apportioned to interest charges and the reduction of the lease liability until the liability is reduced to zero at the end of the lease term. Leased assets are depreciated over the useful life of the asset or over the lease term, whichever is shorter.
e) Post-Employment Benefits Costs for employee future benefits, other than pensions, are accrued over the periods during
which the employees render services in return for these benefits. The projected unit credit method is used to calculate the defined benefit obligations and current service costs. Actuarial gains and losses arise from the actual experience of the plan’s liabilities for a period and are recorded through other comprehensive income with no subsequent reclassification to comprehensive income. Current service and interest costs are recorded through comprehensive income in the period in which they arise. Discount rates are based on the market yields of high quality corporate bonds.
44 WCB Nova Scotia 2015 Annual Report
f) Benefits Liabilities An independent actuary completes a valuation of the benefits liabilities of the WCB at each year-
end. The benefits liabilities represent the actuarial present value of all future benefits payments expected to be made for injuries which occurred in the current fiscal year or in any prior year including exposure for occupational diseases. The benefits liabilities includes provisions for all benefits provided by current legislation, policies and/or administrative practices in respect of existing claims and for future costs of administering existing claims. Changes to the benefits liability arising from growth in present value, changes in actuarial assumptions and actuarial experience adjustments are recognized in expense annually based on the year-end actuarial valuation. The benefits liabilities are accounted for using IFRS 4 – Insurance contracts.
g) Foreign Currency Translation Investments denominated in foreign currencies are converted to Canadian dollars at rates of
exchange prevailing at the balance sheet date. The resulting translation adjustment is accounted for on a basis consistent with the accounting policy for investments.
h) Financial Instruments The WCB early adopted IFRS 9 – Financial instruments (2009), which require financial
instruments to be classified as either amortized cost, or fair value through profit and loss. The applicable financial instruments for the WCB are as follows:• Accountsreceivableandpayable–recordedatamortizedcost• Investments–recordedasfairvaluethroughprofitandloss
The carrying values of accounts receivables and payables approximate fair values because of their short-term maturity and/or underlying terms and conditions. The WCB’s accounts receivable are not subject to significant concentration of credit risk because the accounts are owed by a large number of employers, the Province of Nova Scotia and the Government of Canada on normal credit terms. Accounts are reviewed regularly for consideration to be included in the allowance for doubtful account or to be written-off.
The investment portfolio does not contain any derivatives intended for speculation or trading purposes. The portfolio includes a currency overlay hedge strategy as described in Note 7. The WCB has elected not to apply hedge accounting.
i) Intangible Assets Intangible assets are stated at cost, less accumulated depreciation and when applicable, write-
downs for impairment. Intangible assets consist of externally purchased and internally generated software applications, and process development costs. To qualify for capitalization, the intangible asset must be separately identifiable, the WCB must have control of the asset and the asset must have future economic benefits.
Depreciation is charged on a straight-line basis over a period of five to 10 years for internally generated software and process development costs, with one half year’s depreciation taken in the year of completion.
Expenditures related to the research phase of an internal project are recognized as an expense in the period incurred. Software purchases are depreciated on a declining-balance basis at an annual rate of 50 per cent. The useful lives of intangible assets are reviewed at each reporting date and adjusted if required.
j) Asset Impairment Testing IFRS requires a test for impairment at least annually whenever there is objective evidence that
the carrying value of an asset may exceed its fair value. Impairment tests must be conducted for an individual asset, an asset group or at the cash-generating unit level which is the smallest identifiable group of assets that generates cash inflows independent of cash inflows of other assets.
Based on the analysis of the entity and its cash flows, the WCB has determined that it is a single cash generating unit. Impairment of assets at the entity level is unlikely as the WCB has the power under the Act to revise premiums to ensure the continuity of the workers’ compensation system. Therefore, individual assets are monitored for impairment using a variety of qualitative considerations including, but not limited to: obsolescence, damage, reduction in asset performance, disposal or the existence of plans to discontinue the use of the asset. If an asset is deemed impaired, the asset is written off completely or subjected to accelerated depreciation, whichever is appropriate.
k) Future Accounting Policy Developments WCB staff monitors the pronouncements of the International Accounting Standards Board (IASB)
and considers the impact that changes in standards may have on the WCB’s financial reporting. The IASB has ongoing projects to improve existing standards and issue new standards, some of which will impact the WCB in the future as follows:
IAS 1 – Presentation of Financial Statements – A revision was issued by IASB providing guidance in the determination of what information to disclose and how to present that information in the financial statements, the impact to potentially reduce some disclosures. The change has an effective date of January 1, 2016.
IFRS 9 – Financial instruments – The standard introduces the option to recognize unrealized investment gains and losses as fair value through other comprehensive income (OCI) with no subsequent reclassification to profit or loss. In the future, the WCB has an option to apply hedge accounting to show the effect of managing risk through hedges. The mandatory effective date for adoption is for years beginning on January 1, 2018.
IFRS 16 – Leases – This new standard requires all leases be treated as finance type leases with assets and liabilities recorded on the statement of financial position, with the exception of short-term and low dollar value leases. The most important change for the WCB will be reporting an asset and liability related to the WCB’s leases for office space. The new standard has an effective date of January 1, 2019.
4. ACCOUNTING JUDGEMENTS & ESTIMATES
The preparation of financial statements in conformity with IFRS requires management to make estimates and assumptions that affect the reported amounts of assets and liabilities, in particular, benefits liabilities, at the date of the financial statements and the reported amounts of revenues and expenses during the reporting periods. Actual results may differ materially from those estimates. Decisions of the WCB may be appealed to the Workers’ Compensation Appeals Tribunal, subsequently to the Nova Scotia Court of Appeal, and finally, to the Supreme Court of Canada. Rulings by these bodies have the potential to impact benefits liabilities. Legislated Obligations excluding the Workers’ Compensation Appeals Tribunal are based on forecasts supplied by the Province of Nova Scotia with the actual billing through an order in council occurring post release of the annual report.
Information about the judgments and estimates in applying accounting policies that have the most significant effect on the amounts recognized in the financial statements are discussed in detail in the following notes:• Note5–Receivables• Note10–Post-employmentbenefits• Note11–Benefitsliabilities• Note12–Assessmentrevenue
WCB Nova Scotia 2015 Annual Report 45

5. RECEIVABLES 2015 2014 Assessments $ 21,118 $ 18,806 Self-insured employers 3,916 4,400 Assessments receivable 25,034 23,206 Harmonized sales tax rebate 827 616 Other 2,329 1,556 $ 28,190 $ 25,378
Assessments receivable are net of an allowance for doubtful accounts of $3,477 in 2015 (2014 - $2,817). Other receivables are net of an allowance for doubtful accounts of $1,297 in 2015 (2014 - $1,157). Amounts written to bad debts were $900 in 2015 (2014 - $800).
6. INVESTMENTS 2015 2014
Equities Canadian $ 263,338 $ 295,699 United States - 160,253 Europe, Australasia and Far East - 133,083 Global 245,578 292,667 Global low volatility 102,551 - Global small cap 75,179 - Emerging markets 101,464 - 788,110 881,702Fixed income 468,149 449,521Real estate 151,547 146,057 Cash and money market 155,201 1,534Currency overlay (16,968) (2,374)Accrued interest - 308 $ 1,546,039 $ 1,476,748
Investment Income 2015 2014Interest and dividends $ 5,006 $ 5,768Distributions from pooled funds 47,990 47,700Realized gains from the sale of investments 269,967 37,232Change in fair market value (200,648) 56,508Currency overlay loss (47,861) (6,417)Portfolio management expenses (4,716) (5,520)Net investment income $ 69,738 $ 135,271
7. FINANCIAL RISK MANAGEMENT In accordance with IFRS 7 – Financial Instruments, Disclosure, the following provides qualitative
and quantitative information relating to market risk, interest rate and currency risks, credit risk and liquidity risk.
The WCB manages its investments in accordance with a Statement of Investment Policies and Objectives and manages investment risk by using a diversified portfolio both across and within asset classes engaging fund managers with a broad range of investment practices and styles.
Market risk Market risk is the risk that the value of a financial instrument will fluctuate as a result of
changes in market prices whether those changes are caused by factors specific to the individual instrument or its issuer or factors affecting all instruments traded in the market.
The following table presents the decrease to comprehensive income (CI) as a result of a potential adverse change in the key risk variable – the sector benchmark – for each equity mandate in the WCB’s investment portfolio. Possible outcomes are estimated using the historical five-year variability as measured by the standard deviation of each mandate.
2015 2014Equities % Change CI Impact % Change CI Impact (1 Std Deviation) (1 Std Deviation)
Canadian 11.1% $ (29,231) 11.9% $ (35,188)United States - $ - 12.6% $ (20,192)EAFE* - $ - 12.7% $ (16,902)Global 10.8% $ (26,522) 11.2% $ (32,779)Global Low Volatility 10.8% $ (11,076) - $ - Global Small Cap 13.7% $ (10,300) - $ - Emerging Markets 13.8% $ (14,002) - $ -
* Europe, Australasia and Far East
Interest rate risk Fluctuations in interest rates can impact the market value of the fixed-term investment portion
of the portfolio. Interest rate risk is mitigated through diversification of the term to maturities to partially match the duration of the benefits liabilities of 8.7 years. The duration of the bond portfolio was 7.4 years in 2015 (2014 - 7.4 years).
For fixed-income, the effect of a 0.5 per cent increase in market interest rates for the bond portfolio (which is held in pooled funds) would result in a decrease to comprehensive income of $17,415 in 2015 (2014 - $16,251).
Currency risk Currency risk is the risk of gain or loss due to movements in foreign currency rates as compared
to the Canadian Dollar. To mitigate these risks the WCB had foreign exchange forward contracts to hedge approximately 50 per cent of the foreign currency denominated assets held in British Pounds, Euros, Japanese Yen, and US Dollars. Foreign exchange forward contracts are contracts to exchange an amount of one currency for another at a future date at a set price determined at contract inception.
The following table presents the effect of a 10 per cent appreciation in the Canadian Dollar as compared to the US Dollar, Euro, Japanese Yen and British Pound and the decrease to compre-hensive income.
46 WCB Nova Scotia 2015 Annual Report
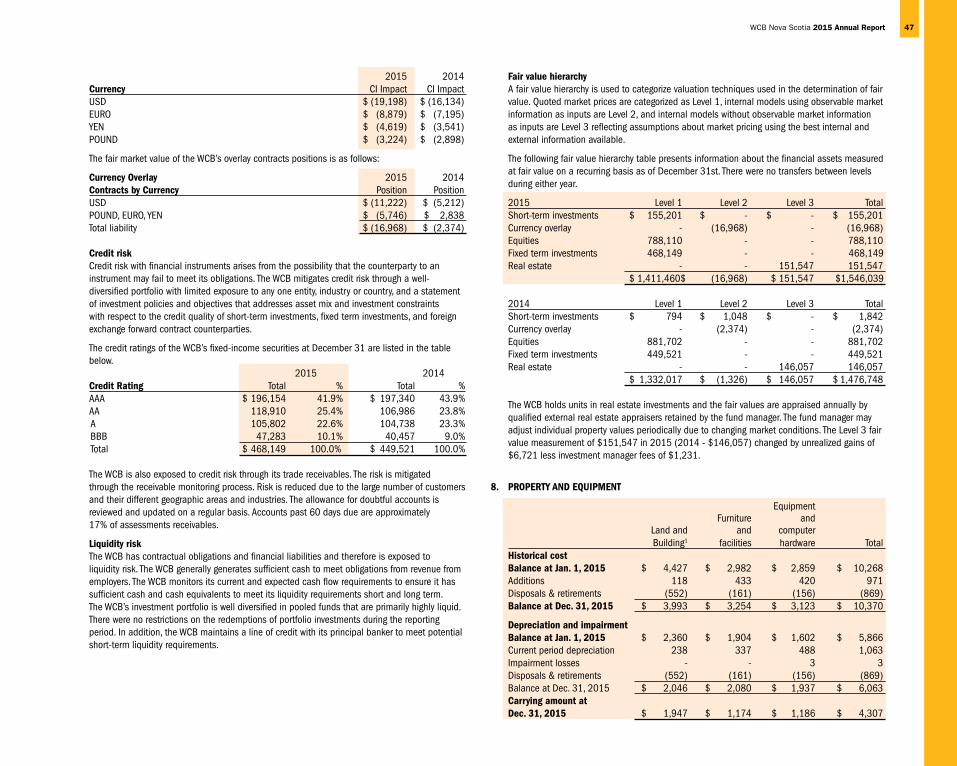
2015 2014 Currency CI Impact CI Impact
USD $ (19,198) $ (16,134)EURO $ (8,879) $ (7,195)YEN $ (4,619) $ (3,541)POUND $ (3,224) $ (2,898)
The fair market value of the WCB’s overlay contracts positions is as follows:
Currency Overlay 2015 2014Contracts by Currency Position PositionUSD $ (11,222) $ (5,212)POUND, EURO, YEN $ (5,746) $ 2,838Total liability $ (16,968) $ (2,374)
Credit risk Credit risk with financial instruments arises from the possibility that the counterparty to an
instrument may fail to meet its obligations. The WCB mitigates credit risk through a well-diversified portfolio with limited exposure to any one entity, industry or country, and a statement of investment policies and objectives that addresses asset mix and investment constraints with respect to the credit quality of short-term investments, fixed term investments, and foreign exchange forward contract counterparties.
The credit ratings of the WCB’s fixed-income securities at December 31 are listed in the table below.
2015 2014Credit Rating Total % Total % AAA $ 196,154 41.9% $ 197,340 43.9%AA 118,910 25.4% 106,986 23.8% A 105,802 22.6% 104,738 23.3% BBB 47,283 10.1% 40,457 9.0% Total $ 468,149 100.0% $ 449,521 100.0%
The WCB is also exposed to credit risk through its trade receivables. The risk is mitigated through the receivable monitoring process. Risk is reduced due to the large number of customers and their different geographic areas and industries. The allowance for doubtful accounts is reviewed and updated on a regular basis. Accounts past 60 days due are approximately 17% of assessments receivables.
Liquidity risk The WCB has contractual obligations and financial liabilities and therefore is exposed to
liquidity risk. The WCB generally generates sufficient cash to meet obligations from revenue from employers. The WCB monitors its current and expected cash flow requirements to ensure it has sufficient cash and cash equivalents to meet its liquidity requirements short and long term. The WCB’s investment portfolio is well diversified in pooled funds that are primarily highly liquid. There were no restrictions on the redemptions of portfolio investments during the reporting period. In addition, the WCB maintains a line of credit with its principal banker to meet potential short-term liquidity requirements.
Fair value hierarchy A fair value hierarchy is used to categorize valuation techniques used in the determination of fair
value. Quoted market prices are categorized as Level 1, internal models using observable market information as inputs are Level 2, and internal models without observable market information as inputs are Level 3 reflecting assumptions about market pricing using the best internal and external information available.
The following fair value hierarchy table presents information about the financial assets measured at fair value on a recurring basis as of December 31st. There were no transfers between levels during either year.
2015 Level 1 Level 2 Level 3 TotalShort-term investments $ 155,201 $ - $ - $ 155,201Currency overlay - (16,968) - (16,968)Equities 788,110 - - 788,110Fixed term investments 468,149 - - 468,149Real estate - - 151,547 151,547 $ 1,411,460 $ (16,968) $ 151,547 $ 1,546,039
2014 Level 1 Level 2 Level 3 TotalShort-term investments $ 794 $ 1,048 $ - $ 1,842Currency overlay - (2,374) - (2,374)Equities 881,702 - - 881,702Fixed term investments 449,521 - - 449,521Real estate - - 146,057 146,057 $ 1,332,017 $ (1,326) $ 146,057 $ 1,476,748
The WCB holds units in real estate investments and the fair values are appraised annually by qualified external real estate appraisers retained by the fund manager. The fund manager may adjust individual property values periodically due to changing market conditions. The Level 3 fair value measurement of $151,547 in 2015 (2014 - $146,057) changed by unrealized gains of $6,721 less investment manager fees of $1,231.
8. PROPERTY AND EQUIPMENT
Equipment Furniture and Land and and computer
Building1 facilities hardware TotalHistorical costBalance at Jan. 1, 2015 $ 4,427 $ 2,982 $ 2,859 $ 10,268Additions 118 433 420 971Disposals & retirements (552) (161) (156) (869)Balance at Dec. 31, 2015 $ 3,993 $ 3,254 $ 3,123 $ 10,370
Depreciation and impairmentBalance at Jan. 1, 2015 $ 2,360 $ 1,904 $ 1,602 $ 5,866Current period depreciation 238 337 488 1,063Impairment losses - - 3 3Disposals & retirements (552) (161) (156) (869)Balance at Dec. 31, 2015 $ 2,046 $ 2,080 $ 1,937 $ 6,063Carrying amount at Dec. 31, 2015 $ 1,947 $ 1,174 $ 1,186 $ 4,307
WCB Nova Scotia 2015 Annual Report 47

Equipment Furniture and Land and and computer
Building1 facilities hardware TotalHistorical costBalance at Jan. 1, 2014 $ 4,274 $ 2,744 $ 2,631 $ 9,649Additions 156 301 437 894Disposals & retirements (3) (63) (209) (275)Balance at Dec. 31, 2014 $ 4,427 $ 2,982 $ 2,859 $ 10,268
Depreciation and impairmentBalance at Jan. 1, 2014 $ 2,090 $ 1,663 $ 1,289 $ 5,042Current period depreciation 273 302 500 1,075Impairment losses - 2 22 24Disposals & retirements (3) (63) (209) (275)Balance at Dec. 31, 2014 $ 2,360 $ 1,904 $ 1,602 $ 5,866Carrying amount at Dec. 31, 2014 $ 2,067 $ 1,078 $ 1,257 $ 4,402
1 Includes $155 cost of the land which has an indefinite useful life and is not depreciated.
Finance leased assets Equipment and computer hardware includes the following amounts where the WCB is a lessee:
2015 2014Cost – capitalized finance leases $ 367 $ 367Accumulated depreciation (290) (206)Net book value $ 77 $ 161
There were no additions to equipment under finance leases during the year (2014 - $8).
9. INTANGIBLE ASSETS
Internally Internally Acquired generated generated software software processes TotalHistorical costBalance at Jan. 1, 2015 $ 902 $ 1,387 $ 191 $ 2,480Additions 30 484 - 514Disposals & retirements (30) (350) - (380)Balance at Dec. 31, 2015 $ 902 $ 1,521 $ 191 $ 2,614
Depreciation and impairmentBalance at Jan. 1, 2015 $ 649 $ 723 $ 191 $ 1,563Current period depreciation 97 142 - 239Impairment losses 1 7 - 8Disposals & retirements (30) (350) - (380)Balance at Dec. 31, 2015 $ 717 $ 522 $ 191 $ 1,430Carrying amount at Dec. 31, 2015 $ 185 $ 999 $ - $ 1,184
Internally Internally Acquired generated generated software software processes TotalHistorical costBalance at Jan. 1, 2014 $ 1,243 $ 1,085 $ 222 $ 2,550Additions 63 556 - 619Disposals & retirements (404) (254) (31) (689)Balance at Dec. 31, 2014 $ 902 $ 1,387 $ 191 $ 2,480
Depreciation and impairmentBalance at Jan. 1, 2014 $ 884 $ 869 $ 206 $ 1,959Current period depreciation 159 100 14 273Impairment losses 10 8 2 20Disposals & retirements (404) (254) (31) (689)Balance at Dec. 31, 2014 $ 649 $ 723 $ 191 $ 1,563Carrying amount at Dec. 31, 2014 $ 253 $ 664 $ - $ 917
10. POST-EMPLOYMENT BENEFITS
The WCB provides post-employment benefits other than pensions (Note 20) consisting of retirement allowances, post-employment life insurance, dental and medical programs. An actuarial valuation was performed as at December 31, 2015.
The significant actuarial assumptions adopted in measuring these accrued benefit obligations (ABO) as at December 31 are as follows:
2015 2014Discount rate, benefits expense for the year 4.25% 5.00%Discount rate, accrued benefit obligation 4.10% 4.25%Expected health care costs trend rate; decreasing annually by 0.20% (2014 - 0.25%) increments to an ultimate rate of 4.50% (2014 - 4.0%) 5.25% 5.50%Drug claim increases trend rate; decreasing annually by 0.20% (2014 - 0.25%) increments to an ultimate rate of 4.50% (2014 – 5.00%) 6.25% 6.50%Dental cost escalation 3.00% 3.00%Retirement age assumption 59 years 59 years
Costs Arising in the Period 2015 2014Current service costs $ 1,409 $ 1,130Interest costs 1,249 1,168Total employee future benefits expense $ 2,658 $ 2,298
Accrued Benefit Obligation 2015 2014Beginning of year $ 28,158 $ 22,381Total employee future benefits expense 2,658 2,298Actuarial (gains) losses on ABO through OCI (a) (3,661) 3,769Benefits paid (351) (290)End of year $ 26,804 $ 28,158
48 WCB Nova Scotia 2015 Annual Report

a) The net actuarial gain of $3,661 as at December 31, 2015 arises from: A gain of $5,545 due to retiree health and dental claims experience being better than expected. A gain of $1,258 due to plan demographics and other miscellaneous items. A gain of $1,342 due to changes in demographic assumptions. A loss of $2,735 due to changes in economic assumptions other than the discount rate. A loss of $951 due to adjustments to the retirement allowance and life insurance
attribution periods. A loss of $798 due to change in the discount rate.
Estimates are highly sensitive to changes in discount rates and health care cost trends.
The table below provides sensitivity for changes to the discount rate or the assumed health care cost trend rates with resulting increases (decreases) to Comprehensive Income (CI).
2015 2014 CI Impact CI Impact
1% decrease in the discount rate $ (6,376) $ (6,506)1% increase in the discount rate $ 4,693 $ 4,8151% decrease in the assumed health care cost trend rate $ 3,882 $ 4,4291% increase in the assumed health care cost trend rate $ (5,381) $ (6,023)
11. BENEFITS LIABILITIES
Short-Term Long-Term Survivor Health Claims Total Disability Disability Benefits Care Rehabilitation Subtotal Administration 2015Balance, beginning of year $ 98,877 $ 1,200,723 $ 124,030 $ 366,390 $ 5,787 $ 1,795,807 $ 107,749 $ 1,903,556Growth in present value of benefit liabilities 4,800 69,672 7,123 19,772 297 101,664 6,100 107,764Change in actuarial assumptions (a) - - - - - - - - Actuarial experience adjustments (b) 4,357 (50,991) (4,004) (7,614) 650 (57,602) (3,457) (61,059)Total growth 9,157 18,681 3,119 12,158 947 44,062 2,643 46,705Claims costs incurred 41,100 100,791 4,790 56,403 947 204,031 10,276 214,307Less: Claims payments made (44,427) (129,591) (13,764) (63,214) (1,155) (252,151) (13,163) (265,314)Balance, end of year 104,707 1,190,604 118,175 371,737 6,526 1,791,749 107,505 1,899,254Change in liability for occupational disease in latency (c) (41) (58) (2) (79) (2) (182) (11) (193)Balance, end of year $ 104,666 $ 1,190,546 $ 118,173 $ 371,658 $ 6,524 $ 1,791,567 $ 107,494 $ 1,899,061
Short-Term Long-Term Survivor Health Claims Total Disability Disability Benefits Care Rehabilitation Subtotal Administration 2014Balance, beginning of year $ 95,134 $ 1,194,186 $ 125,508 $ 349,750 $ 4,982 $ 1,769,560 $ 106,174 $ 1,875,734Growth in present value of benefit liabilities 4,977 75,178 7,833 20,395 267 108,650 6,519 115,169 Change in actuarial assumptions (a) (192) 16,632 2,666 (752) (12) 18,342 1,100 19,442 Actuarial experience adjustments (b) 1,898 (59,940) (3,601) 2,558 836 (58,249) (3,494) (61,743)Total growth 6,683 31,870 6,898 22,201 1,091 68,743 4,125 72,868Claims costs incurred 38,975 101,069 5,558 56,080 898 202,580 10,255 212,835Less: Claims payments made (42,167) (126,768) (13,946) (62,130) (1,195) (246,206) (12,873) (259,079)Balance, end of year 98,625 1,200,357 124,018 365,901 5,776 1,794,677 107,681 1,902,358Change in liability for occupational disease in latency (c) 252 366 12 489 11 1,130 68 1,198Balance, end of year $ 98,877 $ 1,200,723 $ 124,030 $ 366,390 $ 5,787 $ 1,795,807 $ 107,749 $ 1,903,556
a) There were no changes in actuarial assumptions in 2015. In 2014, there was a change related to the assumed Consumer Price Index (CPI) rate decreasing to 2.50 per cent from 3.0 per cent, increasing the benefits liability by $19,442.
b) Actuarial experience adjustments represent the difference between what was predicted based on the actuarial assumptions and methods used in the prior valuation and what actually occurred in the year.
In 2015, actuarial experience adjustments decreasing the benefits liabilities totalled $61,059. The adjustments included:• Anetdecreaseof$35,400asaresultoflowerthanexpectednewExtendedEarnings
Replacement Benefits (EERBs) and new Survivor awards.• Adecreaseof$9,300asaresultoflowerthananticipatedinflationforawardsinpay.• Adecreaseof$8,700asaresultofmortalityexperience.• Adecreaseof$3,457intheestimatedcostoffutureclaimsadministration.• Othernon-specifiedactuarialadjustmentsresultedinandecreasetothebenefitsliabilities
of $4,202.
WCB Nova Scotia 2015 Annual Report 49
In 2014, actuarial experience adjustments decreasing the benefits liabilities totalled $61,743. The adjustments included:• Anetdecreaseof$46,200asaresultoflowerthanexpectednewExtendedEarnings
Replacement Benefits (EERBs) and Survivor awards.• Adecreaseof$3,494intheestimatedcostoffutureclaimsadministration.• Adecreaseof$4,600asaresultoflowerthananticipatedinflationforawardsinpay.• Adecreaseof$10,800asaresultofmortalityexperience.• Anetdecreaseof$2,600asaresultoflowerthanexpectedpaymentsinlong-term
disability and health care payments related to recent injury years.• Anetincreaseof$7,500toreflectincreasesinexpectedpaymentsforolderinjuryyears,
primarily health care related.• Othernon-specifiedactuarialadjustmentsresultedinadecreasetothebenefitsliabilities
of $1,549.
c) The Actuarial Standards Board requires workers’ compensation organizations to include an estimation of liabilities for occupational disease during the latency period rather than when the occupational disease is confirmed through diagnosis. The liability for latent occupational disease is estimated at $81,778 and is included in the total benefits liability for 2015 (2014 - $81,971).
Actuarial Assumptions and Methods All liabilities were calculated using an underlying assumption of 3.50 per cent for real rate of
return on assets and a rate of increase in the CPI equal to 2.50 per cent in 2015 and 2014. The gross rate of return that results from the CPI and the real rate of return assumptions is 6.00 per cent in 2015 and 2014. The inflation assumptions and the resulting net interest rates for 2015 and 2014 are presented below:
Expected Resulting Resulting NetCategory Inflation Inflation Rate Interest RateSupplementary Benefits (LTD) 0.5% + CPI 3.00% 3.00%
All other LTD, Survivor Pensions 50% * CPI 1.25% 4.75% Health Care 1.75% + CPI 4.25% 1.75% All Others CPI 2.50% 3.50%
General Statement – Given the statutory nature of its operations, the Board adopts a long-term view for running its business. A long-term perspective avoids overreaction to what may be a temporary trend and provides for more stable assessment rates. Economic assumptions are chosen to be consistent with the Board’s approved investment and funding strategies, both of which consider very long-term trends. Demographic assumptions are chosen to reflect the Board’s actual underlying experience. Given the significant statistical volatility associated with workers’ compensation benefits, demographic assumptions are not updated each year in response to emerging experience. Rather, they are updated over time once enough experience is available to credibly suggest that deviations are due to actual trends rather than statistical fluctuations.
Consumer Price Index – The 2.50 per cent assumption for the rate of increase in CPI is chosen to be consistent with assumptions used by the Bank of Canada inflation controlled target rate of range of 1.00 to 3.00 per cent. This rate is consistent with long-term averages.
Real Rate of Return – The 3.50 per cent real rate of return assumption was chosen to be consistent with the Board’s funding and investment strategies. It is based on expected long-term real return on the assets backing the benefit liabilities. Analysis of historical returns by Board staff has shown that 3.50 per cent appears to be a reasonable and prudent real return target (after investment expenses) given the Board’s strategic asset allocation within the Investment portfolio.
Gross Rate of Return – The gross rate of return assumption is derived as the sum of the Board’s CPI and real rate of return assumptions. Given the assumptions for CPI of 2.50 per cent and real rate of return of 3.50 per cent, the gross rate of return assumption is 6.00 per cent.
Benefit Inflation – The inflation rates assumed for the specific benefit categories are based on their relation to general consumer price inflation, as follows:
LTD & Survivor Benefits – The Act specifies indexing for these benefits at a rate equal to 50 per cent of the change in the CPI. The assumption is 50 per cent of CPI or 1.25 per cent (i.e. 50 per cent of 2.50 per cent).
Medical Aid Benefits – The cost of medical care has historically increased at rates exceeding the general rate of inflation. To account for this, the assumption is that increases due to medical inflation and utilization will be 1.75 per cent higher than the general rate of inflation. As a result, medical inflation assumption is 4.25 per cent (i.e. 1.75 per cent + 2.50 per cent). The appropriateness of this rate is monitored on a regular basis.
Supplementary Awards – Supplementary awards provide an income tested benefit to certain claimants injured prior to March 23, 1990. The assumption is that indexing for supplementary awards will be 0.50 per cent higher than the general rate of inflation, or 3.00 per cent (2.50 per cent + 0.50 per cent). Past reviews of supplementary award experience has shown this assumption to be adequate.
All Other Benefits – All other benefits are subject to general inflation; therefore utilizing the same assumption as used for CPI (i.e. 2.50 per cent).
Future Administration – Future administrative expenses are assumed to be equal to 6.00 per cent of future benefit payments. This assumption is based on an internal review of past administrative expenses conducted by Board staff and is assessed each year to ensure that it remains appropriate.
Occupational Disease – The valuation includes a provision for all recognized occupational diseases that are expected to arise from past workplace exposures. In past valuations, occupational disease claims were recognized upon diagnosis of the covered occupational disease. In 2013, a review of past data was conducted by our independent actuaries to determine a reasonable estimate of the incidence of occupational disease in Nova Scotia Workplaces. The review concluded that an additional provision of 4.50 per cent of the total benefits liability was adequate to cover the cost of occupational disease in the latency period.
Mortality – Mortality for permanent awards is based on the 1983 Group Annuitant Mortality Table (GAM 1983) with a 10 per cent margin (i.e. mortality rates are reduced by 10 per cent to reflect on-going increases in life expectancy). This table was selected based on the results of a study of the Board’s mortality experience conducted during 2010. The study concluded that this table is reasonable based on the number of deaths that occurred among the injured worker population over the past several years.
50 WCB Nova Scotia 2015 Annual Report
Future Permanent Awards – Future EERB and Permanent Impairment Benefit (PIB) awards are assumed to occur in accordance with claims run-off tables. These run-off tables are based on the past claims patterns for the Board and are updated from time to time as emerging experience dictates. The run-off tables currently in use were developed for the 2008 valuation. Each year, actual claim experience is compared to that expected by the table and minor experience adjustments are implemented when warranted.
Sensitivity Analysis of Insurance Risk The benefit liabilities determined in the report are estimated using many actuarial assumptions.
The two most significant assumptions are the long-term real rate of return (3.50 per cent) and the long-term inflation rate (2.50 per cent). The liability estimates are highly sensitive to small changes in these assumptions. The following table provides examples of their sensitivity along with the implied investment rate for the test.
Section 5460 of the actuarial standards of practice for Public Personal Injury Compensation Plans requires that plans (at minimum) provide sensitivity testing for certain specified scenarios. These mandated scenarios are tested, along with other plausible scenarios, in the table below. The scenarios tested can be summarized as follows:1. Scenario 1 tests the impact of a 100 basis point decrease in the assumed rate of
investment earnings.2. Scenario 2 tests the impact of a 100 basis point increase in the assumed rate of inflation.3. Scenario 3 shows the impact of using a discount rate that is equal to the expected rate
of return earned on a hypothetical fixed income portfolio, consisting of high-quality bonds of pertinent duration. This scenario can also be thought of as a market value based measurement of the liabilities.
4. Scenario 4 shows the impact of strengthening economic assumptions by reducing the assumed inflation rate by 50 basis points.
5. Scenario 5 shows the impact of strengthening economic assumptions by reducing both the assumed inflation rate and real rate of return by 50 basis points.
6. Scenario 6 provides an integrated test of the impact of a high inflation, low real rate of return environment.
7. Scenario 7 provides the impact of a 1 per cent increase in the assumed healthcare inflation rate.
Sensitivity of Valuation Assumptions Assumptions Change to Liabilities and Incurred Claims Incurred Real Return Inflation Investment Effect Liabilities Claims
1 2.5% 2.5% 5.0% Increase $ 151,137 $ 14,027 2 3.5% 3.5% 7.0% Decrease $ (43,021) $ (3,176) 3 2.1% 1.4% 3.5% Increase $ 280,213 $ 24,971 4 3.5% 2.0% 5.5% Increase $ 22,622 $ 1,666 5 3.0% 2.0% 5.0% Increase $ 96,936 $ 8,535 6 2.5% 3.5% 6.0% Increase $ 101,913 $ 10,317 7 Increase Health Care Inflation Rate by 1.0% Increase $ 44,182 $ 3,336
Claims risk management(a) Managing insurance risk The WCB has an objective to manage claims risk. In addition to the inherent uncertainty of
claims risk, which can lead to significant variability in the loss experience, performance from operations are significantly affected by factors external to the WCB.
Insurance risk associated with the volume and cost of claims is managed by focussing on performance at the system level, the industry level and the employer level. The balanced scorecard includes corporate performance measures for financial and operational results. Annually, these metrics are linked to the funding strategy and go through a targeting exercise where corporate targets are developed. Metrics are tracked and reported to the Board of Directors quarterly.
At the industry level, Integrated Service Teams are aligned by industry, in order to focus on a single industry, and add value from an injury prevention and return-to-work perspective. Work includes assisting the industry safety associations to understand the trends in their industries and target areas where value can be added. At the employer level, employer injury rate and trends are used to identify those employers that could improve results from a prevention and return-to-work perspective. In addition, the rate-setting model provides incentives through Experience Rating for employers to manage injuries and work to prevent future injuries.
(b) Concentration of insurance risk A large proportion of the covered workers are employed in a relatively small number of
workplaces. These workplaces receive more personalized services through Integrated Service Teams, including relationship management, prevention and return-to-work consulting. In addition to focusing on workplaces with a large number of employees, the Nova Scotia Department of Labour and Advanced Education is provided with data to allow targeted occupational health and safety inspections.
Claims Development Table The following claims development table is a required disclosure under International Financial
Reporting Standards. The top section of the table shows the total dollar amount expected to be paid on claims incurred in the accident year as estimated at various times. Note that claims paid are referred to as “cash flows” in the table so as to be clear that these figures do not include discounting.
To put the top section of the table in context, consider the entry in accident year 2008, and year of estimate 2008 (i.e. $268,645). This figure was the estimated total cash flows expected to be paid on accidents in 2008, as measured at December 31, 2008. The amount in accident year 2008, and year of estimate 2015 (i.e. $243,925) provides the same figure re-estimated at a later date. Estimated cash flows in respect of individual accident years will continue to change over time to the extent there are changes in actuarial assumptions and experience is different than expected.
The lower section of the table shows the development of the liability (or present value of future cash flows associated with each accident year) for accident years 2006 through 2015, as well as the liability in respect of accidents prior to 2006.
WCB Nova Scotia 2015 Annual Report 51

Claims Development Table Year of Accident Year Estimate 2006 2007 2008 2009 2010 2011 2012 2013 2014 2015 TotalEstimated Total Cash Flow 2006 $ 229,438 $ 229,438(including Past and 2007 256,543 $ 264,014 520,557Future Cash Flows) 2008 255,618 258,286 $ 268,645 782,549 2009 271,732 259,194 268,721 $ 277,094 1,076,741 2010 272,107 264,685 274,394 272,679 $ 291,200 1,375,065 2011 275,864 266,190 278,871 262,142 285,756 $ 307,785 1,676,608 2012 265,628 254,151 262,054 236,655 257,080 272,468 $ 292,523 1,840,559 2013 269,079 256,841 256,798 235,326 250,970 257,182 280,830 $ 308,160 2,115,186 2014 258,660 251,762 247,688 223,735 236,287 232,763 242,790 275,937 $ 293,068 2,262,690 2015 253,341 246,115 243,925 221,488 228,787 221,940 227,030 258,543 275,718 $ 293,116 2,470,003Current (2015) Estimate of Total Cash Flow 253,341 246,115 243,925 221,488 228,787 221,940 227,030 258,543 275,718 293,116 2,470,003
Total Cash Flows Paid to December 31, 2015 (140,572) (128,365) (116,016) (99,926) (92,935) (80,768) (72,546) (66,558) (51,394) (25,790) (874,870)Estimated Future Cash Flows 112,769 117,750 127,909 121,562 135,852 141,172 154,484 191,985 224,324 267,326 1,595,133Impact of Discounting (44,638) (47,410) (53,034) (52,574) (58,373) (61,048) (66,695) (84,488) (99,666) (117,152) (685,078)Liability in Respect of Accident Years 2006 to 2015 $ 68,131 $ 70,340 $ 74,875 $ 68,988 $ 77,479 $ 80,124 $ 87,789 $ 107,497 $ 124,658 $ 150,174 910,055Liability in Respect of Accident Years 2005 and prior 804,363Claims Administration 102,865Liability for Occupational Disease in latency 81,778Balance Sheet Liability at December 31, 2015 $ 1,899,061
12. ASSESSMENT REVENUE
2015 2014 Assessed employers $ 277,432 $ 270,133 Self-insured employers (Note 16) 39,372 37,947 Assessment reporting penalties and interest 1,100 1,050 317,904 309,130 Deduct: practice incentive rebates and surcharge refunds (3,717) (3,162) $ 314,187 $ 305,968
Practice incentive rebates and surcharge refunds were introduced in 2013. These programs continue and are voluntary and offer refunds and rebates to those registered workplaces that have met certain eligibility requirements. They are payable in the following year.
13. ADMINISTRATION COSTS
2015 2014 Salaries and staff expense $ 37,183 $ 37,569 Professional, consulting and service fees 5,117 3,632 Building operations 2,324 2,234 Services contracted 1,795 1,614 Communications 1,447 1,424 Depreciation 1,313 1,392 Supplies 869 823 Travel and accommodations 739 844 Training and development 499 606 51,286 50,138 Change in liability for future administration costs (2,887) (2,618) $ 48,399 $ 47,520
52 WCB Nova Scotia 2015 Annual Report

14. SYSTEM SUPPORT
System support costs are costs associated with providing support to the Workplace Safety Insurance System (WSIS) agencies and the Office of the Employer Advisor and the Office of the Worker Counsellor. The focus is on improving the ease of stakeholders interacting with the Workplace Safety and Insurance System agencies.
15. LEGISLATED OBLIGATIONS
2015 2014 Occupational Health and Safety $ 10,077 $ 9,604 Workers’ Advisers Program* 3,484 3,240 Workers’ Compensation Appeals Tribunal 1,644 1,732 $ 15,205 $ 14,576
The WCB is required by the Act to reimburse the Province of Nova Scotia for part of the operating costs of the Occupational Health and Safety Division of the Nova Scotia Department of Labour and Advanced Education.
The Workers’ Advisers Program (WAP) offers legal advice and assistance to eligible injured workers on workers’ compensation matters. The WAP operates autonomously from the WCB. The WCB is required by the Act to absorb the operating costs of the WAP.
The Workers’ Compensation Appeals Tribunal (WCAT) is an independent organization formed to hear appeals of workers’ compensation claims and assessment decisions. The WCB is required by the Act to absorb the operating costs of the WCAT.
Injured Workers’ Associations provide advice and assistance to workers on workers’ compensation issues. The WCB is required by the Act to provide funding to Injured Workers’ Associations on such terms and conditions as the Minister of the Nova Scotia Department of Labour and Advanced Education deems appropriate, or the Governor in Council prescribes.
* The cost of the Injured Workers’ Associations is combined within the Workers’ Advisers Program.
16. SELF-INSURED EMPLOYERS
These financial statements include the effects of transactions carried out for self-insured employers – federal and provincial government bodies – who directly bear the costs of their own incurred claims and an appropriate share of WCB administration costs.
2015 2014 Revenue $ 39,372 $ 37,947 Claims payments made Short-term disability $ 5,263 $ 4,507 Long-term disability 16,643 16,609 Survivor benefits 3,417 3,425 Health care 7,314 7,089 Rehabilitation 134 32 32,771 31,662 Administration costs 6,601 6,285 $ 39,372 $ 37,947
Self-insured employers are included in claims cost incurred; however, the benefits liabilities related to self-insured employers have not been included in the WCB’s benefits liabilities account. As these liabilities will be borne by those employers when paid in future years, they do not add to the WCB’s unfunded liability.
17. RELATED PARTY TRANSACTIONS
The WCB provides self-insured coverage to provincial government agencies and departments. The Province is considered a related party as the Province administers the Act through which the WCB is governed. The Province, as a self-insured employer, reimburses the WCB for its own incurred claims and a share of WCB administration costs. The amounts included in Note 16 for the Province of Nova Scotia are as follows:
2015 2014 Revenue $ 7,930 $ 7,582 Claims payments made 6,364 6,138 Administration costs 1,566 1,444 $ 7,930 $ 7,582
These transactions are measured at the exchange amount, which is the amount of consideration established and agreed to by the related parties. The balances due from the Province of Nova Scotia are non-interest bearing and under normal credit terms. At December 31, 2015, the amount receivable from the Province of Nova Scotia was $639 (2014 - $1,249) for claims payments made and administration costs.
Key management personnel of the WCB (CEO, Vice Presidents, Directors and the Board of Directors) are deemed related parties. In addition, close family members of the key management personnel are also related parties of the WCB. There were no transactions or relationships with these related parties, with the exception of salaries and benefits shown below, that require disclosure.
WCB Nova Scotia 2015 Annual Report 53
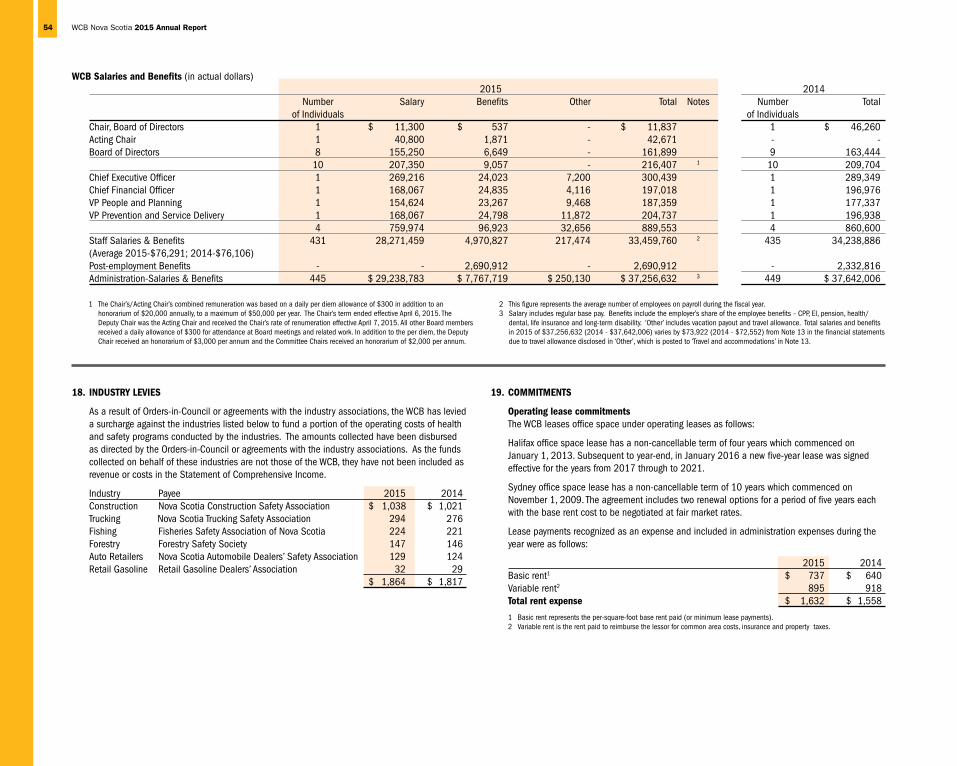
WCB Salaries and Benefits (in actual dollars) 2015 2014 Number Salary Benefits Other Total Notes Number Total of Individuals of IndividualsChair, Board of Directors 1 $ 11,300 $ 537 - $ 11,837 1 $ 46,260Acting Chair 1 40,800 1,871 - 42,671 - -Board of Directors 8 155,250 6,649 - 161,899 9 163,444 10 207,350 9,057 - 216,407 1 10 209,704Chief Executive Officer 1 269,216 24,023 7,200 300,439 1 289,349Chief Financial Officer 1 168,067 24,835 4,116 197,018 1 196,976VP People and Planning 1 154,624 23,267 9,468 187,359 1 177,337VP Prevention and Service Delivery 1 168,067 24,798 11,872 204,737 1 196,938 4 759,974 96,923 32,656 889,553 4 860,600Staff Salaries & Benefits 431 28,271,459 4,970,827 217,474 33,459,760 2 435 34,238,886(Average 2015-$76,291; 2014-$76,106) Post-employment Benefits - - 2,690,912 - 2,690,912 - 2,332,816Administration-Salaries & Benefits 445 $ 29,238,783 $ 7,767,719 $ 250,130 $ 37,256,632 3 449 $ 37,642,006
1 The Chair’s/Acting Chair’s combined remuneration was based on a daily per diem allowance of $300 in addition to an honorarium of $20,000 annually, to a maximum of $50,000 per year. The Chair’s term ended effective April 6, 2015. The Deputy Chair was the Acting Chair and received the Chair’s rate of renumeration effective April 7, 2015. All other Board members received a daily allowance of $300 for attendance at Board meetings and related work. In addition to the per diem, the Deputy Chair received an honorarium of $3,000 per annum and the Committee Chairs received an honorarium of $2,000 per annum.
2 This figure represents the average number of employees on payroll during the fiscal year. 3 Salary includes regular base pay. Benefits include the employer’s share of the employee benefits – CPP, EI, pension, health/
dental, life insurance and long-term disability. ‘Other’ includes vacation payout and travel allowance. Total salaries and benefits in 2015 of $37,256,632 (2014 - $37,642,006) varies by $73,922 (2014 - $72,552) from Note 13 in the financial statements due to travel allowance disclosed in ‘Other’, which is posted to ‘Travel and accommodations’ in Note 13.
18. INDUSTRY LEVIES
As a result of Orders-in-Council or agreements with the industry associations, the WCB has levied a surcharge against the industries listed below to fund a portion of the operating costs of health and safety programs conducted by the industries. The amounts collected have been disbursed as directed by the Orders-in-Council or agreements with the industry associations. As the funds collected on behalf of these industries are not those of the WCB, they have not been included as revenue or costs in the Statement of Comprehensive Income.
Industry Payee 2015 2014 Construction Nova Scotia Construction Safety Association $ 1,038 $ 1,021 Trucking Nova Scotia Trucking Safety Association 294 276 Fishing Fisheries Safety Association of Nova Scotia 224 221
Forestry Forestry Safety Society 147 146 Auto Retailers Nova Scotia Automobile Dealers’ Safety Association 129 124 Retail Gasoline Retail Gasoline Dealers’ Association 32 29 $ 1,864 $ 1,817
19. COMMITMENTS
Operating lease commitments The WCB leases office space under operating leases as follows:
Halifax office space lease has a non-cancellable term of four years which commenced on January 1, 2013. Subsequent to year-end, in January 2016 a new five-year lease was signed effective for the years from 2017 through to 2021.
Sydney office space lease has a non-cancellable term of 10 years which commenced on November 1, 2009. The agreement includes two renewal options for a period of five years each with the base rent cost to be negotiated at fair market rates.
Lease payments recognized as an expense and included in administration expenses during the year were as follows:
2015 2014 Basic rent1 $ 737 $ 640 Variable rent2 895 918 Total rent expense $ 1,632 $ 1,558
1 Basic rent represents the per-square-foot base rent paid (or minimum lease payments).2 Variable rent is the rent paid to reimburse the lessor for common area costs, insurance and property taxes.
54 WCB Nova Scotia 2015 Annual Report

The future aggregate minimum lease payments are as follows:
2015 2014 Within 1 year $ 737 $ 737 More than 1 year and up to 5 years 2,754 1,375 Later than 5 years 530 - Total $ 4,021 $ 2,112
Finance lease commitments The WCB has finance leases for various items of equipment. Lease terms range from 3 to 5
years and have no terms of renewal, purchase options or escalation clauses. Future minimum lease payments under finance leases together with the present value of the net minimum lease payments are as follows:
2015 2014 Minimum Present value Minimum Present value payments of payments payments of paymentsWithin one year $ 64 $ 62 $ 95 $ 88
One to five years 22 21 86 83 Total minimum lease
payments 86 83 181 171 Less finance charges (3) - (10) - Present value of
minimum lease payments $ 83 $ 83 $ 171 $ 171
Leased assets are pledged as collateral for the related finance leases.
20. EMPLOYEE PENSION PLAN
Employees of the WCB participate in the Public Service Superannuation Fund (Plan), a contributory pension plan administered by the Pension Services Superannuation Plan Trustee Incorporated, which provides pension benefits based on length of service and earnings. Contributions to the Plan are required by both employees and the WCB. Total WCB employer contributions for 2015 were $2,497 (2014 - $2,504) and are recognized as an expense in the period. The WCB is not obligated for any unfunded liability, nor does the WCB have entitlement to any surplus that may arise in this Plan.
21. CAPITAL MANAGEMENT
The capital management objective reflects the mandate to pay benefits and to ensure the long-term financial sustainability of the Workers’ Compensation System. The funding strategy outlines the WCB’s planned approach to funding current operations and the eventual elimination of the unfunded liability. Funding of the Workers’ Compensation System requires consideration of a number of complex variables and assumptions (rates, benefits, funding period and investment returns).
The WCB monitors the unfunded status based on the funding percentage. The funding percentage calculated by the ratio of total assets to total liabilities is 80.6 per cent (2014 - 76.9 per cent).
22. SUBSEQUENT EVENTS
The WCB invested $155,000 Canadian in units of Mercer Canadian Hedge Fund Investors Limited which settled on January 4, 2016. This investment was funded by a reduction in United States Equities $32,000, International Equities of $33,000 and Global Equities of $87,000 and Canadian Equities of $3,000. The funds were held as cash at year-end to fund the purchase of the hedge fund units.
On January 29, 2016, the WCB committed to the purchase of $115,000 United States Dollars (USD) the Mercer Private Investment Partners IV Société d’Investissement à Capital Variable – Fonds d’Investissement Spécialisé to be invested over the next 36 months. The funds will purchase $57,500 USD in infrastructure sub-fund and $57,500 USD in private equity sub-fund.
WCB Nova Scotia 2015 Annual Report 55
Actuarial Certificate
We have completed an actuarial valuation of the benefit liabilities for insured employers under the Workers’CompensationActof Nova Scotia (the “Act”) as at December 31, 2015, for the purpose of providing input to the Financial Statements of the Workers’ Compensation Board of Nova Scotia (the “Board”). The valuation is in respect of assessed firms only, and does not include any provision for future payments in respect of self-insured firms
Our estimate of the benefits liabilities of $1,899,061,000 represents the actuarial present value at December 31, 2015, of all expected health-care payments, short-term disability benefits, long-term disability benefits, survivor benefits, rehabilitation and other payments which will be made in future years, and which relate to claims arising from events which occurred on or before December 31, 2015. The liabilities include a provision for future administrative expenses. The liabilities also include a provision for potential occupational diseases in the latency period. No allowance has been made in these liabilities for any future deviations from the present policies and practices of the Board or for the extension of new coverage types.
Data required for the valuation has been provided by the Board. We have reviewed the valuation data to test for reasonableness and consistency with the data used in prior years.
The liabilities have been allocated into six categories,namely:short-termdisability;long-termdisability;survivors’benefits;healthcare;rehabilitation and administration.
All liabilities have been calculated using underlying assumptions of 3.50 per cent per annum for the real rate of return on invested assets and 2.50 per cent per annum for the rate of increase in the Consumer Price Index. These assumptions are consistent with those in the Board’s approved funding and investment strategies.
The CPI assumption equates to inflation rates for indexing benefits of 1.25 per cent per annum in respect of long-term disabilities and permanent survivor benefits, because indexing for these benefits is specified under the Act as 50 per cent of the rate of increase in the Consumer Price Index.
Liabilities in respect of permanent long-term disability and survivor benefits in-pay have been determined by projecting cash flows on an individual claimant basis using mortality as the only decrement.
Liabilities in respect of future permanent long-term disability and survivor benefits awards have been determined based on factors developed from historical patterns of permanent awards, and using mortality and valuation interest rate assumptions identical to those used in determining the existing pension and long-term disability liabilities.
The liabilities in respect of short-term disability, health care, rehabilitation and the non-permanent portion of survivors’ benefits have been determined from projections of future claim payments. These projections have been based on continuation of recent payment patterns by
years since the injury. An inflation rate of 2.50 per cent per annum has been used to project future cash flows for short-term disability claims, rehabilitation, and the non-permanent portion of survivors’ benefits. For health care, we used an inflation rate of 4.25 per cent per annum reflecting the greater expected inflation and utilization rate for this benefit category.
It is our opinion that:• thedataaresufficientandreliableforthe
purposeofthisvaluation;• theactuarialassumptionsandthemethods
employed are appropriate for the purpose ofthevaluation;and
• theamountofbenefitliabilitiesmakesappropriate provision for future benefit payments on accidents incurred prior to the valuation date.
Our valuation report has been prepared and our opinions have been given in accordance with accepted actuarial practice in Canada.
Further information on the data, assumptions, methods, and valuation results can be found in our actuarial valuation report.
Jeff Turnbull, Scott Mossman, FSA FCIA FSA FCIA
56 WCB Nova Scotia 2015 Annual Report
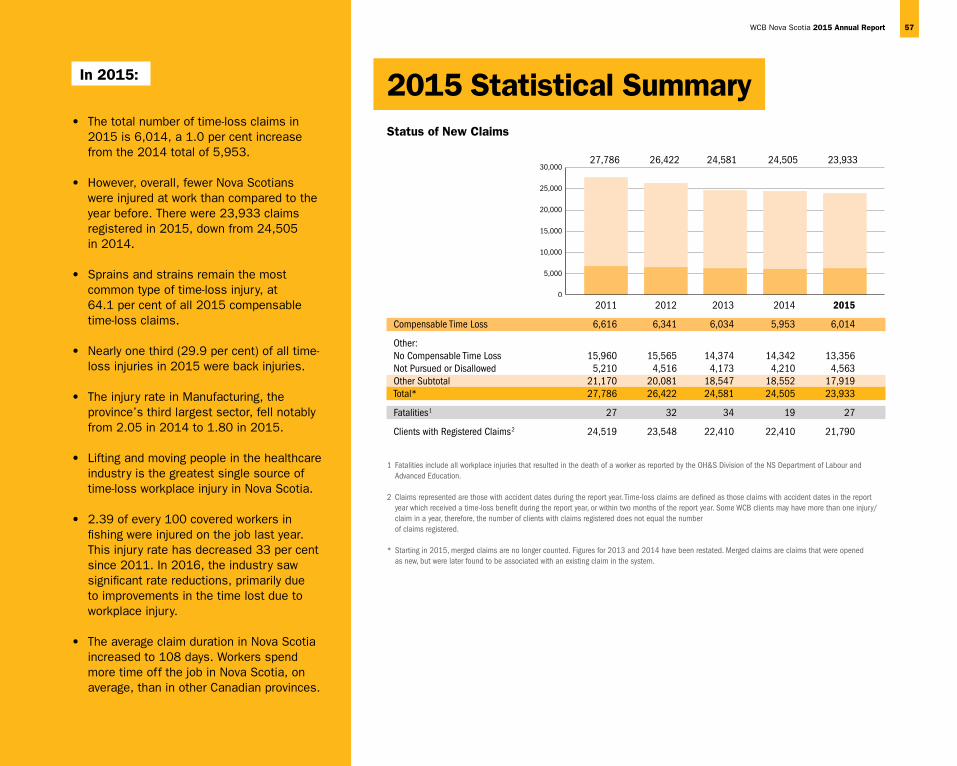
In 2015:
• Thetotalnumberoftime-lossclaimsin2015 is 6,014, a 1.0 per cent increase from the 2014 total of 5,953.
• However,overall,fewerNovaScotianswere injured at work than compared to the year before. There were 23,933 claims registered in 2015, down from 24,505 in 2014.
• Sprainsandstrainsremainthemostcommon type of time-loss injury, at 64.1 per cent of all 2015 compensable time-loss claims.
• Nearlyonethird(29.9percent)ofalltime-loss injuries in 2015 were back injuries.
• TheinjuryrateinManufacturing,theprovince’s third largest sector, fell notably from 2.05 in 2014 to 1.80 in 2015.
•Liftingandmovingpeopleinthehealthcareindustry is the greatest single source of time-loss workplace injury in Nova Scotia.
•2.39ofevery100coveredworkersin
fishing were injured on the job last year. This injury rate has decreased 33 per cent since 2011. In 2016, the industry saw significant rate reductions, primarily due to improvements in the time lost due to workplace injury.
•TheaverageclaimdurationinNovaScotia
increased to 108 days. Workers spend more time off the job in Nova Scotia, on average, than in other Canadian provinces.
2011 2012 2013 2014 2015
Compensable Time Loss 6,616 6,341 6,034 5,953 6,014 Other: No Compensable Time Loss 15,960 15,565 14,374 14,342 13,356Not Pursued or Disallowed 5,210 4,516 4,173 4,210 4,563Other Subtotal 21,170 20,081 18,547 18,552 17,919Total* 27,786 26,422 24,581 24,505 23,933 Fatalities1 27 32 34 19 27 Clients with Registered Claims2 24,519 23,548 22,410 22,410 21,790
Status of New Claims
30,000
25,000
20,000
15,000
10,000
5,000
0
27,786 26,422 24,581 24,505 23,933
1 Fatalities include all workplace injuries that resulted in the death of a worker as reported by the OH&S Division of the NS Department of Labour and Advanced Education.
2 Claims represented are those with accident dates during the report year. Time-loss claims are defined as those claims with accident dates in the report year which received a time-loss benefit during the report year, or within two months of the report year. Some WCB clients may have more than one injury/claim in a year, therefore, the number of clients with claims registered does not equal the number of claims registered.
* Starting in 2015, merged claims are no longer counted. Figures for 2013 and 2014 have been restated. Merged claims are claims that were opened as new, but were later found to be associated with an existing claim in the system.
2015 Statistical Summary
WCB Nova Scotia 2015 Annual Report 57

120
100
80
60
40
20
006 07 08 09 10 11 12 13 14 15
DAYS
YEAR
105
102
95 98 98 98 99 99 102
108
$3.00
$2.50
$2.00
$1.50
$1.00
$.50
$0NS ON NL YT NT/NU QC PE BC SK MB NB AB
2.65
2.46
2.45
2.18
2.05
2.02
1.90
1.70
1.51
1.50
1.21
1.03
27 workplace fatalities occurred in Nova Scotia in 2015.
Workplace Fatalities in Nova Scotia: 2015
Type of fatality
27
21
6
20122011
32
22
10
2013
34
17
17
2014
19
14
5
2015
27
19
8n Chronic fatalityn Acute fatality
Targeted Average Assessment Rate All Provinces per $100 of Assessable Payroll, 2014 (AWCBC)
Composite Duration Index Using AWCBC Composite Method
Gender of Client Compensable time-loss claims
2014 % 2015 %
n Male 3,254 54.7% 3,240 53.9%n Female 2,699 45.3% 2,774 46.1%
5,953 100.0% 6,014 100.0%
Injury Region Compensable time-loss claims by geographic region
1
2
3
4
2014 % 2015 %
1 Halifax Regional Municipality 2,432 40.9% 2,492 41.5%2 Central & North Shore 1,286 21.6% 1,366 22.7%3 South Shore & Valley 1,370 23.0% 1,306 21.7%4 Cape Breton 848 14.2% 826 13.7% Other 17 0.3% 24 0.4%
5,953 100.0% 6,014 100.0%
8 deaths were classified as “acute,” and were caused by traumatic injuries at a workplace.
19 deaths were classified as “chronic.” This includes two categories:
- 10 deaths related to occupational diseases or conditions, often from previous exposures; and
- 9 deaths occurring at a workplace, from other health conditions not necessarily related to the work, primarily cardiac events.
WCB Nova Scotia and the Nova Scotia Department of Labour and Advanced Education’s Occupational Health and Safety Division report a single fatality number including both deaths at worksites, and deaths due to occupational disease or illness from previous exposures in a given year. Occupational disease fatalities are those which occurred in 2015, and are on record as of year-end.
The average age of workers suffering a workplace fatality is 56
58 WCB Nova Scotia 2015 Annual Report

Injury Frequency and Claim Volumes by Industry For Nova Scotia, 2015
Excluding Self Insured Claims Including Self Insured ClaimsAssessable
Payroll ($ millions)
% of Total Assessable
Payroll
Number of Claims Registered (No Self Insured)
% of Claims Registered (No Self Insured)
Number of Time-Loss Claims
(No Self Insured)
% of Time-Loss Claims
(No Self Insured)
Injury Frequency
Injury Frequency Last Year (2014)
Number of Claims Registered
(Inc. Self Insured)
% of Claims Registered (Inc. Self Insured)
Number of Time-Loss Claims (Inc. Self Insured)
% of Time-Loss Claims
(Inc. Self Insured)
Health/Social Services 2,061.8 20.1% 4,935 22.3% 1,680 30.6% 3.13 2.93 4,935 20.6% 1,680 27.9%
Retail Trade 1,349.6 13.2% 2,525 11.4% 606 11.1% 1.24 1.23 2,594 10.8% 628 10.4%
Manufacturing 1,292.9 12.6% 3,271 14.8% 621 11.3% 1.80 2.05 3,271 13.7% 621 10.3%
Construction 1,067.4 10.4% 2,183 9.9% 521 9.5% 1.99 1.90 2,183 9.1% 521 8.7%
Wholesale Trade 849.1 8.3% 1,504 6.8% 325 5.9% 1.39 1.33 1,504 6.3% 325 5.4%
Accommodation/Food/Beverages
569.1 5.6% 1,665 7.5% 352 6.4% 1.34 1.52 1,665 7.0% 352 5.9%
Transportation/Storage 530.0 5.2% 1,159 5.2% 337 6.1% 2.79 2.70 1,170 4.9% 340 5.7%
Business Services 464.5 4.5% 423 1.9% 119 2.2% 0.73 0.65 423 1.8% 119 2.0%
Communication/Utilities 433.0 4.2% 625 2.8% 125 2.3% 1.23 1.31 899 3.8% 222 3.7%
Government Services 393.2 3.8% 588 2.7% 150 2.7% 1.60 1.68 2,012 8.4% 556 9.2%
Other Services 336.4 3.3% 684 3.1% 174 3.2% 1.47 1.57 684 2.9% 174 2.9%
Educational Services 293.9 2.9% 725 3.3% 220 4.0% 2.46 2.23 726 3.0% 220 3.7%
Fishing/Trapping 248.8 2.4% 315 1.4% 122 2.2% 2.39 2.39 315 1.3% 122 2.0%
Real Estate/Insurance Agents 121.2 1.2% 196 0.9% 50 0.9% 1.53 1.09 196 0.8% 50 0.8%
Agriculture/Related Services 78.2 0.8% 164 0.7% 41 0.8% 1.54 2.14 164 0.7% 41 0.7%
Mining/Quarries/Oil Wells 68.2 0.7% 85 0.4% 11 0.2% 0.86 0.98 97 0.4% 11 0.2%
Logging/Forestry 47.4 0.5% 91 0.4% 26 0.5% 2.14 1.78 91 0.4% 26 0.4%
Finance/Insurance 31.6 0.3% 10 0.0% 1 0.0% 0.18 0.14 10 0.0% 1 0.0%
Unknown 0.0 0.0% 994 4.5% 5 0.1% 0.00 0.00 994 4.1% 5 0.1%
Total $10,236.3 100.0% 22,142 100.0% 5,486 100.0% 23,933 100.0% 6,014 100.0%
Claims Registered by Firms
Number of Number of % of % of Total Number Claims % of New Claims New Claims Assessable Payroll
of Firms Registered 2015 all Firms Registered Registered ($ millions)
11 200 or more 0.06% 5,072 21.19% 16.0%19 100 or more 0.10% 6,274 26.21% 19.9%49 50 or more 0.26% 8,346 34.87% 27.3%137 25 or more 0.73% 11,347 47.41% 35.6%376 10 or more 2.00% 14,889 62.21% 46.8%795 5 or more 4.23% 17,601 73.54% 57.6%
WCB Nova Scotia 2015 Annual Report 59
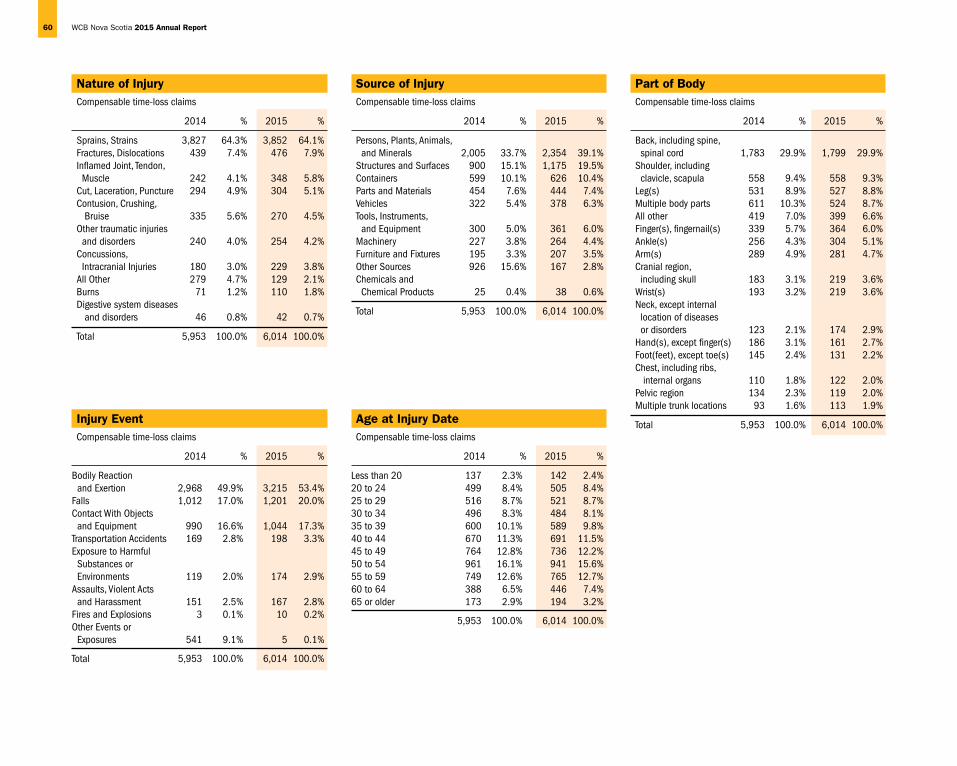
Nature of Injury Compensable time-loss claims
2014 % 2015 %
Sprains, Strains 3,827 64.3% 3,852 64.1%Fractures, Dislocations 439 7.4% 476 7.9%Inflamed Joint, Tendon, Muscle 242 4.1% 348 5.8%Cut, Laceration, Puncture 294 4.9% 304 5.1%Contusion, Crushing, Bruise 335 5.6% 270 4.5%Other traumatic injuries and disorders 240 4.0% 254 4.2%Concussions, Intracranial Injuries 180 3.0% 229 3.8%All Other 279 4.7% 129 2.1%Burns 71 1.2% 110 1.8%Digestive system diseases and disorders 46 0.8% 42 0.7%
Total 5,953 100.0% 6,014 100.0%
Part of Body Compensable time-loss claims
2014 % 2015 %
Back, including spine, spinal cord 1,783 29.9% 1,799 29.9%Shoulder, including clavicle, scapula 558 9.4% 558 9.3%Leg(s) 531 8.9% 527 8.8%Multiple body parts 611 10.3% 524 8.7%All other 419 7.0% 399 6.6%Finger(s), fingernail(s) 339 5.7% 364 6.0%Ankle(s) 256 4.3% 304 5.1%Arm(s) 289 4.9% 281 4.7%Cranial region, including skull 183 3.1% 219 3.6%Wrist(s) 193 3.2% 219 3.6%Neck, except internal location of diseases or disorders 123 2.1% 174 2.9%Hand(s), except finger(s) 186 3.1% 161 2.7%Foot(feet), except toe(s) 145 2.4% 131 2.2%Chest, including ribs, internal organs 110 1.8% 122 2.0%Pelvic region 134 2.3% 119 2.0%Multiple trunk locations 93 1.6% 113 1.9%
Total 5,953 100.0% 6,014 100.0%
Source of Injury Compensable time-loss claims
2014 % 2015 %
Persons, Plants, Animals, and Minerals 2,005 33.7% 2,354 39.1%Structures and Surfaces 900 15.1% 1,175 19.5%Containers 599 10.1% 626 10.4%Parts and Materials 454 7.6% 444 7.4%Vehicles 322 5.4% 378 6.3%Tools, Instruments, and Equipment 300 5.0% 361 6.0%Machinery 227 3.8% 264 4.4%Furniture and Fixtures 195 3.3% 207 3.5%Other Sources 926 15.6% 167 2.8%Chemicals and Chemical Products 25 0.4% 38 0.6%
Total 5,953 100.0% 6,014 100.0%
Injury Event Compensable time-loss claims
2014 % 2015 %
Bodily Reaction and Exertion 2,968 49.9% 3,215 53.4%Falls 1,012 17.0% 1,201 20.0%Contact With Objects and Equipment 990 16.6% 1,044 17.3%Transportation Accidents 169 2.8% 198 3.3%Exposure to Harmful Substances or Environments 119 2.0% 174 2.9%Assaults, Violent Acts and Harassment 151 2.5% 167 2.8%Fires and Explosions 3 0.1% 10 0.2%Other Events or Exposures 541 9.1% 5 0.1%
Total 5,953 100.0% 6,014 100.0%
Age at Injury Date Compensable time-loss claims
2014 % 2015 %
Less than 20 137 2.3% 142 2.4%20 to 24 499 8.4% 505 8.4%25 to 29 516 8.7% 521 8.7%30 to 34 496 8.3% 484 8.1%35 to 39 600 10.1% 589 9.8%40 to 44 670 11.3% 691 11.5%45 to 49 764 12.8% 736 12.2%50 to 54 961 16.1% 941 15.6%55 to 59 749 12.6% 765 12.7%60 to 64 388 6.5% 446 7.4%65 or older 173 2.9% 194 3.2%
5,953 100.0% 6,014 100.0%
60 WCB Nova Scotia 2015 Annual Report
ouR Vision
Nova Scotians – safe and secure from workplace injury.
ouR Mission
We set the standard for workplace injury insurance. We inform and inspire Nova Scotians in the prevention of workplace injury, but if it occurs, we support those whose lives it touches by championing a timely return to safe and healthy work.
ouR goALs
Working in collaboration with workers, employers and our partners, the WCB’s goals are to:
• Buildaworkplace safety culture;
• Improveoutcomesforsafe and timely return to work;
• Befinancially stable and sustainable;
• expand strategic relationships to enhance the commitment to workplace health and safety and return to work across the province;
• Provideexcellent and efficient service, leveraging technology to meet worker and employer expectations.
ouR VALues
Employees of the WCB model three corporate values:
• can-do Attitude We will deliver on our promises and provide
top-notch service.
• safety champion We will be a champion for workplace safety through
our relationships and innovative solutions, and by keeping prevention and return-to-work at the heart of our business.
• caring and compassionate We will strive to walk a mile in workers’ and employers’
shoes. We will serve as we like to be served and provide those we serve with the respect and support they need to be successful.
sydney office404 Charlotte StreetSuite 200Sydney, NS B1P 1E2
Tel: 902 563 2444Toll Free: 1 800 880 0003Fax: 902 563 0512
on the Webwcb.ns.caworksafeforlife.ca
employer Account Accessmy-account.ns.ca
halifax office5668 South StreetP.O. Box 1150Halifax, NS B3J 2Y2
Tel: 902 491 8999Toll Free: 1 800 870 3331Injury Reporting Fax: 902 491 8001
Related Documents