Leading Continuous Impr ovement

Welcome message from author
This document is posted to help you gain knowledge. Please leave a comment to let me know what you think about it! Share it to your friends and learn new things together.
Transcript
Leading Continuous Improvement

Define Measure Analyse Improve Control
What are we trying to achieve? What’s important? What does success look like? What steps can we take? Who needs to be involved & when?
Define the goals of the improvement activity, include deliverables & benefits.
Identify the Customer (patients directly or other internal customers) and their goals.
Agree & clearly state scope of activities.
Understand the current processes and performance.
Define team involved and timelines.
Setting up for Success
Approved PID / Charter
Action Plan
Critical Customer Requirements
Process Maps
Quick Win Opportunities
Prepared Team
Activities Tools Outcomes
Goal Setting
Team PID / Charter
SIPOC Diagram
Process Maps
Stakeholder Analysis
In / Out Scope Diagram
Roles & Responsibilities
1

Suppliers
WHO provides the inputs to the process
Input
WHAT is it they provide to our process; Material, equipment, appointments, hardware, software, training, resources, information, data, products
Process
The sequence of activities that convert the Inputs from individual
entities to a valuable
outcome/output.
Output
WHAT does the process provide as an output from its activities. Completed treatment, an appointment schedule, a diagnosis, data, information, referral.
Customers
WHO receives the outputs; Patient, GP, Onward referral departments. Who else has an interest; management teams, committees, agencies.
Process Mapping But before we get flowcharting, let’s understand
the whole picture first using SIPOC
2
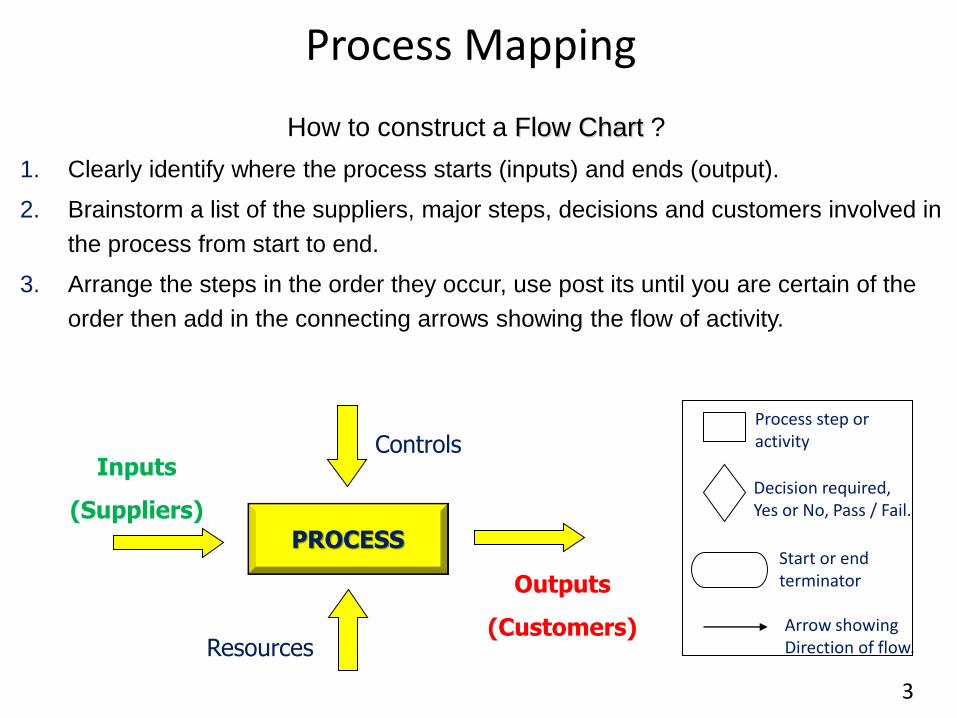
How to construct a Flow Chart ?
1. Clearly identify where the process starts (inputs) and ends (output).
2. Brainstorm a list of the suppliers, major steps, decisions and customers involved in
the process from start to end.
3. Arrange the steps in the order they occur, use post its until you are certain of the
order then add in the connecting arrows showing the flow of activity.
PROCESS
Outputs
(Customers)
Inputs
(Suppliers)
Resources
Controls Process step or activity
Decision required, Yes or No, Pass / Fail.
Start or end terminator
Arrow showing Direction of flow.
Process Mapping
3
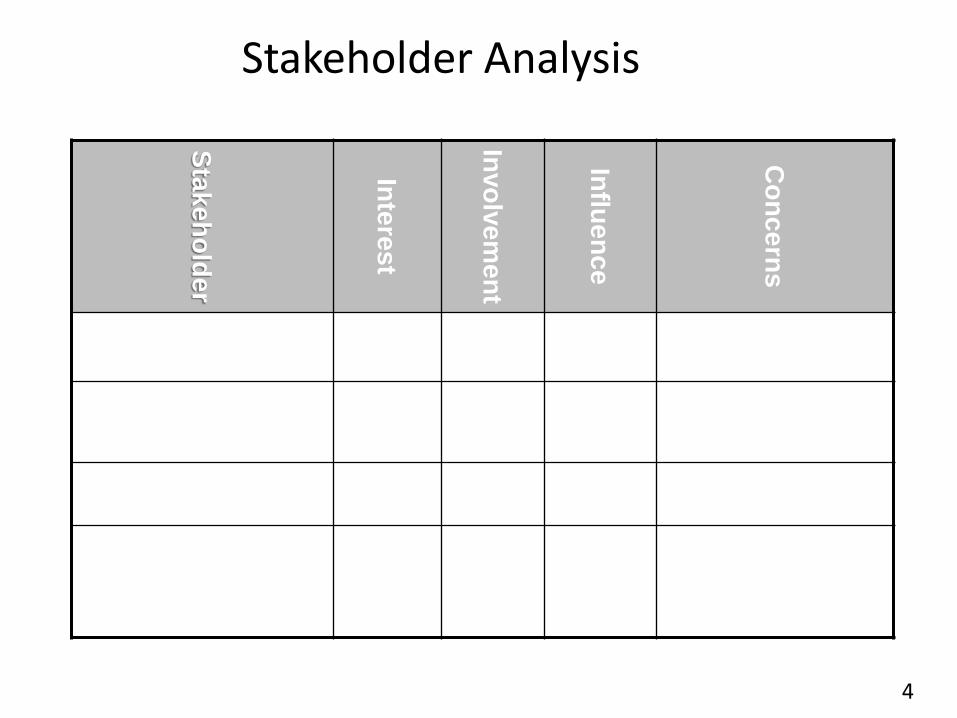
Stakeholder Analysis
Sta
ke
ho
lde
r
Inte
res
t
Invo
lve
me
nt
Influ
en
ce
Co
nc
ern
s
4

Major Stakeholders Criteria
1. Interest in the project (indicate also + or - )? 5. All
4. A lot
3. Medium
2. Little
1. No
2. How much are they involved?
5. Extremely involved
4. Highly involved
3. Regularly involved
2. Little involved
1. No involvement 3. Influence on the project?
5. Very high influence
4. A lot of influence
3. Something to say
2. Can speak up for themselves
1. No influence
5

DEFINE Stage Checklist
Task Who Status
1. SMART Goals defined
2. Stakeholders enrolled
3. Team Selection
4. Complete Project PID, all sections
5. Review existing Process documentation
6. Define Timings & Plan
7. Define & Map current “as is” process
8. Review and redefine project scope if necessary
9. Gain approval of Sponsor before next stage
6

Define Measure Analyse Improve Control
How do we measures our problem? Where does the data come from? What is the performance now? How will we demonstrate before & after ?
Collect data on the current process.
Establish a baseline of current performance.
Establish the metrics to help monitor progress towards the goals stated in the “Define” stage.
Answer how we measure project success.
Creating a shared need
Measures/KPI Definitions
Data Collection Plans
Baseline Performance Metrics
Shared vision
Activities Tools Outcomes
Measures
Data collection
Balanced Scorecard
Stakeholder Engagement
7

Communications Plan
Comms Title Audience Objectives Message How By Who When Where Content Status Comments
1
2
3
4
5
8

Stakeholders Interview
Background
What is your official job title?
Can you please outline your key responsibilities and accountabilities?
How does performance affect you and your team?
Current Issues
What in your opinion are the key issues impacting efficiency?
What is the root cause of these issues?
How do they manifest themselves – lost time / cancelled patients / more work What is currently being done to address these issues?
Who is leading / responsible for driving home these changes?
What impact are the changes having?
What 3 changes to current working practices would you like?
Have the biggest impact
Make your job easier
Influencers / power base
Who do we need to win over to ensure maximum chances of success in this project
9
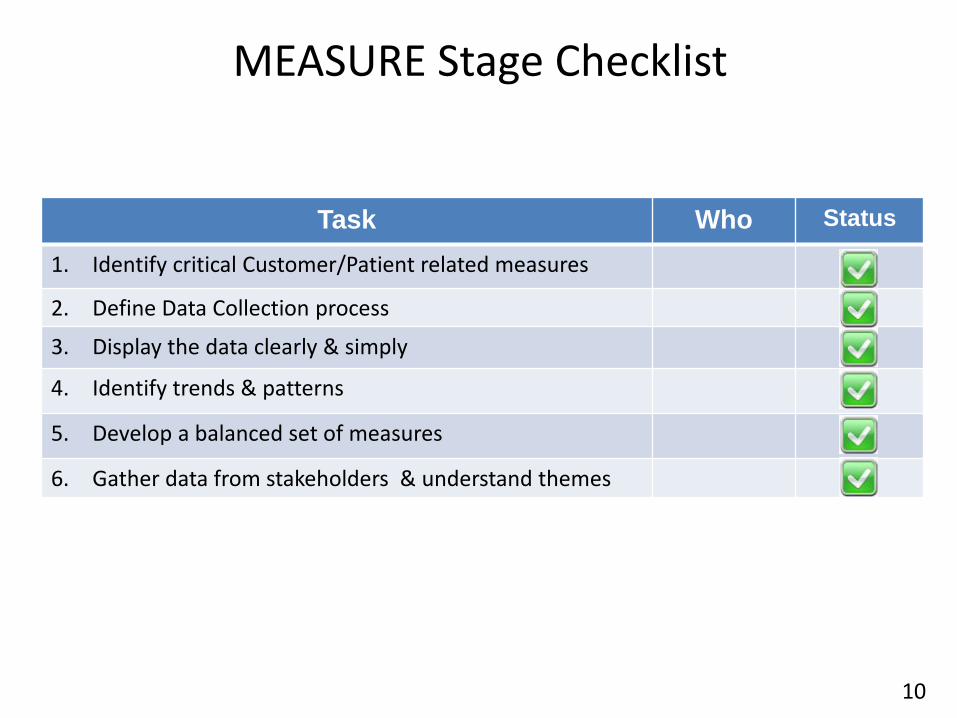
MEASURE Stage Checklist
Task Who Status
1. Identify critical Customer/Patient related measures
2. Define Data Collection process
3. Display the data clearly & simply
4. Identify trends & patterns
5. Develop a balanced set of measures
6. Gather data from stakeholders & understand themes
10

Define
How does the process really work? What does our knowledge about the process say? What does the data tells us about the process? What are the root causes of our process problem?
Analyse the process to identify ways of eliminating the gap between current and desired performance.
Isolate root causes not just symptoms.
Prioritise the areas of focus and id resources required to help.
Identify any obstacles or risks to success.
Identify resistance to change
Process & Data Analysis
Validated Root Causes
Potential Solutions
Prioritised focus areas
Identifying and overcoming barriers to change
Activities Tools Outcomes
Value Stream mapping
8 wastes
Cause & effect fishbone
5 whys
Prioritisation VAP
Gleicher Change Formula
Measure Analyse Improve Control
11

1. Waiting Inpatients waiting in ED, patients waiting for discharge, physicians waiting for test results
2. Inventories Patients queuing for clinic, lab samples for testing, stocks on wards, dictation waiting for typing
3. Defects Needle stick injury, missing patient information, wrong information communicated
4. Excessive Processing Re-sticks, multiple bed moves, re-testing, multiple assessments 5. Overproduction Excessive reporting, unnecessary tests, Irrelevant information sent out
6. Movement working across multiple sites, storage of consumables in disparate places
7. Transportation Moving patients to tests, patients having to attend different depts.
8. Under-utilisation Physicians transporting patients, not fully using skill mix of staff
The 8 Wastes in Healthcare
12

Cause and Effect
13

ANALYSE Stage Checklist
Task Who Status
1. Analyse your data for patterns & trends
2. Analyse your process for wastes
3. Identify opportunities to remove the wastes
4. Prioritise the opportunities
5. Perform root cause analysis on the process issues
6. Analyse people’s behaviours in the process too
14

Define
What are all the possible solutions? Which ones are best? How can we try it out? Has it worked as we expected? Which ones will we keep?
Improve the process.
Be creative in finding new ways to do things, quicker, cheaper & better.
Use structured methods to implement changes.
Collect data on measures to validate improvement/
Manage & communicate changes.
Mobilising Commitment to change.
Tried & tested Solutions
Process Maps and Documentation
Cost/Benefit Analyses
Improvement Impacts and Benefits
Pilot and Solution Results
Storyboard
Staff engagement
Activities Tools Outcomes
PDSA cycle
Project management
5S’s
Change Curve
Measure Improve Control Analyse
15

PDSA Template
16

PDSA Template
Plan-the change, predictions and data collection
What are we testing and who is carrying out the test?
Who are we testing the change on?
When are we testing?
Where are we testing?
Do – test (carry out the change)collect data and begin analysis
What was actually tested?
What happened?
Observations
Problems
Study
Complete analysis of data, summarize what was learned, compare data to predictions
Act
What changes should we make before the next test cycle?
What will the next test cycle be?
Are we ready the implement the change?
Which actions need to be conducted in the 30 day sustain period?
17

5S Scorecard
Level O
f Im
provem
ent
Steps of Implementation
20
19
18
17
16
15
14
13
12
11
10
9
8
7
6
5
4
3
2
1
Area owners
identified and
responsibilities
documented.
Level
Anything not
required for
immediate
utilization is
removed from
the area
Immediate actions
taken against
abnormalities. Area
kept orderly on a
continuous basis.
Non-utilized cabinets,
benches, tables,
Equipment & stock
etc.identified and
removed from
area.
Unneeded equipment
& stock removed
from area not
stored away.
Needed and unneeded
equipment & stock
have been identified
and separated.
Needed and unneeded
equipment & stock
are mixed throughout
the work area.
Daily cleanliness
inspection of
equipment and stock.
Repeated between
cases.
Visual controls
established and well
marked for work area.
Work areas unkempt.
No visual controls in
place. Information is
difficult to
access
Level 4
Level 3
Level 2
Level 1
Immediate actions
taken
against
abnormalities.
Team take
ownership; standards
are followed.
Daily checks performed
by Team Leaders;
standards are regularly
reviewed and
updated.
Periodic checks are
performed by Team
Leaders.
No area checks are
performed; standards
are not established.
Sustain Sort Shine 5S’s
Establish & follow
standard procedures.
They are clear,
up-to-date,
and displayed
in work areas.
Area layout,
equipment, stock &
communications are
documented,
standardized &
followed rigorously.
Labeling of items
with required
quantities are
standardized.
Procedures are
documented, but not
consistently followed.
No procedures in
place.
Standardize All items can be
easily
retrieved by
anyone;
they are clearly
marked.
Standardized item
quantities are
established;
Correct locations are
outlined.
Needed items have
dedicated locations
which are clearly
labeled.
Needed items have
been safely stored
and organized.
Items are placed
randomly throughout
the work place.
Set in Order
5
Area: Date:
Auditor:
5 S Scorecard
18
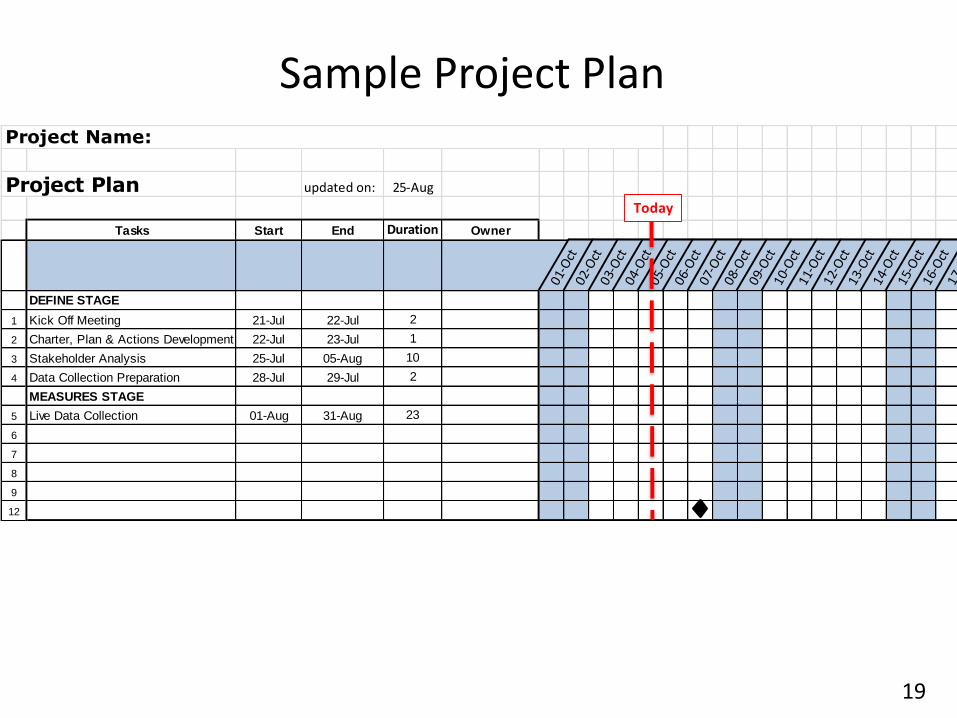
Sample Project Plan
Project Plan updated on: 25-Aug
Tasks Start End Duration Owner
Project Name:
01-O
ct02
-Oct
03-O
ct04
-Oct
05-O
ct06
-Oct
07-O
ct08
-Oct
09-O
ct10
-Oct
11-O
ct12
-Oct
13-O
ct14
-Oct
15-O
ct16
-Oct
17-O
ct
DEFINE STAGE
1 Kick Off Meeting 21-Jul 22-Jul 2
2 Charter, Plan & Actions Development 22-Jul 23-Jul 1
3 Stakeholder Analysis 25-Jul 05-Aug 10
4 Data Collection Preparation 28-Jul 29-Jul 2
MEASURES STAGE
5 Live Data Collection 01-Aug 31-Aug 23
6
7
8
9
12
Today
19

Progress Summary Project Title:
PROGRESS TO PLAN:
Status : Progress Summary:
KEY ISSUES Owner Due
ACHIEVEMENTS:
PLANS Owner Due
Project Leader :
Project Manager :
Green = On plan.
Amber = Requires attention to meet plan
Red = Progress stopped, requires immediate escalation
Date :
20

Action Tracker
Open Actions Tracker Status Key :
Blue = Action agreed by team as Completed
Last Updated : 15/08/08 by : CA Amber = Action Pending - Not started yet, requires attention.
Green = Action in Progress and on Plan.
Red = Roadblock or Showstopper , requires immediate escalation.
# ACTION / ISSUE CATEGORY RAISED BY RAISED ON OWNER
PLANNED
COMPLETION
DATE
NEW
COMPLETION
DATE
DEPENDENCY COMMENTS / UPDATES STATUS
G
A
R
Complete
Project Title :
21

Project Management basics
Project Governance cycle:
Mon Tues Wed Thurs Fri
Sponsor
Team Lead
/ PM
Team
Members
Prepare Updates
for Weekly Review
Collate & issue
Team Update
Report
Weekly
Progress
Review
Meeting /
Con Call
Monthly Board
Progress
Updates
Progress Tasks
22

IMPROVE Stage Checklist
Task Who Status
1. Plan your changes – start with PDSA
2. Perform pilot change small scale first
3. Assess pilot results
4. Re run pilot if necessary
5. Develop implementation plan
23

Define
How do we makes our changes normal operation? How can we sustain our improvements & benefits? How will we measure in future? Have we met the goals we set and can we close the project?
Control the new processes.
Embed the changes into everyday routines and systems.
Maintain monitoring reports.
Demonstrate and Sustain the benefits.
Making Change Last
Sustaining Benefits
Standards and Procedures
Standardization
Trained staff & training Plans
Project & Team Review
Success Stories
Replication opportunities
Activities Tools Outcomes
Sustain/Control plan
Measure Control Analyse Improve
24

Control Plan Steps you can take to ensure the sustainability of your project
Improvement How go wrong?
How stop it?
How know when gone wrong?
How correct?
Action & owner
25
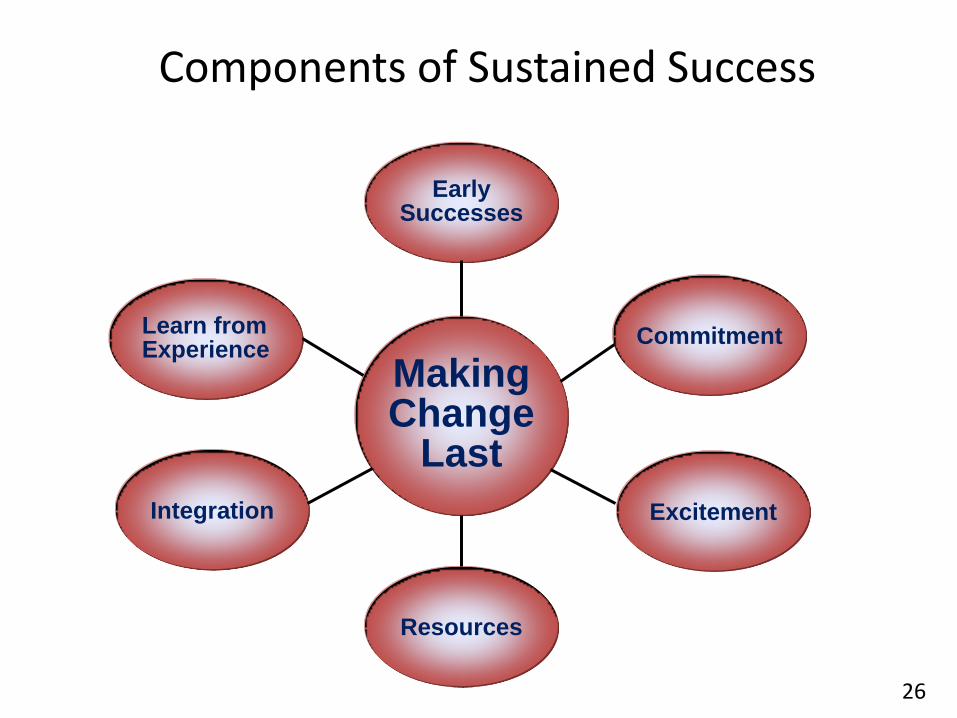
Making Change
Last
Integration
Resources
Excitement
Commitment
Early Successes
Learn from Experience
Components of Sustained Success
26
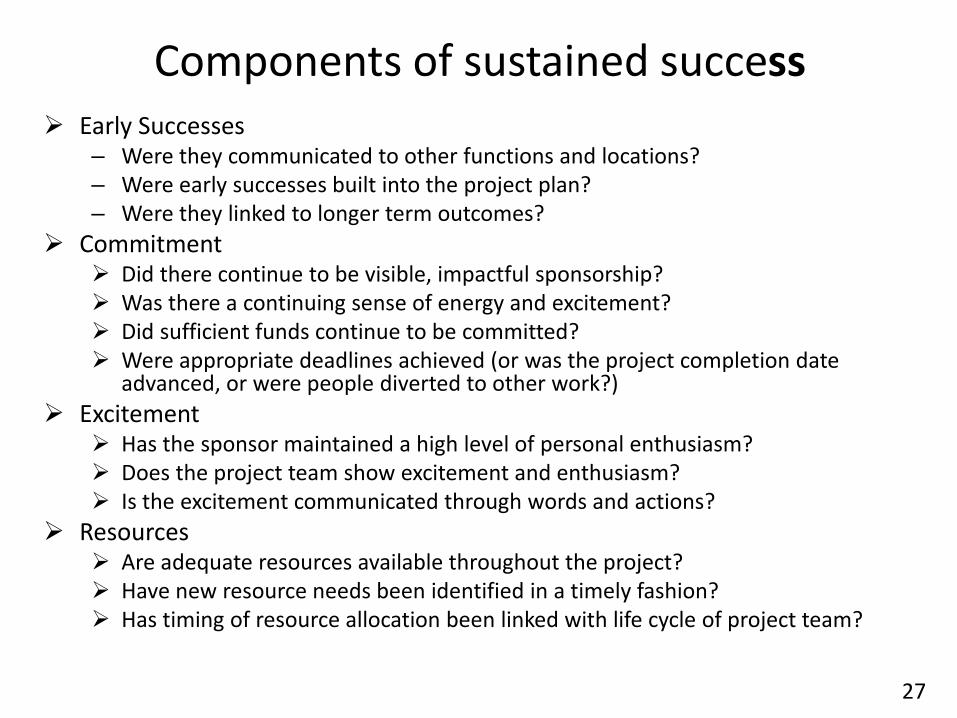
Components of sustained success Early Successes
– Were they communicated to other functions and locations? – Were early successes built into the project plan? – Were they linked to longer term outcomes?
Commitment Did there continue to be visible, impactful sponsorship? Was there a continuing sense of energy and excitement? Did sufficient funds continue to be committed? Were appropriate deadlines achieved (or was the project completion date
advanced, or were people diverted to other work?)
Excitement Has the sponsor maintained a high level of personal enthusiasm? Does the project team show excitement and enthusiasm? Is the excitement communicated through words and actions?
Resources Are adequate resources available throughout the project? Have new resource needs been identified in a timely fashion? Has timing of resource allocation been linked with life cycle of project team?
27

CONTROL Stage Checklist
Task Who Status
1. Complete Control Plan for changes made
2. Define Control measures/metrics
3. Rollout improved processes/changes
4. Monitor Progress using measures
5. Conduct training on new processes
6. Document new processes
7. Define ownership of new processes
28
Related Documents