Leadership and Corporate Responsibility Metrics for Sustainable Corporate Performance esmt CRLSF # 1 Working Paper Series on Responsible Leadership and Sustainability Francisco Székely, Ph.D., Adjunct Professor, and Marianna Knirsch, Research Assistant Center for Responsible Leadership and Sustainable Futures European School of Management and Technology, Berlin October, 2005

Welcome message from author
This document is posted to help you gain knowledge. Please leave a comment to let me know what you think about it! Share it to your friends and learn new things together.
Transcript
Leadership and Corporate Responsibility
Metrics for Sustainable Corporate Performance
esmt CRLSF # 1 Working Paper Series on
Responsible Leadership and Sustainability
Francisco Székely, Ph.D., Adjunct Professor, and Marianna Knirsch, Research Assistant
Center for Responsible Leadership and Sustainable Futures European School of Management and Technology, Berlin
October, 2005
Metrics for Sustainable Performance
2
TABLE OF CONTENTS
Executive Summary I. Background
II. Sustainability, Responsible Leadership and Corporate Social Responsibility
III. Methods and Tools to Measure Corporate Sustainability Performance
IV. How German Companies Measure Sustainability Performance
V. The Forum “Metrics for Sustainable Performance,” Held at esmt’s Munich Campus on 16 June 2005
VI. Conclusions
ANNEX 1: PERFORM Indicators ANNEX 2: Britain’s IChemE Indicators ANNEX 3: Websites on Metrics for Sustainable Performance ANNEX 4: Bibliography
Metrics for Sustainable Performance
3
EXECUTIVE SUMMARY
Perhaps the biggest challenge for humanity in the twenty-first century is to build a sustainable society. During the last fifty years, the world has become ever more unsustainable. The planet is overpopulated, our natural resources have been severely degraded, and the gap between rich and poor has widened dramatically. It is important to point out at the outset that the challenge of building a sustainable society requires the adoption of a long-term view and the commitment and active participation of all members of society, particularly the private sector. The last few years have demonstrated that short-term thinking, especially when coupled with managerial incentive schemes that over-reward short-term economic performance, can undermine the long-term institution building and sustained growth and profit of companies. Some corporate icons have disappeared from the economic landscape altogether and many others fear a similar fate. It has become increasingly clear that shareholder value is a highly desirable outcome but a very poor goal in terms of both motivating employees and business partners and securing the support of society and public officials. During the last five years, many large companies have initiated a number of sustainable development initiatives mainly to address the demands and expectations of government authorities, pressure groups, consumers, industry, religious associations and society at large. Although most analysts argue that these initiatives contribute to making business more profitable, many managers are not yet convinced of the validity of this argument. The reason is that most sustainable development initiatives launched by companies have been developed in isolation of business activity and are not yet directly linked to business strategy. One way to strengthen the link between sustainable development initiatives and the business strategy of a company is to measure how much its performance improves as a result of implementing sustainable development initiatives. esmt has started a research project to identify the best available methods and criteria that companies have been using to measure their sustainable performance. Our project has conducted an extensive review of relevant literature and examined in detail the way twenty major German companies measure and report their sustainability performance today. The research project attempts to provide business managers with practical tools and methodologies for implementing sustainable principles and initiatives that will contribute to improving the overall performance of their companies. This project examines and evaluates not only the different methods used to measure sustainability performance, but also the usefulness of reporting practices and the role that external and internal management incentives play in promoting sustainability performance.
• Initial findings 1. There are various approaches that have been used to measure, monitor and assess a company’s
progress toward sustainability, including: sustainability surveys, sustainability metrics, sustainability indexes, performance indicators, award schemes, investor criteria, accountability, reporting, internal and external communication tools, benchmarking, accreditation processes, standards, codes, social screening services, screening systems, and sustainability performance ranking. None of these methods represents a clear universal tool that can be used by all industries or by all companies within the same industry.
2. External incentives and the adoption of internal sustainable management practices seem to have a
significant potential to transform companies into sustainable institutions. An example of an efficient external incentive is the analysis of the increasing participation of capital markets in rating the
Metrics for Sustainable Performance
4
sustainable performance of companies. Companies today are paying close attention to the criteria used not only by ethically oriented investors, but also by sustainability-focused think tanks and consulting firms that assess the sustainable performance of companies and determine whether they are worth investing in or having in one’s community. This work forms the basis of recommendations that go out to clients and society at large.
3. The sustainable performance of a company is generally measured by assessing three aspects of sustainability: economic, social and ecological performance. The initial findings of our project indicate that companies have made significant progress in measuring economic performance. There are clear rules and a broad understanding of how to take the economic pulse of a company at any given time. The environmental performance of companies is measured mainly by assessing their externalities to society and the environment—in other words, by measuring their “environmental footprint.” The assessment of environmental performance is still very limited since it is mainly based on primary environmental impacts such as natural resource depletion, land degradation, pollution emissions, energy consumption and waste generation—and not on the long-term environmental impact of company operations. The assessment of the social impact of companies, however, seems a more difficult task and much less developed than the assessment of economic and environmental performance. Companies today tend to focus and report on their philanthropic initiatives and improved labor practices (i.e. reducing accidents at work, hiring more women, and employing a more ethnically diverse workforce). Although highly desirable, these practices do not reflect society’s expectations of the private sector in terms of building a sustainable society.
4. The reporting of sustainability practices varies from company to company, and it is often difficult to understand and compare reporting methods. Most of the companies we analyzed, however, have adopted the Sustainability Reporting Guidelines of the Global Reporting Initiative (GRI) and are participating in the United Nations’ Global Compact Initiative. In doing so, they feel they are adequately reporting the sustainable performance of their companies to society. The reality is that society expects much more from sustainability reporting. It is asking for greater transparency and easier access to information on the social and ecological impacts of companies. The adoption of the GRI’s guidelines represents a good start. However, these guidelines still need to be improved and developed. The Global Compact Initiative seems to be more of an exercise in improving the image of companies than an undertaking with strong and visionary leadership designed to promote the serious internal structural changes that companies need to become more sustainable. There is a need to establish clear and user-friendly methodologies and tools to measure the progress that companies are making toward sustainability.
The initial results of the project were presented on 16 June 2005 on our Munich campus and discussed by experts and interested individuals. It is the belief of the European School of Management and Technology that the evolution of the ideas generated by our analysis will benefit from a dialogue with different members of society. Professor Francisco Székely, Ph.D. esmt Center for Responsible Leadership and Sustainable Futures
Metrics for Sustainable Performance
5
I. Background
a. The European School of Management and Technology The European School of Management and Technology (esmt) is Europe’s new center for international executive education. esmt’s mission is to develop a new generation of twenty-first century leaders who are professional, entrepreneurially minded, farsighted and responsible. In keeping with the European tradition, they will be internationally oriented and culturally grounded. Research at esmt relates theory to practice with the goal of achieving new generalizations and conceptual insights. esmt´s Center for Responsible Leadership and Sustainable Futures is a research initiative devoted to the challenges of achieving long-term sustainable business performance. Our approach to sustainability research and thinking is based on a leadership perspective rather than the usual technical or public-policy focus. The question that we ask and seek to answer is how leaders must reconcile different perspectives and stakeholder interests in order to ensure a high level of corporate performance, significant social performance and a positive ecological scorecard.
b. Genesis of the project Perhaps the biggest challenge for the twenty-first century is how to build a sustainable society. This challenge must be addressed by all members of society: government authorities, the private sector, the academic community, non-governmental organizations, consumers and individuals. The concept of sustainable development emerged in the 1980s. At that time, the business sector was singled out as a key player in efforts to build a sustainable society. The participation of business in this task, however, requires a paradigm shift and a rethinking of the basic assumptions of the traditional capitalist business model. The last few years have demonstrated that short-term thinking, especially when coupled with managerial incentive schemes that over-reward short-term performance, can undermine both long-term institution building and sustained growth and profitability. Some corporate icons have disappeared from the economic landscape altogether, and many others fear a similar fate. It has become increasingly clear that shareholder value is a highly desirable outcome but a very poor goal in terms of both motivating employees and business partners and securing the support of society and public officials. Many large and medium-sized companies have started to incorporate sustainability into their business strategies. However, they report on their initiatives in ways that are difficult to understand and compare. There is a need to establish clear, user-friendly methodologies and tools to measure the progress that companies are making toward sustainability. The project “Responsible Leadership and Corporate Social Responsibility” was thus designed to focus on some specific issues of sustainable performance. It has set itself the following goals:
• Analyze the existing tools and methodologies used to measure sustainable performance
• Determine the yardsticks that capital markets employ to measure the progress made by the private sector in its efforts to meet society’s sustainability requirements
• Investigate how companies measure the sustainable performance of managers and employees
Metrics for Sustainable Performance
6
II. Sustainability, Responsible Leadership and Corporate Social Responsibility
II.1. Sustainable performance of a company
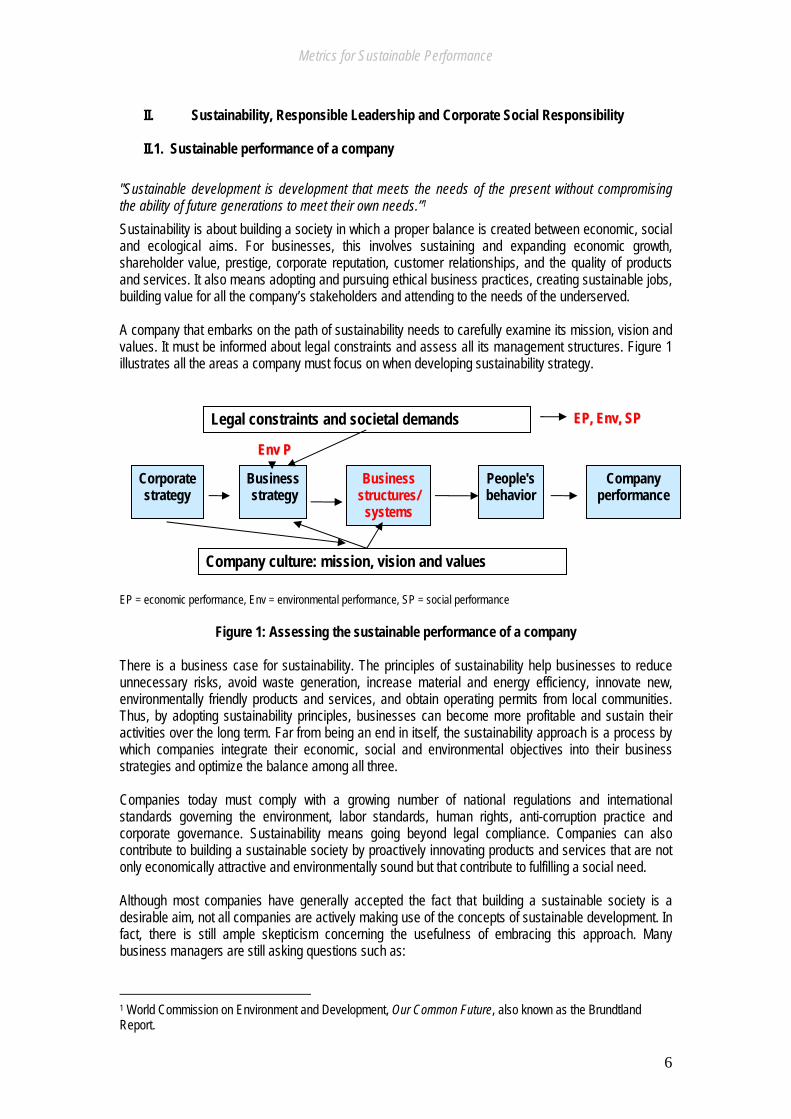
"Sustainable development is development that meets the needs of the present without compromising the ability of future generations to meet their own needs.”1 Sustainability is about building a society in which a proper balance is created between economic, social and ecological aims. For businesses, this involves sustaining and expanding economic growth, shareholder value, prestige, corporate reputation, customer relationships, and the quality of products and services. It also means adopting and pursuing ethical business practices, creating sustainable jobs, building value for all the company’s stakeholders and attending to the needs of the underserved. A company that embarks on the path of sustainability needs to carefully examine its mission, vision and values. It must be informed about legal constraints and assess all its management structures. Figure 1 illustrates all the areas a company must focus on when developing sustainability strategy.
EP = economic performance, Env = environmental performance, SP = social performance
Figure 1: Assessing the sustainable performance of a company There is a business case for sustainability. The principles of sustainability help businesses to reduce unnecessary risks, avoid waste generation, increase material and energy efficiency, innovate new, environmentally friendly products and services, and obtain operating permits from local communities. Thus, by adopting sustainability principles, businesses can become more profitable and sustain their activities over the long term. Far from being an end in itself, the sustainability approach is a process by which companies integrate their economic, social and environmental objectives into their business strategies and optimize the balance among all three. Companies today must comply with a growing number of national regulations and international standards governing the environment, labor standards, human rights, anti-corruption practice and corporate governance. Sustainability means going beyond legal compliance. Companies can also contribute to building a sustainable society by proactively innovating products and services that are not only economically attractive and environmentally sound but that contribute to fulfilling a social need. Although most companies have generally accepted the fact that building a sustainable society is a desirable aim, not all companies are actively making use of the concepts of sustainable development. In fact, there is still ample skepticism concerning the usefulness of embracing this approach. Many business managers are still asking questions such as:
1 World Commission on Environment and Development, Our Common Future, also known as the Brundtland Report.
Corporate strategy
Business strategy
Business structures/
systems
People's behavior
Company performance
Legal constraints and societal demands
Company culture: mission, vision and values
EEPP,, EEnnvv,, SSPP
EEnnvv PP
Metrics for Sustainable Performance
7
• Are there substantial benefits for businesses that act in a sustainable manner? • Are investors playing an increasingly important role in the development of society? Are
they interested in more than just dividends? • Are global pressures forcing organizations to reevaluate corporate structures, processes,
cultures and resources? • Are employees interested in more than just their jobs? • Are consumers interested in more than what products can deliver?
To answer these questions, tools are required that measure the impact of sustainability on the short- and long-term performance of businesses.
II. 2. Responsible leadership
- What role does leadership play in promoting sustainability? The adoption of sustainability within a company is much more than a mere public relations exercise. Sustainability takes place only when there is an active leader/manager within the firm who champions this approach. In our research we found that it always takes a leader to transform a company into a sustainable and socially responsible enterprise. This individual needs to be both a good leader and a good manager. His/her sustainability work starts by carefully examining all the factors that determine the sustainability performance of his/her company and its suppliers. These factors can be internal (mainly managerial and organizational) or external (stakeholders’ demands). Addressing these internal and external factors is not an easy task. There are a number of time and market barriers that need to be overcome. However, the most critical success factor for sustainability is true leadership within the organization. Leadership means securing the commitment of management (starting at the very top) and developing a system of incentives to reward leaders at all levels who develop and push for the adoption of sustainability practices. It also refers to the ability to respond flexibly to change and to engage in dialogue and partnerships with different members of society. The importance and scope of such factors will vary from business to business, reflecting the context in which a business operates.
a. Internal factors that determine sustainability within a company Companies embarking on a strategic approach to corporate sustainability expect their contributions to enhance business performance and to support the long-term interests of the company. The Global Compact Initiative2 has identified a number of ways in which the efficient management of environmental, social and governance issues can contribute to creating shareholder value.3 The internal factors favoring the adoption of a sustainable approach toward business operations include: 2Announced at the World Economic Forum in Davos in 1999 and launched in New York in 2000 in response to concerns about the adverse effects of globalization, the Global Compact Initiative aims to create a more sustainable and inclusive global economy. It contributes to the global dialogue on corporate citizenship and sustainability and is one of the most important institutions working to align business with sustainable development. More than 2,000 companies and stakeholders have joined, including 200 major multinationals. The “ten principles” of the Global Compact in the areas of human rights, labor policy, environmental protection and anti-corruption policy enjoy universal acceptance and are derived from the Universal Declaration of Human Rights, the International Labor Organization’s Declaration on Fundamental Principles and Rights at Work, the Rio Declaration on Environment and Development, and the United Nations Convention against Corruption. The principles are not new, but by uniting internationally accepted standards and framing them as business commitments, the UN Global Compact functions as a principle-based global benchmark for corporate citizenship. 3UN Global Compact, Who Cares Wins.
Metrics for Sustainable Performance
8
Managerial factors: Assessment of all internal organizational structures and management procedures Development and implementation of incentive mechanisms to promote
sustainability initiatives and to increase the sustainable performance of companies
Early identification of potential business opportunities Recognition of emerging risks, potential threats and management failures Better risk management, lower risk levels Improvement in workers’ safety and the quality of labor recruitment and retention
Operational factors:
Identification of environmental problems Minimization of environmental footprint Reduction of material inputs Achievement of energy efficiency (eco-efficiency) Operating licenses
Economic factors:
New market opportunities Cost savings Technological innovation
b. External factors that determine sustainability within a company The factors outside the company that compel managers to act in a certain way or to respond to society’s expectations and demands are:
Market factors: Product differentiation Customers’ values (e.g. green consumers, human rights) Access to new markets Industry competition More competitive labor markets Increased consumer interest in ethical and socially responsible business conduct Socially oriented investors Ratings agencies Improved company reputation
Government factors:
Increased regulatory intervention Operating licenses
Stakeholder expectations:
Full transparency and access to information Internalization of negative externalities (pollution and waste) Demands for reduced material consumption Adoption of international labor codes (human rights groups) Transparent reporting (investors and authorities)
Cost analysis can be greatly reduced through the assessment of risks and uncertainties. In some industrial sectors, key risks and uncertainties have strong links to environmental and social concerns.
Metrics for Sustainable Performance
9
Economic, environmental and social indicators can help management anticipate new risks and opportunities in the marketplace. For example:4
• Knowledge of direct and indirect energy use and the types of fuels consumed by the company can reveal its exposure to the risks of future carbon emission agreements and requirements.
• Performance indicators on energy efficiency initiatives and the use of renewable energy can help demonstrate the degree to which the company is insulated from volatile, cyclical non-renewable energy markets.
• Performance indicators relating to worker health and safety can help assess the risk of costly accidents or workers’ demands for compensation.
Investors are an important external factor that puts real pressure on companies to engage in sustainability practices. Following the initial success of ethical investment funds, a new trend toward socially responsible investment (SRI) has emerged over the last few years. The objective of such initiatives is to advise clients on how to make investment decisions based wholly or partly on ethical preferences and the sustainable performance of companies. Hence, to earn an SRI label, investment analysts must take into account the processes by which companies operate as well as the nature of their products. Socially responsible investment is growing as more analysts, investors and fund managers integrate environmental, social and governance issues into their investment decisions. A better inclusion of these factors in investment decisions will ultimately contribute to more stable and predictable markets and benefit all market players. The investment rationale for including environmental, social and governance criteria lies in the growing importance of intangible assets such as management skills, reputation, human/intellectual capital, brands and the ability to work in partnership with stakeholders. In a recent survey of European fund managers, analysts and investment relations officers, 78 percent found that the management of environmental and social risk had a positive impact on a company’s long-term market value.5
c. Sustainable performance: barriers and challenges - Time horizons
One of the crucial barriers that companies need to overcome when developing a business strategy that incorporates the principles of sustainability is how to plan for their short- and long-term future. The adoption of a sustainable approach requires a much longer timeframe and perspective than the short- to medium-term planning horizon most business leaders use. The market’s short-term evaluation is a major impediment to businesses that are trying to align performance with sustainable development.6 Embarking on sustainable performance entails long-term scenario planning and risk management to secure future business success. The key barrier to adopting a long-term approach to sustainable business performance is related to the approach a company takes when addressing the issue. It is not a one-time management decision but requires continuous assessment. This effort may lead to costs in the form of time and investments over the short term if the company wants to plan and implement sustainability measures. - Market response Consumers are increasingly demanding in-depth information on product quality, product ingredients and manufacturing methods. They are concerned with the health and security aspects of products and production sites as well as with recycling issues. Transparency across these fields is essential.
4 www.globalreporting.org. 5 CSR Europe, Deloitte and Euronext, Investing in Responsible Business, 2003. 6 AccountAbility and CSR Network, The Accountability Rating 2004.
Metrics for Sustainable Performance
10
Unfortunately, the market does not always reward sustainability investments with premium margins. Although it is true that some environmentally oriented market niches exist (e.g. organic food), most people are not willing to pay a premium just because a product or the company producing it is more sustainable. One of the reasons given in the literature for the disparity between what consumers say they do and what they actually do is that “green” products might not meet consumer criteria regarding price, performance and quality. An environmentally friendly consumer might not buy green because the product repeatedly fails to meet his/her expectations or because he/she is not willing to pay the premium price.7 At the same time, it is crucial to note that consumers can be very quick, powerful and successful when it comes to banning or boycotting certain products or companies once a corporate reputation is under attack or tarnished.
“In the global economy, there are many jurisdictions to which a company can run to avoid regulation and taxes or reduce labor costs. But there are few places where a company can hide its activities from skeptical consumers, shareowners and protestors.”8
d. Critical success factors to achieve sustainability
There are at least three critical success factors that a company needs to fulfill to achieve sustainable performance. Leadership and vision, flexibility to change, and openness for engagement. - Leadership and vision A number of factors are crucial for successfully implementing long-term business sustainability measures. Good sustainability performance is heavily influenced by the full and honest commitment of management to sustainability and by the adoption of a management incentive scheme. The top management of a company needs to send the right signals to promote sustainability and to set an example in how sustainable principles are followed. A variety of management measures need to be taken and supported by top management, not only the establishment of management systems, but also the introduction of incentives and training on sustainability issues that drive performance on non-financial issues. These measures must also include product and process innovations that improve sustainability performance. Key top managerial staff must be committed to this objective, and companies must ensure that sustainability values and vision are not only integrated into business strategy, policies and culture, but also communicated to all employees. Setting appropriate goals and targets, developing a coordinated approach, monitoring and evaluating progress, and optimizing the process when necessary—such measures facilitate learning and build credibility. Companies that not only identify and communicate key issues and value drivers but also clearly prioritize economic, environmental and social sustainability issues can gain a competitive edge by proactively managing sustainable performance. Improved overall performance can only be achieved by setting sustainable performance targets that are consistent with the company’s operating principles and that measure, report on and, if necessary, adapt performance to these targets over time. - Flexibility to change Adopting a sustainability approach involves continuous effort, investment and adaptation. A key challenge lays in aligning sustainability activities with the nature of the business, in defining the right positioning at board level, and in securing the commitment of key staff. The objective must be to incorporate sustainability into the overall business strategy and policy of a company. One of the greatest pitfalls occurs when companies view sustainable development as a mere regulatory compliance issue, and address it through typical environmental, health and safety programs. Companies that implement successful sustainable development programs view it as a strategic issue. Their chief executive officer 7Ibon Galarraga and Anil Markandya, Economic Techniques to Estimate the Demand for Sustainable Products. 8 King Committee on Corporate Governance, King II Report for South Africa, 2002.
Metrics for Sustainable Performance
11
or other senior executives are champions of this cause, and they encourage cross-functional collaboration throughout the organization in pursuit of innovative products and business models. For sustainable development to become truly integrated into business decisions, a systematic sustainable development performance measurement is essential.9 - Openness: stakeholder engagement In order to develop a shared understanding of approaches and expectations, including the provision of external benchmarks, it is important to engage with key stakeholders in their own right and not only with investors with short-term financial interests. Stakeholder engagement means more than just entering into dialogue. It has to produce real learning effects that lead to product and process improvement or innovation.10 Engagement with internal and external stakeholders as well as with sectoral and multi-stakeholder initiatives supports the learning process and increases credibility, commitment and innovation. Reporting on and communicating sustainability investments and achievements helps demonstrate transparency and seriousness of intent and rewards staff and partners for their input into the sustainability programs. The internal objective of reporting is to track and improve sustainability performance. External reporting enables stakeholders to judge an organization’s performance and make informed decisions on how and to what extent they want to interact.11 It is crucial to distinguish between voluntary activities and legal requirements and not to claim the latter as part of a voluntary program. For this reason good reporting practice includes providing information that is material and relevant, granting access to more information when needed, and ensuring that reporting is comparable and consistent over time. Business in the Community states that “reporting is not an end to itself. It’s a means to build trust with your employees, customers, suppliers and other stakeholders by demonstrating your company’s openness and willingness to be accountable for its actions and impact on society.”12
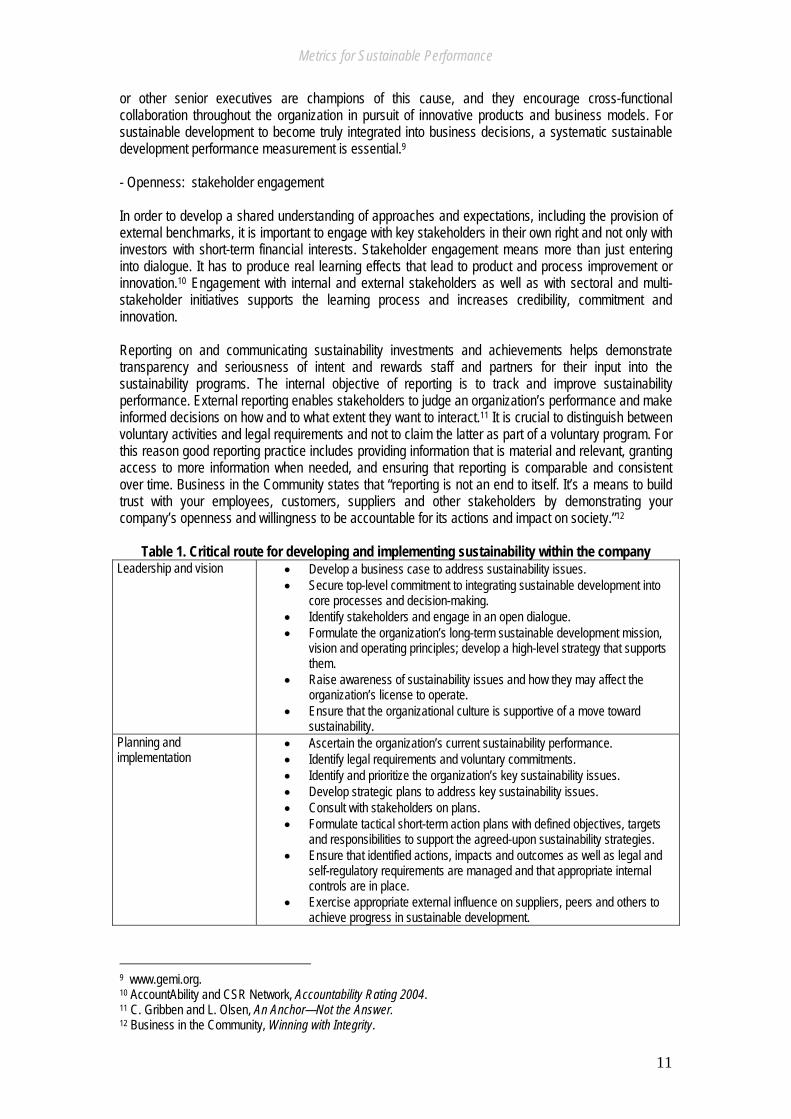
Table 1. Critical route for developing and implementing sustainability within the company Leadership and vision • Develop a business case to address sustainability issues.
• Secure top-level commitment to integrating sustainable development into core processes and decision-making.
• Identify stakeholders and engage in an open dialogue. • Formulate the organization’s long-term sustainable development mission,
vision and operating principles; develop a high-level strategy that supports them.
• Raise awareness of sustainability issues and how they may affect the organization’s license to operate.
• Ensure that the organizational culture is supportive of a move toward sustainability.
Planning and implementation
• Ascertain the organization’s current sustainability performance. • Identify legal requirements and voluntary commitments. • Identify and prioritize the organization’s key sustainability issues. • Develop strategic plans to address key sustainability issues. • Consult with stakeholders on plans. • Formulate tactical short-term action plans with defined objectives, targets
and responsibilities to support the agreed-upon sustainability strategies. • Ensure that identified actions, impacts and outcomes as well as legal and
self-regulatory requirements are managed and that appropriate internal controls are in place.
• Exercise appropriate external influence on suppliers, peers and others to achieve progress in sustainable development.
9 www.gemi.org. 10 AccountAbility and CSR Network, Accountability Rating 2004. 11 C. Gribben and L. Olsen, An Anchor—Not the Answer. 12 Business in the Community, Winning with Integrity.
Metrics for Sustainable Performance
12
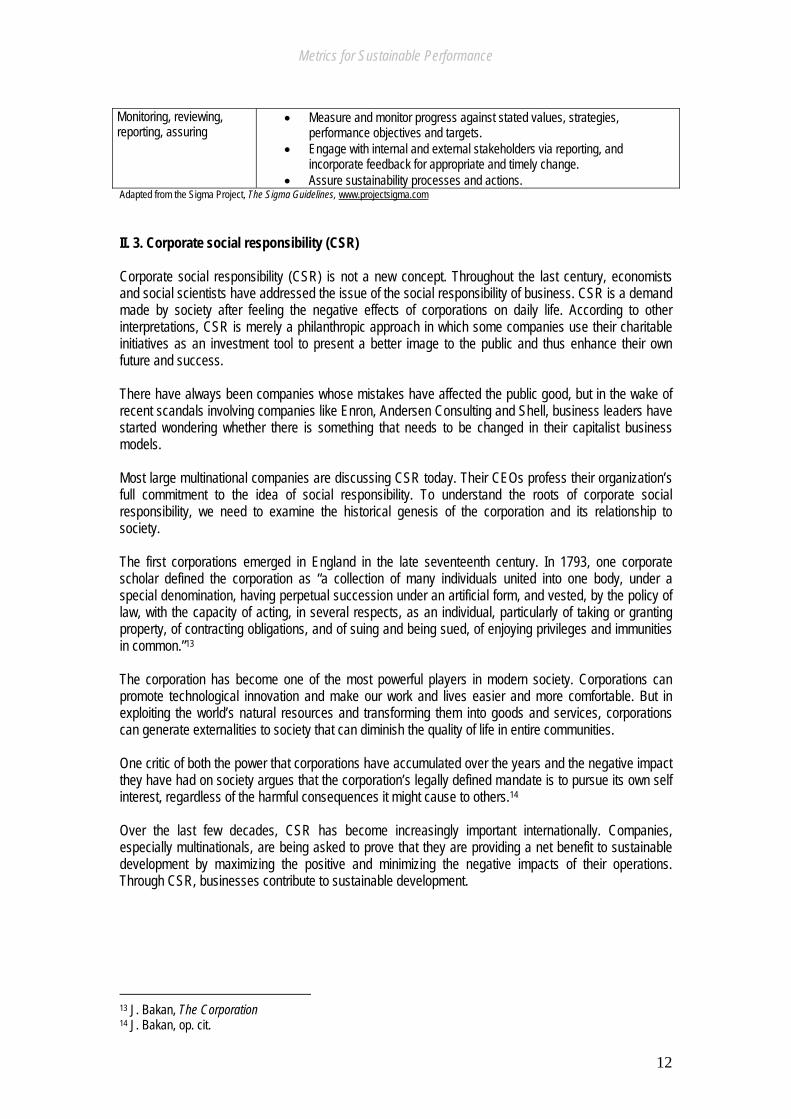
Monitoring, reviewing, reporting, assuring
• Measure and monitor progress against stated values, strategies, performance objectives and targets.
• Engage with internal and external stakeholders via reporting, and incorporate feedback for appropriate and timely change.
• Assure sustainability processes and actions. Adapted from the Sigma Project, The Sigma Guidelines, www.projectsigma.com II. 3. Corporate social responsibility (CSR) Corporate social responsibility (CSR) is not a new concept. Throughout the last century, economists and social scientists have addressed the issue of the social responsibility of business. CSR is a demand made by society after feeling the negative effects of corporations on daily life. According to other interpretations, CSR is merely a philanthropic approach in which some companies use their charitable initiatives as an investment tool to present a better image to the public and thus enhance their own future and success. There have always been companies whose mistakes have affected the public good, but in the wake of recent scandals involving companies like Enron, Andersen Consulting and Shell, business leaders have started wondering whether there is something that needs to be changed in their capitalist business models. Most large multinational companies are discussing CSR today. Their CEOs profess their organization’s full commitment to the idea of social responsibility. To understand the roots of corporate social responsibility, we need to examine the historical genesis of the corporation and its relationship to society. The first corporations emerged in England in the late seventeenth century. In 1793, one corporate scholar defined the corporation as “a collection of many individuals united into one body, under a special denomination, having perpetual succession under an artificial form, and vested, by the policy of law, with the capacity of acting, in several respects, as an individual, particularly of taking or granting property, of contracting obligations, and of suing and being sued, of enjoying privileges and immunities in common.”13 The corporation has become one of the most powerful players in modern society. Corporations can promote technological innovation and make our work and lives easier and more comfortable. But in exploiting the world’s natural resources and transforming them into goods and services, corporations can generate externalities to society that can diminish the quality of life in entire communities. One critic of both the power that corporations have accumulated over the years and the negative impact they have had on society argues that the corporation’s legally defined mandate is to pursue its own self interest, regardless of the harmful consequences it might cause to others.14 Over the last few decades, CSR has become increasingly important internationally. Companies, especially multinationals, are being asked to prove that they are providing a net benefit to sustainable development by maximizing the positive and minimizing the negative impacts of their operations. Through CSR, businesses contribute to sustainable development.
13 J. Bakan, The Corporation 14 J. Bakan, op. cit.
Metrics for Sustainable Performance
13
The European Multi-stakeholder Forum on CSR15 emphasized the following aspects of CSR: CSR is a voluntary integration of environmental and social considerations into business
operations, over and above legal requirements and contractual obligations. It is essential that management be committed to driving CSR forward. CSR is about the core business activities of a company and is likely to contribute to the long-
term sustainability of business in society. CSR is one means among many to achieve economic, social and environmental progress and
to integrate these concerns into business practice. The dialogue with relevant stakeholders adds value to the development of CSR practices and
tools. CSR is complementary to other approaches that aim for high environmental and social
performance, but it should not be used to shift public responsibilities to companies. CSR is an ongoing learning process for companies and stakeholders, and the development of
tools and practices is work in progress. Room for flexibility, innovation and improvement are important for successful CSR. Convergence of CSR practices and tools can achieve quality, consistency, comparability and
flexibility. - Stakeholder theory, globalization and CSR
One of the primary reasons for investing in CSR is the need for companies, especially multinationals, to protect and build their reputations across a diverse set of countries, cultures, values and socio-political situations. This means that the number of stakeholders and issues that a company faces and needs to consider strategically is growing, and global business success depends on productive relationships with local stakeholders. Stakeholder theory distinguishes between:
Direct stakeholders—shareholders and employees concerned with value creation and risk management
Indirect stakeholders—all individuals and organizations within the company’s sphere of influence, including customers, suppliers, NGOs, capital markets, financial analysts, government agencies and local communities.
Awareness and understanding of CRS on the part of all involved stakeholders can lead to better financial performance and support the creation of more sustainable societies:
Companies must lead the way by implementing environmental, social and governance principles and improving reporting and disclosure.
Regulators and governments must implement reporting standards and create legal frameworks that are predictable and transparent.
Investors and asset managers must integrate environmental, social and governance issues into research and investment processes and reward research on these topics.
Educators, consultants and analysts must incorporate those factors into research and facilitate high-level thinking and training to support demand and awareness building.
Non-governmental organizations must provide the public and financial institutions with objective information on the environmental, social and governance performance of companies.16
Companies must start managing their responsibilities to stakeholders, to the societies in which they operate, and to the natural environment. They must do so in much the same way that they manage quality, customer relationships, and the development of products and markets. 15 European Multi-stakeholder Forum on CSR, Corporate Social Responsibility. 16 UN Global Compact, Who Cares Wins.
Metrics for Sustainable Performance
14
- CSR and Sustainability in Germany
Unlike Anglo-Saxon economies, Germany does not have a long tradition of CSR, yet it has focused on environmental issues since the 1970s due to a strong green movement that has produced numerous environmental standards. European integration and the growing international positioning of German companies have foregrounded social sustainability issues in the overall sustainability discussion. At the political level, the issue of CSR is coordinated by the Federal Ministry of Economics and Labor (BMWA), whose standpoint is that there are many established activities in Germany that support CSR, such as the promotion of codes of conduct in the areas of foreign direct investment and procurement, and the involvement of all interest groups in the multi-stakeholder German standardization committee DIN-NAGUS, which mirrors the development of the ISO 14000 series. Further, in 1999 the German Foreign Office set up a working group on human rights and business. At the level of trade associations, the Federation of German Industries (BDI) tracks the numerous voluntary activities of German companies and is opposed to any further regulatory inroads into this area. The Confederation of German Employers’ Associations (BDA) is devoted to strengthening the International Labor Organization (ILO), which has addressed the issue of corporate responsibilities and their implications to society for over thirty years.17
Corporate social responsibility is an issue that has been receiving greater attention in discussions on business and sustainability. Are sustainability and CSR the same concept?
It is essential to recognize the differences between sustainability and CSR. In fact, sustainable business performance and CSR are not the same thing. Sustainable performance is the private sector’s response to the pressures and demands emerging from an environmental movement that is just thirty-five years old. These demands have been mainly geared toward regulating business environmental externalities and preventing resource depletion that comes from irrational consumption. CSR is over one hundred years old and is the business community’s response to society. It endeavors to improve the community’s reputation and broaden its acceptance. This response is based on diminishing the negative effects of business operations, engaging in and financing philanthropic activities, and marketing businesses as good citizens in order to present a better image to the public and thus enhance the future and success of these businesses.
17 T. Loew et al., Significance of the CSR Debate for Sustainability and the Requirements for Companies.
Metrics for Sustainable Performance
15
III. Methods and Tools to Measure Corporate Sustainability Performance Companies are increasingly being asked to provide more and better information on how they identify and manage social and environmental issues. They are also being asked to explain how these opportunities and threats affect short- and long-term value. The comparative analysis of sustainability is a complex task due to both the wide range of reporting practices for environmental, social and corporate governance risks/opportunities and the difficulty of verifying the accuracy of the information provided by companies. Whereas economic performance can be measured easily by internationally accepted standard measures, and environmental performance can be evaluated through input-output measurements, it is difficult to measure social performance and the intangible assets of a company. Standard measuring procedures are required to make possible greater comparability of sustainability policies and to enable the companies themselves to set and adapt targets and to develop standards for internal benchmarking and year-on-year progress. Companies need to focus on the future and report on future sustainability plans in addition to providing historical data on past activities. Key challenges that need to be further investigated include demonstrating the link between sustainability and economic performance and showing how sustainability parameters can be converted into quantifiable indicators that business managers and financial analysts can use. There are various approaches to measuring, monitoring and assessing a company’s progress towards sustainability. They include:
a. Surveys b. Award schemes c. Investors criteria d. Benchmarking e. Sustainability indexes f. External communication tools g. Accreditation processes h. Standards and codes i. Sustainability Indicators j. Metrics for sustainability performance k. Non-quantifiable sustainability initiatives
a. Surveys on sustainability performance
These are studies that examine the way different stakeholders perceive the environmental performance of a company. There are internal (within the company) and external surveys. There is an increasing number of surveys conducted on corporate sustainability performance. The surveys are carried out by:
Industry Business lobbies (World Business Council on Sustainable Development,
etc.) Non-governmental organizations (NGOs) Professional associations (CSR Europe, ISR Compass) International organizations(United Nations, OECD) Academic institutions
Experience with surveys has shown that they are not an objective tool. Surveys mostly reflect opinions and do not provide the “hardcore data” necessary to make a proper assessment of the sustainable
Metrics for Sustainable Performance
16
performance of a company. An additional problem is that there are no methodological guidelines for developing and conducting sustainability surveys.
b. Award schemes
Sustainability awards are presented by initiatives that publicly recognize companies that are working to reduce their impact on the environment, that are innovating environment friendly products and services, or that are incorporating sustainability principles into their business strategies. There have been a large number of international, national and local initiatives that seek to acknowledge and spotlight those businesses that are considered sustainability leaders. The awards attract entries from a wide range of sectors, including finance, education, manufacturing, real estate, retailing, energy and government. Since 2000, sustainability award programs have been expanded from one category to three—small businesses, large businesses and the public sector—to acknowledge the different capacities and resources of organizations. Most sustainability awards began by focusing mainly on the environmental performance of companies. For example, in 1996 the Association of Chartered Certified Accountants (ACCA)18 was one of three co-founders of the European Environmental Reporting Awards (EERA). Participants in the EERA are European accountancy bodies. The award program was renamed the European Sustainability Reporting Awards (ESRA) in 2002 to reflect more accurately the developments among companies that are changing their agendas and broadening the scope of their reports from purely environmental concerns to sustainability issues.
Each year, the winning reports from participating European national schemes may be submitted to the ESRA. The awards are open to all types of organizations, regardless of size (large or small) and sector (private or public).
Each year the judges write a report that highlights both the strengths of the winning entries and the improvements that can be made in future environmental reports. It also lists all the submissions and their contact information. The full list of participants and contact information is provided at the back of this year’s report by the judges. The number of environmental and sustainable development awards has grown dramatically over the past few years, causing problems for potential sponsors and entrants, who are often unsure of the quality and validity of the schemes. The organizers themselves also face new challenges. The RSA19 Environment Forum has established an accreditation scheme to help tackle these issues. The main aim of the scheme is to improve the design, operation and efficacy of award schemes. The Environment Forum's existing initiative, www.EnvironmentAwards.net, features an online database containing over 300 environmental and sustainable development awards. c. Investors’ criteria The financial community recognizes the importance of CSR. Financial markets are demanding an increasing amount of information on the environmental and social performance of companies. Socially responsible investment (SRI) has been on the rise for the past two years, according to 61 percent of fund managers and analysts questioned. The European SRI retail market is currently
18 www.accaglobal.com. 19 The Royal Society for the Encouragement of Arts, Manufactures & Commerce was founded in 1754 to foster the development of a principled and prosperous society.
Metrics for Sustainable Performance
17
estimated to be worth EUR 12.2 billion, while the European SRI institutional market is worth EUR 336 billion.20 According to CSR Europe, the financial community sees a clear link between non-financial risks and shareholder value. There are significant national differences in this area. Only 22 percent of fund managers/analysts in the UK and 26 percent in Sweden grant a premium to responsible companies, compared with 57 percent of Spanish and 50 percent of Dutch and Italian fund managers/analysts.21 SRI carries out its evaluations through surveys that are given to financial investors and analysts. The surveys require participants to rank companies according to four main criteria:
• Negative screening: the exclusion of certain companies or industrial sectors from investment portfolios on the basis of their inability to meet various social, ethical and environmental criteria. Examples include the armaments, nuclear power and tobacco industries.
• Positive screening: building investment portfolios consisting of companies that have been actively selected on the basis of their strong performance on social, environmental or ethical issues. Examples include environmental policy, codes, management systems and respect for human rights and working conditions.
• Engagement: the use by investors of a robust dialogue with boards or other management representatives with the aim of altering corporate behavior in relation to social, environmental and ethical issues. Examples are a lack of policy on climate change, and the pricing of medicines in developing countries.
• Shareholder activism: the exercise of shareholder powers through general protest voting at annual meetings and through the support of SRI-related shareholder resolutions. Shareholder activism can be considered one of the forms of engagement. Examples: voting against resolutions to approve a company’s report and accounts if it does not report on its environmental performance.
In Germany, sustainable investment funds managed assets worth EUR 4.5 billion in 2004 compared with only EUR 300 million in 1996.22
d. Benchmarking23 Benchmarking entails comparing companies to a point of reference. It is a process of comparing performance either internally or externally through standards and indicators. Benchmarking was initiated by the Japanese, who over 30 years ago started taking “study trips” abroad to look at how others ran their businesses. Japanese delegations visited companies and made careful observations, even taking photographs if permitted. Some say that the Japanese “copied,” but in fact they went beyond copying. They picked the best of what they saw and combined their findings to arrive at the “best of the best.” The best was searched out in all spheres. Thus, the Toyota just-in-time manufacturing system had its roots in careful observations of American supermarkets, where there was no backroom inventory and goods arrived when they were needed. But these observations had to be done correctly. Detailed process analysis, hard work, adaptation and a philosophy that always asked “why not” were key contributing factors. To a large extent, this process defines today’s benchmarking processes, i.e. smart copying based on the best of the best. The most fundamental issue of benchmarking is that it must focus on processes. Processes are a series of steps that must be taken to carry out an activity. By definition, a process can always be flowcharted, and, conversely, if something cannot be flowcharted, it is not a process. Corporate culture, for instance,
20 CSR Europe, Investing in Responsible Business, op. cit. 21 Ibid 22 C. Sywottek, “Macht’s gut”, www.brandeins.de 23 F. Székely, T. Vollman and A. Ebbinghaus, Environmental Benchmarking.
Metrics for Sustainable Performance
18
cannot be flowcharted. Moreover, the culture of another company might be highly desirable, but trying to copy it is extraordinarily difficult. A culture simply has too many facets. Similarly, a company’s competencies or abilities—such as 3M’s pollution prevention expertise, Procter & Gamble’s supply chain management, or another company’s ability to champion sustainability—are not processes. They are critical to the competitive performance of these companies, but they are not processes and cannot be copied. There are some processes that support these competencies, and it is surely interesting to examine the links between processes and competencies. But the key point is that processes can be benchmarked. Competencies are almost impossible to benchmark. Besides examining processes, benchmarking can also focus on measurements. Knowing which companies are achieving superior sustainability performance can lead to a series of detailed questions such as why they are successful. What processes support that level of performance? Who are the leaders in different industries and why? Who is achieving the best sustainability performance? Who is in the lead? The last two questions often compel companies to study the chemical and pharmaceutical industries, even if they have nothing to do with chemicals or pharmaceuticals. For years, chemical and pharmaceutical companies have been working hard on resolving environmental issues and on contributing to social needs. There has been a great deal of attention focused on the environmental and social costs of chemical and pharmaceutical manufacturing, and successful chemical and pharmaceutical companies have had a steep learning curve. At any rate, the players are less concerned with the actual results (passengers) than with processes (drivers). Benchmarking needs to focus on processes and the practice of processes. Serious benchmarking requires the inclusion of business process reengineering (BPR)—that is, a process is selected and then carefully studied. It is examined with BPR techniques, which include a detailed flowchart and process analysis to identify each step in the process, the quantity of resources consumed at each step, the amount of waste produced, the energy consumed, and the number of people involved. This analysis also identifies the steps which do (and do not) add value in terms of customer and stakeholder perceptions. Improving the sustainability performance of a company is a complex task, one that necessarily involves many people in the company. If sustainability is only considered an issue that pertains to a few individuals—or even worse, as some kind of public relations exercise—it will always be peripheral to the company’s most important concerns. This is, in fact, the sad truth in far too many companies. Breakthrough sustainability performance—performance that yields a competitive edge—requires the mobilization of resources, the commitment of virtually everyone in the company, and a good understanding of how it is possible to improve the handling of environmental issues.
e. Sustainability indexes Over the last few years, an array of sustainability stock indexes has been created to provide guidance for investors. The most widely recognized are the Dow Jones Sustainability Index (DJSI), established in 1999, and the FTSE4Good, launched in 2001. Both indexes have a European derivative. From the investor’s point of view, such indexes are easy to access and use. An investor can quickly identify best-in-class companies and thereby gain a rough estimate of non-financial risk. The main drawback of these indexes is that they rely on a self-assessment procedure.24 The Dow Jones Sustainability Index, established in 1999, was the first index to attempt to assess the ability of businesses to create long-term shareholder value by embracing opportunities and managing risks deriving from economic, environmental and social developments. It looks for the “best in class” in specific sectors. The index’s methodology appears to succeed in identifying future value potential: the DJSI has outperformed the base index over the past three years. 24 K. Plesner and A. Lerberg Jogensen, “Reporting for Duty: Managing Non-Financial Risks.”
Metrics for Sustainable Performance
19
The identification of sustainability leaders for the Dow Jones Sustainability Indexes is based on corporate sustainability assessment by SAM Research. A defined set of criteria and weightings is used to assess the opportunities and risks deriving from economic, environmental and social developments for the eligible companies. A major source of information is the SAM questionnaire, which is completed by the companies participating in the annual review. Further sources include company and third-party documents as well as personal contacts between the analysts and companies. The external verification by PricewaterhouseCoopers ensures that the corporate sustainability assessments are completed in accordance with the defined rules. Based on the corporate sustainability assessment of SAM Research, companies are ranked within their industry group and selected for the Dow Jones Sustainability Indexes if they are among the sustainability leaders in their fields. For the criteria assessment, metrics and weightings used by the Dow Jones Sustainability Index, please see Annex 3. FTSE4Good is an index for socially responsible investment designed by FTSE. It represents a series of benchmark and tradable indexes facilitating investment in companies with a good track record in corporate social responsibility. The FTSE4Good Index Series has been designed both to measure the performance of companies that meet globally recognized corporate responsibility standards and to facilitate investment in these companies. Transparent management and criteria together with the FTSE brand make FTSE4Good an index for the creation of socially responsible investment products. The FTSE4Good selection criteria are intended to reflect a broad consensus on what constitutes good corporate responsibility practice globally. The criteria originate from common themes in ten sets of declared principles. In a widespread market consultation process, the criteria are regularly revised to ensure that they continue to reflect evolving standards of responsible business practice and developments in socially responsible investment. Since the index series was launched in July 2001, both the environmental and human rights criteria have been strengthened. The FTSE4Good inclusion criteria are designed to be challenging yet achievable so that companies are encouraged to meet them.
f. External communications tools—reporting Over the past few years, the Sustainability Reporting Guidelines25 of the Global Reporting Initiative (GRI) have become the de-facto standard for sustainability reporting due to the lack of a formal global consensus on measurement and reporting practices.26 GRI employs quantitative indicators wherever possible. In situations where quantitative measures are not effective, GRI relies on qualitative measures for reporting on an organization’s activities. Raw performance data in terms of absolute figures, specified for a given period, are preferred as they provide information on the scope of impacts, values and achievements. Absolute figures are essential as a linkage to the carrying capacity of an ecosystem or as benchmarking criteria either between consecutive years or between companies operating in the same business line. Absolute figures on sustainability issues enable data users to:
• Consistently track data • Summarize various emissions to assess a total impact • Calculate additional ratios other than those reported
Relative figures or ratios can be included to provide information on the efficiency of an activity, the intensity of an impact or the quality of a value or achievement. Ratios relate two absolute figures to each other and provide a context for both. 25 Global Reporting Initiative, Sustainability Reporting Guidelines. 26 A. Gillam and M. Newson, Sustainability: Quest for the Best Devils.
Metrics for Sustainable Performance
20
Ratio indicators serve to: • relate two aspects to each other • make the relationship visible and interpretable • enable comparison of different scales of operation relative to a specific activity
In some cases, the absolute figure is the most relevant piece of information, but in other cases efficiency will be more relevant to measuring economic, environmental and social performance. Standardized data relates an absolute figure to a common factor, thus enabling comparison between the relative efficiency of two organizations in efforts to manage one aspect of economic, environmental and social performance, regardless of differences in size.
g. Accreditation processes—standards and codes Companies adopt international standards and codes and use assurance providers for a number of reasons: to meet legal compliance requirements, to build trust and credibility, to gain certification, to gain or restore stakeholder confidence, and to improve management systems through the use of standards and processes. - The use of official standards and codes One way to ensure that a company performs at a certain level is to adopt an external standard. The International Standardization Organization (ISO), which is a member agency of the Untied Nations System, has established a number of international standards in the areas of social and environmental performance (ISO 14000 series). These standards are based on the three main elements of sustainable development: the economy, the social sphere and the environment. Many companies now recognize and monitor these three parallel standards on the basis of their assessments in order to guide product, process and personnel development and to secure their position in the rapidly changing climate of environmental legislation and stakeholder expectations. AA1000 Assurance Standard AA1000 is an assurance standard that covers an organization’s disclosure and associated sustainability performance. Its goal is to secure the quality of sustainability accounting, auditing and reporting. It is continually under development by AccountAbility, an international membership-based professional institute established in London in 1996. AA1000 is used worldwide by a variety of organizations such as businesses, service providers, NGOs, public bodies and advocacy groups. SA8000 SA8000 is the first global certification system for supply chain labor standards. This voluntary standard developed by Social Accountability International (SAI) is based on ILO conventions and linked to UN norms. It is significant both as an example of a stand-alone certification solution for managing aspects of corporate responsibility and as a global certifiable standard that is delivering auditable compliance for manufacturers and purchasers in the supply chain. ISO 14001 ISO 14001 is one of the most frequently adopted standards in the area of corporate responsibility and is widely recognized as an international standard for environmental management. ISO 14001 was developed in 1996 by ISO, which is a network of national standards institutes in 148 countries with headquarters in Geneva. ISO standards are developed by technical committees made up of experts on loan from the industrial, technical and business sectors that have asked for the standards and that subsequently put them to use. An ISO social responsibility standard has been proposed. ISO expects development of the standard to take three years, with publication scheduled for early 2008.The standard will provide guiding principles
Metrics for Sustainable Performance
21
on social responsibility. “Our ambition is to develop guiding principles with global relevance that will be useful to organizations worldwide in establishing, implementing, maintaining and improving the way they address social responsibility,”27 says Catarina Munck af Rosenschöld, vice chair of the working group. This announcement has received mixed reviews. Some have welcomed ISO’s ability to provide clarity, standardization and comparability in the area and to bring about international recognition. Others, in industry and in NGO communities, fear that ISO will be overextending its expertise and legitimacy in its attempt to create a global CSR standard. There is an upward trend in the number of companies using some form of external assurance or review even though assurance is one of the biggest cost factors associated with reporting. Until the AA 1000 Assurance Standard was released in 2003, almost no external assurance statements were based on a named standard. Thus it is difficult to compare one company to the next in assurance terms.28 Assurance includes all the steps taken to increase confidence in a report. It encompasses:
Verification of reported data Quality assurance of systems and processes that generate data Effectiveness of management systems related to the issues reported Materiality of reported information Completeness of the sustainability picture on which a report is based Responsiveness of a company to stakeholder needs Stakeholders’ opinions on the appropriateness of reporting
Assurance is for:
Indoor stakeholders—managerial staff and board members, who require assurance that information is accurate and complete, since they are concerned with risk and value creation
Back-door stakeholders—investors and regulators interested in assurance that looks at risk and legal breaches
Front-door stakeholders—the media, NGOs and customers According to the 2004 Accountability Rating,29 future criteria for the assurance of sustainability reporting lie in the ability to address the role of internal assurance in achieving accountability and in broadening the scope and the completeness of assurance through the supply chain. The issue of assuror independence and competencies must also be addressed.
h. Sustainability indicators Companies have long tried to measure elements of sustainability, including various resource uses that incur economic costs and certain emissions and wastes as mandated by regulation. The challenge of developing sustainability metrics or indicators lies in organizing the information in a format that best supports decision-making in terms of sustainability.30
In 1998 John Elkingtom, chairman of SustainAbility, institutionalized the concept of the triple bottom line.31 He argued that business in the twenty-first century needs to focus on enhancing environmental quality and social equity just as it strives for profits. It must also put the same effort into this cause. Thus it must weight the three sustainability spheres equally.
27 “ISO Prepares to Launch Development of Standard on Social Responsibility,” press release, 28 January 2005. 28 SustainAbility, Risk & Opportunity. 29 AccountAbility, The Accountability Rating 2004. 30 The following overview is adapted from D. Tanzil, G. Ma and B. Beloff, “Sustainability Metrics.” 31 J. Elkington, Cannibals with Forks.
Metrics for Sustainable Performance
22
Canada’s National Round Table on the Environment and the Economy (NRTEE) conducted one of the earliest studies on the development of sustainability metrics.32 Its search for a small set of eco-efficiency indicators that is meaningful and applicable across industries became an underlying theme in later efforts to develop sustainability metrics. The study, which involved eight companies from different industrial sectors, recommended a set of “core” metrics that include material intensity, energy intensity, and dispersion of regulated toxics per unit of products or services. The study also suggested using complementary metrics, such as greenhouse gas intensity. Some of the works mentioned will now be analyzed in greater detail, together with additional concepts.
GRI sustainability ratio indicators
GRI distinguishes between three general types of ratio indicators: Productivity/efficiency ratios relate value to impact. Normally financial performance is tracked with efficiency ratios. Examples of environmental/social productivity/efficiency ratios include:
labor productivity (e.g. turnover per employee) resource productivity (e.g. sales per unit of energy consumption, GDP per unit of
material input) process eco-efficiency (e.g. production unit per unit of waste, net sales per unit of
greenhouse gas emissions in tons of CO2 equivalent) functional eco-efficiency of products or services (e.g. fuel efficiency of a plane/car)
Intensity ratios express an impact per unit of activity or unit of value. A declining intensity ratio reflects performance improvement. Often environmental performance is tracked with intensity ratios such as:
emission intensity (e.g. tons of CO2 emissions per unit of electricity generated) waste intensity (e.g. amount of waste per production volume) resource intensity (e.g. energy consumption per function, material input per service)
Percentages indicate ratios between two like issues with the same physical unit in the numerator and denominator. Examples of percentages meaningful for sustainability performance are:
input/output ratios (e.g. process yields) losses (e.g. non-product output per materials input) recycling percentages (% waste recycled per total waste) fractions (e.g. percentage of renewable energy, fraction of recycled materials, fraction
of hazardous waste) quotas (e.g. percentage of women in upper management) financial performance ratios (e.g. return on equity, return on operating assets)
Eco-efficiency Indicators Investors increasingly require companies to pursue eco-efficient strategies that reduce the impact on the environment while increasing or at least not decreasing (shareholder) value. The World Business Council for Sustainable Development (WBCSD) states that eco-efficiency is achieved by the delivery of competitively priced goods and services that satisfy human needs and bring quality of life, while progressively reducing ecological impacts and resource intensity. The WBCSD includes a clear target level for eco-efficiency with economic activities at a level at least in line with the earth’s estimated carrying capacity.33 32 NRTEE, Measuring Eco-efficiency in Business. 33 Stefan Schmidheiny, Changing Course.
Metrics for Sustainable Performance
23
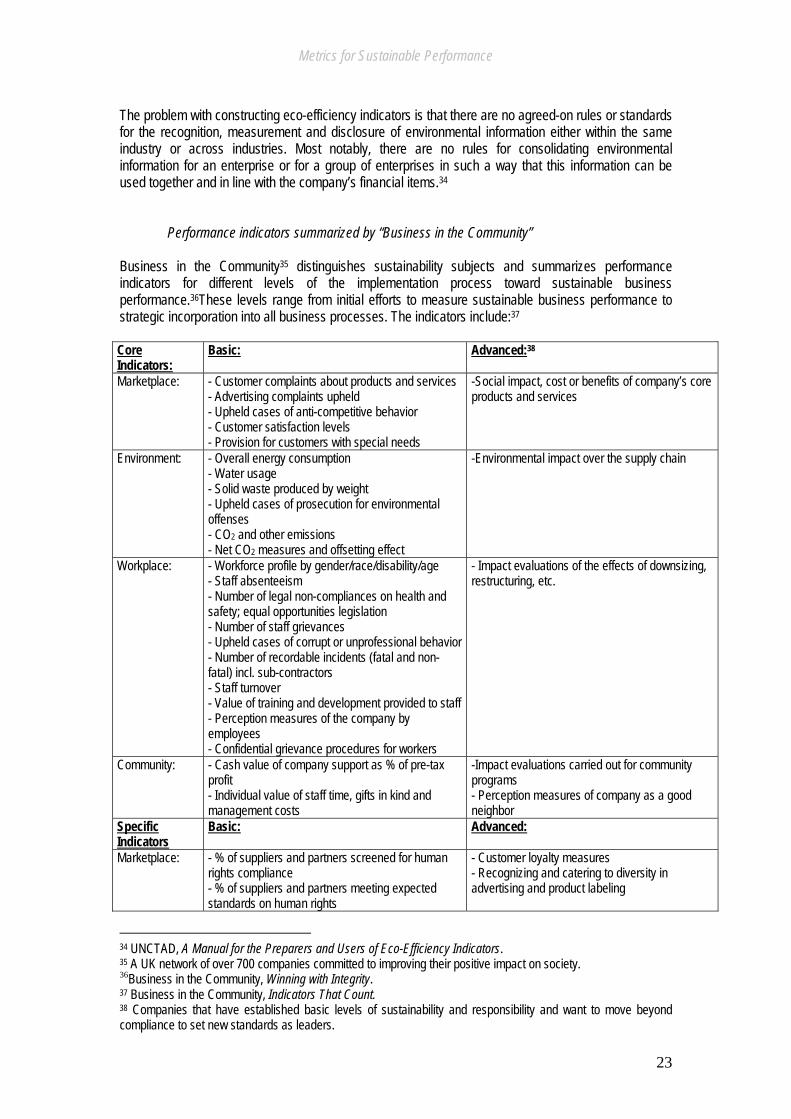
The problem with constructing eco-efficiency indicators is that there are no agreed-on rules or standards for the recognition, measurement and disclosure of environmental information either within the same industry or across industries. Most notably, there are no rules for consolidating environmental information for an enterprise or for a group of enterprises in such a way that this information can be used together and in line with the company’s financial items.34 Performance indicators summarized by “Business in the Community” Business in the Community35 distinguishes sustainability subjects and summarizes performance indicators for different levels of the implementation process toward sustainable business performance.36These levels range from initial efforts to measure sustainable business performance to strategic incorporation into all business processes. The indicators include:37 Core Indicators:
Basic: Advanced:38
Marketplace:
- Customer complaints about products and services - Advertising complaints upheld - Upheld cases of anti-competitive behavior - Customer satisfaction levels - Provision for customers with special needs
-Social impact, cost or benefits of company’s core products and services
Environment:
- Overall energy consumption - Water usage - Solid waste produced by weight - Upheld cases of prosecution for environmental offenses - CO2 and other emissions - Net CO2 measures and offsetting effect
-Environmental impact over the supply chain
Workplace:
- Workforce profile by gender/race/disability/age - Staff absenteeism - Number of legal non-compliances on health and safety; equal opportunities legislation - Number of staff grievances - Upheld cases of corrupt or unprofessional behavior - Number of recordable incidents (fatal and non-fatal) incl. sub-contractors - Staff turnover - Value of training and development provided to staff - Perception measures of the company by employees - Confidential grievance procedures for workers
- Impact evaluations of the effects of downsizing, restructuring, etc.
Community:
- Cash value of company support as % of pre-tax profit - Individual value of staff time, gifts in kind and management costs
-Impact evaluations carried out for community programs - Perception measures of company as a good neighbor
Specific Indicators
Basic: Advanced:
Marketplace: - % of suppliers and partners screened for human rights compliance - % of suppliers and partners meeting expected standards on human rights
- Customer loyalty measures - Recognizing and catering to diversity in advertising and product labeling
34 UNCTAD, A Manual for the Preparers and Users of Eco-Efficiency Indicators. 35 A UK network of over 700 companies committed to improving their positive impact on society. 36Business in the Community, Winning with Integrity. 37 Business in the Community, Indicators That Count. 38 Companies that have established basic levels of sustainability and responsibility and want to move beyond compliance to set new standards as leaders.
Metrics for Sustainable Performance
24
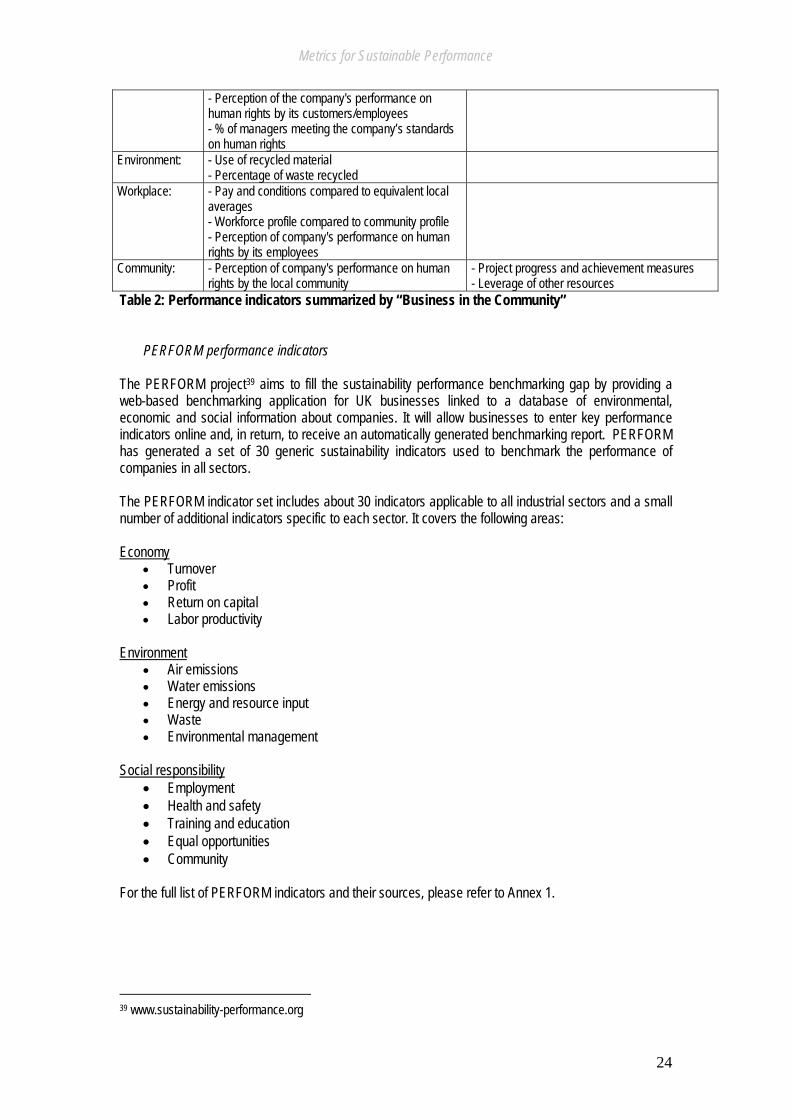
- Perception of the company's performance on human rights by its customers/employees - % of managers meeting the company’s standards on human rights
Environment:
- Use of recycled material - Percentage of waste recycled
Workplace:
- Pay and conditions compared to equivalent local averages - Workforce profile compared to community profile - Perception of company's performance on human rights by its employees
Community:
- Perception of company's performance on human rights by the local community
- Project progress and achievement measures - Leverage of other resources
Table 2: Performance indicators summarized by “Business in the Community”
PERFORM performance indicators
The PERFORM project39 aims to fill the sustainability performance benchmarking gap by providing a web-based benchmarking application for UK businesses linked to a database of environmental, economic and social information about companies. It will allow businesses to enter key performance indicators online and, in return, to receive an automatically generated benchmarking report. PERFORM has generated a set of 30 generic sustainability indicators used to benchmark the performance of companies in all sectors. The PERFORM indicator set includes about 30 indicators applicable to all industrial sectors and a small number of additional indicators specific to each sector. It covers the following areas: Economy
• Turnover • Profit • Return on capital • Labor productivity
Environment
• Air emissions • Water emissions • Energy and resource input • Waste • Environmental management
Social responsibility
• Employment • Health and safety • Training and education • Equal opportunities • Community
For the full list of PERFORM indicators and their sources, please refer to Annex 1.
39 www.sustainability-performance.org
Metrics for Sustainable Performance
25
IChemE indicators Progress in measuring sustainability performance has also been made by Britain’s Institution of Chemical Engineers (IChemE), which has expanded sustainability metrics to include subsets of economic and societal indicators.40 Though reflecting the triple bottom line approach, most of the economic and societal metrics are not reported per output basis and therefore do not constitute measurements of eco-efficiency. The reporting format recommended by IChemE includes:
• Profile with the definition of the reporting unit, its boundaries and activities • Summary of the key environmental, social and economic indicators and other important
comments and plans • Vision and strategy, including short- and long-term targets to move to greater
sustainability • Policy and organization, including management structure and stakeholder interactions
as well as value chain compliance • Performance reports on environmental, social and economic metrics, including historical
trends, targets and factors affecting performance IChemE has also extended sustainability metrics to include measures of the potential impacts of emissions, effluents and wastes. This reflects a recent trend in sustainability metrics in which toxic and pollutant dispersion are measured in terms of their potential impacts on human health and the ecosystem, rather than in terms of a simple total mass dispersed, as was common practice in most early metrics programs. IChemE uses the “environmental burden” approach. The use of these impact assessment methodologies, however, greatly increases the complexity of metrics calculation and makes automated computational tools necessary. Annex 2 presents the IChemE sustainability indicators.
i. Metrics for sustainability performance Sustainability metrics and indicators assist in assessing the progress made by a company in promoting sustainable development internally and externally in a given time period. They are usually expressed as ratios. The numerator includes impacts such as resource consumption, pollution effects and land use. The denominator contains measures of desired outputs such as production output and economic/social value added. Thus, the metrics follow a simple rule of thumb: the lesser the metric, the better the result. The metrics can be designed to be both scalable for different boundaries (e.g. around a process, a facility, or a business unit) and stackable along the supply chain. This means they can be used beyond the particular boundaries for which the calculation was performed.41 The use of sustainability metrics can help decision-makers set goals, gauge a company’s progress, benchmark, and compare alternatives (different raw materials, suppliers and improvement technologies) from a sustainability perspective. Early metrics included parameters such as megawatt hours of electricity used by a company. While such information might be useful to the company, it is not necessarily meaningful to stakeholders. In other words, stakeholders are most likely to be interested in whether the energy used in the current year is more or less than the previous year. Indicators are communication tools that simplify information in an attempt to mediate between scientific communities and decision-makers. Scientific data is often too complex and obscure for public and private decision-makers. Indicators help translate scientific information into policy-influencing tools. At the same time, they help translate public expectations into measurable components, such as targets or benchmarks.
40 Institution of Chemical Engineers, The Sustainability Metrics. 41 J. Schwarz, B. Beloff and B. Beaver, “Use Sustainability Metrics to Guide Decision-Making.”
Metrics for Sustainable Performance
26
Metrics/indicator criteria include:42
Simple Understandable Easy to reproduce Comparable Complementary to regulatory programs Cost-effective data collection Stackable and scalable Useful as a management tool Protective of company information
Economic sustainability metrics Annual corporate reports primarily fulfill the immediate needs of shareholders and financial analysts but do not directly address what is important to stakeholders in economic as opposed to purely financial terms.43 Nor do financial reports detail the wider economic role of a company as an employer at a community level. The company’s impact on local suppliers and service providers also goes unexamined. Information on a company’s wider economic impact requires quantitative measurement of operational outcomes. A key indicator of sustainability is the success of industry in creating wealth. Economic sustainability indicators include both human and financial capital considerations:44
Financial performance Indicators: net profit/earnings/income, gross margin Tangible and intangible investments: capital investments, R&D, knowledge, human capital,
reputation, brands, networks, partnerships Impacts on investors: return on capital deployed, SD investments with expected shareholder
value implications, shareholder accountability, SRI risks and opportunities Impacts on employees: remuneration, benefits, training opportunities and budgets, pay equity
ratios, redundancy provisions, personal and/or career development Impacts on governments—taxes, tax breaks, subsidies, royalties Impacts on communities—job creation, infrastructure development, technology transfer, social
capital formation
Environmental sustainability metrics It is important to identify those aspects of a business that have the greatest actual or potential impact on the environment and the organization. Large organizations with multiple facilities require consistent environmental indicators across similar operations for comparability. At the same time, facilities require flexibility to establish environmental indicators that are unique to their own operations, locations, regulations and surroundings. A substantial body of literature documents cost savings and added revenues generated through waste minimization programs. Environmental performance indicators relating to resource use and waste
42 www.bridgestos.org. 43 Vernon Jennings, “Addressing the Economic Bottom Line.” 44 www.sustainability.com.
Metrics for Sustainable Performance
27
generation can support the assessment of the cost savings and revenues realized by a company through increased process efficiency.45
Most organizations focus on lagging indicators to manage their environmental impacts; they neglect leading indicators.46 Lagging indicators reflect outcomes and are reported after an impact occurs. Leading indicators track activities that occur before an impact such as the number of audits performed and the gaps identified. They reflect the risk of an occurrence and, when used along with lagging indicators, can be very effective in risk prevention and performance improvement. Accounting for the environmental aspect of the triple bottom line poses a number of challenges, including classification of environmental costs into conventional, hidden, contingent, image and relationship costs.47 At the same time, life-cycle analysis and monetization of external environmental costs have to be taken into consideration. - Ecological footprint The ecological footprint is a tool for measuring and analyzing human natural resource consumption and waste output within the context of nature’s renewable and regenerative capacity (or biocapacity). It represents a quantitative assessment of the biologically productive area (the amount of nature) required to produce resources (food, energy and materials) and to absorb the wastes of an individual person, city, region or country. Footprints are not bad or good per se. Every living entity possesses an ecological footprint; it is the size that varies. On a global scale, humanity’s entire ecological footprint can be compared to the total available natural capital and services. When humanity’s footprint is within the annual regenerative capacities of nature, this footprint is sustainable. From a footprint perspective, sustainability requires human beings to live within the regenerative and absorptive capacity of the planet. The corollary in the biological sciences is typically referred to as a “sustainable yield.” In the Living Planet reports for 2000 and 2002, which provided footprint results for 1997 and 1999, WWF International and Redefining Progress found that, in the late 1970s, humanity’s collective ecological footprint breached the sustainability mark for the first time and has remained unsustainable ever since.48 The strength of the ecological footprint is that it:49
accounts for impacts on foreign countries and shows a community’s dependence on trade calculates how high trade dependence is raises public awareness since it is the focus of political/environmental discussions can be used as an eco-label for consumer products and services is useful for comparison between companies
The ecological footprint does not address triple bottom line sustainability as it only concentrates on environmental sustainability.
45 www.globalreporting.org. 46 www.sustainability.com. 47 M. Bennett and P. James, The Green Bottom Line. 48 Loh, Jonathan, ed., Living Planet Report 2002. 49 V. Franco, T. Williams and S. Yang, “Measuring Sustainability.”
Metrics for Sustainable Performance
28
Social sustainability metrics Efforts to measure and manage social performance strategically are still evolving, and companies are looking for meaningful and realistic ways to measure and report on social performance. Social issues that companies are covering through the use of indicators include the following areas:50
Human rights: with the rapid globalization of business, human rights performance in several countries is under scrutiny.
Labor/employment issues: standard issues such as health and safety, education, training, industrial relations, wages, benefits, conditions of work/employment, accountability, image/reputation and harassment
Supplier relationships: contractual agreements with suppliers, supplier diversity and company policies on the screening of suppliers
Community initiatives: involvement in local communities, contribution to the local economy, ensuring local wealth and skills
Corporate philanthropy: donations, pre-tax profits and grant programs
Integrated sustainability metrics Two classes of metrics/indicators are used to describe the state and performance of a system. Those that indicate the state of a system are known as content indicators and those that measure the behavior of a system as performance indicators. Naturally, researchers have attempted to measure improvements in terms of three groups of metrics corresponding to the three aspects of sustainability: ecological metrics, economic metrics and sociological metrics. These metrics measure only one aspect of the system and are therefore one-dimensional. There have been attempts to measure two-dimensional aspects as well. These two-dimensional metrics are shown in Figure 2 as belonging to the interactions of any two aspects of sustainability—eco-efficiency metrics, socio-ecological metrics and socio-economic metrics. Three-dimensional metrics can be obtained from the intersection of all three aspects, which could be called true sustainability metrics. These seven types51 can be summarized as follows:
Group 1 (one dimensional): economic, ecological and sociological indicators Group 2 (two dimensional): socio-economic, eco-efficiency and socio-ecological indicators Group 3 (three dimensional): sustainability indicators
50 www.sustainability.com. 51 S.K. Sikdar, Journey Towards Sustainable Development.
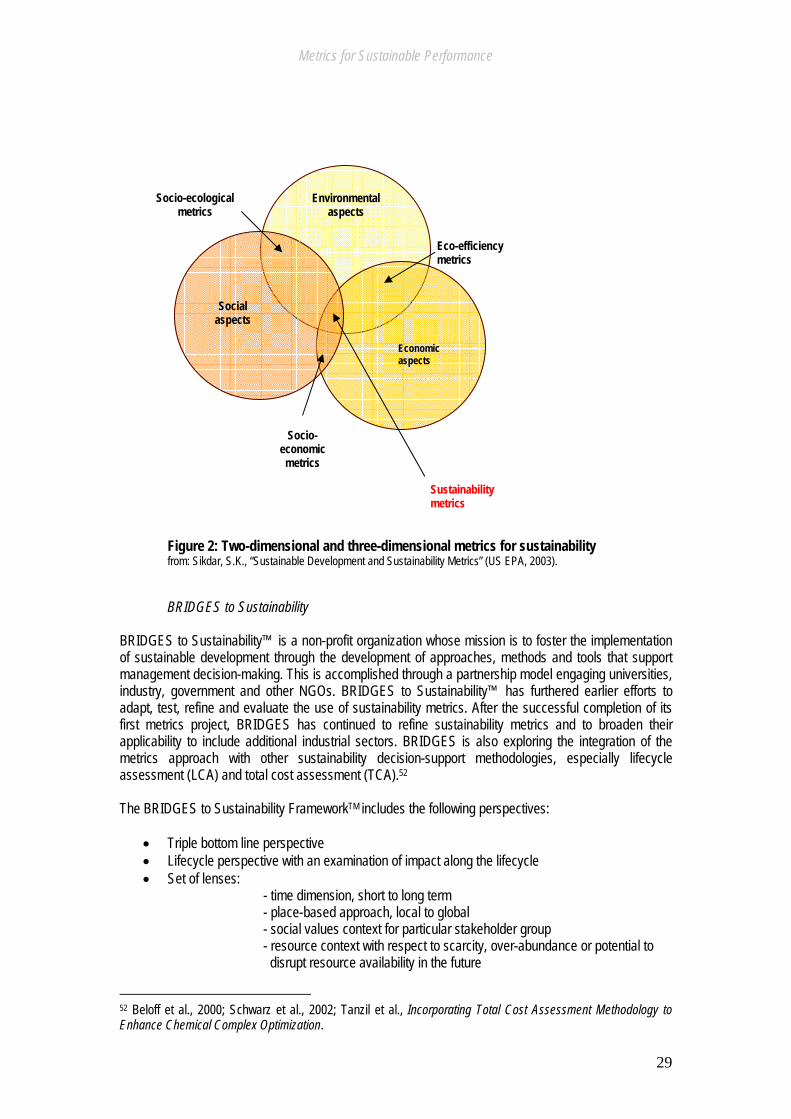
Metrics for Sustainable Performance
29
Figure 2: Two-dimensional and three-dimensional metrics for sustainability from: Sikdar, S.K., “Sustainable Development and Sustainability Metrics” (US EPA, 2003).
BRIDGES to Sustainability BRIDGES to Sustainability™ is a non-profit organization whose mission is to foster the implementation of sustainable development through the development of approaches, methods and tools that support management decision-making. This is accomplished through a partnership model engaging universities, industry, government and other NGOs. BRIDGES to Sustainability™ has furthered earlier efforts to adapt, test, refine and evaluate the use of sustainability metrics. After the successful completion of its first metrics project, BRIDGES has continued to refine sustainability metrics and to broaden their applicability to include additional industrial sectors. BRIDGES is also exploring the integration of the metrics approach with other sustainability decision-support methodologies, especially lifecycle assessment (LCA) and total cost assessment (TCA).52 The BRIDGES to Sustainability FrameworkTM includes the following perspectives:
• Triple bottom line perspective • Lifecycle perspective with an examination of impact along the lifecycle • Set of lenses:
- time dimension, short to long term - place-based approach, local to global - social values context for particular stakeholder group - resource context with respect to scarcity, over-abundance or potential to disrupt resource availability in the future
52 Beloff et al., 2000; Schwarz et al., 2002; Tanzil et al., Incorporating Total Cost Assessment Methodology to Enhance Chemical Complex Optimization.
Socio-ecological metrics
Eco-efficiency metrics
Socio-economic metrics
Sustainability metrics
Economic aspects
Environmental aspects
Social aspects
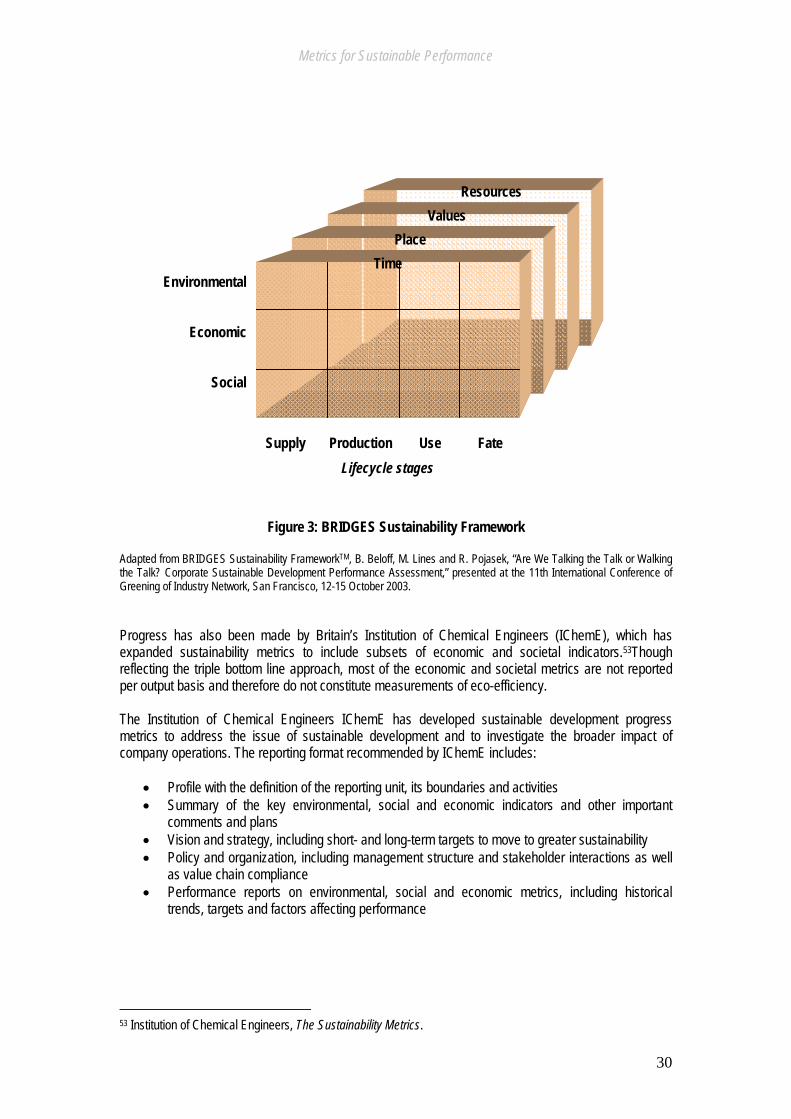
Metrics for Sustainable Performance
30
Figure 3: BRIDGES Sustainability Framework Adapted from BRIDGES Sustainability FrameworkTM, B. Beloff, M. Lines and R. Pojasek, “Are We Talking the Talk or Walking the Talk? Corporate Sustainable Development Performance Assessment,” presented at the 11th International Conference of Greening of Industry Network, San Francisco, 12-15 October 2003. Progress has also been made by Britain’s Institution of Chemical Engineers (IChemE), which has expanded sustainability metrics to include subsets of economic and societal indicators.53Though reflecting the triple bottom line approach, most of the economic and societal metrics are not reported per output basis and therefore do not constitute measurements of eco-efficiency. The Institution of Chemical Engineers IChemE has developed sustainable development progress metrics to address the issue of sustainable development and to investigate the broader impact of company operations. The reporting format recommended by IChemE includes:
• Profile with the definition of the reporting unit, its boundaries and activities • Summary of the key environmental, social and economic indicators and other important
comments and plans • Vision and strategy, including short- and long-term targets to move to greater sustainability • Policy and organization, including management structure and stakeholder interactions as well
as value chain compliance • Performance reports on environmental, social and economic metrics, including historical
trends, targets and factors affecting performance
53 Institution of Chemical Engineers, The Sustainability Metrics.
Supply Production Use Fate Lifecycle stages
Environmental
Economic
Social
Time Place
Values Resources
Metrics for Sustainable Performance
31
Most products with which the process industries are concerned will pass through many links in the chain that consists of resource extraction, transport, design, manufacture, distribution, sale, utilization, disposal, recycling and final disposal. Suppliers, customers and contractors all contribute to this chain.54
j. Non-quantifiable sustainability initiatives Despite enormous efforts to translate economic, environmental and social performance indicators into measures of financial value, many sustainability indicators are qualitative in nature and do not lend themselves well to financial valuation. The outcome of sustainability strategies and the corresponding capital outlays are uncertain and the benefits often difficult to forecast. Financial analysts are interested in information that is:55
• relevant to the business (representing a measurable change in income or revenue in a business segment)
• provided in financial measures • forward-looking (capable of providing insight into trends in business performance)
Performance indicators used in sustainability reporting often do not directly meet all of these criteria and need to be contextualized to become directly useful in financial analysis. One critical reason for linking sustainability performance indicators with conventional financial reporting is the need to provide data in both denominations and terms that are consistent with financial reporting. Wherever possible, sustainability information should be indicated in the same units of analysis that appear in a company’s financial reports—business units, segments and geographic coverage. It should always keep the context of company operations in mind and, if necessary, support quantitative data with qualitative information. Many of the social issues that are the subject of performance measurement are not easily quantifiable, such as measures of the organization’s systems, operations, policies, procedures and management practices. For instance, in the field of training measures, an indication of the number or percentage of employees that have received training does not allow for an assessment of the quality and impact of these measures. Some complex social sustainability programs such as community outreach schemes can have basic qualitative indicators such as amount spent or people reached, but this information needs to be supported by qualitative analysis.56
54 Institution of Chemical Engineers, The Sustainability Metrics. 55 www.globalreporting.org. 56 P. Davis, “The Last Word.”
Metrics for Sustainable Performance
32
IV. How German companies measure sustainable performance The following German companies have been analyzed within the context of this project:
Financial companies
1. Allianz 2. Deutsche Bank 3. Munich Re Group
Information and communications companies 4. Axel Springer 5. Deutsche Post 6. Deutsche Telekom
Energy companies 7. EON Ruhrgas 8. RWE 9. Thyssen Krupp
Transportation companies 10. BMW 11. Daimler Chrysler 12. Deutsche Lufthansa 13. Volkswagen
Manufacturing companies 14. BASF 15. Henkel 16. Robert Bosch 17. Siemens
Pharmaceutical companies 18. Beiersdorf 19. Boehringer Ingelheim Pharma KG 20. Schering
The analysis of the sustainability reports and the related websites of the sample companies reveals large discrepancies in what is measured, what methods are used, and how the companies report on sustainability performance. Ten of the twenty companies analyzed report in accordance with the GRI guidelines, but the scope and range of what is measured and reported varies.
Economic metrics: Although there is mutual agreement on economic metrics, which are derived primarily from the companies’ annual reports, no connection is made between economic performance and its implications for sustainability. Only a few of the analyzed companies indicate the equivalent monetary value of all benefits to staff and all taxes paid to tax-collecting authorities as indicators of economic impact. In dealing with the economic impact of business on employment and taxation, companies can emphasize the sustainability side of economic performance by strategically connecting economic performance and sustainability. Economic metrics are based on international reporting practices of economic performance and have the following characteristics:
• Company-wide • Collected annually and quarterly • Audited externally • Comparable internally and externally • User-friendly and meaningful • Connected to future performance targets
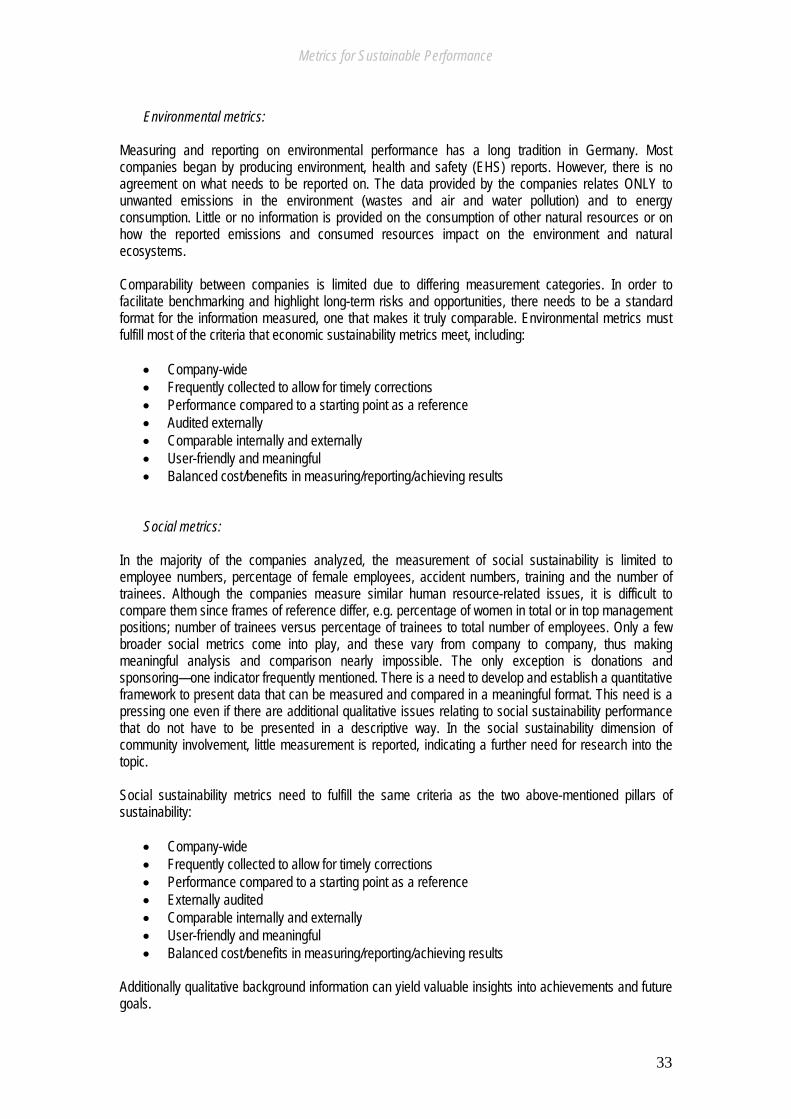
Metrics for Sustainable Performance
33
Environmental metrics:
Measuring and reporting on environmental performance has a long tradition in Germany. Most companies began by producing environment, health and safety (EHS) reports. However, there is no agreement on what needs to be reported on. The data provided by the companies relates ONLY to unwanted emissions in the environment (wastes and air and water pollution) and to energy consumption. Little or no information is provided on the consumption of other natural resources or on how the reported emissions and consumed resources impact on the environment and natural ecosystems. Comparability between companies is limited due to differing measurement categories. In order to facilitate benchmarking and highlight long-term risks and opportunities, there needs to be a standard format for the information measured, one that makes it truly comparable. Environmental metrics must fulfill most of the criteria that economic sustainability metrics meet, including:
• Company-wide • Frequently collected to allow for timely corrections • Performance compared to a starting point as a reference • Audited externally • Comparable internally and externally • User-friendly and meaningful • Balanced cost/benefits in measuring/reporting/achieving results
Social metrics:
In the majority of the companies analyzed, the measurement of social sustainability is limited to employee numbers, percentage of female employees, accident numbers, training and the number of trainees. Although the companies measure similar human resource-related issues, it is difficult to compare them since frames of reference differ, e.g. percentage of women in total or in top management positions; number of trainees versus percentage of trainees to total number of employees. Only a few broader social metrics come into play, and these vary from company to company, thus making meaningful analysis and comparison nearly impossible. The only exception is donations and sponsoring—one indicator frequently mentioned. There is a need to develop and establish a quantitative framework to present data that can be measured and compared in a meaningful format. This need is a pressing one even if there are additional qualitative issues relating to social sustainability performance that do not have to be presented in a descriptive way. In the social sustainability dimension of community involvement, little measurement is reported, indicating a further need for research into the topic. Social sustainability metrics need to fulfill the same criteria as the two above-mentioned pillars of sustainability:
• Company-wide • Frequently collected to allow for timely corrections • Performance compared to a starting point as a reference • Externally audited • Comparable internally and externally • User-friendly and meaningful • Balanced cost/benefits in measuring/reporting/achieving results
Additionally qualitative background information can yield valuable insights into achievements and future goals.
Metrics for Sustainable Performance
34
Integrated indicators:
The integration of the three dimensions of sustainability is a challenge that only one of the sample companies has begun tackling in research and coordination. A number of questions need to be answered:
• How can indicators be integrated into practice? • How can integration be measured? • How can management incentives be developed to promote sustainable performance within the
firm? • How can sustainability, risk prevention and performance be interconnected?
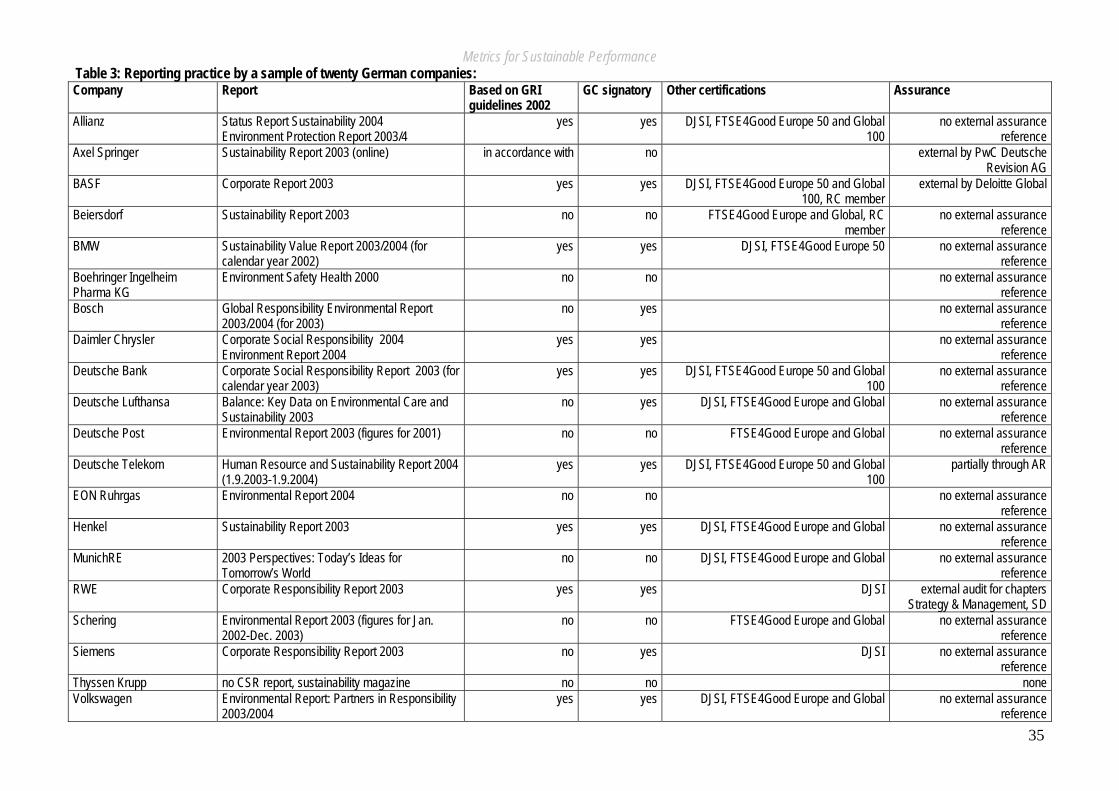
Metrics for Sustainable Performance
35
Table 3: Reporting practice by a sample of twenty German companies: Company Report Based on GRI
guidelines 2002 GC signatory Other certifications Assurance
Allianz Status Report Sustainability 2004 Environment Protection Report 2003/4
yes yes DJSI, FTSE4Good Europe 50 and Global 100
no external assurance reference
Axel Springer Sustainability Report 2003 (online) in accordance with no external by PwC Deutsche Revision AG
BASF Corporate Report 2003 yes yes DJSI, FTSE4Good Europe 50 and Global 100, RC member
external by Deloitte Global
Beiersdorf Sustainability Report 2003 no no FTSE4Good Europe and Global, RC member
no external assurance reference
BMW Sustainability Value Report 2003/2004 (for calendar year 2002)
yes yes DJSI, FTSE4Good Europe 50 no external assurance reference
Boehringer Ingelheim Pharma KG
Environment Safety Health 2000 no no no external assurance reference
Bosch Global Responsibility Environmental Report 2003/2004 (for 2003)
no yes no external assurance reference
Daimler Chrysler Corporate Social Responsibility 2004 Environment Report 2004
yes yes no external assurance reference
Deutsche Bank Corporate Social Responsibility Report 2003 (for calendar year 2003)
yes yes DJSI, FTSE4Good Europe 50 and Global 100
no external assurance reference
Deutsche Lufthansa Balance: Key Data on Environmental Care and Sustainability 2003
no yes DJSI, FTSE4Good Europe and Global no external assurance reference
Deutsche Post Environmental Report 2003 (figures for 2001) no no FTSE4Good Europe and Global no external assurance reference
Deutsche Telekom Human Resource and Sustainability Report 2004 (1.9.2003-1.9.2004)
yes yes DJSI, FTSE4Good Europe 50 and Global 100
partially through AR
EON Ruhrgas Environmental Report 2004 no no no external assurance reference
Henkel Sustainability Report 2003 yes yes DJSI, FTSE4Good Europe and Global no external assurance reference
MunichRE 2003 Perspectives: Today’s Ideas for Tomorrow’s World
no no DJSI, FTSE4Good Europe and Global no external assurance reference
RWE Corporate Responsibility Report 2003 yes yes DJSI external audit for chapters Strategy & Management, SD
Schering Environmental Report 2003 (figures for Jan. 2002-Dec. 2003)
no no FTSE4Good Europe and Global no external assurance reference
Siemens Corporate Responsibility Report 2003 no yes DJSI no external assurance reference
Thyssen Krupp no CSR report, sustainability magazine no no none Volkswagen Environmental Report: Partners in Responsibility
2003/2004 yes yes DJSI, FTSE4Good Europe and Global no external assurance
reference
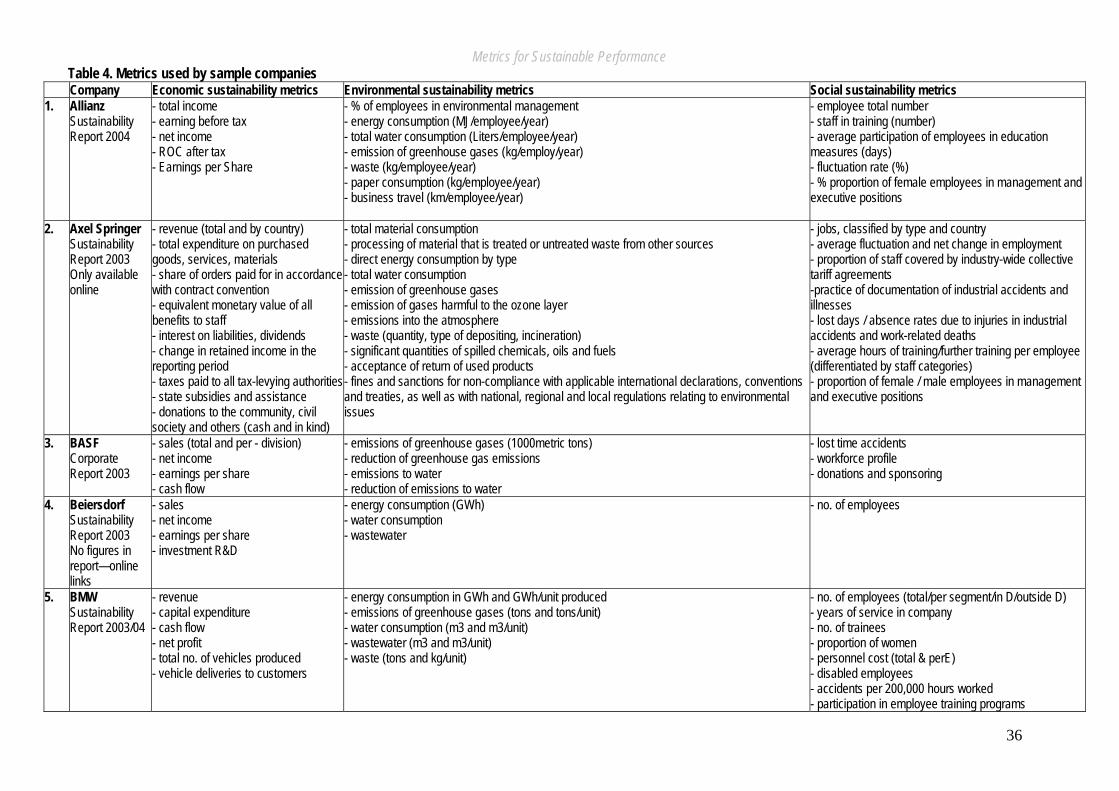
Metrics for Sustainable Performance
36
Table 4. Metrics used by sample companies Company Economic sustainability metrics Environmental sustainability metrics Social sustainability metrics 1. Allianz
Sustainability Report 2004
- total income - earning before tax - net income - ROC after tax - Earnings per Share
- % of employees in environmental management - energy consumption (MJ/employee/year) - total water consumption (Liters/employee/year) - emission of greenhouse gases (kg/employ/year) - waste (kg/employee/year) - paper consumption (kg/employee/year) - business travel (km/employee/year)
- employee total number - staff in training (number) - average participation of employees in education measures (days) - fluctuation rate (%) - % proportion of female employees in management and executive positions
2. Axel Springer Sustainability Report 2003 Only available online
- revenue (total and by country) - total expenditure on purchased goods, services, materials - share of orders paid for in accordance with contract convention - equivalent monetary value of all benefits to staff - interest on liabilities, dividends - change in retained income in the reporting period - taxes paid to all tax-levying authorities- state subsidies and assistance - donations to the community, civil society and others (cash and in kind)
- total material consumption - processing of material that is treated or untreated waste from other sources - direct energy consumption by type - total water consumption - emission of greenhouse gases - emission of gases harmful to the ozone layer - emissions into the atmosphere - waste (quantity, type of depositing, incineration) - significant quantities of spilled chemicals, oils and fuels - acceptance of return of used products - fines and sanctions for non-compliance with applicable international declarations, conventions and treaties, as well as with national, regional and local regulations relating to environmental issues
- jobs, classified by type and country - average fluctuation and net change in employment - proportion of staff covered by industry-wide collective tariff agreements -practice of documentation of industrial accidents and illnesses - lost days / absence rates due to injuries in industrial accidents and work-related deaths - average hours of training/further training per employee (differentiated by staff categories) - proportion of female / male employees in management and executive positions
3. BASF Corporate Report 2003
- sales (total and per - division) - net income - earnings per share - cash flow
- emissions of greenhouse gases (1000metric tons) - reduction of greenhouse gas emissions - emissions to water - reduction of emissions to water
- lost time accidents - workforce profile - donations and sponsoring
4. Beiersdorf Sustainability Report 2003 No figures in report—online links
- sales - net income - earnings per share - investment R&D
- energy consumption (GWh) - water consumption - wastewater
- no. of employees
5. BMW Sustainability Report 2003/04
- revenue - capital expenditure - cash flow - net profit - total no. of vehicles produced - vehicle deliveries to customers
- energy consumption in GWh and GWh/unit produced - emissions of greenhouse gases (tons and tons/unit) - water consumption (m3 and m3/unit) - wastewater (m3 and m3/unit) - waste (tons and kg/unit)
- no. of employees (total/per segment/in D/outside D) - years of service in company - no. of trainees - proportion of women - personnel cost (total & perE) - disabled employees - accidents per 200,000 hours worked - participation in employee training programs
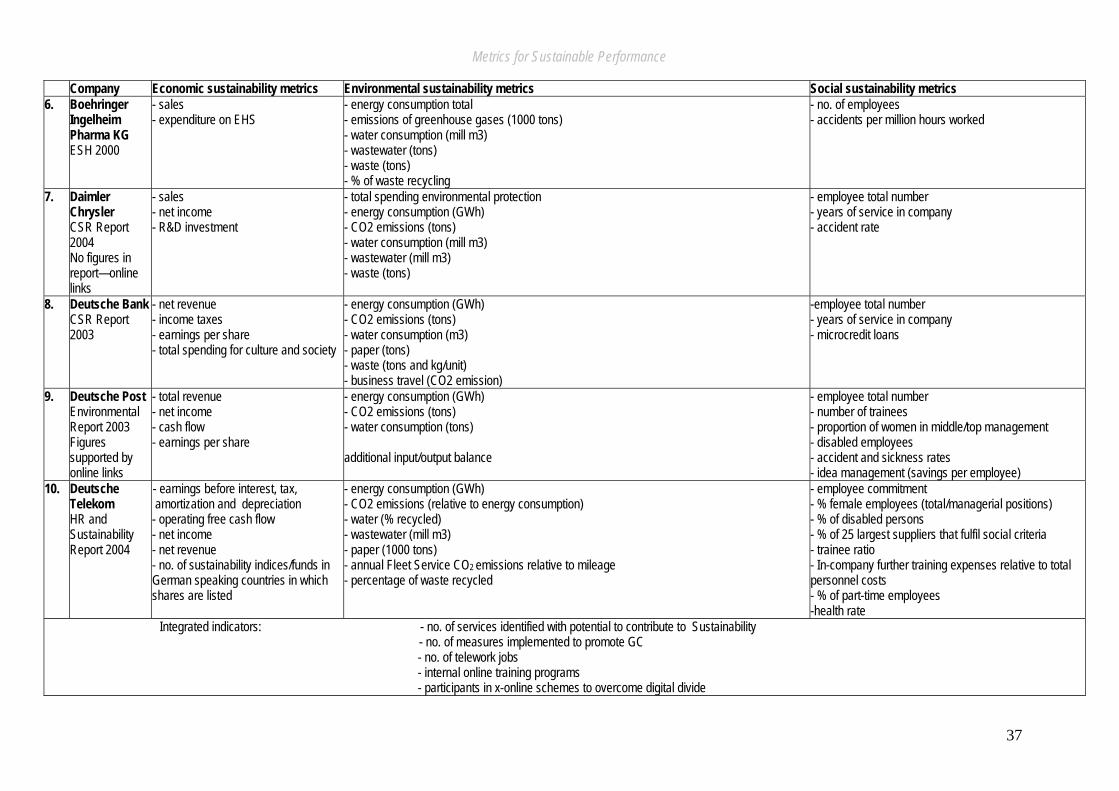
Metrics for Sustainable Performance
37
Company Economic sustainability metrics Environmental sustainability metrics Social sustainability metrics 6. Boehringer
Ingelheim Pharma KG ESH 2000
- sales - expenditure on EHS
- energy consumption total - emissions of greenhouse gases (1000 tons) - water consumption (mill m3) - wastewater (tons) - waste (tons) - % of waste recycling
- no. of employees - accidents per million hours worked
7. Daimler Chrysler CSR Report 2004 No figures in report—online links
- sales - net income - R&D investment
- total spending environmental protection - energy consumption (GWh) - CO2 emissions (tons) - water consumption (mill m3) - wastewater (mill m3) - waste (tons)
- employee total number - years of service in company - accident rate
8. Deutsche Bank CSR Report 2003
- net revenue - income taxes - earnings per share - total spending for culture and society
- energy consumption (GWh) - CO2 emissions (tons) - water consumption (m3) - paper (tons) - waste (tons and kg/unit) - business travel (CO2 emission)
-employee total number - years of service in company - microcredit loans
9. Deutsche Post Environmental Report 2003 Figures supported by online links
- total revenue - net income - cash flow - earnings per share
- energy consumption (GWh) - CO2 emissions (tons) - water consumption (tons) additional input/output balance
- employee total number - number of trainees - proportion of women in middle/top management - disabled employees - accident and sickness rates - idea management (savings per employee)
10. Deutsche Telekom HR and Sustainability Report 2004
e- earnings before interest, tax, amortization and depreciation - operating free cash flow - net income - net revenue - no. of sustainability indices/funds in German speaking countries in which shares are listed
- energy consumption (GWh) - CO2 emissions (relative to energy consumption) - water (% recycled) - wastewater (mill m3) - paper (1000 tons) - annual Fleet Service CO2 emissions relative to mileage - percentage of waste recycled
- employee commitment - % female employees (total/managerial positions) - % of disabled persons - % of 25 largest suppliers that fulfil social criteria - trainee ratio - In-company further training expenses relative to total personnel costs - % of part-time employees -health rate
Integrated indicators: - no. of services identified with potential to contribute to Sustainability - no. of measures implemented to promote GC - no. of telework jobs - internal online training programs - participants in x-online schemes to overcome digital divide
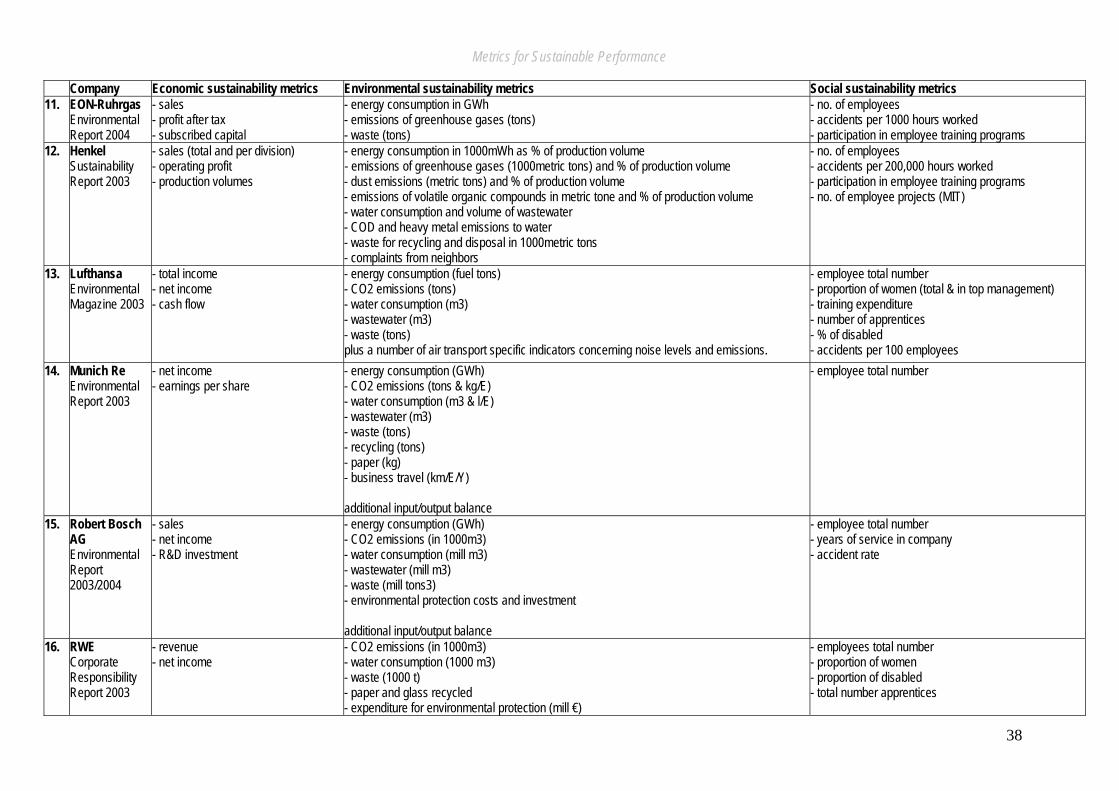
Metrics for Sustainable Performance
38
Company Economic sustainability metrics Environmental sustainability metrics Social sustainability metrics 11. EON-Ruhrgas
Environmental Report 2004
- sales - profit after tax - subscribed capital
- energy consumption in GWh - emissions of greenhouse gases (tons) - waste (tons)
- no. of employees - accidents per 1000 hours worked - participation in employee training programs
12. Henkel Sustainability Report 2003
- sales (total and per division) - operating profit - production volumes
- energy consumption in 1000mWh as % of production volume - emissions of greenhouse gases (1000metric tons) and % of production volume - dust emissions (metric tons) and % of production volume - emissions of volatile organic compounds in metric tone and % of production volume - water consumption and volume of wastewater - COD and heavy metal emissions to water - waste for recycling and disposal in 1000metric tons - complaints from neighbors
- no. of employees - accidents per 200,000 hours worked - participation in employee training programs - no. of employee projects (MIT)
13. Lufthansa Environmental Magazine 2003
- total income - net income - cash flow
- energy consumption (fuel tons) - CO2 emissions (tons) - water consumption (m3) - wastewater (m3) - waste (tons) plus a number of air transport specific indicators concerning noise levels and emissions.
- employee total number - proportion of women (total & in top management) - training expenditure - number of apprentices - % of disabled - accidents per 100 employees
14. Munich Re Environmental Report 2003
- net income - earnings per share
- energy consumption (GWh) - CO2 emissions (tons & kg/E) - water consumption (m3 & l/E) - wastewater (m3) - waste (tons) - recycling (tons) - paper (kg) - business travel (km/E/Y) additional input/output balance
- employee total number
15. Robert Bosch AG Environmental Report 2003/2004
- sales - net income - R&D investment
- energy consumption (GWh) - CO2 emissions (in 1000m3) - water consumption (mill m3) - wastewater (mill m3) - waste (mill tons3) - environmental protection costs and investment additional input/output balance
- employee total number - years of service in company - accident rate
16. RWE Corporate Responsibility Report 2003
- revenue - net income
- CO2 emissions (in 1000m3) - water consumption (1000 m3) - waste (1000 t) - paper and glass recycled - expenditure for environmental protection (mill €)
- employees total number - proportion of women - proportion of disabled - total number apprentices
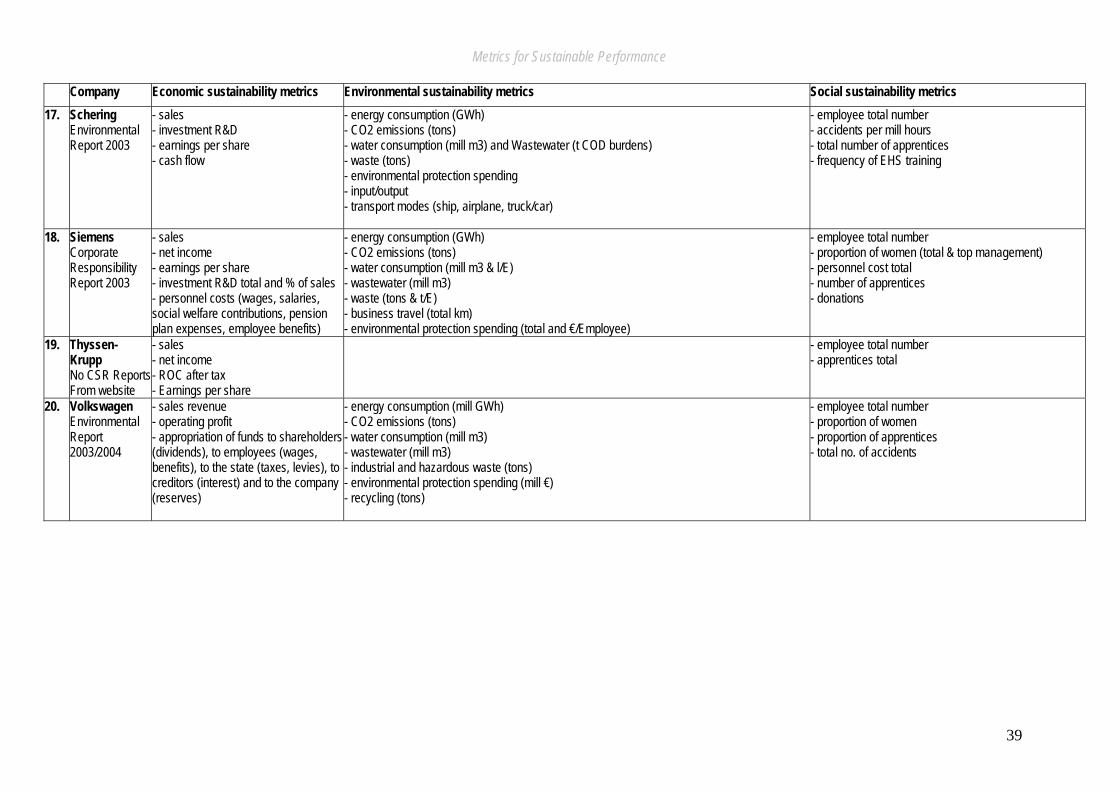
Metrics for Sustainable Performance
39
Company Economic sustainability metrics Environmental sustainability metrics Social sustainability metrics 17. Schering
Environmental Report 2003
- sales - investment R&D - earnings per share - cash flow
- energy consumption (GWh) - CO2 emissions (tons) - water consumption (mill m3) and Wastewater (t COD burdens) - waste (tons) - environmental protection spending - input/output - transport modes (ship, airplane, truck/car)
- employee total number - accidents per mill hours - total number of apprentices - frequency of EHS training
18. Siemens Corporate Responsibility Report 2003
- sales - net income - earnings per share - investment R&D total and % of sales - personnel costs (wages, salaries, social welfare contributions, pension plan expenses, employee benefits)
- energy consumption (GWh) - CO2 emissions (tons) - water consumption (mill m3 & l/E) - wastewater (mill m3) - waste (tons & t/E) - business travel (total km) - environmental protection spending (total and €/Employee)
- employee total number - proportion of women (total & top management) - personnel cost total - number of apprentices - donations
19. Thyssen- Krupp No CSR ReportsFrom website
- sales - net income - ROC after tax - Earnings per share
- employee total number - apprentices total
20. Volkswagen Environmental Report 2003/2004
- sales revenue - operating profit - appropriation of funds to shareholders (dividends), to employees (wages, benefits), to the state (taxes, levies), to creditors (interest) and to the company (reserves)
- energy consumption (mill GWh) - CO2 emissions (tons) - water consumption (mill m3) - wastewater (mill m3) - industrial and hazardous waste (tons) - environmental protection spending (mill €) - recycling (tons)
- employee total number - proportion of women - proportion of apprentices - total no. of accidents
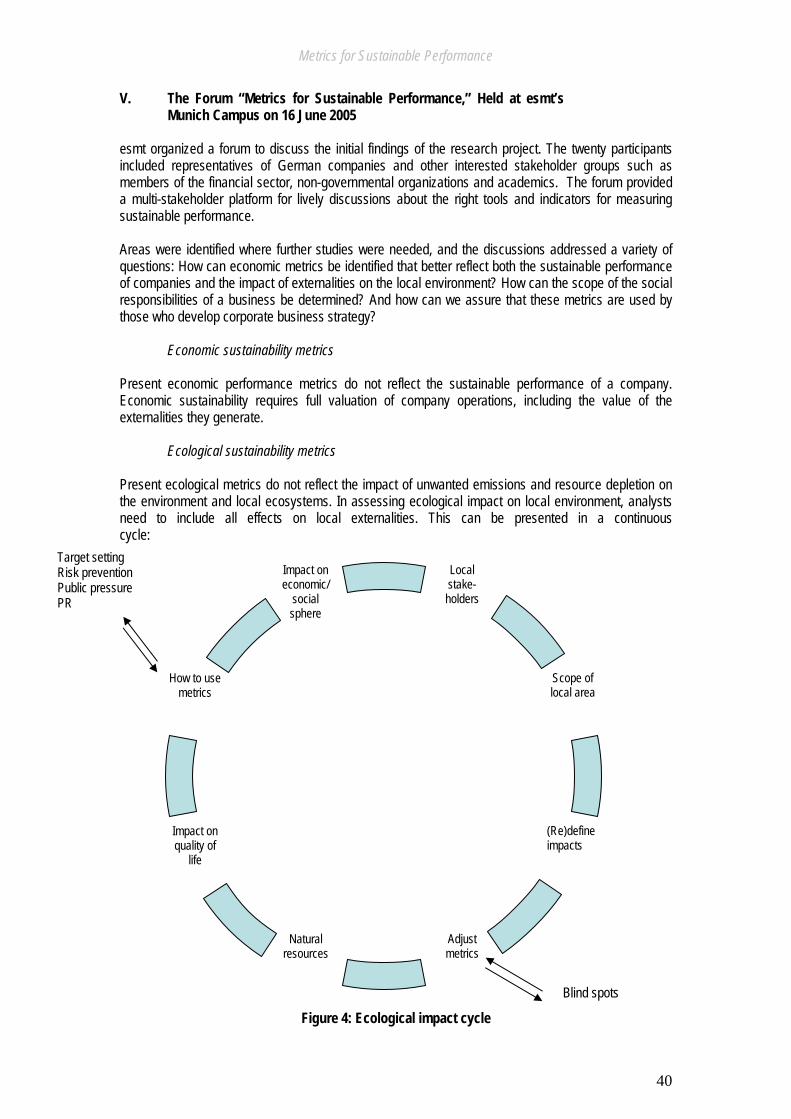
Metrics for Sustainable Performance
40
V. The Forum “Metrics for Sustainable Performance,” Held at esmt’s Munich Campus on 16 June 2005
esmt organized a forum to discuss the initial findings of the research project. The twenty participants included representatives of German companies and other interested stakeholder groups such as members of the financial sector, non-governmental organizations and academics. The forum provided a multi-stakeholder platform for lively discussions about the right tools and indicators for measuring sustainable performance. Areas were identified where further studies were needed, and the discussions addressed a variety of questions: How can economic metrics be identified that better reflect both the sustainable performance of companies and the impact of externalities on the local environment? How can the scope of the social responsibilities of a business be determined? And how can we assure that these metrics are used by those who develop corporate business strategy?
Economic sustainability metrics Present economic performance metrics do not reflect the sustainable performance of a company. Economic sustainability requires full valuation of company operations, including the value of the externalities they generate.
Ecological sustainability metrics Present ecological metrics do not reflect the impact of unwanted emissions and resource depletion on the environment and local ecosystems. In assessing ecological impact on local environment, analysts need to include all effects on local externalities. This can be presented in a continuous cycle:
Figure 4: Ecological impact cycle
Local stake-holders
Scope of local area
(Re)define impacts
Adjust metrics
Natural resources
Impact on quality of
life
How to use metrics
Impact on economic/
social sphere
Blind spots
Target setting Risk prevention Public pressure PR
Metrics for Sustainable Performance
41
Social sustainability metrics
Most social metrics used by German companies do not reflect the contribution that these companies make to building a sustainable society. It is crucial to identify adequate social sustainability metrics for a company and to determine carefully the scope of the company’s responsibility. This can be done through frequent and continuous consultations with the various stakeholders to identify which areas affect the company most. Employees and their families are affected by income, health and social security issues. Additional metrics that influence this group include fair conditions and human rights along the entire production chain as well as fair pricing and product safety. Consumers are mainly worried about added value, product safety and fair pricing of products, but they increasingly demand things such as eco-efficiency, transparency, fair trade, fair conditions and human rights along the supply chain. Shareholders focus on transparency and return on investment, depending on either their long- or short-term orientation. Suppliers require fair prices and conditions. The human and labor rights issues along the entire production chain must also be taken into account. Society at large wants the company to contribute to the quality of life and reinvest in the communities where they are located. It is also interested in corporate citizenship. Companies must identify their own scope of social responsibilities to meet the different needs of these different, non-exclusive stakeholder groups.
How can sustainability metrics be incorporated into business strategy? The forum identified different approaches to implementing and transferring sustainability strategies to operational business such as use of a “balanced scorecard” and the setting of targets that contribute to sustainability strategy. Unfortunately, the balanced scorecard is not widely accepted as a tool by top management as no added value is seen. Especially in the complex field of environmental metrics, a broader dialog with stakeholders can contribute to incorporating external expertise and enabling better assessment of the externalities of a company’s operations. The need for boardroom commitment was repeatedly stressed. It will depend on the push and pull factors crucial for companies. Push factors include laws, regulations, shareholder interests, NGO and civil society interests as well as negative market forces. Pull factors include business opportunities, brand image, recognition, positive market influences and internal employee pressure. What is crucial for boardroom commitment is the identification of tangible benefits or pressures such as a critical mass of competitors committed to sustainability, auditing processes that require sustainability metrics, and inexpensive, easily accessible collection methods for these metrics.
Metrics for Sustainable Performance
42
VI. Conclusions
The analysis of the sustainability reports and the related websites of the sample companies reveal large discrepancies in what is measured, what methods are used, and how the companies report on sustainability performance. Ten of the twenty companies analyzed report in accordance with the GRI guidelines, but the scope and range of what is measured and reported varies.
Conclusions on metrics for economic performance Although there is mutual agreement on economic metrics, which are derived primarily from the companies’ annual reports, no connection is made between economic performance and its implications for sustainability. Only a few of the companies indicate the equivalent monetary value of all benefits to staff and taxes paid to tax-collecting authorities as indicators of economic impact. In dealing with the economic impact of business on employment and taxation, companies attach importance to the sustainability side of economic performance that strategically connects economic performance and sustainability. The characteristics of economic metrics are based on international economic performance reporting practice and have been assimilated and accepted:
Company-wide Collected annually and quarterly Audited externally Comparable internally and externally User-friendly and meaningful Connected to future performance targets
Conclusions on environmental metrics - Environmental metrics refer mainly to emissions and not to the impact on the environment and natural ecosystems. - Most organizations focus on lagging indicators to manage their environmental impacts and neglect leading indicators. Lagging indicators reflect outcomes and are reported after an impact occurs. Leading indicators track activities that occur before an impact such as the number of audits performed or the gaps identified. They reflect the risk of an occurrence and, when used along with lagging indicators, can be very effective in risk prevention and performance improvement. - Little historical data is provided. - There is rarely meaningful information for lay people. Environmental metrics need to fulfill most of the same criteria as economic sustainability metrics, such as:
Company-wide Frequently collected to allow for timely corrections Performance compared to a starting point as reference Audited externally Comparable internally and externally User-friendly and meaningful Balanced cost/benefits in measuring/reporting/achieving results
Metrics for Sustainable Performance
43
Conclusions on social metrics
In the majority of the companies analyzed, the measurement of social sustainability is limited to employee numbers, percentage of female employees, accident numbers, training and trainee numbers. Although the companies measure similar human resource-related issues, it is difficult to compare them since frames of reference differ, e.g. percentage of women in total or in top management positions; number of trainees versus percentage of trainees to total number of employees. Social sustainability metrics need to fulfill the same criteria as the two above-mentioned pillars of sustainability:
Company-wide Collected frequently to allow for timely corrections Performance compared to a starting point as reference Audited externally Comparable internally and externally User-friendly and meaningful
Integrating the metrics
The integration of the three dimensions of sustainability is a challenge that only one of the sample companies has begun tackling in research and coordination. A number of questions need to be considered:
How can indicators be integrated into practice? How can integration be measured? How can incentives be developed to promote the integration of metrics?
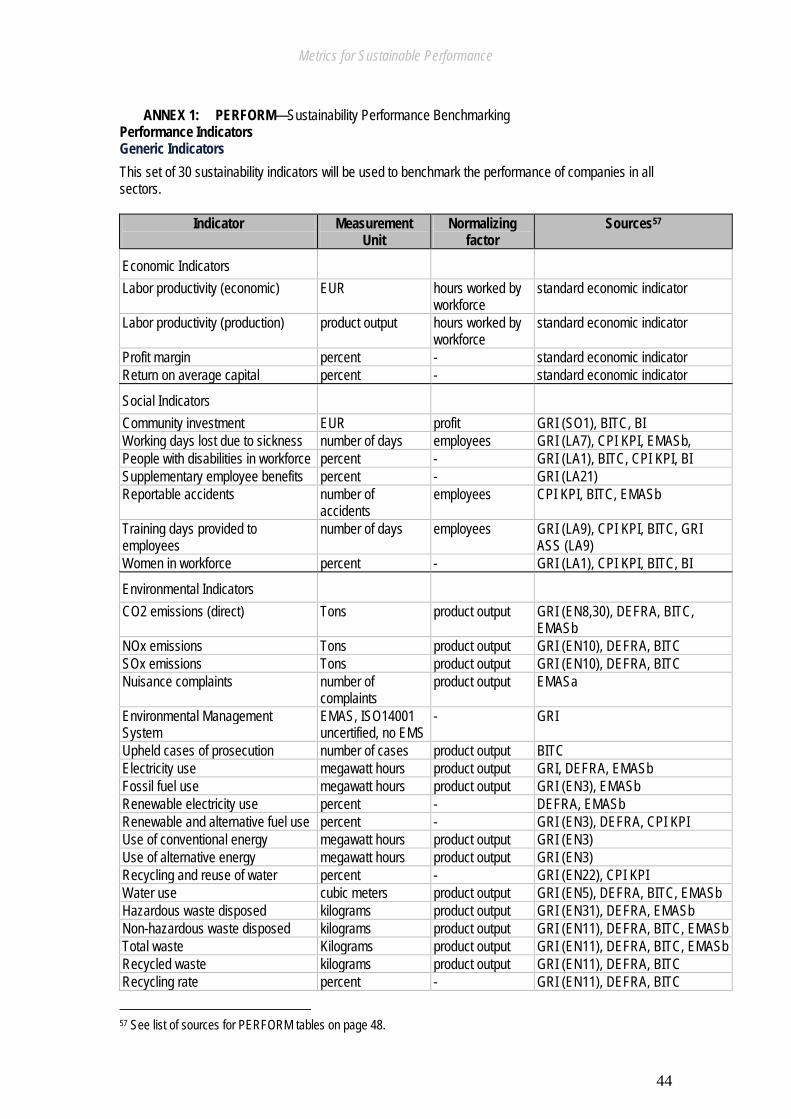
Metrics for Sustainable Performance
44
ANNEX 1: PERFORM—Sustainability Performance Benchmarking
Performance Indicators Generic Indicators This set of 30 sustainability indicators will be used to benchmark the performance of companies in all sectors.
Indicator
Measurement Unit
Normalizing factor
Sources57
Economic Indicators Labor productivity (economic) EUR hours worked by
workforce standard economic indicator
Labor productivity (production) product output hours worked by workforce
standard economic indicator
Profit margin percent - standard economic indicator Return on average capital percent - standard economic indicator
Social Indicators Community investment EUR profit GRI (SO1), BITC, BI Working days lost due to sickness number of days employees GRI (LA7), CPI KPI, EMASb, People with disabilities in workforce percent - GRI (LA1), BITC, CPI KPI, BI Supplementary employee benefits percent - GRI (LA21) Reportable accidents number of
accidents employees CPI KPI, BITC, EMASb
Training days provided to employees
number of days employees GRI (LA9), CPI KPI, BITC, GRI ASS (LA9)
Women in workforce percent - GRI (LA1), CPI KPI, BITC, BI
Environmental Indicators CO2 emissions (direct) Tons product output GRI (EN8,30), DEFRA, BITC,
EMASb NOx emissions Tons product output GRI (EN10), DEFRA, BITC SOx emissions Tons product output GRI (EN10), DEFRA, BITC Nuisance complaints number of
complaints product output EMASa
Environmental Management System
EMAS, ISO14001 uncertified, no EMS
- GRI
Upheld cases of prosecution number of cases product output BITC Electricity use megawatt hours product output GRI, DEFRA, EMASb Fossil fuel use megawatt hours product output GRI (EN3), EMASb Renewable electricity use percent - DEFRA, EMASb Renewable and alternative fuel use percent - GRI (EN3), DEFRA, CPI KPI Use of conventional energy megawatt hours product output GRI (EN3) Use of alternative energy megawatt hours product output GRI (EN3) Recycling and reuse of water percent - GRI (EN22), CPI KPI Water use cubic meters product output GRI (EN5), DEFRA, BITC, EMASb Hazardous waste disposed kilograms product output GRI (EN31), DEFRA, EMASb Non-hazardous waste disposed kilograms product output GRI (EN11), DEFRA, BITC, EMASb Total waste Kilograms product output GRI (EN11), DEFRA, BITC, EMASb Recycled waste kilograms product output GRI (EN11), DEFRA, BITC Recycling rate percent - GRI (EN11), DEFRA, BITC
57 See list of sources for PERFORM tables on page 48.
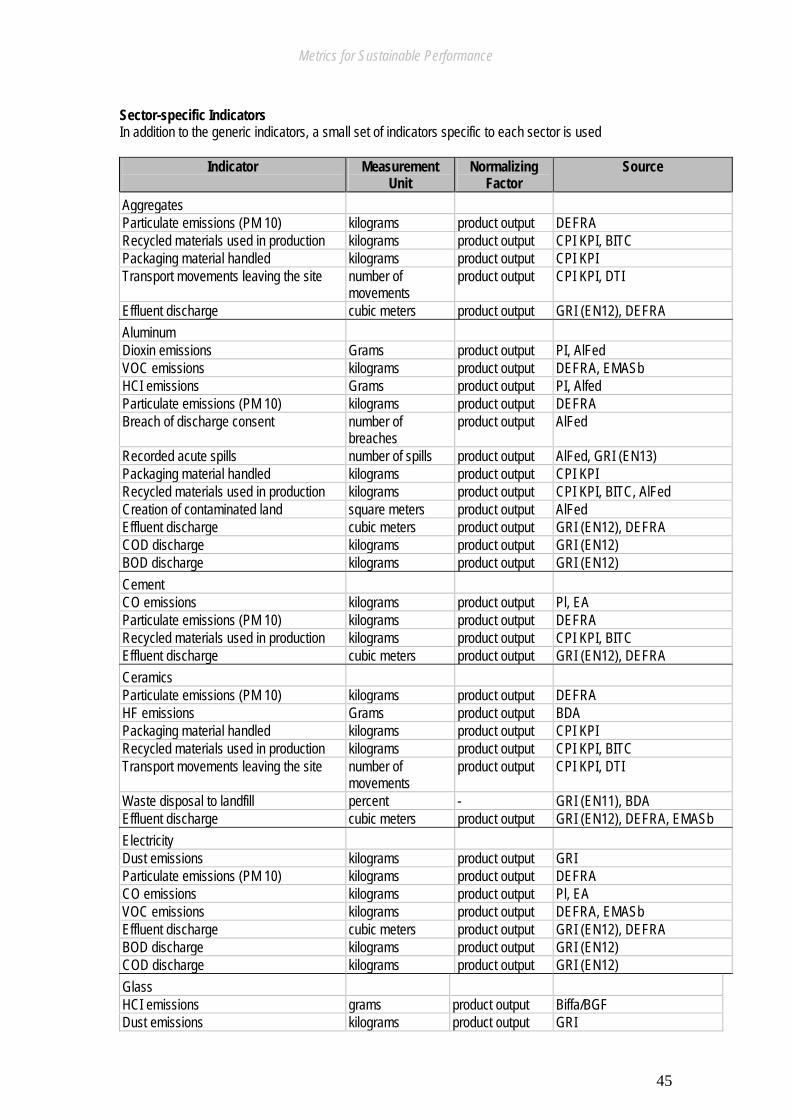
Metrics for Sustainable Performance
45
Sector-specific Indicators In addition to the generic indicators, a small set of indicators specific to each sector is used
Indicator
Measurement Unit
Normalizing Factor
Source
Aggregates Particulate emissions (PM 10) kilograms product output DEFRA Recycled materials used in production kilograms product output CPI KPI, BITC Packaging material handled kilograms product output CPI KPI Transport movements leaving the site number of
movements product output CPI KPI, DTI
Effluent discharge cubic meters product output GRI (EN12), DEFRA Aluminum Dioxin emissions Grams product output PI, AlFed VOC emissions kilograms product output DEFRA, EMASb HCI emissions Grams product output PI, Alfed Particulate emissions (PM 10) kilograms product output DEFRA Breach of discharge consent number of
breaches product output AlFed
Recorded acute spills number of spills product output AlFed, GRI (EN13) Packaging material handled kilograms product output CPI KPI Recycled materials used in production kilograms product output CPI KPI, BITC, AlFed Creation of contaminated land square meters product output AlFed Effluent discharge cubic meters product output GRI (EN12), DEFRA COD discharge kilograms product output GRI (EN12) BOD discharge kilograms product output GRI (EN12) Cement CO emissions kilograms product output Pl, EA Particulate emissions (PM 10) kilograms product output DEFRA Recycled materials used in production kilograms product output CPI KPI, BITC Effluent discharge cubic meters product output GRI (EN12), DEFRA Ceramics Particulate emissions (PM 10) kilograms product output DEFRA HF emissions Grams product output BDA Packaging material handled kilograms product output CPI KPI Recycled materials used in production kilograms product output CPI KPI, BITC Transport movements leaving the site number of
movements product output CPI KPI, DTI
Waste disposal to landfill percent - GRI (EN11), BDA Effluent discharge cubic meters product output GRI (EN12), DEFRA, EMASb Electricity Dust emissions kilograms product output GRI Particulate emissions (PM 10) kilograms product output DEFRA CO emissions kilograms product output Pl, EA VOC emissions kilograms product output DEFRA, EMASb Effluent discharge cubic meters product output GRI (EN12), DEFRA BOD discharge kilograms product output GRI (EN12) COD discharge kilograms product output GRI (EN12) Glass HCI emissions grams product output Biffa/BGF Dust emissions kilograms product output GRI
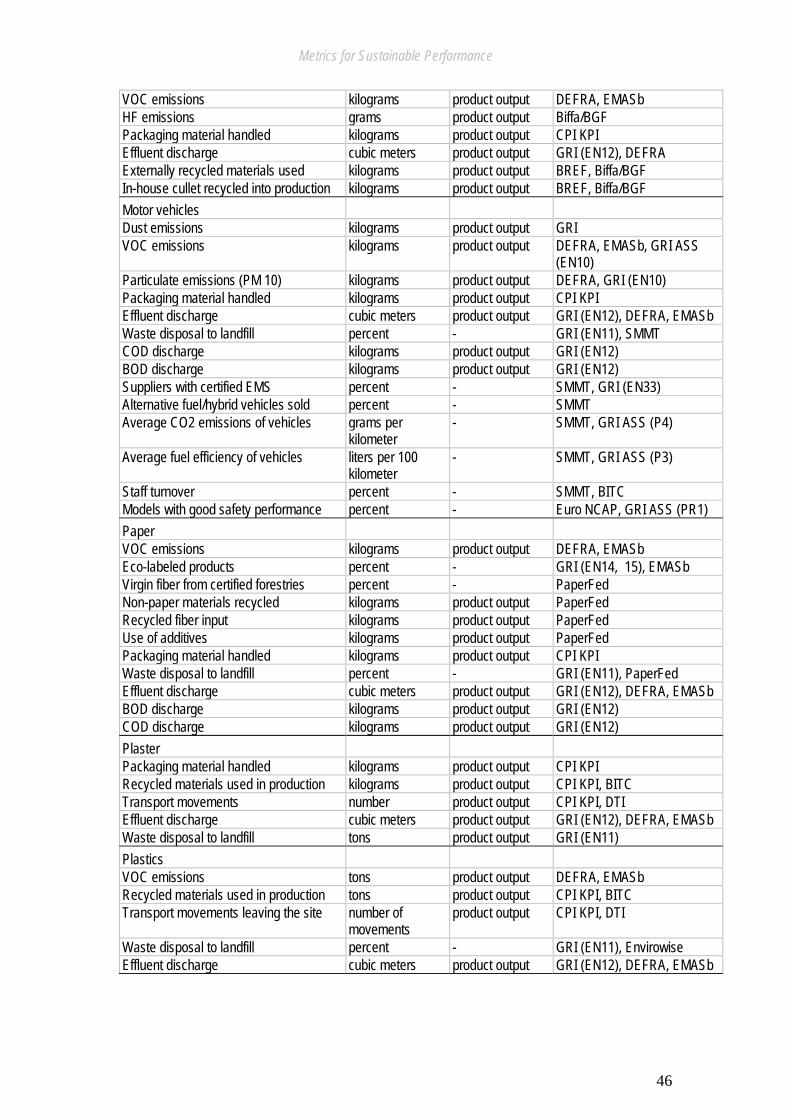
Metrics for Sustainable Performance
46
VOC emissions kilograms product output DEFRA, EMASb HF emissions grams product output Biffa/BGF Packaging material handled kilograms product output CPI KPI Effluent discharge cubic meters product output GRI (EN12), DEFRA Externally recycled materials used kilograms product output BREF, Biffa/BGF In-house cullet recycled into production kilograms product output BREF, Biffa/BGF Motor vehicles Dust emissions kilograms product output GRI VOC emissions kilograms product output DEFRA, EMASb, GRI ASS
(EN10) Particulate emissions (PM 10) kilograms product output DEFRA, GRI (EN10) Packaging material handled kilograms product output CPI KPI Effluent discharge cubic meters product output GRI (EN12), DEFRA, EMASb Waste disposal to landfill percent - GRI (EN11), SMMT COD discharge kilograms product output GRI (EN12) BOD discharge kilograms product output GRI (EN12) Suppliers with certified EMS percent - SMMT, GRI (EN33) Alternative fuel/hybrid vehicles sold percent - SMMT Average CO2 emissions of vehicles grams per
kilometer - SMMT, GRI ASS (P4)
Average fuel efficiency of vehicles liters per 100 kilometer
- SMMT, GRI ASS (P3)
Staff turnover percent - SMMT, BITC Models with good safety performance percent - Euro NCAP, GRI ASS (PR1) Paper VOC emissions kilograms product output DEFRA, EMASb Eco-labeled products percent - GRI (EN14, 15), EMASb Virgin fiber from certified forestries percent - PaperFed Non-paper materials recycled kilograms product output PaperFed Recycled fiber input kilograms product output PaperFed Use of additives kilograms product output PaperFed Packaging material handled kilograms product output CPI KPI Waste disposal to landfill percent - GRI (EN11), PaperFed Effluent discharge cubic meters product output GRI (EN12), DEFRA, EMASb BOD discharge kilograms product output GRI (EN12) COD discharge kilograms product output GRI (EN12) Plaster Packaging material handled kilograms product output CPI KPI Recycled materials used in production kilograms product output CPI KPI, BITC Transport movements number product output CPI KPI, DTI Effluent discharge cubic meters product output GRI (EN12), DEFRA, EMASb Waste disposal to landfill tons product output GRI (EN11) Plastics VOC emissions tons product output DEFRA, EMASb Recycled materials used in production tons product output CPI KPI, BITC Transport movements leaving the site number of
movements product output CPI KPI, DTI
Waste disposal to landfill percent - GRI (EN11), Envirowise Effluent discharge cubic meters product output GRI (EN12), DEFRA, EMASb
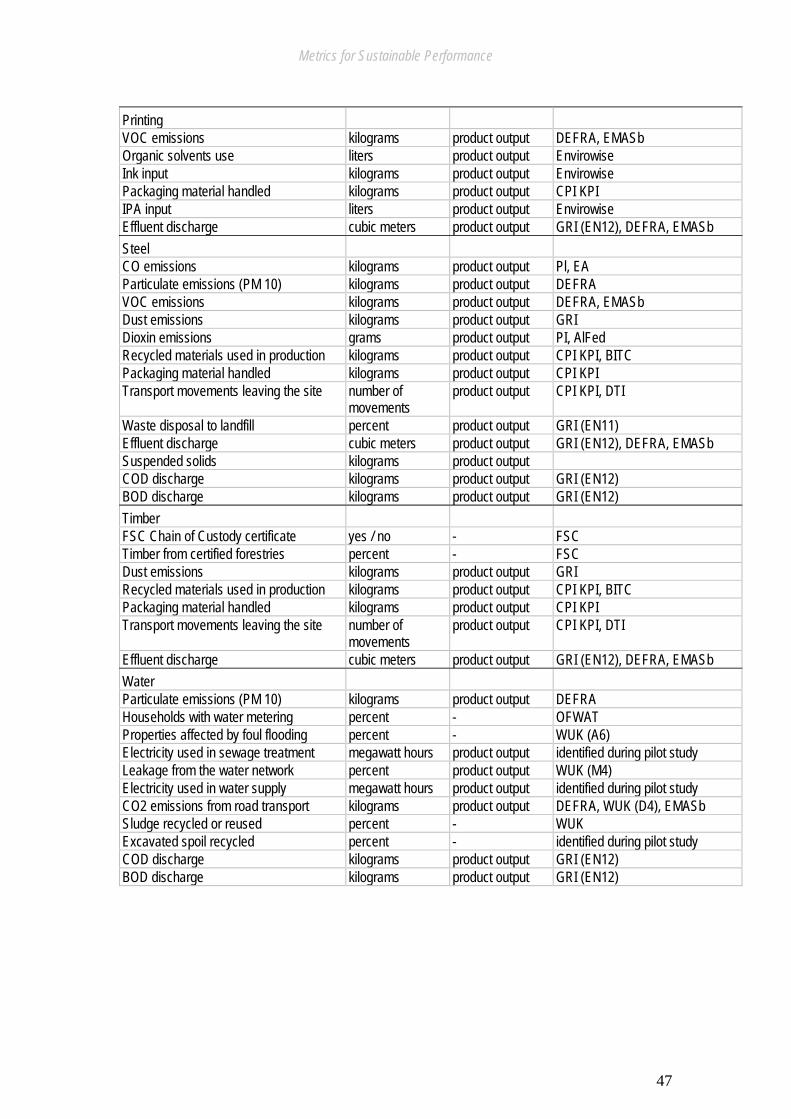
Metrics for Sustainable Performance
47
Printing VOC emissions kilograms product output DEFRA, EMASb Organic solvents use liters product output Envirowise Ink input kilograms product output Envirowise Packaging material handled kilograms product output CPI KPI IPA input liters product output Envirowise Effluent discharge cubic meters product output GRI (EN12), DEFRA, EMASb Steel CO emissions kilograms product output Pl, EA Particulate emissions (PM 10) kilograms product output DEFRA VOC emissions kilograms product output DEFRA, EMASb Dust emissions kilograms product output GRI Dioxin emissions grams product output PI, AlFed Recycled materials used in production kilograms product output CPI KPI, BITC Packaging material handled kilograms product output CPI KPI Transport movements leaving the site number of
movements product output CPI KPI, DTI
Waste disposal to landfill percent product output GRI (EN11) Effluent discharge cubic meters product output GRI (EN12), DEFRA, EMASb Suspended solids kilograms product output COD discharge kilograms product output GRI (EN12) BOD discharge kilograms product output GRI (EN12) Timber FSC Chain of Custody certificate yes / no - FSC Timber from certified forestries percent - FSC Dust emissions kilograms product output GRI Recycled materials used in production kilograms product output CPI KPI, BITC Packaging material handled kilograms product output CPI KPI Transport movements leaving the site number of
movements product output CPI KPI, DTI
Effluent discharge cubic meters product output GRI (EN12), DEFRA, EMASb Water Particulate emissions (PM 10) kilograms product output DEFRA Households with water metering percent - OFWAT Properties affected by foul flooding percent - WUK (A6) Electricity used in sewage treatment megawatt hours product output identified during pilot study Leakage from the water network percent product output WUK (M4) Electricity used in water supply megawatt hours product output identified during pilot study CO2 emissions from road transport kilograms product output DEFRA, WUK (D4), EMASb Sludge recycled or reused percent - WUK Excavated spoil recycled percent - identified during pilot study COD discharge kilograms product output GRI (EN12) BOD discharge kilograms product output GRI (EN12)
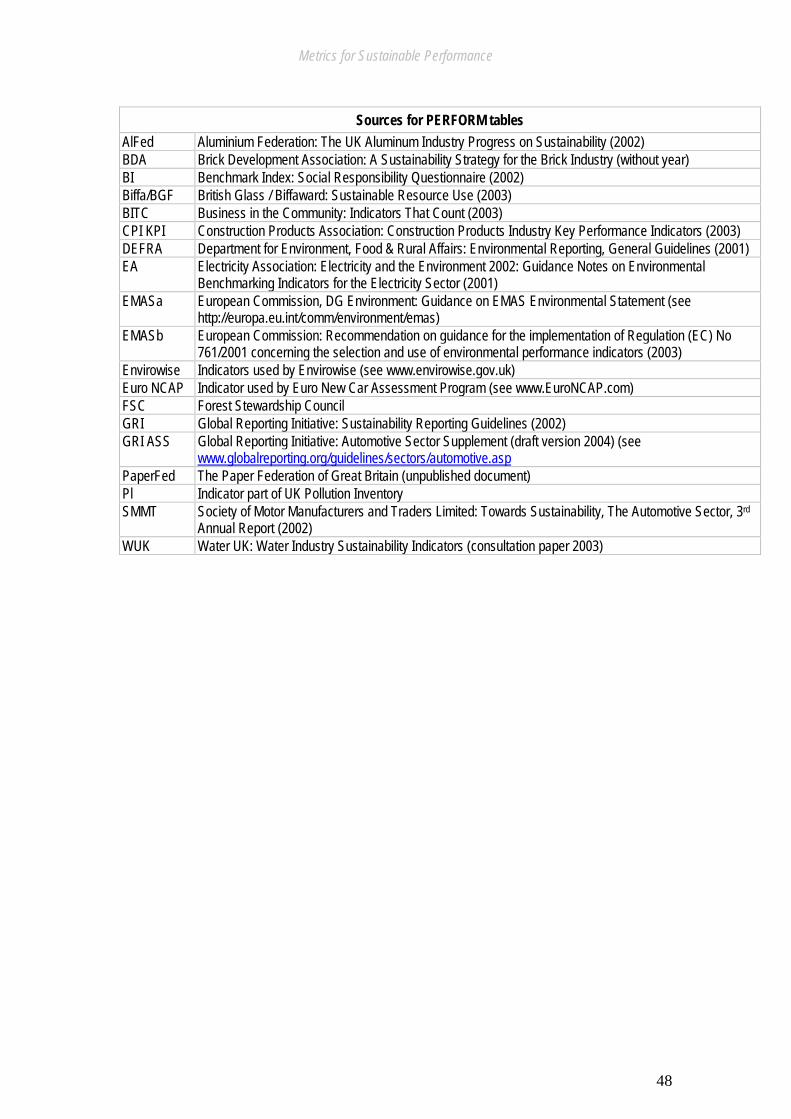
Metrics for Sustainable Performance
48
Sources for PERFORM tables
AlFed Aluminium Federation: The UK Aluminum Industry Progress on Sustainability (2002) BDA Brick Development Association: A Sustainability Strategy for the Brick Industry (without year) BI Benchmark Index: Social Responsibility Questionnaire (2002) Biffa/BGF British Glass / Biffaward: Sustainable Resource Use (2003) BITC Business in the Community: Indicators That Count (2003) CPI KPI Construction Products Association: Construction Products Industry Key Performance Indicators (2003) DEFRA Department for Environment, Food & Rural Affairs: Environmental Reporting, General Guidelines (2001) EA Electricity Association: Electricity and the Environment 2002: Guidance Notes on Environmental
Benchmarking Indicators for the Electricity Sector (2001) EMASa European Commission, DG Environment: Guidance on EMAS Environmental Statement (see
http://europa.eu.int/comm/environment/emas) EMASb European Commission: Recommendation on guidance for the implementation of Regulation (EC) No
761/2001 concerning the selection and use of environmental performance indicators (2003) Envirowise Indicators used by Envirowise (see www.envirowise.gov.uk) Euro NCAP Indicator used by Euro New Car Assessment Program (see www.EuroNCAP.com) FSC Forest Stewardship Council GRI Global Reporting Initiative: Sustainability Reporting Guidelines (2002) GRI ASS Global Reporting Initiative: Automotive Sector Supplement (draft version 2004) (see
www.globalreporting.org/guidelines/sectors/automotive.asp PaperFed The Paper Federation of Great Britain (unpublished document) Pl Indicator part of UK Pollution Inventory SMMT Society of Motor Manufacturers and Traders Limited: Towards Sustainability, The Automotive Sector, 3rd
Annual Report (2002) WUK Water UK: Water Industry Sustainability Indicators (consultation paper 2003)
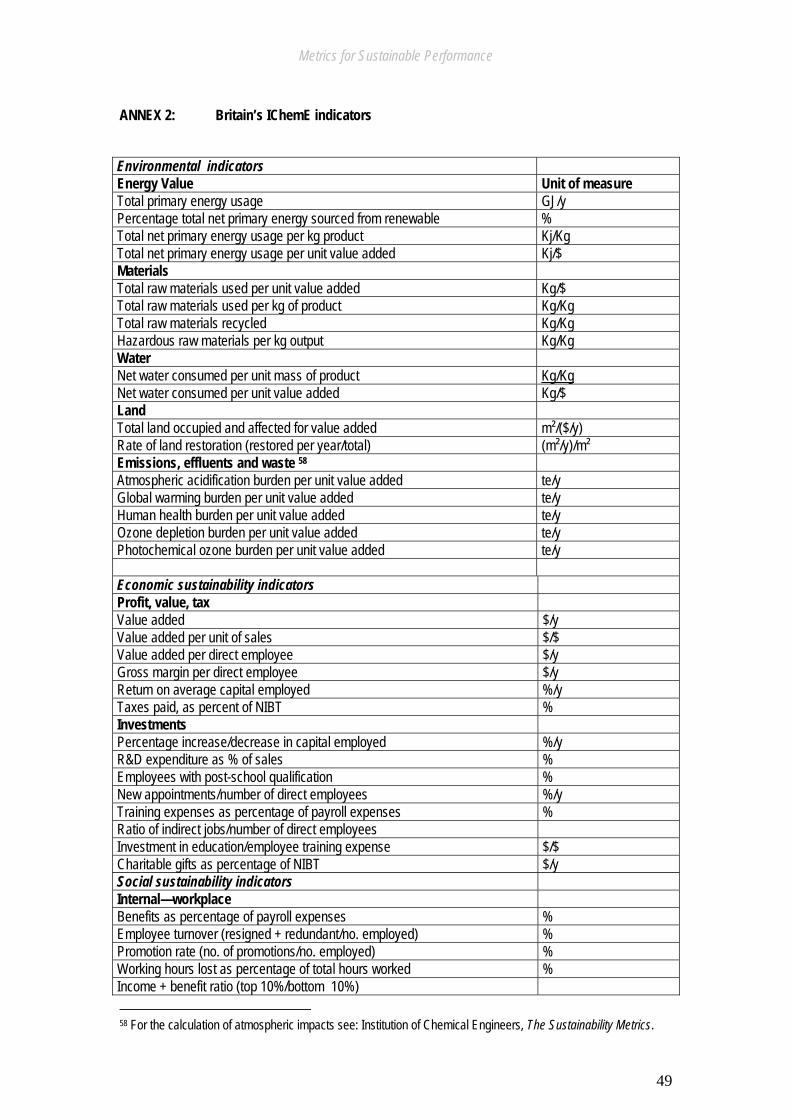
Metrics for Sustainable Performance
49
ANNEX 2: Britain’s IChemE indicators Environmental indicators Energy Value Unit of measure Total primary energy usage GJ/y Percentage total net primary energy sourced from renewable % Total net primary energy usage per kg product Kj/Kg Total net primary energy usage per unit value added Kj/$ Materials Total raw materials used per unit value added Kg/$ Total raw materials used per kg of product Kg/Kg Total raw materials recycled Kg/Kg Hazardous raw materials per kg output Kg/Kg Water Net water consumed per unit mass of product Kg/Kg Net water consumed per unit value added Kg/$ Land Total land occupied and affected for value added m²/($/y) Rate of land restoration (restored per year/total) (m²/y)/m² Emissions, effluents and waste 58 Atmospheric acidification burden per unit value added te/y Global warming burden per unit value added te/y Human health burden per unit value added te/y Ozone depletion burden per unit value added te/y Photochemical ozone burden per unit value added te/y Economic sustainability indicators Profit, value, tax Value added $/y Value added per unit of sales $/$ Value added per direct employee $/y Gross margin per direct employee $/y Return on average capital employed %/y Taxes paid, as percent of NIBT % Investments Percentage increase/decrease in capital employed %/y R&D expenditure as % of sales % Employees with post-school qualification % New appointments/number of direct employees %/y Training expenses as percentage of payroll expenses % Ratio of indirect jobs/number of direct employees Investment in education/employee training expense $/$ Charitable gifts as percentage of NIBT $/y Social sustainability indicators Internal—workplace Benefits as percentage of payroll expenses % Employee turnover (resigned + redundant/no. employed) % Promotion rate (no. of promotions/no. employed) % Working hours lost as percentage of total hours worked % Income + benefit ratio (top 10%/bottom 10%) 58 For the calculation of atmospheric impacts see: Institution of Chemical Engineers, The Sustainability Metrics.

Metrics for Sustainable Performance
50
Lost time accident frequency (per million hours worked) Expenditure on illness and accident prevention/payroll expense $/$ External—society Number of stakeholder meetings per unit value added /$ Indirect community benefit per unit value added $/$ Number of complaints per unit value added /$ Number of legal actions per unit value added /$
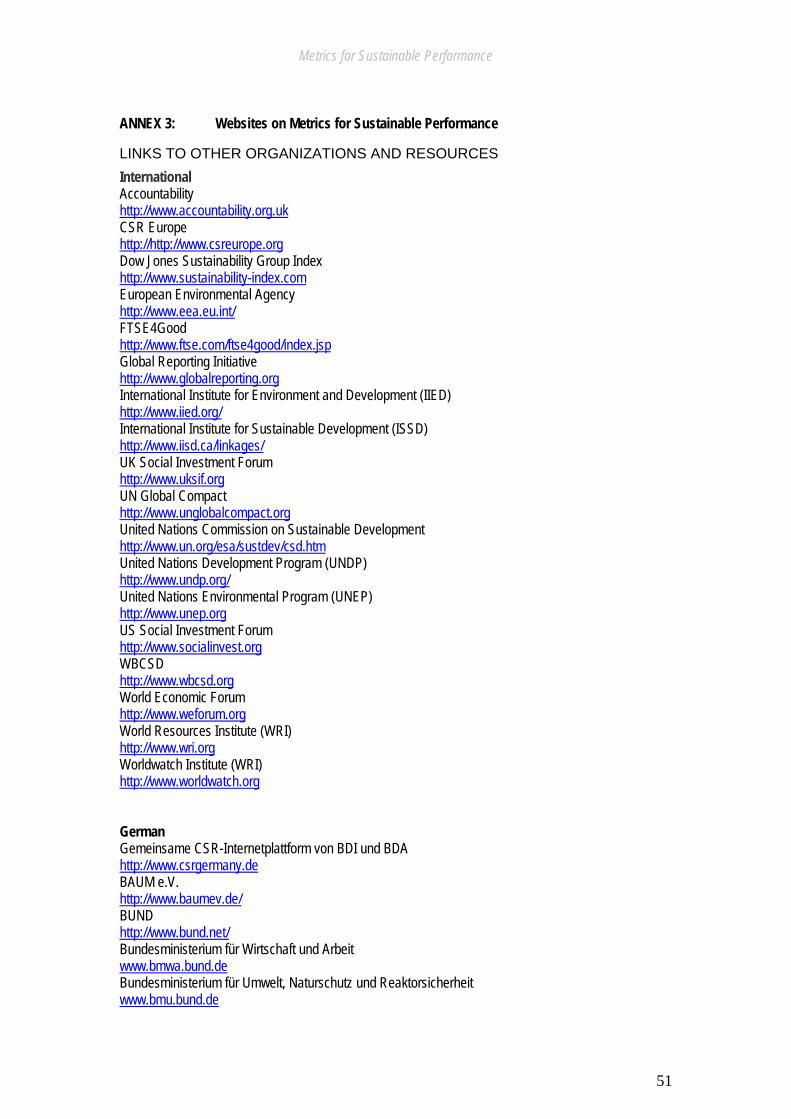
Metrics for Sustainable Performance
51
ANNEX 3: Websites on Metrics for Sustainable Performance
LINKS TO OTHER ORGANIZATIONS AND RESOURCES International Accountability http://www.accountability.org.uk CSR Europe http://http://www.csreurope.org Dow Jones Sustainability Group Index http://www.sustainability-index.com European Environmental Agency http://www.eea.eu.int/ FTSE4Good http://www.ftse.com/ftse4good/index.jsp Global Reporting Initiative http://www.globalreporting.org International Institute for Environment and Development (IIED) http://www.iied.org/ International Institute for Sustainable Development (ISSD) http://www.iisd.ca/linkages/ UK Social Investment Forum http://www.uksif.org UN Global Compact http://www.unglobalcompact.org United Nations Commission on Sustainable Development http://www.un.org/esa/sustdev/csd.htm United Nations Development Program (UNDP) http://www.undp.org/ United Nations Environmental Program (UNEP) http://www.unep.org US Social Investment Forum http://www.socialinvest.org WBCSD http://www.wbcsd.org World Economic Forum http://www.weforum.org World Resources Institute (WRI) http://www.wri.org Worldwatch Institute (WRI) http://www.worldwatch.org German Gemeinsame CSR-Internetplattform von BDI und BDA http://www.csrgermany.de BAUM e.V. http://www.baumev.de/ BUND http://www.bund.net/ Bundesministerium für Wirtschaft und Arbeit www.bmwa.bund.de Bundesministerium für Umwelt, Naturschutz und Reaktorsicherheit www.bmu.bund.de
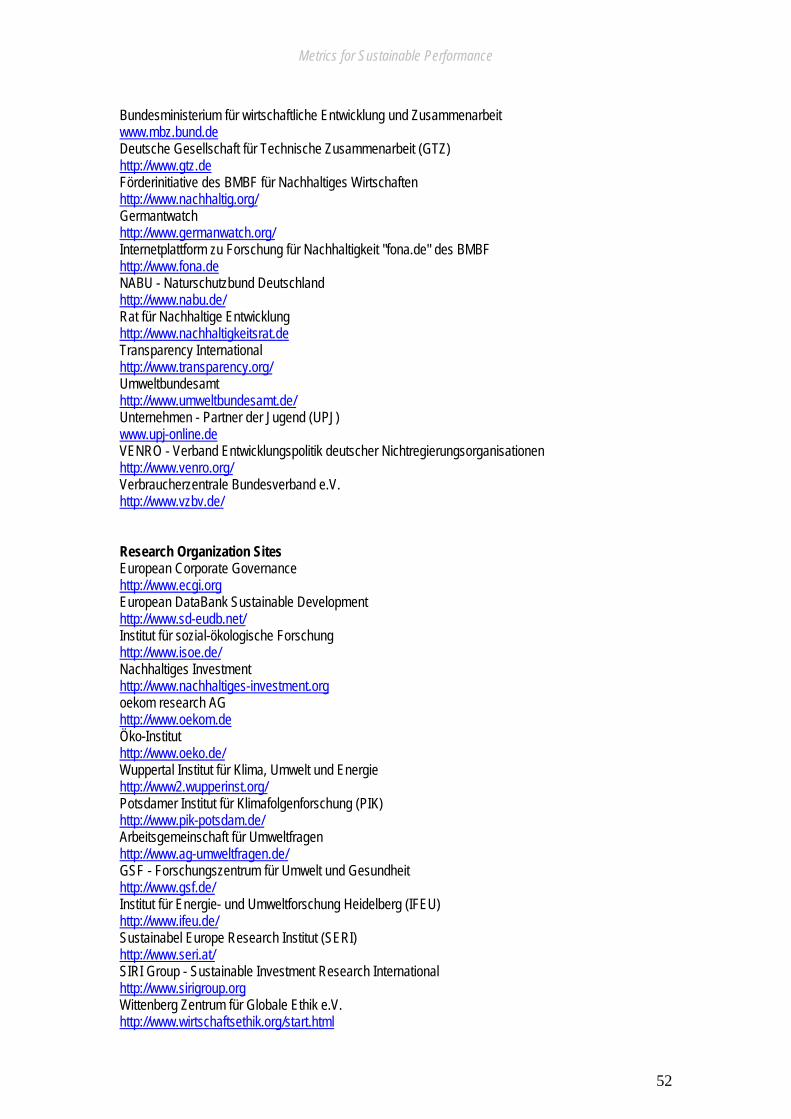
Metrics for Sustainable Performance
52
Bundesministerium für wirtschaftliche Entwicklung und Zusammenarbeit www.mbz.bund.de Deutsche Gesellschaft für Technische Zusammenarbeit (GTZ) http://www.gtz.de Förderinitiative des BMBF für Nachhaltiges Wirtschaften http://www.nachhaltig.org/ Germantwatch http://www.germanwatch.org/ Internetplattform zu Forschung für Nachhaltigkeit "fona.de" des BMBF http://www.fona.de NABU - Naturschutzbund Deutschland http://www.nabu.de/ Rat für Nachhaltige Entwicklung http://www.nachhaltigkeitsrat.de Transparency International http://www.transparency.org/ Umweltbundesamt http://www.umweltbundesamt.de/ Unternehmen - Partner der Jugend (UPJ) www.upj-online.de VENRO - Verband Entwicklungspolitik deutscher Nichtregierungsorganisationen http://www.venro.org/ Verbraucherzentrale Bundesverband e.V. http://www.vzbv.de/ Research Organization Sites European Corporate Governance http://www.ecgi.org European DataBank Sustainable Development http://www.sd-eudb.net/ Institut für sozial-ökologische Forschung http://www.isoe.de/ Nachhaltiges Investment http://www.nachhaltiges-investment.org oekom research AG http://www.oekom.de Öko-Institut http://www.oeko.de/ Wuppertal Institut für Klima, Umwelt und Energie http://www2.wupperinst.org/ Potsdamer Institut für Klimafolgenforschung (PIK) http://www.pik-potsdam.de/ Arbeitsgemeinschaft für Umweltfragen http://www.ag-umweltfragen.de/ GSF - Forschungszentrum für Umwelt und Gesundheit http://www.gsf.de/ Institut für Energie- und Umweltforschung Heidelberg (IFEU) http://www.ifeu.de/ Sustainabel Europe Research Institut (SERI) http://www.seri.at/ SIRI Group - Sustainable Investment Research International http://www.sirigroup.org Wittenberg Zentrum für Globale Ethik e.V. http://www.wirtschaftsethik.org/start.html
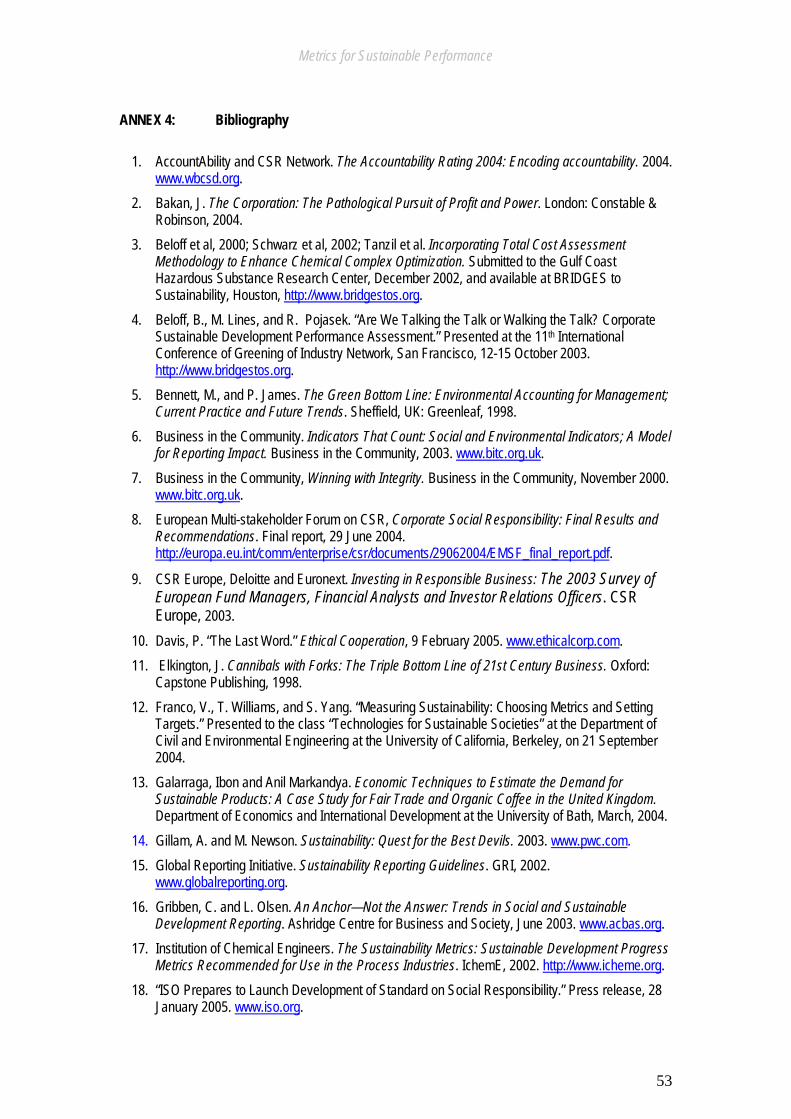
Metrics for Sustainable Performance
53
ANNEX 4: Bibliography
1. AccountAbility and CSR Network. The Accountability Rating 2004: Encoding accountability. 2004.
www.wbcsd.org. 2. Bakan, J. The Corporation: The Pathological Pursuit of Profit and Power. London: Constable &
Robinson, 2004. 3. Beloff et al, 2000; Schwarz et al, 2002; Tanzil et al. Incorporating Total Cost Assessment
Methodology to Enhance Chemical Complex Optimization. Submitted to the Gulf Coast Hazardous Substance Research Center, December 2002, and available at BRIDGES to Sustainability, Houston, http://www.bridgestos.org.
4. Beloff, B., M. Lines, and R. Pojasek. “Are We Talking the Talk or Walking the Talk? Corporate Sustainable Development Performance Assessment.” Presented at the 11th International Conference of Greening of Industry Network, San Francisco, 12-15 October 2003. http://www.bridgestos.org.
5. Bennett, M., and P. James. The Green Bottom Line: Environmental Accounting for Management; Current Practice and Future Trends. Sheffield, UK: Greenleaf, 1998.
6. Business in the Community. Indicators That Count: Social and Environmental Indicators; A Model for Reporting Impact. Business in the Community, 2003. www.bitc.org.uk.
7. Business in the Community, Winning with Integrity. Business in the Community, November 2000. www.bitc.org.uk.
8. European Multi-stakeholder Forum on CSR, Corporate Social Responsibility: Final Results and Recommendations. Final report, 29 June 2004. http://europa.eu.int/comm/enterprise/csr/documents/29062004/EMSF_final_report.pdf.
9. CSR Europe, Deloitte and Euronext. Investing in Responsible Business: The 2003 Survey of European Fund Managers, Financial Analysts and Investor Relations Officers. CSR Europe, 2003.
10. Davis, P. “The Last Word.” Ethical Cooperation, 9 February 2005. www.ethicalcorp.com. 11. Elkington, J. Cannibals with Forks: The Triple Bottom Line of 21st Century Business. Oxford:
Capstone Publishing, 1998. 12. Franco, V., T. Williams, and S. Yang. “Measuring Sustainability: Choosing Metrics and Setting
Targets.” Presented to the class “Technologies for Sustainable Societies” at the Department of Civil and Environmental Engineering at the University of California, Berkeley, on 21 September 2004.
13. Galarraga, Ibon and Anil Markandya. Economic Techniques to Estimate the Demand for Sustainable Products: A Case Study for Fair Trade and Organic Coffee in the United Kingdom. Department of Economics and International Development at the University of Bath, March, 2004.
14. Gillam, A. and M. Newson. Sustainability: Quest for the Best Devils. 2003. www.pwc.com. 15. Global Reporting Initiative. Sustainability Reporting Guidelines. GRI, 2002.
www.globalreporting.org. 16. Gribben, C. and L. Olsen. An Anchor—Not the Answer: Trends in Social and Sustainable
Development Reporting. Ashridge Centre for Business and Society, June 2003. www.acbas.org. 17. Institution of Chemical Engineers. The Sustainability Metrics: Sustainable Development Progress
Metrics Recommended for Use in the Process Industries. IchemE, 2002. http://www.icheme.org. 18. “ISO Prepares to Launch Development of Standard on Social Responsibility.” Press release, 28
January 2005. www.iso.org.
Metrics for Sustainable Performance
54
19. Jennings, Vernon. “Addressing the Economic Bottom Line.” In The Triple Bottom Line—Does It All Add Up? edited by A. Henriques and J. Richardson. London, UK: Earthscan, 2004.
20. King Committee on Corporate Governance, King II Report for South Africa, 2002. 21. Loew, T., K. Ankele, S. Braun, and J. Clausen. Significance of the CSR Debate for Sustainability
and the Requirements for Companies. Münster and Berlin, 2004. 22. Loh, Jonathan, ed. Living Planet Report 2002. World Wildlife Fund, 2002. 23. NRTEE. Measuring Eco-efficiency in Business: Feasibility of a Core Set of Indicators. Ottawa:
Renouf Publishing Co., 1999. 24. PERFORM—Sustainability Performance Benchmarking. A collaborative research project at:
www.sustainability-performance.org 25. Plesner, K., and A. Lerberg Jogensen. “Reporting for Duty: Managing Non-Financial Risks.”
Focus, no. 95 (8 December 2004). Publication of the Copenhagen Stock Exchange. 26. Schmidheiny, Stefan. Changing Course. Cambridge, MA: The MIT Press, 1992. 27. Schwarz, Beloff, and Beaver. “Use Sustainability Metrics to Guide Decision-Making.” Chemical
Engineering Progress (July 2003). www.cepmagazine.org. 28. Sikdar, S.K. “Journey towards Sustainable Development: Role for Chemical Engineers.”
Environmental Progress, 22, Nr. 4 (Dec. 2003). 29. Sikdar, S.K. “Sustainable Development and Sustainability Metrics.” United States Environmental
Protection Agency, 2003. www.epa.gov. 30. SustainAbility. Risk & Opportunity: Best Practice in Non-Financial Reporting. SustainAbility, 2004. 31. Sywottek, C. “Macht’s gut,” brand eins, October 2004. www.brandeins.de. 32. Székely, F., T. Vollman, and A. Ebbinghaus. Environmental Benchmarking: Becoming Green and
Competitive. Cheltenham, UK: Stanley Thornes Ltd., 1996. 33. Tanzil, D., G. Ma, and B. Beloff. “Sustainability Metrics.” Presented at “Innovating for
Sustainability,” the 11th International Conference of Greening of Industry Network, San Francisco, 12–15 October 2003.
34. The Sigma Project. The Sigma Guidelines. www.projectsigma.com.
35. UNCTAD. A Manual for the Preparers and Users of Eco-Efficiency Indicators. Version 1.1. United Nations, 2004.
36. UN Global Compact. Who Cares Wins: Connecting Financial Markets to a Changing World. Global Compact, 2004. www.globalcompact.org.
37. World Business Council for Sustainable Development. Sustainable Development Reporting: Striking the Balance. WBCSD, 2002. www.wbcsd.org.
38. World Commission on Environment and Development. Our Common Future. Oxford: Oxford University Press, 1987.
Related Documents