energies Article Lead-Acid Battery Sizing for a DC Auxiliary System in a Substation by the Optimization Method Janez Ribiˇ c 1, *, Jože Pihler 1 , Robert Maruša 2 , Filip Kokalj 3 and Peter Kitak 1 1 Department of Electrical Engineering, University of Maribor, Faculty of Electrical Engineering and Computer Science, 2000 Maribor, Slovenia; [email protected] (J.P.); [email protected] (P.K.) 2 Electric Transmission Power Operator, ELES, 1000 Ljubljana, Slovenia; [email protected] 3 Faculty of Mechanical Engineering, Department of Power, Process and Environmental Engineering, University of Maribor, 2000 Maribor, Slovenia; fi[email protected] * Correspondence: [email protected]; Tel.: +00-386-2220-7055 Received: 18 October 2019; Accepted: 18 November 2019; Published: 19 November 2019 Abstract: Lead-acid batteries are the most frequently used energy storage facilities for the provision of a backup supply of DC auxiliary systems in substations and power plants due to their long service life and high reliability. It is possible to define the load in these systems, therefore the IEEE 485 Standard can be used for the selection of batteries according to the conventional method of selection. Special attention is paid in the paper to the technical selection of a lead-acid battery, which depends on its operational reliability that decreases with battery aging. It is defined by the extent of maintenance during its service life. A cost analysis was also carried out, which took into consideration maintenance and procurement costs, as well as the costs of the related air conditioning that keeps the prescribed temperature and ventilates the battery room. The impact is shown of selecting a lead-acid battery on the battery room’s operating safety when charging. The final selection of lead-acid battery is performed using an optimization algorithm of differential evolution. Using the optimization process, the new battery selection method includes the technical sizing criteria of the lead-acid battery, reliability of operation with maintenance, operational safety, and cost analysis. Two cases of selection of lead-acid batteries for the backup supply of a DC auxiliary system in a transmission substation are presented in the paper, where the input data were determined based on measurements in an existing substation. A comparison is made between the existing conventional and new lead-acid battery selection method based on optimization. Keywords: lead-acid battery; substation; DC auxiliary system; optimization methods 1. Introduction Batteries represent a part of our everyday life. They are found everywhere, from electronic devices to cars. In electric power systems, they are used as energy storage facilities in conventional and smart distribution systems, transmission systems, as well as for manual frequency Rrestoration reserves (mFRR) and backup supply of auxiliary networks in substations [1]. The most frequently used batteries are lead-acid ones nowadays, although Li-ion and other types of batteries are being used increasingly. The technology for producing a lead-acid battery (LAB) is well known and mature, and these batteries have a long service life (SL). The manufacturing costs are much lower than those for manufacturing Li-ion batteries. Li-ion batteries have the capability of storing high energy density and do not require much maintenance. LABs are used in applications that are limited by costs, such as smart grids that are not connected to the power system. A LAB is composed of a certain number of lead-acid cells connected in series. The selection of LABs used for energy storage applications in isolated microgrids is dealt with in [2–4]. The load is random in these applications. The selection Energies 2019, 12, 4400; doi:10.3390/en12224400 www.mdpi.com/journal/energies

Welcome message from author
This document is posted to help you gain knowledge. Please leave a comment to let me know what you think about it! Share it to your friends and learn new things together.
Transcript
energies
Article
Lead-Acid Battery Sizing for a DC Auxiliary Systemin a Substation by the Optimization Method
Janez Ribic 1,*, Jože Pihler 1, Robert Maruša 2, Filip Kokalj 3 and Peter Kitak 1
1 Department of Electrical Engineering, University of Maribor, Faculty of Electrical Engineering andComputer Science, 2000 Maribor, Slovenia; [email protected] (J.P.); [email protected] (P.K.)
2 Electric Transmission Power Operator, ELES, 1000 Ljubljana, Slovenia; [email protected] Faculty of Mechanical Engineering, Department of Power, Process and Environmental Engineering,
University of Maribor, 2000 Maribor, Slovenia; [email protected]* Correspondence: [email protected]; Tel.: +00-386-2220-7055
Received: 18 October 2019; Accepted: 18 November 2019; Published: 19 November 2019 �����������������
Abstract: Lead-acid batteries are the most frequently used energy storage facilities for the provisionof a backup supply of DC auxiliary systems in substations and power plants due to their longservice life and high reliability. It is possible to define the load in these systems, therefore the IEEE485 Standard can be used for the selection of batteries according to the conventional method ofselection. Special attention is paid in the paper to the technical selection of a lead-acid battery,which depends on its operational reliability that decreases with battery aging. It is defined by theextent of maintenance during its service life. A cost analysis was also carried out, which took intoconsideration maintenance and procurement costs, as well as the costs of the related air conditioningthat keeps the prescribed temperature and ventilates the battery room. The impact is shown ofselecting a lead-acid battery on the battery room’s operating safety when charging. The final selectionof lead-acid battery is performed using an optimization algorithm of differential evolution. Usingthe optimization process, the new battery selection method includes the technical sizing criteria ofthe lead-acid battery, reliability of operation with maintenance, operational safety, and cost analysis.Two cases of selection of lead-acid batteries for the backup supply of a DC auxiliary system in atransmission substation are presented in the paper, where the input data were determined based onmeasurements in an existing substation. A comparison is made between the existing conventionaland new lead-acid battery selection method based on optimization.
Keywords: lead-acid battery; substation; DC auxiliary system; optimization methods
1. Introduction
Batteries represent a part of our everyday life. They are found everywhere, from electronicdevices to cars. In electric power systems, they are used as energy storage facilities in conventionaland smart distribution systems, transmission systems, as well as for manual frequency Rrestorationreserves (mFRR) and backup supply of auxiliary networks in substations [1]. The most frequentlyused batteries are lead-acid ones nowadays, although Li-ion and other types of batteries are beingused increasingly. The technology for producing a lead-acid battery (LAB) is well known and mature,and these batteries have a long service life (SL). The manufacturing costs are much lower than thosefor manufacturing Li-ion batteries. Li-ion batteries have the capability of storing high energy densityand do not require much maintenance. LABs are used in applications that are limited by costs, such assmart grids that are not connected to the power system. A LAB is composed of a certain numberof lead-acid cells connected in series. The selection of LABs used for energy storage applications inisolated microgrids is dealt with in [2–4]. The load is random in these applications. The selection
Energies 2019, 12, 4400; doi:10.3390/en12224400 www.mdpi.com/journal/energies
Energies 2019, 12, 4400 2 of 22
is performed by optimization methods for harmonization of dynamic voltage characteristics withthe load. A net present value (NPV) cost analysis was performed in [2]. A mathematical model ofan LAB is used based on [5]. The selection of LABs for high-capacity energy storage applications is alsoperformed using iteration methods, using the existing battery models in the NETOMAC [6] programtool. LABs are used mostly in battery storage applications, such as a DC auxiliary system supply insubstations, nuclear power plants, and uninterruptible power supply (UPS) systems [7]. The load isknown in these applications. This means that the batteries can be selected using the procedure definedin the IEEE 485 Standard [8]. The paper focuses only on the DC system for supplying the auxiliarysystem in a substation. This is the most important part of a substation. It supplies the substation’sprotection and control systems. The requirements for operation of a DC auxiliary system are coveredby the Standard [9]. In normal operation, this system is supplied from the power grid through a batterycharging system (rectifier). The DC auxiliary system should be supplied without interruption from theLAB in the case of a rectifier’s outage. For a certain period of time, it should provide supply to theentire DC auxiliary system load. The most important parameter for the reliable operation of a LAB isthe State of Health (SOH) factor for the entire SL of the battery. This factor describes the ability of thebattery to perform charging and discharging during its SL, and shows the degradation processes. It isnecessary to determine this factor [10,11]. The possibilities have been analyzed for determination ofthe SOH factor for LABs in a substation and its impact on their reliability [12]. An important factorof an LAB’s operational reliability is also the temperature of the electrolyte. It has an impact on thethermal dynamics of electrochemical processes and on the battery’s capacity [13]. An adequate costanalysis of both investment and operation of the LAB is also an important factor in the selection ofLABs [14].
The main purpose of this paper is to give a presentation and implementation of thenew LAB selection method for energy storage applications, especially in DC auxiliary systems,using an optimization method where the load current can be determined. In this process, the technicalcriteria given by the Standard [9], economic criteria, and reliability operation criteria are takeninto account. The selection is performed using an optimization algorithm of differential evolution(DEA) [15,16].
Special attention is paid in this article to the LAB’s operational safety in the battery room (BR).General requirements for this area follow the Standard [17]. Hydrogen, H2, is released due to theelectrolysis of water in the electrolyte when charging a LAB [17,18]. Hence, proper BR ventilation isrequired. The author in [19] discusses the risk of explosion in the BR and safety measures.
The new LAB selection concept by the DE optimization method is designed in the Matlab programtool environment. The data on LABs were supplied by the battery manufacturer. Computation exampleswere made for a substation of the Slovenian TSO ELES. The article will also introduce the conventionalmethod of selecting LABs. This method will be compared with the new selection method that usesthe optimization process. The basic theoretical requirements for the new concept of LAB selectionwith optimization have been covered from a book [18], articles [19–21], and standards [8,17,22,23].The implementation of DEA in the LAB selection was carried out on the basis of research in [15,16].
The main contributions and innovations in this paper are:
• Development of an optimization algorithm for the selection of LABs in stationary applications,taking into consideration technical, economic and reliability criteria, safety, and possible methodsof battery maintenance;
• Optimum conditions of battery selection;• A selection method that contributes to more reliable and more cost-efficient operation of LABs for
the supply of a DC auxiliary system in substations;• The selection of LABs impacts on the operational safety in the BR.
Below is a short presentation of the paper’s Sections. Section 2 gives a description of the DCauxiliary system supply in a substation and the role of LABs in it. Section 3 presents a detailed
Energies 2019, 12, 4400 3 of 22
description of the LAB selection concept of the conventional LAB selection method. In this context,the role of the IEEE 485 Standard is explained. The new LAB selection method with optimization ispresented in Section 4, together with a detailed description of battery capacity and number of lead-acidcells’ calculation. This section also includes a presentation of costs, determination of reliability andsafety in the BR, and the optimization method of DEA with criteria. Section 5 presents the results of theselection process analysis, with the conventional selection method and the selection with optimizationof LABs for two cases. Section 6 provides a comparison and analysis between the conventional andnew selection method with optimization. This paper concludes with Section 7 which contains theconclusions of the research.
2. The Role of Lead-Acid Batteries in a Substation’s Auxiliary System Supply
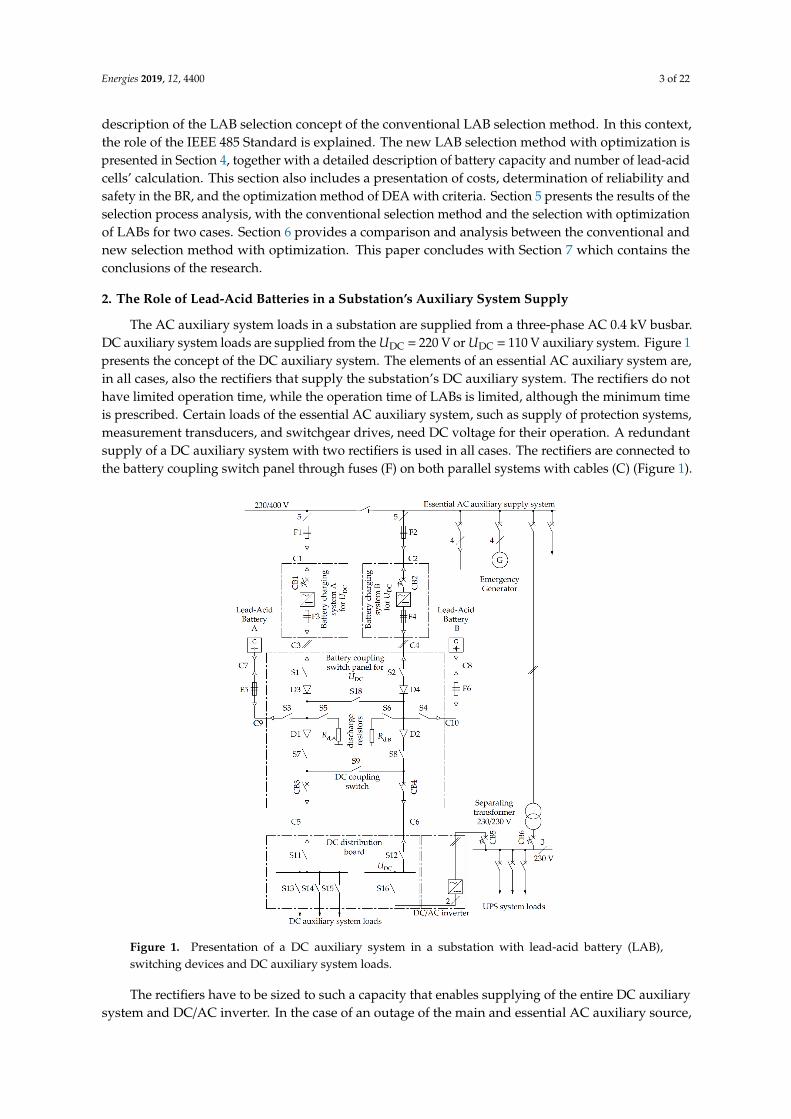
The AC auxiliary system loads in a substation are supplied from a three-phase AC 0.4 kV busbar.DC auxiliary system loads are supplied from the UDC = 220 V or UDC = 110 V auxiliary system. Figure 1presents the concept of the DC auxiliary system. The elements of an essential AC auxiliary system are,in all cases, also the rectifiers that supply the substation’s DC auxiliary system. The rectifiers do nothave limited operation time, while the operation time of LABs is limited, although the minimum timeis prescribed. Certain loads of the essential AC auxiliary system, such as supply of protection systems,measurement transducers, and switchgear drives, need DC voltage for their operation. A redundantsupply of a DC auxiliary system with two rectifiers is used in all cases. The rectifiers are connected tothe battery coupling switch panel through fuses (F) on both parallel systems with cables (C) (Figure 1).
Energies 2019, 12, x FOR PEER REVIEW 3 of 22
and safety in the BR, and the optimization method of DEA with criteria. Section 5 presents the results
of the selection process analysis, with the conventional selection method and the selection with
optimization of LABs for two cases. Section 6 provides a comparison and analysis between the
conventional and new selection method with optimization. This paper concludes with Section 7
which contains the conclusions of the research.
2. The Role of Lead-Acid Batteries in a Substation’s Auxiliary System Supply
The AC auxiliary system loads in a substation are supplied from a three-phase AC 0.4 kV busbar.
DC auxiliary system loads are supplied from the UDC = 220 V or UDC = 110 V auxiliary system. Figure
1 presents the concept of the DC auxiliary system. The elements of an essential AC auxiliary system
are, in all cases, also the rectifiers that supply the substation’s DC auxiliary system. The rectifiers do
not have limited operation time, while the operation time of LABs is limited, although the minimum
time is prescribed. Certain loads of the essential AC auxiliary system, such as supply of protection
systems, measurement transducers, and switchgear drives, need DC voltage for their operation. A
redundant supply of a DC auxiliary system with two rectifiers is used in all cases. The rectifiers are
connected to the battery coupling switch panel through fuses (F) on both parallel systems with cables
(C) (Figure 1).
Figure 1. Presentation of a DC auxiliary system in a substation with lead-acid battery (LAB), switching
devices and DC auxiliary system loads.
The rectifiers have to be sized to such a capacity that enables supplying of the entire DC auxiliary
system and DC/AC inverter. In the case of an outage of the main and essential AC auxiliary source,
Figure 1. Presentation of a DC auxiliary system in a substation with lead-acid battery (LAB),switching devices and DC auxiliary system loads.
The rectifiers have to be sized to such a capacity that enables supplying of the entire DC auxiliarysystem and DC/AC inverter. In the case of an outage of the main and essential AC auxiliary source,
Energies 2019, 12, 4400 4 of 22
the supply of rectifiers is interrupted. Two separated LABs of sufficient capacities are needed toprovide a reliable operation of the DC auxiliary system. Each of them is capable of supplying the DCauxiliary system and inverted loads for a certain period of time. Two LABs are used for this purpose inmost substations. Both batteries are charged through the rectifiers during normal operation. For thepurpose of battery testing, each battery is equipped with two discharging resistors, Rd,A and Rd,B.Individual parts of the system are protected by fuses. Switching manipulations in the DC auxiliarysystem network are performed by adequate switching devices (S). In the majority of substations, the DCauxiliary system is also the main supply source of the UPS system (through an inverter). The operationdepends on the load and availability of supply sources. In the normal operation, both systems, (Aand B), are switched on, and supply all load and charge the LABs. In the case of rectifiers’ outage,the supply is taken over by the LABs.
3. Procedure of the Conventional Lead-Acid Battery Selection Method According to the Standard
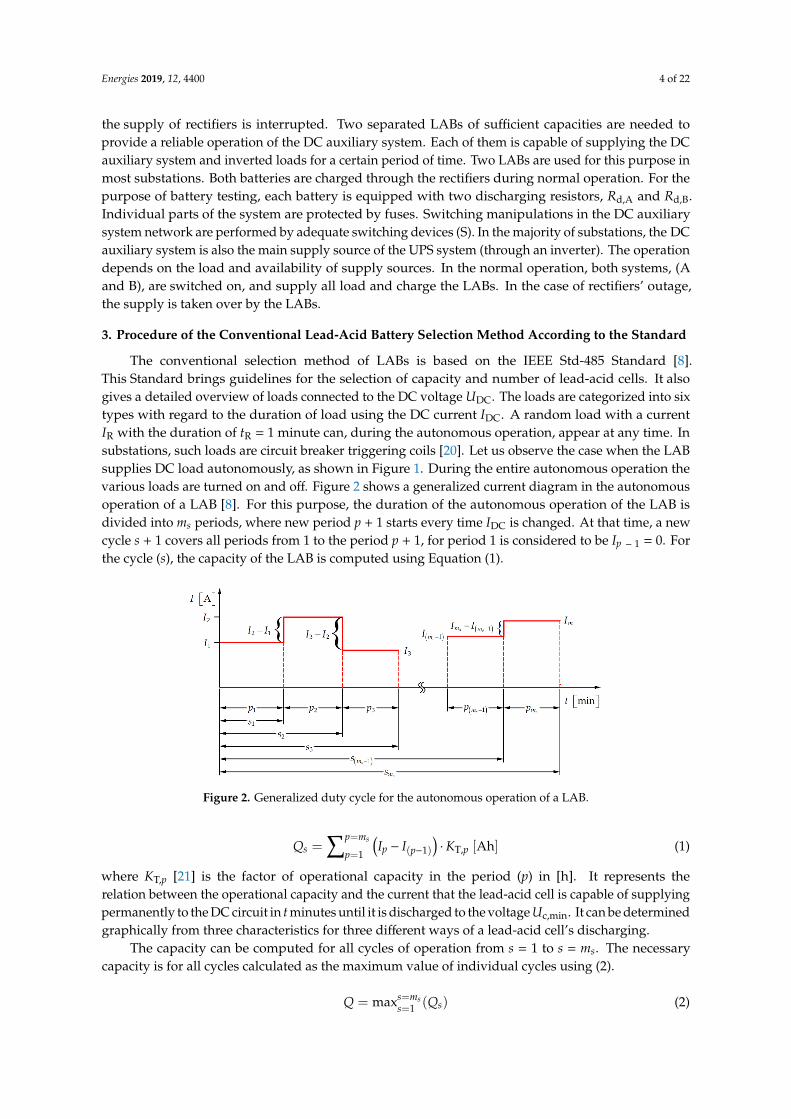
The conventional selection method of LABs is based on the IEEE Std-485 Standard [8].This Standard brings guidelines for the selection of capacity and number of lead-acid cells. It alsogives a detailed overview of loads connected to the DC voltage UDC. The loads are categorized into sixtypes with regard to the duration of load using the DC current IDC. A random load with a currentIR with the duration of tR = 1 minute can, during the autonomous operation, appear at any time. Insubstations, such loads are circuit breaker triggering coils [20]. Let us observe the case when the LABsupplies DC load autonomously, as shown in Figure 1. During the entire autonomous operation thevarious loads are turned on and off. Figure 2 shows a generalized current diagram in the autonomousoperation of a LAB [8]. For this purpose, the duration of the autonomous operation of the LAB isdivided into ms periods, where new period p + 1 starts every time IDC is changed. At that time, a newcycle s + 1 covers all periods from 1 to the period p + 1, for period 1 is considered to be Ip − 1 = 0. Forthe cycle (s), the capacity of the LAB is computed using Equation (1).
Energies 2019, 12, x FOR PEER REVIEW 4 of 22
the supply of rectifiers is interrupted. Two separated LABs of sufficient capacities are needed to
provide a reliable operation of the DC auxiliary system. Each of them is capable of supplying the DC
auxiliary system and inverted loads for a certain period of time. Two LABs are used for this purpose
in most substations. Both batteries are charged through the rectifiers during normal operation. For
the purpose of battery testing, each battery is equipped with two discharging resistors, Rd,A and Rd,B.
Individual parts of the system are protected by fuses. Switching manipulations in the DC auxiliary
system network are performed by adequate switching devices (S). In the majority of substations, the
DC auxiliary system is also the main supply source of the UPS system (through an inverter). The
operation depends on the load and availability of supply sources. In the normal operation, both
systems, (A and B), are switched on, and supply all load and charge the LABs. In the case of rectifiers’
outage, the supply is taken over by the LABs.
3. Procedure of the Conventional Lead-Acid Battery Selection Method According to the Standard
The conventional selection method of LABs is based on the IEEE Std-485 Standard [8]. This
Standard brings guidelines for the selection of capacity and number of lead-acid cells. It also gives a
detailed overview of loads connected to the DC voltage UDC. The loads are categorized into six types
with regard to the duration of load using the DC current IDC. A random load with a current IR with
the duration of tR = 1 minute can, during the autonomous operation, appear at any time. In
substations, such loads are circuit breaker triggering coils [20]. Let us observe the case when the LAB
supplies DC load autonomously, as shown in Figure 1. During the entire autonomous operation the
various loads are turned on and off. Figure 2 shows a generalized current diagram in the autonomous
operation of a LAB [8]. For this purpose, the duration of the autonomous operation of the LAB is
divided into ms periods, where new period p + 1 starts every time IDC is changed. At that time, a new
cycle s + 1 covers all periods from 1 to the period p + 1, for period 1 is considered to be Ip − 1 = 0. For
the cycle (s), the capacity of the LAB is computed using Equation (1).
( 1) T,1
Ahsp m
s p p ppQ I I K (1)
where KT,p [21] is the factor of operational capacity in the period (p) in [h]. It represents the relation
between the operational capacity and the current that the lead-acid cell is capable of supplying
permanently to the DC circuit in t minutes until it is discharged to the voltage Uc,min. It can be
determined graphically from three characteristics for three different ways of a lead-acid cell’s
discharging.
Figure 2. Generalized duty cycle for the autonomous operation of a LAB.
The capacity can be computed for all cycles of operation from s = 1 to s = ms. The necessary
capacity is for all cycles calculated as the maximum value of individual cycles using (2).
1max ss mssQ Q
(2)
Figure 2. Generalized duty cycle for the autonomous operation of a LAB.
Qs =∑p=ms
p=1
(Ip − I(p−1)
)·KT,p [Ah] (1)
where KT,p [21] is the factor of operational capacity in the period (p) in [h]. It represents therelation between the operational capacity and the current that the lead-acid cell is capable of supplyingpermanently to the DC circuit in t minutes until it is discharged to the voltage Uc,min. It can be determinedgraphically from three characteristics for three different ways of a lead-acid cell’s discharging.
The capacity can be computed for all cycles of operation from s = 1 to s = ms. The necessarycapacity is for all cycles calculated as the maximum value of individual cycles using (2).
Q = maxs=mss=1 (Qs) (2)

Energies 2019, 12, 4400 5 of 22
The necessary capacity of a lead-acid cell for a random load is, according to the Standard,calculated using Equation (3).
QR = nrep · IR ·KT,R (3)
where KT,R is the factor that can be determined graphically from three characteristics for three differentways of a lead-acid cell’s discharging for a random load for the duration of tR = 1 min. nrep is therandom load repetition factor, assuming tR = 1 min for all repetitions. IR is the total load current ofa random load. This capacity is oversized, due to the selected duration [7].
The necessary capacity of the lead-acid cell can, finally, be calculated using Equation (4).
Qc,need = Ka ·Ktem ·Kdm · (Q + QR) (4)
where Ka is the aging factor of the lead-acid cell (irreversible chemical processes). The Standard definesit as Ka = 1.25. This means that, at the start, up to 25% higher capacity of a lead-acid cell needs to beprovided to ensure that it will be able to supply the load during the entire SL. Ktem is the temperaturefactor. Kdm (design margin) is a correction factor that takes into consideration insufficient maintenanceand unexpected changes of load.
To design the DC auxiliary system for new substations, it is necessary to determine the set ofpotential DC auxiliary system loads. The power ratings of individual loads and their estimatedduration of connection to the DC auxiliary system are determined during the intended autonomyof power supply from LABs. Also determined are the average current Iavg at the average dischargevoltage Uavg (Iavg = P/Uavg) and the random load current IR. Cycles and periods of load currentsare determined. The appropriate capacity is selected according to Equations (1)–(4). The factors incapacity selection (aging, temperature, manufacturing constraints) are generally taken conservativelyas maximum values. The number of lead-acid cells connected in series for a given DC voltage levelis predetermined and in accordance with the Standard [8]. In the case of a reconstruction of theDC auxiliary system, the current measurement and duration shall be measured for the existing one.A random current load, as well as the number of lead-acid cells connected in series, are also determinedin accordance with the provisions of the Standard and equipment at the DC auxiliary system voltage.The rule is that a unifying number of cells connected in series is selected for a given DC auxiliarysystem voltage level. Based on these provisions, and in cooperation with the institutions for designingthe DC auxiliary system in substations, we have created an application in MS Excel, which coversan active capacity selection table by the Standard [8].
4. Procedure of Lead-Acid Battery Selection Based on the Optimization Method
The new LAB selection method using optimization complies fully with the technical criterionregarding the selection of capacity and the number of lead-acid cells connected in series. With theadditional variation of factors (temperature and manufacturing constraints) and the number of cellsconnected in series, we introduced a cost criterion, and criteria for the reliability and operational safetyof lead-acid cells in the BR.
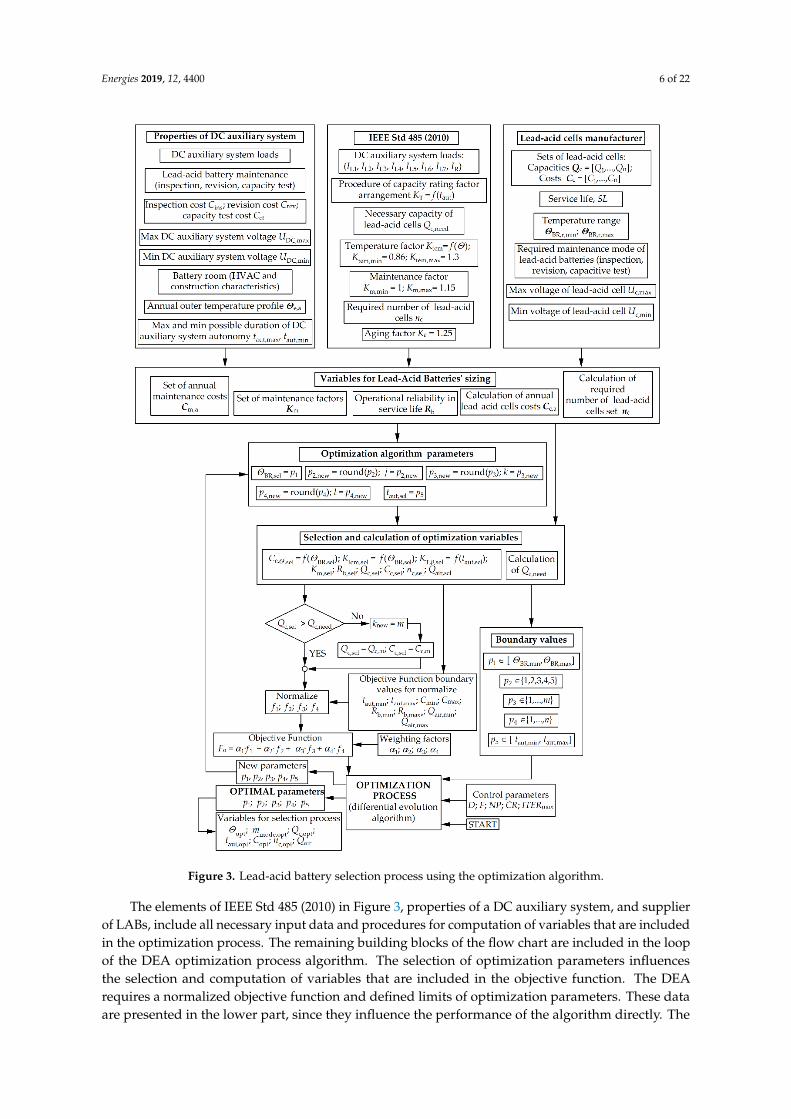
The entire procedure of LAB selection using the optimization method is presented in Figure 3. DEAwas used as an optimization method for the selection of LABs. The basic idea is to use an optimizationmethod that enables selection of the most optimal battery using multiple selection criteria. The flowchart shows several phases of computations and selection. The basic phase is a collection of informationand variables that are used in the optimization procedure, as well as Standards, based on the user’sexperiences and manufacturer’s data. The flow chart in Figure 2 presents the entire procedure for thecomputation of variables that are included in the optimization process.
Energies 2019, 12, 4400 6 of 22
Energies 2019, 12, x FOR PEER REVIEW 6 of 22
DEA requires a normalized objective function and defined limits of optimization parameters. These
data are presented in the lower part, since they influence the performance of the algorithm directly.
The optimization parameters that are not part of the analytic procedure according to the Standard [8]
are also presented, but have an impact on the DEA’s behavior. The algorithm offers new values of
parameters that have an indirect impact on the value of the objective function. This procedure leads
to the selection of optimal parameters at the criteria of the highest possible autonomy of supply with
the LAB f1, minimum cost f2, highest possible operational reliability f3, and maximum operational
safety of LABs in the BR f4. All elements of this optimization system are presented below.
Figure 3. Lead-acid battery selection process using the optimization algorithm. Figure 3. Lead-acid battery selection process using the optimization algorithm.
The elements of IEEE Std 485 (2010) in Figure 3, properties of a DC auxiliary system, and supplierof LABs, include all necessary input data and procedures for computation of variables that are includedin the optimization process. The remaining building blocks of the flow chart are included in the loopof the DEA optimization process algorithm. The selection of optimization parameters influencesthe selection and computation of variables that are included in the objective function. The DEArequires a normalized objective function and defined limits of optimization parameters. These dataare presented in the lower part, since they influence the performance of the algorithm directly. The

Energies 2019, 12, 4400 7 of 22
optimization parameters that are not part of the analytic procedure according to the Standard [8]are also presented, but have an impact on the DEA’s behavior. The algorithm offers new values ofparameters that have an indirect impact on the value of the objective function. This procedure leads tothe selection of optimal parameters at the criteria of the highest possible autonomy of supply with theLAB f 1, minimum cost f 2, highest possible operational reliability f 3, and maximum operational safetyof LABs in the BR f 4. All elements of this optimization system are presented below.
To include factors KT,p and KT,R in the optimization process, an approximation from threecharacteristics for three different ways of a lead-acid cell’s discharging was made with the polynomialof the fourth degree. The “grabit” application was used for this purpose, where, for the diagram foreach characteristic, the points Ti (xi,yi) were determined (more than 200 points per curve). Since thesecurves are plotted on a log-log graph, the final points were obtained using x’ = 10x transformation.The transformation is valid for all coordinates. The fourth-degree polynomial coefficients were soughtusing the approximation process in Equation (5).
KT,p = a1 · t4aut + a2 · t3
aut + a3 · t2aut + a4 · taut + a5 [h] (5)
where a1, a2, a3, a4 in a5 are fourth-degree polynomial coefficients and taut is the duration of theautonomous supply expressed in minutes. Table 1 shows the coefficients for three ways of lead-acidcells’ discharge at different Uc,min.
Table 1. Fourth-degree polynomial coefficients for various depths of lead-acid battery discharging.
Uc,min [V/Cell] a1 a2 a3 a4 a5
1.81 −8.7584·10−11 1.0610·10−7−4.4639·10−5 22.9857·10−3 1.0599
1.75 −1.7060·10−10 1.8196·10−7−6.5694·10−5 24.5160·10−3 0.7513
1.69 −1.0067·10−10 1.6330·10−7−4.5739·10−5 23.6610·10−3 0.5792
The Standard defines discrete values of this temperature factor for electrolyte temperaturesbetween θ = 4.4 ◦C (Ktem = 1.3) and θ = 48.9 ◦C (Ktem = 0.86). This is also the ambient temperaturein the stationary operating conditions. In the optimization process, these boundary conditions aregiven in a tabular form. For the intermediate temperatures, the factor Ktem is defined by the linearinterpolation. Kdm (design margin) is a correction factor that takes into consideration insufficientmaintenance and unexpected changes of load. Only the influence of insufficient maintenance is takeninto account in the optimization process. The boundary values of this factor lie between Kdm,min = 1.0and Kdm,max = 1.15. In the subsequent parts of the paper, this factor is addressed to maintenance factorKm = Kdm.
The other important area that influences the selection of a LAB is the DC network supplied bythe battery. Below, there is a description of a DC auxiliary system supply in modern substations,although the procedures can be generalized to all DC networks. Voltage levels of DC networks aredefined by the types and properties of the connected load. The minimum voltage UDC,min is theDC network voltage that enables uninterrupted operation of the supplied load. The maximum DCnetwork voltage UDC,max is the maximum permitted operational voltage of the supplied load. The DCnetwork voltage and, thus, the LAB voltage, depend on the necessary amount of energy stored in thebattery. The user has to maintain the LAB and comply with the minimum maintenance requirementsdefined by the manufacturer. These requirements may be even higher to provide the required levelof reliability. An LAB has to undergo inspections, revisions, and capacity tests to maintain its SL.The LAB is not disconnected from the DC network during the inspections. Checked are the generalcondition of the battery, electrolyte level, and condition of contacts between the lead-acid cells (usinga thermovision camera), the sealing, and ventilation of the BR. The battery is switched off duringthe revisions. This process includes a thorough inspection of contacts, with measurement of contactresistance, battery connections, electrolyte density, and voltage of individual cells. The capacity

Energies 2019, 12, 4400 8 of 22
test is performed in accordance with the IEC 60896-11 Standard [22], and in accordance with themanufacturer’s instructions. A detailed inspection of the battery is performed. It is loaded with aconstant current through the discharging resistor. Voltage is measured until the battery is dischargedto 80% of its initial capacity. The intention is to find malfunctioning lead-acid cells. During this process,the electrolyte density is also measured constantly.
The inspection cost is denoted as Cins. The revision cost, on the other hand, is denoted as Crev,while the cost of the capacity test is Cct. The SL of the battery is designated as SL.
The maintenance extent influences the maintenance factor Km and the maintenance costs Cm.On the basis of the lead-acid cells’ maintenance method and the manufacturer’s recommendations,five maintenance modes are possible, as described below. Maintenance mode 1: Twice a year, a capacitytest is performed; once a year, a revision; and twice a year, an inspection. Km,mode1 = 1. The cost ofmaintenance mode 1 is expressed as Cm,mode1 = (2 · Cct + Crev + 2 · Cins) · SL. Maintenance mode 2: Oncea year, a capacity test; once a year, a revision; and twice a year, an inspection. Km,mode2 = 1.05. The costof this mode is defined by Cm,mode2 = (Cct + Crev + 2 · Cins) · SL. Maintenance mode 3: A capacity test isperformed every two years. During the years of the service life, when the capacity test is not performed,a revision is carried out, and, twice a year, an inspection. The cost of this mode is Cm,mode3 = (0.5 ·(Cct + Crev) + 2 · Cins) · SL. Km,mode3 = 1.075. Service mode 4: A capacity test is performed every fiveyears. During the years of the service life, when the capacity test is not performed, a revision is carriedout, and, twice a year, an inspection. Cm,mode4 = (0.2 · Cct + 0.8 · Crev + 2 · Cins) · SL. Km,mode4 = 1.1.Service mode 5: A capacity test is performed once in the middle of the SL. During years of the servicelife, when the capacity test is not performed, a revision is carried out, and, twice a year, an inspection.Km,mode5 = 1.15. Cm,mode5 = Cct + (SL − 1)·Crev + 2 · Cins · SL. The vectors Km = [1,1.05,1.075,1.1,1.15]and Cm = [Cm,mode1, Cm,mode2, Cm,mode3, Cm,mode4, Cm,mode5] are formed with the currency unit [CU].We are interested in the annual maintenance costs. The vector of annual maintenance costs is calculatedusing Cm,a = (1/SL) · Cm, where SL is the lead-acid cells’ SL. The maintenance of LABs is linked closelywith their reliability of operation. A LAB is composed of a large number of cells connected in series.The capacity test gives us an indication of the weak links in this series, and the instruction which cellsneed to be replaced with new ones. Each weak lead-acid cell can prevent the battery from ensuring itrequired autonomy time during its operation [12]. The calculation of reliability depends mainly on thecapacity test. A basic level of reliability is ensured by regular revisions if a capacity test is not carriedout during the years of service life and inspections twice a year. For mode 1, it was found out thata failure may occur in the last half year of the SL. The reliability of operation is, thus, Rb,mode1 = 1 −0.5 · SL−1. For mode 2, the reliability of operation is Rb,mode2 = 1 − SL−1. For mode 3, the reliabilityof operation is Rb,mode3 = 1 − 2 · SL−1. For mode 4, the reliability of operation is Rb,mode4 = 1 − 5 ·SL−1. For maintenance mode 5, the reliability of operation is expressed as Rb,mode5 = 1 − 10 · SL−1.The reliability of operation vector Rb = [Rb,mode1, Rb,mode2, Rb,mode3, Rb,mode4, Rb,mode5] is formed forthe LAB.
The LAB is placed in the BR, which needs to be ventilated forcibly, due to the release of H2 duringbattery charging [18]. For this purpose, a heating, ventilation, and air conditioning (HVAC) device isinstalled in the BR, which also keeps the room temperature at the desired level. The question is, whatare the costs related to the operation of the HVAC device to maintain the desired temperature in theBR? For this purpose, the IEC 12831 Standard [23] is used, which defines the method of calculating theprojected thermal load for buildings. To use this Standard properly, one has to know the properties ofthe walls, floor, ceilings, windows, and doors of both the building and the BR, as well as the surfaceareas of all elements. Heat losses due to natural ventilation of the BR and heat transfer through heatbridges can be neglected. It is assumed that the BR is located in a heated building with the temperatureof the adjacent rooms amounting to Θnp. It is also assumed that all the adjacent heated/cooled roomshave the same temperature Θnp. The heat is transmitted between the building elements with theadjacent rooms, and the outer walls with the exterior. A stationary state of heat transmission is
Energies 2019, 12, 4400 9 of 22
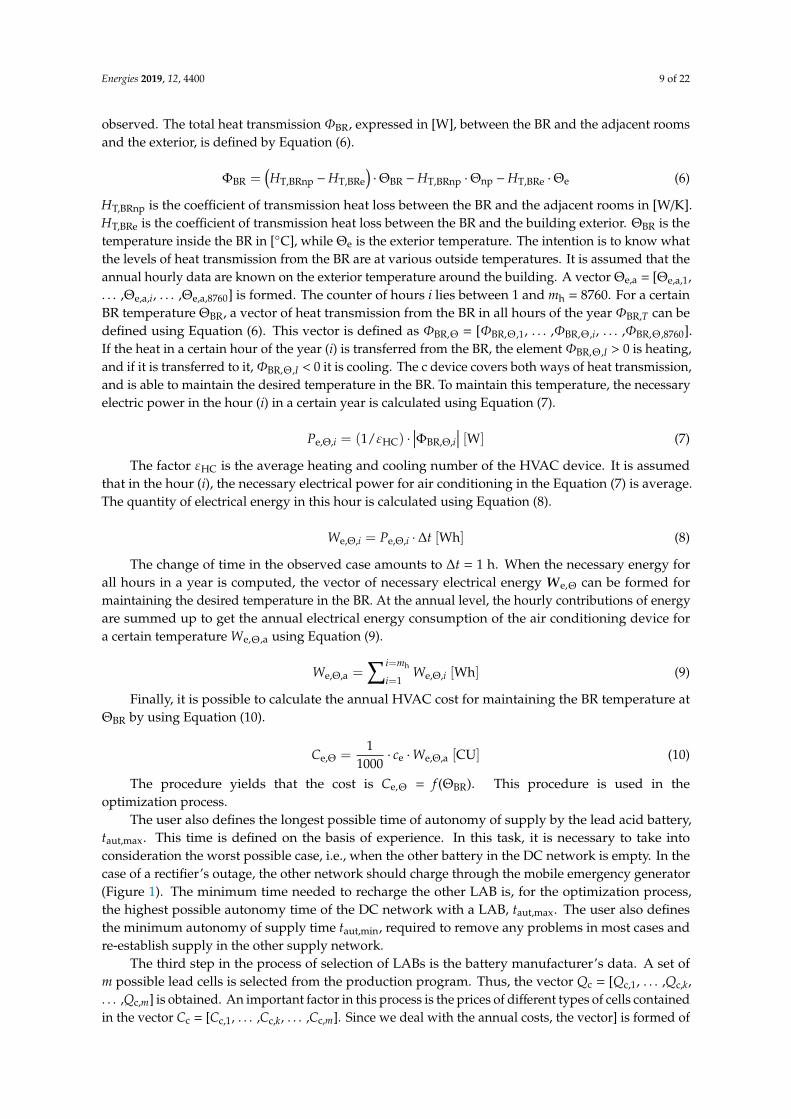
observed. The total heat transmission ΦBR, expressed in [W], between the BR and the adjacent roomsand the exterior, is defined by Equation (6).
ΦBR =(HT,BRnp −HT,BRe
)·ΘBR −HT,BRnp ·Θnp −HT,BRe ·Θe (6)
HT,BRnp is the coefficient of transmission heat loss between the BR and the adjacent rooms in [W/K].HT,BRe is the coefficient of transmission heat loss between the BR and the building exterior. ΘBR is thetemperature inside the BR in [◦C], while Θe is the exterior temperature. The intention is to know whatthe levels of heat transmission from the BR are at various outside temperatures. It is assumed that theannual hourly data are known on the exterior temperature around the building. A vector Θe,a = [Θe,a,1,. . . ,Θe,a,i, . . . ,Θe,a,8760] is formed. The counter of hours i lies between 1 and mh = 8760. For a certainBR temperature ΘBR, a vector of heat transmission from the BR in all hours of the year ΦBR,T can bedefined using Equation (6). This vector is defined as ΦBR,Θ = [ΦBR,Θ ,1, . . . ,ΦBR,Θ ,i, . . . ,ΦBR,Θ ,8760].If the heat in a certain hour of the year (i) is transferred from the BR, the element ΦBR,Θ ,I > 0 is heating,and if it is transferred to it,ΦBR,Θ ,I < 0 it is cooling. The c device covers both ways of heat transmission,and is able to maintain the desired temperature in the BR. To maintain this temperature, the necessaryelectric power in the hour (i) in a certain year is calculated using Equation (7).
Pe,Θ,i = (1/εHC) ·∣∣∣ΦBR,Θ,i
∣∣∣ [W] (7)
The factor εHC is the average heating and cooling number of the HVAC device. It is assumedthat in the hour (i), the necessary electrical power for air conditioning in the Equation (7) is average.The quantity of electrical energy in this hour is calculated using Equation (8).
We,Θ,i = Pe,Θ,i · ∆t [Wh] (8)
The change of time in the observed case amounts to ∆t = 1 h. When the necessary energy forall hours in a year is computed, the vector of necessary electrical energy We,Θ can be formed formaintaining the desired temperature in the BR. At the annual level, the hourly contributions of energyare summed up to get the annual electrical energy consumption of the air conditioning device fora certain temperature We,Θ ,a using Equation (9).
We,Θ,a =∑i=mh
i=1We,Θ,i [Wh] (9)
Finally, it is possible to calculate the annual HVAC cost for maintaining the BR temperature atΘBR by using Equation (10).
Ce,Θ =1
1000· ce ·We,Θ,a [CU] (10)
The procedure yields that the cost is Ce,Θ = f (ΘBR). This procedure is used in theoptimization process.
The user also defines the longest possible time of autonomy of supply by the lead acid battery,taut,max. This time is defined on the basis of experience. In this task, it is necessary to take intoconsideration the worst possible case, i.e., when the other battery in the DC network is empty. In thecase of a rectifier’s outage, the other network should charge through the mobile emergency generator(Figure 1). The minimum time needed to recharge the other LAB is, for the optimization process,the highest possible autonomy time of the DC network with a LAB, taut,max. The user also definesthe minimum autonomy of supply time taut,min, required to remove any problems in most cases andre-establish supply in the other supply network.
The third step in the process of selection of LABs is the battery manufacturer’s data. A set ofm possible lead cells is selected from the production program. Thus, the vector Qc = [Qc,1, . . . ,Qc,k,. . . ,Qc,m] is obtained. An important factor in this process is the prices of different types of cells containedin the vector Cc = [Cc,1, . . . ,Cc,k, . . . ,Cc,m]. Since we deal with the annual costs, the vector] is formed of
Energies 2019, 12, 4400 10 of 22
annual procurement costs Cc,a = (1/SL)·Cc in a [CU/year]. The manufacturer also gives the technical SLof cells’ SL. Characteristic data are also the maximum lead-acid cell’s voltage Uc,max in [V/cell] andminimum operating voltage that enables its normal operation, Uc,min in [V/cell]. The manufacturer alsospecifies the recommended temperature range, limited by ΘBR,r,min and ΘBR,r,max. This temperaturerange is usually narrower than the one defined by the Standard.
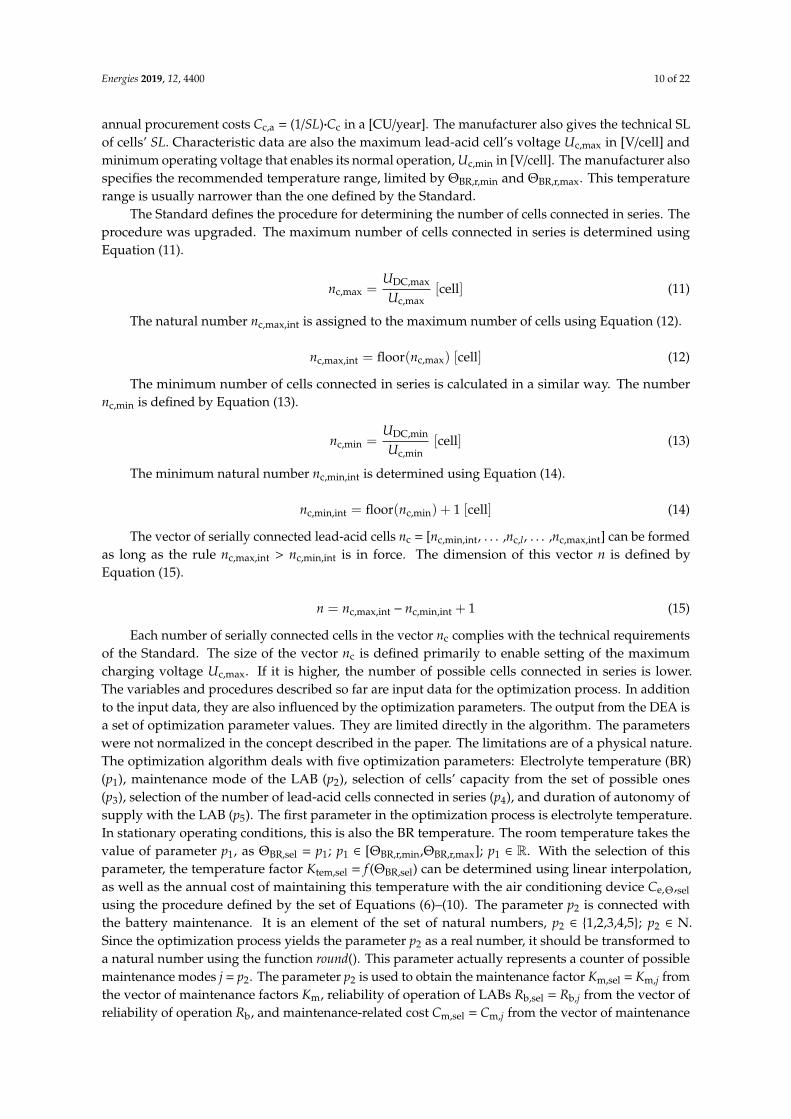
The Standard defines the procedure for determining the number of cells connected in series. Theprocedure was upgraded. The maximum number of cells connected in series is determined usingEquation (11).
nc,max =UDC,max
Uc,max[cell] (11)
The natural number nc,max,int is assigned to the maximum number of cells using Equation (12).
nc,max,int = floor(nc,max) [cell] (12)
The minimum number of cells connected in series is calculated in a similar way. The numbernc,min is defined by Equation (13).
nc,min =UDC,min
Uc,min[cell] (13)
The minimum natural number nc,min,int is determined using Equation (14).
nc,min,int = floor(nc,min) + 1 [cell] (14)
The vector of serially connected lead-acid cells nc = [nc,min,int, . . . ,nc,l, . . . ,nc,max,int] can be formedas long as the rule nc,max,int > nc,min,int is in force. The dimension of this vector n is defined byEquation (15).
n = nc,max,int − nc,min,int + 1 (15)
Each number of serially connected cells in the vector nc complies with the technical requirementsof the Standard. The size of the vector nc is defined primarily to enable setting of the maximumcharging voltage Uc,max. If it is higher, the number of possible cells connected in series is lower.The variables and procedures described so far are input data for the optimization process. In additionto the input data, they are also influenced by the optimization parameters. The output from the DEA isa set of optimization parameter values. They are limited directly in the algorithm. The parameterswere not normalized in the concept described in the paper. The limitations are of a physical nature.The optimization algorithm deals with five optimization parameters: Electrolyte temperature (BR)(p1), maintenance mode of the LAB (p2), selection of cells’ capacity from the set of possible ones(p3), selection of the number of lead-acid cells connected in series (p4), and duration of autonomy ofsupply with the LAB (p5). The first parameter in the optimization process is electrolyte temperature.In stationary operating conditions, this is also the BR temperature. The room temperature takes thevalue of parameter p1, as ΘBR,sel = p1; p1 ∈ [ΘBR,r,min,ΘBR,r,max]; p1 ∈ R. With the selection of thisparameter, the temperature factor Ktem,sel = f (ΘBR,sel) can be determined using linear interpolation,as well as the annual cost of maintaining this temperature with the air conditioning device Ce,Θ,sel
using the procedure defined by the set of Equations (6)–(10). The parameter p2 is connected withthe battery maintenance. It is an element of the set of natural numbers, p2 ∈ {1,2,3,4,5}; p2 ∈ N.Since the optimization process yields the parameter p2 as a real number, it should be transformed toa natural number using the function round(). This parameter actually represents a counter of possiblemaintenance modes j = p2. The parameter p2 is used to obtain the maintenance factor Km,sel = Km,j fromthe vector of maintenance factors Km, reliability of operation of LABs Rb,sel = Rb,j from the vector ofreliability of operation Rb, and maintenance-related cost Cm,sel = Cm,j from the vector of maintenance

Energies 2019, 12, 4400 11 of 22
costs Cm. The parameter p3 is related to the selection of lead-acid cells’ capacity, defined by themanufacturer. It represents a counter of selection of cell capacities from the set of products k offered bythe manufacturer, k = p3; p3 ∈ {1,2, . . . ,m}; p3 ∈ N. With this parameter, the lead-acid cells’ capacityQc,sel = Qc,k is selected from the vector Qc, as well as the procurement costs distributed by the yearsCc,a,sel = Cc,a,k from the vector of annual costs Cc,a. The parameter p4 represents the counter of selectionof the number of cells connected in series. This is the counter l in the vector nc, l = p4; p4 ∈ {1,2, . . . ,n};p4 ∈ N. The number of cells connected in series nc,sel = nc,l is selected from the vector nc with thisparameter,. The parameter p5 represents the duration of battery autonomy in supplying energy tothe DC auxiliary network. The duration of autonomy takes the value of the parameter p5 as taut,sel
= p5; p5 ∈ [taut,min,taut,max]; p5 ∈ R. This parameter enables calculation of the factor KT,p,sel = f (taut,sel),which makes possible calculation of the needed lead-acid cell’s capacity Qc,need.
When the variables that depend on optimization parameters are selected (Ktem,sel, Ce,Θ ,sel, Km,sel,Cm,sel, Rb,sel, Qc,sel, Cc,a,sel, nc,sel, KT,p,sel), it is possible to calculate the needed capacity Qc,need usingEquation (4). If Qc,sel ≥Qc,need, then the capacity was selected properly, and complies with the technicalcriteria defined by the Standard. If Qc,sel < Qc,need, then the counter k is set at the last place, k =
m. The capacity Qc,sel and cost Cc,a,sel are selected once again. After this, we may proceed to thecomputation of the Objective Function.
The objective is to select LABs using an optimization procedure by maximizing their durationof autonomy, minimizing costs, and providing maximum reliability of operation of the LAB. This isa multiple-criteria function. The total objective function can be computed using Equation (16). This isa dimensionless variable. In the optimization process it approaches to the minimum.
Fo = α1 · f1 + α2 · f2 + α3 · f3 + α4 · f4 → min (16)
The functions f 1, f 2, f 3, and f 4 are normalized functions for autonomy of supply, costs, reliabilityof operation, and the operational safety of LABs in a BR. α1, α2, α3, and α4 are weighting factors of theobjective function. The normalized function f 1 is a normalized objective function for the criterion ofautonomy of supply. This function is normalized through the linear transformation in Equation (17).
f1 = 1−taut,sel − taut,min
taut,max − taut,min(17)
This objective function is defined only with the duration of supply autonomy. The boundaryvalues of this objective function are also the limits of the parameter p5. The most cost efficientselection of a LAB is sought. This means that the minimum of the objective function f 2 is sought.Normalized function f 2 is the normalized function for the criterion of cost. Normalization is performedusing linear transformation in Equation (18). Since the minimum of this function is sought, it can onlybe increasing linearly.
f2 =Csel −Cmin
Cmax −Cmin(18)
The cost criterion was designed on the basis of the procedure in [14]. The total cost in theoptimization procedure Csel is defined by Equation (19).
Csel = Ce,Θ,sel + Cm,sel + nc,sel ·Cc,a,sel (19)
The upper limit of cost Cmax is defined by the inequality in Equation (20).
Cmax > Ce,Θ,max + Cm,max + nc,max ·Cc,a,max (20)
The lower limit of cost Cmin is defined by the inequality in Equation (21).
Cmin < Ce,Θ,min + Cm,min + nc,min ·Cc,a,min (21)

Energies 2019, 12, 4400 12 of 22
The third objective function defines the criterion of the maximum reliability of operation.This criterion depends only on the reliability of operation of the LAB. The reliability vector Rb
has distributed five probabilities discretely, and each of them has reliability mostly above Rb > 0.5.The normalization of the reliability criterion with linear transformation is, in this case, not adequate.A Gaussian curve is used instead for the normalization of the objective function, assuming that theobjective is to ensure the highest possible reliability of operation of the LAB. The function f 3 is obtainedby Equation (22).
f3 = 1− eml·(Rb−1)2(22)
where ml is the “shape factor” on the left side of the Gaussian curve, calculated for our normalizationcase using the equation ml = ln(0.1)/(0.82 − 1)2.
The last objective function f 4 is the operational safety criterion of LABs in the BR. It refers tothe amount of released hydrogen, H2, into the BR while charging LABs. The Standard [17] dealswith the safety requirements for secondary batteries and installations. An important part of thisStandard is explosion hazards and protection against them in the BR. During the charging process ofthe LAB at Uc > 2,23 V/cell, a chemical reaction of electrolysis of water is initiated in the electrolyte.The concentration of hydrogen in the air in the BR must not exceed 4%vol (a potentially explosivemixture). The battery for a DC auxiliary system supply in the substation is recharged all the time. Thismeans the H2 concentration is increasing regularly. The solution is adequate forced ventilation of theBR. The amount of replaced air in hours is defined by Equation (23).
Qair = 5 · 10−5· nc · Igas ·Qc
[m3
h
](23)
Igas is a specific equivalent charge current producing H2 in [mA/Ah]. The thermodynamics of theelectrochemical reaction of the electrolysis of water in the electrolyte depends on the charge currentdensity [18]. With increasing charging current, the amount of H2 release also increases. The current isdependent on the lead-acid cell’s charge voltage Uc, since the conductivity is presumed to be constantin this area of charging. In the worst case, the charge voltage of the lead-acid cell is determined asUc = UDC,max/nc. The limit currents Igas = 5 mA/Ah at the voltage Uc = 2.23 V/cell and Igas = 20 mA/Ahat the voltage Uc = 2,40 V/cell are specified in the Standard [17]. Based on the two boundary points,function Igas = f (Uc) is determined by linear interpolation. Inserting this function into Equation (23),Equation (24) is obtained for the ventilation airflow Qair,sel.
Qair,sel = 5 · 10−5· nc,sel ·
(88.235 ·
UDC,max
nc,sel− 191.764
)·Qc,sel (24)
Qc,sel is the selected capacity from vector Qc. Equation (24) is normalized, and the objectivefunction in Equation (25) obtained. As with the normalization for the objective function f 3, the Gaussianbell curve function is also applied here.
f4 = 1− eml·Q2air (25)
where ml is the “shape factor”, defined by ml = ln(0.01)/502. By minimizing the objective function inEquation (25), the amount of H2 released into the BR is reduced, along with the required airflow forforced ventilation with HVAC.
Figure 3 also presents the control parameters of the DEA, i.e., the algorithm that is used in theoptimization. These parameters are the number of optimization variables D, number of members ofpopulation NP, difference factor F, crossover control parameter CR, and the maximum number ofiterations itermax.
The optimization process terminates when the algorithm reaches the maximum number ofiterations, or the deviation of the objective function is lower than ε = 1·10−6. The optimizationparameters become the optimum parameters. The vector popt = [p1,opt, p2,opt, p3,opt, p4,opt, p5,opt]
Energies 2019, 12, 4400 13 of 22
is obtained as a solution. If the parameters are decoded, we can obtain the optimum operationaltemperature Θopt = p1,opt, optimum maintenance mode mmode,opt = p2, optimum capacity of thelead-acid cell Qc,opt, optimum number of cells connected in series nc,opt, optimum duration ofautonomy taut,opt = p5,opt, and optimum costs Copt, that can be calculated using Equation (19) if optimalcosts Ce,Θ ,opt, Cm,opt in Cc,a,opt are used as parameters in this equation.
5. Two Examples of the Selection of Lead-Acid Batteries Using the Conventional Method and theOptimization Process
Two examples of the selection of LABs were performed, one for an auxiliary DC network in a smallsubstation and one for a large substation. For both examples, the selection was performed using theconventional method and the new proposed selection method with optimization. Substations differwith regard to the number of bays and loading of the DC network. Both substations have an existingDC auxiliary system. The reconstruction of the LABs is required due to the expiration of the LAB’slife. For both examples, the same settings of control parameters were used for the DEA, as well asthe boundaries of objective functions for normalizing. The control parameters for the DEA are asfollows: D = 5, NP = 50, F = 0.6, CR = 0.7 in itermax = 50, and they were determined based on previousexperience for such optimization cases. The boundaries for normalization for the objective function f 1
are taut,min = 1 h and taut,max = 8 h.For the cost criterion f 2, the boundary values for normalization are Cmin = 938 CU and
Cmax = 4000 CU. For f 3, the boundary values are 0 and 1. For the safety criterion f 4, the boundaryvalues for normalization are Qair,min = 12 m3/h and Qair,max = 100 m3/h. All four objective functions areequally weighted, α1 = α2 = α3 = α4 = 0.25.
5.1. Input Data for the Selection of Lead-Acid Batteries for Small Substations
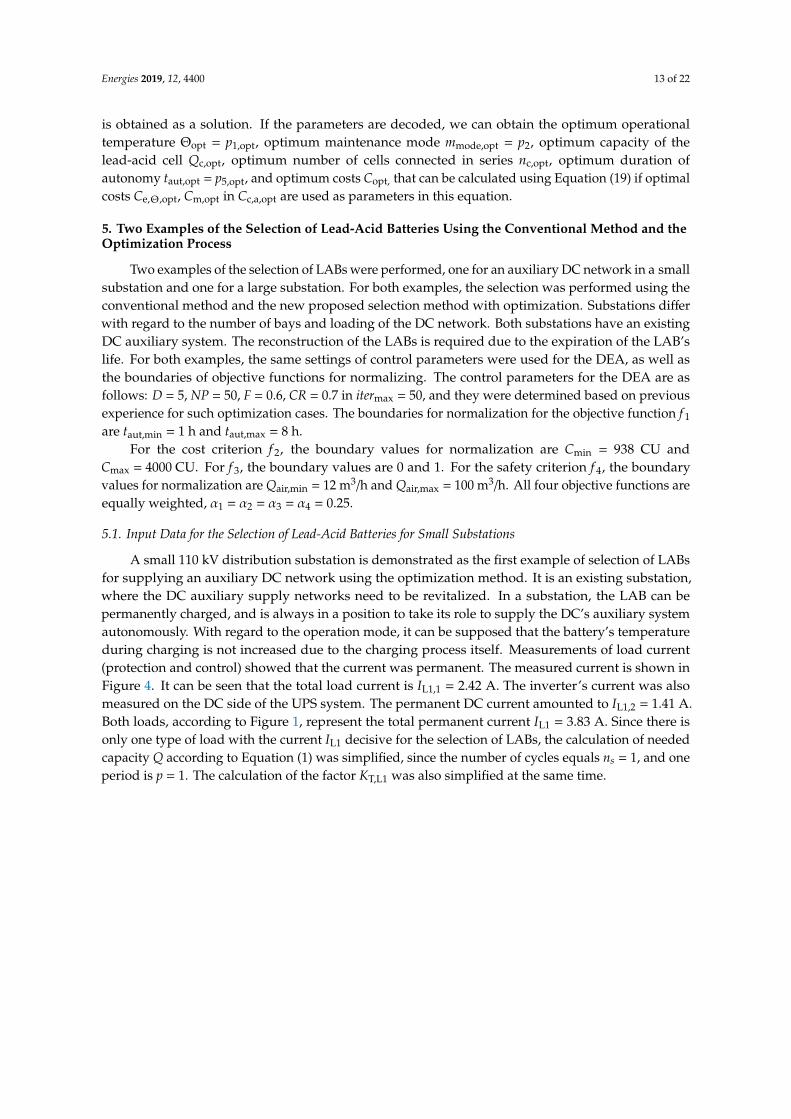
A small 110 kV distribution substation is demonstrated as the first example of selection of LABsfor supplying an auxiliary DC network using the optimization method. It is an existing substation,where the DC auxiliary supply networks need to be revitalized. In a substation, the LAB can bepermanently charged, and is always in a position to take its role to supply the DC’s auxiliary systemautonomously. With regard to the operation mode, it can be supposed that the battery’s temperatureduring charging is not increased due to the charging process itself. Measurements of load current(protection and control) showed that the current was permanent. The measured current is shown inFigure 4. It can be seen that the total load current is IL1,1 = 2.42 A. The inverter’s current was alsomeasured on the DC side of the UPS system. The permanent DC current amounted to IL1,2 = 1.41 A.Both loads, according to Figure 1, represent the total permanent current IL1 = 3.83 A. Since there isonly one type of load with the current IL1 decisive for the selection of LABs, the calculation of neededcapacity Q according to Equation (1) was simplified, since the number of cycles equals ns = 1, and oneperiod is p = 1. The calculation of the factor KT,L1 was also simplified at the same time.
Energies 2019, 12, 4400 14 of 22
Energies 2019, 12, x FOR PEER REVIEW 13 of 22
normalization are Qair,min = 12 m3/h and Qair,max = 100 m3/h. All four objective functions are equally
weighted, 1 = 2 = 3 = 4 = 0.25.
5.1. Input Data for the Selection of Lead-Acid Batteries for Small Substations
A small 110 kV distribution substation is demonstrated as the first example of selection of LABs
for supplying an auxiliary DC network using the optimization method. It is an existing substation,
where the DC auxiliary supply networks need to be revitalized. In a substation, the LAB can be
permanently charged, and is always in a position to take its role to supply the DC’s auxiliary system
autonomously. With regard to the operation mode, it can be supposed that the battery’s temperature
during charging is not increased due to the charging process itself. Measurements of load current
(protection and control) showed that the current was permanent. The measured current is shown in
Figure 4. It can be seen that the total load current is IL1,1 = 2.42 A. The inverter’s current was also
measured on the DC side of the UPS system. The permanent DC current amounted to IL1,2 = 1.41 A.
Both loads, according to Figure 1, represent the total permanent current IL1 = 3.83 A. Since there is
only one type of load with the current IL1 decisive for the selection of LABs, the calculation of needed
capacity Q according to Equation (1) was simplified, since the number of cycles equals ns = 1, and one
period is p = 1. The calculation of the factor KT,L1 was also simplified at the same time.
Figure 4. Oscillogram of the measured DC current of protection and control system’s DC auxiliary
system in a small substation.
We also measured the current during the operation of the triggering coil of the circuit breaker’s
drive. The temporal course of this current is shown in Figure 5, where we can see the highest value
of this impulse Itc = 1.63 A.
Figure 4. Oscillogram of the measured DC current of protection and control system’s DC auxiliarysystem in a small substation.
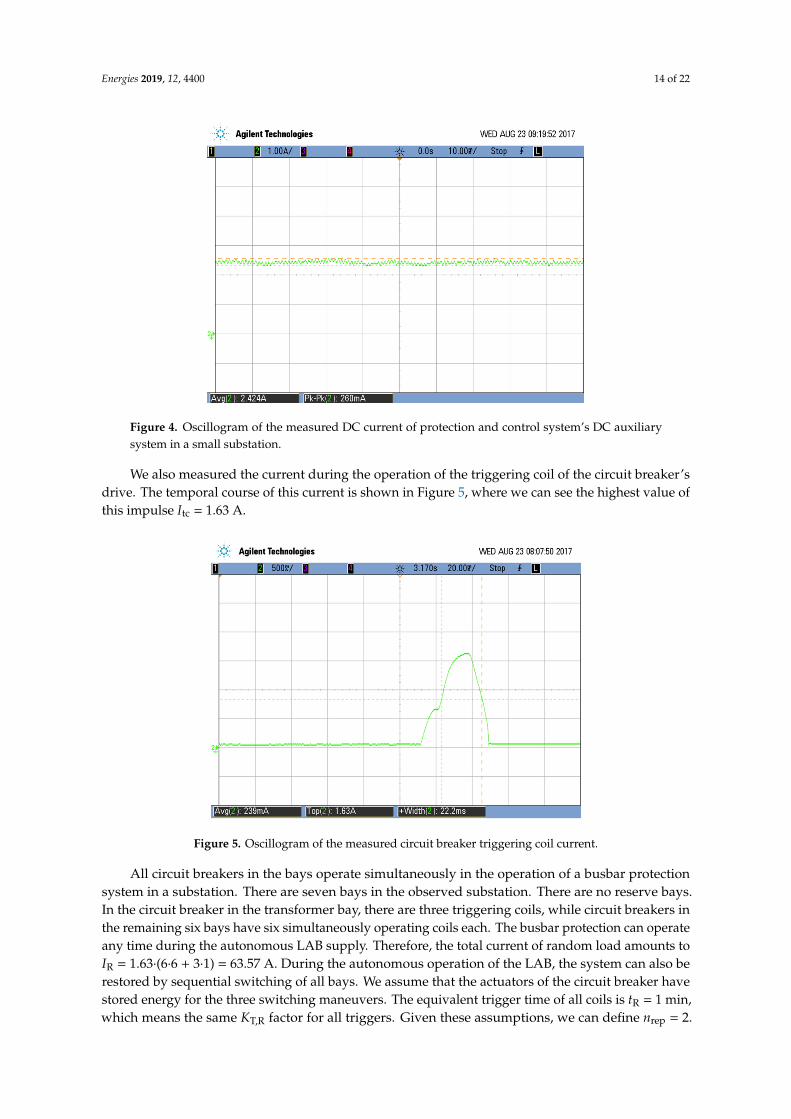
We also measured the current during the operation of the triggering coil of the circuit breaker’sdrive. The temporal course of this current is shown in Figure 5, where we can see the highest value ofthis impulse Itc = 1.63 A.Energies 2019, 12, x FOR PEER REVIEW 14 of 22
Figure 5. Oscillogram of the measured circuit breaker triggering coil current.
All circuit breakers in the bays operate simultaneously in the operation of a busbar protection
system in a substation. There are seven bays in the observed substation. There are no reserve bays.
In the circuit breaker in the transformer bay, there are three triggering coils, while circuit breakers in
the remaining six bays have six simultaneously operating coils each. The busbar protection can
operate any time during the autonomous LAB supply. Therefore, the total current of random load
amounts to IR = 1.63(66 + 31) = 63.57 A. During the autonomous operation of the LAB, the system
can also be restored by sequential switching of all bays. We assume that the actuators of the circuit
breaker have stored energy for the three switching maneuvers. The equivalent trigger time of all coils
is tR = 1 min, which means the same KT,R factor for all triggers. Given these assumptions, we can define
nrep = 2. By integrating the nrep repetition factor, we included in the LAB selection concept with
optimization the determination of the required capacity reserve to restore the system after switching
off the bays in substation. To enable their operation, the loads also define UDC,max = 250 V and minimal
load voltage UDC,min = 188 V. Let us assume that 8 h are needed to charge the second battery system.
This means that taut,max = 8 h. The minimum time of autonomy of supply is set to taut,min = 1 h. The cost
of LAB inspections in the substation is known, and amounts to Cpr = 100 CU, cost of revision amounts
to Crev = 240 CU, while the cost of the capacity test amounts to Ckp = 350 CU. The vector of maintenance
costs Cm = [1140, 790, 495, 462, 445.5] CU, is calculated on the basis of these data. The lead-acid battery
should be located in the BR. Proper BR ambient conditions are provided by the HVAC device. The
room has one outer wall with HT,BRe = 10.3 W/K. The other walls, ceiling, and floor are uninsulated,
with HT,BRnp = 87.7 W/K. The temperature in the neighboring rooms is constant, and amounts to np =
21 C. In the year 2018, a temperature profile of the outer side of the building was measured,
comprising hourly temperature readings. The temperature profile is shown in Figure 6.
Figure 5. Oscillogram of the measured circuit breaker triggering coil current.
All circuit breakers in the bays operate simultaneously in the operation of a busbar protectionsystem in a substation. There are seven bays in the observed substation. There are no reserve bays.In the circuit breaker in the transformer bay, there are three triggering coils, while circuit breakers inthe remaining six bays have six simultaneously operating coils each. The busbar protection can operateany time during the autonomous LAB supply. Therefore, the total current of random load amounts toIR = 1.63·(6·6 + 3·1) = 63.57 A. During the autonomous operation of the LAB, the system can also berestored by sequential switching of all bays. We assume that the actuators of the circuit breaker havestored energy for the three switching maneuvers. The equivalent trigger time of all coils is tR = 1 min,which means the same KT,R factor for all triggers. Given these assumptions, we can define nrep = 2.

Energies 2019, 12, 4400 15 of 22
By integrating the nrep repetition factor, we included in the LAB selection concept with optimizationthe determination of the required capacity reserve to restore the system after switching off the bays insubstation. To enable their operation, the loads also define UDC,max = 250 V and minimal load voltageUDC,min = 188 V. Let us assume that 8 h are needed to charge the second battery system. This meansthat taut,max = 8 h. The minimum time of autonomy of supply is set to taut,min = 1 h. The cost of LABinspections in the substation is known, and amounts to Cpr = 100 CU, cost of revision amounts to Crev
= 240 CU, while the cost of the capacity test amounts to Ckp = 350 CU. The vector of maintenance costsCm = [1140, 790, 495, 462, 445.5] CU, is calculated on the basis of these data. The lead-acid batteryshould be located in the BR. Proper BR ambient conditions are provided by the HVAC device. Theroom has one outer wall with HT,BRe = 10.3 W/K. The other walls, ceiling, and floor are uninsulated,with HT,BRnp = 87.7 W/K. The temperature in the neighboring rooms is constant, and amounts to Θnp
= 21 ◦C. In the year 2018, a temperature profile of the outer side of the building was measured,comprising hourly temperature readings. The temperature profile is shown in Figure 6.Energies 2019, 12, x FOR PEER REVIEW 15 of 22
Figure 6. Temperature profile of the outer side of the building in the year 2018.
The average heating and cooling number of the air conditioning device should be HC = 3.7. The
specific cost for electricity is ce = 0.124 CU/kWh. Using the procedure defined by Equations (6)–(10),
the annual electricity costs were calculated to maintain the temperature between 10 C and 25 C in
the BR. The diagram of costs for different BR temperatures is shown in Figure 7.
Figure 7. Annual costs of the heating, ventilation, and air conditioning (HVAC) device in the battery
room (BR) for various BR temperatures in a small substation.
These data are used in the optimization process for the cost Ce,. The manufacturer provides a
set of possible LAB cells’ capacities Qc = [100,150,200,250,300,350,420,490,600,800,1000,1200] Ah and
costs Cc = [91,104,115,130,148,163,185,204,235,325,378,431] CU. The manufacturer also specifies the SL
of the lead-acid cells, SL = 20 years, and operating temperature range between BR,r,min = 10 C and
BR,r,max = 25 C. The maximum charging voltage of lead-acid cells is Uc,max = 2.35 V/cell. The minimum
voltage, to which a cell can discharge, amounts to Uc,min = 1.81 V/cell.
5.2. Selection of Lead-Acid Batteries Using the Conventional Method for Small Substations
Based on the measured current DC auxiliary system loads and the current of DC auxiliary
system random loads, we have chosen the required lead-acid cell capacity using the conventional
method based on the Standard [8]. The results of the selection are shown in active Table 2. For the
LAB autonomy, the required capacity was calculated as Qc,need = 291.65 Ah. From the scale of offered
capacities from the manufacturer, we have chosen Qc = 300 Ah. It is assumed that the lead battery
operates at a temperature BR 10 C. The number of lead-acid cells connected in series is nc = 104
cells.
Figure 6. Temperature profile of the outer side of the building in the year 2018.
The average heating and cooling number of the air conditioning device should be εHC = 3.7.The specific cost for electricity is ce = 0.124 CU/kWh. Using the procedure defined by Equations(6)–(10), the annual electricity costs were calculated to maintain the temperature between 10 ◦C and 25◦C in the BR. The diagram of costs for different BR temperatures is shown in Figure 7.
Energies 2019, 12, x FOR PEER REVIEW 15 of 22
Figure 6. Temperature profile of the outer side of the building in the year 2018.
The average heating and cooling number of the air conditioning device should be HC = 3.7. The
specific cost for electricity is ce = 0.124 CU/kWh. Using the procedure defined by Equations (6)–(10),
the annual electricity costs were calculated to maintain the temperature between 10 C and 25 C in
the BR. The diagram of costs for different BR temperatures is shown in Figure 7.
Figure 7. Annual costs of the heating, ventilation, and air conditioning (HVAC) device in the battery
room (BR) for various BR temperatures in a small substation.
These data are used in the optimization process for the cost Ce,. The manufacturer provides a
set of possible LAB cells’ capacities Qc = [100,150,200,250,300,350,420,490,600,800,1000,1200] Ah and
costs Cc = [91,104,115,130,148,163,185,204,235,325,378,431] CU. The manufacturer also specifies the SL
of the lead-acid cells, SL = 20 years, and operating temperature range between BR,r,min = 10 C and
BR,r,max = 25 C. The maximum charging voltage of lead-acid cells is Uc,max = 2.35 V/cell. The minimum
voltage, to which a cell can discharge, amounts to Uc,min = 1.81 V/cell.
5.2. Selection of Lead-Acid Batteries Using the Conventional Method for Small Substations
Based on the measured current DC auxiliary system loads and the current of DC auxiliary
system random loads, we have chosen the required lead-acid cell capacity using the conventional
method based on the Standard [8]. The results of the selection are shown in active Table 2. For the
LAB autonomy, the required capacity was calculated as Qc,need = 291.65 Ah. From the scale of offered
capacities from the manufacturer, we have chosen Qc = 300 Ah. It is assumed that the lead battery
operates at a temperature BR 10 C. The number of lead-acid cells connected in series is nc = 104
cells.
Figure 7. Annual costs of the heating, ventilation, and air conditioning (HVAC) device in the batteryroom (BR) for various BR temperatures in a small substation.
Energies 2019, 12, 4400 16 of 22
These data are used in the optimization process for the cost Ce,Θ. The manufacturer providesa set of possible LAB cells’ capacities Qc = [100,150,200,250,300,350,420,490,600,800,1000,1200] Ah andcosts Cc = [91,104,115,130,148,163,185,204,235,325,378,431] CU. The manufacturer also specifies theSL of the lead-acid cells, SL = 20 years, and operating temperature range between ΘBR,r,min = 10 ◦Cand ΘBR,r,max = 25 ◦C. The maximum charging voltage of lead-acid cells is Uc,max = 2.35 V/cell. Theminimum voltage, to which a cell can discharge, amounts to Uc,min = 1.81 V/cell.
5.2. Selection of Lead-Acid Batteries Using the Conventional Method for Small Substations
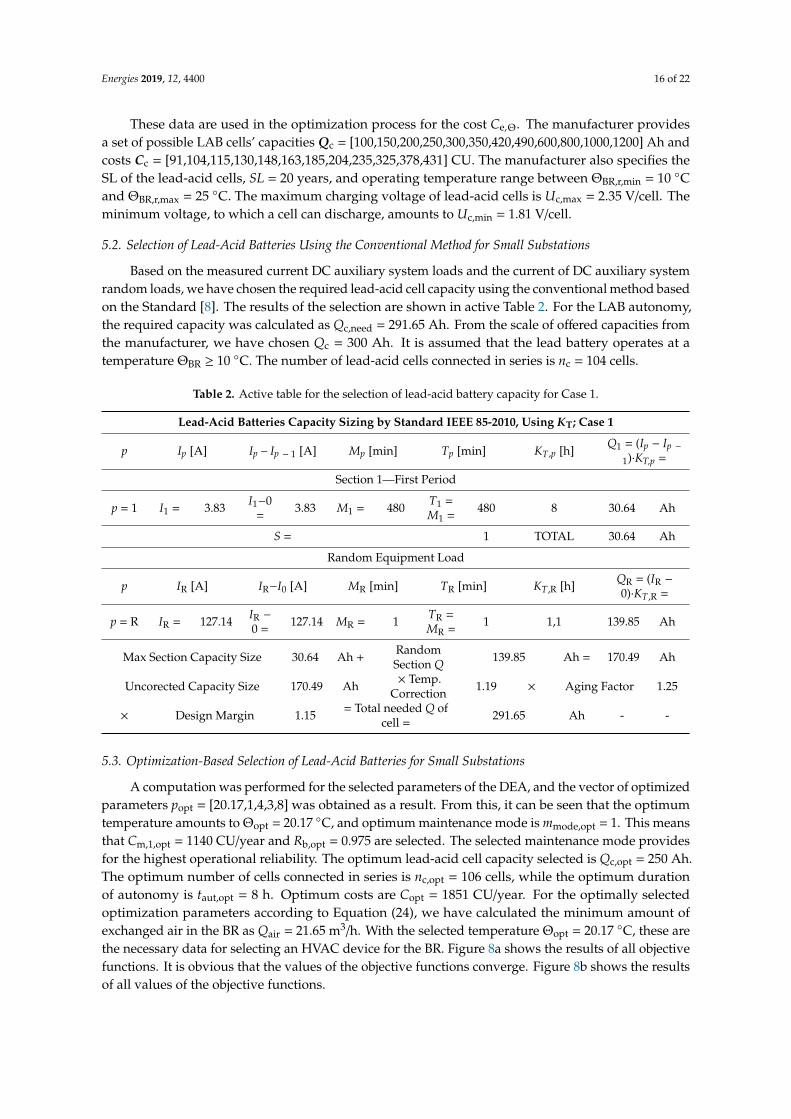
Based on the measured current DC auxiliary system loads and the current of DC auxiliary systemrandom loads, we have chosen the required lead-acid cell capacity using the conventional method basedon the Standard [8]. The results of the selection are shown in active Table 2. For the LAB autonomy,the required capacity was calculated as Qc,need = 291.65 Ah. From the scale of offered capacities fromthe manufacturer, we have chosen Qc = 300 Ah. It is assumed that the lead battery operates at atemperature ΘBR ≥ 10 ◦C. The number of lead-acid cells connected in series is nc = 104 cells.
Table 2. Active table for the selection of lead-acid battery capacity for Case 1.
Lead-Acid Batteries Capacity Sizing by Standard IEEE 85-2010, Using KT; Case 1
p Ip [A] Ip – Ip − 1 [A] Mp [min] Tp [min] KT,p [h]Q1 = (Ip − Ip −
1)·KT,p =
Section 1—First Period
p = 1 I1 = 3.83 I1−0=
3.83 M1 = 480 T1 =M1 =
480 8 30.64 Ah
S = 1 TOTAL 30.64 Ah
Random Equipment Load
p IR [A] IR−I0 [A] MR [min] TR [min] KT,R [h] QR = (IR −
0)·KT,R =
p = R IR = 127.14 IR −
0 =127.14 MR = 1 TR =
MR =1 1,1 139.85 Ah
Max Section Capacity Size 30.64 Ah +RandomSection Q 139.85 Ah = 170.49 Ah
Uncorected Capacity Size 170.49 Ah × Temp.Correction 1.19 × Aging Factor 1.25
× Design Margin 1.15 = Total needed Q ofcell =
291.65 Ah - -
5.3. Optimization-Based Selection of Lead-Acid Batteries for Small Substations
A computation was performed for the selected parameters of the DEA, and the vector of optimizedparameters popt = [20.17,1,4,3,8] was obtained as a result. From this, it can be seen that the optimumtemperature amounts to Θopt = 20.17 ◦C, and optimum maintenance mode is mmode,opt = 1. This meansthat Cm,1,opt = 1140 CU/year and Rb,opt = 0.975 are selected. The selected maintenance mode providesfor the highest operational reliability. The optimum lead-acid cell capacity selected is Qc,opt = 250 Ah.The optimum number of cells connected in series is nc,opt = 106 cells, while the optimum durationof autonomy is taut,opt = 8 h. Optimum costs are Copt = 1851 CU/year. For the optimally selectedoptimization parameters according to Equation (24), we have calculated the minimum amount ofexchanged air in the BR as Qair = 21.65 m3/h. With the selected temperature Θopt = 20.17 ◦C, these arethe necessary data for selecting an HVAC device for the BR. Figure 8a shows the results of all objectivefunctions. It is obvious that the values of the objective functions converge. Figure 8b shows the resultsof all values of the objective functions.

Energies 2019, 12, 4400 17 of 22
Energies 2019, 12, x FOR PEER REVIEW 16 of 22
Table 2. Active table for the selection of lead-acid battery capacity for Case 1.
Lead-Acid Batteries Capacity Sizing by Standard IEEE 85-2010, Using KT; Case 1
p Ip [A] Ip – Ip − 1 [A] Mp [min] Tp [min] KT,p [h] Q1 = (Ip Ip −1)KT,p =
Section 1—First Period
p = 1 I1 = 3.83 I10 = 3.83 M1 = 480 T1 = M1 = 480 8 30.64 Ah
S = 1 TOTAL 30.64 Ah
Random Equipment Load
p IR [A] IRI0 [A] MR [min] TR [min] KT,R [h] QR = (IR 0)KT,R =
p = R IR = 127.1
4
IR 0
=
127.1
4 MR = 1 TR = MR = 1 1,1 139.85 Ah
Max Section Capacity
Size 30.64 Ah + Random Section Q 139.85 Ah = 170.49 Ah
Uncorected Capacity
Size
170.4
9 Ah Temp. Correction 1.19 Aging Factor 1.25
Design Margin 1.15 = Total needed Q of cell = 291.65 Ah - -
5.3. Optimization-Based Selection of Lead-Acid Batteries for Small Substations
A computation was performed for the selected parameters of the DEA, and the vector of
optimized parameters popt = [20.17,1,4,3,8] was obtained as a result. From this, it can be seen that the
optimum temperature amounts to opt = 20.17 C, and optimum maintenance mode is mmode,opt = 1.
This means that Cm,1,opt = 1140 CU/year and Rb,opt = 0.975 are selected. The selected maintenance mode
provides for the highest operational reliability. The optimum lead-acid cell capacity selected is Qc,opt
= 250 Ah. The optimum number of cells connected in series is nc,opt = 106 cells, while the optimum
duration of autonomy is taut,opt = 8 h. Optimum costs are Copt = 1851 CU/year. For the optimally selected
optimization parameters according to Equation (24), we have calculated the minimum amount of
exchanged air in the BR as Qair = 21.65 m3/h. With the selected temperature opt = 20.17 C, these are
the necessary data for selecting an HVAC device for the BR. Figure 8a shows the results of all objective
functions. It is obvious that the values of the objective functions converge. Figure 8b shows the results
of all values of the objective functions.
Figure 8. The results of all objective functions and all objective functions values for small substation:
(a) Results of all objective functions; (b) Results of all values of the objective functions.
Figure 9 shows the courses of all five parameters during the iteration process.
Figure 8. The results of all objective functions and all objective functions values for small substation:(a) Results of all objective functions; (b) Results of all values of the objective functions.
Figure 9 shows the courses of all five parameters during the iteration process.Energies 2019, 12, x FOR PEER REVIEW 17 of 22
Figure 9. The results of optimization parameters in various iterations for a small substation.
5.4. Input Data for Selection of Lead-Acid Batteries for Large Substations
A large 400 kV/220 kV/110 kV transmission substation was selected as the second example of
selection of LABs for supplying an auxiliary DC network using the conventional and optimization
methods. This substation has line bays and transformer bays for voltage levels 110 kV, 220 kV, and
400 kV. At the 110 kV level, the substation has nine line and coupler bays and three transformer bays
(two for 110/220 kV and one for 110/400 kV). At the 220 kV, the substation has four line and coupler
bays and three transformer bays (two for 220/110 kV and one for 220/400 kV). At the 400 kV level,
there are also four line and coupler bays and two transformer bays.
Figure 10 shows the measured permanent load at the DC busbar, and represents the permanent
current IL1 = 20.4 A. The circuit breaker drives are the same as in the small substation. When the busbar
protection is activated at 110 kV, it switches off all 110 kV bays, as well as the transformer bays on
both sides of the transformers. The total current in this case amounts to IR,110 = 1.63(96 + 233) = 117.36
A. At the 220 kV level, it stays equal, while at 400 kV, it equals IR,400 = 1.63(46 + 223) = 58.68 A.
Figure 10. Oscillogram of the measured DC current of protection and control system’s DC auxiliary
system in a large substation.
In reality, it is impossible that there will be an outage at all three voltage levels at the same time.
Therefore, the maximum value of IR = 117.36 A is used as a random current. Also, in this case, during
the LABs’ autonomous operation, the system can be restored to its original state after the busbar
protection is activated. We assume the random load repetition factor nrep = 2. The BR has one insulated
wall with HT,BRe = 4.71 W/K. The other walls and ceiling are shared with the neighboring rooms
through uninsulated walls with HT,BRnp = 100.53 W/K. The heat loss coefficient to the uninsulated floor
Figure 9. The results of optimization parameters in various iterations for a small substation.
5.4. Input Data for Selection of Lead-Acid Batteries for Large Substations
A large 400 kV/220 kV/110 kV transmission substation was selected as the second example ofselection of LABs for supplying an auxiliary DC network using the conventional and optimizationmethods. This substation has line bays and transformer bays for voltage levels 110 kV, 220 kV, and400 kV. At the 110 kV level, the substation has nine line and coupler bays and three transformer bays(two for 110/220 kV and one for 110/400 kV). At the 220 kV, the substation has four line and couplerbays and three transformer bays (two for 220/110 kV and one for 220/400 kV). At the 400 kV level, thereare also four line and coupler bays and two transformer bays.
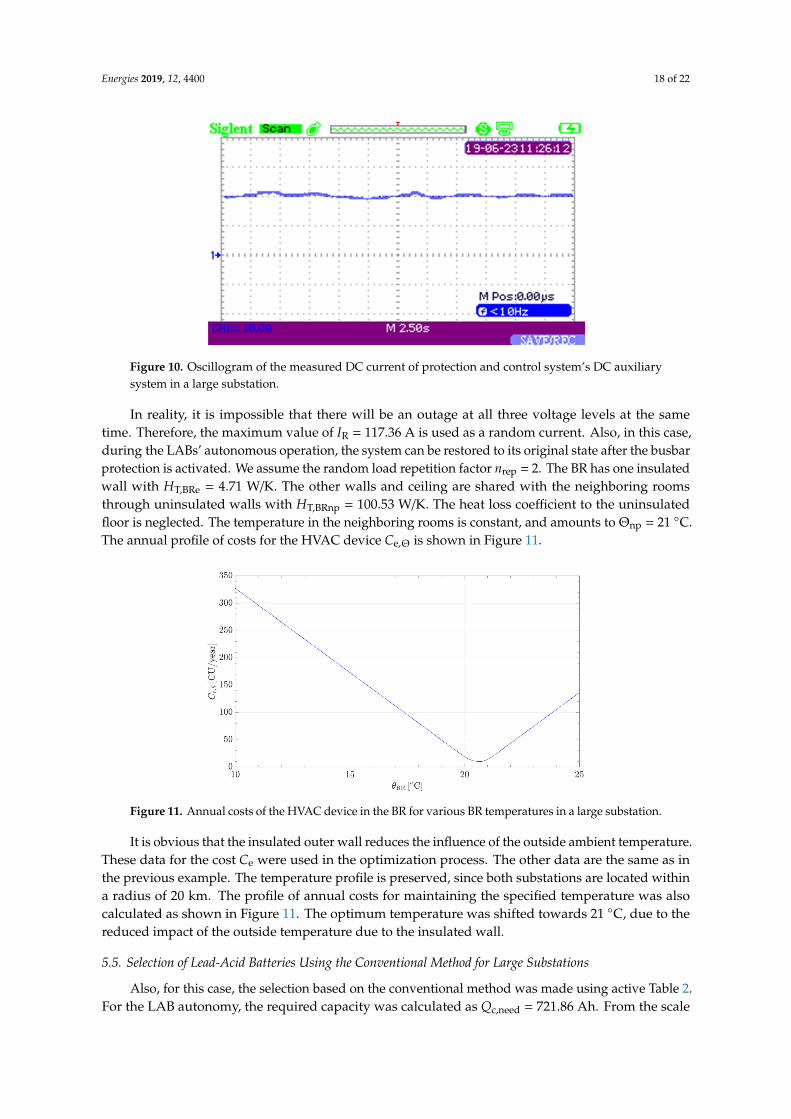
Figure 10 shows the measured permanent load at the DC busbar, and represents the permanentcurrent IL1 = 20.4 A. The circuit breaker drives are the same as in the small substation. When the busbarprotection is activated at 110 kV, it switches off all 110 kV bays, as well as the transformer bays on bothsides of the transformers. The total current in this case amounts to IR,110 = 1.63·(9·6 + 2·3·3) = 117.36 A.At the 220 kV level, it stays equal, while at 400 kV, it equals IR,400 = 1.63·(4·6 + 2·2·3) = 58.68 A.
Energies 2019, 12, 4400 18 of 22
Energies 2019, 12, x FOR PEER REVIEW 17 of 22
Figure 9. The results of optimization parameters in various iterations for a small substation.
5.4. Input Data for Selection of Lead-Acid Batteries for Large Substations
A large 400 kV/220 kV/110 kV transmission substation was selected as the second example of
selection of LABs for supplying an auxiliary DC network using the conventional and optimization
methods. This substation has line bays and transformer bays for voltage levels 110 kV, 220 kV, and
400 kV. At the 110 kV level, the substation has nine line and coupler bays and three transformer bays
(two for 110/220 kV and one for 110/400 kV). At the 220 kV, the substation has four line and coupler
bays and three transformer bays (two for 220/110 kV and one for 220/400 kV). At the 400 kV level,
there are also four line and coupler bays and two transformer bays.
Figure 10 shows the measured permanent load at the DC busbar, and represents the permanent
current IL1 = 20.4 A. The circuit breaker drives are the same as in the small substation. When the busbar
protection is activated at 110 kV, it switches off all 110 kV bays, as well as the transformer bays on
both sides of the transformers. The total current in this case amounts to IR,110 = 1.63(96 + 233) = 117.36
A. At the 220 kV level, it stays equal, while at 400 kV, it equals IR,400 = 1.63(46 + 223) = 58.68 A.
Figure 10. Oscillogram of the measured DC current of protection and control system’s DC auxiliary
system in a large substation.
In reality, it is impossible that there will be an outage at all three voltage levels at the same time.
Therefore, the maximum value of IR = 117.36 A is used as a random current. Also, in this case, during
the LABs’ autonomous operation, the system can be restored to its original state after the busbar
protection is activated. We assume the random load repetition factor nrep = 2. The BR has one insulated
wall with HT,BRe = 4.71 W/K. The other walls and ceiling are shared with the neighboring rooms
through uninsulated walls with HT,BRnp = 100.53 W/K. The heat loss coefficient to the uninsulated floor
Figure 10. Oscillogram of the measured DC current of protection and control system’s DC auxiliarysystem in a large substation.
In reality, it is impossible that there will be an outage at all three voltage levels at the sametime. Therefore, the maximum value of IR = 117.36 A is used as a random current. Also, in this case,during the LABs’ autonomous operation, the system can be restored to its original state after the busbarprotection is activated. We assume the random load repetition factor nrep = 2. The BR has one insulatedwall with HT,BRe = 4.71 W/K. The other walls and ceiling are shared with the neighboring roomsthrough uninsulated walls with HT,BRnp = 100.53 W/K. The heat loss coefficient to the uninsulatedfloor is neglected. The temperature in the neighboring rooms is constant, and amounts to Θnp = 21 ◦C.The annual profile of costs for the HVAC device Ce,Θ is shown in Figure 11.
Energies 2019, 12, x FOR PEER REVIEW 18 of 22
is neglected. The temperature in the neighboring rooms is constant, and amounts to np = 21 C. The
annual profile of costs for the HVAC device Ce, is shown in Figure 11.
Figure 11. Annual costs of the HVAC device in the BR for various BR temperatures in a large
substation.
It is obvious that the insulated outer wall reduces the influence of the outside ambient
temperature. These data for the cost Ce were used in the optimization process. The other data are the
same as in the previous example. The temperature profile is preserved, since both substations are
located within a radius of 20 km. The profile of annual costs for maintaining the specified temperature
was also calculated as shown in Figure 11. The optimum temperature was shifted towards 21 C, due
to the reduced impact of the outside temperature due to the insulated wall.
5.5. Selection of Lead-Acid Batteries Using the Conventional Method for Large Substations
Also, for this case, the selection based on the conventional method was made using active Table
2. For the LAB autonomy, the required capacity was calculated as Qc,need = 721.86 Ah. From the scale
of offered capacities from the manufacturer, we have chosen Qc = 800 Ah. It is assumed that the LAB
operates at a temperature BR 10 C. The number of lead-acid cells connected in series is nc = 104
cells.
5.6. Optimization-Based Selection of Lead-Acid Batteries for Large Substations
For the selected parameters of the DEA, another computation was performed, which yielded the
vector of optimum parameters popt = [20.65,1,9,3,8]. The optimum temperature obtained in the second
computation was opt = 20.65 C. This result is slightly different than that obtained by the first
computation. The optimum maintenance mode is also, in this case, mmode,opt = 1. The transmission
system operator should stem for the highest possible reliability. This means that Cm,1,opt = 1140
CU/year and Rb,opt = 0.975 are selected. The selected maintenance mode provides the highest reliability
of operation. The optimum lead-acid cell capacity is Qc,opt = 600 Ah. The selected capacity is so high
due to the high constant loading and the possibility of a random current. The optimum number of
cells connected in series is nc,opt = 106 cells. The optimum duration of autonomy is taut,opt = 8 h. The
optimum costs are Copt = 2397 CU/year. For the optimally selected optimization parameters according
to Equation (24), we have calculated the minimum amount of exchanged air in the BR as Qair = 51.95
m3/h. These costs are only higher due to the higher annuity for purchasing the LAB. The only
differences between the two computations are the capacities of the lead-acid cells, which is a result
of the higher current loadings of the DC network in the large substation.
Figure 12a shows the results of all objective functions for the second Case. It is obvious that the
value of the objective function converges. Figure 12b shows the results of all values of the objective
functions.
Figure 11. Annual costs of the HVAC device in the BR for various BR temperatures in a large substation.
It is obvious that the insulated outer wall reduces the influence of the outside ambient temperature.These data for the cost Ce were used in the optimization process. The other data are the same as inthe previous example. The temperature profile is preserved, since both substations are located withina radius of 20 km. The profile of annual costs for maintaining the specified temperature was alsocalculated as shown in Figure 11. The optimum temperature was shifted towards 21 ◦C, due to thereduced impact of the outside temperature due to the insulated wall.
5.5. Selection of Lead-Acid Batteries Using the Conventional Method for Large Substations
Also, for this case, the selection based on the conventional method was made using active Table 2.For the LAB autonomy, the required capacity was calculated as Qc,need = 721.86 Ah. From the scale

Energies 2019, 12, 4400 19 of 22
of offered capacities from the manufacturer, we have chosen Qc = 800 Ah. It is assumed that theLAB operates at a temperature ΘBR ≥ 10 ◦C. The number of lead-acid cells connected in series isnc = 104 cells.
5.6. Optimization-Based Selection of Lead-Acid Batteries for Large Substations
For the selected parameters of the DEA, another computation was performed, which yieldedthe vector of optimum parameters popt = [20.65,1,9,3,8]. The optimum temperature obtained in thesecond computation was Θopt = 20.65 ◦C. This result is slightly different than that obtained by the firstcomputation. The optimum maintenance mode is also, in this case, mmode,opt = 1. The transmissionsystem operator should stem for the highest possible reliability. This means that Cm,1,opt = 1140 CU/yearand Rb,opt = 0.975 are selected. The selected maintenance mode provides the highest reliability ofoperation. The optimum lead-acid cell capacity is Qc,opt = 600 Ah. The selected capacity is so highdue to the high constant loading and the possibility of a random current. The optimum numberof cells connected in series is nc,opt = 106 cells. The optimum duration of autonomy is taut,opt = 8 h.The optimum costs are Copt = 2397 CU/year. For the optimally selected optimization parametersaccording to Equation (24), we have calculated the minimum amount of exchanged air in the BR as Qair
= 51.95 m3/h. These costs are only higher due to the higher annuity for purchasing the LAB. The onlydifferences between the two computations are the capacities of the lead-acid cells, which is a result ofthe higher current loadings of the DC network in the large substation.
Figure 12a shows the results of all objective functions for the second Case. It is obvious thatthe value of the objective function converges. Figure 12b shows the results of all values of theobjective functions.Energies 2019, 12, x FOR PEER REVIEW 19 of 22
Figure 12. The results of all objective functions and all objective function values for large substation:
(a) Results of all objective functions; (b) Results of all values of the objective functions.
For each computation case, 10 individual computations were made with a DEA. The optimum
parameter differed at the fourth decimal. The objective values were compared. They also differed at
the fourth decimal. Thus, the reproducibility was ensured of the optimization algorithm results. Some
computations were also performed with the increased population NP = 75. There were no changes of
the optimum parameters. Figure 13 shows the courses of all five parameters during the iteration
process in a large substation.
Figure 13. The results of optimization parameters in various iterations for a large substation.
6. Comparison between the Conventional and New Selection Method Using Optimization
For Case 1, the selected capacity of lead-acid cells is Qc = 300 Ah using the conventional selection
method for the intended autonomy of operation. Using the new method, the selected capacity after
optimization is Qc = 250 Ah for the estimated LAB autonomy of 8 h, which is one level lower than the
selection according to the conventional method. The number of lead-acid cells is nc = 106 cells
according to the new method. According to the conventional method, it is nc = 104 cells. These
selections satisfy all the technical requirements of the Standard [8]. Selection according to the new
method is cost effective. The highest level of reliability and the lowest H2 emissions in the BR were
reached. According to the conventional method, the minimum amount of required air exchange in
the BR is Qair = 31.73 m3/h, which is 46% more than the selection using the optimization method. In
the event of a failure on the HVAC system for the BR, the gas concentration would rise earlier, with
the same mode of operation. Maintenance and explosion protection requirements are part of the
Figure 12. The results of all objective functions and all objective function values for large substation:(a) Results of all objective functions; (b) Results of all values of the objective functions.
For each computation case, 10 individual computations were made with a DEA. The optimumparameter differed at the fourth decimal. The objective values were compared. They also differedat the fourth decimal. Thus, the reproducibility was ensured of the optimization algorithm results.Some computations were also performed with the increased population NP = 75. There were nochanges of the optimum parameters. Figure 13 shows the courses of all five parameters during theiteration process in a large substation.
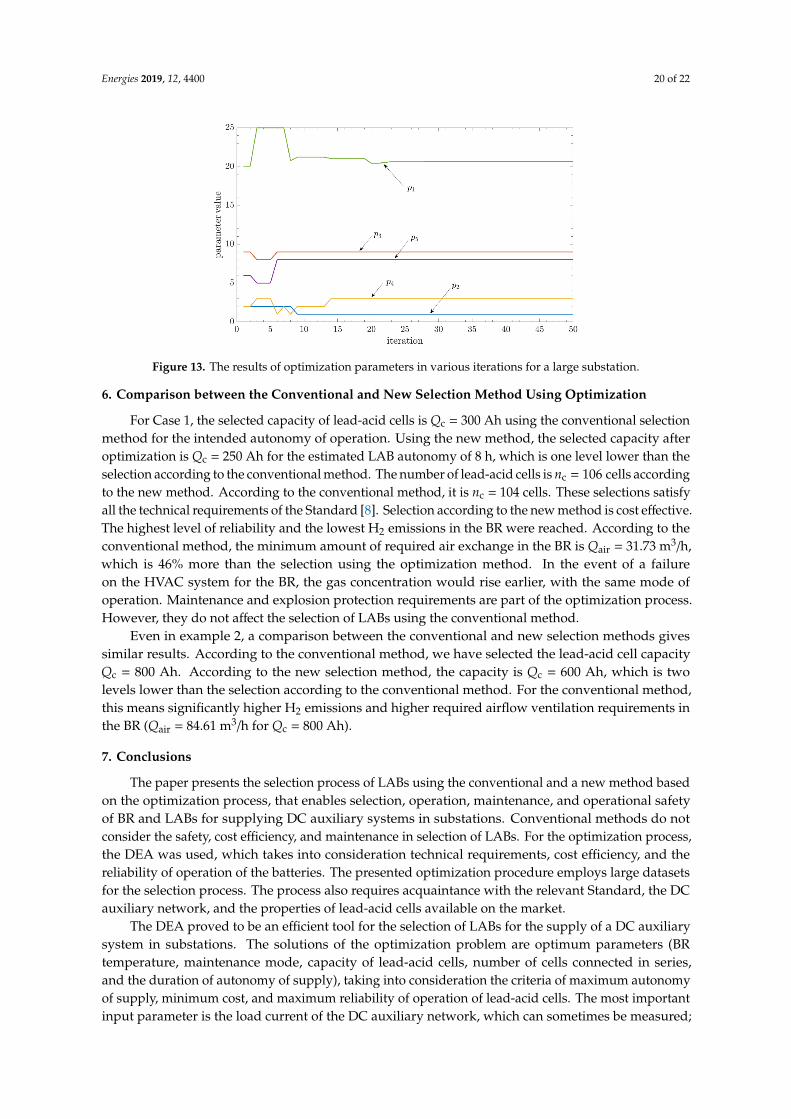
Energies 2019, 12, 4400 20 of 22
Energies 2019, 12, x FOR PEER REVIEW 19 of 22
Figure 12. The results of all objective functions and all objective function values for large substation:
(a) Results of all objective functions; (b) Results of all values of the objective functions.
For each computation case, 10 individual computations were made with a DEA. The optimum
parameter differed at the fourth decimal. The objective values were compared. They also differed at
the fourth decimal. Thus, the reproducibility was ensured of the optimization algorithm results. Some
computations were also performed with the increased population NP = 75. There were no changes of
the optimum parameters. Figure 13 shows the courses of all five parameters during the iteration
process in a large substation.
Figure 13. The results of optimization parameters in various iterations for a large substation.
6. Comparison between the Conventional and New Selection Method Using Optimization
For Case 1, the selected capacity of lead-acid cells is Qc = 300 Ah using the conventional selection
method for the intended autonomy of operation. Using the new method, the selected capacity after
optimization is Qc = 250 Ah for the estimated LAB autonomy of 8 h, which is one level lower than the
selection according to the conventional method. The number of lead-acid cells is nc = 106 cells
according to the new method. According to the conventional method, it is nc = 104 cells. These
selections satisfy all the technical requirements of the Standard [8]. Selection according to the new
method is cost effective. The highest level of reliability and the lowest H2 emissions in the BR were
reached. According to the conventional method, the minimum amount of required air exchange in
the BR is Qair = 31.73 m3/h, which is 46% more than the selection using the optimization method. In
the event of a failure on the HVAC system for the BR, the gas concentration would rise earlier, with
the same mode of operation. Maintenance and explosion protection requirements are part of the
Figure 13. The results of optimization parameters in various iterations for a large substation.
6. Comparison between the Conventional and New Selection Method Using Optimization
For Case 1, the selected capacity of lead-acid cells is Qc = 300 Ah using the conventional selectionmethod for the intended autonomy of operation. Using the new method, the selected capacity afteroptimization is Qc = 250 Ah for the estimated LAB autonomy of 8 h, which is one level lower than theselection according to the conventional method. The number of lead-acid cells is nc = 106 cells accordingto the new method. According to the conventional method, it is nc = 104 cells. These selections satisfyall the technical requirements of the Standard [8]. Selection according to the new method is cost effective.The highest level of reliability and the lowest H2 emissions in the BR were reached. According to theconventional method, the minimum amount of required air exchange in the BR is Qair = 31.73 m3/h,which is 46% more than the selection using the optimization method. In the event of a failureon the HVAC system for the BR, the gas concentration would rise earlier, with the same mode ofoperation. Maintenance and explosion protection requirements are part of the optimization process.However, they do not affect the selection of LABs using the conventional method.
Even in example 2, a comparison between the conventional and new selection methods givessimilar results. According to the conventional method, we have selected the lead-acid cell capacityQc = 800 Ah. According to the new selection method, the capacity is Qc = 600 Ah, which is twolevels lower than the selection according to the conventional method. For the conventional method,this means significantly higher H2 emissions and higher required airflow ventilation requirements inthe BR (Qair = 84.61 m3/h for Qc = 800 Ah).
7. Conclusions
The paper presents the selection process of LABs using the conventional and a new method basedon the optimization process, that enables selection, operation, maintenance, and operational safetyof BR and LABs for supplying DC auxiliary systems in substations. Conventional methods do notconsider the safety, cost efficiency, and maintenance in selection of LABs. For the optimization process,the DEA was used, which takes into consideration technical requirements, cost efficiency, and thereliability of operation of the batteries. The presented optimization procedure employs large datasetsfor the selection process. The process also requires acquaintance with the relevant Standard, the DCauxiliary network, and the properties of lead-acid cells available on the market.
The DEA proved to be an efficient tool for the selection of LABs for the supply of a DC auxiliarysystem in substations. The solutions of the optimization problem are optimum parameters (BRtemperature, maintenance mode, capacity of lead-acid cells, number of cells connected in series,and the duration of autonomy of supply), taking into consideration the criteria of maximum autonomyof supply, minimum cost, and maximum reliability of operation of lead-acid cells. The most importantinput parameter is the load current of the DC auxiliary network, which can sometimes be measured;
Energies 2019, 12, 4400 21 of 22
otherwise, it has to be assumed. We performed measurements of load current on the DC auxiliarysystem supply in two substations, the temporal course of triggering the coil current of the circuitbreakers’ drive, and the temperature profile of the area outside the substation building for the year 2018.
In every substation, the criterion of reliability of supply of the DC auxiliary system is a veryimportant factor. The LAB has to have the lowest possible number of outages during its SL.The reliability of operation is connected closely with the battery’s maintenance. The presentedcalculation results for small and large substations show that the substation operator has to performthe highest maintenance level to achieve the desired reliability. This should also be the uniform LABmaintenance concept of the substation operator. An adequate maintenance level also enables reachingthe criterion of the highest autonomy of supply of the DC network with LABs.
In the paper, the cost efficiency also includes the annual cost of electricity consumed for the HVACdevice, which depends on the BR and outside temperature. A detailed analysis was carried out ofstationary heat transfer through the BR walls to the outside. The actual measured data of outsidetemperature were used in this analysis.
The new proposed selection method of LABs using optimization combines the technicalrequirements set by the IEEE 485 Standard, cost effectiveness, operational reliability,including maintenance processes during their lifetime and safety, where H2 emissions are reducedto a minimum (up to 40% in comparison to the conventional method). Based on the comparisonbetween the conventional and new method of selection, it can be concluded that the conventionalselection method satisfies the technical criterion only. Maintenance tasks and associated reliability ofoperation are determined independently of selection. Also, the HVAC device selection for the BR ismade independently. The proposed new method using optimization includes them in the selectionprocess. Thus, we achieve the optimum choice of both LAB, as well as maintenance, operational safetyBR, and designing of HVAC.
The described concept of LAB selection could also be used for the selection of LABs for largeelectricity storage facilities used for manual frequency restoration reserves (tertiary control in the oldterminology) in the transmission system. An alternative to the use of LABs for supplying the DCauxiliary system supply in a substation could be the use of lithium titanate oxide (LTO) batteries,which have a titanium oxide electrode instead of a graphite one. Thus, a temperature escape isprevented. These batteries have similar voltage characteristics of discharging as the LABs.
Author Contributions: All authors contributed equally to all the sections of this work. Writing—original draftpreparation, J.R.; writing—review and editing, J.P., P.K., and R.M.; supervision F.K.; software, J.R. and P.K.;measurements, R.M., J.P.
Funding: The research received no external fundings.
Acknowledgments: The authors gratefully acknowledge ELES TSO for getting access to substations of ELES andproviding measurements in a DC auxiliary system, and Lead-Acid Batteries‘ Manufacturer TAB Mezica for theprovided data for lead-acid cells.
Conflicts of Interest: The authors declare no conflict of interest.
References
1. Parvini, Y.; Vahidi, A.; Fayazi, S.A. Heuristic Versus Optimal Charging of Supercapacitors,Lithium-Ion, and Lead-Acid Batteries: An Efficiency Point of View. IEEE Trans. Control Syst. Technol.2018, 26, 167–180. [CrossRef]
2. Neto, P.B.L.; Saavedra, O.R.; de Souza Ribeiro, L.A. A Dual-Battery Storage Bank Configuration for IsolatedMicrogrids Based on Renewable Sources. IEEE Trans. Sustain. Energy 2018, 9, 1618–1626. [CrossRef]
3. Gallo, D.; Landi, C.; Luiso, M.; Morello, R. Optimization of Experimental Model Parameter Identification forEnergy Storage Systems. Energies 2013, 6, 4572–4590. [CrossRef]
4. Vrettos, E.I.; Papathanassiou, S.A. Operating Policy and Optimal Sizing of a High Penetration RES-BESSSystem for Small Isolated Grids. IEEE Trans. Energy Convers. 2011, 26, 744–756. [CrossRef]
Energies 2019, 12, 4400 22 of 22
5. Salameh, Z.M.; Casacca, M.A.; Lynch, W.A. A mathematical model for lead-acid batteries. IEEE Trans. EnergyConvers. 1992, 7, 93–98. [CrossRef]
6. Papic, I. Simulation model for discharging a lead-acid battery energy storage system for load leveling.IEEE Trans. Energy Convers. 2006, 21, 608–615. [CrossRef]
7. Jancauskas, J.R.; Shook, D.A. Optimization of station battery replacement [nuclear plant]. IEEE Trans. Nuclear Sci.1994, 41, 1384–1388. [CrossRef]
8. IEEE. Recommended Practice for Sizing Lead-Acid Batteries for Stationary Applications. IEEE Std 485-2010(Revis. IEEE Std 485-1997) 2011, 1–90. [CrossRef]
9. IEEE. Guide for the Design of Low-Voltage Auxiliary Systems for Electric Power Substations. IEEE Std1818-2017 2017, 1–95. [CrossRef]
10. Sun, Y.; Jou, H.; Wu, J. Aging Estimation Method for Lead-Acid Battery. IEEE Trans. Energy Convers. 2011, 26,264–271. [CrossRef]
11. Stevanatto, L.C.; Brusamarello, V.J.; Tairov, S. Parameter Identification and Analysis of Uncertainties inMeasurements of Lead–Acid Batteries. IEEE Trans. Instrum. Meas. 2014, 63, 761–768. [CrossRef]
12. Liu, X.; Yang, Y.; He, Y.; Zhang, J.; Zheng, X.; Ma, M.; Zeng, G. A new dynamic SOH estimation of lead-acidbattery for substation application. Int. J. Energy Res. 2017, 41, 579–592. [CrossRef]
13. Azzollini, I.A. Lead-Acid Battery Modeling Over Full State of Charge and Discharge Range. IEEE Trans.Power Syst. 2018, 33, 6422–6429. [CrossRef]
14. Zhao, X.; Zhang, J.; Chen, C.; Guo, L. Operation Optimization of Standalone Microgrids Considering LifetimeCharacteristics of Battery Energy Storage System. IEEE Trans. Sustain. Energy 2013, 4, 934–943. [CrossRef]
15. Ribic, J.; Pihler, J.; Kitak, P. Impact of Electrode Shape on the Performance of a Gas Discharge Arrester.IEEE Trans. Power Deliv. 2015, 30, 463–471. [CrossRef]
16. Glotic, A.; Glotic, A.; Kitak, P.; Pihler, J.; Ticar, I. Parallel Self-Adaptive Differential Evolution Algorithm forSolving Short-Term Hydro Scheduling Problem. IEEE Trans. Power Syst. 2014, 29, 2347–2358. [CrossRef]
17. CENELEC—EN 50272-2—Safety Requirements for Secondary Batteries and Battery Installations Part 2:Stationary Batteries|Engineering360. Available online: https://standards.globalspec.com/std/418395/EN%2050272-2 (accessed on 18 October 2019).
18. Pavlov, D. Lead-Acid Batteries: Science and Technology; Elsevier: Amsterdam, The Netherlands, 2011.19. Brzezinska, D. Ventilation System Influence on Hydrogen Explosion Hazards in Industrial Lead-Acid Battery
Rooms. Energies 2018, 11, 2086. [CrossRef]20. Thompson, M.J.; Wilson, D. Auxiliary DC Control Power System Design for Substations. In Proceedings of
the 2007 60th Annual Conference for Protective Relay Engineers, College Station, TX, USA, 27–29 March 2007;pp. 522–533.
21. Kim, D.; Cha, H. Kt Factor analysis of lead-acid battery for nuclear power plant. In Proceedings of the 2013International Conference on Electrical Machines and Systems (ICEMS), Busan, Korea, 26–29 October 2013;pp. 526–529.
22. TC/SC 21, I. IEC 60896-11 Ed. 1.0 b:2002, Stationary Lead-Acid Batteries-Part 11: Vented Types-General Requirementsand Methods of Tests; IEC: Geneva, Switzerland, 2003.
23. CEN/TR 12831-2:2017. Energy, Performance of Buildings - Method for Calculation of the Design Heat Load - Part 2:Explanation and Justification. EN 12831-1; Module M3-3; CEN: Brussels, Belgium, 2017.
© 2019 by the authors. Licensee MDPI, Basel, Switzerland. This article is an open accessarticle distributed under the terms and conditions of the Creative Commons Attribution(CC BY) license (http://creativecommons.org/licenses/by/4.0/).
Related Documents