L’échantillonnage Les caractéristiques de la population sont obtenues en analysant un échantillon, c’est-à- dire une partie, souvent très petite, de la population. Comment obtenir un « bon » échantillon? Quelle est la fiabilité des résultats obtenus? Comment interpréter les résultats obtenus?

Welcome message from author
This document is posted to help you gain knowledge. Please leave a comment to let me know what you think about it! Share it to your friends and learn new things together.
Transcript
L’échantillonnage
Les caractéristiques de la population sont obtenues en analysant un échantillon, c’est-à-dire une partie, souvent très petite, de la population.Comment obtenir un « bon » échantillon?Quelle est la fiabilité des résultats obtenus?Comment interpréter les résultats obtenus?

Pourquoi prendre un échantillon
• 1) le coût: analyser toute la population coûte trop cher. Le recensement suisse de 2000 a coûté plus de 10 millions. Analyser le contenu en alcool de toutes les bouteilles de vin coûte trop cher.
• 2) le temps: écouter tous les CD pour connaître leur qualité ne peut pas se faire rapidement mais on doit prendre une décision d’achat dans un bref délai.
Types d’échantillons
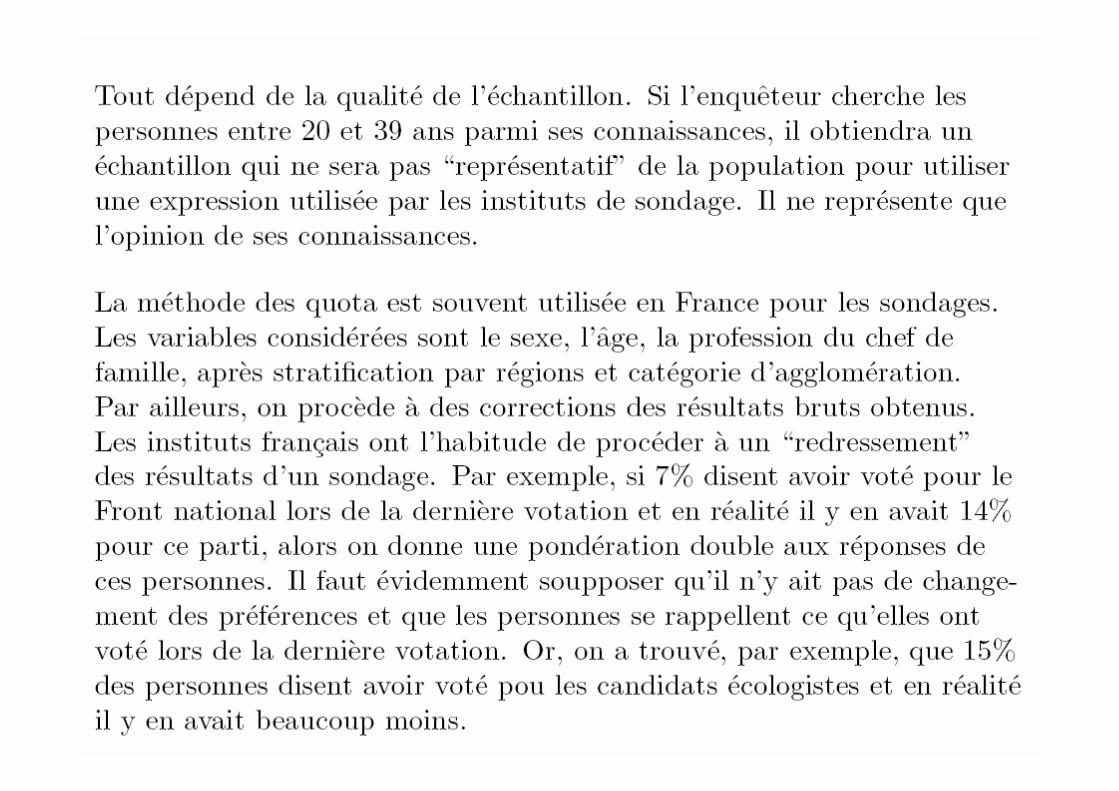
• 1) Echantillon aléatoire simple• 2) Echantillon systématique• 3) Echantillon stratifié• 4) Echantillon par grappe• 5) Echantillon à plusieurs degrés• 6) Echantillon selon la méthode des quota

Echantillon aléatoire simple
• Tous les éléments de la population ont la même probabilité de faire partie de l’échantillon.
• Si les éléments de la population sont N et ceux de l’échantillon n, la probabilité qu’un élément soit dans l’échantillon est n/N.

Exemple• On désire connaître les dépenses moyennes
des étudiants lausannois en prenant un échantillon aléatoire simple de 1000 personnes.
• En utilisant MINITAB, on met les numéros des étudiants dans C1. La commande Sample 1000 C1 C2 permet d’obtenir l’échantillon désiré.
• On peut aussi utiliser une table de nombres aléatoires.

Nombres aléatoires

Commande MINITAB
• Introduire les valeurs dans C1• Choisir dans le menu: Calc / Données
aléatoires / Echantillon des colonnes• Dans Prélever, mettre la grandeur de
l’échantillon• Dans Mémoriser les échantillons, mettre par
exemple C2• Cocher Echantillon avec remplacement si l’on
veut un échantillon non exhaustif.
Estimations de la moyenne
• 1) Méthode des moments: prendre le même moment de l’échantillon � la moyenne de l’échantillon (x) est l’estimateur de la moyenne de la population (µ).
• 2) Prendre le premier élément de l’échantillon
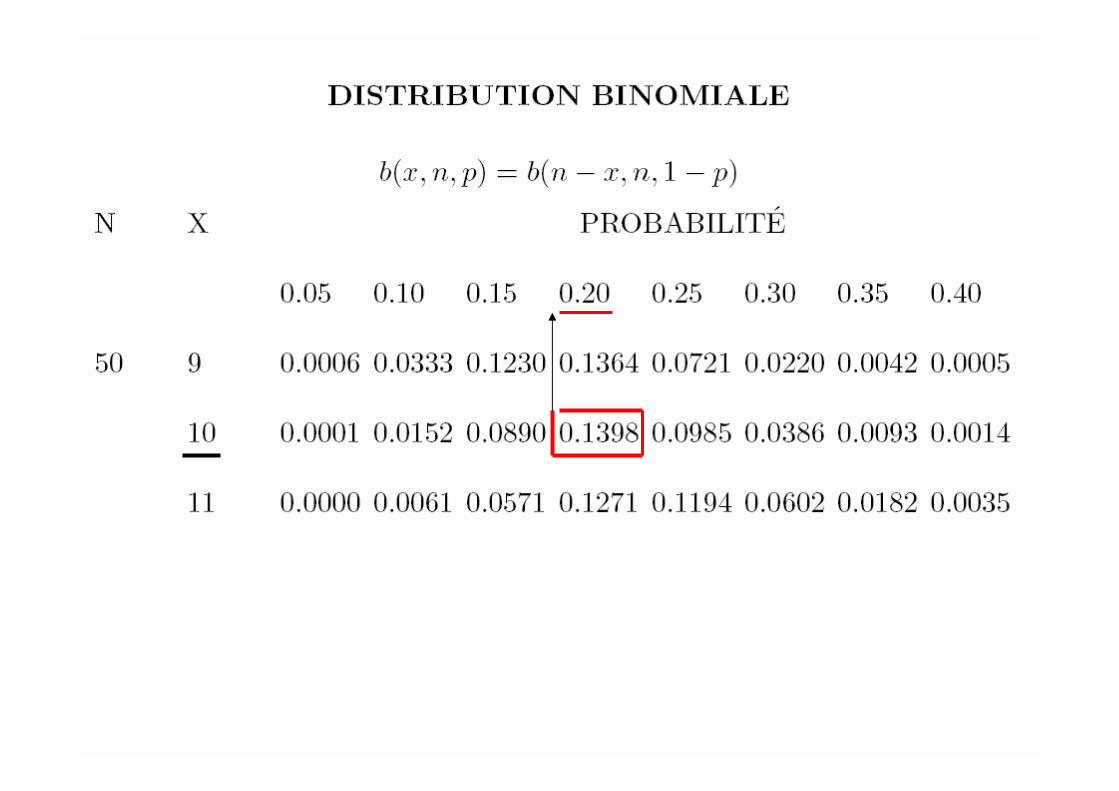
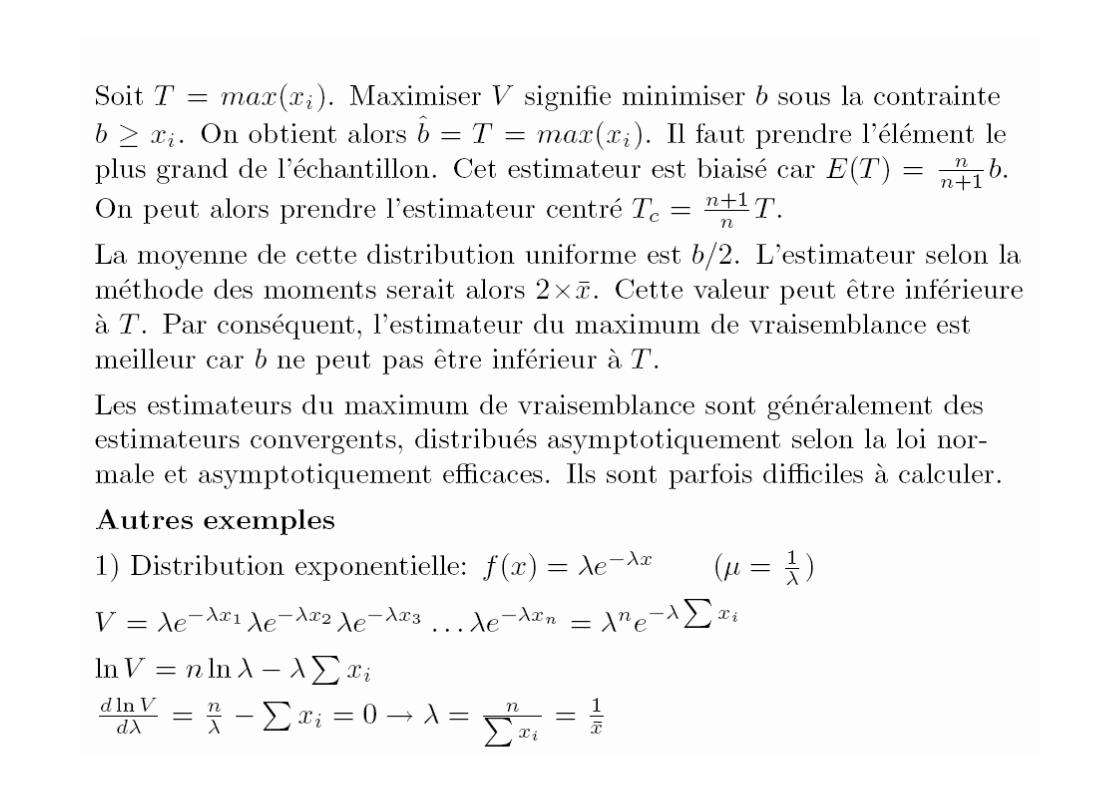
• 3) Choisir la valeur la plus probable: méthode du maximum de vraisemblance
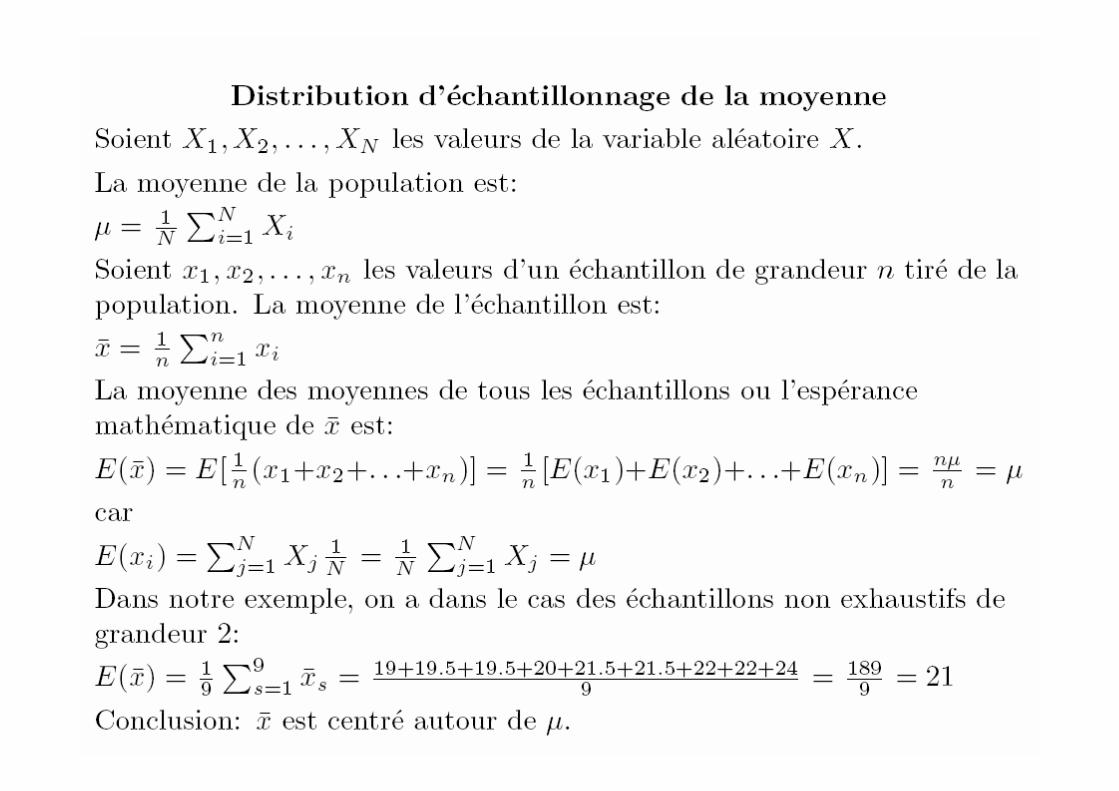
Population et échantillons
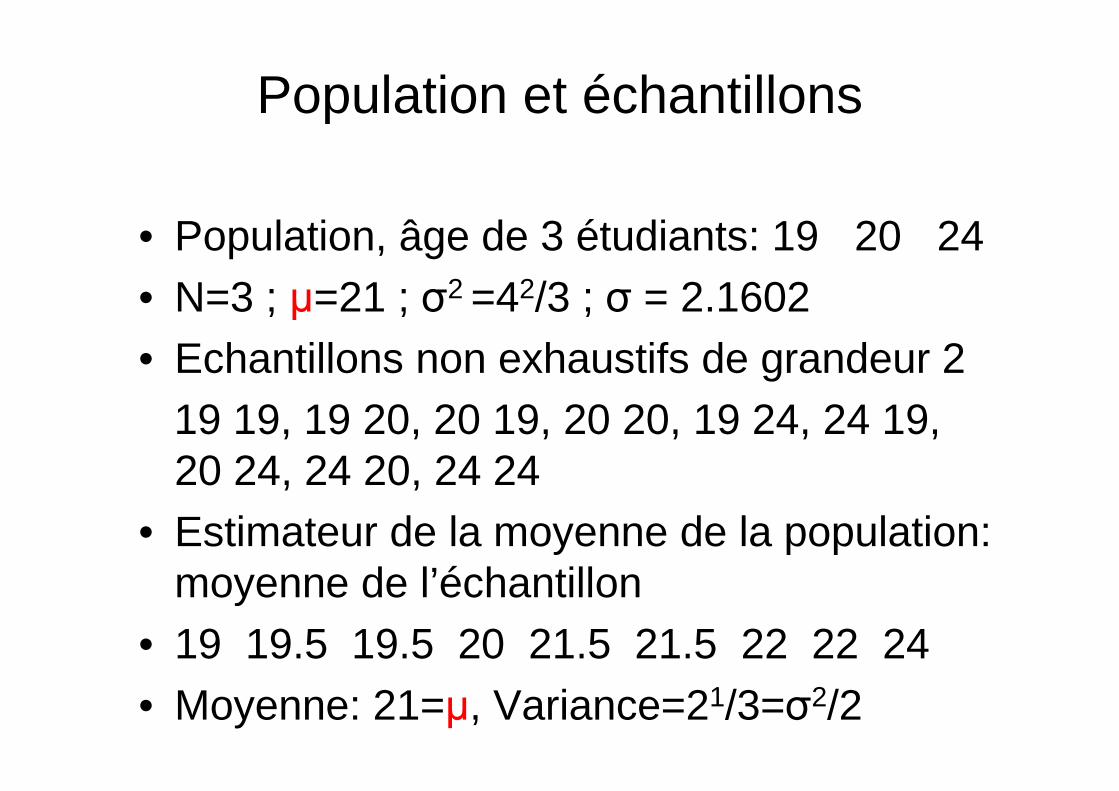
• Population, âge de 3 étudiants: 19 20 24• N=3 ; µ=21 ; σ2 =42/3 ; σ = 2.1602• Echantillons non exhaustifs de grandeur 2
19 19, 19 20, 20 19, 20 20, 19 24, 24 19, 20 24, 24 20, 24 24
• Estimateur de la moyenne de la population: moyenne de l’échantillon
• 19 19.5 19.5 20 21.5 21.5 22 22 24• Moyenne: 21=µ, Variance=21/3=σ2/2

Population et échantillons
• Population: 19 20 24• N=3 ; µ=21 ; σ2 =42/3 ; σ = 2.1602• Echantillons non exhaustifs de grandeur 2• 19 19, 19 20, 20 19, 20 20, 19 24, 24 19,
20 24, 24 20, 24 24• Estimateur de la moyenne de la population:
première valeur de l’échantillon• 19 19 20 20 19 24 20 24 24• Moyenne: 21=µ, Variance=42/3=σ2
Population et échantillons
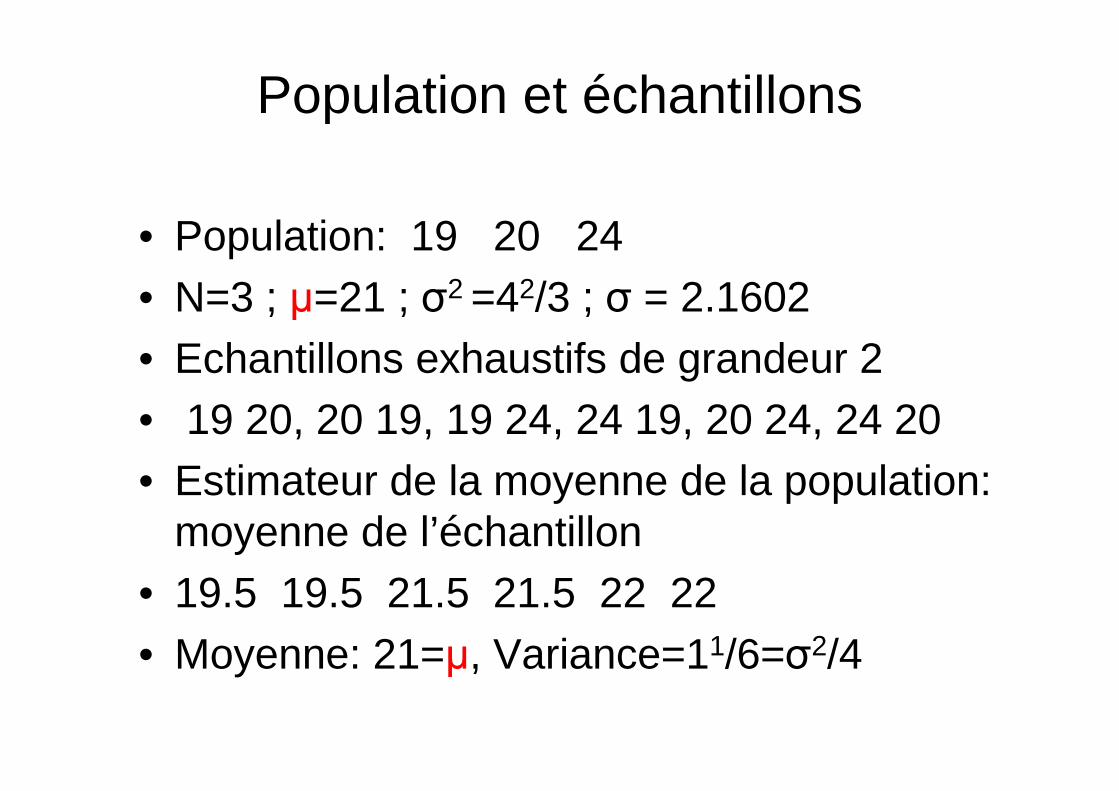
• Population: 19 20 24• N=3 ; µ=21 ; σ2 =42/3 ; σ = 2.1602• Echantillons exhaustifs de grandeur 2• 19 20, 20 19, 19 24, 24 19, 20 24, 24 20• Estimateur de la moyenne de la population:
moyenne de l’échantillon• 19.5 19.5 21.5 21.5 22 22• Moyenne: 21=µ, Variance=11/6=σ2/4
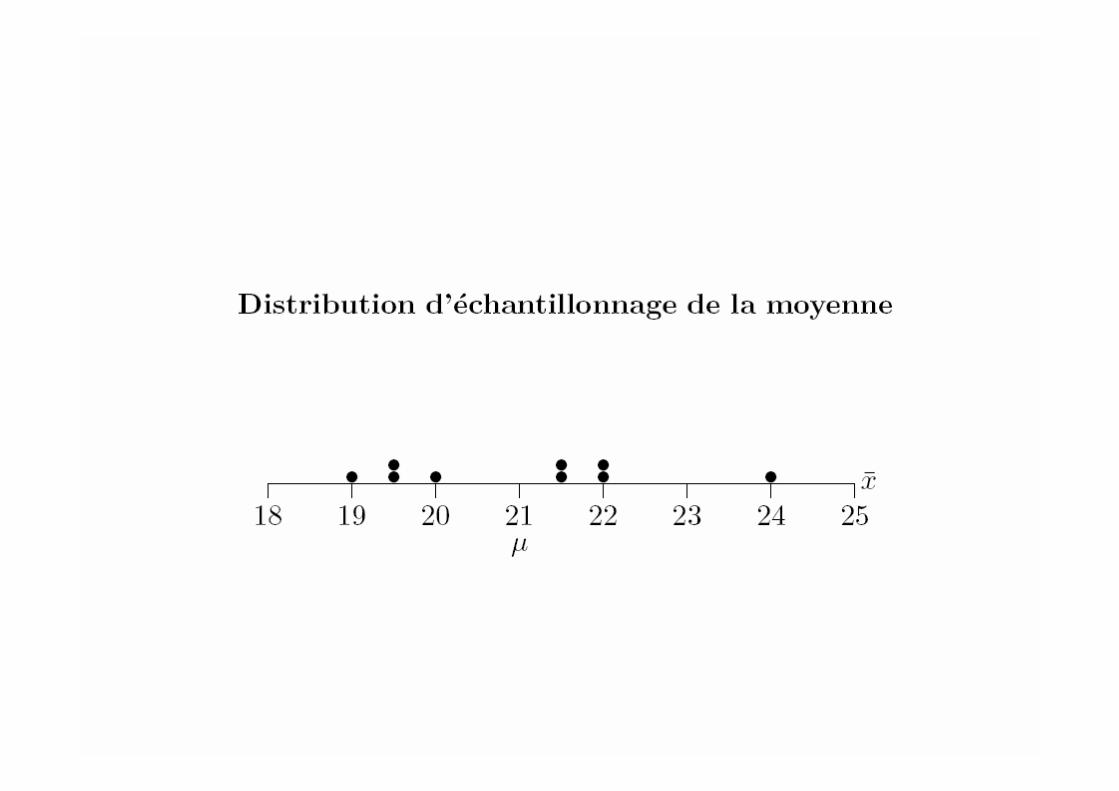
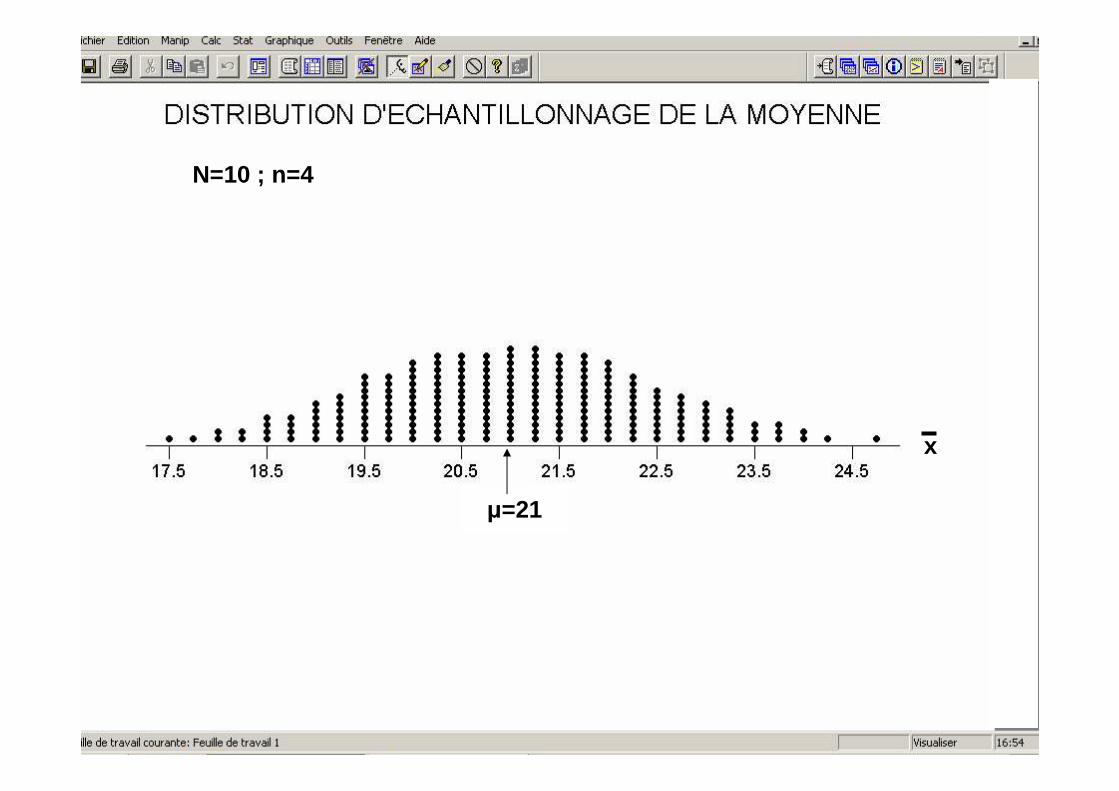
µ=21
x
N=10 ; n=4
Conclusions• 1) L’estimation n’est pas précise mais les
valeurs obtenues sont centrées autour de la moyenne de la population
• 2) La variance des moyennes des échantillons est plus petite que celle des valeurs de la population.
• 3) La variance du premier élément de l’échantillon est égale à la variance des valeurs de la population. Estimateur peu précis.


Ne pas confondre
• 1) : variance (corrigée) des éléments de l’échantillon.
• 2) : variance de la moyenne de l’échantillon. Elle indique comment la moyenne peut varier d’un échantillon à l’autre
∑ −−
= 22 )(1
1xx
ns i
nxVar
x
22)(
σσ ==
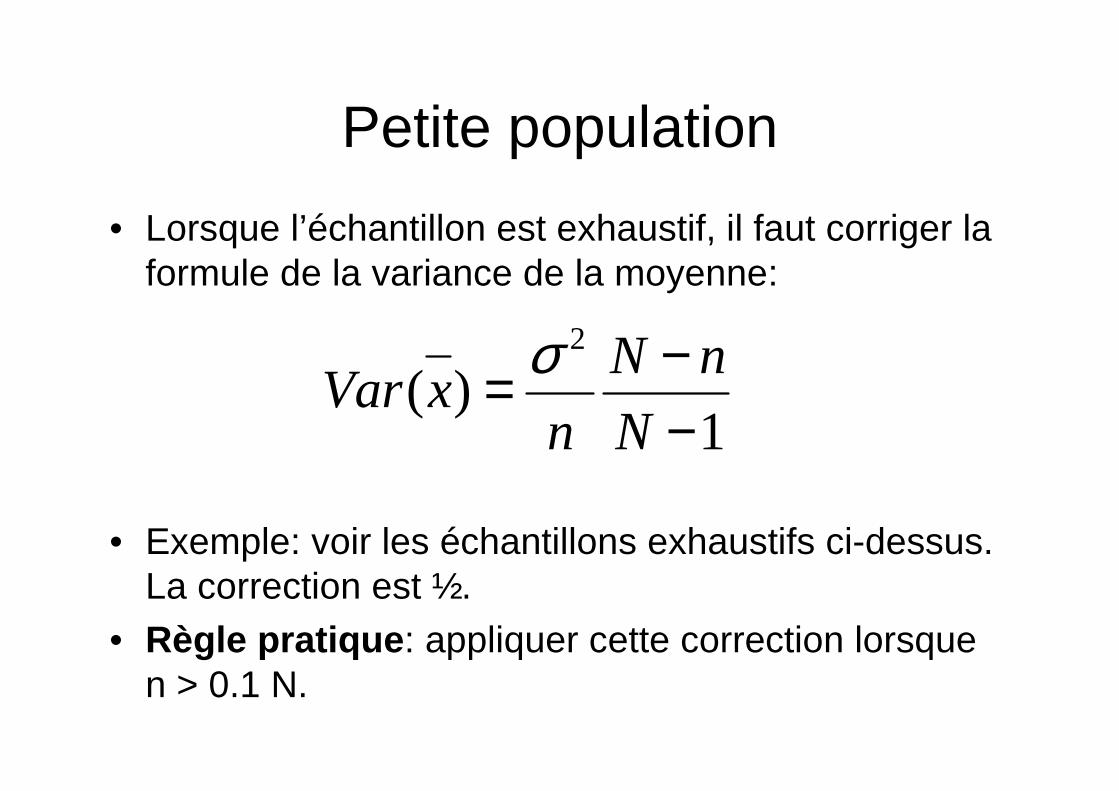
Petite population
• Lorsque l’échantillon est exhaustif, il faut corriger la formule de la variance de la moyenne:
• Exemple: voir les échantillons exhaustifs ci-dessus. La correction est ½.
• Règle pratique : appliquer cette correction lorsque n > 0.1 N.
1)(
2
−−=
N
nN
nxVar
σ
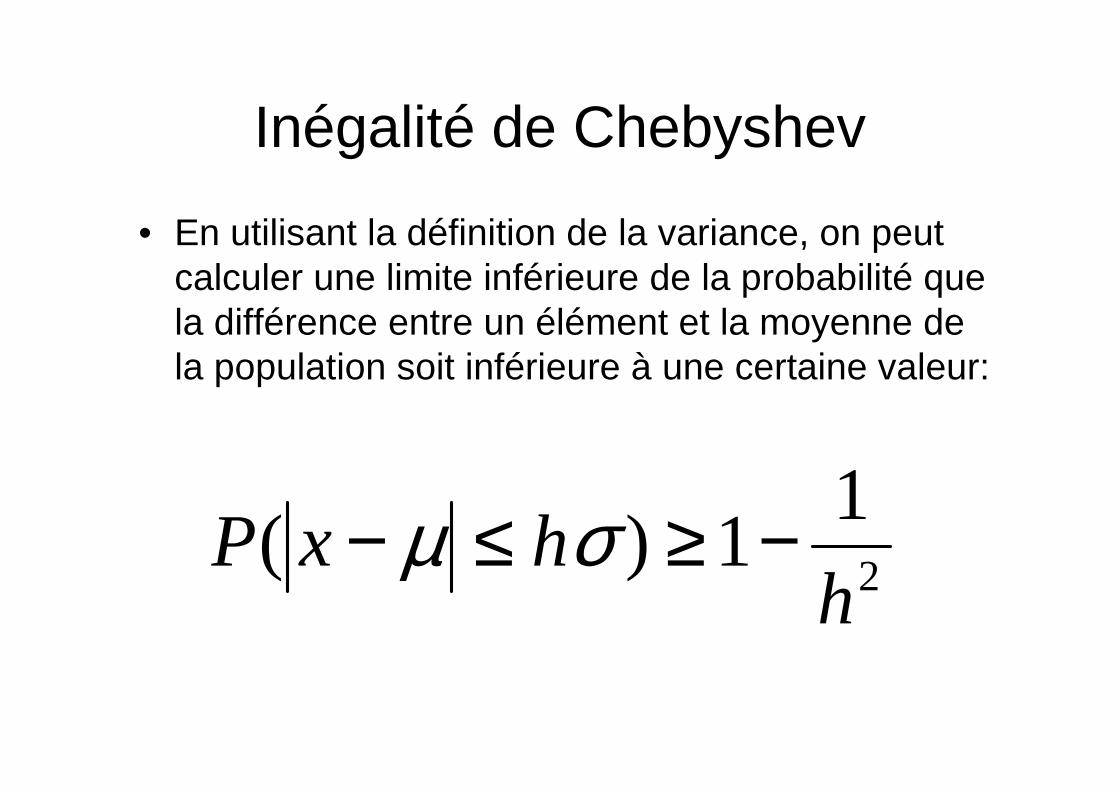
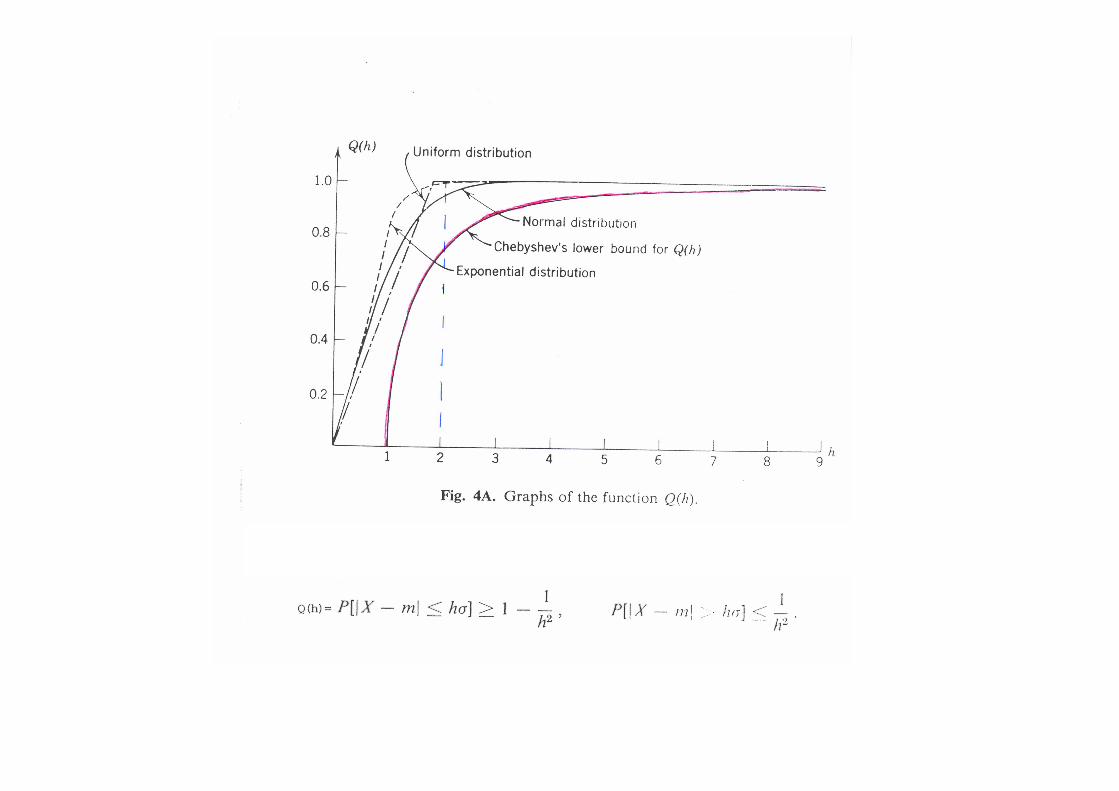
Inégalité de Chebyshev
• En utilisant la définition de la variance, on peut calculer une limite inférieure de la probabilité que la différence entre un élément et la moyenne de la population soit inférieure à une certaine valeur:
2
11)(
hhxP −≥≤− σµ

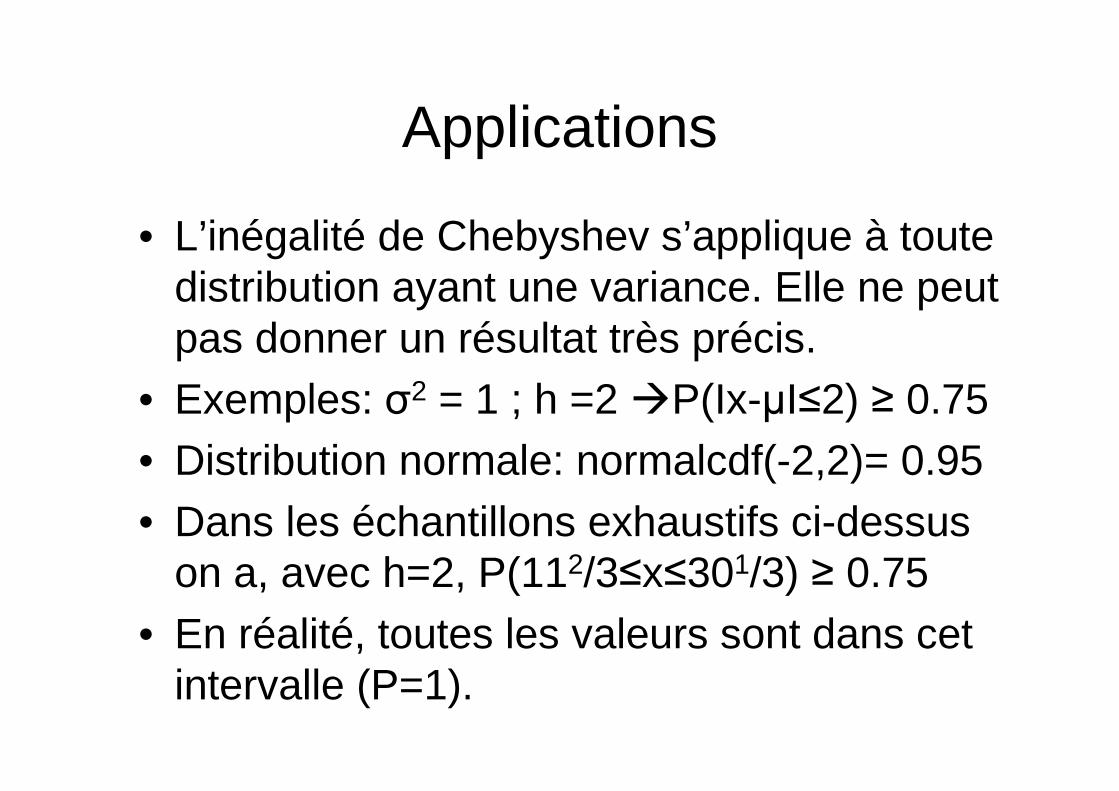
Applications
• L’inégalité de Chebyshev s’applique à toute distribution ayant une variance. Elle ne peut pas donner un résultat très précis.
• Exemples: σ2 = 1 ; h =2 �P(Ix-µI≤2) ≥ 0.75• Distribution normale: normalcdf(-2,2)= 0.95• Dans les échantillons exhaustifs ci-dessus
on a, avec h=2, P(112/3≤x≤301/3) ≥ 0.75• En réalité, toutes les valeurs sont dans cet
intervalle (P=1).

Loi des grands nombres• La moyenne de l’échantillon a une distribution avec
moyenne µ et écart-type σ/√n . En utilisant l’inégalitéde Chebyshev on a:
• Soit δ=1/h2 ; ε=hσ/√n (n=σ2/δε2). Si n>σ2/δε2, ε>0 et 0 < δ < 1 on obtient:
• P(-ε < xn – µ < ε) > 1-δ
• La probabilité que xn dévie de µ de moins que ε peut être aussi près de 1 qu’on veut. Il suffit de choisir une valeur de n suffisamment grande.
2/11)//( hnhxnhP −≥≤−≤− σµσ

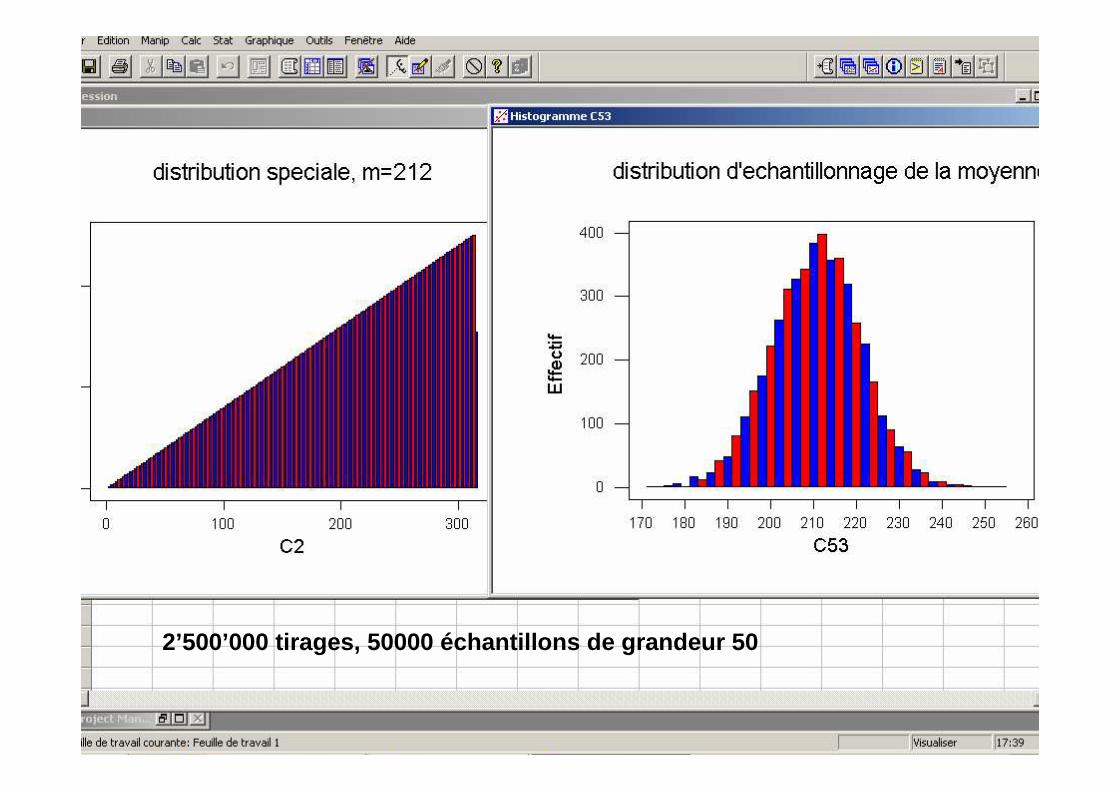
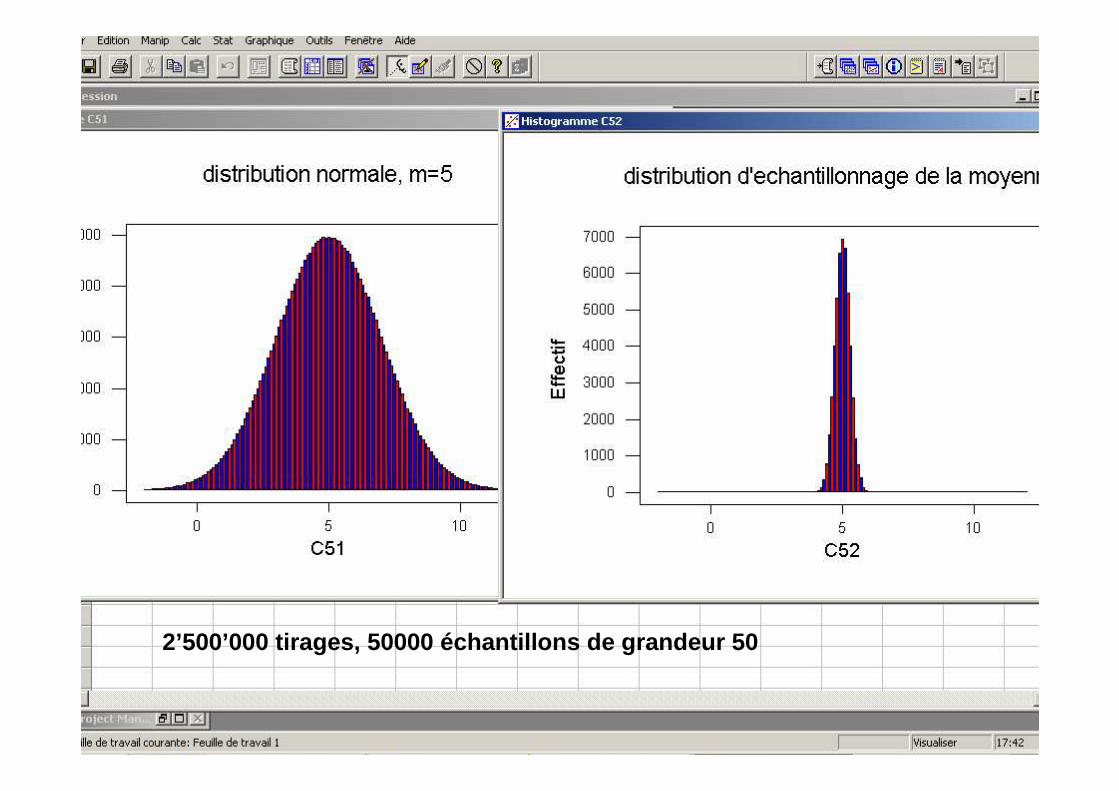
Théorème limite central
• Soit une distribution quelconque avec moyenne µ et écart-type σ. On tire un échantillon de grandeur n. La distribution de la moyenne de l’échantillon approchera une distribution normale avec moyenne µ et écart-type σ/√n lorsque n tend vers l’infini.
• On a déjà une bonne approximation lorsque n > 30.

•
2’500’000 tirages [binompdf(10,0.1,x)], 50’000 écha ntillons de grandeur 50
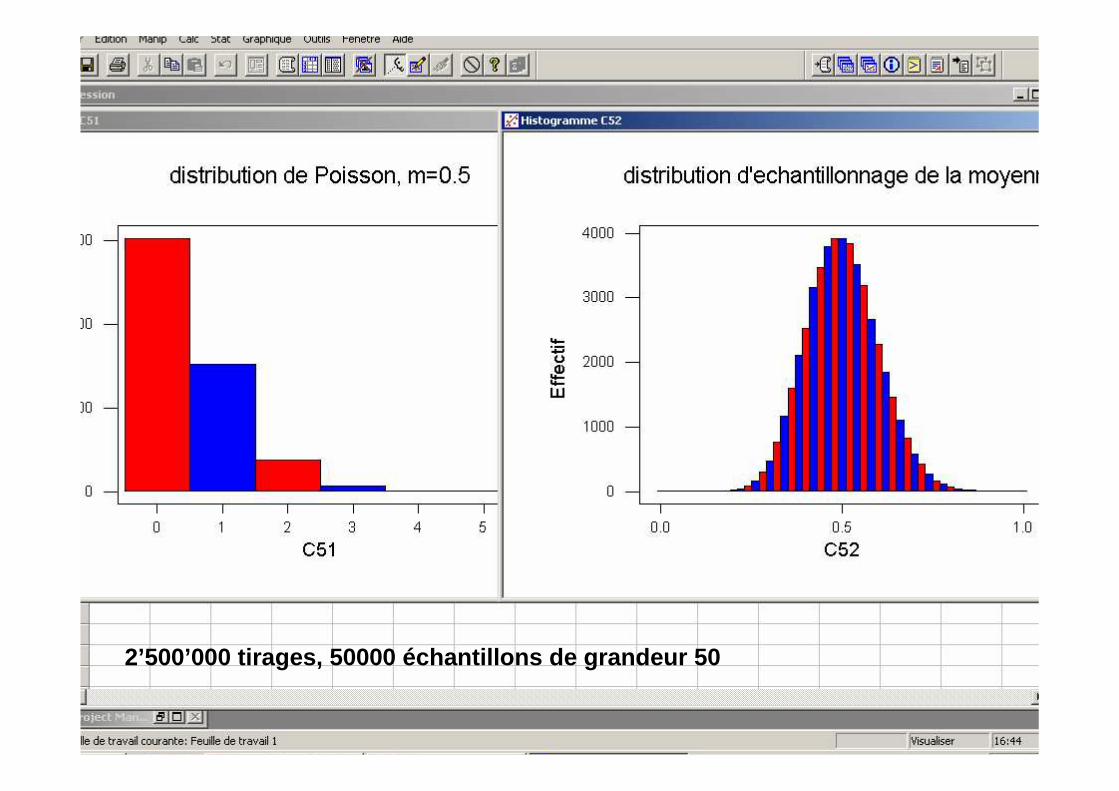
2’500’000 tirages, 50000 échantillons de grandeur 5 0

2’500’000 tirages (entiers 0-10), 50000 échantillon s de grandeur 50

•
2’500’000 tirages, 50000 échantillons de grandeur 5 0

2’500’000 tirages, 50000 échantillons de grandeur 5 0

•
2’500’000 tirages, 50000 échantillons de grandeur 5 0
2’500’000 tirages, 50000 échantillons de grandeur 5 0
•
2’500’000 tirages, 50000 échantillons de grandeur 5 0

•
2’500’000 tirages, 50’000 échantillons de grandeur 50

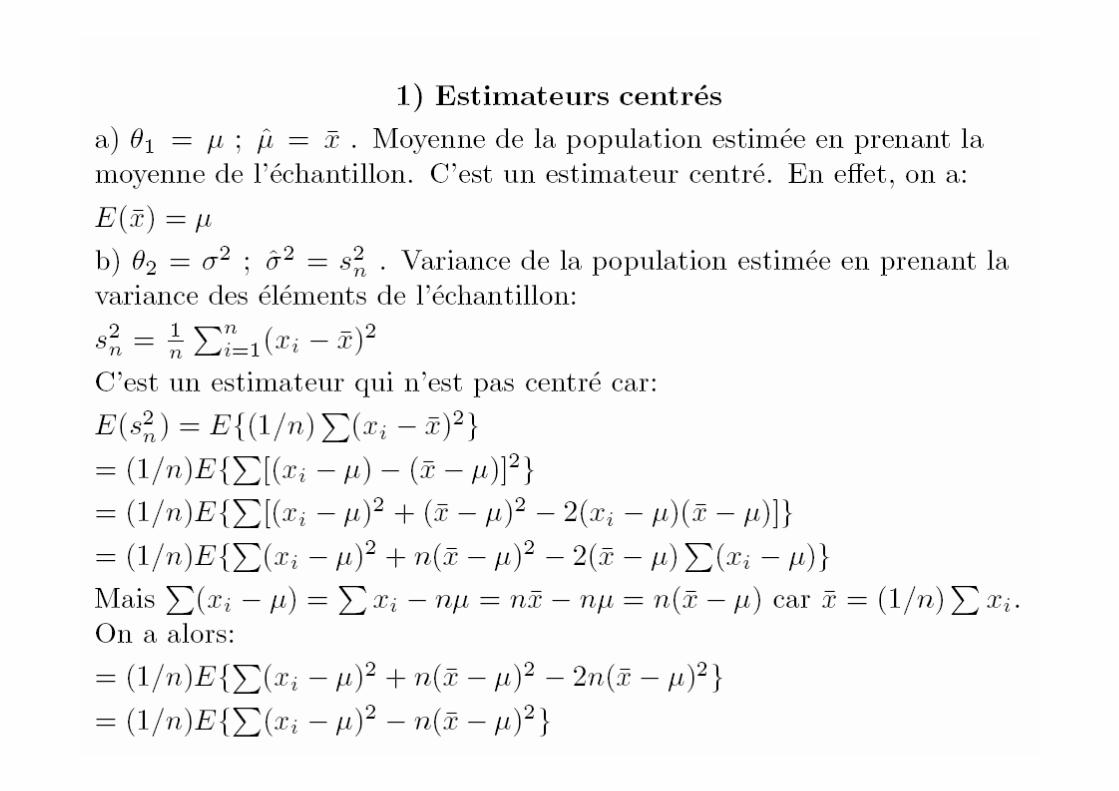
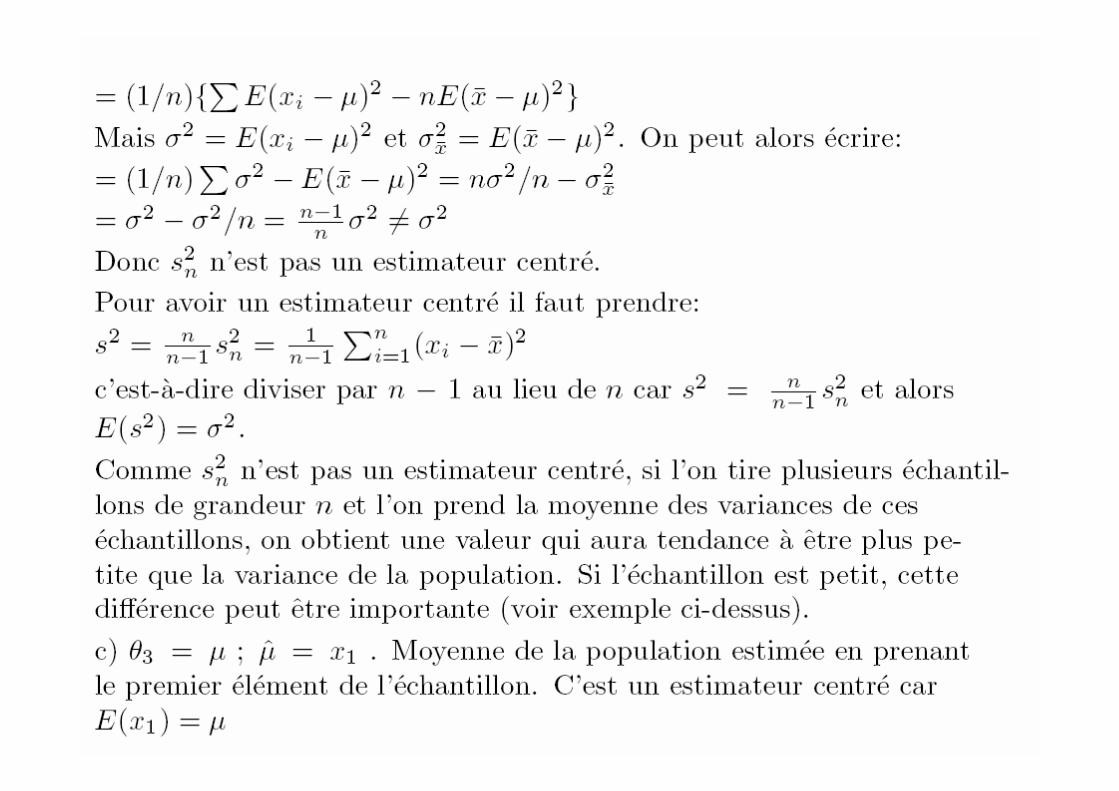
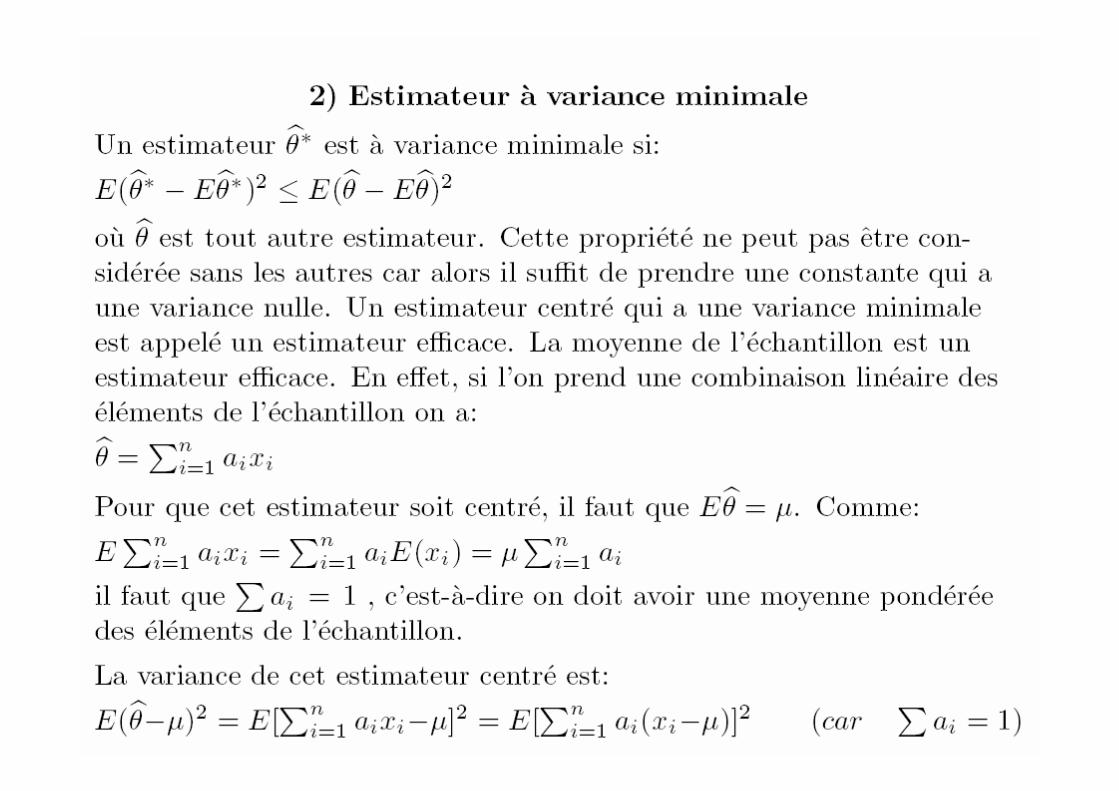
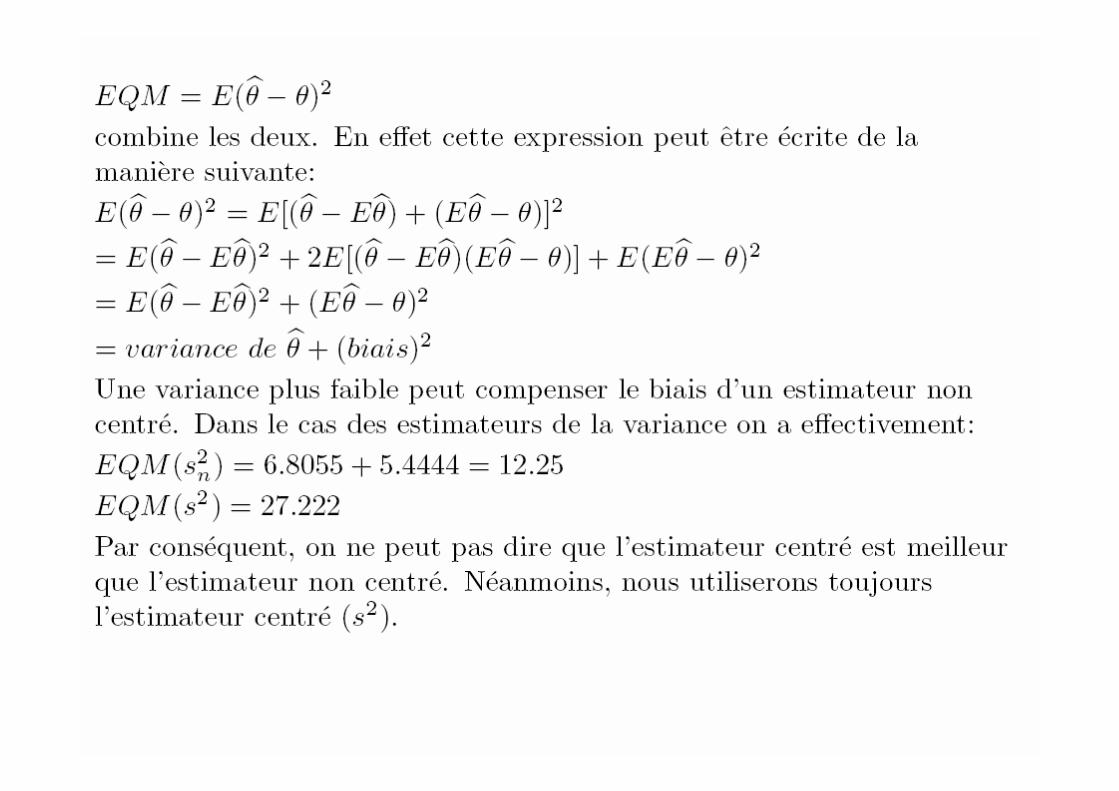
Estimation• Un estimateur du paramètre θ est une fonction
des éléments de l’échantillon:• θ = f(x1,x2,…,xn)• Propriétés désirables:• 1) centré ou sans biais: E( θ )=θ• 2) variance minimale: E[θ* -Eθ*]2 ≤ E[θ-Eθ]2
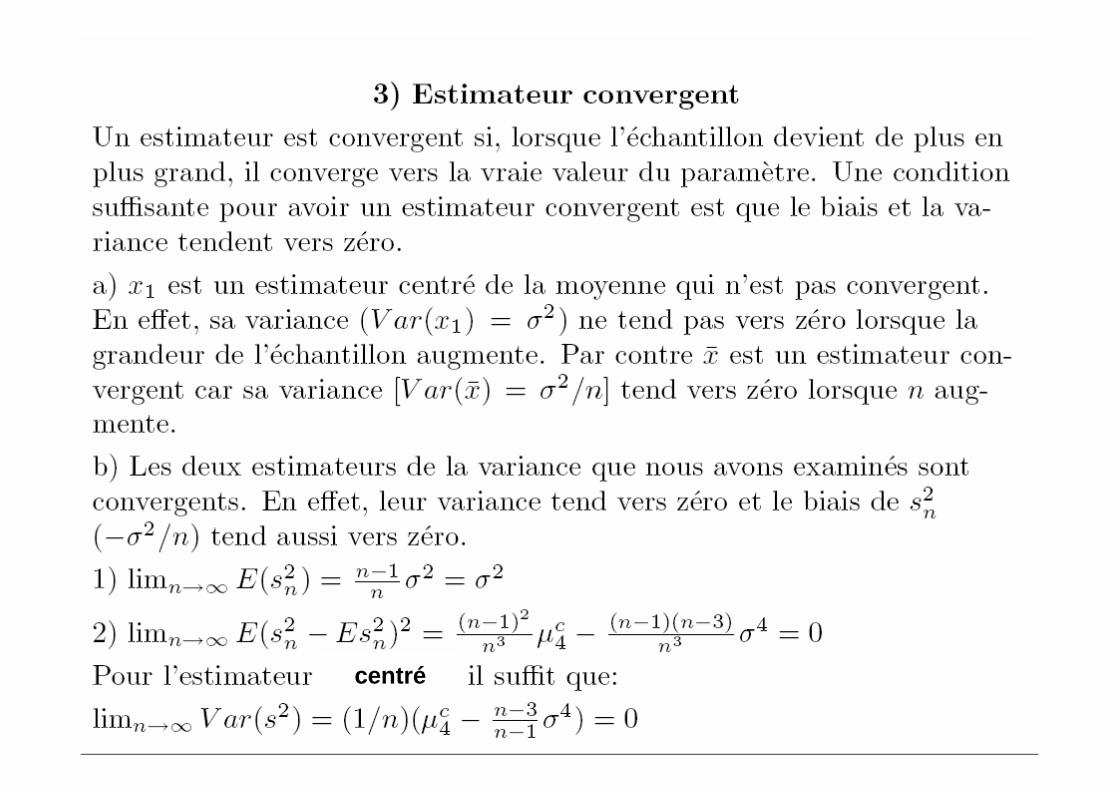
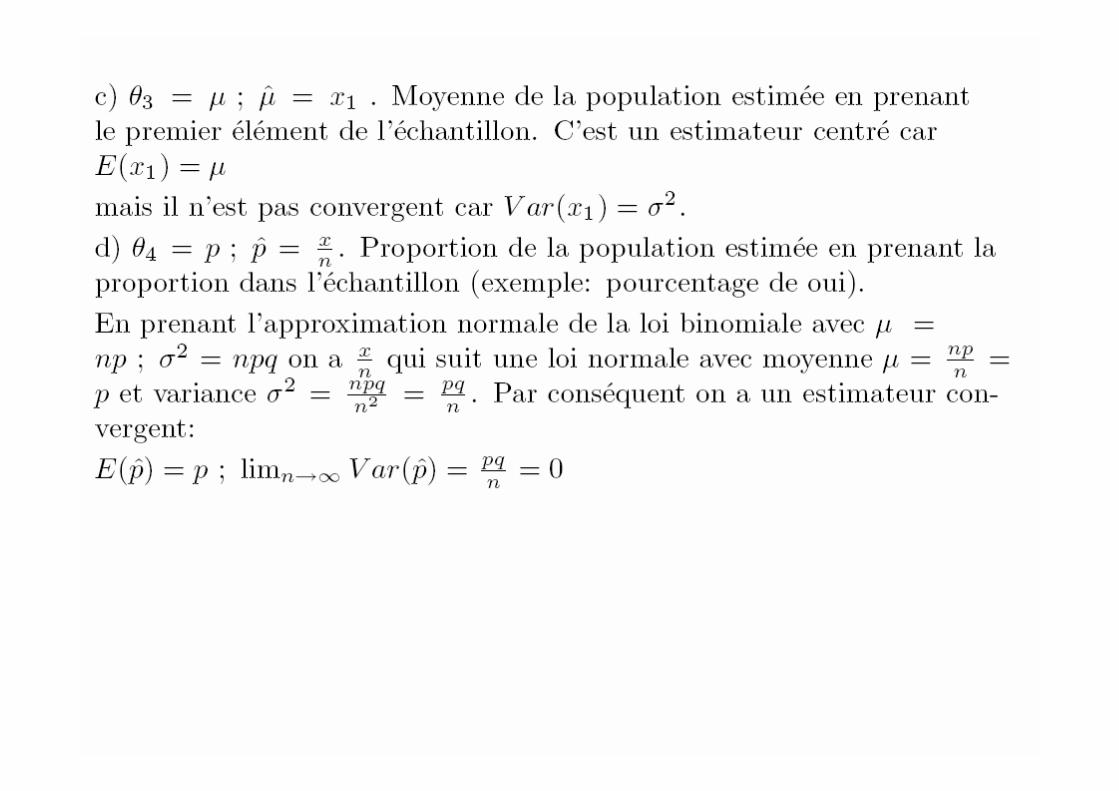
• 3) convergent: P lim (I θn-θ I < ε) = 1n ����∞∞∞∞

Population et échantillons
• Population: 19 20 24• N=3 ; µ=21 ; σ2 =42/3 ; σ = 2.1602
• Echantillons non exhaustifs de grandeur 219 19, 19 20, 20 19, 20 20, 19 24, 24 19, 20 24, 24 20, 24 24
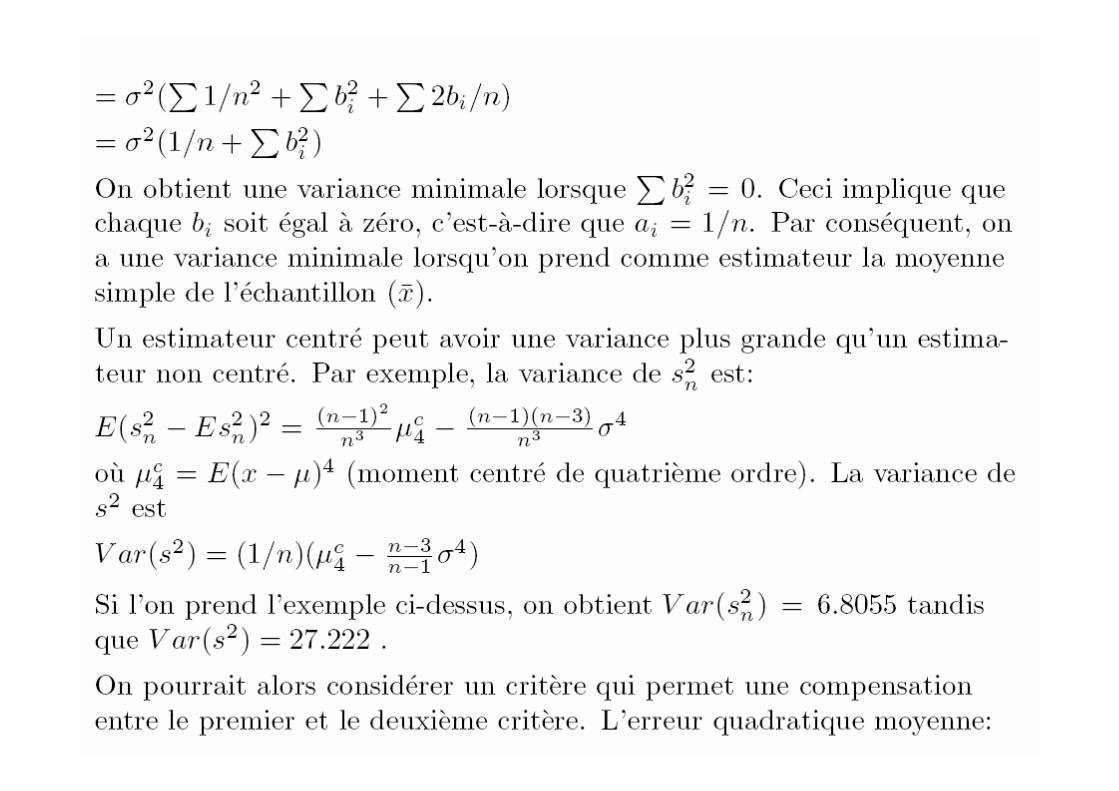
• Estimateur de la variance de la population: variance de l’échantillon:
• 0 0.25 0.25 0 6.25 6.25 4 4 0
• Moyenne: 21/3=σ2/2 , Variance=6.8055
n
xxs i
n∑ −
=2
2 )(

Population et échantillons
• Population: 19 20 24• N=3 ; µ=21 ; σ2 =42/3 ; σ = 2.1602
• Echantillons non exhaustifs de grandeur 219 19, 19 20, 20 19, 20 20, 19 24, 24 19, 20 24, 24 20, 24 24
• Estimateur de la variance de la population: variance corrigée de l’échantillon:
• 0 0.5 0.5 0 12.5 12.5 8 8 0
• Moyenne: 42/3=σ2 , Variance=27.222
1
)( 22
−−
= ∑n
xxs i
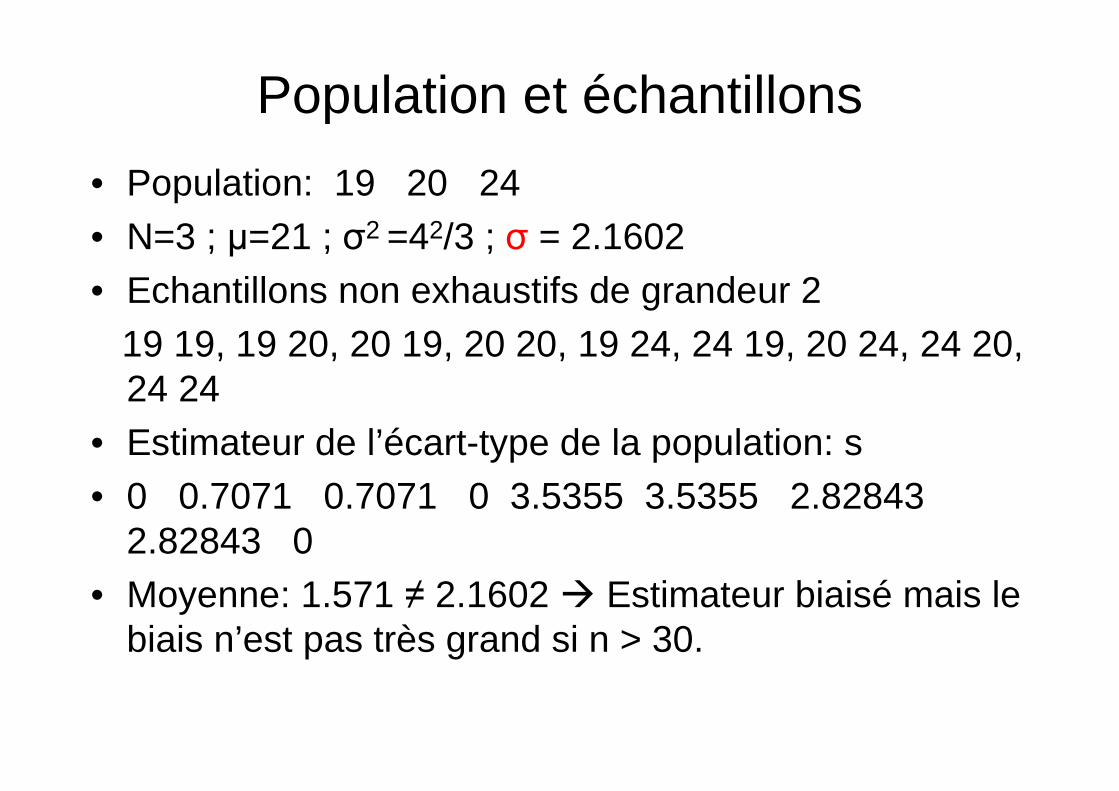
Population et échantillons
• Population: 19 20 24• N=3 ; µ=21 ; σ2 =42/3 ; σ = 2.1602
• Echantillons non exhaustifs de grandeur 219 19, 19 20, 20 19, 20 20, 19 24, 24 19, 20 24, 24 20, 24 24
• Estimateur de l’écart-type de la population: s• 0 0.7071 0.7071 0 3.5355 3.5355 2.82843
2.82843 0• Moyenne: 1.571 ≠ 2.1602 � Estimateur biaisé mais le
biais n’est pas très grand si n > 30.

centré

µ
n
0 1 2 3
0.00
0.02
0.04
0.06
0.08
0.10
0.12
0.14
lambda
L
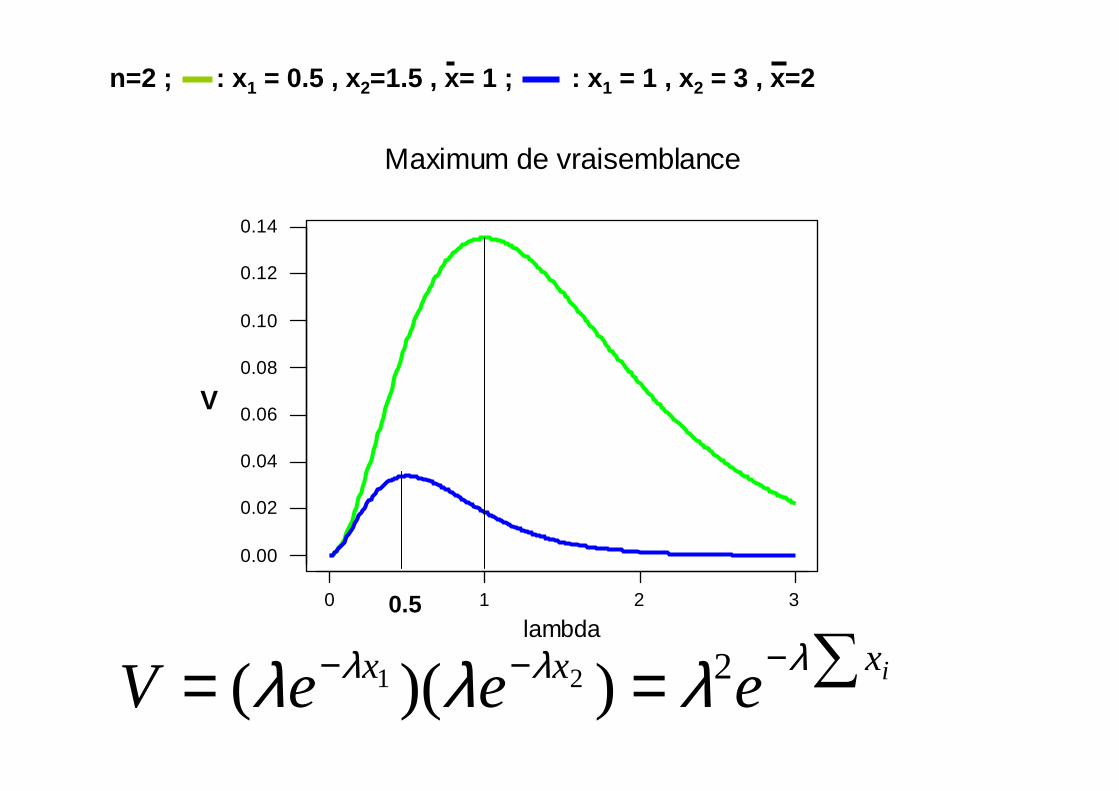
Maximum de vraisemblance
∑== −−− ixxx eeeVλλλ λλλ 2))(( 21
n=2 ; : x 1 = 0.5 , x2=1.5 , x= 1 ; : x 1 = 1 , x2 = 3 , x=2
0.5
V
Estimation ponctuelle
• Les estimateurs donnés ci-dessus sont des estimations ponctuelles. On donne une valeur comme estimateur du paramètre de la population.
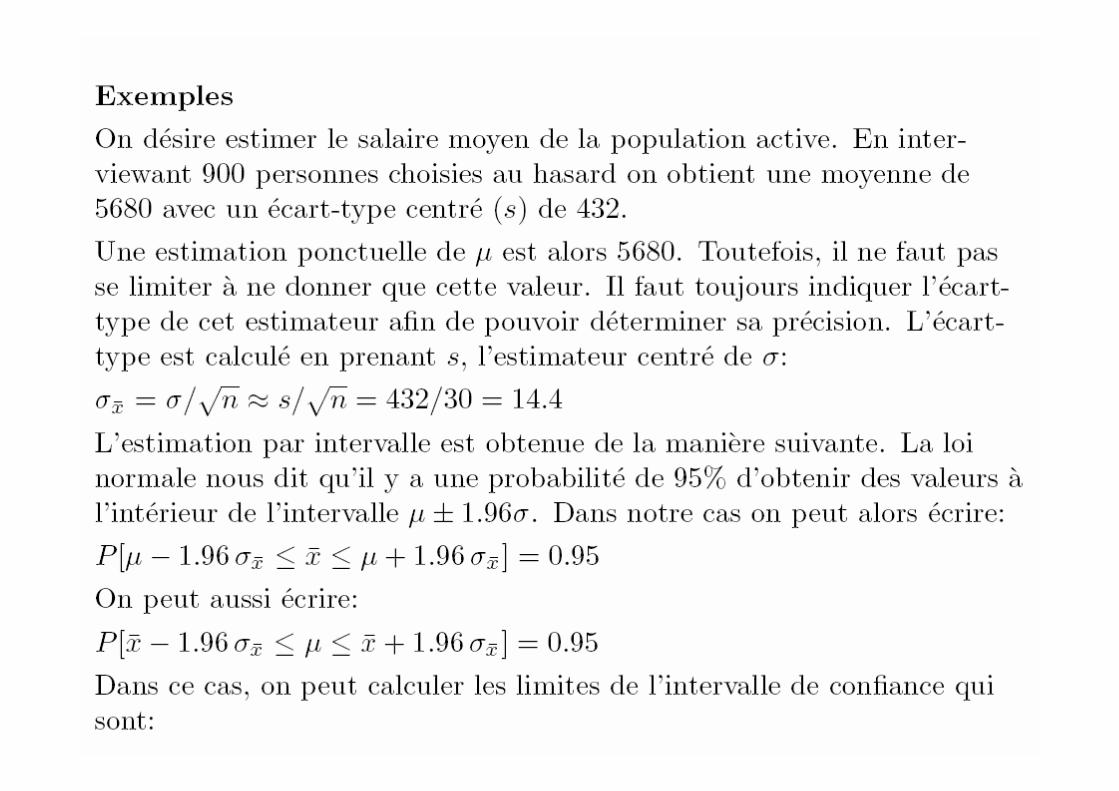
• Il faut toujours donner la précision de l’estimation. Dans le cas de la moyenne, le théorème limite central nous dit qu’on peut utiliser la loi normale pour calculer la précision de l’estimation.

0.95=1-α
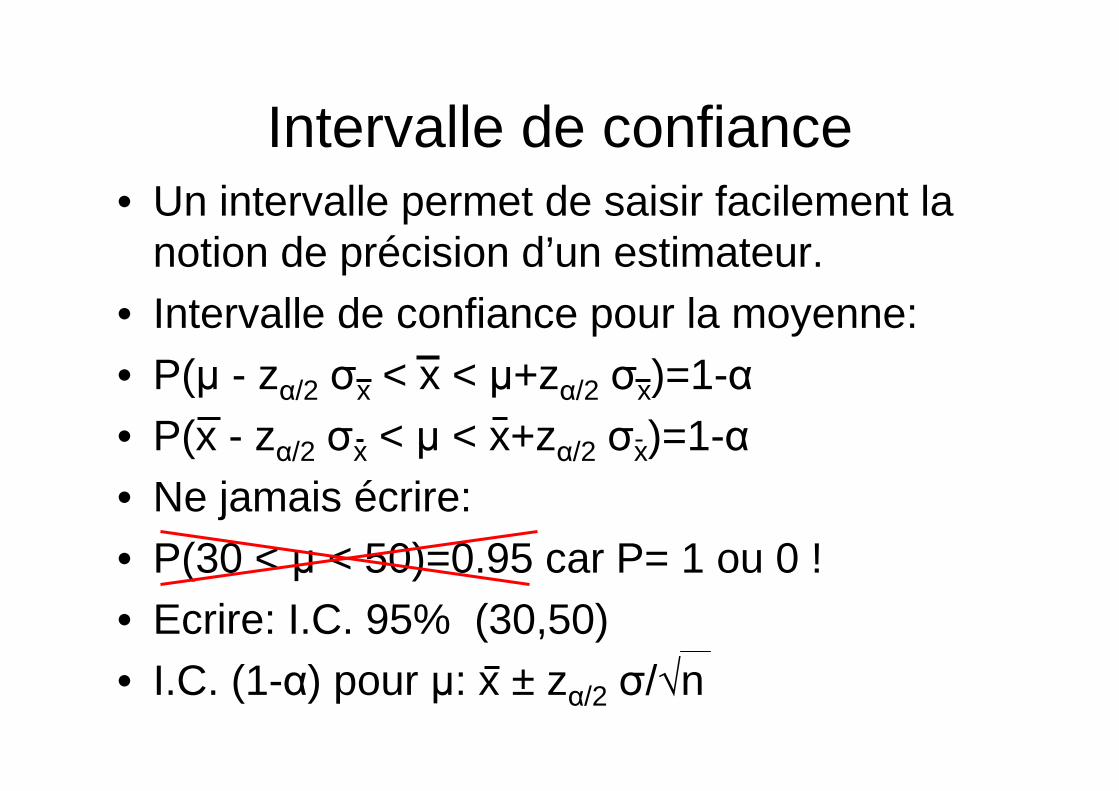
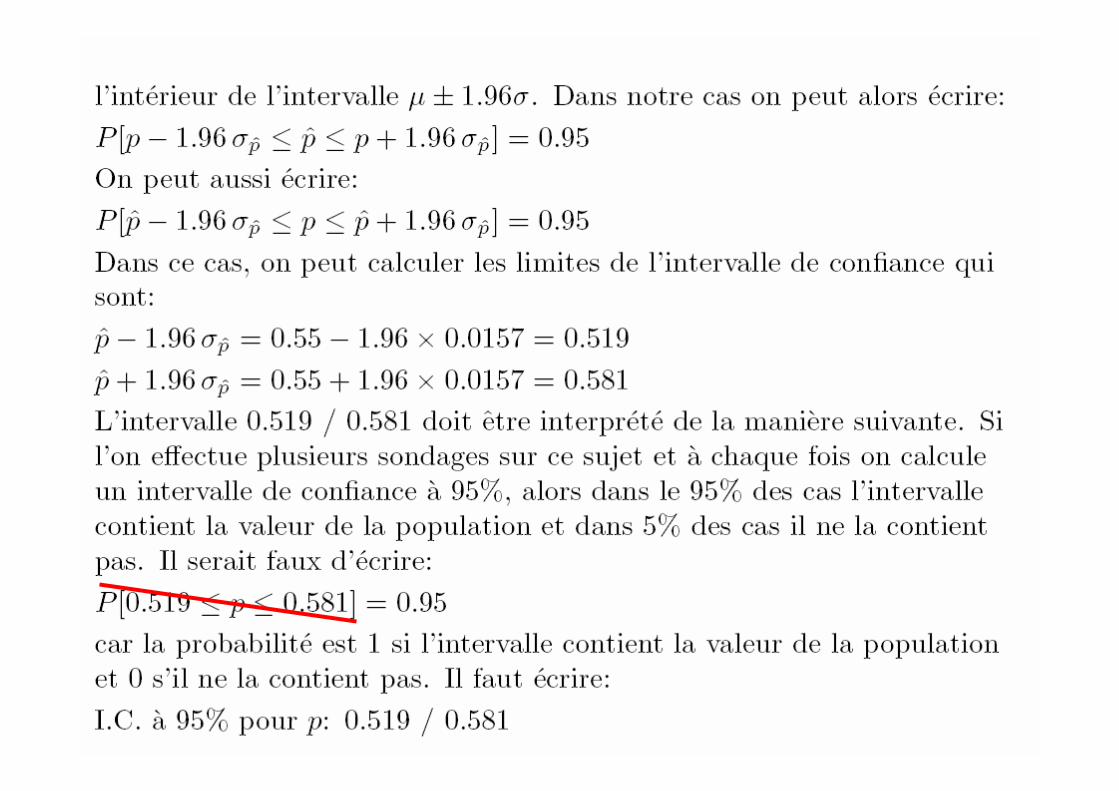
Intervalle de confiance• Un intervalle permet de saisir facilement la
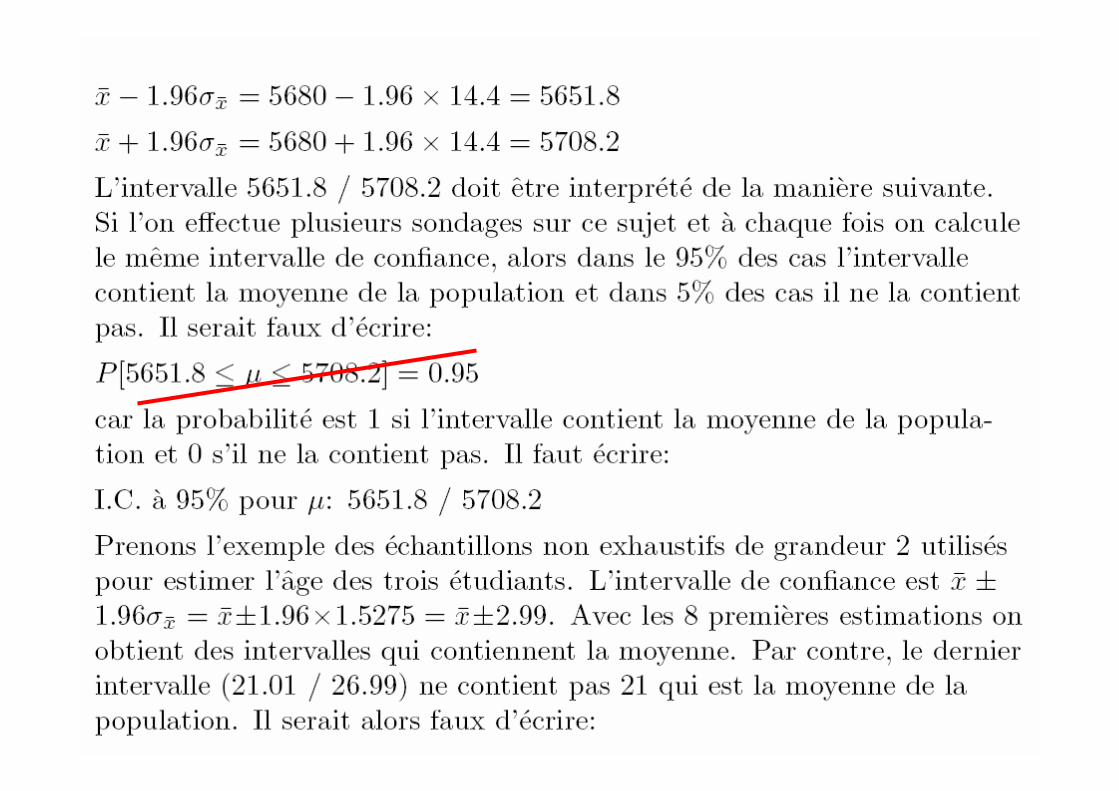
notion de précision d’un estimateur.• Intervalle de confiance pour la moyenne:• P(µ - zα/2 σx < x < µ+zα/2 σx)=1-α• P(x - zα/2 σx < µ < x+zα/2 σx)=1-α• Ne jamais écrire:• P(30 < µ < 50)=0.95 car P= 1 ou 0 !• Ecrire: I.C. 95% (30,50)• I.C. (1-α) pour µ: x ± zα/2 σ/√n
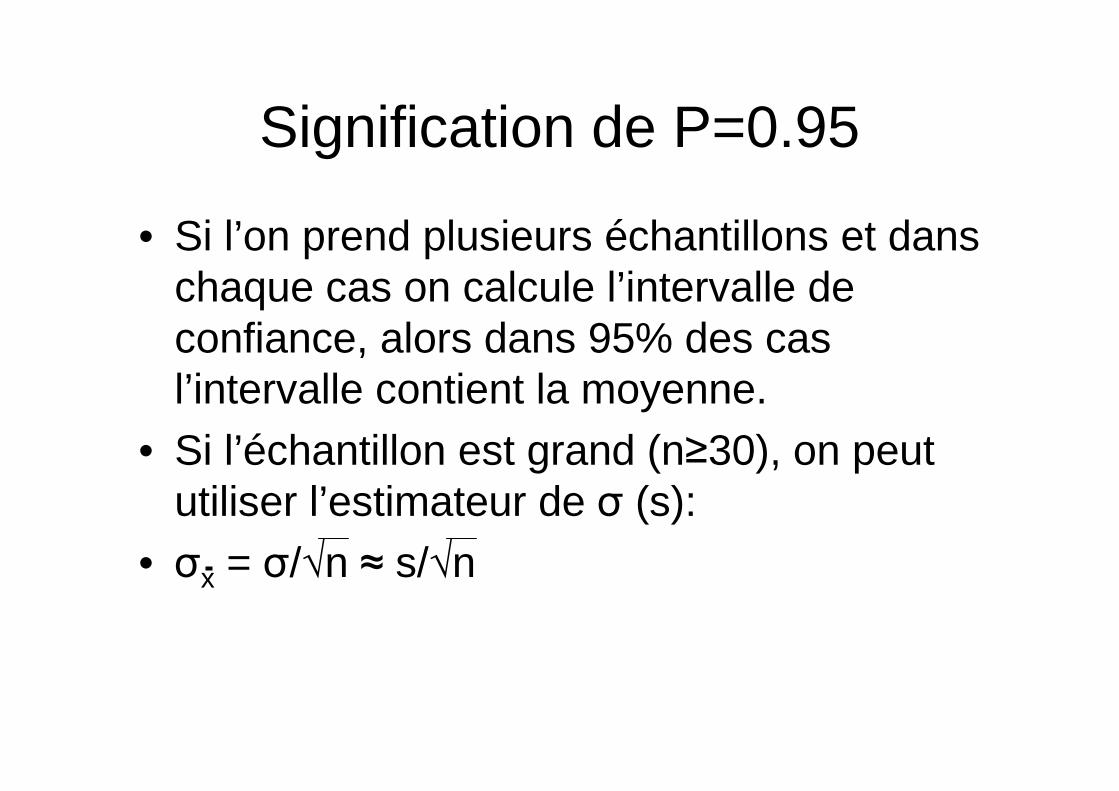
Signification de P=0.95
• Si l’on prend plusieurs échantillons et dans chaque cas on calcule l’intervalle de confiance, alors dans 95% des cas l’intervalle contient la moyenne.
• Si l’échantillon est grand (n≥30), on peut utiliser l’estimateur de σ (s):
• σx = σ/√n ≈ s/√n

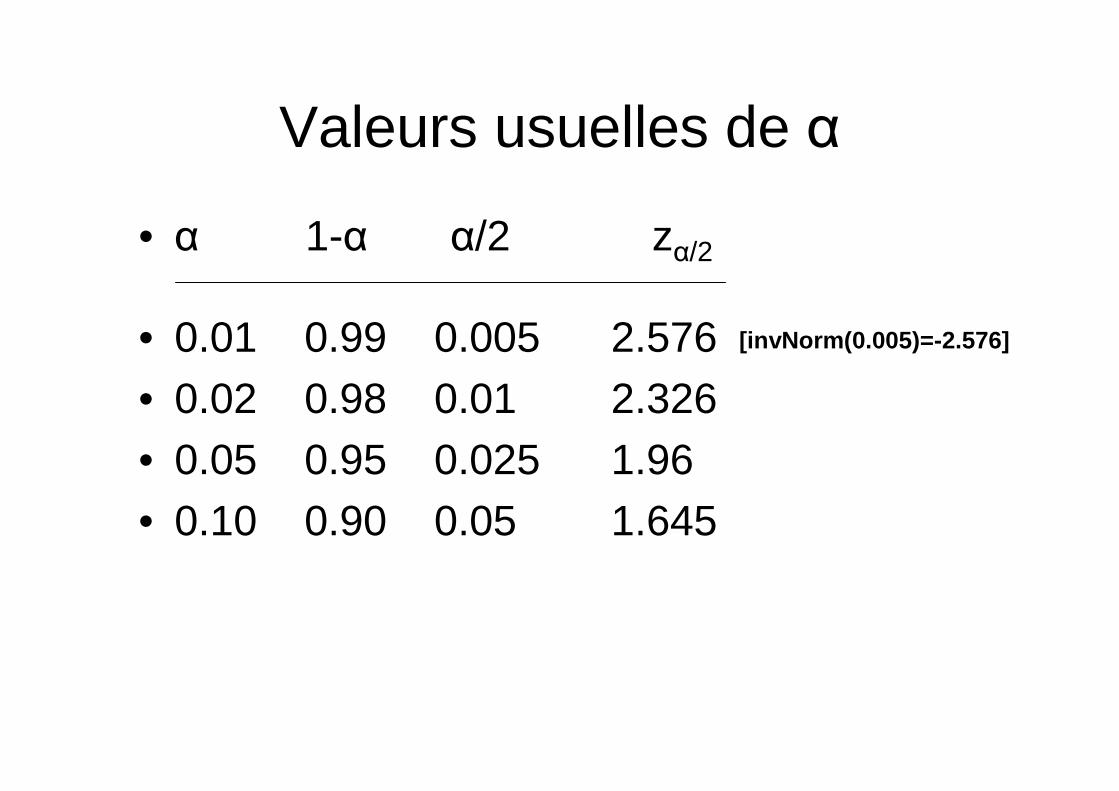
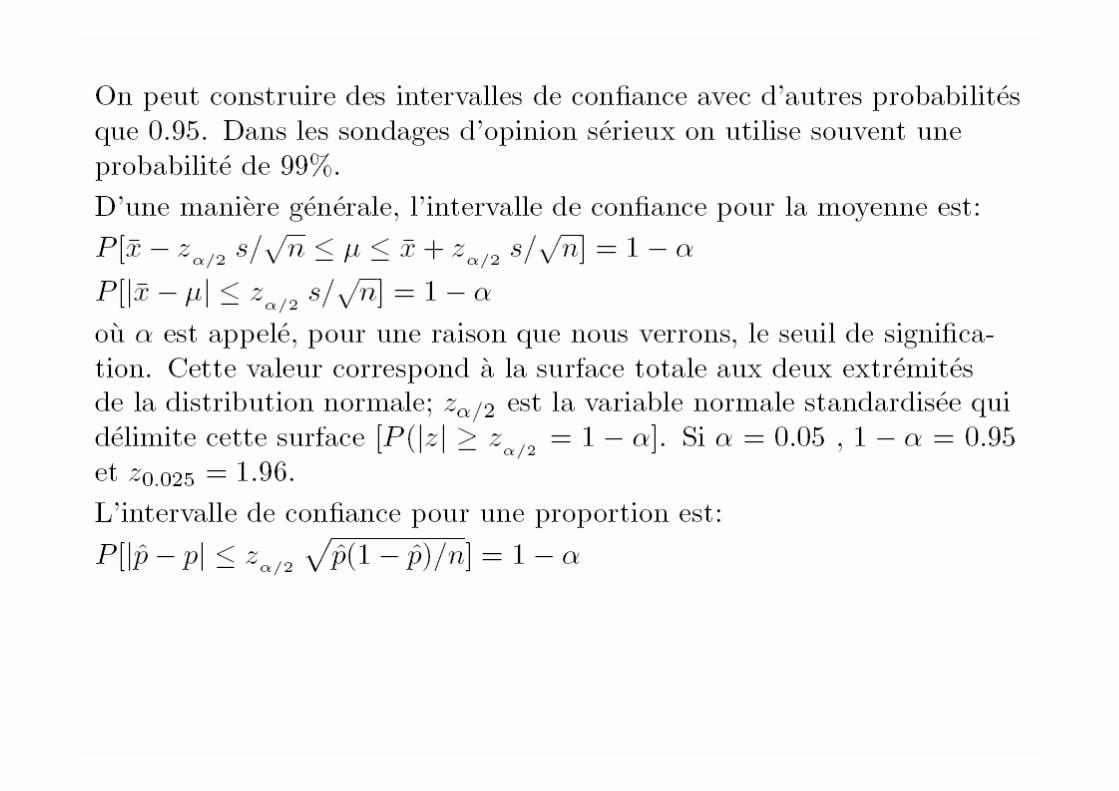
Valeurs usuelles de α
• α 1-α α/2 zα/2
• 0.01 0.99 0.005 2.576• 0.02 0.98 0.01 2.326• 0.05 0.95 0.025 1.96• 0.10 0.90 0.05 1.645
[invNorm(0.005)=-2.576]
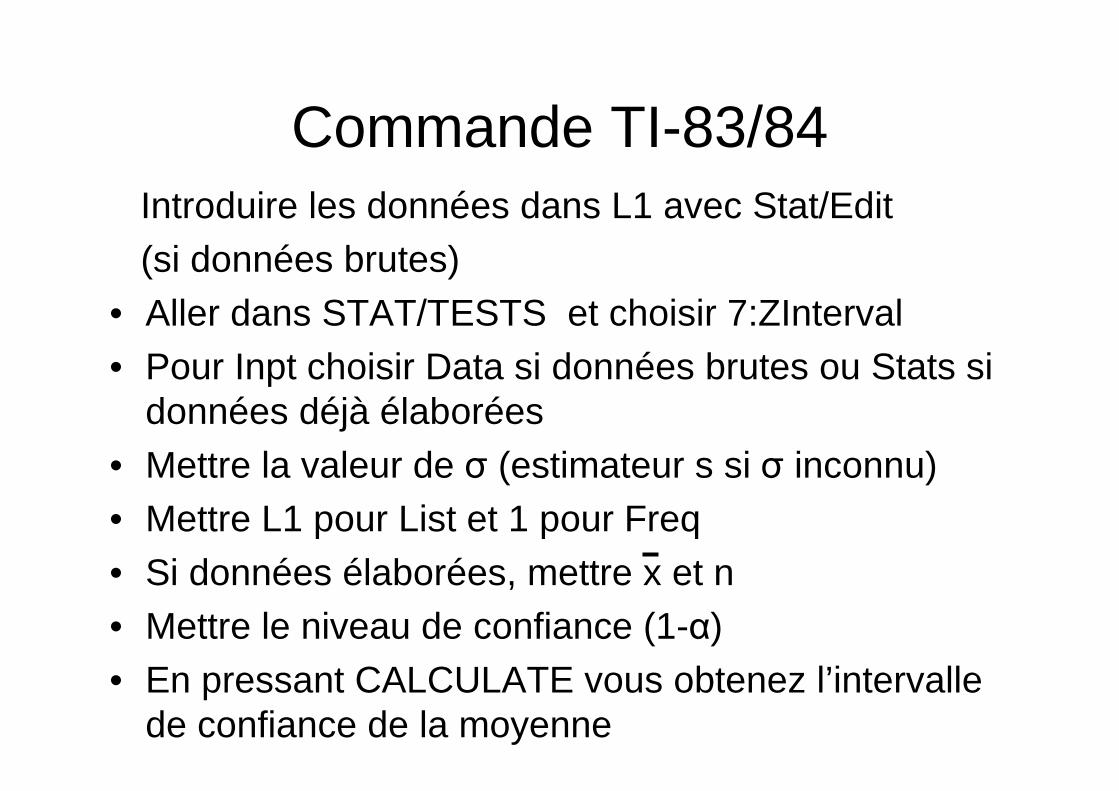
Commande TI-83/84Introduire les données dans L1 avec Stat/Edit(si données brutes)
• Aller dans STAT/TESTS et choisir 7:ZInterval• Pour Inpt choisir Data si données brutes ou Stats si
données déjà élaborées
• Mettre la valeur de σ (estimateur s si σ inconnu)• Mettre L1 pour List et 1 pour Freq
• Si données élaborées, mettre x et n• Mettre le niveau de confiance (1-α)
• En pressant CALCULATE vous obtenez l’intervalle de confiance de la moyenne

Commandes MINITAB et EXCEL• Pour MINITAB, introduire les données dans C1• Aller dans Stat / Statistiques élémentaires/ Test
Z à 1 échantillon• Sélectionner C1, introduire la valeur de Sigma.• Aller dans Options et introduire le niveau de
confiance• Pour EXCEL, chercher Intervalle.Confiance
dans les fonctions statistiques. Introduire α, σ et n (grandeur de l’échantillon). Pour avoir l’intervalle, ajouter et soustraire à x cette valeur.

Intervalle pour p
• En utilisant l’approximation de la loi binomiale par la loi normale, on peut écrire:
• P(p-zα/2 √pq/n < p < p+ zα/2 √pq/n)=1-α• Si p est inconnu, on le remplace par son
estimateur p=x/n.• I.C. (1-α) pour p: p ± zα/2 √p(1-p)/n
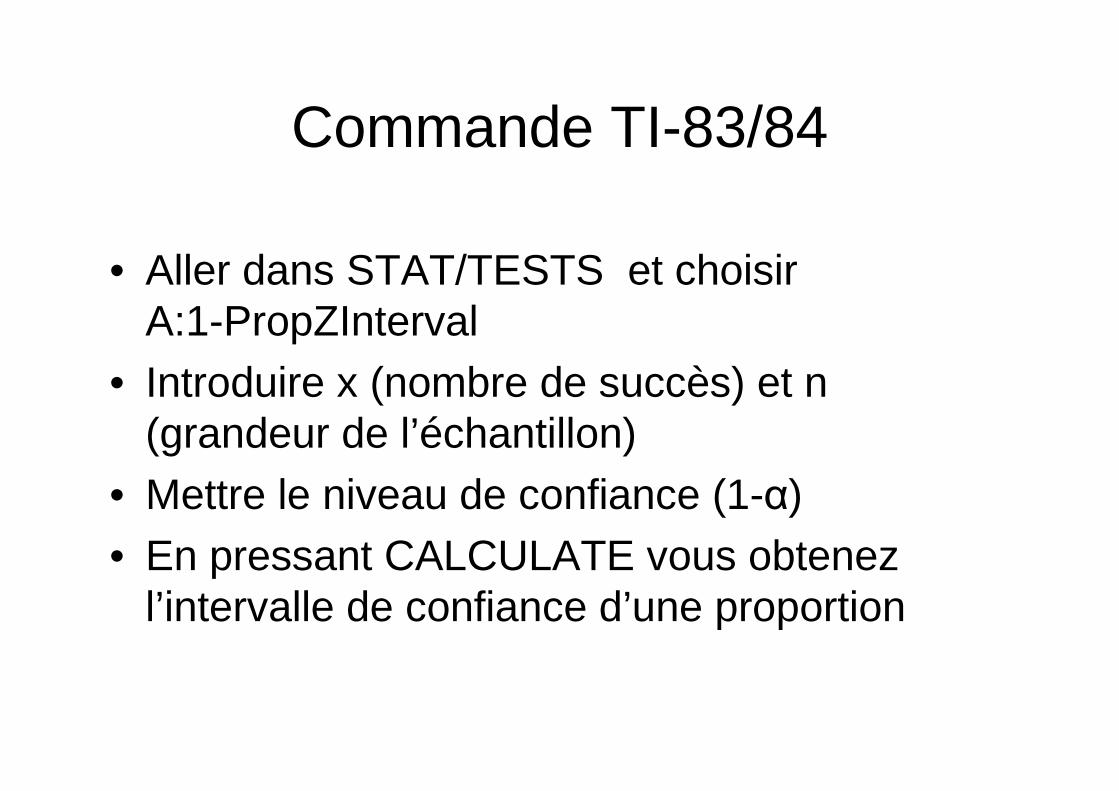
Commande TI-83/84
• Aller dans STAT/TESTS et choisir A:1-PropZInterval
• Introduire x (nombre de succès) et n (grandeur de l’échantillon)
• Mettre le niveau de confiance (1-α)• En pressant CALCULATE vous obtenez
l’intervalle de confiance d’une proportion
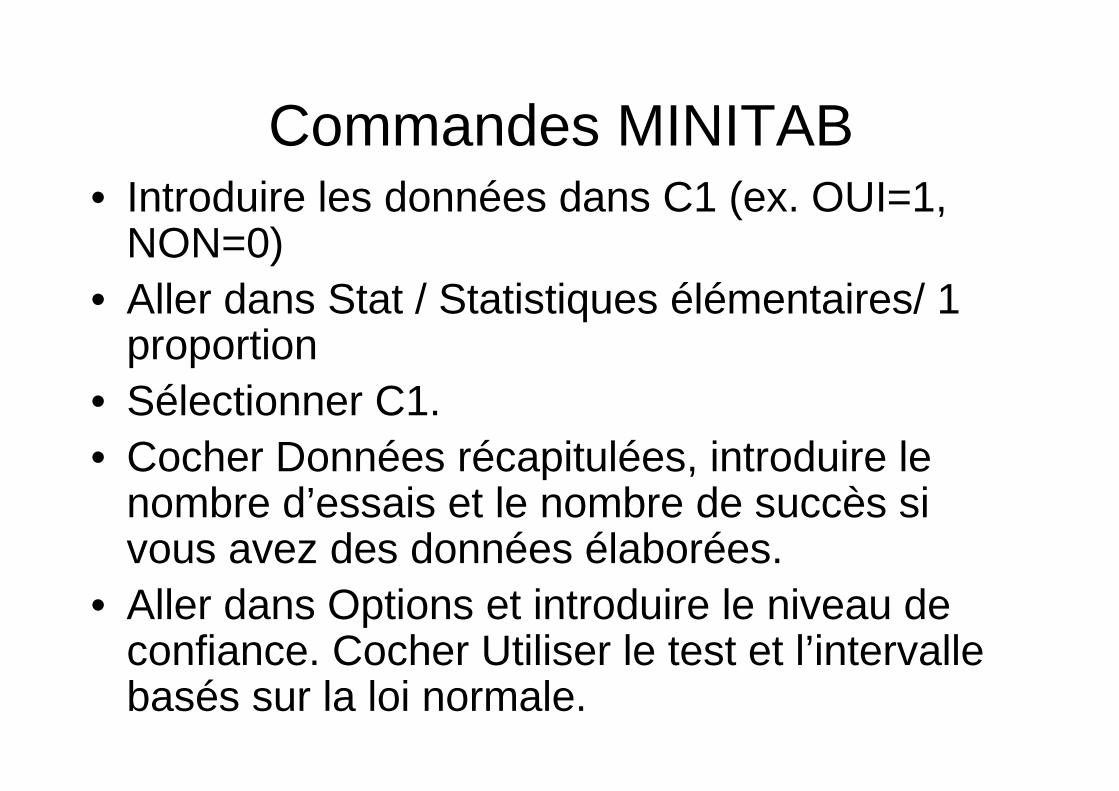
Commandes MINITAB• Introduire les données dans C1 (ex. OUI=1,
NON=0)• Aller dans Stat / Statistiques élémentaires/ 1
proportion• Sélectionner C1.• Cocher Données récapitulées, introduire le
nombre d’essais et le nombre de succès si vous avez des données élaborées.
• Aller dans Options et introduire le niveau de confiance. Cocher Utiliser le test et l’intervalle basés sur la loi normale.

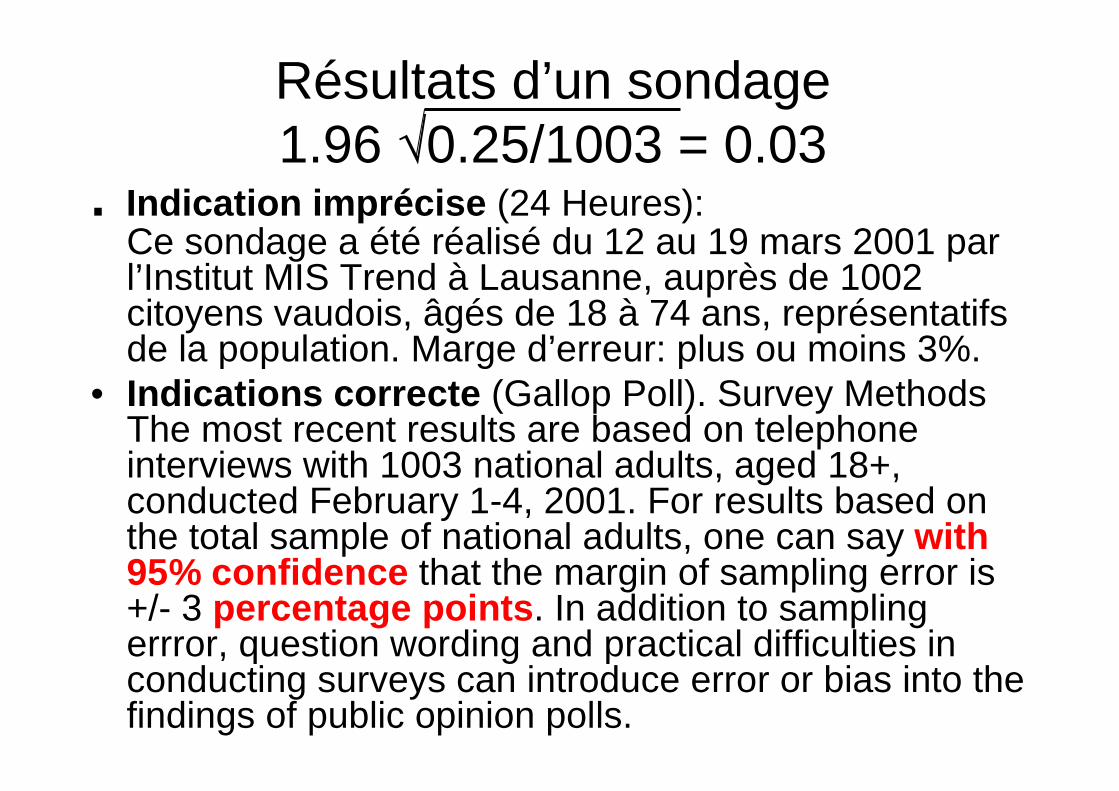
Résultats d’un sondage 1.96 √0.25/1003 = 0.03
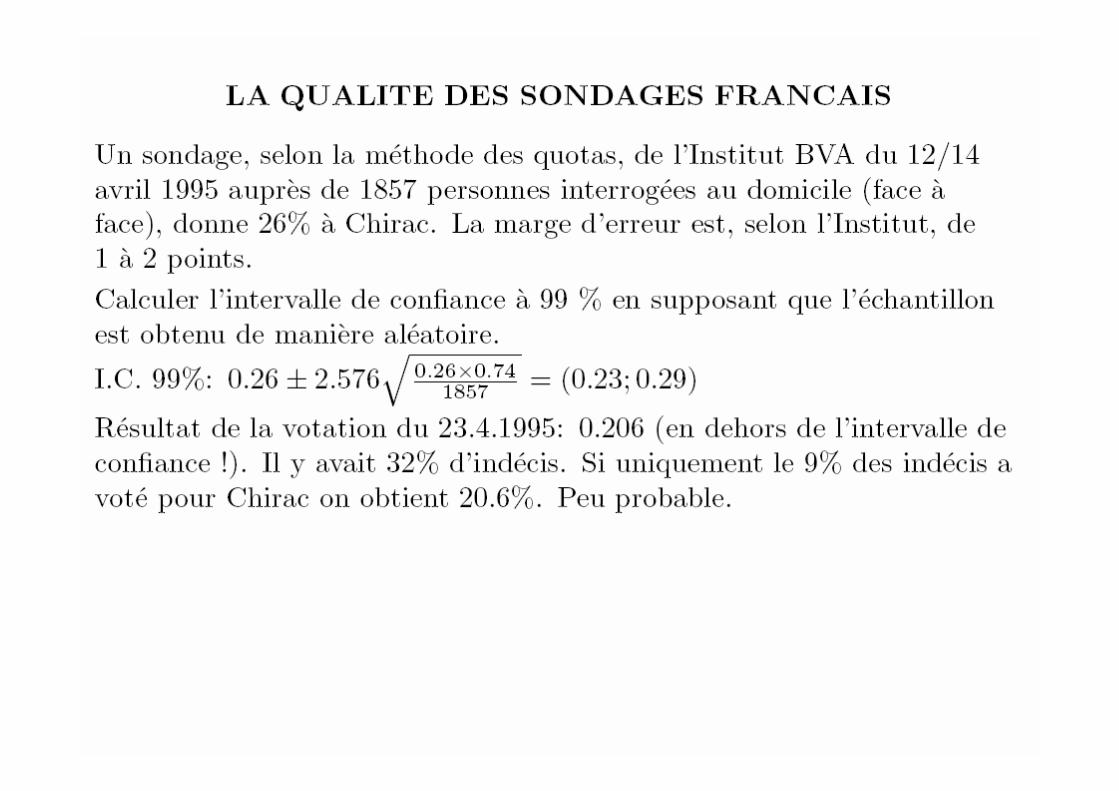
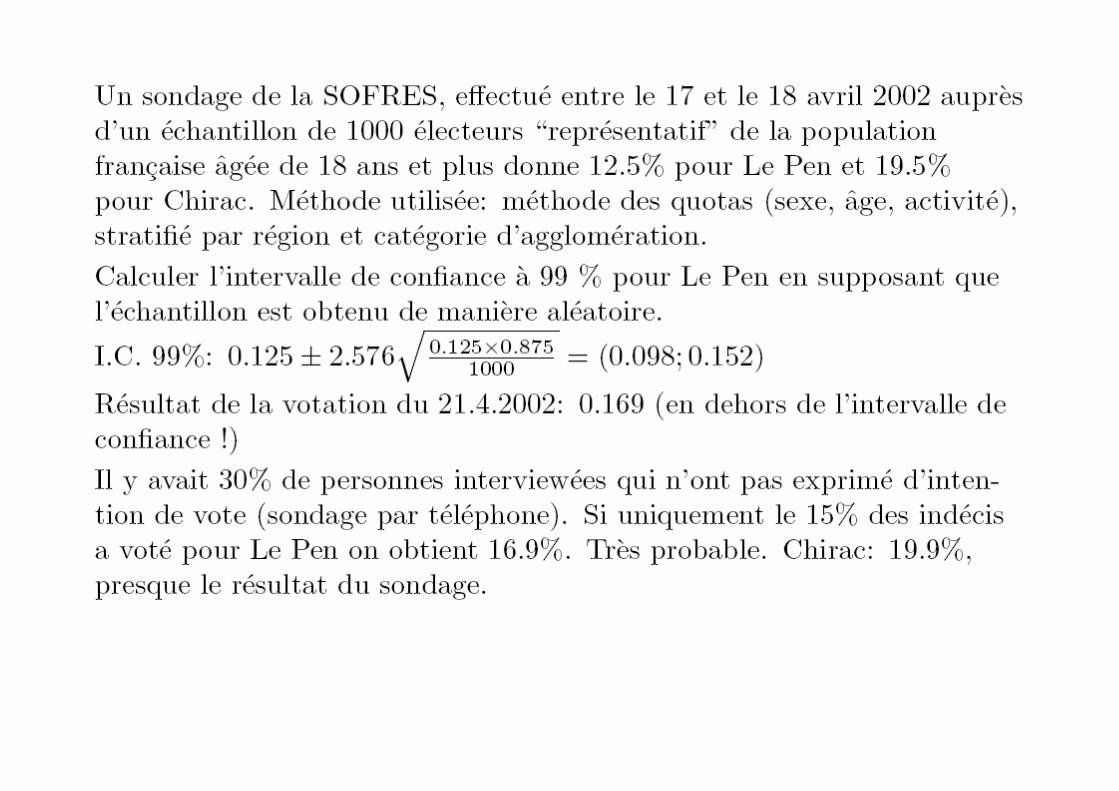
. Indication imprécise (24 Heures): Ce sondage a été réalisé du 12 au 19 mars 2001 par l’Institut MIS Trend à Lausanne, auprès de 1002 citoyens vaudois, âgés de 18 à 74 ans, représentatifs de la population. Marge d’erreur: plus ou moins 3%.
• Indications correcte (Gallop Poll). Survey MethodsThe most recent results are based on telephoneinterviews with 1003 national adults, aged 18+, conducted February 1-4, 2001. For results based on the total sample of national adults, one can say with95% confidence that the margin of sampling error is+/- 3 percentage points . In addition to samplingerrror, question wording and practical difficulties in conducting surveys can introduce error or bias into the findings of public opinion polls.
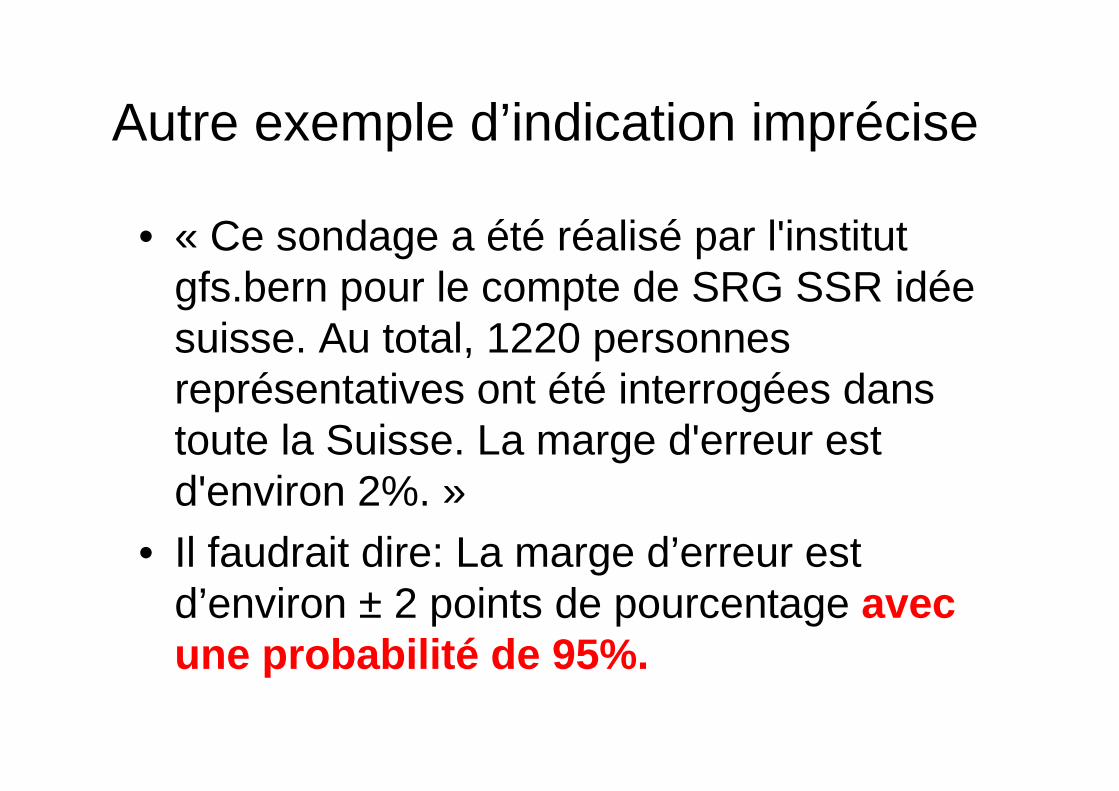
Autre exemple d’indication imprécise
• « Ce sondage a été réalisé par l'institut gfs.bern pour le compte de SRG SSR idée suisse. Au total, 1220 personnes représentatives ont été interrogées dans toute la Suisse. La marge d'erreur est d'environ 2%. »
• Il faudrait dire: La marge d’erreur est d’environ ± 2 points de pourcentage avec une probabilité de 95%.
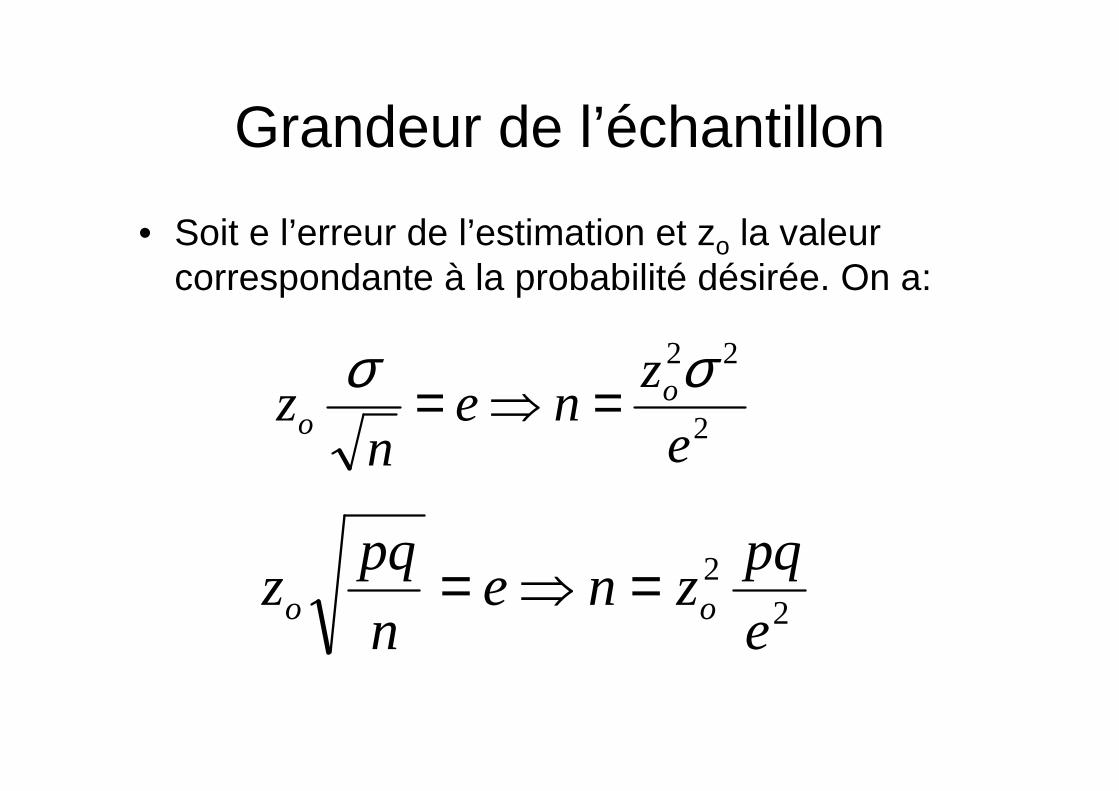
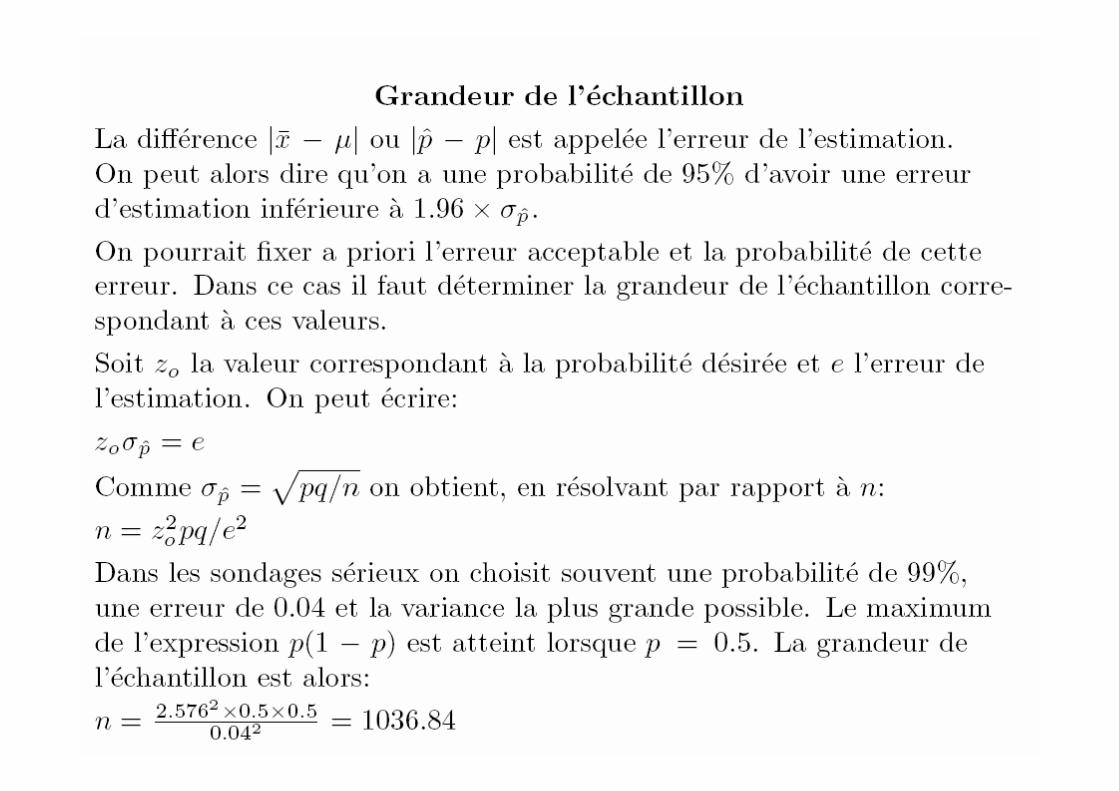
Grandeur de l’échantillon
• Soit e l’erreur de l’estimation et zo la valeur correspondante à la probabilité désirée. On a:
2
22
e
zne
nz o
o
σσ =⇒=
22
e
pqzne
n
pqz oo =⇒=
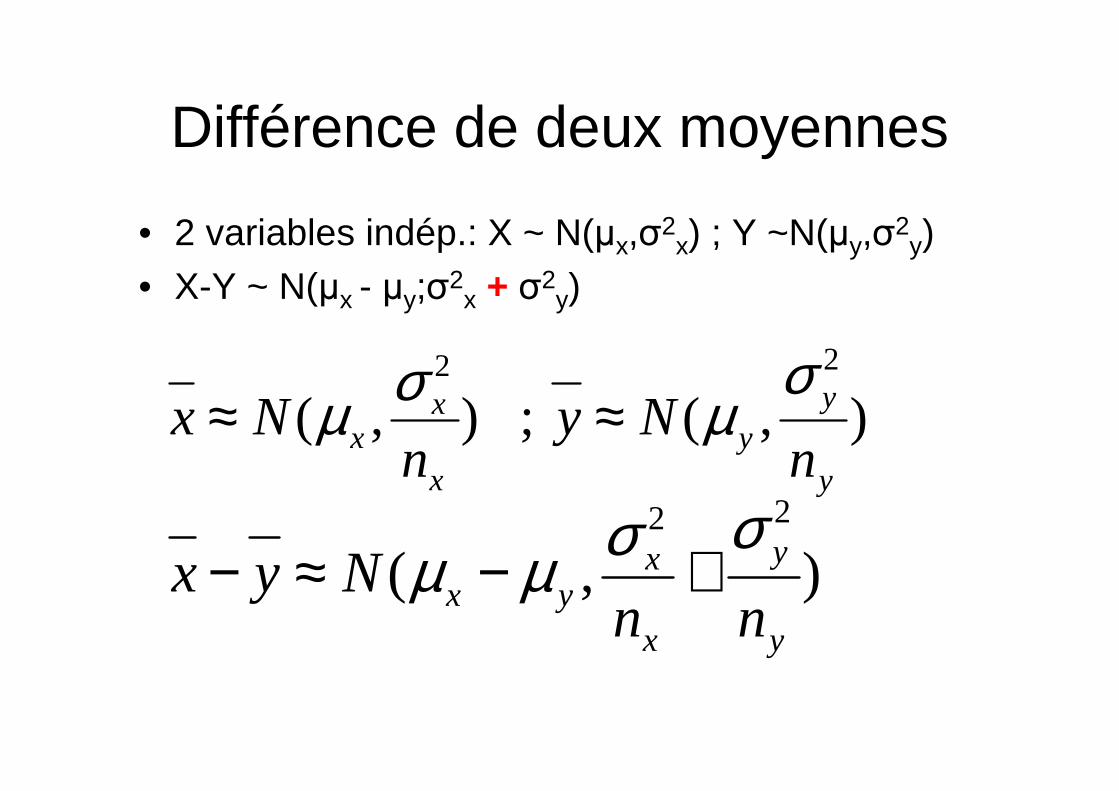
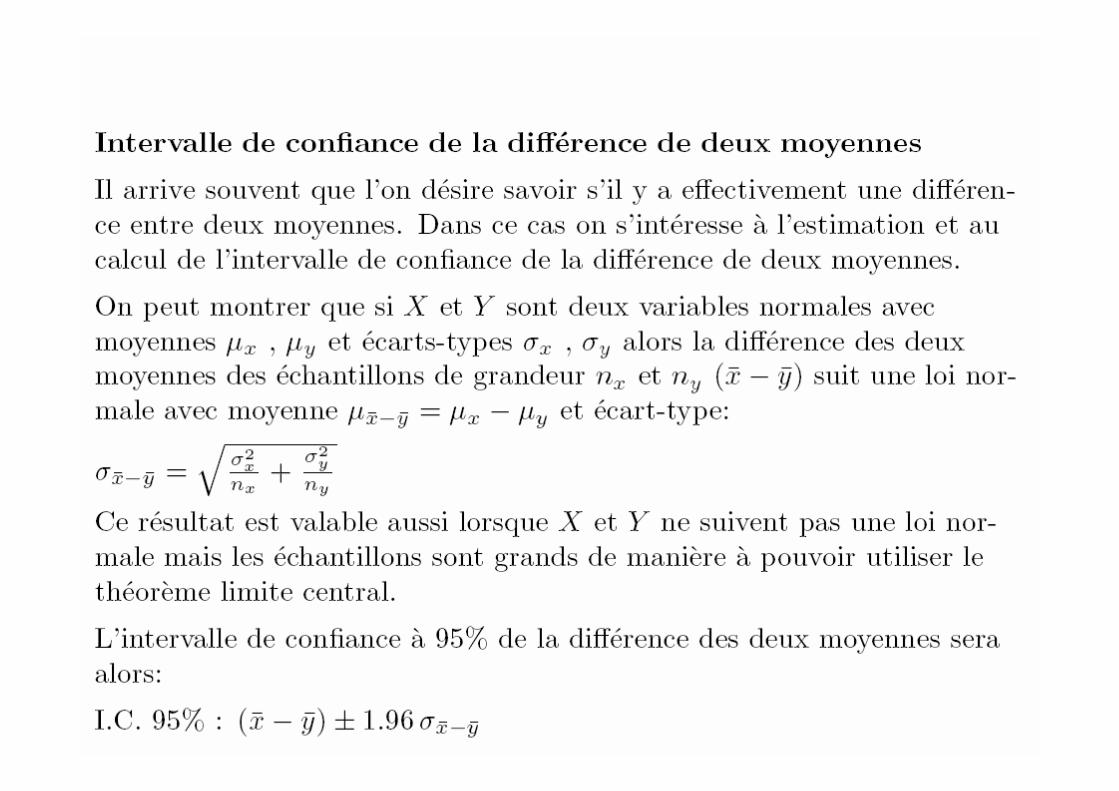
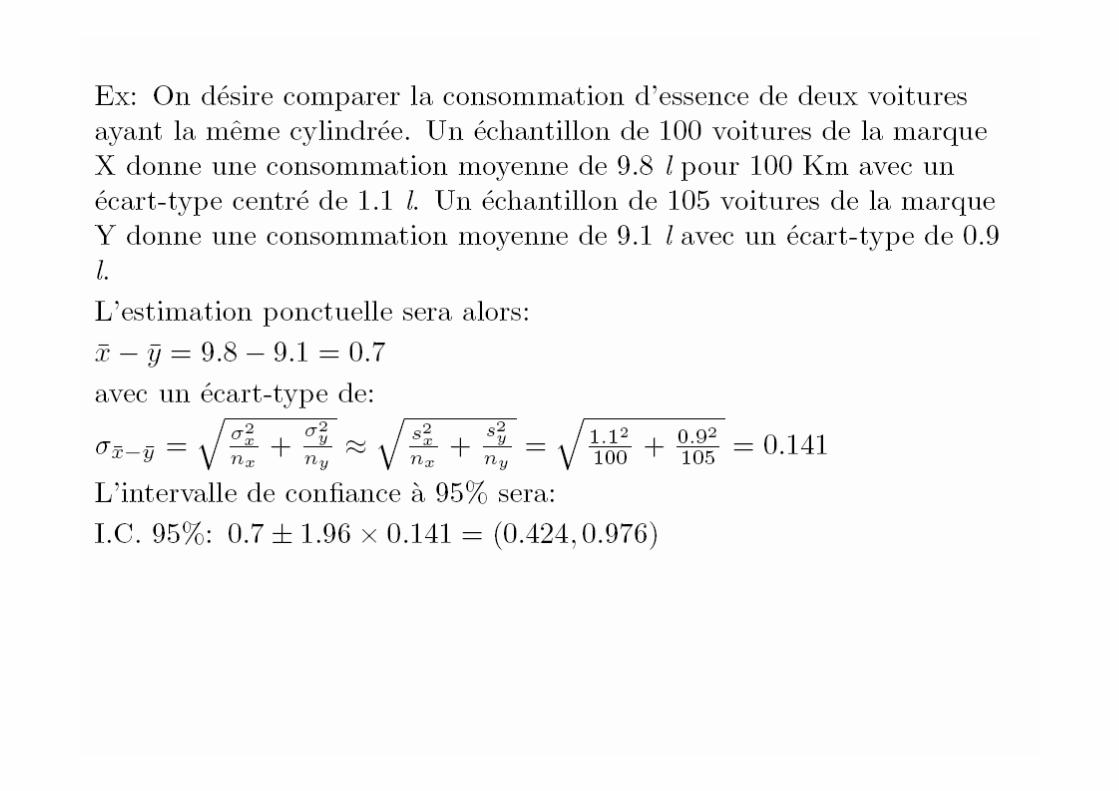
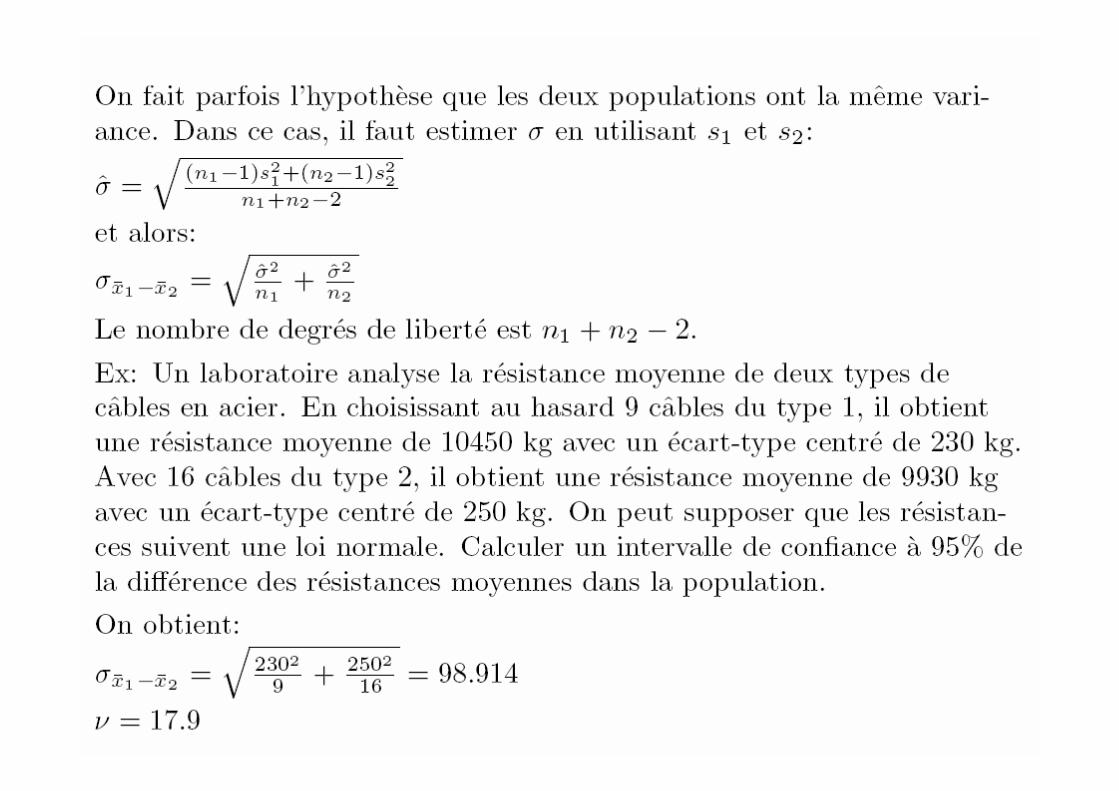
Différence de deux moyennes
• 2 variables indép.: X ~ N(µx,σ2x) ; Y ~N(µy,σ2
y)
• X-Y ~ N(µx - µy;σ2x + σ2
y)
),() ; ,(22
y
yy
x
xx n
Nyn
Nxσ
µσµ ≈≈
),(22
y
y
x
xyx nn
Nyxσσµµ +−≈−

Commande TI-83/84Introduire les données dans L1 et L2 avec Stat/Edit(si données brutes)
• Aller dans STAT/TESTS et choisir 9:2-SampZInt• Pour Inpt choisir Data si données brutes ou Stats si
données déjà élaborées
• Mettre les valeurs de σ1 et σ2
• Mettre L1 et L2, Freq1 et Freq2. Si données élaborées, mettre x1 , n1 , x2 , n2
• Mettre le niveau de confiance (1-α)• En pressant CALCULATE vous obtenez l’intervalle
de confiance de la différence de deux moyennes

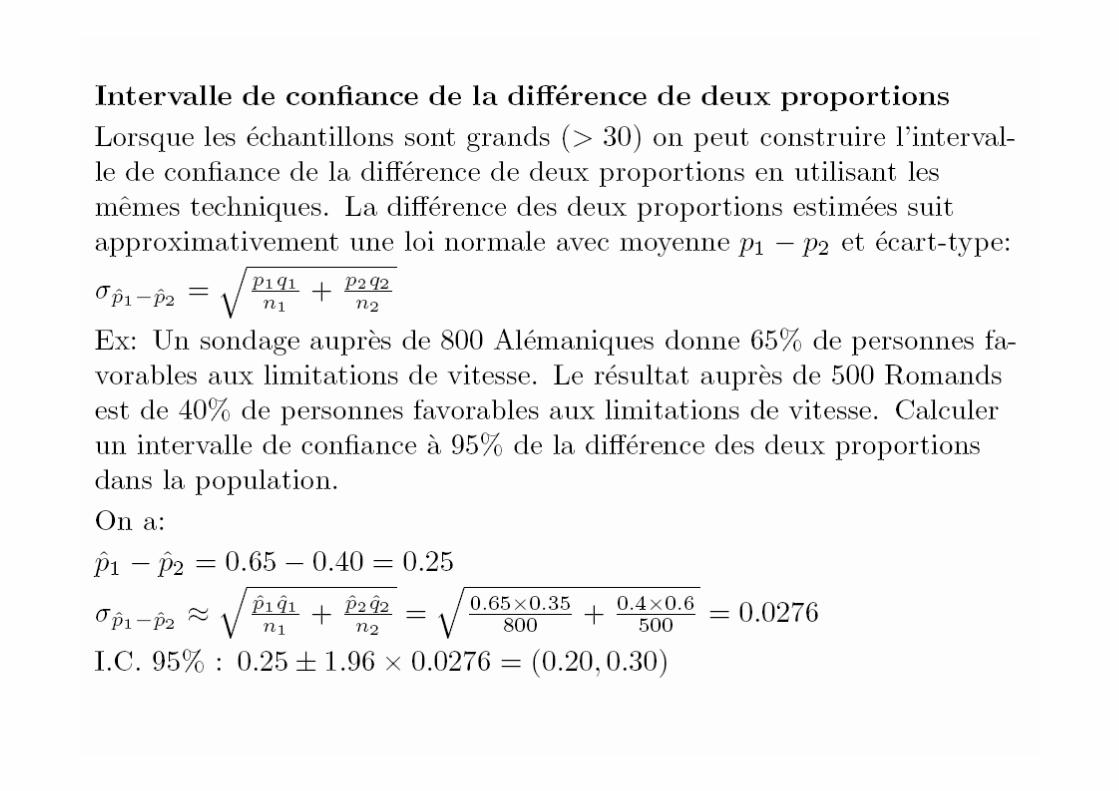
Différence de deux proportions
• p1 – p2 ~ N(p1-p2,√p1q1/n1+p2q2/n2)
• I.C. (1-α):
2
22
1
112/21
)1()1()(
n
pp
n
ppzpp
)))))) −+−±− α

Commande TI-83/84
• Aller dans STAT/TESTS et choisir B:2-PropZInterval
• Introduire x1, n1, x2, n2 (nombres de succès et grandeurs des échantillons)
• Mettre le niveau de confiance (1-α)• En pressant CALCULATE vous obtenez
l’intervalle de confiance de la différence de deux proportions

Commandes MINITAB• Introduire les données dans C1 et C2 (ex.
OUI=1, NON=0)• Aller dans Stat / Statistiques élémentaires/ 2
proportions• Cocher Echantillons dans deux colonnes.
Sélectionner C1 et C2.• Cocher Données récapitulées, introduire les
nombres d’essais et les nombres de succès si vous avez des données élaborées.
• Aller dans Options et introduire le niveau de confiance.

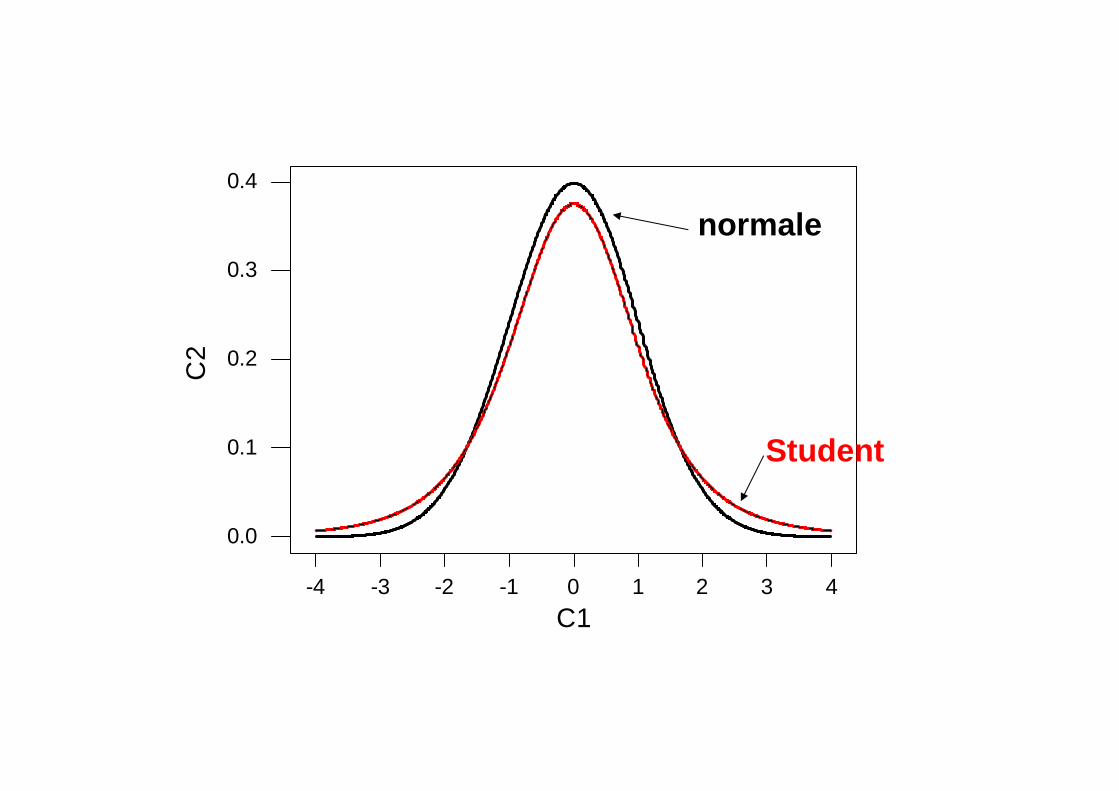
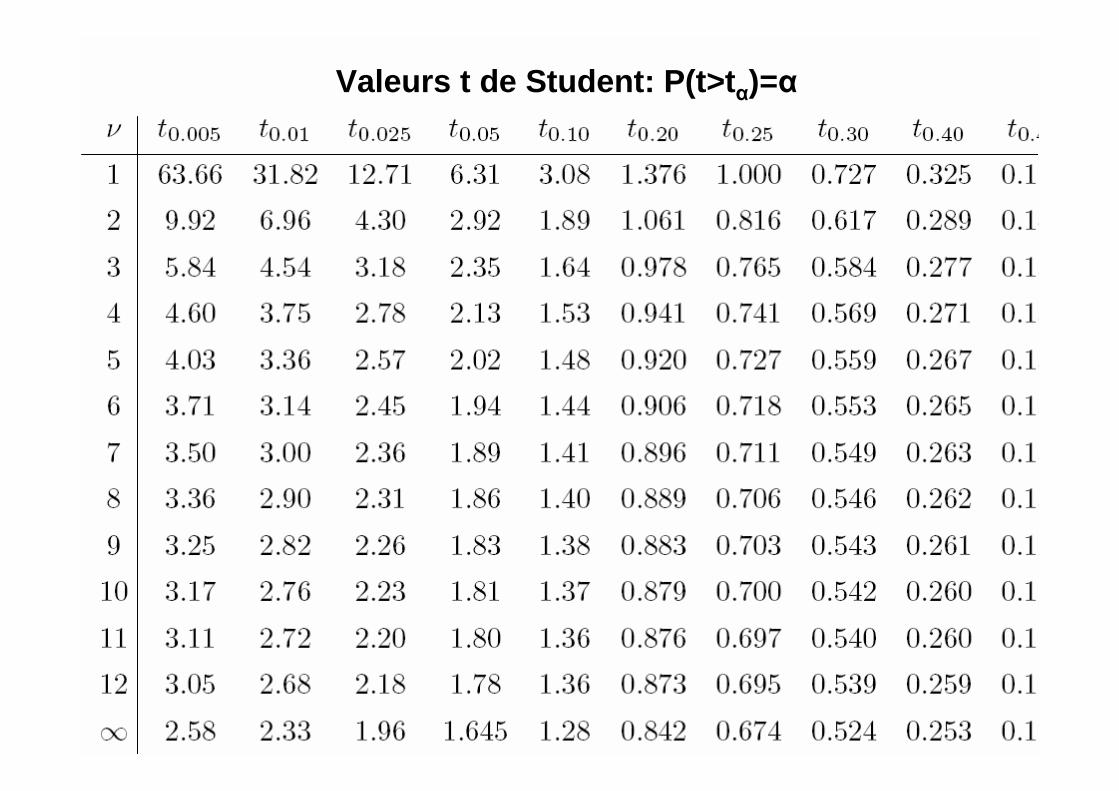
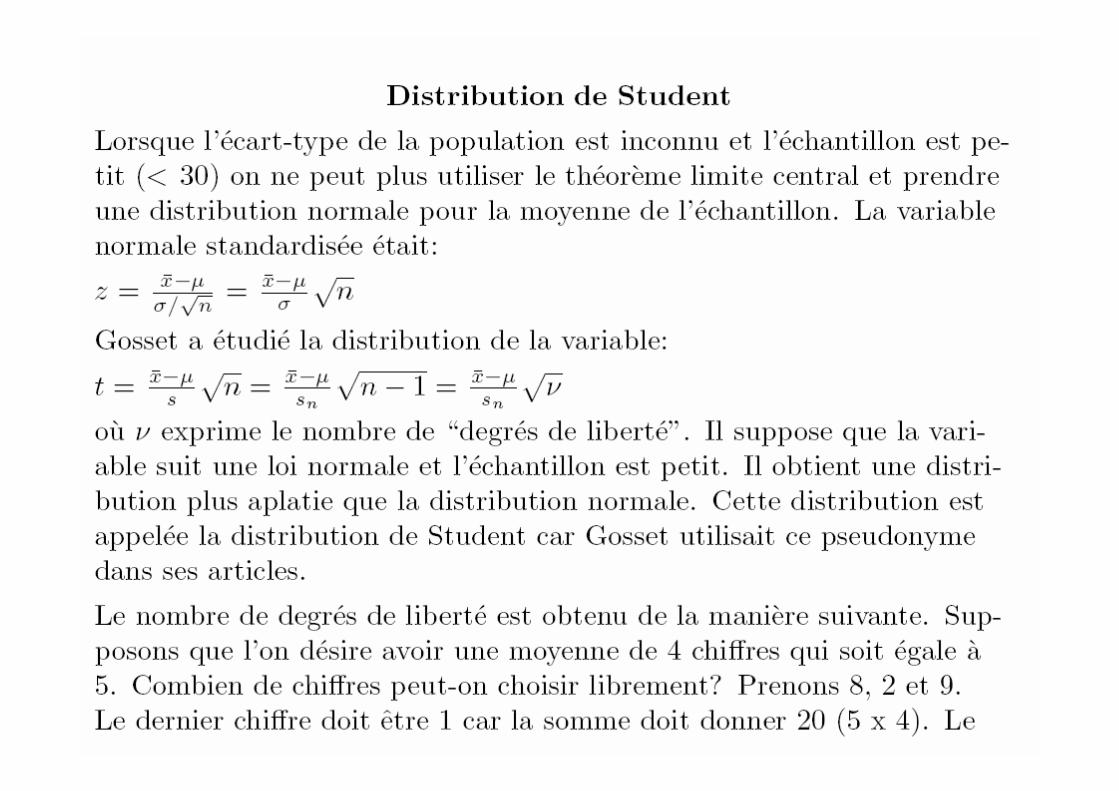
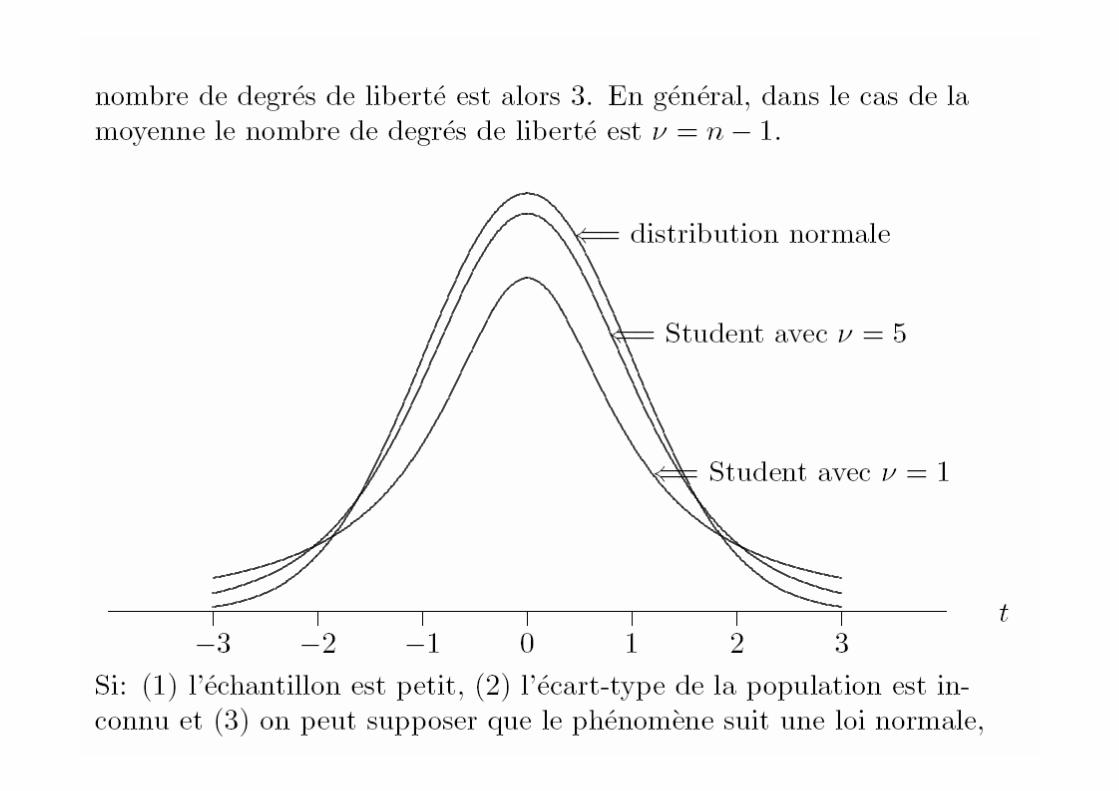
Loi de Student
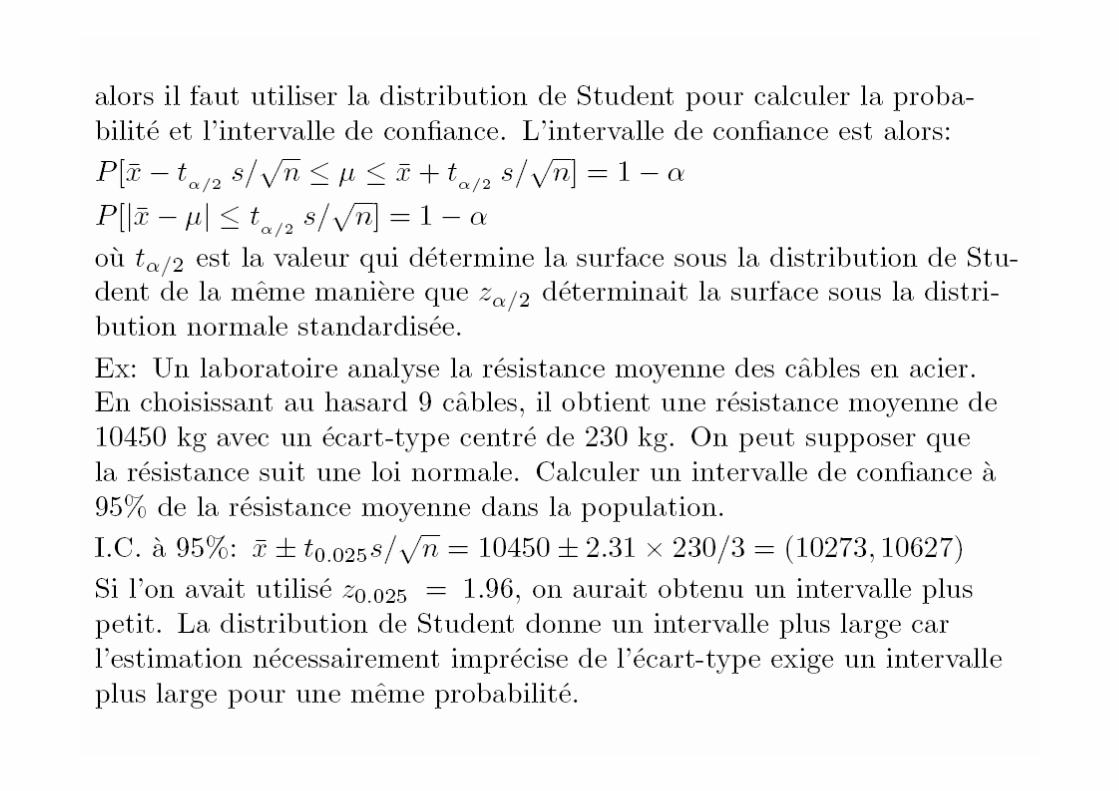
• Si n < 30 , la variable suit une loi normale et σ est inconnu il faut utiliser la distribution de Student (tα/2) et non pas la loi normale (zα/2).
• Nombre de degrés de liberté: ν=n-1• t = √n (x-µ)/s • P(x-tv,α/2 s/√n < µ < x + tv,α/2 s/√n)=1-α• I.C. (1-α): x ± tv,α/2 s /√n
-4 -3 -2 -1 0 1 2 3 4
0.0
0.1
0.2
0.3
0.4
C1
C2
Student
normale

Commande TI-83/84Introduire les données dans L1 avec Stat/Edit(si données brutes)
• Aller dans STAT/TESTS et choisir 8:TInterval• Pour Inpt choisir Data si données brutes ou
Stats si données déjà élaborées• Mettre L1 pour List et 1 pour Freq• Si données élaborées, mettre x, s et n• Mettre le niveau de confiance (1-α)• En pressant CALCULATE vous obtenez
l’intervalle de confiance de la moyenne

Commande MINITAB • Introduire les données dans C1• Aller dans Stat / Statistiques élémentaires/ Test
t à 1 échantillon• Sélectionner C1• Aller dans Options et introduire le niveau de
confiance
Valeurs t de Student: P(t>t α)=α

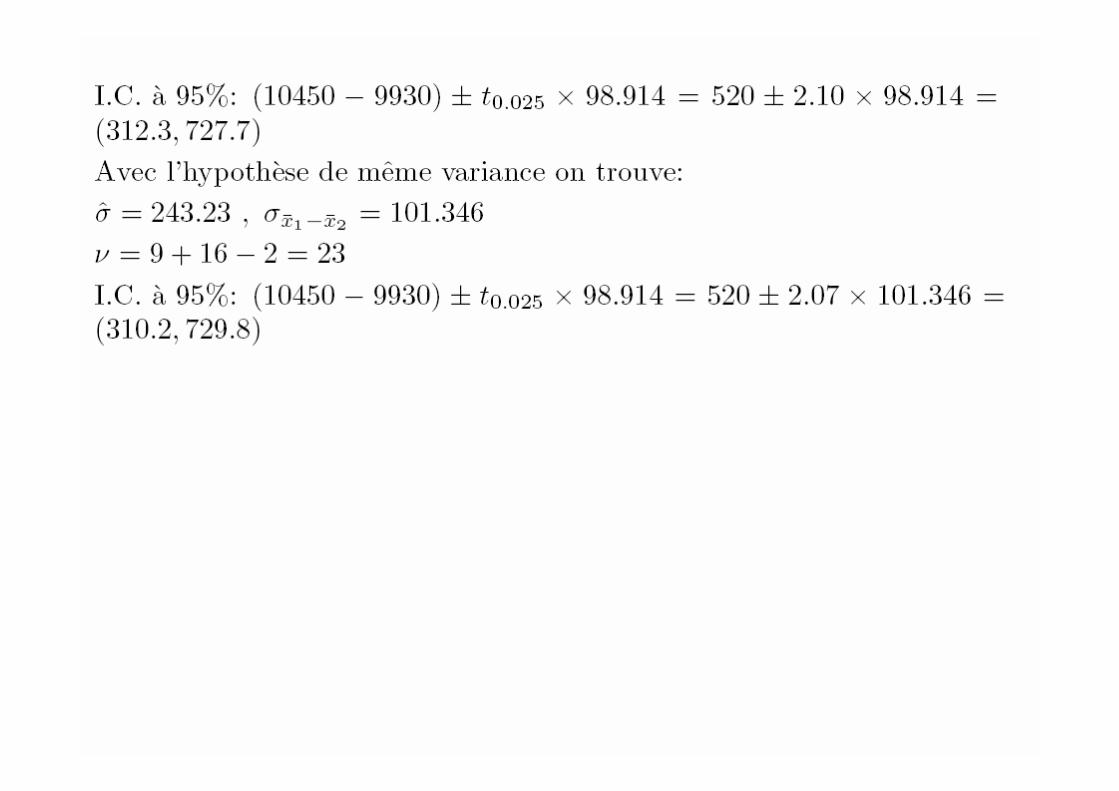
Différence de deux moyennes avec Student
• I.C. (1-α): (x1 – x2)±tv,α/2 σx1-x2
2
22
1
21
21 n
s
n
sxx
+=−σ
11 2
2
2
22
1
2
1
21
2
2
22
1
21
−
+−
+
=
n
n
s
n
n
s
n
s
n
s
υ

Commande TI-83/84Introduire les données dans L1 et L2 avec Stat/Edit(si données brutes)
• Aller dans STAT/TESTS et choisir 0:2-SampTInt• Pour Inpt choisir Data si données brutes ou Stats si
données déjà élaborées
• Mettre L1 et L2 pour List1 et List2 et 1 pour Freq• Si données élaborées, mettre x1, s1, n1, x2, s2, n2
• Mettre le niveau de confiance (1-α)• Pour Pooled choisir No si σ1 ≠ σ2
• En pressant CALCULATE vous obtenez l’intervalle de confiance de la différence de deux moyennes

Commande MINITAB • Introduire les données dans C1 et C2• Aller dans Stat / Statistiques élémentaires/ Test
t à 2 échantillons• Choisir Echantillons dans plusieurs colonnes• Sélectionner C1 pour Premier et C2 pour
Deuxième• Cocher Assumer variances égales si σ1=σ2
• Aller dans Options et introduire le niveau de confiance


Echantillon
• 1) aléatoire simple• 2) systématique• 3) stratifié• 4) par grappe• 5) méthode des quota
x i=3+(i-1)5 (i=1,2,..,n)
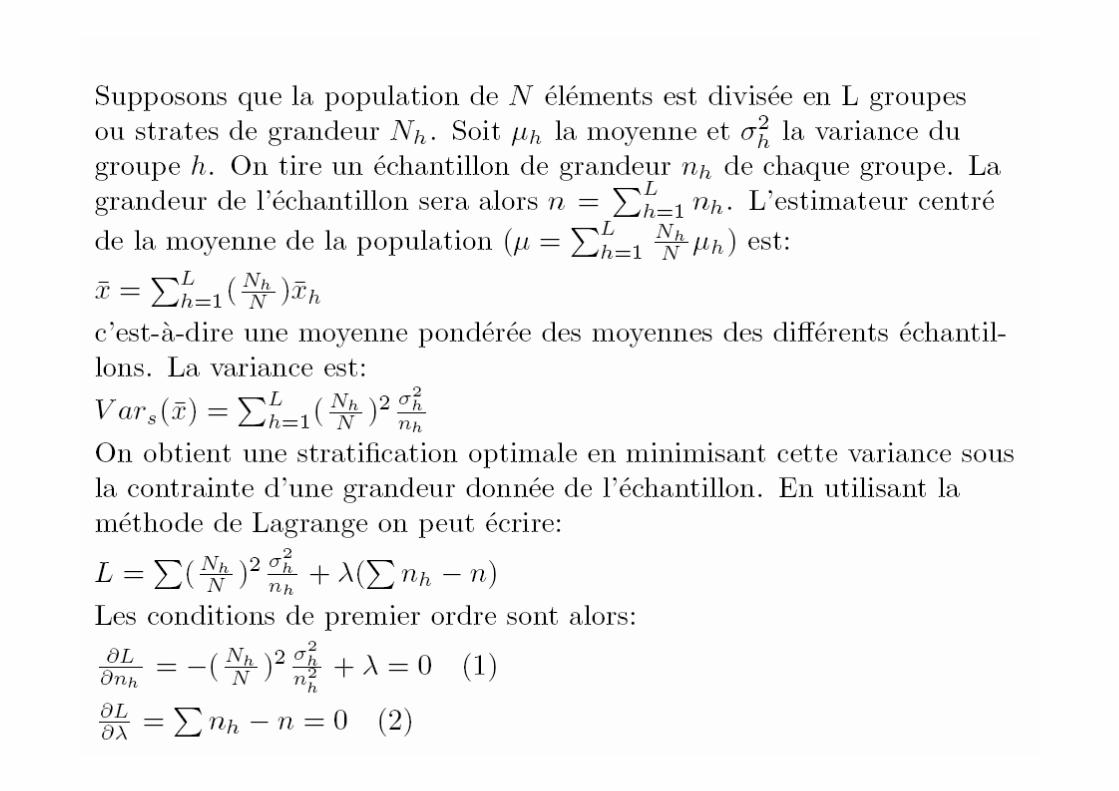

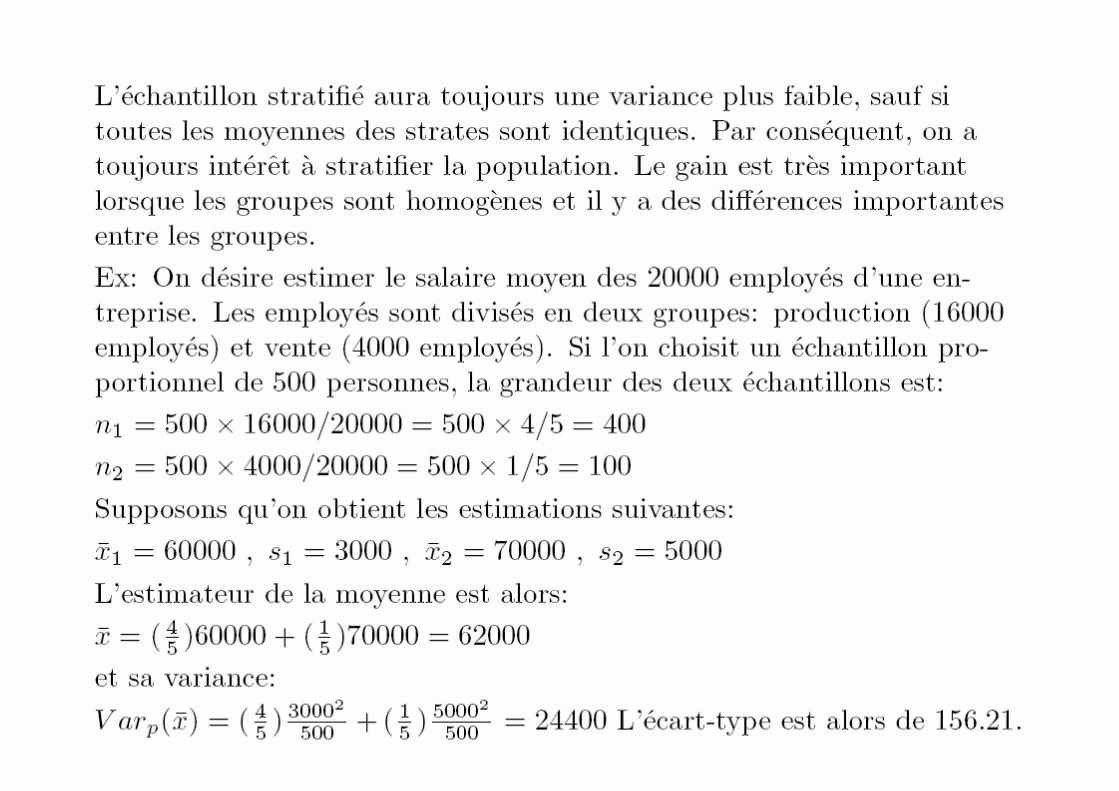
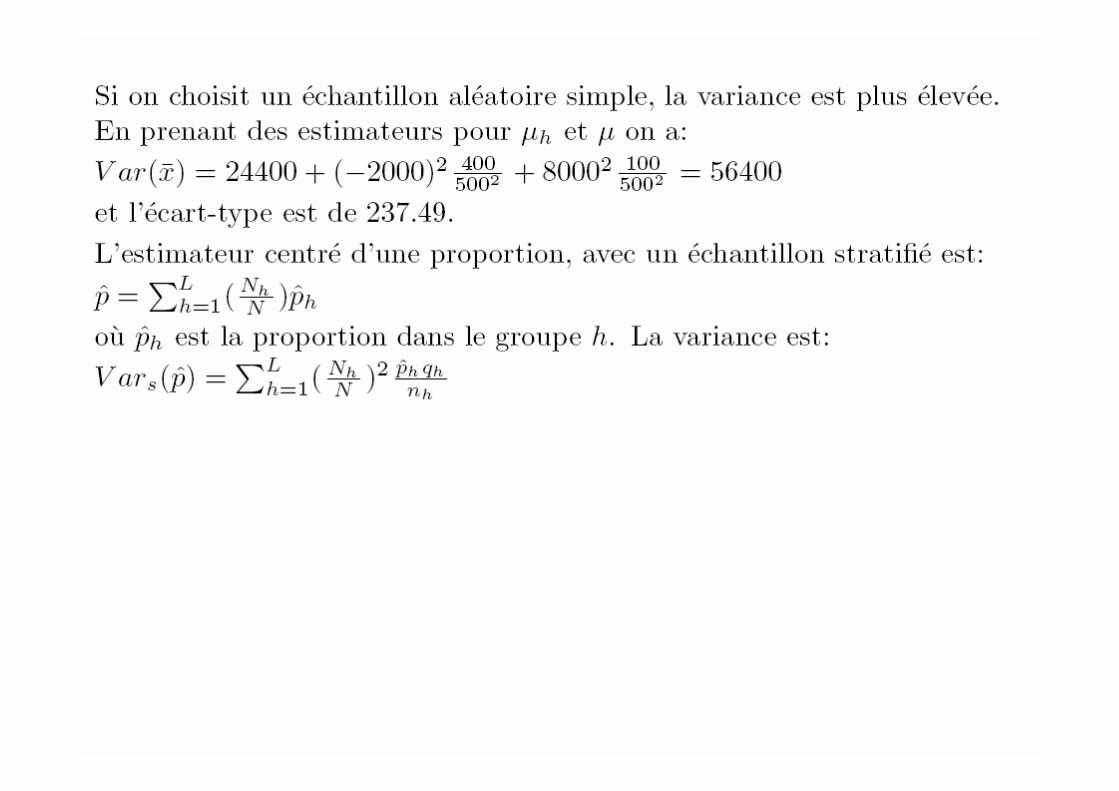


Commande TI-83/84• Calcul de l’intervalle de confiance pour µ ou p avec
un échantillon stratifié• Introduire les proportions des strates dans L1, les
grandeurs des échantillons dans L2, les moyennes ou les pourcentages de oui dans L3 en utilisant la commande STAT / EDIT.
• Aller dans PRGM et choisir STRATM pour µ ou STRATP pour p
• Introduire les écarts-types des strates si STRATM• Introduire le niveau de confiance (C-LEVEL)• En pressant ENTER vous obtenez les intervalles • Ce programme ne fait pas partie des programmes
standard de la TI. Vous devez le télécharger (voir page web du cours)


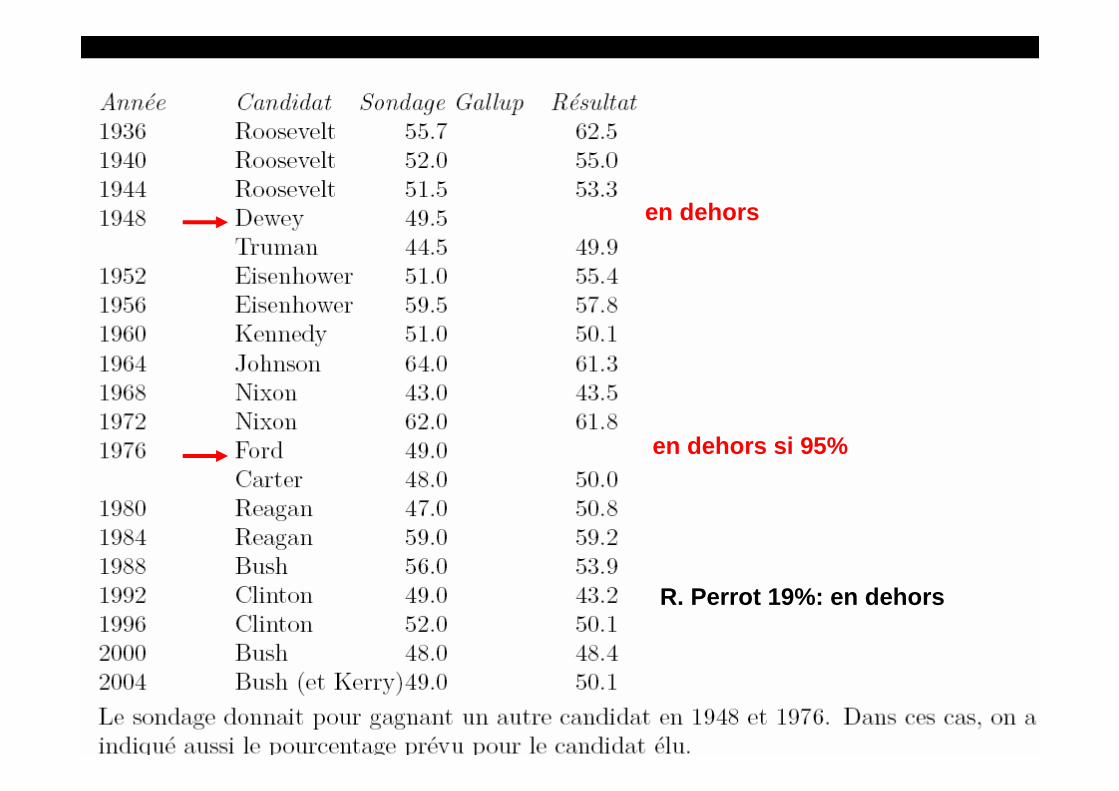
en dehors
en dehors si 95%
R. Perrot 19%: en dehors
4
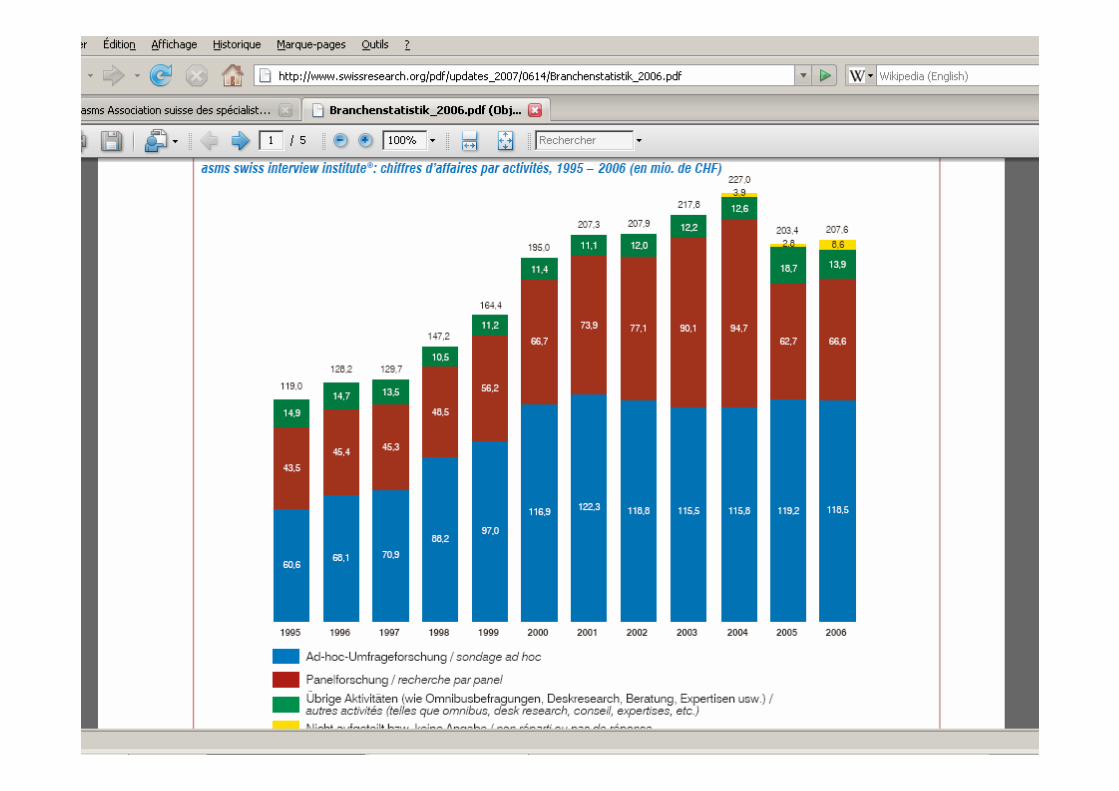


Coût d’un sondage
• CATI (computer assisted telephoneinterview): 43 Fr par interview
• Face-to-face: 59 Fr• Questionnaire: 16 Fr• Personne interviewée en 2005: 2’763’442


Commande TI-83/84• Calcul des probabilités a posteriori avec une
probabilité conditionnelle binomiale• Introduire les proportions dans L1 et les probabilités
a priori dans L2 en utilisant la commande STAT / EDIT.
• Aller dans PRGM et choisir BAPOBI• Introduire nombre épreuves et nombre de succès• En pressant ENTER vous obtenez les probabilités a
posteriori dans L5 que vous pouvez utiliser pour le programme DECISION
• Ce programme ne fait pas partie des programmes standard de la TI. Vous devez le télécharger (voir page web du cours)
Related Documents