LC/MS and LC/MS/MS Determination of Protein Tryptic Digests Eric C. Huang and Jack D. Henion Drug Testing and Toxicology, Cornell University, Ithaca, New York, USA were analyzed by means of online microbore liquid chromatography com- WIth for some proteins. Following conven- tional .dIgestIon WIth trypsm, the freeze-dried r.esIdues were dissolved in high- liquid chromatography (HPLC) eluent and subjected to gradient reversed-phase microbore HPLC separation with mass spectrometric detection. The latter was done in the or tandem (MS/MS) spectrometry mode. The formation of gas-phase from dissolved analytes was accomplished at atmospheric pressure by pneumatically assisted electrospray (ion spray) ionization. This produced field-assisted ion evaporation of dissolved ions, which could then be mass-analyzed for molecular mass or structure. In the full-scan LC/MS mode, the masses for the peptide fragments in the tryptic digests can be their singly or multiply charged ions. When the molecular weights of the peptides he outside the mass range of the mass spectrometer, the multiply charged fea- ture of these experimental conditions still provides reliable molecular weight determinations. addition, collision-activated dissociation (CAD) on selected peptide precursor ions pro- vides online LC/MS/MS sequence information for the tryptic fragments. Results are shown for the tryptic digests of horse heart cytochrome c, bovine ,a-lactoglobulin A, and bovine ,a-lactoglobulin B. (J Am Soc Mass Spectrom 1990, 1, 158-165) T he combination of high-performance liquid chro- matography (HPLC) and mass spectrometry (LC/MS) remains a desirable goal. Although sig- nificant advances have occurred over the last fifteen years [1, 2], the use of routine online LC/MS capabil- ity is common in only a few laboratories worldwide. Most of the successful problem-solving applications, however, focus on so-called small, moderately polar molecules whose molecular weights are typically less than 500. Neither the thermospray [3, 4] nor particle beam [5] LC/MS interfaces have shown much promise for high-sensitivity determinations of the more chal- lenging biomedical molecules such as peptides and proteins. Fast atom bombardment (FAB) in the con- tinuous flow FAB [6, 7] mode has recently shown considerable improvement, but the chromatographic flow rates must be maintained below approximately 5 t-tLlminby using either open tubular [8] or packed capillary columns [9] unless a postcolumn flow split is employed. Although preliminary flow FAB micro- LC/MS results look encouraging, the use of routine reversed-phase separations of real samples has not yet appeared. Currently there is considerable interest in the mass spectrometric characterization of biomolecules. Ana- lytical biochemistry has moved slowly from the use of slab electrophoretic techniques for separations and Address reprint requests to Jack D. Henion, Drug Testing and Toxicology, Comell University, 925 Warren Drive, Ithaca, NY 14850. © 1990 American Society for Mass Spectrometry 1044-0305/90/$3.50 ultracentrifugation for molecular mass determinations. Analytical biotechnology, too, has brought about a need for improved analytical techniques for the char- acterization of primary through quaternary structures of proteins [10]. High-performance liquid chromatography has en- joyed considerable acceptance in the area of biomolecule sample separations [11]. Researchers and commercial suppliers of modern bioactive compounds rely heavily on this technique for both analytical and preparative separations. Conventional DV and fluores- cence detectors, however, have limitations. They lack specificity and sensitivity, so structural characterization of mixture components must be gained by alternative techniques. In effect, HPLC provides only separation of mixture components and an indication that some- thing elutes at a particular retention time. It is clearly desirable to have separation with online specific and sensitive detection [12]. A combination of HPLC and mass spectrometry (LC/MS) provides these attributes. Although the mass spectrometer imposes some limitations on HPLC elu- ent and modifiers (buffers), for the most part accept- able LC/MS analyses of biological mixtures can be accomplished. Gradient reversed-phase capability is typically required with careful selection of HPLC col- umn packings, hardware, and eluent modifiers. As this paper will show, however, good analytical sep- arations and sensitive detection can be achieved with mass spectrometric detection. Received September 1, 1989 Accepted October 10, 1989

Welcome message from author
This document is posted to help you gain knowledge. Please leave a comment to let me know what you think about it! Share it to your friends and learn new things together.
Transcript

LC/MS and LC/MS/MS Determinationof Protein Tryptic Digests
Eric C. Huang and Jack D. HenionDrug Testing and Toxicology, Cornell University, Ithaca, New York, USA
T~yptic ~igests were analyzed by means of online microbore liquid chromatography com~med WIth m~ss ~pec~rome~ry (LC/~S) for some c~mmo~ proteins. Following conventional enzym~tIc .dIgestIon WIth trypsm, the freeze-dried r.esIdues were dissolved in highp~rformanceliquid chromatography (HPLC) eluent and subjected to gradient reversed-phasemicrobore HPLC separation with mass spectrometric detection. The latter was done in the~ull-scan sin~le or tandem (MS/MS) mas~ spectrometry mode. The formation of gas-phaselOn~ from dissolved analytes was accomplished at atmospheric pressure by pneumaticallyassisted electrospray (ion spray) ionization. This produced field-assisted ion evaporation ofdissolved ions, which could then be mass-analyzed for molecular mass or structure. In thefull-scan LC/MS mode, the masses for the peptide fragments in the tryptic digests can bedetermi~ed a~ eithe~ their singly or multiply charged ions. When the molecular weights ofthe peptides he outside the mass range of the mass spectrometer, the multiply charged feature of these experimental conditions still provides reliable molecular weight determinations.I~ addition, collision-activated dissociation (CAD) on selected peptide precursor ions provides online LC/MS/MS sequence information for the tryptic fragments. Results are shownfor the tryptic digests of horse heart cytochrome c, bovine ,a-lactoglobulin A, and bovine,a-lactoglobulin B. (J Am Soc Mass Spectrom 1990, 1, 158-165)
The combination of high-performance liquid chromatography (HPLC) and mass spectrometry(LC/MS) remains a desirable goal. Although sig
nificant advances have occurred over the last fifteenyears [1, 2], the use of routine online LC/MS capability is common in only a few laboratories worldwide.Most of the successful problem-solving applications,however, focus on so-called small, moderately polarmolecules whose molecular weights are typically lessthan 500. Neither the thermospray [3, 4] nor particlebeam [5] LC/MS interfaces have shown much promisefor high-sensitivity determinations of the more challenging biomedical molecules such as peptides andproteins. Fast atom bombardment (FAB) in the continuous flow FAB [6, 7] mode has recently shownconsiderable improvement, but the chromatographicflow rates must be maintained below approximately5 t-tLlmin by using either open tubular [8] or packedcapillary columns [9] unless a postcolumn flow splitis employed. Although preliminary flow FAB microLC/MS results look encouraging, the use of routinereversed-phase separations of real samples has not yetappeared.
Currently there is considerable interest in the massspectrometric characterization of biomolecules. Analytical biochemistry has moved slowly from the useof slab electrophoretic techniques for separations and
Address reprint requests to Jack D. Henion, Drug Testing and Toxicology,Comell University, 925 Warren Drive, Ithaca, NY 14850.
© 1990 American Society for Mass Spectrometry1044-0305/90/$3.50
ultracentrifugation for molecular mass determinations.Analytical biotechnology, too, has brought about aneed for improved analytical techniques for the characterization of primary through quaternary structuresof proteins [10].
High-performance liquid chromatography has enjoyed considerable acceptance in the area ofbiomolecule sample separations [11]. Researchers andcommercial suppliers of modern bioactive compoundsrely heavily on this technique for both analytical andpreparative separations. Conventional DV and fluorescence detectors, however, have limitations. They lackspecificity and sensitivity, so structural characterizationof mixture components must be gained by alternativetechniques. In effect, HPLC provides only separationof mixture components and an indication that something elutes at a particular retention time. It is clearlydesirable to have separation with online specific andsensitive detection [12].
A combination of HPLC and mass spectrometry(LC/MS) provides these attributes. Although the massspectrometer imposes some limitations on HPLC eluent and modifiers (buffers), for the most part acceptable LC/MS analyses of biological mixtures can beaccomplished. Gradient reversed-phase capability istypically required with careful selection of HPLC column packings, hardware, and eluent modifiers. Asthis paper will show, however, good analytical separations and sensitive detection can be achieved withmass spectrometric detection.
Received September 1, 1989Accepted October 10, 1989

JAm Soc Mass Spectrom 1990, 1, 158-165 LC/MS AND LC/MSIMS DETERMINATION OF PROTEIN 159
A perceived limitation of mass spectrometry inthe past has been its mass range. Most quadrupolemass spectrometers have mass ranges from 1000 to4000 u, whereas some magnetic and Fourier transform(FT) mass spectrometers provide greater capability approaching 20,000 u. Only time-of-flight (TOF) massspectrometers have reported capability approaching100,000 u [13], but this is accomplished with peakwidths at half-height of several thousand mass units.Of course, none of these technologies impresses theprotein chemist interested in biomolecules with molecular weights as high as several million units.
An exciting breakthrough in accessing the highermolecular weight ranges with conventional mass spectrometers occurred with the work of Fenn and eoworkers [14, 15]. Their report of multiple charging forhigh molecular weight compounds from electrosprayionization appears to have expanded our view of massspectrometry. Other reports on the continuous slowinfusion of peptide and protein solutions by ourselves[16, 17] and Smith and eo-workers [18] corroboratedthe exciting potential this new capability has for biochemistry and biotechnology. In our work the 16,950-umolecular mass of bovine IJ-Iactoglobulin A was determined to within less than 1 u on a quadrupole massspectrometer with a mass range of only 1400 u [16],whereas Smith et al. [19] reported the molecular massof 1.33 x HP u for the bovine serum albumin dimer.
All the multiple charging of high-mass biomoleculesreported to date has involved the infusion of singlecomponent solutions. Obviously the mass spectrometric analysis of a complex mixture such as an enzymatic digest or a fermentation broth would benefitfrom some prior chromatographic separation. It is wellknown that HPLC is currently the most common technique for accomplishing this task, and the generationof tryptic maps [20], for example, is considered a veryuseful bioanalytical tool.
We propose that the use of online mass spectrometric detection with HPLC is a convenient and preferredapproach to conventional HPLC tryptic mapping. Thepneumatically assisted electrospray (ion spray) LC/MSinterface [21] implemented with an atmospheric pressure ionization (API) ion source provides continuous,stable, and sensitive detection of peptides and proteinsseparated online by microbore HPLC. In one 30-mingradient HPLC analysis, the molecular mass for eachtryptic fragment in the mixture can be determined towithin 1 u. Once the identity of the molecular ion foreach peptide is known, a subsequent HPLC analyticaldetermination in combination with tandem mass spectrometry (LC/MS/MS) can provide sequence information for each tryptic fragment in the HPLC total ioncurrent (TIC) chromatogram. This analytical capabilityshould offer considerable help for the solution of important problems in biochemistry and biotechnology.We present results that demonstrate this capability using tryptic digests of horse heart cytochrome c, bovineIJ-Iactoglobulin A, and bovine IJ-Iactoglobulin B.
Experimental
Materials
The proteins used in this study were bovineIJ-Iactoglobulin A, bovine IJ-Iactoglobulin B, andhorse heart cytochrome c. The enzyme that wasused to digest the protein was trypsin treatedwith L-1-tosylamide-2-phenylethyl chloromethyl ketone (TPCK). These materials were purchased fromSigma Chemical Co. (St. Louis, MO) and were used asreceived without any treatment prior to the digestionprocedure. Sequencing-grade trifluoroacetic acid (TFA)was obtained from Aldrich Chemical Co. (Milwaukee,WI), HPLC-grade acetonitrile was obtained from J.T.Baker Chemical Co. (Phillipsburg, NJ), and HPLCgrade water was from Fisher Scientific (Rochester,NY).
Enzymatic Digestion
Bovine IJ-Iactoglobulin A, bovine IJ-Iactoglobulin B,and horse heart cytochrome c were digested withTPCK-treated trypsin for 16-20 h at 37°C with asubstrate-to-enzyme ratio of 50:1 (w/w) in 50 mM ammonium bicarbonate buffer solution at pH 8.5 (thepH of the buffer solution was adjusted with 1 M ammonium hydroxide). The digestion solution was thenlyophilized and redissolved in water containing 3 mMTFA with an approximate sample concentration of 0.5,or 1 mg protein per milliliter solvent. A sample size of5 ItL was typically injected on-column unless otherwisestated.
Microbore Liquid Chromatography
The preferred microbore LC column used for all protein tryptic digest separations was 1 mm in internaldiameter, 10 cm long, and packed with 5-ltm LC-308packing material (bonded with C-8 stationary phase,300 A pore size) provided by Supelco (Supelco, Inc.,Bellefonte, PA). The micro LC system consisted of aBrownlee Labs Micropump (Santa Clara, CA) and wasused without any modification. The injection of sample was accomplished with a Model 9125 biocompatible syringe-loading sample injector with a 5-ItL external sample loop (Rheodyne, Cotati, CA). The mobilephase was composed of 3 mM TFA/H20 as solvent Aand 3 mM TFA/CH3CN as solvent B. All separationswere accomplished by applying a linear solvent gradient from 5% solvent B to 70% solvent B in a timeperiod of 60 min. With this gradient program, the LCrun times were typically within 40 min. The columnflow was maintained at 40 ItL/min throughout theseexperiments. The exit of the analytical column wasconnected directly to the pneumatically assisted electrospray interface. There was no presplit (before thecolumn) or postsplit (after the column, before entering the ion spray interface) of the mobile phase.
160 HUANG AND HENIGN JAm Soc Mass Spectrom 1990, 1, 158-165
Mass Spectrometry
A Sciex (Thornhill, Ontario, Canada) TAGA 6000Etriple quadrupole mass spectrometer equipped withan API source was used. The interface for couplingthe microbore LC system with APIIMS was a pneumatically assisted electrospray (ion spray) interface thatwas constructed in-house. Details of the interface construction were described previously [21]. The LC/MSinterface sprayer can be floated at ±3 kV potential.The polarity of this potential is dependent upon theoperational mode (i.e., positive ion or negative iondetection) of the mass spectrometer. In the presentstudy the mass spectrometer was operated under positive ion mode of detection for protonated peptides.Ions generated from the ion spray interface via ionevaporation mechanisms were sampled into the massspectrometer by a potential difference (typically 2.5kV) set between the sprayer and the sampling orifice. The sampling orifice was a 100-p.m-diameter holeat the end of the conical nozzle. Ultrapure nitrogen(Linde Specialty Gases, Danbury, CT) was applied atthe atmospheric side of the skimmer to minimize solvent clusters and particulate matter entering the massspectrometer. For online LC/MS experiments, the firstquadrupole (Q-1) was scanned from m/z 350 to m/z 1400in 10 s with a scan step of 1 u. For MS/MS, ultrapureargon (AIRCO, The BOC Group, Inc., Murray Hill,NJ) was used as the collision gas and was introducedinto the collision cell (Q-2) at a target gas thicknessof 200 x 1012 atoms/cm". The collision energy was controlled by the Q-2 offset voltage. A typical Q-2 offset voltage was -20 V in this work unless otherwisestated. The product ion mass spectra were acquired byscanning the third quadrupole (Q-3) while Q-1 was setfor transmitting the precursor ion. The Q-3 offset wasprogrammed to provide optimum ion transmission efficiency.
Results and Discussion
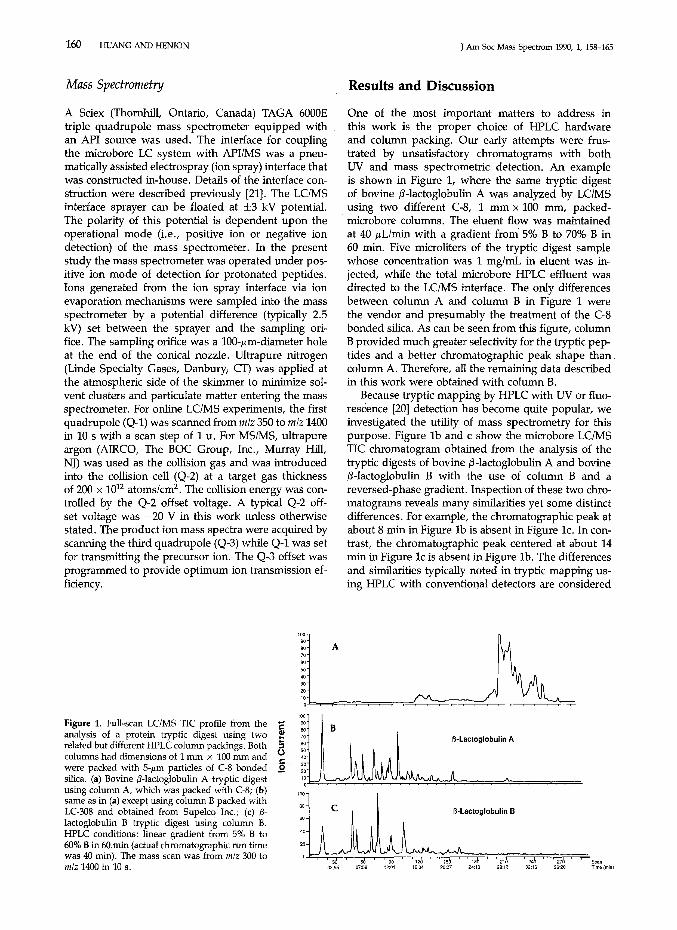
One of the most important matters to address inthis work is the proper choice of HPLC hardwareand column packing. Our early attempts were frustrated by unsatisfactory chromatograms with bothUV and mass spectrometric detection. An exampleis shown in Figure 1, where the same tryptic digestof bovine J3-lactoglobulin A was analyzed by LC/MSusing two different C-8, 1 mm x 100 mm, packed-
. microbore columns. The eluent flow was maintainedat 40 p.Llmin with a gradient from 5% B to 70% B in60 min. Five microliters of the tryptic digest samplewhose concentration was 1 mg/mL in eluent was injected, while the total microbore HPLC effluent wasdirected to the LC/MS interface. The only differencesbetween column A and column B in Figure 1 werethe vendor and presumably the treatment of the C-8bonded silica. As can be seen from this figure, columnB provided much greater selectivity for the tryptic peptides and a better chromatographic peak shape thancolumn A. Therefore, all the remaining data describedin this work were obtained with column B.
Because tryptic mapping by HPLC with UV or fluorescence [20] detection has become quite popular, weinvestigated the utility of mass spectrometry for thispurpose. Figure 1b and c show the microbore LC/MSTIC chromatogram obtained from the analysis of thetryptic digests of bovine J3-lactoglobulin A and bovineJ3-lactoglobulin B with the use of column B and areversed-phase gradient. Inspection of these two chromatograms reveals many similarities yet some distinctdifferences. For example, the chromatographic peak atabout 8 min in Figure 1b is absent in Figure 1c. In contrast, the chromatographic peak centered at about 14min in Figure 1c is absent in Figure lb. The differencesand similarities typically noted in tryptic mapping using HPLC with conventional detectors are considered
A'00
90
80
70
'050403020
'~.b.....-oF=';::"<;:=;:=;==;=;=='~;'::::~~;:::::::;::::::;""-~~~"":-:~~;:'
100~90
80 B
~O :00"0'"''·~ .....~~ ..... ~- ..;:::.==,:::::A;-!;::=====
Figure 1. Full-scan LC/MS TIC profile from the 'Eanalysis of a protein tryptic digest using two erelated but different HPLC column packings. Both scolumns had dimensions of 1 mm x 100 mm and ()c:were packed with 5-JLm particles of C-8 bonded Esilica. (a) Bovine ,6-lactoglobulin A tryptic digestusing column A, which was packed with C-8; (b)same as in (a) except using column B packed withLC-308 and obtained from Supelco Inc.; (c) ,6lactoglobulin B tryptic digest using column B.HPLC conditions: linear gradient from 5% B to60% B in 60.min (actual chromatographic run timewas 40 min). The mass scan was from m/z 300 tom/z 1400 in 10 s.
100
80
60
40
20
c B-Lactoglobulin B
ScanTime (min)
JAm SocMass Spectrom1990, 1, 158-165 LClMS AND LCIMS/MS DETERMINATION OF PROTEIN 161
30
m/z =390
m/z =361
m/z = 729
m/z = 1006
2010
1I
D
c
A100]755025ol----~ "'I"""--"""-...,...---.....,
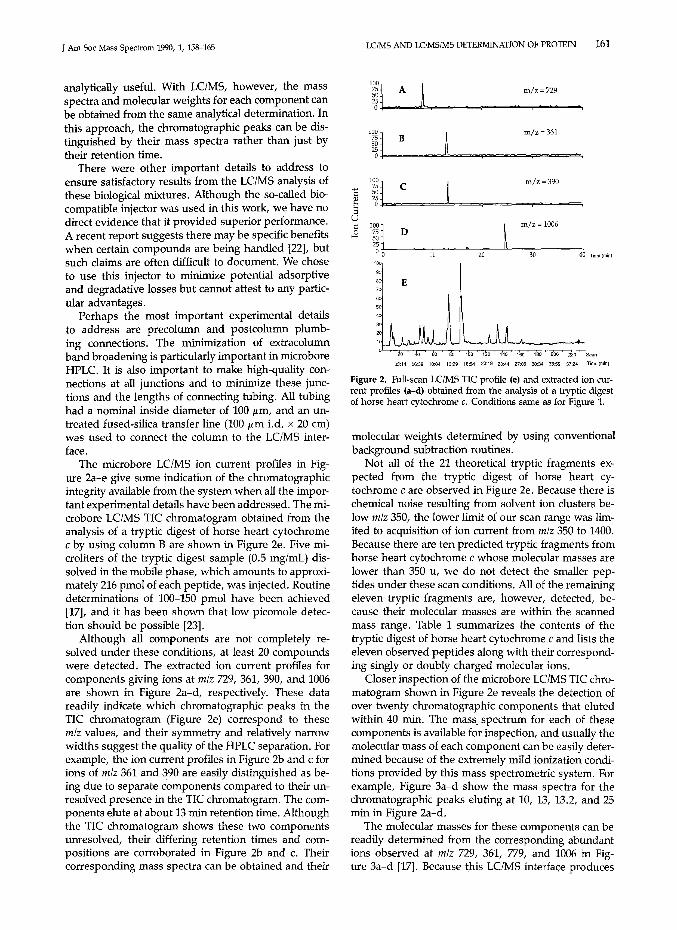
Figure 2. Full-scan LClMS TIC profile (e) and extracted ion current profiles (a-d) obtained from the analysis of a tryptic digestof horse heart cytochrome c. Conditions same as for Figure 1.
molecular weights determined by using conventionalbackground subtraction routines.
Not all of the 21 theoretical tryptic fragments expected from the tryptic digest of horse heart cytochrome c are observed in Figure 2e. Because there ischemical noise resulting from solvent ion clusters below mlz 350, the lower limit of our scan range was limited to acquisition of ion current from m/z 350 to 1400.Because there are ten predicted tryptic fragments fromhorse heart cytochrome c whose molecular masses arelower than 350 u, we do not detect the smaller peptides under these scan conditions. All of the remainingeleven tryptic fragments are, however, detected, because their molecular masses are within the scannedmass range. Table 1 summarizes the contents of thetryptic digest of horse heart cytochrome c and lists theeleven observed peptides along with their corresponding singly or doubly charged molecular ions.
Closer inspection of the microbore LClMS TIC chromatogram shown in Figure 2e reveals the detection ofover twenty chromatographic components that elutedwithin 40 min. The mass, spectrum for each of thesecomponents is available for inspection, and usually themolecular mass of each component can be easily determined because of the extremely mild ionization conditions provided by this mass spectrometric system. Forexample, Figure 3a-d show the mass spectra for thechromatographic peaks eluting at 10, 13, 13.2, and 25min in Figure Za-d,
The molecular masses for these components can bereadily determined from the corresponding abundantions observed at mlz 729, 361, 779, and 1006 in Figure 3a-d [17]. Because this LClMS interface produces
analytically useful. With LC/MS, however, the massspectra and molecular weights for each component canbe obtained from the same analytical determination. Inthis approach, the chromatographic peaks can be distinguished by their mass spectra rather than just bytheir retention time.
There were other important details to address toensure satisfactory results from the LC/MS analysis ofthese biological mixtures. Although the so-called biocompatible injector was used in this work, we have nodirect evidence that it provided superior performance.A recent report suggests there may be specific benefitswhen certain compounds are being handled [22], butsuch claims are often difficult to document. We choseto use this injector to minimize potential adsorptiveand degradative losses but cannot attest to any particular advantages.
Perhaps the most important experimental detailsto address are precolumn and postcolumn plumbing connections. The minimization of extracolumnband broadening is particularly important in microboreHPLC. It is also important to make high-quality connections at all junctions and to minimize these junctions and the lengths of connecting tubing. All tubinghad a nominal inside diameter of 100 /Lm, and an untreated fused-silica transfer line (100 /Lm i.d. x 20 cm)was used to connect the column to the LClMS interface.
The microbore LClMS ion current profiles in Figure 2a-e give some indication of the chromatographicintegrity available from the system when all the important experimental details have been addressed. The microbore LClMS TIC chromatogram obtained from theanalysis of a tryptic digest of horse heart cytochromec by using column B are shown in Figure 2e. Five microliters of the tryptic digest sample (0.5 mg/mL) dissolved in the mobile phase, which amounts to approximately 216 pmol of each peptide, was injected. Routinede terminations of 100-150 pmol have been achieved[17], and it has been shown that low picomole detection should be possible [23].
Although all components are not completely resolved under these conditions, at least 20 compoundswere detected. The extracted ion current profiles forcomponents giving ions at m/z 729,361,390, and 1006are shown in Figure 2a-d, respectively. These datareadily indicate which chromatographic peaks in theTIC chromatogram (Figure 2e) correspond to thesem/z values, and their symmetry and relatively narrowwidths suggest the quality of the HPLC separation. Forexample, the ion current profiles in Figure 2b and c forions of m/z 361 and 390 are easily distinguished as being due to separate components compared to their unresolved presence in the TIC chromatogram. The components elute at about 13 min retention time. Althoughthe TIC chromatogram shows these two componentsunresolved, their differing retention times and compositions are corroborated in Figure 2b and c. Theircorresponding mass spectra can be obtained and their

162 HUANG AND HENION JAm Soc Mass Spectrom 1990, 1, 158-165
Table 1. Theoretical and observed mass of tryptic peptides of horse heart cytochrome cfrom ion spray LC/MS
Theoretical a MW Observed (M+H)+ (M+2H)2+
Tp 1 546 Tp 1 547
Tp 4 634 Tp 4 635
Tp 5 1018 Tp 5 570
Tp 8 1168 Tp 8 585
Tp 10 1456 Tp 10 729
Tp 12 2010 Tp 12 1006
Tp 14 678 Tp 14 679
Tp 15 779 Tp 15 390
Tp 18 360 Tp 18 361
Tp 19 964 Tp 19 483
Tp 21 433 Tp 21 434
a Horse heart cytochrome c tryptic peptide fragments whose singly or doubly charged molecular ions lie withinthe m/z 350-1400 range scanned during the course of these Le/MS experiments.
b Out of the mass spectrometry scan range (350-1400 ul,c Low ion abundance.
Note: All the expected tryptic peptides [11] are observed.
The degree of multiple charging can be readily calculated [16], and hence one can determine the molecular masses of peptides that may lie outside the massrange of the mass spectrometer. An example of this isseen in Figure 3d, where the molecular mass of the T12 fragment is 2010 u, or 610 u above the mass rangeof our quadrupole mass spectrometer. However, itsdoubly protonated, doubly charged ion at mlz 1006and its triply protonated, triply charged ion at m/z 671are readily detected. Molecular masses above the massrange of the mass spectrometer, therefore, can be readily determined for the components detected in a gradient microbore LClMS analytical determination of sucha tryptic digest.
When one has the molecular masses for components of interest in the LClMS TIC chromatogram froma tryptic digest, the next logical step is to combineHPLC with MS/MS in an effort to gather sequence information from collision-activated dissociation (CAD).Online LClMS/MS is, in fact, a natural combinationwith this LClMS interface. The very mild ionizationconditions produce mass spectra with most of the ioncurrent in one or two ions. These may be selectivelyfocused into the collision cell for CAD to gather sequence or structural information based on the formation of product ions.
The product ion full-scan TIC chromatogramsshown in Figure 4 were obtained from the onlinemicrobore LClMS/MS analysis of the tryptic digestof bovine fJ-lactoglobulin A. The gradient microboreHPLC experimental conditions used were the sameas described for Figure 1. The T-8 singly protonated,singly charged precursor ion at mlz 573 was focusedwith Q-l into the collision cell Q-2, and argon was usedwith a collision energy of 50 eV (laboratory frame) anda collision gas thickness of 200 x 1012 atoms/ern- for theCAD experiment shown in Figure 4a. Q-3 was scannedrepetitively from m/z 50 to m/z 1300. The full-scan CAD
T-IO:TGQAPGFSYTDANK(MW=1456)
T-18: GER(MW=360)
T-15:MIFAGIK(MW=779)
729.0 [M +2Hr+
700 800 900 1000 1100 1200 1300 1400 m/z
500 600 700 SOD 900 1000 1100 1200 1300
67 .0 [M+3Hf+
T-12:o GITWGEETLMEYLENPK
(MW=2010)1006.0 [M+2H]2+
c
.0 [M+2Hr+
400 500 600 700 800 900 1000 1100 1200 1300 1400 m/z
B
-[M+H]+rn/z=361
1009080706050403020
19:-I-c-40""0.........,=-.-,.,,,........I.:±.....--,=-......,,,o:----,.±,........,-,.;;;;--.-,-;;,,,,,...~;;-- m/ z
10 398765432
100~LJ,!;;--=-~r;;;----;;;;;;--~......-,;r;;;--.,-;;;;;;-'"""'=.....,,>on""'i'Tn;;-,""",",
10090
A807060
[M+fP+50403020 486.0100 400 500 600
Figure 3. Full-scan ion evaporation mass spectra of (a) T-IO, (b)T-18, (c) T-15, and (d) T-12 peptides obtained from the trypticdigest of horse heart cytochrome c (Figure 2).
no fragment ions from these peptides, their abundantprecursor ions are readily discernible. For the smallerpeptides or for those that have only one basic aminoacid residue, singly protonated, singly charged precursor ions usually predominate; this is observed, forexample, for the T-18 fragment shown in Figure 3b.When these peptides have multiple basic sites (aminoacids) or basic sites plus a terminal amino moiety, however, they often produce multiply protonated, multiply charged precursor ions [15-18].

J AID Soc Mass Spectrom 1990, 1, 158-165 LC/MS AND LCIMS/MS DETERMINATION OF PROTEIN 163
573 -.. 50, 1300
AT-8A
'~ 1f-=-=====~----'======-=;=======;=========;B T-18
Figure 4. Full-scan LC/MS/MS (m/z 501300) product ion TIC chromatograms forthe analysis of a tryptic digest of bovine {3lactoglobulin A. (a) CAD on m/z 573, T-8;(b) CAD on m/z 419, T-18; (c) CAD on m/z674, T-10. See text for LClMS/MS experimental details.14 Time (min)12
L674 -.. 50, 1300
~ "-../"
8 10
C T-10100 j75
50
25
01-====~=r===='~===~~';======~~--=-~=6.==;
product ion mass spectrum resulting from this experiment is shown in Figure 5. This mass spectrum wastaken from the apex of the chromatographic peak centered at 8.3 min retention time in Figure 4a. Althoughthe singly protonated, singly charged precursor ionat m/z 573 remains as the most abundant in this 50eV spectrum, an abundance of structurally significantproduct ions is observed. These include the 1-4 frag-"ments from the A, B, and Y" series of sequence ions[24]. The presence of each ion series in this CAD spectrum provides evidence for the corresponding aminoacids in the peptide sequence. Although additional information would be needed for characterizing isomericresidues, sequence information from these product ionspectra should be possible and rules leading to thegeneral use of such spectra for these purposes could bedeveloped. Considerable effort is still required, however, to test these generalizations, and this work isunder way.
The CAD mass spectrum for the doubly protonated,doubly charged precursor ion-product ion relationshipshown in Figure 4b is shown in Figure 6. The precursorion at m/z 419 was focused with Q-l into the collisioncell, Q-2, and argon was used with a collision energy of50 eV (laboratory frame) and a collision gas thicknessof 200 x 1012 atoms/cm". Q-3 was scanned repetitivelyfrom m/z 50 to m/z 1300 in 10 s. The online LC/MS/MStotal product ion current profile from mlz 50 to m/z1300 resulting from CAD of the m/z 419 precursor ionfor the analysis of the tryptic digest from bovine {3lactoglobulin A is shown in Figure 4b. The CAD massspectrum shown in Figure 6 was obtained from thechromatographic peak centered at 11.1 min retentiontime shown in Figure 4b.
Inspection of the m/z 419 product ion spectrum inFigure 6 shows an abundance of fragment ions including some (m/z 556, 636, 653, and 766) above the massto-charge ratio range of the precursor ion. The pres-
[M+H] +
573.0
scctl"0C
'".0<I:'" 5>~IDer:
82
227
v., 11 A2 248
199
147
Y~' y"3
A,
~~"'347
86
~276 2~260
Y~'
(460
460 500 540
I-I-A-E-K
580 620 660
Figure 5. Full-scan CAD mass spectrum of asingly charged tryptic peptide (T-8) derivedfrom {3-lactoglobulinA (Figure 4a). For condi-tions, see Figure 4. '

164 HUANG AND BENION J Am Sac Mass Spectram 1990, 1, 158-165
327.0
[M+2H]2+157.0
419.0
A-L-P-M-H-86.0
110+ +N N~
.81 82
~ J:+ +72 2:: ~1B5
I /I /
V; I 'V" V~ V~ V"202,2) 2
6175
,I -I ~I 2BB (425 556.0
I ,I II1 I!,I I, 766
6530
V;"
Figure 6. Full-scan CAD mass spectrum ofa doubly charged tryptic peptide (I-IS)derived from bovine l3-lactoglobulin A(Figure4b). For conditions, see Figure 4and text.
100
90
BD
70
Clo
60Cctl
"0C
50::>.0<l:Cl 40>'@
30a;er:
20
10
100 200
2+IY;"+H]
300 400 500 600 700 BOO
I-R
ence of product ions at a higher mlz than the precursor ion is a unique feature for CAD of multiply chargedions. Although the interpretation of the CAD spectrumresulting from a doubly charged ion would be expectedto be less straightforward than that described above, itis still possible to gather useful information from suchdata. Unlike the rather confusing information reportedfrom CAD of precursor ions containing many charges[18], the product ion spectra resulting from doublycharged ions appear to be useful [25]. Inspection ofFigure 6 reveals abundant singly charged ions at mlz653 and 157, for example, but also an abundant doublycharged fragment ion at mlz 327 with weaker doublycharged ions at mlz 213 and 278. These latter ions cancomplicate the interpretation of results, but knowledgeof their likelihood can help clarify their origin.
The product ion mass spectra in Figures 5 and 6reveal fragments corresponding to A, B, and Y" series ions [24]. On the basis of knowledge gained fromFAB/MS/MS peptide sequencing from singly chargedprecursor ions, it has been suggested that the mostcommonly observed fragment series are A, B, C", Y",Z,and Z" for positive ion spectra and C, "X, Y, "Y,and Z for negative ion spectra [26-29]. Our positiveion CAb spectra from both singly and doubly chargedprecursor ions indicate a complete fragment series ofA, B, and Y" ions. Further work is in progress to delineate the relevance of CAD product ion mass spectrato structural characterization of doubly charged ionssuch as those resulting from tryptic peptides.
Figure 6 also indicates an unusually abundant product ion at mlz 327. Examination of possible CAD fragments from this heptapeptide derived from the bovineiJ-Iactoglobulin A tryptic digest reveals no obvious association with the established amino acid sequence.Because the mlz 419 precursor ion was known to bedoubly protonated and doubly charged, the mlz 327fragment ion may be either singly or doubly charged.If the precursor ion were to be protonated at remoteamino acid sites, the cleavage of an internal bond inthe CAD process could yield two singly charged fragment ions. However, if one of these fragments con-
tained a basic amino acid such as the histidine presentin this T-18 fragment, then both the histidine and theamino terminus could be protonated, thus generatinga doubly charged fragment ion. The additional proton in this doubly charged fragment ion would haveto result from a rearrangement process to produce theobserved [Y5" + Hf+ product ion. Thus we suggestthat the abundant mlz 327 fragment ion results fromthe addition of a proton to the singly charged Y~ fragment ion. Further work on known peptides is neededto verify this speculation. Additional support for thisobservation would be provided by the presence of doubly charged fragments derived from Y~' and Y~ (mlz425 and 556, respectively). This is corroborated by thepresence of ions at mlz 213 and 278, respectively, inFigure 6.
FAB/MS/MS studies of peptides that contain a histidine residue show that CAD always gives an immonium ion at mlz 110 [30, 31]. We also see mlz 110 inFigure 6. This is a convenient way to determine thepresence of histidine in the peptide, although not itsposition in the peptide chain. The results describedabove for CAD of the doubly charged ion, however,also provide information on the position of the histidine via reading through the doubly charged Y" ions.
Summary and Conclusions
The use of LClMS and LClMS/MS for the characterization of protein tryptic digests can be a very powerful bioanalytical technique. A mass spectrometerequipped with a pneumatically assisted electrospray(ion spray) LClMS interface with an API ion source canmaintain good chromatographic integrity for reversedphase gradient HPLC separations of these digests atthe low picomole level. In addition to the informationafforded by conventional tryptic mapping using HPLCwith DV or fluorescence detection, microbore LClMScan assist in the identification of each peptide by providing its molecular mass. Peptides whose molecularmasses lie beyond the mass range of the mass spec-

J Am Sac Mass Spectram 1990, 1, 158-165 LC/MS AND Le/MS/MS DETERMINATION OF PROTEIN 165
trometer can be determined by calculating the numberof charges exhibited by the precursor ions formed.
In addition to determining the molecular masses forthe tryptic peptides, it is feasible to obtain amino acidsequence information by combining HPLC with onlineMS/MS. Once the precursor ions are known from themicrobore LC/MS results, one can sequentially focusthem into the collision cell in a subsequent online analysis to obtain the full-scan CAD mass spectra. Bothsingly and doubly charged precursor ions appear toprovide meaningful structural information that can facilitate characterization of the peptide sequence. Although additional systematic work is necessary to develop this interpretation ability, it is anticipated thatthis approach to peptide and hence protein characterization will offer tremendous assistance to analyticalbiochemistry.
AcknowledgmentsWe thank Richard Ludwig of Supelco Inc. for providing the microbore C-8 column and Sciex for hardware and research support. We also thank Dr. T. Covey for assistance and helpful suggestions during the course of this work, and E.C.H. thanks theEastman Kodak Company for financial support.
References
1. Arpino, P. J.; Cuiochon, G. Anal. Chem. 1979, 51,682A-701A.
2. Covey, T. R; Lee, E. D.; Bruins, A. P.; Henion, J. D. Anal.Chem. 1986, 58, 1451A-1461A.
3. Garteiz, D. A.; Vestal, M. 1. LC Mag. 1985, 3, 334-346.4. Stachowiak, K; Wilder, c.. Vestal, M. 1.; Dyckes, D. F. J.
Am. Chem. Soc. 1988, 110, 1758-1765.5. Winkler, P. c.. Perkins, D. D.; Williams, W. K; Browner, R.
F. Anal. Chem. 1988, 60, 489-493.6. Ashcroft, A. E. OMS Lett. 1987, 22, 754-757.7. Caprioli, R. M. Biochemistry 1988, 27, 513-521.8. Mosely, A. M.; Deterding, 1. J.; Tomer, K B.; Bragg, N.;
[orgenson, J.W. Capillary zone electrophoresis and capillaryliquid chromatography coupled with sector mass spectrometry using coaxial continuous flow FAB interfaces, Proceedingsof the 37th ASMS Conference on Mass Spectrometry and AlliedTopics; Miami Beach, FL, May 21-26, 1989, P 114.
9. Bourell, J. H.; Henzel, W. J.; Stults, J. T. Analysisof enzymatically digested proteins by on-line capillary
HPLClFABMS, presented at the 37th ASMS Conference onMass Spectrometry and Allied Topics; Miami Beach, FL, May21-26, 1989, P 1015.
10. Glajch, J. 1. Anal. Chem. 1986,58,385-394.11. Dong, M. W.; Cant, J. R.; Larsen, B. R Biochromatography
1989, 4, 19-33.12. Garnick, R. 1.; Solli, N. J.; Papa, P. A. Anal. Chem. 1988, 60,
2546-2557.13. Karas, M.; Hillenkamp, F. Anal. Chem. 1988, 60, 2301-2303.14. Whitehouse, C. M.; Dreyer, R. N.; Yamashita, M.; Fenn, J.
B. Anal. Chem. 1985, 57, 675-679.15. Mann, M.; Meng, C. K; Fenn, J. B. Anal. Chem. 1989, 61,
1702-1708.16. Covey, T. R.; Bonner, R. F.; Shushan, B. 1.; Henion, J. D.
Rapid Commun. Mass Spectrom. 1988,2,249-255.17. Henion, J.D.; Covey, T. R; Muck, W.; Huang, E. C. LC/MS
of proteins and large peptides. Presented at the 37th ASMSConference on Mass Spectrometry and Allied Topics; MiamiBeach, FL, May 21-26, 1989, P 1014.
18. Barinaga, C. J.; Edmonds, C. G.; Udseth, H. R; Smith, RD. RapidCommun. Mass Spectrom. 1989,3, 160-164.
19. Smith, R D.; Loo, J. A.; Barinaga, C. J.; Udseth, H.Presented at the 5th (Montreux) Symposium on LClMS,Freiburg, FRG, November 1988.
20. Schroeder, W. A. In Handbook of HPLC for the Separation ofAmino Acids, Pepiides, and Proteins; Hancock, W. S., Ed.;CRC: Boca Raton, FL, Vol. 2, Protein Identification by PeptideMapping, 1984, pp 287-300.
21. Bruins, A. P.; Covey, T. R; Henion, J. D. Anal. Chem. 1987,59, 2642-2646.
22. Hattangadi, S. LC-GC 1989, 7, 108-114.23. Lee, E. D.; Covey, T. R; Henion, J. D. J. Microcol. Sep. 1989,
1, 14-18.24. Roepstorff, P.; Fohlman, J. Biomed. Mass Spectrom. 1984, 11,
601-602.25. Hunt, D. F.; Zhu, N.; Shabanowitz, J.; RapidCommun. Mass
Spectrom. 1989, 3, 122-124.26. Westmore, J.B.; Ens, W.; Standing, K. G. Biomed. Mass Spec
trom. 1982, 9, 119-124.27. Barber, M.; Bordoli, R S.; Sedgwick, D.; Tyler, A. N.; Whal
ley, E. T. Biomed. Mass Spectrom. 1981, 8, 337-342.28. Williams, D. H.; Bradley, C. V.; Santikarn, S.; Bojesen, G.
J. Biochem. 1982, 201, 105-117.29. Konig, W. A.; Aydin, M.; Schulze, D.; Rapp, D.; Hohn, M.;
Pesch, R; Kalikhevitch, V. N. Int. J. Mass Spectrom. Ion Phys.1983, 46, 403-408.
30. Gaskell, S. J.; Haroldsen, P. E.; Reilly, M. H. Biomed. MassSpectrom. 1988, 16, 31-33.
31. Heerma, W.; Kulik, W. Biomed. Mass Spectrom. 1988, 16,155-159.
Related Documents