Energy and Buildings 45 (2012) 229–239 Contents lists available at SciVerse ScienceDirect Energy and Buildings j ourna l ho me p age: www.elsevier.com/locate/enbuild LCC and LCCO 2 analysis of green roofs in elementary schools with energy saving measures TaeHoon Hong ∗ , JiMin Kim, ChoongWan Koo Department of Architectural Engineering, Yonsei University, Seoul 120-749, Republic of Korea a r t i c l e i n f o Article history: Received 20 June 2011 Received in revised form 25 October 2011 Accepted 5 November 2011 Keywords: Green roof systems Energy saving measures Elementary school Life cycle cost Life cycle CO2 a b s t r a c t As the area of urban forests rapidly decrease in size, there is growing interest in green roofs as the only alternative to urban forests. This study aimed to evaluate economic and environmental effects of functional improvement in elementary school facilities by applying various improvement scenar- ios based on green roof systems (GRSs) with the combination of energy-saving measures (ESMs). A total of 16 possible improvement scenarios from the combination of GRSs and ESMs were developed, and energy modeling (Energy Plus ver. 6.0), based on the (i) characteristics of building, (ii) regional climate, and (iii) season, was performed. Using the energy modeling result, the amount of the CO 2 emission reduction by energy savings and the CO 2 absorption by GRSs’ plants was calculated, and a life cycle cost analysis was conducted with the consideration of the life cycle CO 2 (LCCO 2 ). The results of this study can be used (i) to introduce the most appropriate ESMs for the specific facility when applying GRSs, (ii) to decide which location is proper to implement GRSs considering characteris- tics of regional climate, and (iii) to select energy- and cost-efficient elementary school when applying GRSs. © 2011 Elsevier B.V. All rights reserved. 1. Introduction The concentration of urban populations, which causes urban climatic and environmental changes such as floods, shortage of underground water, and urban desertification, is causing a rapid decrease in urban forests and worsening environmental pollu- tion day by day [1]. The forest reduction rate in South Korea is 35 times higher than the global average forest reduction rate, and particularly, the area of urban forests in representative metropoli- tan cities, including Seoul, is 6.78 m 2 /person, about two-thirds of the minimal standard (9 m 2 /person) recommended by the World Health Organization (WHO). The area of urban forests in Seoul is 4.54 m 2 /person, which is relatively smaller than that in Tokyo (5.14 m 2 /person), Paris (13 m 2 /person), New York (23 m 2 /person), and London (27 m 2 /person) [2]. Thus, in cities such as Seoul where the urban ecosystem is threatened by excessive urbanization, even the smallest green area must be gradually acquired to improve the micro-climate of the city. In South Korea or Japan, however, where the population is concentrated, there is an extreme lack of urban forests, and it is currently difficult to rapidly expand or improve existing green open spaces. Therefore, green roof systems (GRSs) ∗ Corresponding author. Tel.: +82 2 2123 5788; fax: +82 2 2248 0382. E-mail address: [email protected] (T. Hong). are considered as the only alternative to acquiring urban forests on the ground [3,4]. As such, some countries are taking various measures to promote GRSs. In Japan, the Tokyo Prefecture has attempted to distribute GRSs by enacting regulations that make GRSs mandatory as of April 2001 for newly built, renovated, and expanded buildings whose land area is 1000 m 2 or larger. Similarly, South Korea is conducting the Green School Project, one of the core projects in the country’s Green New Deal Program, which combines green growth and job creation. According to the Green School Project, the South Korean government is implementing the overall repair and renovation of existing elementary and middle school facilities that are severely deteriorated, using eco-friendly techniques, including GRSs [5]. Despite such policy efforts, GRSs both in South Korea and abroad are not being rapidly deployed because of difficulties such as limited budgets, lack of owner commitment of GRSs, higher construction cost compared to the energy-saving effect, and difficulties in repair and maintenance aspect [6]. Therefore, the introduction of GRSs considers not merely the quantitative increase in urban forests, but also their effect on improving the quality of cities and building performance. First, in terms of improving urban environments, GRSs alleviate the thermal island effect, reduce damages from urban flooding, purify the air (emitting oxygen by absorbing CO 2 and heavy metal particles in the air), and help boost bio-diversity. Second, in terms of improving the environment in a building, GRSs improve the building’s 0378-7788/$ – see front matter © 2011 Elsevier B.V. All rights reserved. doi:10.1016/j.enbuild.2011.11.006

Welcome message from author
This document is posted to help you gain knowledge. Please leave a comment to let me know what you think about it! Share it to your friends and learn new things together.
Transcript

Lm
TD
a
ARRA
KGEELL
1
cudt3pttHi(attmtfe
0d
Energy and Buildings 45 (2012) 229–239
Contents lists available at SciVerse ScienceDirect
Energy and Buildings
j ourna l ho me p age: www.elsev ier .com/ locate /enbui ld
CC and LCCO2 analysis of green roofs in elementary schools with energy savingeasures
aeHoon Hong ∗, JiMin Kim, ChoongWan Kooepartment of Architectural Engineering, Yonsei University, Seoul 120-749, Republic of Korea
r t i c l e i n f o
rticle history:eceived 20 June 2011eceived in revised form 25 October 2011ccepted 5 November 2011
eywords:reen roof systemsnergy saving measures
a b s t r a c t
As the area of urban forests rapidly decrease in size, there is growing interest in green roofs as theonly alternative to urban forests. This study aimed to evaluate economic and environmental effectsof functional improvement in elementary school facilities by applying various improvement scenar-ios based on green roof systems (GRSs) with the combination of energy-saving measures (ESMs). Atotal of 16 possible improvement scenarios from the combination of GRSs and ESMs were developed,and energy modeling (Energy Plus ver. 6.0), based on the (i) characteristics of building, (ii) regionalclimate, and (iii) season, was performed. Using the energy modeling result, the amount of the CO2
lementary schoolife cycle costife cycle CO2
emission reduction by energy savings and the CO2 absorption by GRSs’ plants was calculated, and alife cycle cost analysis was conducted with the consideration of the life cycle CO2 (LCCO2). The resultsof this study can be used (i) to introduce the most appropriate ESMs for the specific facility whenapplying GRSs, (ii) to decide which location is proper to implement GRSs considering characteris-tics of regional climate, and (iii) to select energy- and cost-efficient elementary school when applyingGRSs.
. Introduction
The concentration of urban populations, which causes urbanlimatic and environmental changes such as floods, shortage ofnderground water, and urban desertification, is causing a rapidecrease in urban forests and worsening environmental pollu-ion day by day [1]. The forest reduction rate in South Korea is5 times higher than the global average forest reduction rate, andarticularly, the area of urban forests in representative metropoli-an cities, including Seoul, is 6.78 m2/person, about two-thirds ofhe minimal standard (9 m2/person) recommended by the Worldealth Organization (WHO). The area of urban forests in Seoul
s 4.54 m2/person, which is relatively smaller than that in Tokyo5.14 m2/person), Paris (13 m2/person), New York (23 m2/person),nd London (27 m2/person) [2]. Thus, in cities such as Seoul wherehe urban ecosystem is threatened by excessive urbanization, evenhe smallest green area must be gradually acquired to improve the
icro-climate of the city. In South Korea or Japan, however, wherehe population is concentrated, there is an extreme lack of urban
orests, and it is currently difficult to rapidly expand or improvexisting green open spaces. Therefore, green roof systems (GRSs)∗ Corresponding author. Tel.: +82 2 2123 5788; fax: +82 2 2248 0382.E-mail address: [email protected] (T. Hong).
378-7788/$ – see front matter © 2011 Elsevier B.V. All rights reserved.oi:10.1016/j.enbuild.2011.11.006
© 2011 Elsevier B.V. All rights reserved.
are considered as the only alternative to acquiring urban forests onthe ground [3,4].
As such, some countries are taking various measures to promoteGRSs. In Japan, the Tokyo Prefecture has attempted to distributeGRSs by enacting regulations that make GRSs mandatory as of April2001 for newly built, renovated, and expanded buildings whoseland area is 1000 m2 or larger. Similarly, South Korea is conductingthe Green School Project, one of the core projects in the country’sGreen New Deal Program, which combines green growth and jobcreation. According to the Green School Project, the South Koreangovernment is implementing the overall repair and renovation ofexisting elementary and middle school facilities that are severelydeteriorated, using eco-friendly techniques, including GRSs [5].Despite such policy efforts, GRSs both in South Korea and abroad arenot being rapidly deployed because of difficulties such as limitedbudgets, lack of owner commitment of GRSs, higher constructioncost compared to the energy-saving effect, and difficulties in repairand maintenance aspect [6].
Therefore, the introduction of GRSs considers not merely thequantitative increase in urban forests, but also their effect onimproving the quality of cities and building performance. First, interms of improving urban environments, GRSs alleviate the thermal
island effect, reduce damages from urban flooding, purify the air(emitting oxygen by absorbing CO2 and heavy metal particles in theair), and help boost bio-diversity. Second, in terms of improvingthe environment in a building, GRSs improve the building’s
2 d Buildings 45 (2012) 229–239
ild
otrtap
ataCt[ivbcictt
efisrm2
oocibi[tisTob
rebccsctmwE
faceoLF
30 T. Hong et al. / Energy an
nsulation performance, reduce air heating and coolingoads by blocking solar radiation, and prevent the buildingeterioration.
Various studies have been conducted both in South Korea andther countries on the effects of GRSs. Particularly in line withhe recent global efforts to reduce greenhouse gases, previousesearchers have been actively investigating GRSs’ roles in con-rolling temperature and alleviating the heat island phenomenon,nd reducing CO2 concentration by the CO2 absorption capacity oflants.
First, regarding the role of GRSs in controlling temperature andlleviating the heat island phenomenon, it has been reported thathe installation of GRSs on a five-story commercial building led to
0.6–14.5% decline in the building’s annual energy consumption.ompared to the 72 W/m2 heat flux value of a conventional roof,he heat flux value of a roof that a GRS installed is only 2 W/m2
7]. Such an effect depends on the height of plants or the leaf areandex (LAI), which represents the total leaf surface contained in aolume of unit base [8]. As the LAI changed from 1.5 to 3.5, theuilding’s internal temperature decreased by as much as 3.3 ◦C,ompared to that of the building with a conventional roof. Alson terms of the daily temperature change, the building with theonventional roof showed a difference of 10 ◦C and more, whereashe building that GRSs installed showed a difference of only upo 5 ◦C [9,10].
Second, regarding the CO2 absorption capacity of plants and theffects on the microclimate improvement of the GRSs, the use ofeld measures, chamber experiments, and numerical simulationhowed that plants can reduce the CO2 concentration in the envi-onment by absorbing CO2 during the day. On a sunny day, GRSsay lower the CO2 concentration in nearby regions by as much as
% [11,12].The previous study considered only the effects of GRSs with-
ut consideration to the related factors such as the characteristicsf building or regional climate. For example, although one studyonducted some case studies which categorized the types of build-ngs, it did not analyze the characteristics of energy usage in eachuilding. This approach made it difficult to analyze the character-
stics of building that cause the difference of energy consumption13]. From the perspective of decision makers, it has been difficulto determine what type of GRSs is most appropriate for the build-ng because the characteristics of building and the regional climatehould be considered together to maximize energy saving effects.herefore, the relationship between the characteristics of buildingr regional climate and the energy-saving effect of GRSs needs toe clarified.
This study focused on the energy-saving and greenhouse gaseduction effect of GRSs with various scenarios considering thenergy performance of a building which is affected by the com-ination of energy saving measures (ESMs) and different regionallimates. To achieve this, one type of GRS was applied to thease study, because the purpose of this study is to analyze energyaving and greenhouse gas reduction effect of GRS in terms ofharacteristics of building and regional climate, not to selecthe optimum alternative among various type of GRSs. Further-
ore, life cycle cost (LCC) and life cycle CO2 (LCCO2) analysesere performed to quantitatively analyze the effects of various
SMs.This study is organized as follows: (i) selection of educational
acility for case study; (ii) selection of green roof systems (GRSs)nd energy saving measures (ESMs); (iii) analysis of the energyonsumption characteristics in case study; (iv) analysis of the
nergy saving effect of GRSs with the combination of ESMs basedn the results of energy simulation; (v) case study: LCC andCCO2 analysis of GRSs and ESMs scenarios. And it is shown inig. 1.Fig. 1. Research framework.
2. Research framework
This study aimed to examine the economic and environmentaleffect of the installation of GRSs in educational facilities. To considervarious effects of GRSs, the following analyses were performed: (i)an analysis of the effect of GRSs based on the application of variouscombinations of ESMs; and (ii) an analysis of the effect of GRSsbased on different climatic characteristics in different regions. Thisstudy also aimed to conduct LCC and LCCO2 analyses of a projectselected as a case study. The detailed research process is as follows.
First, using the 2009 Statistical Yearbook of Education, publishedby the Korea Ministry of Education, Science, and Technology, dataon the energy consumption of educational facilities in South Koreawere collected and analyzed. Based on the results of the analysis,an elementary school facility was selected because of the highestamount of CO2 emission due to energy consumption and a casestudy was selected based on the region, the service life, energyconsumption, etc.
Second, through extensive literature review and interviews withexperts in the field of green roofs, a type of GRS was selected asappropriate to the selected case project. Also, the properties ofthe soil and plants were examined to collate basic data for energysimulation, and ESMs that were applicable to educational facili-ties both in South Korea and abroad were surveyed. The ESMs thatwere used in this study were selected first based on the literaturereview, and finally based on interviews with experts. By combiningthe ESMs that were selected as such, improvement scenarios wereestablished.
Third, as a preliminary process for analyzing the energy-saving effect of each improvement scenario, energy modeling forthe selected case studies was performed using Energy Modeling(Energy Plus ver. 6.0). The coefficient of variation of the root meansquare error (CV (RMSE)) equation was used to evaluate the relia-bility of the modeling result.
Fourth, the energy-saving effect of each improvement scenariowas analyzed by applying the established energy model to theestablished improvement scenarios. The amounts of heating andcooling energy saved by region, by varying climate conditions of
the identical improvement scenarios were also compared. Basedon the results, the relationship between GRSs and ESMs in terms oftheir energy-saving performance was analyzed.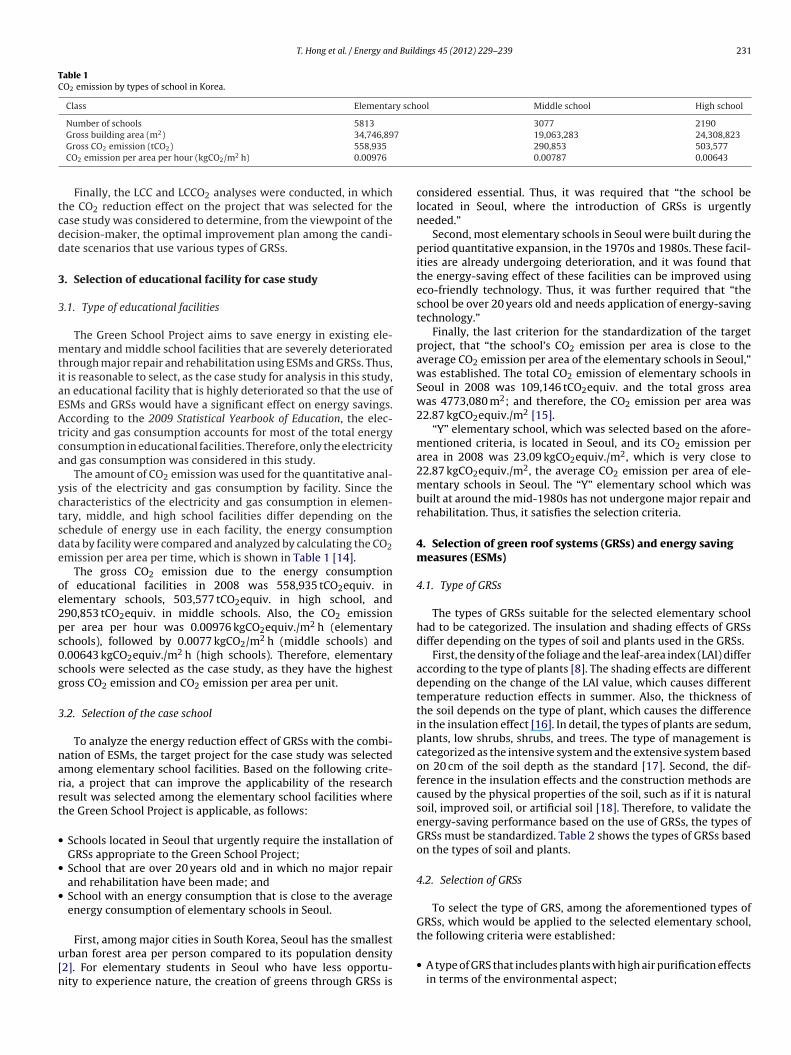
T. Hong et al. / Energy and Buildings 45 (2012) 229–239 231
Table 1CO2 emission by types of school in Korea.
Class Elementary school Middle school High school
Number of schools 5813 3077 21902 7
tcdd
3
3
mtiaEAtca
yctsde
oe2ps0sg
3
narrt
•
•
•
u[n
Gross building area (m ) 34,746,89Gross CO2 emission (tCO2) 558,935
CO2 emission per area per hour (kgCO2/m2 h) 0.00976
Finally, the LCC and LCCO2 analyses were conducted, in whichhe CO2 reduction effect on the project that was selected for thease study was considered to determine, from the viewpoint of theecision-maker, the optimal improvement plan among the candi-ate scenarios that use various types of GRSs.
. Selection of educational facility for case study
.1. Type of educational facilities
The Green School Project aims to save energy in existing ele-entary and middle school facilities that are severely deteriorated
hrough major repair and rehabilitation using ESMs and GRSs. Thus,t is reasonable to select, as the case study for analysis in this study,n educational facility that is highly deteriorated so that the use ofSMs and GRSs would have a significant effect on energy savings.ccording to the 2009 Statistical Yearbook of Education, the elec-
ricity and gas consumption accounts for most of the total energyonsumption in educational facilities. Therefore, only the electricitynd gas consumption was considered in this study.
The amount of CO2 emission was used for the quantitative anal-sis of the electricity and gas consumption by facility. Since theharacteristics of the electricity and gas consumption in elemen-ary, middle, and high school facilities differ depending on thechedule of energy use in each facility, the energy consumptionata by facility were compared and analyzed by calculating the CO2mission per area per time, which is shown in Table 1 [14].
The gross CO2 emission due to the energy consumptionf educational facilities in 2008 was 558,935 tCO2equiv. inlementary schools, 503,577 tCO2equiv. in high school, and90,853 tCO2equiv. in middle schools. Also, the CO2 emissioner area per hour was 0.00976 kgCO2equiv./m2 h (elementarychools), followed by 0.0077 kgCO2/m2 h (middle schools) and.00643 kgCO2equiv./m2 h (high schools). Therefore, elementarychools were selected as the case study, as they have the highestross CO2 emission and CO2 emission per area per unit.
.2. Selection of the case school
To analyze the energy reduction effect of GRSs with the combi-ation of ESMs, the target project for the case study was selectedmong elementary school facilities. Based on the following crite-ia, a project that can improve the applicability of the researchesult was selected among the elementary school facilities wherehe Green School Project is applicable, as follows:
Schools located in Seoul that urgently require the installation ofGRSs appropriate to the Green School Project;School that are over 20 years old and in which no major repairand rehabilitation have been made; andSchool with an energy consumption that is close to the averageenergy consumption of elementary schools in Seoul.
First, among major cities in South Korea, Seoul has the smallestrban forest area per person compared to its population density2]. For elementary students in Seoul who have less opportu-ity to experience nature, the creation of greens through GRSs is
19,063,283 24,308,823290,853 503,5770.00787 0.00643
considered essential. Thus, it was required that “the school belocated in Seoul, where the introduction of GRSs is urgentlyneeded.”
Second, most elementary schools in Seoul were built during theperiod quantitative expansion, in the 1970s and 1980s. These facil-ities are already undergoing deterioration, and it was found thatthe energy-saving effect of these facilities can be improved usingeco-friendly technology. Thus, it was further required that “theschool be over 20 years old and needs application of energy-savingtechnology.”
Finally, the last criterion for the standardization of the targetproject, that “the school’s CO2 emission per area is close to theaverage CO2 emission per area of the elementary schools in Seoul,”was established. The total CO2 emission of elementary schools inSeoul in 2008 was 109,146 tCO2equiv. and the total gross areawas 4773,080 m2; and therefore, the CO2 emission per area was22.87 kgCO2equiv./m2 [15].
“Y” elementary school, which was selected based on the afore-mentioned criteria, is located in Seoul, and its CO2 emission perarea in 2008 was 23.09 kgCO2equiv./m2, which is very close to22.87 kgCO2equiv./m2, the average CO2 emission per area of ele-mentary schools in Seoul. The “Y” elementary school which wasbuilt at around the mid-1980s has not undergone major repair andrehabilitation. Thus, it satisfies the selection criteria.
4. Selection of green roof systems (GRSs) and energy savingmeasures (ESMs)
4.1. Type of GRSs
The types of GRSs suitable for the selected elementary schoolhad to be categorized. The insulation and shading effects of GRSsdiffer depending on the types of soil and plants used in the GRSs.
First, the density of the foliage and the leaf-area index (LAI) differaccording to the type of plants [8]. The shading effects are differentdepending on the change of the LAI value, which causes differenttemperature reduction effects in summer. Also, the thickness ofthe soil depends on the type of plant, which causes the differencein the insulation effect [16]. In detail, the types of plants are sedum,plants, low shrubs, shrubs, and trees. The type of management iscategorized as the intensive system and the extensive system basedon 20 cm of the soil depth as the standard [17]. Second, the dif-ference in the insulation effects and the construction methods arecaused by the physical properties of the soil, such as if it is naturalsoil, improved soil, or artificial soil [18]. Therefore, to validate theenergy-saving performance based on the use of GRSs, the types ofGRSs must be standardized. Table 2 shows the types of GRSs basedon the types of soil and plants.
4.2. Selection of GRSs
To select the type of GRS, among the aforementioned types ofGRSs, which would be applied to the selected elementary school,
the following criteria were established:• A type of GRS that includes plants with high air purification effectsin terms of the environmental aspect;
232 T. Hong et al. / Energy and Buildings 45 (2012) 229–239
Table 2Type of green roof systems.
Sedum Grass and plant Low shrub Shrub Tree
Thickness (mm)Natural soil 10 15 30 45 70Improved soil 10 15 30 45 70
•
•
phesiClrwla
Gatgobgf
sctcaw$frt
4
Ett
TP
Artificial soil 5
Type of management Extensive system
A type of GRS that is appropriate to maximizing the educationalfunction of the facility in terms of the educational aspect; andA type of GRS that offers easy constructability and a relativelylower construction cost.
First, in the study of [19], the amount of absorption of CO2er square centimeter of Juniperus Conferta, which is a commonanging and well-mounted plant, was 1.055 × 10⁻⁷ g/cm2 in thexperiments. Ahn reported the amounts of absorption of CO2 perquare centimeter by 16 plants that were most frequently usedn 80 GRSs in South Korea [20]. The amounts of absorption ofO2 per square centimeter of the chrysanthemum Zawadskii var.
atilobum and the shrub hydrangea macrophylla was the highestate at 21.47 × 10⁻⁶ g/cm2 and 5.370 × 10⁻⁶ g/cm2, respectively. Itas found that the amounts of absorption of CO2 of plants are
arger than that of shrubs. Thus, the plant that offers excellent CO2bsorption performance was selected.
Second, as the basic eco-friendly element in elementary schools,RSs can be divided into the installation of a biotope and the cre-tion of an educational space for growing plants. Particularly, GRSshat are used for educational purposes often implement plant-rowing. Some schools also plant wild flowers listed in textbooksr offer students the experience of planting and growing plantsy themselves [21]. Therefore, plants that students can plant androw by themselves were selected to offer maximum educationalunctions.
Third, a facility improvement project should plan its con-truction cost by considering budget limitations. To calculate theonstruction cost by type of GRS, an interview with a GRS construc-ion company was conducted. This company calculated the GRSonstruction cost based on general information for construction [22]nd monthly construction market price [23]. The construction costsere $173.50/m2 for trees, followed by $149.48/m2 for shrubs,
135.24/m2 for low shrubs, $129.02/m2 for sedum, and $110.33/m2
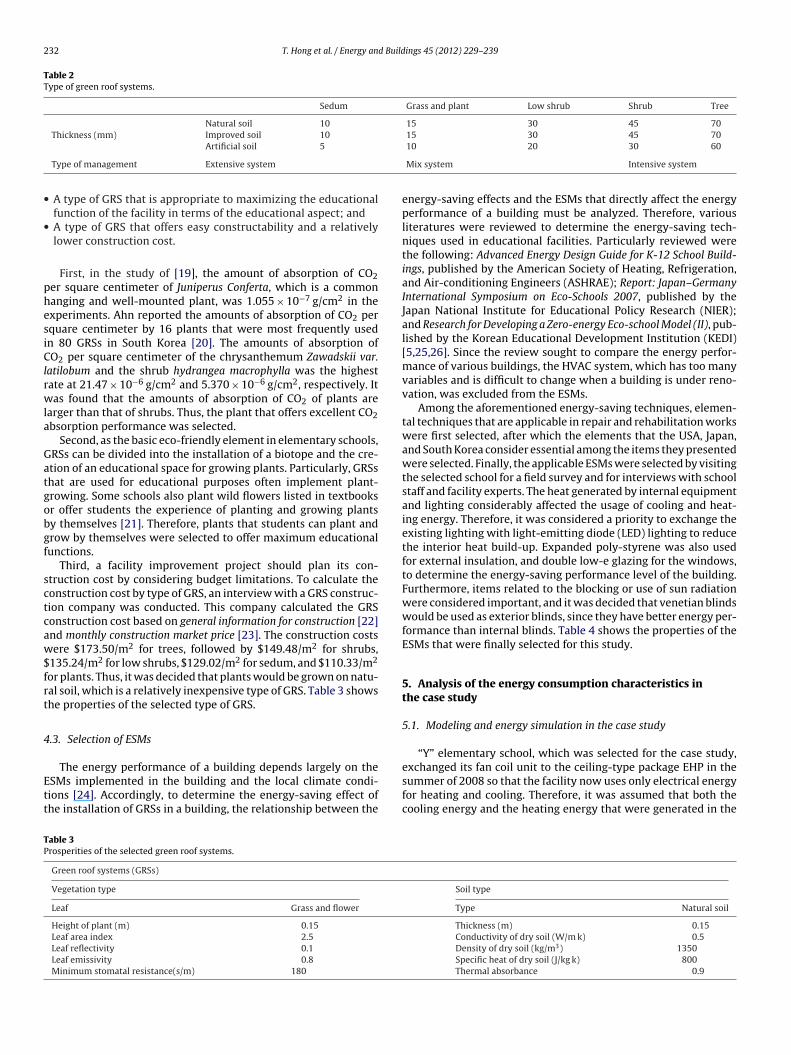
or plants. Thus, it was decided that plants would be grown on natu-al soil, which is a relatively inexpensive type of GRS. Table 3 showshe properties of the selected type of GRS.
.3. Selection of ESMs
The energy performance of a building depends largely on theSMs implemented in the building and the local climate condi-ions [24]. Accordingly, to determine the energy-saving effect ofhe installation of GRSs in a building, the relationship between the
able 3rosperities of the selected green roof systems.
Green roof systems (GRSs)
Vegetation type
Leaf Grass and flower
Height of plant (m) 0.15
Leaf area index 2.5
Leaf reflectivity 0.1
Leaf emissivity 0.8
Minimum stomatal resistance(s/m) 180
10 20 30 60
Mix system Intensive system
energy-saving effects and the ESMs that directly affect the energyperformance of a building must be analyzed. Therefore, variousliteratures were reviewed to determine the energy-saving tech-niques used in educational facilities. Particularly reviewed werethe following: Advanced Energy Design Guide for K-12 School Build-ings, published by the American Society of Heating, Refrigeration,and Air-conditioning Engineers (ASHRAE); Report: Japan–GermanyInternational Symposium on Eco-Schools 2007, published by theJapan National Institute for Educational Policy Research (NIER);and Research for Developing a Zero-energy Eco-school Model (II), pub-lished by the Korean Educational Development Institution (KEDI)[5,25,26]. Since the review sought to compare the energy perfor-mance of various buildings, the HVAC system, which has too manyvariables and is difficult to change when a building is under reno-vation, was excluded from the ESMs.
Among the aforementioned energy-saving techniques, elemen-tal techniques that are applicable in repair and rehabilitation workswere first selected, after which the elements that the USA, Japan,and South Korea consider essential among the items they presentedwere selected. Finally, the applicable ESMs were selected by visitingthe selected school for a field survey and for interviews with schoolstaff and facility experts. The heat generated by internal equipmentand lighting considerably affected the usage of cooling and heat-ing energy. Therefore, it was considered a priority to exchange theexisting lighting with light-emitting diode (LED) lighting to reducethe interior heat build-up. Expanded poly-styrene was also usedfor external insulation, and double low-e glazing for the windows,to determine the energy-saving performance level of the building.Furthermore, items related to the blocking or use of sun radiationwere considered important, and it was decided that venetian blindswould be used as exterior blinds, since they have better energy per-formance than internal blinds. Table 4 shows the properties of theESMs that were finally selected for this study.
5. Analysis of the energy consumption characteristics inthe case study
5.1. Modeling and energy simulation in the case study
“Y” elementary school, which was selected for the case study,
exchanged its fan coil unit to the ceiling-type package EHP in thesummer of 2008 so that the facility now uses only electrical energyfor heating and cooling. Therefore, it was assumed that both thecooling energy and the heating energy that were generated in theSoil type
Type Natural soil
Thickness (m) 0.15Conductivity of dry soil (W/m k) 0.5Density of dry soil (kg/m3) 1350Specific heat of dry soil (J/kg k) 800Thermal absorbance 0.9
T. Hong et al. / Energy and Buildings 45 (2012) 229–239 233
Table 4Properties of energy saving measures.
#1 Exterior insulation #2 Exterior blind #3 Window #4 Lighting
Expanded poly-styrene Venetian blind Double glazed low-e LEDThickness (mm) 85
Conductivity (W/m k) 0.034 Slat conductivity (W/m k) 221
Density (kg/m3) 30 Slat angle (deg) 45
Table 5Condition for the simulation model.
Condition for the simulation model
Weather data Climate data in Incheon, which are similar tothose in Seoul climate data
Run period 01/01/2000–12/31/2009Holiday Korea, 2009Schedule School schedule
Lighting load densityAir-conditioning space: 23 W/m2
Non air-conditioning space: 6 W/m2
sludoEtmtswr
5
fire
C
wu
TC
Equipment load density 16 W/m2
Setting temperature Winter: 18 ◦C; summer: 23 ◦C
imulation used electrical energy. For the building energy simu-ation, Energy Plus ver. 6.0 (US Department of Energy, DOE) wassed for the modeling and energy simulation. Based on the detailedesign plan of the “Y” elementary school, the plug-in functionf Google Sketch-up ver. 8 was used to realize the 3D model innergy Plus. The modeling implemented the properties shown inhe detailed design plan as best as it could and entered the equip-
ent schedule and heating and cooling schedule data accordingo the interviews with the facility manager. The classrooms andchool offices were set as air-conditioned rooms, whereas stair-ays, corridors, and bathrooms were set as non-air-conditioned
ooms. Table 5 shows the conditions for the overall simulation.
.2. Analysis of simulation results
Room electricity refers to the energy consumption in a roomrom the use of computers in a classroom, excluding the light-ng energy consumption. To determine the error in the simulationesults, the CV(RMSE) proposed by the ASHRAE is used as the tol-rance of the energy simulation, should be within 25% [27].
V (RMSE) =
√(∑ni=1(yestimate usage,i − yactual usage,i)
2)/(n − 1)
yactual usage
× 100 (1)
here yestimate usage,i is electricity consumption of each month (sim-lation data), yactual usage,i is electricity consumption of each month
able 6omparison of actual electricity consumption and simulation results in the case school (u
Room electricity Lighting Heat generation
January 5904 3258 30,627
February 7290 5728 17,879
March 9981 9684 5716
April 9451 9841 32
May 9616 9947 –
June 9585 9868 –
July 8308 7153 –
August 6500 2557 –
September 9732 10,036 –
October 8709 8690 –
November 10,088 10,643 1652
December 8719 8138 15,458
Total 103,883 95,544 71,363
Slat width (mm) 50Clear glass (mm) 6 Power consumption (W) 25Air (mm) 12.5 Durability (h) 30,000
(actual data), yactual usage is average of actual electricity consump-tion for 1 year, n is the number of data (months).
As shown in Table 6, the CV (RMSE) of “Y” elementary schoolwas 15.44%, which is within the tolerance range. The main causeof such an error is, first, the difference between the schedule undersimulation and the actual schedule in use; and second, the differ-ence between the weather file and the actual climate conditions.The simulation was limited in that the hours of the heating andcooling operation changes depended on the students and teachers,and the yearly schedule could not be identical to the actual sched-ule. Since the simulation error was within the scope of the tolerancerange proposed by ASHRAE, however, it was determined that theproposed simulation was reliable.
Comparison of the monthly usage and the actual usage showedrelatively higher energy consumption for cooling in summer. Par-ticularly in September, the result of the energy simulation wasshown to be higher than the actual usage. It is possible that thetemperature in the summer of 2009 was lower than the averagetemperature, so that the facility might have used the cooling equip-ment less often. It is also possible that since the cooling equipmentin each room is operated by those who use the room, they mighthave used the equipment less often than shown in the scheduleunder simulation.
The difference in the heating energy usage in winter was rela-tively negligible, from which it can be assumed that the result ofthe simulation was almost identical to the actual usage, and thatthe climate condition in the winter of 2009 was about average.
6. Analysis of the energy saving effect of GRSs with thecombination of ESMs
6.1. Energy simulation with GRSs with the combination of ESMs
Based on the combination of the previous selected types of GRSsand four ESMSs, 16 improvement scenarios were developed. Byimplementing each improvement scenario, the energy in each sce-nario was modeled. Table 7 lists the 16 improvement scenarios
based on GRSs with the combination of ESMs.This study conducted a detailed analysis of the relationshipbetween GRSs and ESMs by examining the conditions of the cool-ing and heating energy consumption based on 16 improvement
nit: kWh).
Chiller Total Exist facility total Error
– 39,812 31,335 27.1%– 30,918 26,333 17.4%– 25,400 26,703 4.9%– 19,350 19,951 3.0%– 19,590 17,822 9.9%
17,577 37,052 26,142 41.7%15,886 31,372 22,720 38.1%11,529 20,586 20,600 0.1%11,018 30,811 17,092 80.3%
– 17,420 19,208 9.3%– 22,412 19,876 12.8%– 32,336 33,621 3.8%
56,009 327,059 281,402 16.2%
234 T. Hong et al. / Energy and Buildings 45 (2012) 229–239
Table 7List of 16 improvement scenarios based on the combination of green roof systemsand energy saving measures.
Scenario number Combination
Scenario #1 GRSsScenario #2 GRSs + #1Scenario #3 GRSs + #2Scenario #4 GRSs + #3Scenario #5 GRSs + #4Scenario #6 GRSs + #1 + #2Scenario #7 GRSs + #1 + #3Scenario #8 GRSs + #1 + #4Scenario #9 GRSs + #2 + #3Scenario #10 GRSs + #2 + #4Scenario #11 GRSs + #3 + #4Scenario #12 GRSs + #1 + #2 + #3Scenario #13 GRSs + #1 + #2 + #4Scenario #14 GRSs + #1 + #3 + #4Scenario #15 GRSs + #2 + #3 + #4Scenario #16 GRSs + #1 + #2 + #3 + #4
Nd
svtt1bttc
•
•
•
slcb
Table 8Cooling and heating energy consumption of the existing facility by climate (unit:kWh).
City Je-ju Seoul Cheol-won
Heating energy consumption 1433 71,363 115,856Cooling energy consumption 77,260 56,009 42,547Total energy consumption 278,120 326,799 357,830
TE
ote: GRSs: green roof systems, #1: external insulation, #2: exterior blind, #3:ouble low-e glazing, #4: LED (light-emitting diode).
cenarios and comparing the results of the examination with thealues of the existing facility. This study also sought to producehe optimal improvement scenario under various climate condi-ions by varying and implementing the climate conditions in the6 improvement scenarios. In this study, the relationship not onlyetween GRSs and ESMs, but also between them and climate condi-ions, would be determined through such analyses. Therefore, threeypes of climate conditions were selected based on the followingriteria:
The climate condition in the region that the project selected asthe case study is located;The climate condition in the region that shows a drastic differencein temperature between summer and winter, from the compar-ison of the climate conditions of the project selected as the casestudy; andThe climate condition in the neighboring region, if no weatherfile was provided by the Energy Plus Simulation.
Based on such criteria, the climate conditions in Incheon were
elected, which is near Seoul where “Y” elementary school isocated. Compared to the climate conditions in Seoul, the twolimate conditions that show a drastic difference in temperatureetween summer and winter were selected, as in the following: (i)able 9nergy savings effects by 16 improvement scenarios in comparison with the existing faci
TypeCity
Je-ju Seoul
Energy saving rate Rank Energy sa
Scenario 1 −0.1% 14 0.6%
Scenario 2 0.0% 13 5.1%
Scenario 3 4.4% 12 3.7%
Scenario 4 −0.2% 15 6.3%
Scenario 5 23.6% 7 18.9%
Scenario 6 5.0% 9 8.6%
Scenario 7 −0.4% 16 10.8%
Scenario 8 23.7% 6 23.4%
Scenario 9 4.5% 11 9.6%
Scenario 10 28.1% 4 21.9%
Scenario 11 23.7% 5 25.0%
Scenario 12 4.9% 10 14.7%
Scenario 13 28.7% 2 26.8%
Scenario 14 23.5% 8 29.6%
Scenario 15 28.4% 3 28.3%
Scenario 16 28.8% 1 33.4%
Jeju, the southernmost region in South Korea; and (ii) Cheolwon,where the temperature in winter is the lowest in South Korea. SinceEnergy Plus ver. 6.0 does not offer the weather files for Jeju and Che-olwon, the weather files of cities in Japan, the climate conditions ofwhich are similar to those of Jeju and Cheolwon, were used instead.For Jeju, Tosashimizu in Japan was selected, which is not only sim-ilar in latitude, but also has the same a humid subtropical climatezone characterized by hot, humid summers and cool winters in theKöppen climate classification (Cfa). For Cheolwon, Sapporo in Japanwas selected, which is the same a humid continental climate regiontypified by large seasonal temperature differences, with warm tohot summers and cold winters in the Köppen climate classification(Dfa).
6.2. Energy savings effects of GRSs with the combination of ESMson the existing facility
The energy simulation was performed by applying the 16improvement scenarios to the existing facility. The results of thesimulation, in which identical energy simulation environmentswere set except for the climate condition, showed that the regionalclimate condition caused a difference in the amount of energysaved. Table 8 shows the cooling and heating energy consumptionof the existing facility according to the regional climate conditions,and Table 9 shows the ratio of the saved energy consumption to theenergy consumption of the existing facility and the ranks of the 16improvement scenarios.
As shown in Table 8, the comparison of the total energyconsumption showed that in Jeju, where the yearly average tem-perature is relatively higher than in the other regions, the coolingenergy consumption was higher than the heating energy consump-
tion. In Seoul and Cheolwon, where the average temperature islower than in other regions, the heating energy consumption washigher than the cooling energy consumption.lity.
Cheol-won
ving rate Rank Energy saving rate Rank
16 0.5% 1614 6.5% 1415 3.9% 1513 7.9% 13
8 16.1% 912 10.1% 1210 13.9% 10
6 21.9% 611 11.5% 11
7 19.2% 75 24.1% 59 18.0% 84 25.3% 42 30.1% 23 27.4% 31 33.8% 1
T. Hong et al. / Energy and Buildings 45 (2012) 229–239 235
ing ag
nerwlierytcsti
otto5(ewacinsi(
etis0oaeiopts
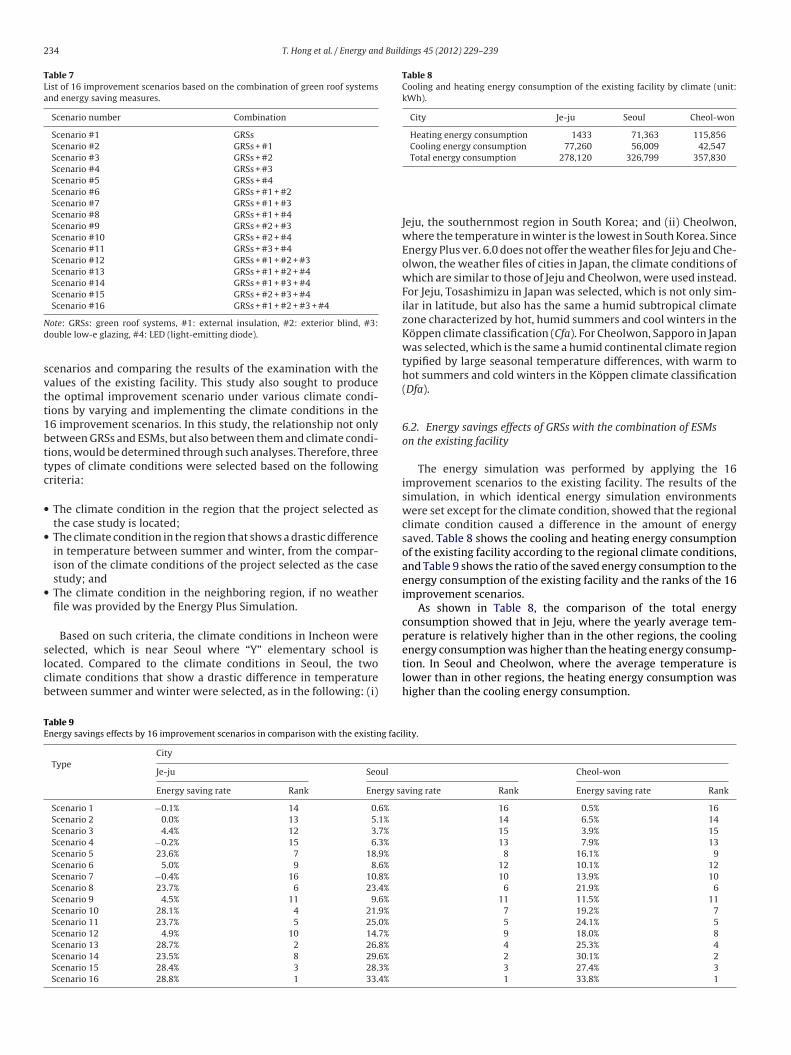
Fig. 2. Heating energy sav
As shown in Table 9, improvement scenario 16 (GRSs, exter-al insulation, exterior blinds, double low-e glazing, and LED)xhibited maximum reduction of energy consumption in all threeegions: 28.8% in Jeju, 33.4% in Seoul, and 33.8% in Cheolwon. Itas followed by improvement scenario 14 (GRSs, external insu-
ation, double low-e glazing, and LED): 29.6% in Seoul and 30.1%n Cheolwon. However, it was improvement scenario 13 (GRSs,xternal insulation, exterior blinds, single window, and LED) thatanked second in Jeju (28.7%). In other words, in Jeju, where theearly average temperature is higher than in the other regions,he cooling energy consumption is larger than the heating energyonsumption, and therefore, it is more effective to improve theun radiation blocking performance using exterior blinds ratherhan to improve the insulation performance through externalnsulation.
Even in Seoul and Cheolwon, both of which have higher levelsf heating energy consumption than cooling energy consumption,he rank of some improvement scenarios differed according tohe relative difference in temperature between the two regionsf consumption. For example, in Seoul, improvement scenario
(GRSs and LED) showed higher energy reduction performance18.9%) than improvement scenario 12 (GRSs, external insulation,xternal blinds, and double low-e glazing) (14.7%). In Cheol-on, however, it was the opposite. In other words, the yearly
verage temperature in Cheolwon is lower than in Seoul, andonsequently, improving the insulation performance by externalnsulation and double low-e glazing through improvement sce-ario 12 (18.0%) was more effective than through improvementcenario 5, which decreases the internal heating caused by light-ng as using LED and causes more heating energy consumptions16.1%).
As such, most of these GRSs with the combination of ESMsxhibited energy-saving effects, despite having some quantita-ive differences. In Jeju, however, the energy consumption levelsncreased from those of the existing facility after improvementcenarios 7, 4, and 1 were implemented, by 0.4%, 0.2%, and.1%, respectively. To analyze the reasons for such increases, notnly the total energy saved should be analyzed, but also themount of cooling and heating energy saved. The energy-savingffect of GRSs with the combination of ESMs was not shownn all the regions or in all seasons. Fig. 1 shows the results
f the analysis of the heating energy saving by region com-ared to that of existing facility based on the implementation ofhe 16 improvement scenarios. Fig. 2 shows the cooling energyaving.ainst the existing facility.
6.3. Analysis of heating energy based on GRSs with thecombination of ESMs scenarios
As shown in Fig. 2, the heating energy saving was higher in Che-olwon of which the yearly average temperature is lower than inJeju or Seoul. The amounts of heating energy saved by improve-ment scenario 1 (GRSs) were 200 kWh in Jeju, 2069 kWh in Seoul,and 2132 kWh in Cheolwon; and by improvement scenario 7 (GRSs,external insulation, and double low-e glazing), 52,532 kWh in Che-olwon, 38,602 kWh in Seoul and 1227 kWh in Jeju. When the energysaving by scenarios were compared, the difference between themaximum and minimum energy saving was about 50,000 kWh inCheolwon, and about 1000 kWh in Jeju. In other words, there wasa significant difference in the heating energy saving effect depend-ing on the yearly average temperature of the region. Therefore,the characteristics of regional climate should be considered in theimplementation of any improvement scenario.
Generally, all the scenarios that included lighting improvementusing LED showed the disadvantage of the heating energy saving.Particularly, improvement scenarios 5 (GRSs and LED) and 10 (GRSs,external blinds, and LED), which improved only the internal light-ing without improving the insulation and windows, increased theheating energy consumption in all three regions. Using LED, theinternal heating caused by lighting decreased, which might haveresulted in the increase of heating energy consumption. It was alsodetermined that the amount of the heating energy saving due tothe GRSs did not cover the reduction amount of the internal heat-ing caused by LED. In conclusion, the results of this study showedthat implementing GRSs without considering ESMs can increasethe heating energy consumption.
On the other hand, implementing improvement scenarios thatinclude the improvement of external insulation and double low-eglazing was shown to be more effective in terms of heating energysaving. This shows that the improvement of insulation performancedirectly affects the reduction of heating energy consumption.
6.4. Analysis of cooling energy based on GRSs with thecombination of ESMs scenarios
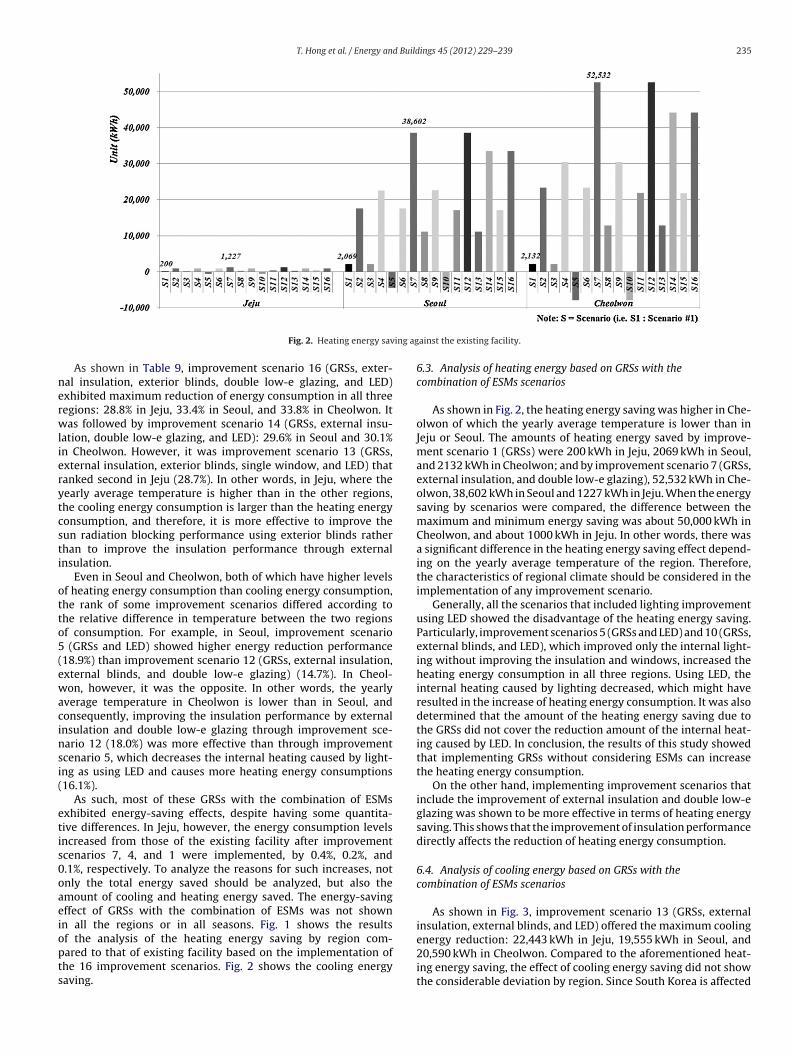
As shown in Fig. 3, improvement scenario 13 (GRSs, externalinsulation, external blinds, and LED) offered the maximum cooling
energy reduction: 22,443 kWh in Jeju, 19,555 kWh in Seoul, and20,590 kWh in Cheolwon. Compared to the aforementioned heat-ing energy saving, the effect of cooling energy saving did not showthe considerable deviation by region. Since South Korea is affected
236 T. Hong et al. / Energy and Buildings 45 (2012) 229–239
ing ag
bmetacr
1otcsatiictt(m
oechietbioc
cuie(ooe
Fig. 3. Cooling energy sav
y seasonal winds due to its geographical location, it exhibits aarked regional difference in temperature in winter due to the
ffect of the continent (northwestern wind). Due to the effect ofhe sea (southeastern wind), however, the difference in temper-ture in summer is not as great as in winter. Thus, the use ofooling equipment in summer is deemed to be about the same in allegions.
The results of the implementation of improvement scenarios–5, each of which includes GRSs and one ESM for the improvementf the energy performance of the existing facility, clearly showedhe relationship between ESMs and their effect on the reduction ofooling energy consumption. The implementation of improvementcenarios 1 (GRSs), 2 (GRSs and external insulation), and 4 (GRSsnd double low-e glazing) increased the cooling energy consump-ion. It is believed that this result was caused by the improvementn the insulation performance of the facility when only GRSs weremplemented, which prevented the escape of the heat energyaused by the internal heating. In other words, it is concluded thathe improvement of the cooling energy saving in summer requireshe reduction of internal heating through improvement scenario 5GRSs and LED) or the blocking of solar radiation through improve-
ent scenario 3 (GRSs and external blinds).While it can be conceptually argued that the improvement
f the performance of insulation materials can reduce coolingnergy consumption, such improvement can in fact increase theooling energy consumption in a facility that has a high internaleating capacity, because internal heat cannot escape the facil-
ty. Therefore, from the viewpoint of cooling energy, to reducenergy consumption using GRSs, the improvement of the reduc-ion of internal heating and the blocking of solar radiation shoulde considered at the same time. The mere use of high-performance
nsulation materials or windows without overall understandingf the energy usage of a facility can increase cooling energyonsumption.
Therefore, to maximize the energy saving effect of GRSs, theharacteristics of energy consumption in a facility should be wellnderstood. Otherwise, the opposite can result. For example, the
mplementation of improvement scenarios 1 (GRSs), 2 (GRSs andxternal insulation), 4 (GRSs and double low-e glazing), and 7
GRSs, external insulation, and double low-e glazing) in Jeju, with-ut considering the reduction of internal heating or the blockingf solar radiation, can cause unwanted results in terms of coolingnergy saving.ainst the existing facility.
7. Case study
The results of the application of the improvement scenarios tothe facility by region revealed that in all the regions, improve-ment scenario 16 was the most efficient in saving energy. Since anyimprovement project for deteriorated educational facilities mustconsider the budget limitations, however, it is difficult to deter-mine the optimal improvement scenario by considering only theenergy saving effect. Therefore, an LCC analysis of the “Y” elemen-tary school was performed to determine the optimal improvementscenario in terms of cost efficiency. Also, to consider the environ-mental aspect, an LCCO2 analysis on the CO2 emission reductionby energy savings and the CO2 absorption by GRSs’ plants wasperformed.
7.1. Basic information for analysis of the LCC and LCCO2
As the basic assumption for the LCC analysis, the real inter-est rate was calculated by considering the nominal interest rateand the inflation rate. Based on the data provided by the Bank ofKorea ECOnomic Statistics system (ECOS) and the KOrean StatisticalInformation Service (KOSIS), the real discount rate on the inflationrate (3.30%), the electricity price growth rate (0.66%), the gas pricegrowth rate (0.11%), and the carbon dioxide emission trading pricegrowth rate (2.66%) were calculated respectively, as follows:
i = (1 + in)(1 + f )
− 1 (2)
where i is the real discount rate, in is the nominal interest rate, andf is the inflation rate, the electricity price growth rate, the gas pricegrowth rate, and the carbon dioxide emission trading price growthrate.
For the LCC analysis, the initial investment cost, the operationand maintenance cost, and the demolition cost should be deter-mined. The initial investment cost includes the material, labor, andequipment costs. The operation and maintenance cost includes therepair and replacement cost, energy consumption cost, and theprofit from sale of carbon credits, called “Certified Emission Reduc-tion.” The demolition cost includes the waste disposal cost, and the
salvage value [14,24,28]. The demolition cost was excluded fromthis study as it was assumed that the waste disposal cost wouldbe offset by the salvage value [28]. Thus, the LCC analysis was per-formed only on the initial investment cost and the operation and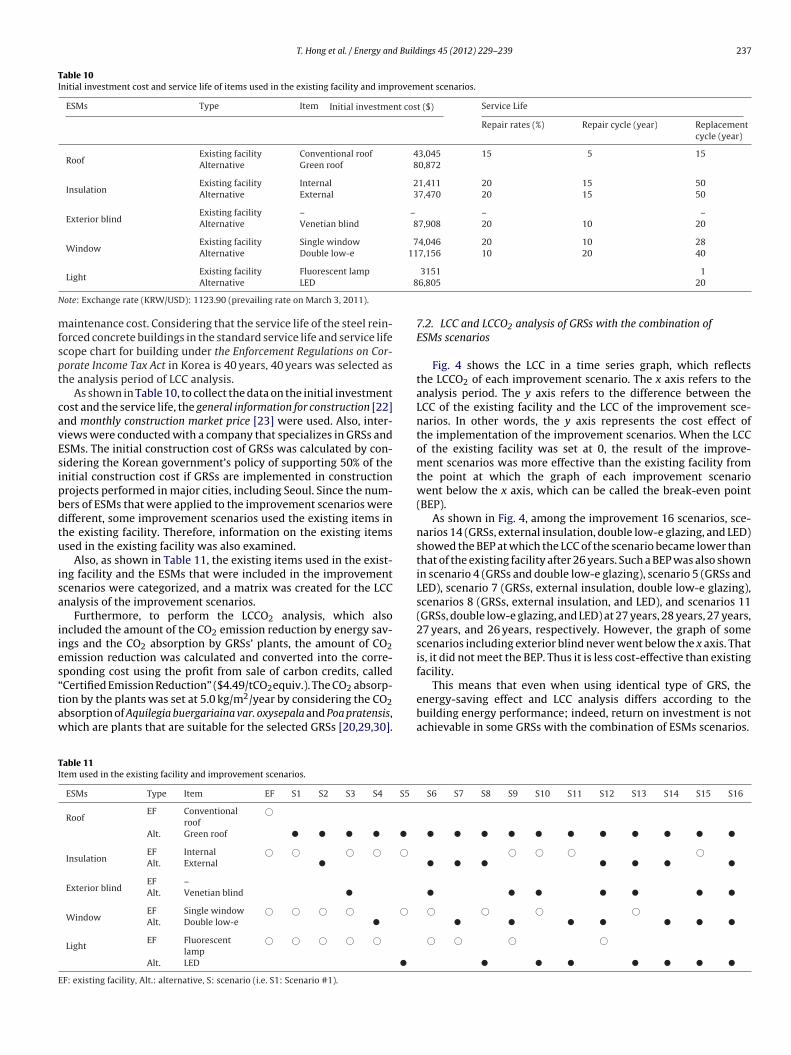
T. Hong et al. / Energy and Buildings 45 (2012) 229–239 237
Table 10Initial investment cost and service life of items used in the existing facility and improvement scenarios.
ESMs Type Item Initial investment cost ($) Service Life
Repair rates (%) Repair cycle (year) Replacementcycle (year)
RoofExisting facility Conventional roof 43,045 15 5 15Alternative Green roof 80,872
InsulationExisting facility Internal 21,411 20 15 50Alternative External 37,470 20 15 50
Exterior blindExisting facility – – – –Alternative Venetian blind 87,908 20 10 20
WindowExisting facility Single window 74,046 20 10 28Alternative Double low-e 117,156 10 20 40
8
N
mfspt
cavEsipbdtu
isa
iies“taw
TI
E
LightExisting facility Fluorescent lamp
Alternative LED
ote: Exchange rate (KRW/USD): 1123.90 (prevailing rate on March 3, 2011).
aintenance cost. Considering that the service life of the steel rein-orced concrete buildings in the standard service life and service lifecope chart for building under the Enforcement Regulations on Cor-orate Income Tax Act in Korea is 40 years, 40 years was selected ashe analysis period of LCC analysis.
As shown in Table 10, to collect the data on the initial investmentost and the service life, the general information for construction [22]nd monthly construction market price [23] were used. Also, inter-iews were conducted with a company that specializes in GRSs andSMs. The initial construction cost of GRSs was calculated by con-idering the Korean government’s policy of supporting 50% of thenitial construction cost if GRSs are implemented in constructionrojects performed in major cities, including Seoul. Since the num-ers of ESMs that were applied to the improvement scenarios wereifferent, some improvement scenarios used the existing items inhe existing facility. Therefore, information on the existing itemssed in the existing facility was also examined.
Also, as shown in Table 11, the existing items used in the exist-ng facility and the ESMs that were included in the improvementcenarios were categorized, and a matrix was created for the LCCnalysis of the improvement scenarios.
Furthermore, to perform the LCCO2 analysis, which alsoncluded the amount of the CO2 emission reduction by energy sav-ngs and the CO2 absorption by GRSs’ plants, the amount of CO2mission reduction was calculated and converted into the corre-ponding cost using the profit from sale of carbon credits, calledCertified Emission Reduction” ($4.49/tCO2equiv.). The CO2 absorp-
ion by the plants was set at 5.0 kg/m2/year by considering the CO2bsorption of Aquilegia buergariaina var. oxysepala and Poa pratensis,hich are plants that are suitable for the selected GRSs [20,29,30].able 11tem used in the existing facility and improvement scenarios.
ESMs Type Item EF S1 S2 S3 S4 S5
RoofEF Conventional
roof©
Alt. Green roof � � � � �
InsulationEF Internal © © © © ©
Alt. External �
Exterior blindEF –Alt. Venetian blind �
WindowEF Single window © © © © ©
Alt. Double low-e �
LightEF Fluorescent
lamp© © © © ©
Alt. LED �
F: existing facility, Alt.: alternative, S: scenario (i.e. S1: Scenario #1).
3151 16,805 20
7.2. LCC and LCCO2 analysis of GRSs with the combination ofESMs scenarios
Fig. 4 shows the LCC in a time series graph, which reflectsthe LCCO2 of each improvement scenario. The x axis refers to theanalysis period. The y axis refers to the difference between theLCC of the existing facility and the LCC of the improvement sce-narios. In other words, the y axis represents the cost effect ofthe implementation of the improvement scenarios. When the LCCof the existing facility was set at 0, the result of the improve-ment scenarios was more effective than the existing facility fromthe point at which the graph of each improvement scenariowent below the x axis, which can be called the break-even point(BEP).
As shown in Fig. 4, among the improvement 16 scenarios, sce-narios 14 (GRSs, external insulation, double low-e glazing, and LED)showed the BEP at which the LCC of the scenario became lower thanthat of the existing facility after 26 years. Such a BEP was also shownin scenario 4 (GRSs and double low-e glazing), scenario 5 (GRSs andLED), scenario 7 (GRSs, external insulation, double low-e glazing),scenarios 8 (GRSs, external insulation, and LED), and scenarios 11(GRSs, double low-e glazing, and LED) at 27 years, 28 years, 27 years,27 years, and 26 years, respectively. However, the graph of somescenarios including exterior blind never went below the x axis. Thatis, it did not meet the BEP. Thus it is less cost-effective than existingfacility.
This means that even when using identical type of GRS, the
energy-saving effect and LCC analysis differs according to thebuilding energy performance; indeed, return on investment is notachievable in some GRSs with the combination of ESMs scenarios.S6 S7 S8 S9 S10 S11 S12 S13 S14 S15 S16
� � � � � � � � � � �
© © © ©� � � � � � �
� � � � � � �
© © © ©� � � � � � �
© © © ©
� � � � � � �

238 T. Hong et al. / Energy and Buildings 45 (2012) 229–239
enario
8
eacruttpps
eaoso
t(roteeisoreti
aLaicbG
Fig. 4. Life cycle cost and life cycle CO2 of some sc
. Conclusion and discussion
This study aimed to evaluate economic and environmentalffects of functional improvement in elementary school facilities bypplying various improvement scenarios based on GRSs with theombination of ESMs. By conducting a multilateral analysis on theesults of the energy simulation, the energy saving effect was eval-ated by each improvement scenario. Furthermore, an LCC analysishat included an analysis of the LCCO2 (i.e. the CO2 emission reduc-ion by energy savings and CO2 absorption by the photosynthesis oflants) was conducted to assess the economic and environmentalerformance according to the implementation of the improvementcenarios.
Using the 16 improvement scenarios, the total energy savingffect of the introduction of GRSs in a facility was verified. It waslso shown that the improvement of the energy performance basedn the implementation of GRSs should be accompanied by the con-ideration of various factors such as the characteristics of buildingr regional climate.
It was shown that to improve the heating energy saving effect byhe implementation of GRSs, the following should be considered:i) the effect of the improvement of the insulation performanceegarding the external insulation and window, which prevents coldutside air to infiltrate; and (ii) the opposite effect of the reduc-ion of internal heating depending on the improvement of lightingnergy performance. It was also shown that to improve the coolingnergy saving effect by the implementation of GRSs, the follow-ng should be considered: (i) the effect of the implementation ofhading regarding the blocking of solar radiation; (ii) the effectf the improvement of the internal lighting energy performanceegarding the reduction of internal heating; and (iii) the oppositeffect of the improvement of the insulation performance regardinghe external insulation and window, which makes it difficult thatnternal heating escapes to the outside.
According to the results of the LCC analysis, which included thenalysis of the LCCO2, the improvement scenarios in which GRSs,ED, and double low-e glazing were used (scenarios 4, 5, 7, 8, 11,nd 14) were shown to be cost-effective. However, some scenar-
os including exterior blind did not meet the BEP. Thus it is lessost-effective than existing facility. Therefore, the characteristics ofuilding and regional climate should be considered when applyingRSs.s with which return on investment is achievable.
In this study, the effect of CO2 emission reduction by energysavings and CO2 absorption by GRSs’ plant was considered. Othervarious effects according to the implementation of GRSs and ESMsshould be considered in the future research, which can be the effecton flood prevention or the rental fee for vegetable garden. It isalso believed that qualitative research on the aesthetic and edu-cational effects of the implementation of GRSs and ESMs shouldbe conducted in the future research. Moreover, various types ofGRSs should be compared for decision maker to select the optimumalternative for the specific facility.
It is expected that the results of this study can be used (i) tointroduce the most appropriate ESMs for the specific facility whenapplying GRSs, (ii) to decide which location is proper to implementGRSs considering characteristics of regional climate, and (iii) toselect energy- and cost-efficient elementary school when applyingGRSs.
Acknowledgements
This research was supported by Basic Science Research Pro-gram through the National Research Foundation of Korea (NRF)funded by the Ministry of Education, Science and Technology(2011-0005086). This research was supported by the NRF grantfunded by the Ministry of Education, Science and Technology(2011-0018360).
References
[1] V. Heffernan, Roof and the Environment, Canadian Consulting Engineer, 2003.[2] Korean Forest Service 2009. The Fifth National Forest Plan, 2009, web accessed
at http://english.forest.go.kr/.[3] Chicago Climate Exchange: CO2 Market Data 2011, Available from:
http://www.chicagoclimatex.com/market/data/summary.jsf (accessedOctober 2011).
[4] C. Clark, P. Adriaens, B. Talbot, Green roof valuation: a probabilistic economicanalysis of environmental benefits, Environmental Science and Technology 42(6) (2008) 2155–2161.
[5] Korean Educational Development Institution (KEDI), Research for DevelopmentZero Energy-Eco School Model (II), KEDI, Seoul, South Korea, 2009.
[6] Korean Forest Service 2009, The Fifth National Forest Plan, Available from:http://english.forest.go.kr/ (accessed September 2011).
[7] H. Takebayashi, M. Moriyama, Surface heat budget on green roof and highreflection roof for mitigation of urban heat island, Building and Environment42 (8) (2007) 2971–2979.
d Build
[
[
[
[
[
[
[
[
[
[
[
[
[
[
[
[
[
[
[
T. Hong et al. / Energy an
[8] J.M.O. Scurlock, G.P. Asner, S.T. Gower, Global Leaf Area Index Data form FieldMeasurements, 1932–2000, Oak Ridge National Laboratory Distributed ActiveArchive Center, Oak Ridge, Tennessee, USA, 2001.
[9] E.P.D. Barrio, Analysis of the green roofs cooling potential in buildings, Energyand Buildings 27 (2) (1998) 179–193.
10] R. Kumar, S.C. Kaushik, Performance evaluation of green roof and shadingfor thermal protection of buildings, Building and Environment 40 (11) (2005)1505–1511.
11] J.F. Li, O.W.H. Wai, Y.S. Li, J.M. Zhan, Y.A. Ho, J. Li, E. Lam, Effect of greenroof on ambient CO2 concentration, Building and Environment 45 (12) (2010)2644–2651.
12] R.W. Macdonald, Modeling the mean velocity profile in theurban canopy layer, Boundary-Layer Meteorology 97 (1) (2000)25–45.
13] H. Niu, C. Clark, J. Zhou, P. Adriaens, Scaling of economic benefits from green roofimplementation in Washington, DC, Environmental Science and Technology 44(11) (2010) 4302–4308.
14] T. Hong, H. Kim, T. Kwak, Energy saving techniques for reducing CO2 emissionin elementary schools, Journal of Management in Engineering 28 (1) (2012), inpress.
15] Korea Ministry of Education, Science and Technology (KMEST), 2009 StatisticalYearbook of Education, KMEST, Seoul, South Korea, 2009.
16] N.H. Wong, D.K.W. Cheong, H. Yan, C.L. Ong, A. Sia, The effects of rooftop gardenon energy consumption of a commercial building in Singapore, Energy andBuildings 35 (4) (2003) 353–364.
17] Seoul Metropolitan Government, Guidelines on Green Roof Systems and Prepa-ration of References, Seoul Metropolitan Government, Seoul, South Korea,2008.
18] H. Marico, Q&A of Green Roof Systems, Kajima Institute Publishers, Co., Tokyo,Japan, 2003.
[
[
ings 45 (2012) 229–239 239
19] S. Fujii, H. Cha, N. Kagi, H. Miyamura, Y.S. Kim, Effects on air pollutant removalby plant absorption and adorption, Building and Environment 40 (1) (2005)105–112.
20] G.Y. Ahn, A Study on CO2 Absorption Capacity and Effects on MicroclimateImprovement of Artificial Ground Greening, Ph.D. thesis, Seoul Women’s Uni-versity, Seoul, Korea, 2010.
21] Y.J. Sim, Investigation and Analysis of Eco-school Element Applicable withEnvironmental in Elementary School, M.S. thesis, Seoul National University ofEducation, Seoul, Korea, 2008.
22] Construction Association of Korea (CAK), General Information for Construction,Construction Association of Korea, Seoul, South Korea, 2011.
23] Construction Association of Korea (CAK), Monthly Construction Market Price:February, Construction Association of Korea, Seoul, South Korea, 2011.
24] J. Park, T. Hong, Maintenance management process for reducing CO2 emissionin shopping mall complexes, Energy and Buildings 43 (4) (2011) 894–904.
25] American Society of Heating, Refrigerating and Air-conditioning Engineers(ASHRAE), Advanced Energy Design Guide for K-12 School Buildings, ASHRAE,Atlanta, GA, 2008.
26] Japan National Institute for Educational Policy Research (NIER), Report:Japan–Germany International Symposium on Eco-Schools 2007, NIER, Tokyo,Japan, 2007.
27] American Society of Heating, Refrigerating and Air-conditioning Engineers(ASHRAE), ASHRAE Guideline 14-2002, ASHRAE, Atlanta, GA, 2002.
28] Korea Ministry of Knowledge Economy (KMKE), Prime Cost Calculation Stan-dard of Energy Service Company (ESCO) Project, KMKE, Seoul, South Korea,
2009.29] Korea Energy Management Corporation (KEMCO), Automatic Calculation ofTOE and CO2 Emission, 2010, web accessed at http://co2.kemco.or.kr/.
30] Korea Energy Management Corporation (KEMCO), Energy and Climate ChangeHandbook 2010, KEMCO, Seoul, South Korea, 2010.
Related Documents