1 23 Journal of Physiology and Biochemistry Official Journal of the University of Navarra, Spain ISSN 1138-7548 J Physiol Biochem DOI 10.1007/s13105-012-0172-0 LCAT cholesterol esterification is associated with the increase of ApoE/ApoA-I ratio during atherosclerosis progression in rabbit Alessandro Carlucci, Luisa Cigliano, Bernardetta Maresca, Maria Stefania Spagnuolo, Giovanni Di Salvo, Raffaele Calabrò & Paolo Abrescia

Welcome message from author
This document is posted to help you gain knowledge. Please leave a comment to let me know what you think about it! Share it to your friends and learn new things together.
Transcript

1 23
Journal of Physiology andBiochemistryOfficial Journal of the University ofNavarra, Spain ISSN 1138-7548 J Physiol BiochemDOI 10.1007/s13105-012-0172-0
LCAT cholesterol esterification is associatedwith the increase of ApoE/ApoA-I ratioduring atherosclerosis progression in rabbit
Alessandro Carlucci, Luisa Cigliano,Bernardetta Maresca, Maria StefaniaSpagnuolo, Giovanni Di Salvo, RaffaeleCalabrò & Paolo Abrescia

1 23
Your article is protected by copyright and
all rights are held exclusively by University
of Navarra. This e-offprint is for personal
use only and shall not be self-archived in
electronic repositories. If you wish to self-
archive your work, please use the accepted
author’s version for posting to your own
website or your institution’s repository. You
may further deposit the accepted author’s
version on a funder’s repository at a funder’s
request, provided it is not made publicly
available until 12 months after publication.

ORIGINAL PAPER
LCAT cholesterol esterification is associated with the increaseof ApoE/ApoA-I ratio during atherosclerosis progressionin rabbit
Alessandro Carlucci & Luisa Cigliano &
Bernardetta Maresca & Maria Stefania Spagnuolo &
Giovanni Di Salvo & Raffaele Calabrò &
Paolo Abrescia
Received: 13 October 2011 /Accepted: 11 April 2012# University of Navarra 2012
Abstract Apolipoprotein A-I and Apolipoprotein Epromote different steps of reverse cholesterol transport,including lecithin-cholesterol acyltransferase stimula-tion. Our aim was to study the changes in the levels ofApolipoprotein A-I, Apolipoprotein E, and lecithin-cholesterol acyltransferase activity during atherosclero-sis progression in rabbits. Quantitative echocardio-graphic parameters were analyzed in order to evaluate,for the first time, whether atherosclerosis progression inrabbit is associated to apolipoproteins changes and
alteration of indices of cardiac function, such as systolicstrain and strain rate of the left ventricle. Atherosclerosiswas induced by feeding rabbits for 8 weeks with 2 %cholesterol diet. The HDL levels of cholesterol andcholesteryl esters were measured by HPLC. Thelecithin-cholesterol acyltransferase activity was evaluat-ed both ex vivo, as cholesteryl esters/cholesterol molarratio, and in vitro. Apolipoproteins levels were analyzedby ELISA. The HDL levels of cholesterol and choles-teryl esters increased, during treatment, up to 3.7- and2.5-fold, respectively, compared to control animals. Thelecithin-cholesterol acyltransferase activity in vitro washalved after 4 weeks. During cholesterol treatment,Apolipoprotein A-I level significantly decreased,whereas Apolipoprotein E concentration markedly in-creased. The molar ratio Apolipoprotein E/Apolipopro-tein A-I was negatively correlated with the enzymeactivity, and positively correlated with both increasesin the intima-media thickness of common carotid walland cardiac dysfunction signs, such as systolic strain andstrain rate of the left ventricle.
Keywords Atherosclerosis . Rabbit . Cholesterol .
Apolipoprotein A-I . Apolipoprotein E . Lecithincholesterol acyltransferase
Introduction
The HDL apolipoproteins ApoA-I and ApoE impairthe onset and progression of atherosclerosis by playing
J Physiol BiochemDOI 10.1007/s13105-012-0172-0
Alessandro Carlucci and Luisa Cigliano contributed equally tothis study.
Further studies on humans or other animal models could be ofhelp to confirm whether the ratio Apolipoprotein E/Apolipoprotein A-I can be considered as a biomarker of ath-erosclerosis progression.
A. Carlucci : L. Cigliano (*) : B. Maresca : P. AbresciaDipartimento delle Scienze Biologiche-Sezionedi Fisiologia ed Igiene, Università di Napoli Federico II,via Mezzocannone 8,80134 Naples, Italye-mail: [email protected]
M. S. SpagnuoloIstituto per il Sistema Produzione Animale in AmbienteMediterraneo, Consiglio Nazionale delle Ricerche,Naples, Italy
G. Di Salvo : R. CalabròDipartimento di Cardiologia, Divisione di CardiologiaPediatrica, Seconda Università di Napoli,Ospedale Monaldi,Naples, Italy
Author's personal copy

a pivotal role in a multi-step process called “reversecholesterol transport” (RCT) [13, 17, 19]. In particu-lar, Apolipoprotein A-I (ApoA-I) and ApolipoproteinE (ApoE) promote the efflux of cholesterol excessfrom cells [19], and stimulate lecithin cholesterol acyl-transferase (LCAT) to convert free cholesterol intocholesteryl esters, which are embedded into the lipo-protein core, and change particle shape and density [4,11, 42]. Spherical lipoproteins are thus formed andmostly contribute to the heterogeneous population ofcirculating HDL [19]. Finally, ApoA-I and ApoE actas HDL ligands for hepatocyte receptors and delivertheir lipid cargo, including free cholesterol and cho-lesteryl esters, to liver for elimination [17, 19]. Plasmalevels of large or small HDL subfractions werereported to be associated with the progression of cor-onary atherosclerosis [8, 27].
Rabbits share with humans most HDL-remodellingenzymes and, when fed a high cholesterol diet, rapidlydevelop severe hypercholesterolemia leading to ath-erosclerosis [14, 40]. They have been used as animalmodel to study potential predictors of atherosclerosisdevelopment or therapies against the progression ofthe disease [40]. We focused on cholesterol-fed rabbitsbecause they represent an ideal animal model to createextreme conditions of cholesterol excess and studyconsequent alteration of critical players of RCT, i.e.,LCAT, ApoA-I, and ApoE.
A major problem is the lack of sensitive and objec-tive plasma markers for early diagnosis of individualsat risk of coronary heart disease and/or to follow theprogression of the disease. The aim of this study wasto analyse, in cholesterol fed rabbits, the changes inthe levels of ApoA-I, ApoE, and LCAT activity duringatherosclerosis progression. Furthermore, this studysought to determine whether cholesterol treatmentinduces alteration of both intima-media thickness andindices of cardiac function. The correlation of theseparameters with changes of apolipoproteins or LCATactivity was also explored.
Materials and methods
Materials
RAM11 (mouse monoclonal antibody anti-rabbit mac-rophage) was purchased from Santa Cruz [Santa Cruz,California, USA]. Goat anti-ApoE polyclonal
antibody was purchased from Chemicon [Millipore,Billerica, MA, USA]. Human ApoE was obtainedfrom Calbiochem [La Jolla, CA, USA]. Sheep anti-ApoA-I purchased from Serotec [Oxford, UK].[1α,2α-3H]Cholesterol (45 Ci/mmol) was obtainedfrom Perkin Elmer [Boston, MA, USA]. Sil-G platesfor Thin Layer Chromatografy (TLC; thickness0.25 mm) were obtained from Macherey-Nagel[Düren, Germany]. Chemicals of the highest purity,thyroglobulin, ferritin, lactate dehydrogenase, bovineserum albumin (BSA) cholesterol, egg yolk lecithin,rabbit anti-goat HRP-conjugated (RAG-HRP) IgG,donkey anti-sheep HRP-conjugated (DAS-HRP) IgG,goat anti-mouse HRP-conjugated peroxidase (GAM-HRP) IgG, o-phenylenediamine, dextran sulphate(DS, 50 kD), 4-chloro-1-naphtol, molecular weightmarkers, Supelcosil LC-18 (5 μm particle size, 250×4.6 mm I.D.) were obtained from Sigma-Aldrich [StLouis, MO, USA]. Ketamine, Acepromazine, Diaze-pam, and Tanax were obtained from Alcyon [Marene,CN, Italy]. LDL-cholesterol direct colorimetric kit wasobtained from PKL, Pokler [Salerno, Italia]. PVDFtransfer membrane of Millipore [Bedford, MA, USA]was used. Organic solvents were purchased fromRomil [Cambridge, UK]. Polystyrene 96 wells plateswere purchased from Nunc [Roskilde, Denmark].
Methods
Rabbits' treatment
Male New Zealand white rabbits weighing 1.4–1.6 kg(Harlan, Correzzana (MI), Italy) were fed for 8 weekswith Purina® standard feed as such (control group) orcontaining 2 % (w/w) cholesterol (treated group). Bothfeeds were purchased from Cargill (Milano, Italia).During treatment, blood samples were collected fromthe marginal ear vein. Plasma was separated by cen-trifugation at 800×g for 15 min at 4°C. During theechocardiographic analysis, the rabbits were anesthe-tized with intravenous injection of Ketamine (25 mg/Kg), Acepromazine (1 mg kg−1), and Diazepam(2 mg kg−1). After 8 weeks, the rabbits were anesthe-tized and then sacrificed by administration of Tanax(0.3 ml kg−1). The aortic arch of each rabbit wasdissected free of adhering tissue, washed with physi-ological solution, and perfusion-fixed with Bouin'sfluid for 18 h [10]. The specimens were then dehy-drated through a graded ethanol series, soaked in
A. Carlucci et al.
Author's personal copy
paraffin, and serially and transversally cut for histo-chemistry. Standard principles of laboratory animalcare were in accordance with accepted institutionalpolicies, and all procedures were approved by theAnimal Ethics Committee of the University of NaplesFederico II.
Histochemistry
Tissue cross-sections (5 μm thick) were prepared fromaortic arch. Some of them were stained with Azan-Mallory trichrome method according to a publishedprocedure [10]. Other sections were processed forhistochemistry using a monoclonal antibody(RAM11) against the macrophage marker CD68. Indetail, deparaffinized and hydrated sections werewashed in PBS (50 mM Na2HPO4/NaH2PO4,pH 7.4) for 10 min, treated with 0.3 % hydrogenperoxide for 30 min, incubated with 0.5 % BSA for30 min, and finally challenged with RAM11 (dilution1:100 in PBS containing 0.25 % BSA) at 4°C overnight. After washing by PBS, the sections were incu-bated with GAM-HRP (dilution 1:100 in PBS contain-ing 0.25 % BSA) for 60 min, washed again by PBS,incubated with 0.1 % diaminobenzidine tetrahydro-cloride and 0.3 % H2O2 in PBS, and finally counter-stained with Mayer's hematoxylin and mounted forlight microscopy. Negative controls were prepared byomitting the incubation with the primary antibody.Images of the treated sections were acquired by asoftware-assisted camera system (KS300 from Zeiss,Zaventem, Belgium).
ELISA
Plasma concentrations of ApoA-I and ApoE weretitrated by ELISA. Rabbit ApoA-I, isolated accordingto a published procedure [3] and exhibiting over 98 %purity by electrophoresis and densitometric analysis,was used for calibration. The level of ApoE wasdetermined by using the human antigen as standardfor calibration. The ApoA-I and ApoE levels weredetermined both in the whole plasma and in the super-natant obtained after precipitation of plasma LDL andVLDL with 0.1 % DS in 50 mM MnCl2 (DS-treatedplasma). Aliquots of plasma or DS-treated plasma(50 μL from 1:1,000, 1:10,000, 1:20,000, 1:45,000,1:60,000, and 1:100,000 dilutions in 7.3 mM Na2CO3,17 mM NaHCO3, 1.5 mM NaN3, pH 9.6), were loaded
into the wells of a microtiter plate, and processedessentially according to a published procedure [6]. Inparticular, sheep or goat IgG (anti-ApoA-I, 1:1,500dilution, or anti-ApoE, 1:2,000 dilution, respectively)was used as primary antibody, and DAS-HRP IgG orRAG-HRP IgG (1:3,000 dilution and 1: 8,000 dilu-tion, respectively) as secondary antibody for colordevelopment.
LCAT activity assay
Plasma samples from cholesterol-fed and control ani-mals were treated with 0.1 % DS in 50 mM MnCl2 toremove VLDL and LDL [6]. The in vitro activity ofLCAT was measured as described previously [5, 32],using a proteoliposome (ApoA-I: lecithin: choles-terol01.5:200:18 molar contribution; 0.7 μM ApoA-Iin the assay) as substrate. The enzyme activity wasexpressed as nanomole of cholesterol esterified perhour per milliliter of plasma (units). The efficiencyof LCAT stimulation by ApoA-I or ApoE was inves-tigated by incubating a pool of DS-treated plasma,obtained from control rabbits (as enzyme source) withproteoliposomes containing different molar ratios ofApoA-I with ApoE (4:0, 3:1, 2:2, 1:3, or 0:4; 0.4 μMapolipoprotein in the assay) as substrate.
Titration of cholesterol and cholesteryl esters in HDL
Plasma samples of cholesterol-fed or control animalswere treated with 0.1 % DS in 50 mM MnCl2 forremoving VLDL and LDL [6]. The absence of VLDLand LDL in DS-treated plasma was verified by enzy-matic colorimetric method [1], using a commercial kit,according to the manufacturer's instructions. After thistreatment, two aliquots of DS-treated plasma (25 μL)were used for measuring the amount of free cholesterol(FC) and total cholesterol. In detail, one aliquot wasincubated with 0.25 mL of ethanol, while the otherone with 0.25 mL of ethanol containing 5 M KOH.After incubation (1 h, 75°C), both mixtures were sup-plemented with 0.15mL of 1 %NaCl and, after additionof 2 mL of ice-cold hexane, were vigorously shaken for2 min. Each hexane extract was taken on and the lowerphase was likewise extracted two more times. The threeextracts were pooled and dried under nitrogen stream.The residue was dissolved in 0.2 mL of acetonitrile/isopropanol (57:43, v:v), and 20 μL were processed byreverse-phase HPLC. The chromatography was
ApoA-I, ApoE, and LCAT in cholesterol-fed rabbit
Author's personal copy

performed by a C18 column at 40°C with 1 mL min−1
flow rate, according to a published procedure [6]. Theamounts of free and total cholesterol, as measured in thesamples processed without and with KOH, respectively,were used to calculate the amount of cholesteryl esters(CE) as “total minus free cholesterol”. Calibrationcurves (r2≥0.9997), obtained by injecting differentamounts (n012) of standard FC, were used for quanti-tative analysis.
Electrophoresis and densitometry
In order to check whether DS-treated plasma was con-taminated by ApoB-containing lipoproteins, pools ofwhole plasma (N05) and DS-treated plasma fromcholesterol-fed (after 8 weeks of diet) and control rabbitswere analyzed by electrophoresis. Proteins were frac-tionated by 3–10 % (w/v) polyacrylamide gradient gelelectrophoresis, under denaturing and reducing condi-tions, and then blotted onto PVDF membrane [5]. Afterprotein blotting, the membrane was rinsed in TBS(130 mM NaCl, 20 mM Tris–HCl, pH 7.4) containing0.05 % (v/v) Tween 20 (T-TBS), and treated with 0.5 %BSA in TBS for 1 h at 37°C. ApoB presence wasanalyzed by incubating the membrane with goat anti-ApoB IgG (1:1,000 dilution in TBS containing 0.25 %BSA; 1 h at 37°C), followed by RAG-HRP IgG(1:3,000 dilution; 1 h at 37°C). The immune complexeswere detected by using hydrogen peroxide and 4-chloro-1-naphthol for color development. ApoB was detectedonly in whole plasma, but not in DS-treated plasma,confirming that all ApoB containing lipoproteins wereprecipitated by DS treatment (data not shown).
The separation of HDL population in subfractionswas performed as follows. Aliquots (2 μL) of a pool ofDS-treated plasma obtained from cholesterol fed andcontrol rabbits were processed for electrophoresis on4–30 % (w/v) polyacrylamide gradient gel [18]. Homo-geneity and hydrodynamic diameter of HDL were esti-mated using reference globular proteins (thyroglobulin,ferritin, lactate dehydrogenase, and albumin; Stokes' di-ameter, 17, 12.2, 8.1, and 7.1, respectively) [18]. Afterelectrophoresis, proteins were blotted onto PVDF mem-brane. The membrane was treated with 5 % non fat milkin T-TBS (1 h, 37°C), and then incubated, overnight at 4°C, with sheep anti-ApoA-I or goat anti-ApoE IgG (1:1,000 dilution in T-TBS containing 0.25% non fat milk).The immunocomplexes were detected by DAS-HRP orGAR-HRP IgG, respectively (1:1,000 dilution in T-TBS
containing 0.25 % non fat milk), using hydrogen perox-ide and 4-chloro-1-naphthol for color development. Dig-ital images of membranes were analyzed bydensitometry with the Gel-ProAnalyser software (MediaCybernetics, Silver Spring, MA). The band intensitieswere recorded as peaks on a densitogram and arbitrarilyexpressed as Integrated Optical Density (IOD).
Echocardiography
Echocardiographic studies were performed at baseline,4, and 8 weeks of cholesterol treatment. Two-dimensional targeted M-mode traces were obtained atthe level of the papillary muscles using an echocardio-graphic system equipped with a 10-MHz phased-arraytransducer. Anterior and posterior end-diastolic wallthickness, left ventricular (LV) contractility end-diastolic, and end-systolic dimensions were measured,according to the American Society for Echocardiogra-phy leading-edge method [31], from at least three con-secutive cardiac cycles. LV volume and ejection fractionwere calculated on the basis of the Teichholtz formula[34]. Data were collected by the Aplio XG echo-scannerand the Toshiba PSM-70AT transducer (5–10 MHz)with high temporal and spatial resolution. The transduc-er was placed directly on the chest wall and fixed at theparasternal view and then at the apical 4 chamber view(for color Doppler myocardial imaging, CDMI) using amechanical arm. Using a zoomed image window, myo-cardial velocity data were acquired at rate of 203frames s−1, a sector angle of 30°, and an image depthof 15 mm. Beam focus was set at 10 mm. Digital data often consecutive heart cycles were recorded and trans-ferred to a personal computer workstation for off-lineanalysis. Longitudinal myocardial velocities, systolicstrain (S), and strain rate (SR) of the left ventricle werecalculated from CDMI data using the Toshiba software.SR and S profiles were analyzed on the basal part of theinterventricular septum. The region of interest wasplaced in the wall always in order to reduce the anglebetween the ultrasound beam and the muscle. S estima-tion length of 1.0 mm was used depending on thethickness of the wall (end-diastolic wall thickness be-tween 1.1 and 2 mm). Start and end of the ejection phasewere properly defined using ECG and velocity trace, aspreviously demonstrated in humans [33]. SR and Sprofiles were handled without smoothing. Peak systolicSR and S values were measured in each of ten heartcycles. The maximal and minimal values were
A. Carlucci et al.
Author's personal copy

discarded, and the remaining eight values were aver-aged. The serial changes of peak systolic SR and S,before and during treatment, were then evaluated. Allthe echocardiographic analyses were performed on dig-itally stored raw data (gray scale bidimensional imagesand CDM images) by two investigators blinded to thetreatment group and to the histological findings.
Statistical analysis
The samples for measurement of apolipoprotein con-centration and LCAT activity were processed in tripli-cate. Echocardiographic data were also collected intriplicate. Data were expressed as means±standarddeviation (SD). Statistical differences were determinedusing t test or, where appropriate, one-way ANOVA,followed by Tukey's test for multiple comparisons(GraphPad Software Inc., San Diego, CA). Differen-ces were considered statistically significant when thetwo-sided P value was less than 0.05.
Results
Influence of cholesterol diet on lesion formation
Histological analysis of the aortic arch was performedto assess the presence of atherosclerotic plaques. Thesections were obtained from rabbits fed standard dietor high cholesterol diet for 8 weeks. The intima wasbarely visible and no plaque was detected, after Azan-Mallory staining, in aorta sections from control group(Fig. 1a). In the cholesterol-treated group, the intima/media ratio was approximately twofold greater thanthat in control group, and atherosclerotic plaques weredetected (Fig. 1c). In particular, these plaquescontained a large amount of thick fatty streaks withround lipid-loaded cells, which turned out to be mac-rophages as detected by anti-RAM11 antibodies(Fig. 1d vs. b). The macrophages clearly displayedpenetration into the media layer.
Ratio of CE with FC in HDL of normalor cholesterol-fed rabbits
The activity of LCAT was evaluated in rabbit plasmaby measuring the amount of CE and FC in HDL. Inparticular, the molar ratio of CE with FC in HDL, aparameter used to evaluate the enzyme activity ex vivo
[6], was calculated. Plasma samples were collectedfrom cholesterol-fed (N05) or control rabbits (N05),and analyzed at different time lengths. The CE levelwas found markedly higher in cholesterol fed rabbitsthan in controls, starting from the fourth week oftreatment (4 weeks, 2.38±0.36 vs. 1.2±0.1 mM, P<0.01; 6 weeks, 2.6±0.24 vs. 1.3±0.1 mM, P<0.01;8 weeks, 2.9±0.42 vs. 1.1±0.15 mM, P<0.01)(Fig. 2a). As expected, the HDL FC level was higherin cholesterol-fed rabbits than in controls (Fig. 2a),from the fourth week of treatment (4 weeks, 0.72±0.22 vs. 0.20±0.03 mM in controls, P<0.01) and fromthen onwards (6 weeks, 0.8±0.1 vs. 0.25±0.05 mM,P<0.01; 8 weeks, 0.86±0.25 vs. 0.23±0.04 mM,P<0.01). It is worth to note that the level of HDL-FC increased more than that of HDL-CE during treat-ment (about 3.8- and 2-fold, respectively). The CE/FCratio did not change after 1 week of treatment, whereasit decreased afterwards as a logarithmic function oftime length (r00.9522), thus indicating that the HDLcomposition in FC and CE was not immediately mod-ified by the cholesterol loading but only a few dayslater. The ratio progressively and significantly de-creased from the second to the third week of treatment(down to 53±10 % of the value at the starting point),and poorly changed ever since (8 weeks, 50±12 %)(Fig. 2b). In particular, after 2 weeks of treatment, theCE/FC ratio was significantly lower (30 % lower ofinitial value) than that in controls. The control groupdid not display significant alterations of CE/FC ratio.In agreement with these data, the amount of plasmaLCAT, when measured in vitro by determining theenzyme activity after 4 weeks of treatment, was foundto be about half of that in control rabbits (3.3±0.8 vs.7.8±0.6 units, P<0.01), and no further significantdecrease until the end of treatment was observed (3.9±0.9 vs. 8.1±0.7 units, P<0.01) (Fig. 3).
ApoA-I and ApoE levels in normal or cholesterol-fedrabbits
The major LCAT stimulating effectors are ApoA-I andApoE [4, 11, 42]. Therefore, in order to get moreinsight into the regulation of enzyme activity, it wasmandatory to analyze the levels of these two apolipo-proteins during the dietary treatment. Plasma fromrabbits, fed with normal or cholesterol diet, was col-lected at different times (0, 2, 4, 6, and 8 weeks) andtreated with DS to remove VLDL and LDL. Then,
ApoA-I, ApoE, and LCAT in cholesterol-fed rabbit
Author's personal copy

ApoA-I or ApoE were titrated by ELISA, using anti-ApoA-I or anti-ApoE antibodies, respectively. Thelevel of ApoA-I progressively decreased incholesterol-fed rabbits during treatment, as comparedto that in controls (4 weeks, 30.3±1.4 vs. 44.2±1.7 μM, P<0.01; 8 weeks, 18.5±1.7 vs. 45±2.5 μM,P<0.01) (Fig. 4a). The level of ApoE was found mark-edly increased in cholesterol-fed rabbits (4 weeks, 16.1±1.4 vs. 2±0.2 μM in controls, P<0.01; 8 weeks, 30.5±2.9 vs. 1.3±0.5 μM, P<0.01) (Fig. 4b). The decrease inApoA-I level concomitantly accompanied the increasein ApoE level from just the start of the treatment. Anegative correlation was found between these levels (r0−0.9462, P<0.01), and the function which better de-scribed the changes of ApoE/ApoA-I during treatmentwas represented by a linear curve (r00.948).
In order to measure the ApoE amount in HDL andnon-HDL lipoproteins from cholesterol-fed rabbits,the plasma was collected after 8 weeks of treatmentand processed by ELISA. Plasma aliquots were ana-lyzed as such, and after fractionation with DS. ApoE
was mostly (over 90 %) found as HDL-bound form(30.5±2.9 μM in HDL fraction), whereas in controlanimals, the amount of HDL-bound form was compa-rable to that in non-HDL fraction (Fig. 5). Thesefindings indicate that cholesterol loading essentiallycaused ApoE accumulation in the HDL fraction. Con-versely, ApoA-I levels in the HDL fraction and in thewhole plasma were comparable both in control (45±2.5 and 47.4±1.9 μM, respectively) and cholesterol-fed rabbits (18.5±1.7 and 18.9±1.5 μM, respectively).
Effect of ApoE/ApoA-I ratio on LCAT activity in vitro
Proteoliposomes containing either ApoE or ApoA-I ordifferent molar ratios of ApoE with ApoA-I (4:0, 3:1,2:2, 1:3, or 0:4) were used to stimulate LCAT in vitro.Proteoliposomes with ApoE stimulated the enzyme1.97-fold less than those with ApoA-I (4±0.12 vs.7.86±0.04 U, P<0.01), and the enzyme activity de-creased as the ApoE/ApoA-I ratio increased (Fig. 6a).These data indicate that LCAT activity is negatively
Fig. 1 Analysis of aortic arch from control and cholesterol-fedrabbits. Serial cross-sections showing immunohistochemicalstaining of aortic arch of rabbits fed either a normal diet orcholesterol diet. a, c Sections obtained from representativecontrol or cholesterol-fed rabbit, respectively, stained with AzanMallory's (original magnification, 10×). b, d Sections obtained
from representative control or cholesterol-fed rabbit, respective-ly, stained with RAM11 monoclonal antibody (original magni-fication, 10×). e, f Particular of atherosclerotic lesion stainedwith Azan Mallory's method or RAM11 monoclonal antibody(original magnification, 40×). In d and f, positive immunostain-ing is indicated by a brown color
A. Carlucci et al.
Author's personal copy

correlated to the ApoE/ApoA-I ratio in vitro (r0−0.993). This association might exist also in vivo. Tosupport this hypothesis, HDL isolated from plasma oftreated rabbits, collected at weekly intervals, were ana-lyzed for their ApoE/ApoA-I and CE/FC ratios. As amatter of fact, the HDL CE/FC ratio was found de-creased as the ApoE/ApoA-I ratio increased during thecholesterol diet (Fig. 6b). In particular, CE/FC wasnegatively correlated to Ln [ApoE/ApoA-I] (P<0.001).
Distribution of ApoA-I and ApoE among HDLsubclasses
To evaluate how cholesterol diet affect ApoA-I andApoE distribution over the different HDL subclasses,
Fig. 2 FC and CE levels in HDL, from control and cholesterol-fed rabbits, at different times of treatment. The HDL fractionwas isolated from plasma of cholesterol-fed or control rabbits,and analyzed for its FC and CE content by HPLC. a Theconcentrations of FC and CE in treated (full circles and squares,respectively) or control rabbits (open circles and squares, re-spectively) at 0, 2, 4, 6, and 8 weeks are shown. b The molarratio of CE with FC in treated (N05; full triangles) or controlrabbits (N05; open triangles), was calculated at each time, andexpressed as percent of the initial value in each animal. Data areexpressed as mean±SD at each time length. The dotted curverepresents the trend expressed by CE/FC091.7–22.3 Ln (time)(r00.9522)
Fig. 3 Time-dependent modifications of LCAT activity in vitro.The in vitro activity of LCAT was measured in plasma samplesfrom treated (N05; full bars) and control rabbits (N05; openbars), after 0, 4, and 8 weeks of treatment, using an ApoA-I-containing proteoliposome (0.7 μM) as substrate. The enzymeactivity is expressed as enzyme units (nanomole of cholesterolesterified per hour per milliliter of sample). Data are reported asmean±SD at each time length
Fig. 4 Levels of ApoA-I and ApoE in normal and cholesteroltreated rabbits. Plasma samples were collected from treated (N05; full symbols) and control rabbits (N05; open symbols) atdifferent times (0, 2, 4, 6, and 8 weeks). The concentrations ofApoA-I (panel a) and ApoE (panel b) were measured by ELISAin samples of plasma, treated with 0.1 % DS and 50 mM MnCl2to remove VLDL and LDL. Data are expressed as mean±SD ateach time length
ApoA-I, ApoE, and LCAT in cholesterol-fed rabbit
Author's personal copy

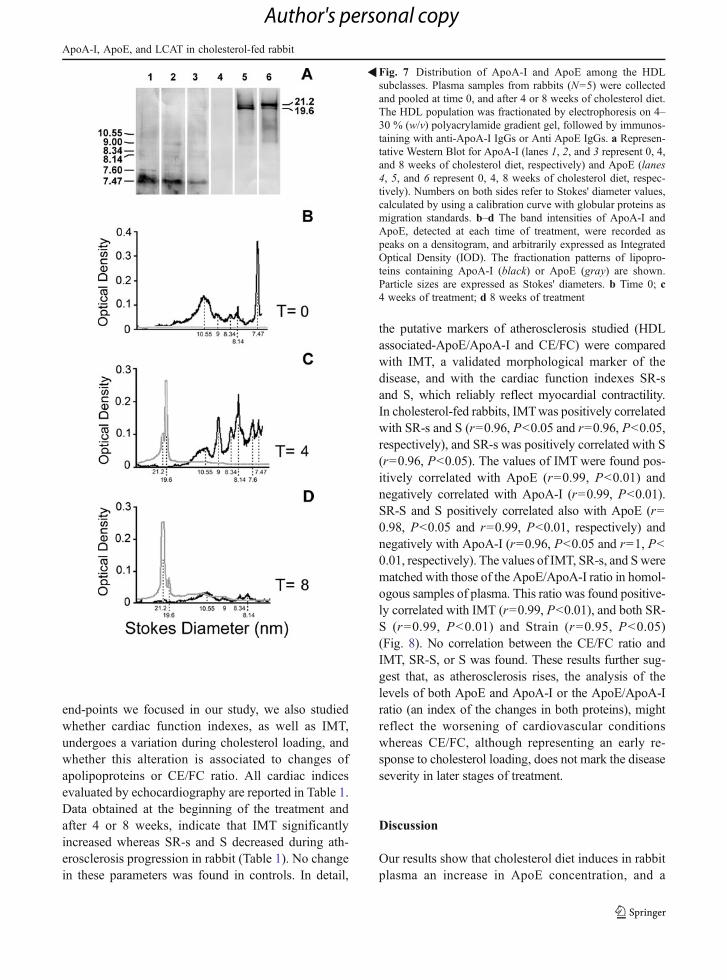
the HDL fraction from cholesterol-fed rabbits wasprocessed by non-denaturing electrophoresis and im-munoblotting with antibodies against ApoA-I andApoE (Fig. 7a). Three distinct patterns of immunore-activity to antibodies against ApoA-I or ApoE wereobserved in HDL samples analyzed at different timesof treatment (0, 4, and 8 weeks). Densitometric scan-ning of antibody-reacted ApoA-I or ApoE in the frac-tionated HDL population was carried out (Fig. 7). Insamples collected at the beginning of treatment, HDLparticles of 10.55 and 7.47 nm contained most ofApoA-I (40.3 % and 19 % of total amount, respective-ly). In samples collected after 4 weeks, the ApoA-Iamount increased in the HDL particles sized from 7.6to 9 nm, whereas it decreased in particles of 10.55 and7.47 nm. After 8 weeks of treatment, ApoA-I de-creased in all the HDL population, and was mostlyassociated to the HDL subclasses with 9 and 10.55 nmparticle size.
ApoE was not detected in HDL isolated from plas-ma of cholesterol-fed rabbits at baseline (time 0). After4 weeks of treatment, ApoE was present in large HDLparticles (19.6 and 21.6 nm) and mostly associated tothose displaying 19.6 nm size particles (73.6 % of thetotal amount). After 8 weeks, ApoE was mostlydetected in 21.6 nm sized particles (63.2 % of the totalamount). Furthermore, at this time, ApoE was detectedin 9 and 10.55 nm sized particles (7.5 % and 13.7 % ofthe total amount, respectively).
Correlation of ApoE/ApoA-I or CE/FCwith parameters of cardiovascular dysfunction
Previous studies investigated the relationship betweenstructural and functional changes in the carotid arteriesand LV myocardial function in patients with cardio-vascular risk factors and found that LV relaxation issignificantly associated with carotid stiffness [23].Notably, ultrasonic strain imaging revealed subclinicalchanges in intrinsic myocardial deformation that couldnot be detected by the conventional methods, includ-ing transmitral flow and mitral annular motion veloc-ities, used to evaluate LV function [23].
Although echocardiographic indices of cardiacfunction are different end-point from the functional
Fig. 5 ApoE level in plasma and lipoprotein fractions. Aliquotsof plasma were collected, after 8 weeks of treatment, from bothcontrol (N05) and treated (N05) rabbits, and used as such orprocessed by DS for separating the HDL fraction from the nonHDL fraction. The volumes of both fractions were adjusted tothat of starting plasma. ApoE was titrated in the total plasma, inthe HDL fraction, and in the non HDL lipopropotein fraction ofeach rabbit (see the insert for symbols). Each sample wasanalyzed in triplicate: deviations over 5 % from the averagewere not found. Data are expressed as mean±SD
Fig. 6 Effect of ApoE/ApoA-I ratio on LCAT activity in vitro,and on CE/FC in HDL. a LCAT activity was analyzed in vitroby using a pool of DS-treated plasma, obtained from controlrabbits, as enzyme source and liposomes containing ApoA-I, orApoE, or different molar ratios of both apolipoproteins as sub-strate. The activity is expressed as enzyme units (nanomoles ofcholesterol esterified per hour per milliliter of plasma). The dataare reported as mean±SD. The negative correlation is graph-ically represented by the drawn curve (r00.9928). b Correlationbetween CE/FC and ApoE/ApoA-I ratio. Plasma samples werecollected at 1 week intervals during treatment of rabbits (N05)with cholesterol-supplemented diet. Each sample was used tomeasure the molar concentration of ApoE, Apo A-I, FC, and CEin isolated HDL. The data are expressed as means±SD
A. Carlucci et al.
Author's personal copy
end-points we focused in our study, we also studiedwhether cardiac function indexes, as well as IMT,undergoes a variation during cholesterol loading, andwhether this alteration is associated to changes ofapolipoproteins or CE/FC ratio. All cardiac indicesevaluated by echocardiography are reported in Table 1.Data obtained at the beginning of the treatment andafter 4 or 8 weeks, indicate that IMT significantlyincreased whereas SR-s and S decreased during ath-erosclerosis progression in rabbit (Table 1). No changein these parameters was found in controls. In detail,
the putative markers of atherosclerosis studied (HDLassociated-ApoE/ApoA-I and CE/FC) were comparedwith IMT, a validated morphological marker of thedisease, and with the cardiac function indexes SR-sand S, which reliably reflect myocardial contractility.In cholesterol-fed rabbits, IMTwas positively correlatedwith SR-s and S (r00.96, P<0.05 and r00.96, P<0.05,respectively), and SR-s was positively correlated with S(r00.96, P<0.05). The values of IMT were found pos-itively correlated with ApoE (r00.99, P<0.01) andnegatively correlated with ApoA-I (r00.99, P<0.01).SR-S and S positively correlated also with ApoE (r00.98, P<0.05 and r00.99, P<0.01, respectively) andnegatively with ApoA-I (r00.96, P<0.05 and r01, P<0.01, respectively). The values of IMT, SR-s, and Swerematched with those of the ApoE/ApoA-I ratio in homol-ogous samples of plasma. This ratio was found positive-ly correlated with IMT (r00.99, P<0.01), and both SR-S (r00.99, P<0.01) and Strain (r00.95, P<0.05)(Fig. 8). No correlation between the CE/FC ratio andIMT, SR-S, or S was found. These results further sug-gest that, as atherosclerosis rises, the analysis of thelevels of both ApoE and ApoA-I or the ApoE/ApoA-Iratio (an index of the changes in both proteins), mightreflect the worsening of cardiovascular conditionswhereas CE/FC, although representing an early re-sponse to cholesterol loading, does not mark the diseaseseverity in later stages of treatment.
Discussion
Our results show that cholesterol diet induces in rabbitplasma an increase in ApoE concentration, and a
Fig. 7 Distribution of ApoA-I and ApoE among the HDLsubclasses. Plasma samples from rabbits (N05) were collectedand pooled at time 0, and after 4 or 8 weeks of cholesterol diet.The HDL population was fractionated by electrophoresis on 4–30 % (w/v) polyacrylamide gradient gel, followed by immunos-taining with anti-ApoA-I IgGs or Anti ApoE IgGs. a Represen-tative Western Blot for ApoA-I (lanes 1, 2, and 3 represent 0, 4,and 8 weeks of cholesterol diet, respectively) and ApoE (lanes4, 5, and 6 represent 0, 4, 8 weeks of cholesterol diet, respec-tively). Numbers on both sides refer to Stokes' diameter values,calculated by using a calibration curve with globular proteins asmigration standards. b–d The band intensities of ApoA-I andApoE, detected at each time of treatment, were recorded aspeaks on a densitogram, and arbitrarily expressed as IntegratedOptical Density (IOD). The fractionation patterns of lipopro-teins containing ApoA-I (black) or ApoE (gray) are shown.Particle sizes are expressed as Stokes' diameters. b Time 0; c4 weeks of treatment; d 8 weeks of treatment
�
ApoA-I, ApoE, and LCAT in cholesterol-fed rabbit
Author's personal copy

decrease in both the LCAT activity and the level ofApoA-I, which is the LCAT major stimulator. Thisenzyme function can actually be limited or lost underinflammatory conditions [17]. The decrease of ApoA-Iconcentration in HDL, during atherogenesis, can de-pend on reduced synthesis, enhanced clearance, orreplacement by serum amyloid A [17, 25]. Both hu-man and animal studies showed that a high cholesteroldiet leads to elevations in ApoE plasma levels [20,22]. ApoE concentration also increased in patientswith coronary artery disease [28]. Thus, CE depletion,
ApoA-I decrease, and ApoE increase [17, 20, 22] inHDL are all resulting from traffic and activities on thescenario of altered RCT. The CE/FC molar ratio (rath-er than the concentration of either) in HDL mightreflect the complex pathways of lipid metabolism inRCT and mark compositionally altered HDL. We ac-tually found this ratio decreased during the first stagesof treatment (0 to 4 weeks), as expected by the alter-ation of LCAT activity and the levels of its effectors.This enzyme was expected to work less than in normalconditions as atherosclerosis worsened, just because
Table 1 Echocardiographic parameters and IMT measured in control and treated rabbits
Echocardiographic parameters Sample Time 0 Time 4 weeks Time 8 weeks
Body weight (kg) C 1.42±0.03 2.71±0.06* 3.44±0. 21*,**
T 1.37±0.06 2.78±0.31* 3.31±0.38*, **
SIVd (mm) C 2.02±0.15 2.00±0.08 1.95±0.06
T 2.05±0.12 2.07±0.21 2.13±0.06
PPd (mm) C 2.05±0.10 2.00±0.18 1.95±0.13
T 2.06±0.08 2.08±0.28 2.03±0.11
LVd (mm) C 15.35±0.85 15.35±0.85 15.12±0.58
T 15.57±0.78 15.60±1.00 16.20±0.30
SIVs (mm) C 3.02±0.26 3.01±0.28 3.05±0.24
T 3.03±0.26 2.91±0.18 2.97±0.25
PPs (mm) C 3.10±0.18 3.10±0.23 3.20±0.10
T 3.12±0.17 3.13±0.18 3.17±0.25
LVs (mm) C 10.60±0.96 10.50±0.96 10.60±0.64
T 10.80±0.84 10.40±0.90 11.80±0.72
EF (%) C 64.00±3.90 63.20±2.70 63.50±2.40
T 63.00±3.50 64.60±3.30 64.70±3.10
SF (%) C 34.00±4.10 33.70±3.80 34.20±3.10
T 32.80±3.70 33.60±3.00 33.00±2.00
IMT (mm) C 0.19±0.03 0.19±0.03 0.19±0.02
T 0.19±0.01 0.21±0.01 0.23±0.03*
Strain (%) C −31.00±1.35 −31.25±1.25 −30.25±0.85T −30.30±0.21 −26.50±0.56* −23.30±0.88*, **
Strain rate S C −2.86±0.05 −2.85±0.03 −2.82±0.03T −2.87±0.03 −2.49±0.22 −1.8±0.05*, **
Strain rate E C 2.60±0.53 2.60±0.53 2.50±0.28
T 2.65±0.48 2.50±0.48 2.65±0.11
The data are expressed as means±standard deviation. Statistical differences were calculated by one-way ANOVA followed by Tukey'stest for multiple comparisons
*Significantly different from time 0 (p<0.01); **significantly different from 4 weeks (p<0.05)
C rabbit fed with normal diet, T rabbit fed with 2 % cholesterol-supplemented diet, SIVd end-diastole interventricular septum thickness,PPd end-diastole posterior wall thickness, LVd left ventricular diastolic diameter, SIVs, end-systole interventricular septum thickness,PPs end-systole posterior wall thickness, LVs left ventricular systolic diameter, EF ejection fraction, SF shortening fraction, IMT intimamedia thickness
A. Carlucci et al.
Author's personal copy

the stimulation on the enzyme activity decreased. Infact, the increase of ApoE level during the treatmentcould not make up for the decrease of ApoA-I level. Invitro LCAT stimulation by ApoE was actually found tobe about a half of that by ApoA-I, according to previousinformation [42]. We also report here experimental ev-idence that ApoE liposomes stimulated rabbit LCATless efficiently than ApoA-I liposomes. However, sinceit has been reported that ApoE is more efficient thanApoA-I as LCAT activator on large HDL particles [42],it cannot be excluded that the constant trend of the ratioCE/FC, at late stages of treatment, could be due to theincrease in ApoE concentration. Several lines of evi-dence suggested a potent anti-atherogenic role forApoE. Indeed, ApoE −/− mice are severely hypercho-lesterolemic and rapidly develop atherosclerosis [37].ApoE was reported to prevent the progression of ath-erosclerosis in hyperlipidemic rabbits [39]. A prominentHDL subclass, enriched in ApoE and referred to asHDL-1, was detected in cholesterol-fed rabbits [21].We cannot exclude that ApoE might influence the rateof atherogenesis not only by modulating the RCT path-way but also by positively modifying cellular functionsin the arterial wall.
LCAT activity might also be reduced by oxidativestress as it has been reported that oxidation of ApoA-I orApoE, as occurring during inflammatory conditions,
can be associated to the loss of the ability of theseapolipoproteins to stimulate LCAT [29, 30]. It wasrecently shown that HDL from patients with coronaryartery disease is oxidatively modified and that oxidationimpairs RCT mediated by HDL [2, 24]. However cho-lesterol esterification, though negatively affected byreduced stimulation and possible oxidative stress, seemsto be driven by enhanced levels of circulating cholester-ol. Therefore, the observed poor change of CE/FC inHDL, during the second month of cholesterol-loading,might depend on balance between high CE productionand increased availability of dietary cholesterol. In-creased cholesterol availability might be also enhancedby reduced uptake by hepatocytes or macrophages. Infact, the expression of SR-BI was previously foundsignificantly decreased in the liver of hypercholesterol-emic rabbits as compared with control group [15, 41].
The HDL population shows considerable composi-tional heterogeneity with respect to both lipid andapolipoprotein components. As changes in these com-ponents among HDL subclasses might influence RCTand predict cardiovascular disease [35], we choose toanalyze the distribution of ApoE and ApoA-I amongHDL subclasses. Our analysis of the HDL populationin the plasma of rabbits shows that cholesterol-diet, inthe early stages of treatment, raises the amount ofHDL-2, which are considered less efficient thanHDL-3 in stimulating RCT and weakening atheroscle-rosis. In later stages of treatment, most of ApoE waslocalized in large HDL-1. This marked increase ofApoE concentration on HDL might represent a phys-iological response to face high cholesterol accumula-tion and counteract inflammation and atherosclerosis.
Previous studies showed that HDL and ApoA-Inegatively correlated with IMT in humans [16]. Lowerlevel of ApoA-I, higher level of ApoB, and the ratioApoB/ApoA-I were suggested to be independent riskfactors for coronary heart disease [26]. In addition, alink between ApoE phenotype prevalence and IMTwas found [38]. S and SR reflect myocardial deforma-tion properties [9, 33], do not depend on overall heartmotion or rotation induced by contraction of adjacentmyocardial segments, and reliably represent the heartlocal deformation [7, 36]. In particular, regional SRwas proposed to be a strong index of left ventricularcontractility [12]. Our study suggests that the analysis ofS and SR-s, which was previously shown to be effectivein detecting early subclinical myocardial abnormalities[9], allows detecting longitudinal myocardial damage
Fig. 8 Correlation between ApoE/ApoA-I ratio and IMT, SR-s,or S. Rabbits were analyzed at the beginning of treatment withcholesterol diet (t00) and after 4 and 8 weeks (t04 and t08,respectively). Measurements of SR-s, S, and IMT were per-formed by image analysis for each animal, and the average isreported: deviations over 5 % from the average were not found.The ratio ApoE/ApoA-I in HDL was determined in triplicatesfrom each sample, and the average values were used to obtainmeans±SD, as indicated on the figure bottom. This ratio ispositively correlated with SR-s (P<0.01), S (P<0.05), andIMT (P<0.01)
ApoA-I, ApoE, and LCAT in cholesterol-fed rabbit
Author's personal copy

in rabbit treated with cholesterol diet. To our knowl-edge, this is the first time that SR-s imaging was usedto compare right ventricular and left ventricular re-gional function in cholesterol-fed rabbit. The CE/FCratio was not correlated with IMT or with the indicesof cardiac function. On the other hand, we found theratio ApoE/ApoA-I correlated both with IMT andwith function S and SR-s. These data suggest thatthe alteration of ApoE/ApoA-I ratio, in HDL, mightreflect the severity of atherosclerosis, as quantified byIMT, as well as the alteration of cardiac function, asevaluated by the cardiac parameters used in this study.This ratio might also reflect the HDL remodelingcaused by the changes in enzyme activities and apo-lipoprotein metabolism occurring in response to highlevels of dietary or endogenous cholesterol. In con-clusion, our study suggests that the cardiac functionmight be altered by the increase of IMT, which in turnshould be altered by changes in reverse cholesteroltransport. Prospective studies on patients with athero-sclerosis are required to verify whether relationshipsof cause–effect between insufficient RCT and cardiacfunction do exist and to confirm the usefulness of theApoE/ApoA-I ratio as a marker for evaluating athero-sclerosis progression in longitudinal analysis.
Acknowledgments This research was supported by a grantfrom the Ministry of Health of Italy (Project BS 1.2.5; upb2.1.2.1, cap 2306). We thank Dr. Daniele Di Napoli for rabbits'treatment and Dr. Domenico Iossa for assistance in ELISAexperiments.
References
1. Bachorik PS, Ross JW (1995) National Cholesterol Educa-tion Program recommendations for measurement of low-density lipoprotein cholesterol: executive summary. TheNational Cholesterol Education Program Working Groupon Lipoprotein Measurement. Clin Chem 41:1414–1420
2. Bergt C, Pennathur S, Fu X et al (2004) The myeloperox-idase product hypochlorous acid oxidizes HDL in the hu-man artery wall and impairs ABCA1-dependent cholesteroltransport. Proc Natl Acad Sci USA 101:13032–13037
3. Brewer HB Jr, Ronan R, Meng M, Bishop C (1986) Isola-tion and characterization of apolipoproteins A-I, A-II, andA-IV. Methods Enzymol 128:223–246
4. Chen CH, Albers JJ (1985) Activation of lecithin: choles-terol acyltransferase by apolipoproteins E-2, E-3, and A-IVisolated from human plasma. Biochim Biophys Acta836:279–285
5. Cigliano L, Pugliese CR, Spagnuolo MS et al (2009) Hap-toglobin binds the antiatherogenic protein apolipoprotein E-
impairment of apolipoprotein E stimulation of both lecithin:cholesterol acyltransferase activity and cholesterol uptakeby hepatocytes. FEBS J 276:6158–6171
6. Cigliano L, Spagnuolo MS, Cuomo G et al (2005) Apoli-poprotein A-I-dependent cholesterol esterification inpatients with rheumatoid arthritis. Life Sci 7:108–120
7. D’Hooge J, Heimdal A, Jamal F et al (2000) Regional strainand strain rate measurements by cardiac ultrasound: princi-ples, implementation and limitations. Eur J Echocardiogr1:154–170
8. Desai MY, Rodriguez A, Wasserman BA et al (2005) As-sociation of cholesterol subfractions and carotid lipid coremeasured by MRI. Arterioscler Thromb Vasc Biol 25:e110–e111
9. Di Salvo G, Drago M, Pacileo G et al (2005) Comparison ofstrain rate imaging for quantitative evaluation of regionalleft and right ventricular function after surgical versus per-cutaneous closure of atrial septal defect. Am J Cardiol96:299–302
10. Forte A, Di Micco G, Galderisi U et al (2001) Molecularanalysis of arterial stenosis in rat carotids. J Cell Physiol186:307–313
11. Glomset JA, Janssen ET, Kennedy R, Dobbins J (1996)Role of plasma lecithin:cholesterol acyltransferase in themetabolism of high density lipoproteins. J Lipid Res7:638–648
12. Greenberg NL, Firstenberg MS, Castro PL et al (2002)Doppler-derived myocardial systolic strain rate is a strongindex of left ventricular contractility. Circulation 105:99–105
13. Greenow K, Pearce N, Ramji DP (2005) The key role ofapolipoprotein E in atherosclerosis. J Mol Med 83:329–342
14. Hoeg JM, Santamarina-Fojo S, Bérard AM et al (1996)Overexpression of lecithin:cholesterol acyltransferase intransgenic rabbits prevents diet-induced atherosclerosis.Proc Natl Acad Sci U S A 93:11448–11453
15. Hong SC, Zhao SP, Wu ZH (2007) Effect of probucol onHDL metabolism and class B type I scavenger receptor (SR-BI) expression in the liver of hypercholesterolemic rabbits.Int J Cardiol 115:29–35
16. Juonala M, Viikari JSA, Kahonen M et al (2008) Childhoodlevels of serum apolipoproteins B and A-I predict carotidintima-media thickness and brachial endothelial function inadulthood. J Am Coll Cardiol 52:293–299
17. Kontush A, Chapman MJ (2006) Functionally defectivehigh-density lipoprotein: a new therapeutic target at thecrossroads of dyslipidemia, inflammation, and atherosclero-sis. Pharmacol Rev 58:342–374
18. Li Z, McNamara JR, Ordovas JM, Schaefer EJ (1994)Analysis of high density lipoproteins by a modified gradientgel electrophoresis method. J Lipid Res 35:1698–1711
19. Lund-Katz S, Phillips MC (2010) High density lipoproteinstructure-function and role in reverse cholesterol transport.Subcell Biochem 51:183–227
20. Mahley RW (1982) Atherogenic hyperlipoproteinemia. Thecellular and molecular biology of plasma lipoproteins al-tered by dietary fat and cholesterol. Med Clin North Am66:375–402
21. Mahley RW, Huang Y, Weisgraber KH (2006) Putting cho-lesterol in its place: apo E and reverse cholesterol transport.J Clin Invest 116:1226–1129
A. Carlucci et al.
Author's personal copy

22. Mezdour H, Nomura S, Yamamura T, Yamamoto A (1992)Concentration and distribution of apolipoproteins A-I and Ein normolipidemic, WHHL and diet-induced hyperlipi-demic rabbit sera. Biochim Biophys Acta 1127:116–123
23. Mizuguchi Y, Oishi Y, Tanaka H et al (2007) Arterialstiffness is associated with left ventricular diastolic functionin patients with cardiovascular risk factors: early detectionwith the use of cardio-ankle vascular index and ultrasonicstrain imaging. J Card Fail 13:744–751
24. Pennathur S, Bergt C, Shao B et al (2004) Human athero-sclerotic intima and blood of patients with established cor-onary artery disease contain high density lipoproteindamaged by reactive nitrogen species. J Biol Chem279:42977–42983
25. Rashid S, Patterson BW, Lewis GF (2006) What have welearned about HDL metabolism from kinetics studies inhumans? J Lipid Res 47:1631–1642
26. Rasouli M, Kiasari AM, Mokhberi V (2006) The ratio ofapoB/apoAI, apoB and lipoprotein(a) are the best predictorsof stable coronary artery disease. Clin Chem Lab Med44:1015–1021
27. Rosenson RS, Otvos JD, Freedman DS (2002) Relations oflipoprotein subclass levels and low-density lipoprotein sizeto progression of coronary artery disease in the PravastatinLimitation of Atherosclerosis in the Coronary Arteries(PLAC-I) trial. Am J Cardiol 90:89–94
28. Sacks FM, Alaupovic P, Moye LA et al (2000) VLDL,apolipoproteins B, CIII, and E, and risk of recurrent coro-nary events in the Cholesterol and Recurrent Events(CARE) trial. Circulation 102:1886–1892
29. Salvatore A, Cigliano L, Bucci EM et al (2007) Haptoglobinbinding to apolipoprotein A-I prevents damage from hy-droxyl radicals on its stimulatory activity of the enzymelecithin-cholesterol acyl-transferase. Biochemistry46:11158–11168
30. Salvatore A, Cigliano L, Carlucci A et al (2009) Haptoglo-bin binds apolipoprotein E and influences cholesterol ester-ification in the cerebrospinal fluid. J Neurochem 110:255–263
31. Schiller NB, Shah PM, Crawford M et al (1989) AmericanSociety of Echocardiography Committee on Standards.Recommendations for quantitation of the left ventricle by
two-dimensional echocardiography. J Am Soc Echocardiogr2:358–367
32. Spagnuolo MS, Cigliano L, D'Andrea LD et al (2005)Assignment of the binding site for Haptoglobin on Apoli-poprotein A-I. J Biol Chem 280:1193–1198
33. Sutherland GR, Di Salvo G, Claus P et al (2004) Strain andstrain rate imaging: a new clinical approach to quantifyingregional myocardial function. J Am Soc Echocardiogr17:788–802
34. Teichholz LE, Kreulen T, Herman MV, Gorlin R (1976)Problems in Echocardiographic volume determinations:Echocardiographic-angiographic correlations in the pres-ence of asynergy. Am J Cardiol 37:7–11
35. Tian L, Fu M (2010) The relationship between high densitylipoprotein subclass profile and plasma lipids concentra-tions. Lipids Health Dis 9:118–126
36. Urheim S, Edvardsen T, Torp H et al (2000) Myocardialstrain by Doppler echocardiography validation of a newmethod to quantify regional myocardial function. Circula-tion 102:1158–1164
37. Véniant MM, Withycombe S, Young SG (2001) Lipopro-tein size and atherosclerosis susceptibility in Apoe−/− andLdlr−/− mice. Arterioscler Thromb Vasc Biol 21:1567–1570
38. Wohlin M, Sundstrom J, Lannfelt L et al (2007) Apolipo-protein E epsilon4 genotype is independently associatedwith increased intima-media thickness in a recessive pat-tern. Lipids 42:451–456
39. Yamada N, Inoue I, Kawamura M et al (1992) Apolipopro-tein E prevents the progression of atherosclerosis in Wata-nabe heritable hyperlipidemic rabbits. J Clin Invest 89:706–711
40. Yanni AE (2004) The laboratory rabbit: an animal model ofatherosclerosis research. Lab Anim 38:246–256
41. Zhao SP, Wu ZH, Hong SC et al (2006) Effect of atorvas-tatin on SR-BI expression and HDL-induced cholesterolefflux in adipocytes of hypercholesterolemic rabbits. ClinChim Acta 365:119–124
42. Zorich N, Jonas A, Pownall HJ (1985) Activation of lecithincholesterol Acyltransferase by human apolipoprotein E indiscoidal complexes with lipids. J Biol Chem 260:8831–8837
ApoA-I, ApoE, and LCAT in cholesterol-fed rabbit
Author's personal copy
Related Documents