Equity Funds Lazard US Equity Concentrated Portfolio Lazard US Strategic Equity Portfolio Lazard US Small-Mid Cap Equity Portfolio Lazard International Equity Portfolio Lazard International Equity Select Portfolio Lazard International Equity Concentrated Portfolio Lazard International Strategic Equity Portfolio Lazard International Equity Advantage Portfolio Lazard International Small Cap Equity Portfolio Lazard Equity Franchise Portfolio Lazard Global Equity Select Portfolio Lazard Global Strategic Equity Portfolio Lazard Managed Equity Volatility Portfolio Lazard Funds Annual Report December 31, 2017

Welcome message from author
This document is posted to help you gain knowledge. Please leave a comment to let me know what you think about it! Share it to your friends and learn new things together.
Transcript

Equity FundsLazard US Equity Concentrated Portfolio
Lazard US Strategic Equity Portfolio
Lazard US Small-Mid Cap Equity Portfolio
Lazard International Equity Portfolio
Lazard International Equity Select Portfolio
Lazard International Equity Concentrated Portfolio
Lazard International Strategic Equity Portfolio
Lazard International Equity Advantage Portfolio
Lazard International Small Cap Equity Portfolio
Lazard Equity Franchise Portfolio
Lazard Global Equity Select Portfolio
Lazard Global Strategic Equity Portfolio
Lazard Managed Equity Volatility Portfolio
Lazard Funds Annual Report December 31, 2017
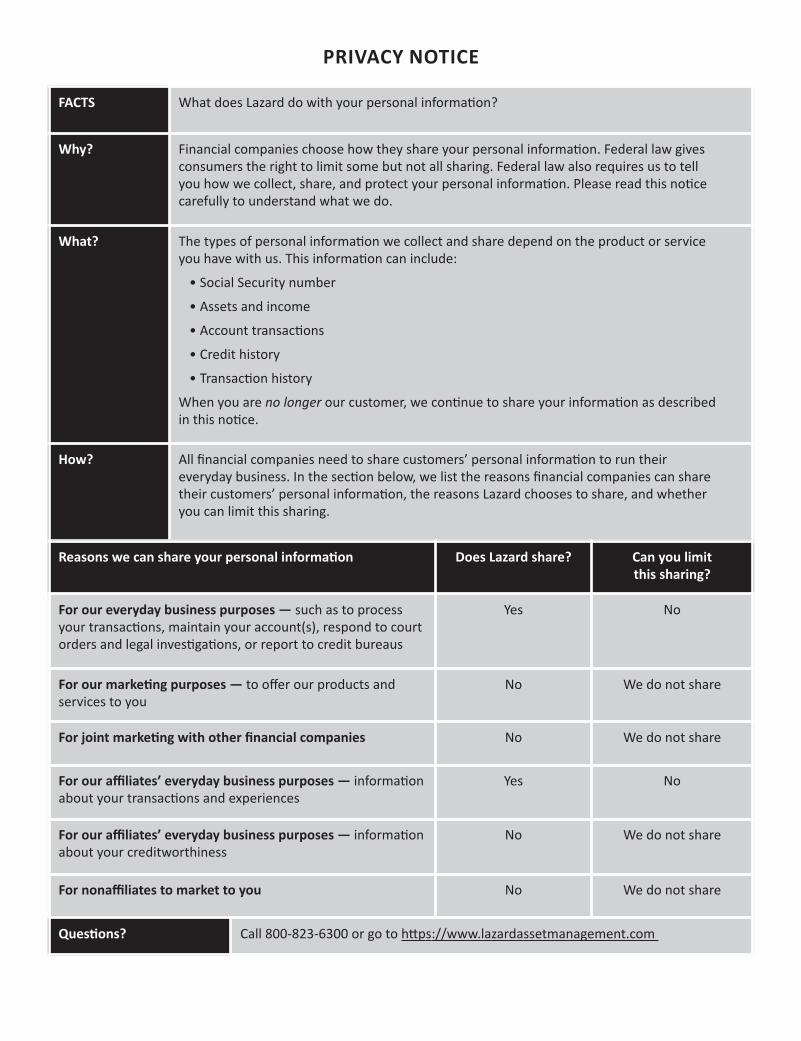
FaCtS What does Lazard do with your personal information?
Why? Financial companies choose how they share your personal information. Federal law givesconsumers the right to limit some but not all sharing. Federal law also requires us to tellyou how we collect, share, and protect your personal information. Please read this noticecarefully to understand what we do.
What? The types of personal information we collect and share depend on the product or serviceyou have with us. This information can include:
• Social Security number
• Assets and income
• Account transactions
• Credit history
• Transaction history
When you are no longer our customer, we continue to share your information as describedin this notice.
How? All financial companies need to share customers’ personal information to run theireveryday business. In the section below, we list the reasons financial companies can sharetheir customers’ personal information, the reasons Lazard chooses to share, and whetheryou can limit this sharing.
PRivaCy NotiCe
Reasons we can share your personal information Does Lazard share? Can you limit this sharing?
For our everyday business purposes — such as to processyour transactions, maintain your account(s), respond to courtorders and legal investigations, or report to credit bureaus
Yes No
For our marketing purposes — to offer our products andservices to you
No We do not share
For joint marketing with other financial companies No We do not share
For our affiliates’ everyday business purposes — informationabout your transactions and experiences
Yes No
For our affiliates’ everyday business purposes — informationabout your creditworthiness
No We do not share
For nonaffiliates to market to you No We do not share
Questions? Call 800-823-6300 or go to https://www.lazardassetmanagement.com
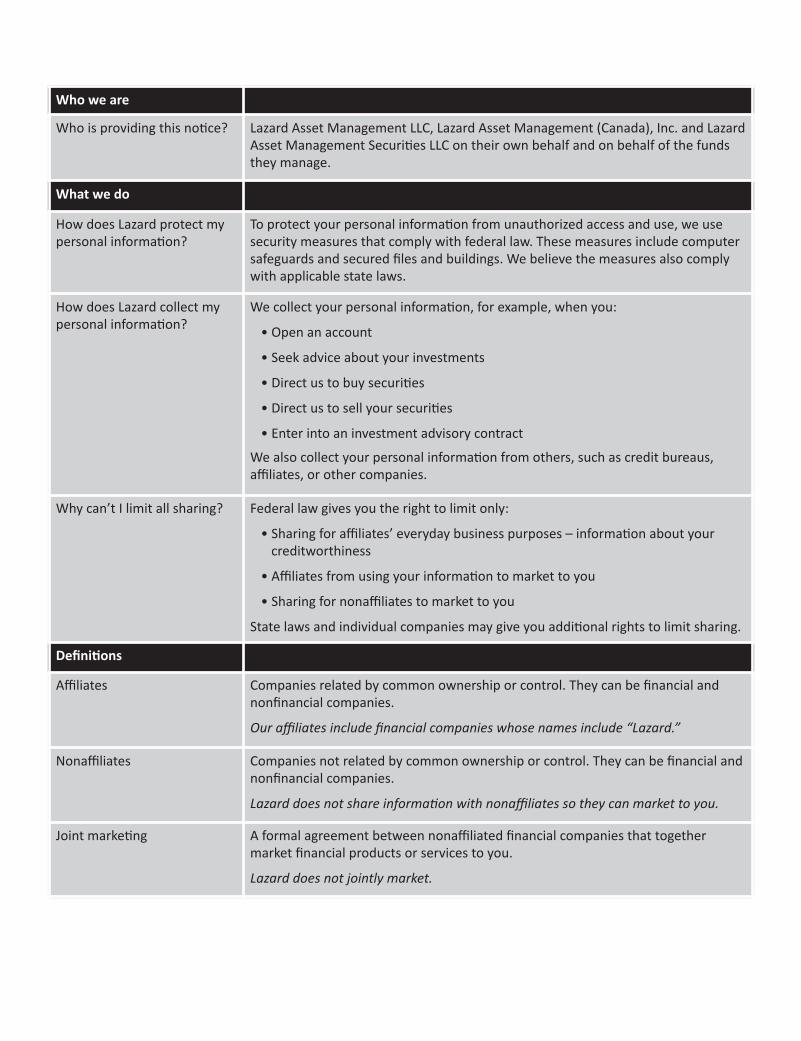
Who we are
Who is providing this notice? Lazard Asset Management LLC, Lazard Asset Management (Canada), Inc. and LazardAsset Management Securities LLC on their own behalf and on behalf of the fundsthey manage.
What we do
How does Lazard protect mypersonal information?
To protect your personal information from unauthorized access and use, we usesecurity measures that comply with federal law. These measures include computersafeguards and secured files and buildings. We believe the measures also complywith applicable state laws.
How does Lazard collect mypersonal information?
We collect your personal information, for example, when you:
• Open an account
• Seek advice about your investments
• Direct us to buy securities
• Direct us to sell your securities
• Enter into an investment advisory contract
We also collect your personal information from others, such as credit bureaus,affiliates, or other companies.
Why can’t I limit all sharing? Federal law gives you the right to limit only:
• Sharing for affiliates’ everyday business purposes – information about yourcreditworthiness
• Affiliates from using your information to market to you
• Sharing for nonaffiliates to market to you
State laws and individual companies may give you additional rights to limit sharing.
Definitions
Affiliates Companies related by common ownership or control. They can be financial andnonfinancial companies.
Our affiliates include financial companies whose names include “Lazard.”
Nonaffiliates Companies not related by common ownership or control. They can be financial andnonfinancial companies.
Lazard does not share information with nonaffiliates so they can market to you.
Joint marketing A formal agreement between nonaffiliated financial companies that togethermarket financial products or services to you.
Lazard does not jointly market.

Annual Report 1
2 A Message from Lazard
3 Investment Overviews
12 Performance Overviews
25 Information About Your Portfolio’s Expenses
29 Portfolio Holdings Presented by Sector
30 Portfolios of Investments
30 Lazard US Equity Concentrated Portfolio
31 Lazard US Strategic Equity Portfolio
33 Lazard US Small-Mid Cap Equity Portfolio
35 Lazard International Equity Portfolio
37 Lazard International Equity Select Portfolio
39 Lazard International Equity Concentrated Portfolio
40 Lazard International Strategic Equity Portfolio
42 Lazard International Equity Advantage Portfolio
45 Lazard International Small Cap Equity Portfolio
47 Lazard Equity Franchise Portfolio
48 Lazard Global Equity Select Portfolio
50 Lazard Global Strategic Equity Portfolio
52 Lazard Managed Equity Volatility Portfolio
55 Notes to Portfolios of Investments
60 Statements of Assets and Liabilities
64 Statements of Operations
68 Statements of Changes in Net Assets
74 Financial Highlights
91 Notes to Financial Statements
107 Report of Independent Registered Public Accounting Firm
109 Proxy Voting Results
111 Board of Directors and Officers Information
114 Tax and Other Information
The Lazard Funds, Inc.Table of Contents
Please consider a Portfolio’s investment objectives, risks, charges and expenses carefully before investing. For more complete informationabout The Lazard Funds, Inc. (the “Fund”), you may obtain a prospectus or summary prospectus by calling 800-823-6300, or online, atwww.lazardassetmanagement.com. Read the prospectus or each Portfolio’s summary prospectus carefully before you invest. Theprospectus and each Portfolio’s summary prospectus contain the investment objectives, risks, charges, expenses and other informationabout each Portfolio of the Fund, which are not detailed in this report.
Distributed by Lazard Asset Management Securities LLC.

2 Annual Report
Dear Shareholder,
Record high global stock prices were supported by synchronized global economic growth in 2017. Markets alsobenefited from benign inflation, accommodative central bank policy, and strong corporate profits. Volatilityremained at historic lows despite tension between North Korea and the United States and political uncertaintyin Brazil, Spain, and the United Kingdom.
Emerging markets equity and debt advanced strongly in 2017. Emerging markets continued to benefit from lowinflation, modest but steady growth, and improving profitability as global demand recovers and businessestighten fiscal discipline. Earnings improvement in China and Korea drove returns in emerging markets. Whileour outlook for the asset class remains positive, our emerging markets investment teams are vigilant aboutpotential risks. This includes an increase in developed markets inflation that could lead to central banks raisingrates too quickly and, in effect, a global growth slowdown.
European equity markets performed well in 2017 as the region’s economic recovery deepened and investorsgrew more confident in its underlying strength. During the year, a market-friendly result to France’s presidentialelection helped buoy European sentiment. UK equities generated solid absolute returns amid a challengingpolitical backdrop and Brexit negotiations. In addition, the European Central Bank announced that it wouldextend its monthly bond-buying program into 2018, but plans to reduce the pace of these purchases.
The US economy also advanced strongly during 2017. A new US tax bill represented one of the most significantchanges to the US tax code in over 30 years as it changes individual, corporate, and international taxes. The USyield curve continued to flatten as short-term rates moved higher, driven by the three US rate hikes during 2017and the prospect of additional hikes in 2018.
We are privileged that you have turned to Lazard for your investment needs and value your continued confi-dence in our investment management capabilities. Be assured that our specialist investment teams, supportedby our global infrastructure, are continuing to strive for the long-term patterns of performance that you expect.
Sincerely,
Lazard Asset Management LLC
The Lazard Funds, Inc. A Message from Lazard
Annual Report 3
US EquitiesThe S&P 500® Index rose 21.8% in 2017. Markets con-tinued to rally into 2018 as investors gained more con-fidence in the US economy’s ability to withstandglobal geopolitical risks, coupled with optimism thatthe Trump administration would decrease regulationand work with Congress to lower corporate taxes andincrease defense and infrastructure spending. Eco-nomic data were generally strong during the year, asemployment reports broadly exceeded expectationsand the economy posted GDP growth of 3.0% orgreater in the final two quarters of the year, auto salesrecovered in the latter half of the year, and consumerconfidence reached a 17-year high in November.Investors were also enthusiastic about the passage ofa tax reform bill in December, which is expected tostoke economic growth by lowering tax rates formany businesses and individual taxpayers.
International EquitiesThe strength of the global economy over the past yearexceeded expectations, with positive growth occur-ring in all major regions, albeit off low levels. Outsidethe United States, earnings growth of over 20% drovestock returns higher in 2017 as measured by the MSCIEAFE® Index. Sector leadership was dominated bycyclicals, and more specifically by information tech-nology. More defensive, and some higher-quality sec-tors such as consumer staples, healthcare, andtelecommunications, lagged in this market.
As with sectors, regions with higher exposure to theglobal economy outperformed, driven by risingglobal growth prospects, a weaker US dollar, and theimprovement of industrial commodities prices. Thesefactors especially benefited emerging markets, whichgenerated extraordinary returns of 37.3% in 2017.Emerging markets technology companies were espe-cially favored by investors seeking companies withhigher revenue and earnings growth—as well ashigher valuations. Among developed markets, Japangenerated significant returns in the fourth quarter,nearly matching the EAFE benchmark for the yearafter lagging in the first three quarters. ContinentalEuropean equities outperformed the MSCI EAFEIndex in US dollar terms in 2017, boosted by stronger
currencies. UK equities generated solid absolutereturns of 22% in the year but modestly lagged thebroader EAFE market amidst a challenging politicalbackdrop and Brexit negotiations, which pushed valu-ation multiples lower.
Market sentiment has continued to rise above alreadyhigh levels, and markets are near or past their historichighs—despite continued valuation, geopolitical, andcredit risks. Our general impression is that the mar-kets appear complacent and are extrapolating the cur-rent improved economic climate into the future. Thisfurther exacerbates the disconnect between high-growth expectations and interest rates, which are athistoric lows.
Lazard US Equity Concentrated PortfolioFor the year ended December 31, 2017, the Lazard USEquity Concentrated Portfolio’s Institutional Sharesposted a total return of 15.49%, while Open Sharesposted a total return of 15.22%, and R6 Shares posteda total return of 15.52%, as compared with the 21.83%return for the S&P 500 Index.
Stock selection and an overweight position in the con-sumer staples sector detracted from performance.Shares of beer company Molson Coors fell followingpoor communication at the company’s investor day,combined with a number of transitory factors. Stockselection in the consumer discretionary sector alsohurt returns. Shares of Advance Auto Parts fell follow-ing Amazon’s announcement that it would enter theauto-parts market, as well as integration headwindsfrom the company’s acquisition of Carquest. We soldthe stock in July, as our thesis had changed.
In contrast, an underweight position in the energy sector contributed to performance. Shares of Schlum-berger rose amid a recovery in oil prices toward theend of the period. In the information technology sector, shares of Cisco rose after the company reportedstrong third quarter earnings, which included growthin all metrics, as well as encouraging managementguidance.
The Lazard Funds, Inc. Investment Overviews

4 Annual Report
Lazard US Strategic Equity PortfolioFor the year ended December 31, 2017, the Lazard USStrategic Equity Portfolio’s Institutional Shares posteda total return of 18.17%, while Open Shares posted atotal return of 17.75%, and R6 Shares posted a totalreturn of 18.16%, as compared with the 21.83% returnfor the S&P 500 Index.
Stock selection in the consumer staples sectordetracted from performance. Shares of beer companyMolson Coors fell following poor communication atthe company’s investor day, combined with a numberof transitory factors. Stock selection in the health caresector also hurt returns. Shares of Medtronic fell inresponse to unexpected, temporary supply con-straints in its diabetes business and potential changesto reimbursements in the Chinese medical devicemarket.
In contrast, stock selection in the financials sectoraided performance. Shares of diversified financialservices provider Citigroup rose amid optimismaround industry deregulation, tax reform, and theprospect of stronger capital returns following theFed’s annual stress tests. A lack of exposure to utilitiesalso helped returns, as the sector was among theworst performers in the benchmark during the period.
Lazard US Small-Mid Cap Equity PortfolioFor the year ended December 31, 2017, the Lazard USSmall-Mid Cap Equity Portfolio’s Institutional Sharesposted a total return of 14.12%, while Open Sharesposted a total return of 13.82%, as compared with the16.81% return for the Russell 2500® Index.
Stock selection and underweight exposure in the con-sumer discretionary sector detracted from perform-ance. Shares of Advance Auto Parts fell followingAmazon’s announcement that it would enter the auto-parts market, as well as integration headwinds fromthe company’s acquisition of Carquest. We sold thestock in July, as our thesis had changed. Stock selec-tion in the financials sector also hurt returns. Sharesof Home BancShares fell after regulatory factors andnegative impacts from Hurricane Irma worriedinvestors.
In contrast, stock selection and an overweight posi-tion in the industrials sector helped performance.Shares of Proto Labs rose after the company reportedquarterly earnings above expectations, driven bystrong revenues. We sold our position in December,as the stock approached our target valuation. Stockselection and an underweight position in the con-sumer staples sector also helped returns.
Lazard International Equity PortfolioFor the year ended December 31, 2017, the LazardInternational Equity Portfolio’s Institutional Sharesposted a total return of 22.81%, while Open Sharesposted a total return of 22.50%, and R6 Shares posteda total return of 22.85%, as compared with the 25.03%return for the MSCI EAFE Index.
The majority of the underperformance occurred inJanuary, which was a continuation of the second halfof the 2016 low-quality rally. During that period,investors bid up lower-quality equities as the globaleconomy strengthened, central banks remainedmostly accommodative, and the Trump administra-tion’s campaign promises on taxes, regulationsreform, and infrastructure drove up investor expecta-tions for improving global growth. While the differ-ence in performance during this period betweenlow-quality and high-quality stocks (as defined byreturn-on-equity) was not unusual, the quickness wassignificant in historical terms. Since the dominanceof low-quality equities ended in the middle of the firstquarter of 2017, investors have increasingly focusedon fundamentals, making stock selection once againthe driver of attribution. International equity priceswere rewarded for improved global economicgrowth, more margin leverage, and cheaper curren-cies. Strong stock selection has been a differentiator,as the tailwinds that supported markets—especiallystimulative central bank policy, increasing global eco-nomic growth off low levels, few signs of inflation,and hopes of a US-led fiscal package—are now wellreflected in elevated valuations of lower-quality cycli-cals. This environment was favorable for skilled stockselection, as the non-idiosyncratic factors that domi-nated the market from the second half of 2016through the beginning of 2017 faded further.
Annual Report 5
Stock selection in the healthcare sector detractedfrom performance during the year, as our holding inShire Pharmaceuticals underperformed. Despite con-sistently strong fundamentals and an attractive valua-tion, Shire has struggled due to investor concernsover debt levels, its hemophilia franchise and, mostrecently, the departure of its CFO. After the announce-ment of this departure, we met with Shire manage-ment and concluded that our investment thesisremained intact. Elsewhere, industrials sector com-pany Assa Abloy underperformed. Despite risingslightly for the year, the stock underperformed duringthe fourth quarter, the result of transitory issues inChina, rising materials costs, and the CEO’s retire-ment announcement. Lastly, cash also continued tobe a significant drag on relative performance for theyear. As equity markets continued to rise during theyear, and valuations remain elevated in historicalterms, we have trimmed or sold some investmentsthat have reached our target valuations faster than wehave been able to replace them. Our cash exposure—which historically averages less than 5% of assets—isa byproduct of our process and is not a managed allo-cation. Our intention, as always, is to remain fullyinvested.
In contrast, stock selection in the consumer discre-tionary sector was additive to relative returns. Sharesof Japanese retailer Don Quijote rose after reportingstrong results driven by better sales and cost control,leading to operating profit margin expansion, whilealso increasing guidance. In the industrials sector,Dutch software company Wolters Kluwer was a strongperformer throughout the year. Stock selection in thereal estate sector was also beneficial to relativereturns. Daiwa House was a strong performer as itrose during the year. Our long-term ownership of thecompany has been predicated on the belief that thevaluation has been too low given the company’sfinancial productivity and improving orders and mar-gins driven by the improving global economic outlookand tight labor market in Japan. Positive stock selec-tion in the telecommunications sector was driven byNordic telecommunications provider Telenor, whichowns additional assets in emerging markets countriesMalaysia and Thailand. Telenor stock rallied in the sec-
ond half of the year, mostly because managementreported earnings in July that beat expectations. Thepositive surprise was a result of operating expensereductions that were significantly ahead of guidanceand which led to margin improvements in the major-ity of their business units. In addition, Telenor man-agement’s capital allocation decisions were rewardedas the proceeds from recent asset sales were redis-tributed to shareholders through a share buyback.
Lazard International Equity Select PortfolioFor the year ended December 31, 2017, the LazardInternational Equity Select Portfolio’s InstitutionalShares posted a total return of 28.31%, while OpenShares posted a total return of 27.89%, as comparedwith the 27.19% return for the MSCI All CountryWorld® Index (the “MSCI ACWI”) ex-US.
Outperformance for the year was driven by positivestock selection in most sectors and regions. Stockselection in the information technology sector wasbeneficial to relative returns as the Portfolio identifiedand owned relative value investments such as Tencentand Worldpay, with the latter sold during the period.Elsewhere, Nordic telecommunications providerTelenor, which owns additional assets in emergingmarkets countries Malaysia and Thailand, also helpedrelative returns during the year.Telenor stock rallied inthe second half of the year, mostly because manage-ment reported earnings in July that beat expectations.The positive surprise was a result of operatingexpense reductions that were significantly ahead ofguidance and which led to margin improvements inthe majority of their business units. In addition,Telenor management’s capital allocation decisionswere rewarded as the proceeds from recent assetsales were redistributed to shareholders through ashare buyback. Lastly, stock selection in the financialssector helped relative returns largely due to our hold-ing in DBS, Singapore’s largest bank. The companyhighlighted their focus on digitization at an analystday in November. With nearly 40% of customers nowutilizing digital offerings and demonstrating increasedretention, we expect these investments to result inhigher financial productivity going forward.

6 Annual Report
In contrast, stock selection in the healthcare sectordetracted from performance in the year, as our hold-ing in Shire Pharmaceuticals underperformed. Whilehaving fallen nearly 10% in 2017 and being one of thelargest relative detractors, Shire stock has begun toimprove, rising in line with the benchmark during thefourth quarter. Despite consistently strong fundamen-tals and an attractive valuation, Shire has struggleddue to investor concerns over debt levels, its hemo-philia franchise and, most recently, the departure ofits CFO. After the announcement of this departure, wemet with Shire management and concluded that ourinvestment thesis remained intact. Elsewhere, ourindustrials sector holding in Assa Abloy underper-formed. Despite rising during the year, the stockunderperformed during the fourth quarter, the resultof transitory issues in China, rising materials costs,and the CEO’s retirement announcement. Lastly, cashalso continued to be a significant drag on relative per-formance in the fourth quarter and for the year. Asequity markets continued to rise during 2017 and val-uations remain elevated in historical terms, we havetrimmed or sold some investments that have reachedour target valuations faster than we have been able toreplace them. Our cash exposure, which historicallyaverages less than 5% of assets, is a byproduct of ourprocess and is not a managed allocation. Our inten-tion, as always, is to remain fully invested.
Lazard International Equity Concentrated PortfolioFor the year ended December 31, 2017, the Lazard Inter-national Equity Concentrated Portfolio’s InstitutionalShares posted a total return of 23.29%, while OpenShares posted a total return of 22.87%, as comparedwith the 27.19% return for the MSCI ACWI ex-US.
Stock selection in the healthcare sector hurt relative performance during the year as Shire Pharmaceuticalsunderperformed. Despite consistent fundamentals andan attractive valuation, Shire has struggled due toinvestor concerns over debt levels, its hemophilia fran-chise and, most recently, the departure of its CFO. Afterthe announcement of this departure, we met with Shiremanagement and concluded that our investment thesisremained intact. In the financials sector, we were in theprocess of selling Provident Financial when the com-
pany surprised the market with a profits warning. Provi-dent Financial management was viewed as a capableteam, held in high regard by the market, with a historyof innovation and solid execution. However, an electiverestructuring of the business resulted in a material staffdefection to rivals, and a material drop in the efficacy ofloan recovery. Separately, it emerged that the companywas being investigated by regulators for mis-sellingtheir products. The surprising news led to the resigna-tion of the CEO and the cutting of the company’s divi-dend.While the position size was small relative to thesize of the position historically, the magnitude of theprice correction was a material detractor to performance.
In contrast, stock selection and a higher-than-bench-mark weight in the information technology sectorwas additive to relative returns in 2017. Shares of Chinese internet company Tencent appreciated bymore than 100% during the year as the companyreported strong results. The market became moreaware of the recurring nature of the gaming franchisebut also the value of stakes in other companiesowned by Tencent (including 58.com). In addition, itbecame clearer not only how much time the averageChinese person was spending on Tencent apps andsites, but also the company’s potential to monetizethis to a greater degree. Our new position in DigitalGarage, the digital advertising and e-payment busi-ness in Japan, also appreciated materially as thecompany communicated a stronger message onorganic growth and reported supportive results.Despite a considerable headwind from the Turkishlira, our investment in Turkcell performed strongly inUS dollar terms as the company positively surprisedthe market on revenues (driven by both net sub-scriber growth and average revenue per unit growth)and also revised up guidance on the operating margin.
Lazard International Strategic Equity PortfolioFor the year ended December 31, 2017, the LazardInternational Strategic Equity Portfolio’s InstitutionalShares posted a total return of 27.85%, while OpenShares posted a total return of 27.44%, and R6 Sharesposted a total return of 27.82%, as compared with the25.03% return for the MSCI EAFE Index.
Annual Report 7
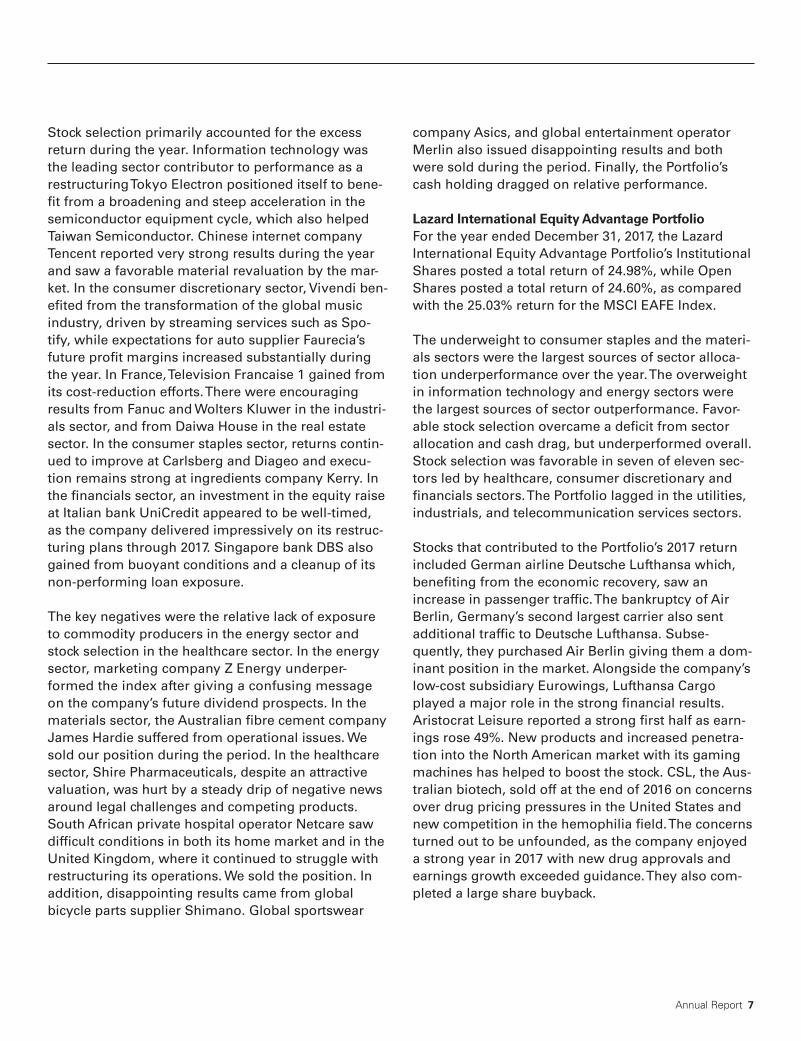
Stock selection primarily accounted for the excessreturn during the year. Information technology wasthe leading sector contributor to performance as arestructuring Tokyo Electron positioned itself to bene-fit from a broadening and steep acceleration in thesemiconductor equipment cycle, which also helpedTaiwan Semiconductor. Chinese internet companyTencent reported very strong results during the yearand saw a favorable material revaluation by the mar-ket. In the consumer discretionary sector, Vivendi ben-efited from the transformation of the global musicindustry, driven by streaming services such as Spo-tify, while expectations for auto supplier Faurecia’sfuture profit margins increased substantially duringthe year. In France, Television Francaise 1 gained fromits cost-reduction efforts. There were encouragingresults from Fanuc and Wolters Kluwer in the industri-als sector, and from Daiwa House in the real estatesector. In the consumer staples sector, returns contin-ued to improve at Carlsberg and Diageo and execu-tion remains strong at ingredients company Kerry. Inthe financials sector, an investment in the equity raiseat Italian bank UniCredit appeared to be well-timed,as the company delivered impressively on its restruc-turing plans through 2017. Singapore bank DBS alsogained from buoyant conditions and a cleanup of itsnon-performing loan exposure.
The key negatives were the relative lack of exposureto commodity producers in the energy sector andstock selection in the healthcare sector. In the energysector, marketing company Z Energy underper-formed the index after giving a confusing messageon the company’s future dividend prospects. In thematerials sector, the Australian fibre cement companyJames Hardie suffered from operational issues. Wesold our position during the period. In the healthcaresector, Shire Pharmaceuticals, despite an attractivevaluation, was hurt by a steady drip of negative newsaround legal challenges and competing products.South African private hospital operator Netcare sawdifficult conditions in both its home market and in theUnited Kingdom, where it continued to struggle withrestructuring its operations. We sold the position. Inaddition, disappointing results came from global bicycle parts supplier Shimano. Global sportswear
company Asics, and global entertainment operatorMerlin also issued disappointing results and bothwere sold during the period. Finally, the Portfolio’scash holding dragged on relative performance.
Lazard International Equity Advantage PortfolioFor the year ended December 31, 2017, the LazardInternational Equity Advantage Portfolio’s InstitutionalShares posted a total return of 24.98%, while OpenShares posted a total return of 24.60%, as comparedwith the 25.03% return for the MSCI EAFE Index.
The underweight to consumer staples and the materi-als sectors were the largest sources of sector alloca-tion underperformance over the year. The overweightin information technology and energy sectors werethe largest sources of sector outperformance. Favor-able stock selection overcame a deficit from sectorallocation and cash drag, but underperformed overall.Stock selection was favorable in seven of eleven sec-tors led by healthcare, consumer discretionary andfinancials sectors. The Portfolio lagged in the utilities,industrials, and telecommunication services sectors.
Stocks that contributed to the Portfolio’s 2017 returnincluded German airline Deutsche Lufthansa which,benefiting from the economic recovery, saw anincrease in passenger traffic. The bankruptcy of AirBerlin, Germany’s second largest carrier also sentadditional traffic to Deutsche Lufthansa. Subse-quently, they purchased Air Berlin giving them a dom-inant position in the market. Alongside the company’slow-cost subsidiary Eurowings, Lufthansa Cargoplayed a major role in the strong financial results.Aristocrat Leisure reported a strong first half as earn-ings rose 49%. New products and increased penetra-tion into the North American market with its gamingmachines has helped to boost the stock. CSL, the Aus-tralian biotech, sold off at the end of 2016 on concernsover drug pricing pressures in the United States andnew competition in the hemophilia field. The concernsturned out to be unfounded, as the company enjoyeda strong year in 2017 with new drug approvals andearnings growth exceeded guidance. They also com-pleted a large share buyback.
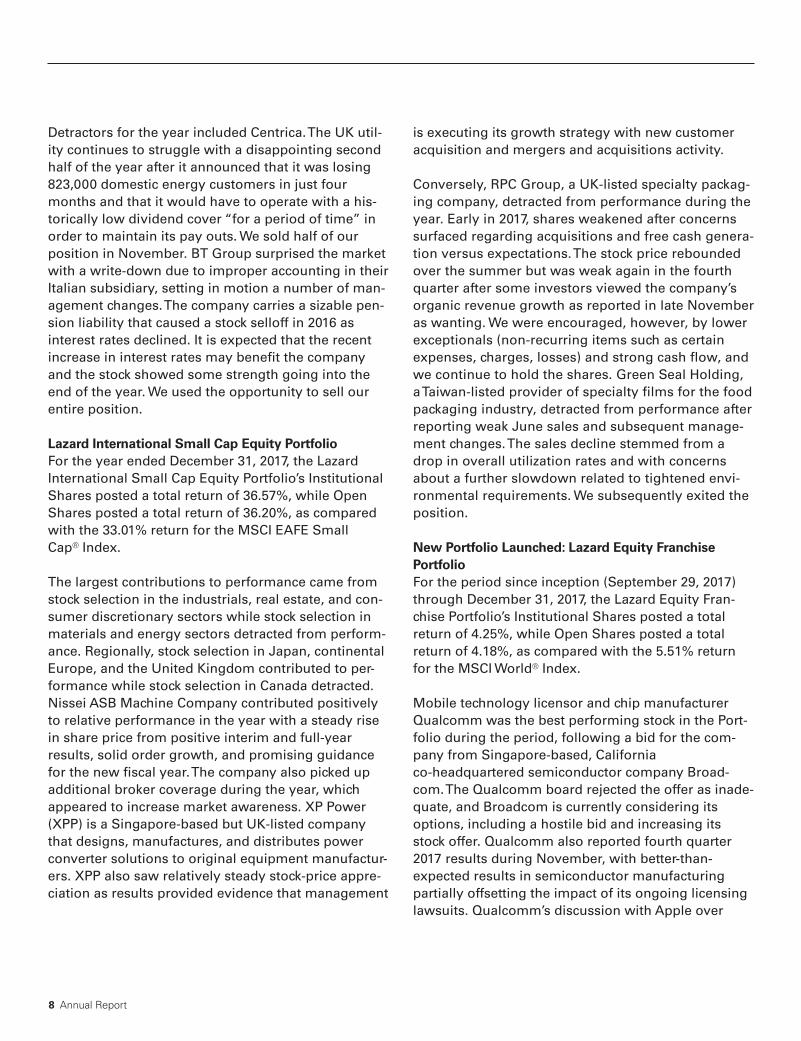
8 Annual Report
Detractors for the year included Centrica. The UK util-ity continues to struggle with a disappointing secondhalf of the year after it announced that it was losing823,000 domestic energy customers in just fourmonths and that it would have to operate with a his-torically low dividend cover “for a period of time” inorder to maintain its pay outs. We sold half of ourposition in November. BT Group surprised the marketwith a write-down due to improper accounting in theirItalian subsidiary, setting in motion a number of man-agement changes. The company carries a sizable pen-sion liability that caused a stock selloff in 2016 asinterest rates declined. It is expected that the recentincrease in interest rates may benefit the companyand the stock showed some strength going into theend of the year. We used the opportunity to sell ourentire position.
Lazard International Small Cap Equity PortfolioFor the year ended December 31, 2017, the LazardInternational Small Cap Equity Portfolio’s InstitutionalShares posted a total return of 36.57%, while OpenShares posted a total return of 36.20%, as comparedwith the 33.01% return for the MSCI EAFE Small Cap® Index.
The largest contributions to performance came fromstock selection in the industrials, real estate, and con-sumer discretionary sectors while stock selection inmaterials and energy sectors detracted from perform-ance. Regionally, stock selection in Japan, continentalEurope, and the United Kingdom contributed to per-formance while stock selection in Canada detracted.Nissei ASB Machine Company contributed positivelyto relative performance in the year with a steady risein share price from positive interim and full-yearresults, solid order growth, and promising guidancefor the new fiscal year. The company also picked upadditional broker coverage during the year, whichappeared to increase market awareness. XP Power(XPP) is a Singapore-based but UK-listed companythat designs, manufactures, and distributes powerconverter solutions to original equipment manufactur-ers. XPP also saw relatively steady stock-price appre-ciation as results provided evidence that management
is executing its growth strategy with new customeracquisition and mergers and acquisitions activity.
Conversely, RPC Group, a UK-listed specialty packag-ing company, detracted from performance during theyear. Early in 2017, shares weakened after concernssurfaced regarding acquisitions and free cash genera-tion versus expectations. The stock price reboundedover the summer but was weak again in the fourthquarter after some investors viewed the company’sorganic revenue growth as reported in late Novemberas wanting. We were encouraged, however, by lowerexceptionals (non-recurring items such as certainexpenses, charges, losses) and strong cash flow, andwe continue to hold the shares. Green Seal Holding,a Taiwan-listed provider of specialty films for the foodpackaging industry, detracted from performance afterreporting weak June sales and subsequent manage-ment changes. The sales decline stemmed from adrop in overall utilization rates and with concernsabout a further slowdown related to tightened envi-ronmental requirements. We subsequently exited theposition.
New Portfolio Launched: Lazard Equity FranchisePortfolioFor the period since inception (September 29, 2017)through December 31, 2017, the Lazard Equity Fran-chise Portfolio’s Institutional Shares posted a totalreturn of 4.25%, while Open Shares posted a totalreturn of 4.18%, as compared with the 5.51% returnfor the MSCI World® Index.
Mobile technology licensor and chip manufacturerQualcomm was the best performing stock in the Port-folio during the period, following a bid for the com-pany from Singapore-based, Californiaco-headquartered semiconductor company Broad-com. The Qualcomm board rejected the offer as inade-quate, and Broadcom is currently considering itsoptions, including a hostile bid and increasing itsstock offer. Qualcomm also reported fourth quarter2017 results during November, with better-than-expected results in semiconductor manufacturing partially offsetting the impact of its ongoing licensinglawsuits. Qualcomm’s discussion with Apple over
Annual Report 9
license fees resulted in both companies filing suitalleging patent breach and a media report that Appleis considering replacing Qualcomm’s modem chips inthe iPhone with new chips from Intel.
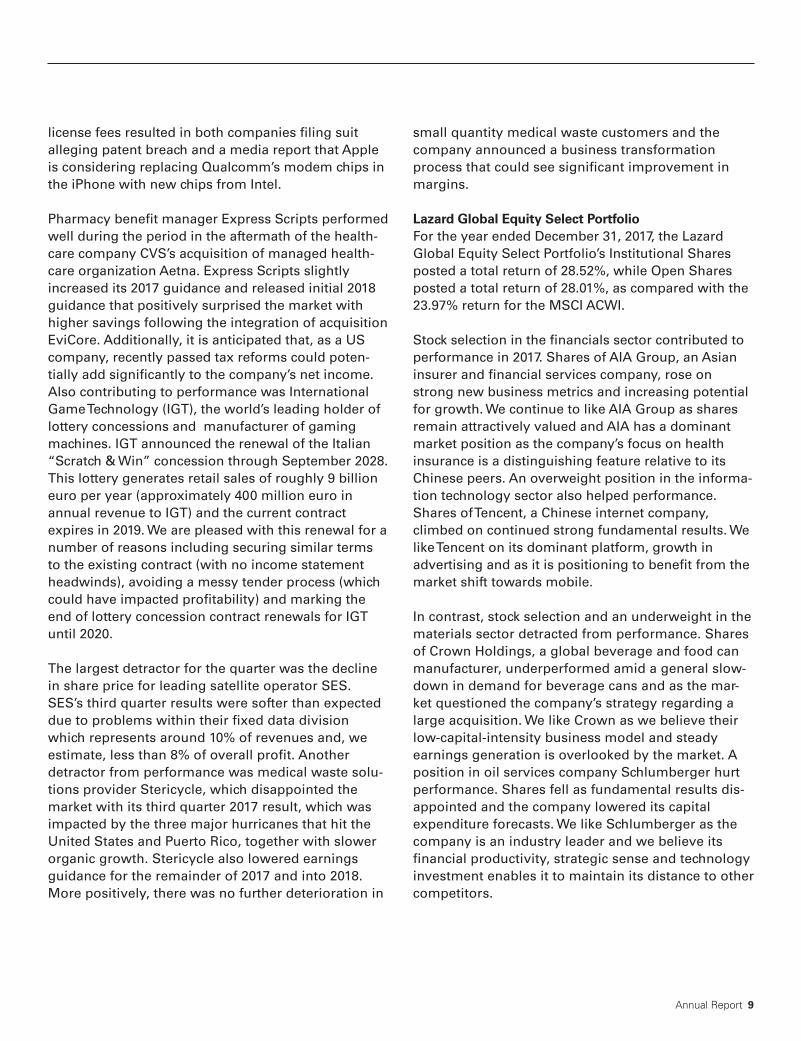
Pharmacy benefit manager Express Scripts performedwell during the period in the aftermath of the health-care company CVS’s acquisition of managed health-care organization Aetna. Express Scripts slightlyincreased its 2017 guidance and released initial 2018guidance that positively surprised the market withhigher savings following the integration of acquisitionEviCore. Additionally, it is anticipated that, as a UScompany, recently passed tax reforms could poten-tially add significantly to the company’s net income.Also contributing to performance was InternationalGame Technology (IGT), the world’s leading holder oflottery concessions and manufacturer of gamingmachines. IGT announced the renewal of the Italian“Scratch & Win” concession through September 2028.This lottery generates retail sales of roughly 9 billioneuro per year (approximately 400 million euro inannual revenue to IGT) and the current contractexpires in 2019. We are pleased with this renewal for anumber of reasons including securing similar termsto the existing contract (with no income statementheadwinds), avoiding a messy tender process (whichcould have impacted profitability) and marking theend of lottery concession contract renewals for IGTuntil 2020.
The largest detractor for the quarter was the declinein share price for leading satellite operator SES.SES’s third quarter results were softer than expecteddue to problems within their fixed data divisionwhich represents around 10% of revenues and, weestimate, less than 8% of overall profit. Anotherdetractor from performance was medical waste solu-tions provider Stericycle, which disappointed themarket with its third quarter 2017 result, which wasimpacted by the three major hurricanes that hit theUnited States and Puerto Rico, together with slowerorganic growth. Stericycle also lowered earningsguidance for the remainder of 2017 and into 2018.More positively, there was no further deterioration in
small quantity medical waste customers and thecompany announced a business transformationprocess that could see significant improvement inmargins.
Lazard Global Equity Select PortfolioFor the year ended December 31, 2017, the LazardGlobal Equity Select Portfolio’s Institutional Sharesposted a total return of 28.52%, while Open Sharesposted a total return of 28.01%, as compared with the23.97% return for the MSCI ACWI.
Stock selection in the financials sector contributed toperformance in 2017. Shares of AIA Group, an Asianinsurer and financial services company, rose onstrong new business metrics and increasing potentialfor growth. We continue to like AIA Group as sharesremain attractively valued and AIA has a dominantmarket position as the company’s focus on healthinsurance is a distinguishing feature relative to its Chinese peers. An overweight position in the informa-tion technology sector also helped performance.Shares of Tencent, a Chinese internet company,climbed on continued strong fundamental results. Welike Tencent on its dominant platform, growth inadvertising and as it is positioning to benefit from themarket shift towards mobile.
In contrast, stock selection and an underweight in thematerials sector detracted from performance. Sharesof Crown Holdings, a global beverage and food canmanufacturer, underperformed amid a general slow-down in demand for beverage cans and as the mar-ket questioned the company’s strategy regarding alarge acquisition. We like Crown as we believe theirlow-capital-intensity business model and steadyearnings generation is overlooked by the market. Aposition in oil services company Schlumberger hurtperformance. Shares fell as fundamental results dis-appointed and the company lowered its capitalexpenditure forecasts. We like Schlumberger as thecompany is an industry leader and we believe itsfinancial productivity, strategic sense and technologyinvestment enables it to maintain its distance to othercompetitors.

10 Annual Report
Lazard Global Strategic Equity PortfolioFor the year ended December 31, 2017, the LazardGlobal Strategic Equity Portfolio’s Institutional Sharesposted a total return of 24.20%, while Open Sharesposted a total return of 23.72%, as compared with the23.97% return for the MSCI ACWI.
Stock selection in the financials and information tech-nology sectors were the leading contributors to per-formance. In financials, London Stock Exchange andS&P Global both benefited from surging ETF vol-umes, while in South Africa insurer Sanlam wasstrong after the African National Congress chose amore business-friendly candidate as its next leader.In the information technology sector, a restructuringTokyo Electron was well positioned to benefit from abroadening and steep acceleration in the semicon-ductor equipment cycle, which also helped TaiwanSemiconductor. Both Ubisoft and Activision rosematerially as investors started to recognize the rap-idly-changing dynamics of the global video-gamingindustry, where revenues are becoming both lessvolatile and more profitable as the business modelmoves from single purchases of physical game DVDs,to repeating purchases of digital downloads. Resultsalso continued to be strong in the electronic pay-ments space, helping Visa and Worldpay, the latterwas sold and being acquired by US peer Vantiv dur-ing the year. In the consumer discretionary sector,auto supplier Faurecia saw a material rise in expecta-tions for future profit margins. We subsequently soldthe position.
The key negatives were stock selection in the con-sumer staples and healthcare sectors. Beer companyMolson Coors was hurt by a combination of decliningmarket volumes, a softening of margin expectations,and an accounting change. In the healthcare sector,Shire Pharmaceuticals, despite an attractive valua-tion, was hurt by a steady drip of negative newsaround legal challenges and competing products.South African private hospital operator Netcare sawtough conditions in both its home market and in theUnited Kingdom, where it continued to struggle torestructure operations. We sold our position duringthe year. Disappointing results also came from theUK funeral company Dignity.
Lazard Managed Equity Volatility PortfolioFor the year ended December 31, 2017, the LazardManaged Equity Volatility Portfolio’s InstitutionalShares posted a total return of 20.57%, while OpenShares posted a total return of 20.11%, as comparedwith the 22.40% return for the MSCI World Index.
Positioning in more defensive sectors was the pri-mary detractor from returns. Stock selection wasslightly positive for the year. The underweight to theinformation technology sector and overweight to theutilities sector accounted for the majority of the year’sunderperformance which was mitigated by the under-weight to the healthcare and energy sectors, two sec-tors that lagged for the year. Regionally, theunderweight to Europe and overweight to Canadawere the largest detractors, offset partially by an over-weight to Asia and underweight to the United States.Stock selection was favorable in five of eleven sectorsled by the healthcare and real estate sectors. Holdingsin the information technology and consumer discre-tionary sectors lagged.
Stocks that contributed to the Portfolio’s 2017 returnincluded CSL, the Australian biotech that sold off atthe end of 2016 on concerns over drug pricing pres-sures in the United States and new competition in thehemophilia field. The concerns turned out to be exag-gerated, as the company enjoyed a strong year in2017 with new drug approvals and earnings growthexceeded guidance. The company also completed alarge share buyback. The German airline DeutscheLufthansa benefited from the economic recoverywhich saw an increase in passenger traffic. The bank-ruptcy of Air Berlin, Germany’s second largest carrier,also sent traffic to them. Subsequently, they pur-chased Air Berlin giving them a dominant position inthe market. Alongside the company’s low-cost sub-sidiary Eurowings, Lufthansa Cargo played a majorrole in the strong financial results. 3M Company alsoenjoyed a favorable year as the diversified industrialreported growth across all six business units alongwith an improvement in operating margins. Revenuegrowth accelerated in the second half of the year, and,along with benefits from the US tax reform, provideda lift to the stock at year end.

Annual Report 11
Detractors for the year included Centrica. The UK util-ity continues to struggle with a disappointing secondhalf of the year after it announced that it was losing823,000 domestic energy customers in just fourmonths and that it would have to operate with a his-torically low dividend cover “for a period of time” inorder to maintain its payouts. We sold our position inNovember. BT Group surprised the market with a
write-down due to improper accounting in their Italiansubsidiary, setting in motion a number of manage-ment changes. The company carries a sizable pensionliability that caused a stock selloff in 2016 as interestrates declined. It is expected that the recent increasein interest rates will benefit the company and thestock showed some strength going into the end of 2017.We used the opportunity to sell our entire position.
Notes to Investment Overviews:
All Portfolios’ total returns reflect reinvestment of all dividends and distributions, if any. Certain expenses of a Portfolio may have been waived or reimbursed by Lazard Asset Management LLC, the Fund’s investment manager (the “Investment Manager”), State Street Bank and Trust Company,the Fund’s administrator (“State Street”), or Boston Financial Data Services, Inc., the Fund’s transfer and dividend disbursing agent (“BFDS”); withoutsuch waiver/reimbursement of expenses, such Portfolio’s returns would have been lower. Past performance is not indicative, or a guarantee, of futureresults. Returns for a period of less than one year are not annualized.
The performance data of the indices and other market data have been prepared from sources and data that the Investment Manager believes to bereliable, but no representation is made as to their accuracy. These indices are unmanaged, have no fees or costs and are not available for investment.
The views of the Investment Manager and the securities described in this report are as of December 31, 2017; these views and portfolio holdingsmay have changed subsequent to this date. Nothing herein should be construed as a recommendation to buy, sell, or hold a particular security. Thereis no assurance that the securities discussed herein will remain in a Portfolio at the time you receive this report, or that securities sold will not havebeen repurchased. The specific securities discussed may, in aggregate, represent only a small percentage of a Portfolio’s holdings. It should not beassumed that securities identified and discussed were, or will be, profitable, or that the investment decisions made in the future will be profitable, orequal the investment performance of the securities discussed herein.
The views and opinions expressed are provided for general information only, and do not constitute specific tax, legal, or investment advice to, or recommendations for, any person. There can be no guarantee as to the accuracy of any outlooks for markets, sectors and securities as discussedherein. You should read the Fund’s prospectus or each Portfolio’s summary prospectus for a more detailed discussion of each Portfolio’s investmentobjectives, strategies, risks and fees.
12 Annual Report
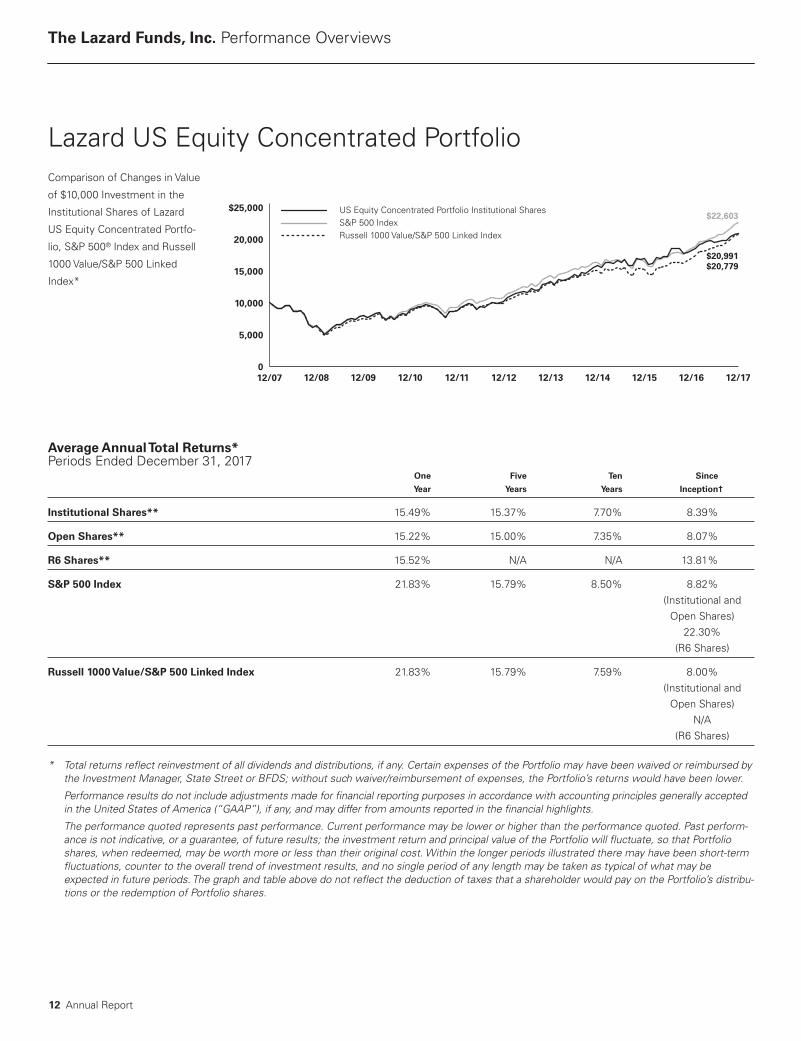
The Lazard Funds, Inc. Performance Overviews
Average Annual Total Returns*Periods Ended December 31, 2017 One Five Ten Since
Year Years Years Inception†
Institutional Shares** 15.49% 15.37% 7.70% 8.39%
Open Shares** 15.22% 15.00% 7.35% 8.07%
R6 Shares** 15.52% N/A N/A 13.81%
S&P 500 Index 21.83% 15.79% 8.50% 8.82% (Institutional and Open Shares) 22.30% (R6 Shares)
Russell 1000 Value/S&P 500 Linked Index 21.83% 15.79% 7.59% 8.00% (Institutional and Open Shares) N/A (R6 Shares)
* Total returns reflect reinvestment of all dividends and distributions, if any. Certain expenses of the Portfolio may have been waived or reimbursed bythe Investment Manager, State Street or BFDS; without such waiver/reimbursement of expenses, the Portfolio’s returns would have been lower.
Performance results do not include adjustments made for financial reporting purposes in accordance with accounting principles generally acceptedin the United States of America (“GAAP”), if any, and may differ from amounts reported in the financial highlights.
The performance quoted represents past performance. Current performance may be lower or higher than the performance quoted. Past perform-ance is not indicative, or a guarantee, of future results; the investment return and principal value of the Portfolio will fluctuate, so that Portfolioshares, when redeemed, may be worth more or less than their original cost. Within the longer periods illustrated there may have been short-termfluctuations, counter to the overall trend of investment results, and no single period of any length may be taken as typical of what may beexpected in future periods. The graph and table above do not reflect the deduction of taxes that a shareholder would pay on the Portfolio’s distribu-tions or the redemption of Portfolio shares.
Lazard US Equity Concentrated PortfolioComparison of Changes in Value
of $10,000 Investment in the
Institutional Shares of Lazard
US Equity Concentrated Portfo-
lio, S&P 500® Index and Russell
1000 Value/S&P 500 Linked
Index*
US Equity Concentrated Portfolio Institutional SharesS&P 500 IndexRussell 1000 Value/S&P 500 Linked Index
$20,991$20,779
$22,603
12/0812/07 12/09 12/10 12/12 12/1712/14 12/1512/1312/11 12/160
5,000
10,000
15,000
20,000
$25,000
Annual Report 13
The Portfolio was previously known as Lazard U.S. Equity Value Portfolio. As of May 31, 2012, the Portfolio changed its name to Lazard U.S. EquityConcentrated Portfolio and changed its investment strategy to a concentrated portfolio of investments, typically investing in 15 to 35 companieswith market capitalizations generally greater than $350 million.
The performance data of the indices have been prepared from sources and data that the Investment Manager believes to be reliable, but no repre-sentation is made as to their accuracy. The S&P 500 Index is a market capitalization-weighted index of 500 companies in leading industries of theUS economy. The Russell 1000 Value/S&P 500 Linked Index is an unmanaged index created by the Investment Manager, which links the perform-ance of the Russell 1000® Value Index for all periods through May 30, 2012 (when the Portfolio’s investment strategy changed) and the S&P 500Index for all periods thereafter. The Russell 1000 Value Index measures the performance of those Russell 1000 companies with lower price-to-book ratios and lower forecasted growth values. The Russell 1000 Index measures the performance of the large-cap segment of the US equityuniverse. It includes approximately 1,000 of the largest securities based on a combination of their market cap and current index membership. Theindices are unmanaged, have no fees or costs and are not available for investment.
** The performance of Institutional Shares, Open Shares and R6 Shares may vary, primarily based on the differences in fees borne by shareholdersinvesting in different classes.
† The inception date for the Institutional and Open Shares was September 30, 2005 and for the R6 Shares was November 15, 2016.

14 Annual Report
Average Annual Total Returns*Periods Ended December 31, 2017 One Five Ten Since
Year Years Years Inception†
Institutional Shares** 18.17% 12.77% 7.11% 7.16%
Open Shares** 17.75% 12.44% 6.79% 6.85%
R6 Shares** 18.16% N/A N/A 9.44%
S&P 500 Index 21.83% 15.79% 8.50% 8.51% (Institutional and Open Shares) 12.53% (R6 Shares)
* Total returns reflect reinvestment of all dividends and distributions, if any. Certain expenses of the Portfolio may have been waived or reimbursed bythe Investment Manager, State Street or BFDS; without such waiver/reimbursement of expenses, the Portfolio’s returns would have been lower.
Performance results do not include adjustments made for financial reporting purposes in accordance with GAAP, if any, and may differ fromamounts reported in the financial highlights.
The performance quoted represents past performance. Current performance may be lower or higher than the performance quoted. Past perform-ance is not indicative, or a guarantee, of future results; the investment return and principal value of the Portfolio will fluctuate, so that Portfolioshares, when redeemed, may be worth more or less than their original cost. Within the longer periods illustrated there may have been short-termfluctuations, counter to the overall trend of investment results, and no single period of any length may be taken as typical of what may beexpected in future periods. The graph and table above do not reflect the deduction of taxes that a shareholder would pay on the Portfolio’s distribu-tions or the redemption of Portfolio shares.
The performance data of the index has been prepared from sources and data that the Investment Manager believes to be reliable, but no repre-sentation is made as to its accuracy. The S&P 500 Index is a market capitalization-weighted index of 500 companies in leading industries of the USeconomy. The index is unmanaged, has no fees or costs and is not available for investment.
** The performance of Institutional Shares, Open Shares and R6 Shares may vary, primarily based on the differences in fees borne by shareholdersinvesting in different classes.
† The inception date for the Institutional and Open Shares was December 30, 2004 and for the R6 Shares was May 19, 2014.
Lazard US Strategic Equity PortfolioComparison of Changes in Value
of $10,000 Investment in the
Institutional Shares of Lazard
US Strategic Equity Portfolio
and S&P 500 Index*
US Strategic Equity Portfolio Institutional SharesS&P 500 Index
5,000
10,000
15,000
20,000
$25,000$22,603
$19,871
12/07 12/08 12/09 12/10 12/12 12/1712/1512/13 12/1412/11 12/16

Annual Report 15
Average Annual Total Returns*Periods Ended December 31, 2017 One Five Ten
Year Years Years
Institutional Shares** 14.12% 14.46% 9.93%
Open Shares** 13.82% 14.12% 9.58%
Russell 2500 Index 16.81% 14.33% 9.22%
Russell 2000/2500 Linked Index 16.81% 14.33% 9.45%
* Total returns reflect reinvestment of all dividends and distributions, if any. Certain expenses of the Portfolio may have been waived or reimbursed bythe Investment Manager, State Street or BFDS; without such waiver/reimbursement of expenses, the Portfolio’s returns would have been lower.
Performance results do not include adjustments made for financial reporting purposes in accordance with GAAP, if any, also exclude one-timeadjustments related to reimbursed custodian out-of-pocket expenses (Note 3 in the Notes to Financial Statements), and may differ from amountsreported in the financial highlights.
The performance quoted represents past performance. Current performance may be lower or higher than the performance quoted. Past perform-ance is not indicative, or a guarantee, of future results; the investment return and principal value of the Portfolio will fluctuate, so that Portfolioshares, when redeemed, may be worth more or less than their original cost. Within the longer periods illustrated there may have been short-termfluctuations, counter to the overall trend of investment results, and no single period of any length may be taken as typical of what may beexpected in future periods. The graph and table above do not reflect the deduction of taxes that a shareholder would pay on the Portfolio’s distribu-tions or the redemption of Portfolio shares.
The Portfolio was previously known as Lazard U.S. Small Cap Equity Portfolio. As of August 25, 2008, the Portfolio changed its name to LazardU.S. Small-Mid Cap Equity Portfolio and changed its investment strategy to invest in equity securities of small-mid cap US companies.
The performance data of the indices have been prepared from sources and data that the Investment Manager believes to be reliable, but no repre-sentation is made as to their accuracy. The Russell 2500 Index measures the performance of the small-to mid-cap segment of the US equity uni-verse, commonly referred to as “smid” cap. The Russell 2500 Index is a subset of the Russell 3000® Index. The Russell 3000 Index measures theperformance of the largest 3,000 US companies, representing 98% of the investable US equity market. The Russell 2500 Index includes approxi-mately 2,500 of the smallest securities based on a combination of their market cap and current index membership. The Russell 2000/2500 LinkedIndex is an unmanaged index created by the Investment Manager, which links the performance of the Russell 2000® Index for all periods throughAugust 24, 2008 (when the Portfolio’s investment focus was changed from small cap companies to small-mid cap companies) and the Russell2500 Index for all periods thereafter. The Russell 2000 Index includes approximately 2,000 of the smallest securities in the Russell 3000 Index,representing roughly 10% of the total market capitalization of Russell 3,000 companies. The indices are unmanaged, have no fees or costs and arenot available for investment.
** The performance of Institutional Shares and Open Shares may vary, primarily based on the differences in fees borne by shareholders investing indifferent classes.
Lazard US Small-Mid Cap Equity PortfolioComparison of Changes in Value
of $10,000 Investment in the
Institutional Shares of Lazard
US Small-Mid Cap Equity Portfo-
lio, Russell 2500® Index and
Russell 2000/2500 Linked
Index*
US Small-Mid Cap Equity Portfolio Institutional SharesRussell 2500 IndexRussell 2000/2500 Linked Index
5,000
10,000
15,000
20,000
25,000
$30,000
$24,164
$25,774$24,666
12/07 12/08 12/09 12/10 12/11 12/12 12/1712/1612/1512/1412/13

16 Annual Report
Average Annual Total Returns*Periods Ended December 31, 2017 One Five Ten Since
Year Years Years Inception†
Institutional Shares** 22.81% 6.70% 2.87% 6.22%
Open Shares** 22.50% 6.42% 2.57% 5.09%
R6 Shares** 22.85% N/A N/A 4.50%
MSCI EAFE Index 25.03% 7.90% 1.94% 5.63% (Institutional Shares) 5.26% (Open Shares) 6.61% (R6 Shares)
* Total returns reflect reinvestment of all dividends and distributions, if any. Certain expenses of the Portfolio may have been waived or reimbursed bythe Investment Manager, State Street or BFDS; without such waiver/reimbursement of expenses, the Portfolio’s returns would have been lower.
Performance results do not include adjustments made for financial reporting purposes in accordance with GAAP, if any, and may differ fromamounts reported in the financial highlights.
The performance quoted represents past performance. Current performance may be lower or higher than the performance quoted. Past perform-ance is not indicative, or a guarantee, of future results; the investment return and principal value of the Portfolio will fluctuate, so that Portfolioshares, when redeemed, may be worth more or less than their original cost. Within the longer periods illustrated there may have been short-termfluctuations, counter to the overall trend of investment results, and no single period of any length may be taken as typical of what may beexpected in future periods. The graph and table above do not reflect the deduction of taxes that a shareholder would pay on the Portfolio’s distribu-tions or the redemption of Portfolio shares.
The performance data of the index has been prepared from sources and data that the Investment Manager believes to be reliable, but no repre-sentation is made as to its accuracy. The MSCI EAFE Index (Europe, Australasia, Far East) is a free-float-adjusted market capitalization index that isdesigned to measure developed markets equity performance, excluding the United States and Canada. The MSCI EAFE Index consists of 21developed markets country indices. The index is unmanaged, has no fees or costs and is not available for investment.
** The performance of Institutional Shares, Open Shares and R6 Shares may vary, primarily based on the differences in fees borne by shareholdersinvesting in different classes.
† The inception date for the Institutional Shares was October 29, 1991, for the Open Shares was January 23, 1997 and for the R6 Shares wasApril 1, 2015.
Lazard International Equity PortfolioComparison of Changes in Value
of $10,000 Investment in the
Institutional Shares of Lazard
International Equity Portfolio
and MSCI EAFE® Index*
International Equity Portfolio Institutional SharesMSCI EAFE Index
0
5,000
10,000
$15,000$13,265
$12,119
12/07 12/08 12/09 12/10 12/11 12/13 12/1712/1612/1512/1412/12
Annual Report 17
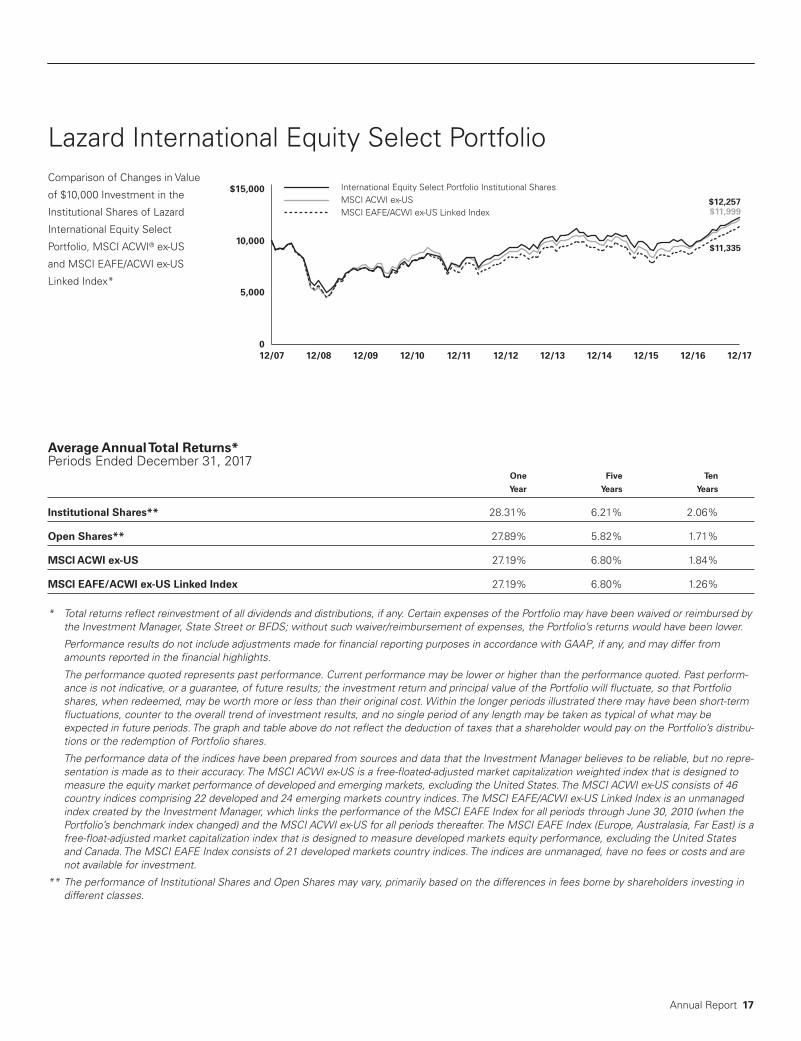
Lazard International Equity Select PortfolioComparison of Changes in Value
of $10,000 Investment in the
Institutional Shares of Lazard
International Equity Select
Portfolio, MSCI ACWI® ex-US
and MSCI EAFE/ACWI ex-US
Linked Index*
International Equity Select Portfolio Institutional SharesMSCI ACWI ex-USMSCI EAFE/ACWI ex-US Linked Index
0
5,000
10,000
$15,000
$11,999
12/07 12/08 12/09 12/10 12/1712/1612/1512/1412/1312/1212/11
$12,257
$11,335
Average Annual Total Returns*Periods Ended December 31, 2017 One Five Ten
Year Years Years
Institutional Shares** 28.31% 6.21% 2.06%
Open Shares** 27.89% 5.82% 1.71%
MSCI ACWI ex-US 27.19% 6.80% 1.84%
MSCI EAFE/ACWI ex-US Linked Index 27.19% 6.80% 1.26%
* Total returns reflect reinvestment of all dividends and distributions, if any. Certain expenses of the Portfolio may have been waived or reimbursed bythe Investment Manager, State Street or BFDS; without such waiver/reimbursement of expenses, the Portfolio’s returns would have been lower.
Performance results do not include adjustments made for financial reporting purposes in accordance with GAAP, if any, and may differ fromamounts reported in the financial highlights.
The performance quoted represents past performance. Current performance may be lower or higher than the performance quoted. Past perform-ance is not indicative, or a guarantee, of future results; the investment return and principal value of the Portfolio will fluctuate, so that Portfolioshares, when redeemed, may be worth more or less than their original cost. Within the longer periods illustrated there may have been short-termfluctuations, counter to the overall trend of investment results, and no single period of any length may be taken as typical of what may beexpected in future periods. The graph and table above do not reflect the deduction of taxes that a shareholder would pay on the Portfolio’s distribu-tions or the redemption of Portfolio shares.
The performance data of the indices have been prepared from sources and data that the Investment Manager believes to be reliable, but no repre-sentation is made as to their accuracy. The MSCI ACWI ex-US is a free-floated-adjusted market capitalization weighted index that is designed tomeasure the equity market performance of developed and emerging markets, excluding the United States. The MSCI ACWI ex-US consists of 46country indices comprising 22 developed and 24 emerging markets country indices. The MSCI EAFE/ACWI ex-US Linked Index is an unmanagedindex created by the Investment Manager, which links the performance of the MSCI EAFE Index for all periods through June 30, 2010 (when thePortfolio’s benchmark index changed) and the MSCI ACWI ex-US for all periods thereafter. The MSCI EAFE Index (Europe, Australasia, Far East) is afree-float-adjusted market capitalization index that is designed to measure developed markets equity performance, excluding the United Statesand Canada. The MSCI EAFE Index consists of 21 developed markets country indices. The indices are unmanaged, have no fees or costs and arenot available for investment.
** The performance of Institutional Shares and Open Shares may vary, primarily based on the differences in fees borne by shareholders investing indifferent classes.

18 Annual Report
Lazard International Equity Concentrated PortfolioComparison of Changes in Value
of $10,000 Investment in the
Institutional Shares of Lazard
International Equity Concen-
trated Portfolio and MSCI ACWI
ex-US*
International Equity Concentrated Portfolio Institutional SharesMSCI ACWI ex-US
$10,834
$11,469
08/29/14 12/14 12/1706/1612/15 12/16 06/1706/15
8,000
7,000
9,000
10,000
11,000
$12,000
Average Annual Total Returns*Periods Ended December 31, 2017 One Since
Year Inception†
Institutional Shares** 23.29% 2.42%
Open Shares** 22.87% 2.16%
MSCI ACWI ex-US 27.19% 4.20%
* Total returns reflect reinvestment of all dividends and distributions, if any. Certain expenses of the Portfolio may have been waived or reimbursed bythe Investment Manager, State Street or BFDS; without such waiver/reimbursement of expenses, the Portfolio’s returns would have been lower.
Performance results do not include adjustments made for financial reporting purposes in accordance with GAAP, if any, and may differ fromamounts reported in the financial highlights.
The performance quoted represents past performance. Current performance may be lower or higher than the performance quoted. Past perform-ance is not indicative, or a guarantee, of future results; the investment return and principal value of the Portfolio will fluctuate, so that Portfolioshares, when redeemed, may be worth more or less than their original cost. Within the longer periods illustrated there may have been short-termfluctuations, counter to the overall trend of investment results, and no single period of any length may be taken as typical of what may beexpected in future periods. The graph and table above do not reflect the deduction of taxes that a shareholder would pay on the Portfolio’s distribu-tions or the redemption of Portfolio shares.
The performance data of the index has been prepared from sources and data that the Investment Manager believes to be reliable, but no repre-sentation is made as to its accuracy. The MSCI ACWI ex-US is a free-floated-adjusted market capitalization weighted index that is designed tomeasure the equity market performance of developed and emerging markets, excluding the United States. The MSCI ACWI ex-US consists of 46country indices comprising 22 developed and 24 emerging markets country indices. The index is unmanaged, has no fees or costs and is not avail-able for investment.
** The performance of Institutional Shares and Open Shares may vary, primarily based on the differences in fees borne by shareholders investing indifferent classes.
† The inception date for the Portfolio was August 29, 2014.
Annual Report 19
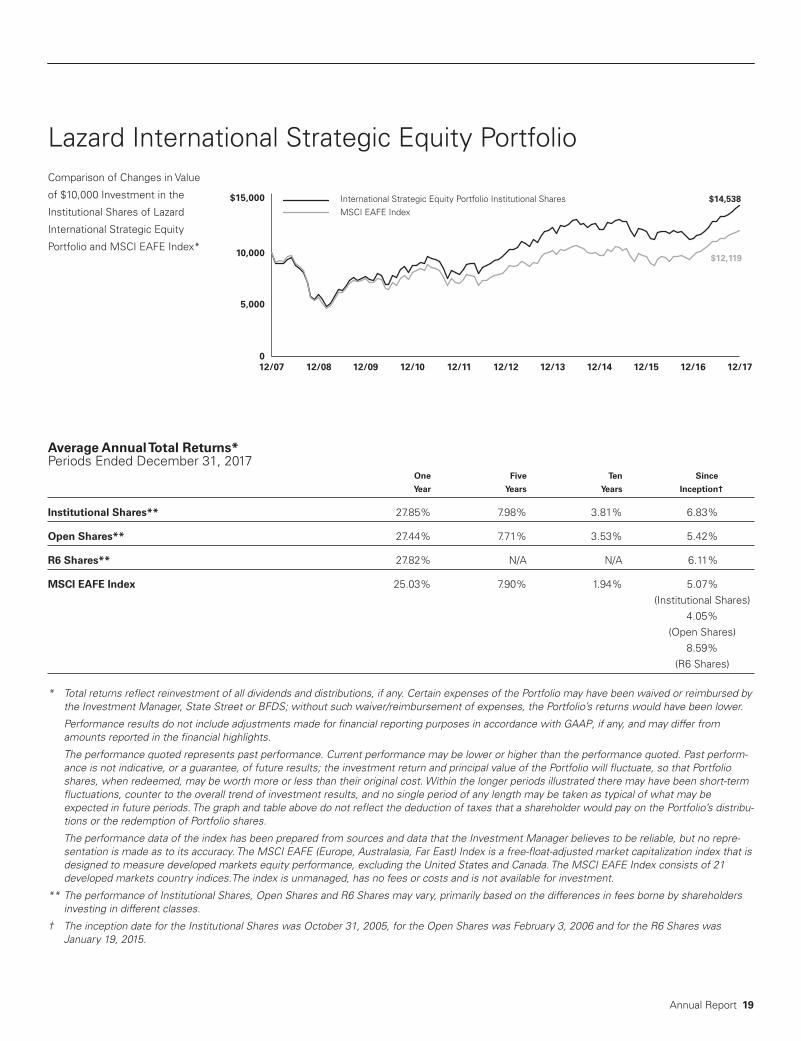
Lazard International Strategic Equity PortfolioComparison of Changes in Value
of $10,000 Investment in the
Institutional Shares of Lazard
International Strategic Equity
Portfolio and MSCI EAFE Index*
MSCI EAFE IndexInternational Strategic Equity Portfolio Institutional Shares
0
5,000
10,000
$15,000
$12,119
$14,538
12/07 12/0912/08 12/10 12/11 12/12 12/1712/1612/1512/1412/13
Average Annual Total Returns*Periods Ended December 31, 2017 One Five Ten Since
Year Years Years Inception†
Institutional Shares** 27.85% 7.98% 3.81% 6.83%
Open Shares** 27.44% 7.71% 3.53% 5.42%
R6 Shares** 27.82% N/A N/A 6.11%
MSCI EAFE Index 25.03% 7.90% 1.94% 5.07% (Institutional Shares) 4.05% (Open Shares) 8.59% (R6 Shares)
* Total returns reflect reinvestment of all dividends and distributions, if any. Certain expenses of the Portfolio may have been waived or reimbursed bythe Investment Manager, State Street or BFDS; without such waiver/reimbursement of expenses, the Portfolio’s returns would have been lower.
Performance results do not include adjustments made for financial reporting purposes in accordance with GAAP, if any, and may differ fromamounts reported in the financial highlights.
The performance quoted represents past performance. Current performance may be lower or higher than the performance quoted. Past perform-ance is not indicative, or a guarantee, of future results; the investment return and principal value of the Portfolio will fluctuate, so that Portfolioshares, when redeemed, may be worth more or less than their original cost. Within the longer periods illustrated there may have been short-termfluctuations, counter to the overall trend of investment results, and no single period of any length may be taken as typical of what may beexpected in future periods. The graph and table above do not reflect the deduction of taxes that a shareholder would pay on the Portfolio’s distribu-tions or the redemption of Portfolio shares.
The performance data of the index has been prepared from sources and data that the Investment Manager believes to be reliable, but no repre-sentation is made as to its accuracy. The MSCI EAFE (Europe, Australasia, Far East) Index is a free-float-adjusted market capitalization index that isdesigned to measure developed markets equity performance, excluding the United States and Canada. The MSCI EAFE Index consists of 21developed markets country indices.The index is unmanaged, has no fees or costs and is not available for investment.
** The performance of Institutional Shares, Open Shares and R6 Shares may vary, primarily based on the differences in fees borne by shareholdersinvesting in different classes.
† The inception date for the Institutional Shares was October 31, 2005, for the Open Shares was February 3, 2006 and for the R6 Shares was January 19, 2015.
20 Annual Report
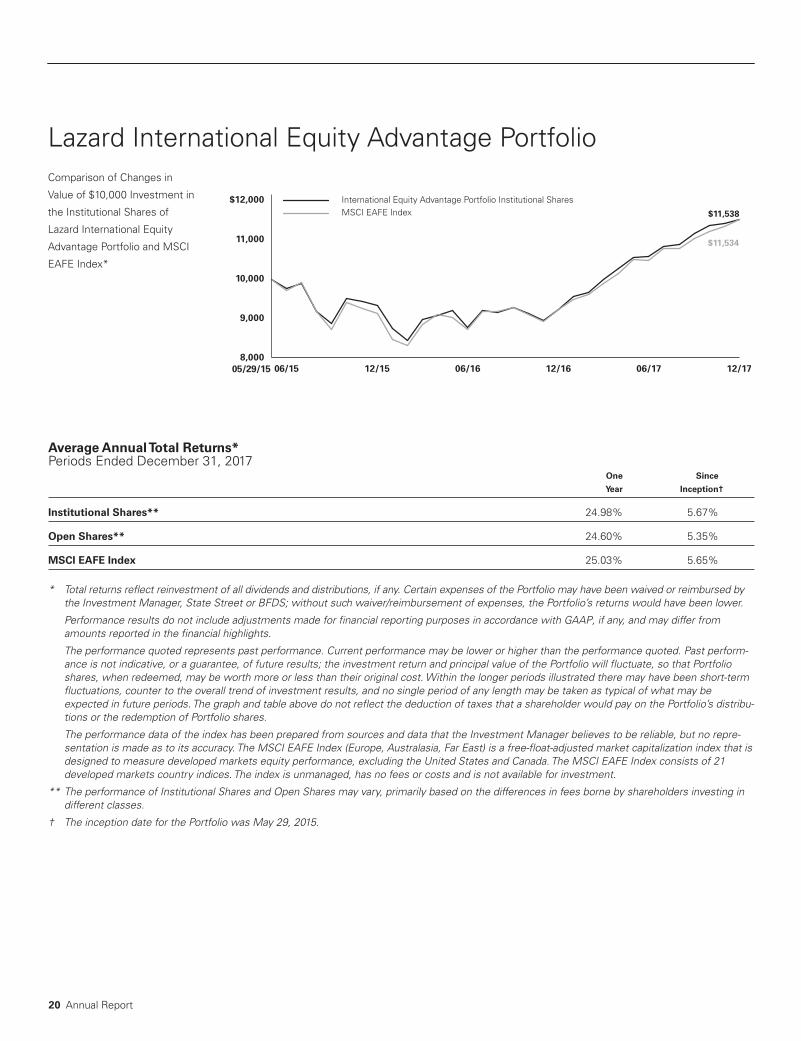
Lazard International Equity Advantage PortfolioComparison of Changes in
Value of $10,000 Investment in
the Institutional Shares of
Lazard International Equity
Advantage Portfolio and MSCI
EAFE Index*
International Equity Advantage Portfolio Institutional SharesMSCI EAFE Index $11,538
$11,534
05/29/15 12/1706/1706/16 12/1606/15 12/158,000
9,000
10,000
11,000
$12,000
Average Annual Total Returns*Periods Ended December 31, 2017 One Since
Year Inception†
Institutional Shares** 24.98% 5.67%
Open Shares** 24.60% 5.35%
MSCI EAFE Index 25.03% 5.65%
* Total returns reflect reinvestment of all dividends and distributions, if any. Certain expenses of the Portfolio may have been waived or reimbursed bythe Investment Manager, State Street or BFDS; without such waiver/reimbursement of expenses, the Portfolio’s returns would have been lower.
Performance results do not include adjustments made for financial reporting purposes in accordance with GAAP, if any, and may differ fromamounts reported in the financial highlights.
The performance quoted represents past performance. Current performance may be lower or higher than the performance quoted. Past perform-ance is not indicative, or a guarantee, of future results; the investment return and principal value of the Portfolio will fluctuate, so that Portfolioshares, when redeemed, may be worth more or less than their original cost. Within the longer periods illustrated there may have been short-termfluctuations, counter to the overall trend of investment results, and no single period of any length may be taken as typical of what may beexpected in future periods. The graph and table above do not reflect the deduction of taxes that a shareholder would pay on the Portfolio’s distribu-tions or the redemption of Portfolio shares.
The performance data of the index has been prepared from sources and data that the Investment Manager believes to be reliable, but no repre-sentation is made as to its accuracy. The MSCI EAFE Index (Europe, Australasia, Far East) is a free-float-adjusted market capitalization index that isdesigned to measure developed markets equity performance, excluding the United States and Canada. The MSCI EAFE Index consists of 21developed markets country indices. The index is unmanaged, has no fees or costs and is not available for investment.
** The performance of Institutional Shares and Open Shares may vary, primarily based on the differences in fees borne by shareholders investing indifferent classes.
† The inception date for the Portfolio was May 29, 2015.
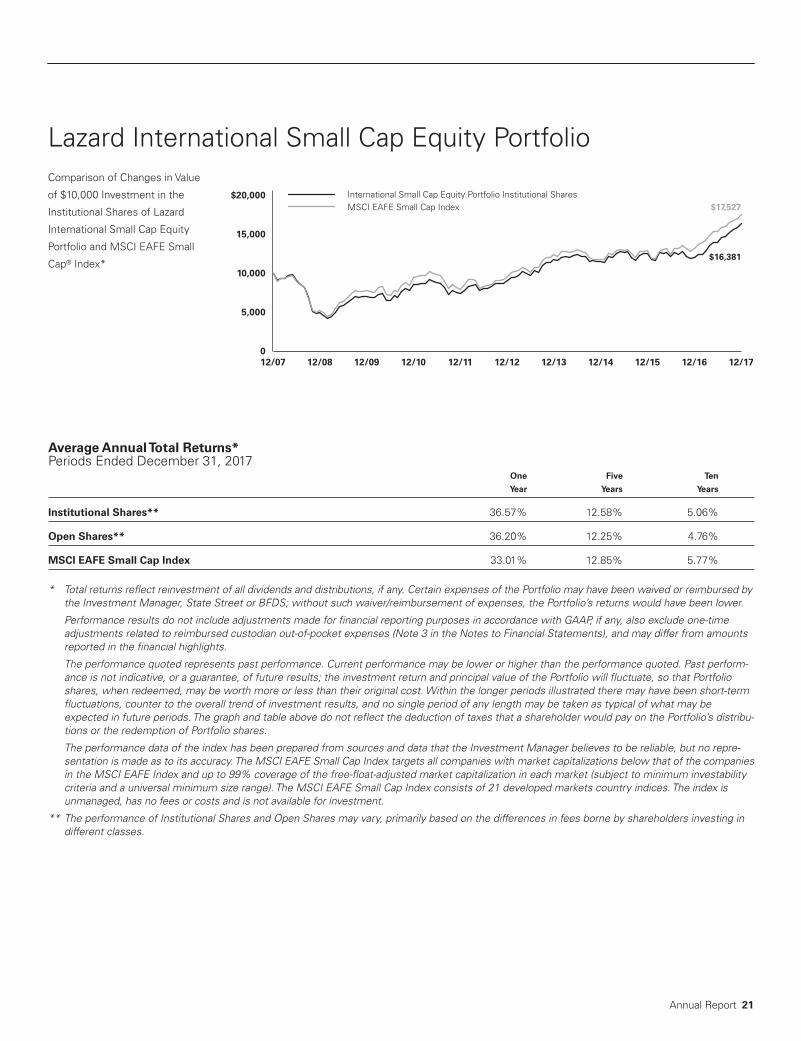
Annual Report 21
Lazard International Small Cap Equity PortfolioComparison of Changes in Value
of $10,000 Investment in the
Institutional Shares of Lazard
International Small Cap Equity
Portfolio and MSCI EAFE Small
Cap® Index*
International Small Cap Equity Portfolio Institutional SharesMSCI EAFE Small Cap Index $17,527
$16,381
12/08 12/09 12/10 12/11 12/1712/1612/1512/1412/1312/1212/070
5,000
10,000
15,000
$20,000
Average Annual Total Returns*Periods Ended December 31, 2017 One Five Ten
Year Years Years
Institutional Shares** 36.57% 12.58% 5.06%
Open Shares** 36.20% 12.25% 4.76%
MSCI EAFE Small Cap Index 33.01% 12.85% 5.77%
* Total returns reflect reinvestment of all dividends and distributions, if any. Certain expenses of the Portfolio may have been waived or reimbursed bythe Investment Manager, State Street or BFDS; without such waiver/reimbursement of expenses, the Portfolio’s returns would have been lower.
Performance results do not include adjustments made for financial reporting purposes in accordance with GAAP, if any, also exclude one-timeadjustments related to reimbursed custodian out-of-pocket expenses (Note 3 in the Notes to Financial Statements), and may differ from amountsreported in the financial highlights.
The performance quoted represents past performance. Current performance may be lower or higher than the performance quoted. Past perform-ance is not indicative, or a guarantee, of future results; the investment return and principal value of the Portfolio will fluctuate, so that Portfolioshares, when redeemed, may be worth more or less than their original cost. Within the longer periods illustrated there may have been short-termfluctuations, counter to the overall trend of investment results, and no single period of any length may be taken as typical of what may beexpected in future periods. The graph and table above do not reflect the deduction of taxes that a shareholder would pay on the Portfolio’s distribu-tions or the redemption of Portfolio shares.
The performance data of the index has been prepared from sources and data that the Investment Manager believes to be reliable, but no repre-sentation is made as to its accuracy. The MSCI EAFE Small Cap Index targets all companies with market capitalizations below that of the companiesin the MSCI EAFE Index and up to 99% coverage of the free-float-adjusted market capitalization in each market (subject to minimum investabilitycriteria and a universal minimum size range). The MSCI EAFE Small Cap Index consists of 21 developed markets country indices. The index isunmanaged, has no fees or costs and is not available for investment.
** The performance of Institutional Shares and Open Shares may vary, primarily based on the differences in fees borne by shareholders investing indifferent classes.

22 Annual Report
Lazard Global Equity Select PortfolioComparison of Changes in Value
of $10,000 Investment in the
Institutional Shares of Lazard
Global Equity Select Portfolio
and MSCI ACWI*
Global Equity Select Portfolio Institutional SharesMSCI ACWI
$13,762
$13,599
12/31/13 06/1512/1406/14 12/1706/1706/16 12/1612/159,000
10,000
11,000
12,000
13,000
$14,000
Average Annual Total Returns*Periods Ended December 31, 2017 One Since
Year Inception†
Institutional Shares** 28.52% 8.31%
Open Shares** 28.01% 7.98%
MSCI ACWI 23.97% 7.99%
* Total returns reflect reinvestment of all dividends and distributions, if any. Certain expenses of the Portfolio may have been waived or reimbursed bythe Investment Manager, State Street or BFDS; without such waiver/reimbursement of expenses, the Portfolio’s returns would have been lower.
Performance results do not include adjustments made for financial reporting purposes in accordance with GAAP, if any, and may differ fromamounts reported in the financial highlights.
The performance quoted represents past performance. Current performance may be lower or higher than the performance quoted. Past perform-ance is not indicative, or a guarantee, of future results; the investment return and principal value of the Portfolio will fluctuate, so that Portfolioshares, when redeemed, may be worth more or less than their original cost. Within the longer periods illustrated there may have been short-termfluctuations, counter to the overall trend of investment results, and no single period of any length may be taken as typical of what may beexpected in future periods. The graph and table above do not reflect the deduction of taxes that a shareholder would pay on the Portfolio’s distribu-tions or the redemption of Portfolio shares.
The performance data of the index has been prepared from sources and data that the Investment Manager believes to be reliable, but no repre-sentation is made as to its accuracy. The MSCI ACWI is a free-float-adjusted market capitalization weighted index that is designed to measure theequity market performance of developed and emerging markets. The MSCI ACWI consists of 47 country indices comprising 23 developed and 24emerging markets country indices. The index is unmanaged, has no fees or costs and is not available for investment.
** The performance of Institutional Shares and Open Shares may vary, primarily based on the differences in fees borne by shareholders investing indifferent classes.
† The inception date for the Portfolio was December 31, 2013.
Annual Report 23
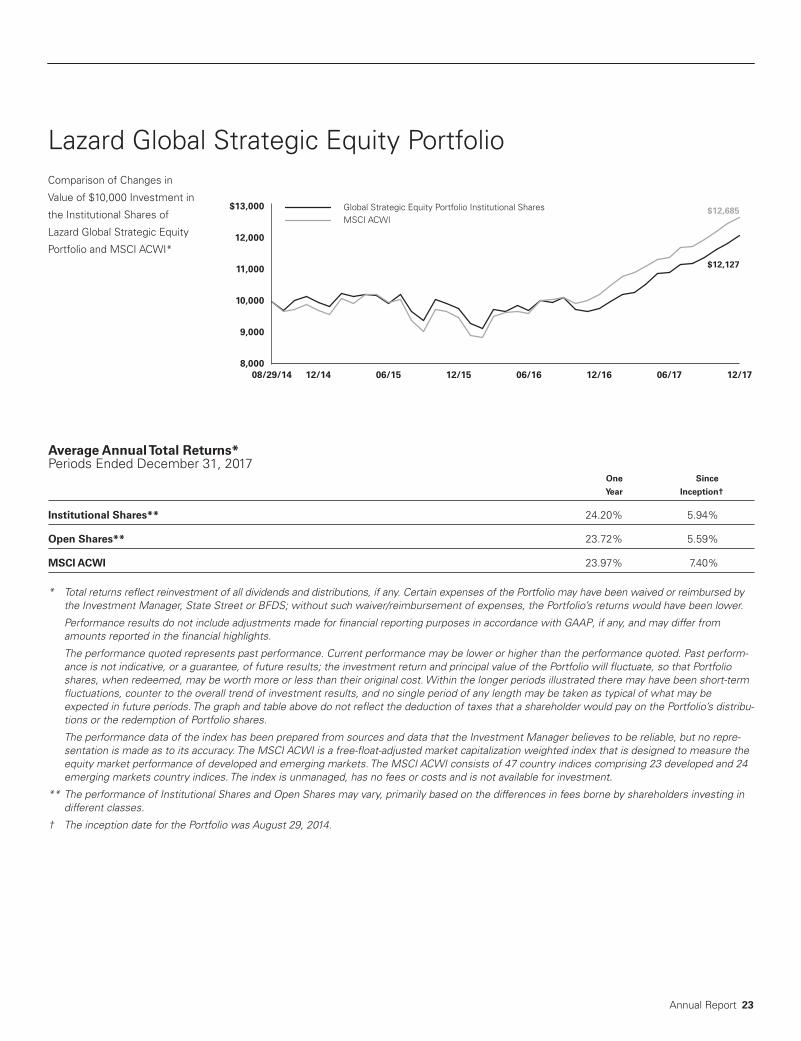
Lazard Global Strategic Equity PortfolioComparison of Changes in
Value of $10,000 Investment in
the Institutional Shares of
Lazard Global Strategic Equity
Portfolio and MSCI ACWI*
Global Strategic Equity Portfolio Institutional SharesMSCI ACWI
$12,127
$12,685
08/29/14 06/1512/14 12/1706/1712/1606/1612/158,000
9,000
10,000
11,000
12,000
$13,000
Average Annual Total Returns*Periods Ended December 31, 2017 One Since
Year Inception†
Institutional Shares** 24.20% 5.94%
Open Shares** 23.72% 5.59%
MSCI ACWI 23.97% 7.40%
* Total returns reflect reinvestment of all dividends and distributions, if any. Certain expenses of the Portfolio may have been waived or reimbursed bythe Investment Manager, State Street or BFDS; without such waiver/reimbursement of expenses, the Portfolio’s returns would have been lower.
Performance results do not include adjustments made for financial reporting purposes in accordance with GAAP, if any, and may differ fromamounts reported in the financial highlights.
The performance quoted represents past performance. Current performance may be lower or higher than the performance quoted. Past perform-ance is not indicative, or a guarantee, of future results; the investment return and principal value of the Portfolio will fluctuate, so that Portfolioshares, when redeemed, may be worth more or less than their original cost. Within the longer periods illustrated there may have been short-termfluctuations, counter to the overall trend of investment results, and no single period of any length may be taken as typical of what may beexpected in future periods. The graph and table above do not reflect the deduction of taxes that a shareholder would pay on the Portfolio’s distribu-tions or the redemption of Portfolio shares.
The performance data of the index has been prepared from sources and data that the Investment Manager believes to be reliable, but no repre-sentation is made as to its accuracy. The MSCI ACWI is a free-float-adjusted market capitalization weighted index that is designed to measure theequity market performance of developed and emerging markets. The MSCI ACWI consists of 47 country indices comprising 23 developed and 24emerging markets country indices. The index is unmanaged, has no fees or costs and is not available for investment.
** The performance of Institutional Shares and Open Shares may vary, primarily based on the differences in fees borne by shareholders investing indifferent classes.
† The inception date for the Portfolio was August 29, 2014.
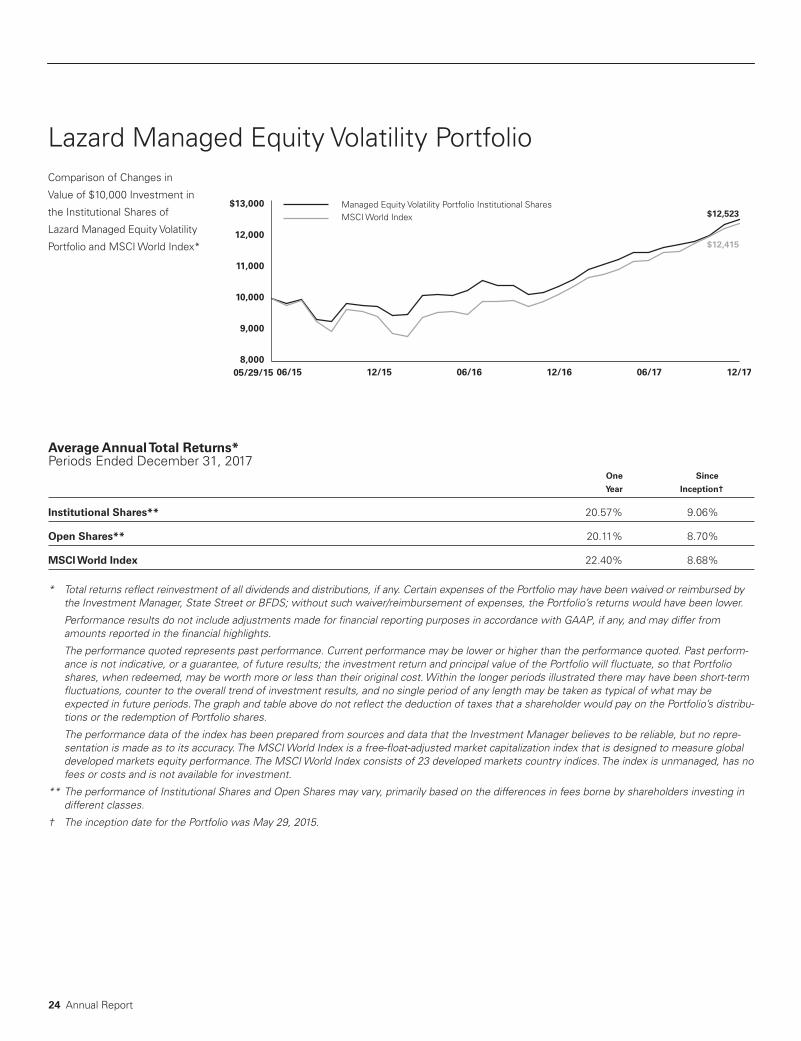
24 Annual Report
Lazard Managed Equity Volatility PortfolioComparison of Changes in
Value of $10,000 Investment in
the Institutional Shares of
Lazard Managed Equity Volatility
Portfolio and MSCI World Index*
Managed Equity Volatility Portfolio Institutional SharesMSCI World Index $12,523
$12,415
05/29/15 12/1706/1706/16 12/1612/1506/158,000
9,000
10,000
11,000
12,000
$13,000
Average Annual Total Returns*Periods Ended December 31, 2017 One Since
Year Inception†
Institutional Shares** 20.57% 9.06%
Open Shares** 20.11% 8.70%
MSCI World Index 22.40% 8.68%
* Total returns reflect reinvestment of all dividends and distributions, if any. Certain expenses of the Portfolio may have been waived or reimbursed bythe Investment Manager, State Street or BFDS; without such waiver/reimbursement of expenses, the Portfolio’s returns would have been lower.
Performance results do not include adjustments made for financial reporting purposes in accordance with GAAP, if any, and may differ fromamounts reported in the financial highlights.
The performance quoted represents past performance. Current performance may be lower or higher than the performance quoted. Past perform-ance is not indicative, or a guarantee, of future results; the investment return and principal value of the Portfolio will fluctuate, so that Portfolioshares, when redeemed, may be worth more or less than their original cost. Within the longer periods illustrated there may have been short-termfluctuations, counter to the overall trend of investment results, and no single period of any length may be taken as typical of what may beexpected in future periods. The graph and table above do not reflect the deduction of taxes that a shareholder would pay on the Portfolio’s distribu-tions or the redemption of Portfolio shares.
The performance data of the index has been prepared from sources and data that the Investment Manager believes to be reliable, but no repre-sentation is made as to its accuracy. The MSCI World Index is a free-float-adjusted market capitalization index that is designed to measure globaldeveloped markets equity performance. The MSCI World Index consists of 23 developed markets country indices. The index is unmanaged, has nofees or costs and is not available for investment.
** The performance of Institutional Shares and Open Shares may vary, primarily based on the differences in fees borne by shareholders investing indifferent classes.
† The inception date for the Portfolio was May 29, 2015.
Annual Report 25
Expense ExampleAs a shareholder in a Portfolio of the Fund, you incur ongoing costs, including management fees, distributionand service (12b-1) fees (Open Shares only), and other expenses. This Example is intended to help you under-stand your ongoing costs (in dollars) of investing in a Portfolio and to compare these costs with the ongoingcosts of investing in other mutual funds. The Example is based on an investment of $1,000 invested at the begin-ning of the six month period from July 1, 2017 through December 31, 2017 and held for the entire period.
Actual ExpensesFor each Share class of the Portfolios, the first line of the table below provides information about actual accountvalues and actual expenses. You may use the information in this line, together with the amount you invested, toestimate the expenses that you paid over the period. Simply divide your account value by $1,000 (for example,an $8,600 account value divided by $1,000=8.6), then multiply the result by the number in the first line under theheading entitled “Expenses Paid During Period” to estimate the expenses you paid on your account during thisperiod.
Hypothetical Example for Comparison PurposesFor each Share class of the Portfolios, the second line of the table below provides information about hypotheti-cal account values and hypothetical expenses based on the class’ actual expense ratio and an assumed rate ofreturn of 5% per year before expenses, which is not the Portfolio’s actual return. The hypothetical account valuesand expenses may not be used to estimate the actual ending account balance or expenses you paid for theperiod. You may use this information to compare the ongoing costs of investing in the Portfolio and othermutual funds. To do so, compare this 5% hypothetical example with the 5% hypothetical examples that appearin the shareholder reports of other mutual funds.
The Lazard Funds, Inc. Information About Your Portfolio’s Expenses

26 Annual Report
US Equity ConcentratedInstitutional Shares Actual $1,000.00 $1,072.40 $3.92 0.75%Hypothetical (5% Return Before Expenses) $1,000.00 $1,021.42 $3.82 0.75%Open Shares Actual $1,000.00 $1,071.00 $5.38 1.03%Hypothetical (5% Return Before Expenses) $1,000.00 $1,020.01 $5.24 1.03%R6 Shares Actual $1,000.00 $1,072.00 $3.81 0.73%Hypothetical (5% Return Before Expenses) $1,000.00 $1,021.53 $3.72 0.73%
US Strategic Equity Institutional Shares Actual $1,000.00 $1,095.10 $3.96 0.75%Hypothetical (5% Return Before Expenses) $1,000.00 $1,021.42 $3.82 0.75%Open Shares Actual $1,000.00 $1,093.20 $5.54 1.05%Hypothetical (5% Return Before Expenses) $1,000.00 $1,019.91 $5.35 1.05%R6 Shares Actual $1,000.00 $1,095.00 $3.96 0.75%Hypothetical (5% Return Before Expenses) $1,000.00 $1,021.42 $3.82 0.75%
US Small-Mid Cap Equity Institutional Shares Actual $1,000.00 $1,093.70 $4.49 0.85%Hypothetical (5% Return Before Expenses) $1,000.00 $1,020.92 $4.33 0.85%Open Shares Actual $1,000.00 $1,091.90 $6.12 1.16%Hypothetical (5% Return Before Expenses) $1,000.00 $1,019.36 $5.90 1.16%
International Equity Institutional Shares Actual $1,000.00 $1,094.90 $4.33 0.82%Hypothetical (5% Return Before Expenses) $1,000.00 $1,021.07 $4.18 0.82%Open Shares Actual $1,000.00 $1,093.50 $5.65 1.07%Hypothetical (5% Return Before Expenses) $1,000.00 $1,019.81 $5.45 1.07%R6 Shares Actual $1,000.00 $1,095.20 $4.22 0.80%Hypothetical (5% Return Before Expenses) $1,000.00 $1,021.17 $4.08 0.80%
International Equity Select Institutional Shares Actual $1,000.00 $1,115.40 $5.60 1.05%Hypothetical (5% Return Before Expenses) $1,000.00 $1,019.91 $5.35 1.05%Open Shares Actual $1,000.00 $1,114.20 $7.19 1.35%Hypothetical (5% Return Before Expenses) $1,000.00 $1,018.40 $6.87 1.35%
Beginning Ending Expenses Paid Annualized Expense Account Value Account Value During Period* Ratio During PeriodPortfolio 7/1/17 12/31/17 7/1/17 - 12/31/17 7/1/17 - 12/31/17

Annual Report 27
International Equity Concentrated Institutional Shares Actual $1,000.00 $1,092.20 $5.54 1.05%Hypothetical (5% Return Before Expenses) $1,000.00 $1,019.91 $5.35 1.05%Open Shares Actual $1,000.00 $1,091.00 $7.12 1.35%Hypothetical (5% Return Before Expenses) $1,000.00 $1,018.40 $6.87 1.35%
International Strategic Equity Institutional Shares Actual $1,000.00 $1,121.70 $4.28 0.80%Hypothetical (5% Return Before Expenses) $1,000.00 $1,021.17 $4.08 0.80%Open Shares Actual $1,000.00 $1,120.00 $5.61 1.05%Hypothetical (5% Return Before Expenses) $1,000.00 $1,019.91 $5.35 1.05%R6 Shares Actual $1,000.00 $1,121.50 $4.22 0.79%Hypothetical (5% Return Before Expenses) $1,000.00 $1,021.22 $4.02 0.79%
International Equity Advantage Institutional Shares Actual $1,000.00 $1,090.60 $4.74 0.90%Hypothetical (5% Return Before Expenses) $1,000.00 $1,020.67 $4.58 0.90%Open Shares Actual $1,000.00 $1,088.40 $6.32 1.20%Hypothetical (5% Return Before Expenses) $1,000.00 $1,019.16 $6.11 1.20%
International Small Cap Equity Institutional Shares Actual $1,000.00 $1,169.60 $5.74 1.05%Hypothetical (5% Return Before Expenses) $1,000.00 $1,019.91 $5.35 1.05%Open Shares Actual $1,000.00 $ 1,167.20 $7.10 1.30%Hypothetical (5% Return Before Expenses) $1,000.00 $1,018.65 $6.61 1.30%
Equity Franchise† Institutional Shares Actual $1,000.00 $1,042.50 $2.42 0.95%Hypothetical (5% Return Before Expenses) $1,000.00 $1,010.10 $2.38 0.95%Open Shares Actual $1,000.00 $1,041.80 $3.05 1.20%Hypothetical (5% Return Before Expenses) $1,000.00 $1,009.45 $3.03 1.20%
Global Equity Select Institutional Shares Actual $1,000.00 $1,123.10 $5.62 1.05%Hypothetical (5% Return Before Expenses) $1,000.00 $1,019.91 $5.35 1.05%Open Shares Actual $1,000.00 $1,120.60 $7.22 1.35%Hypothetical (5% Return Before Expenses) $1,000.00 $1,018.40 $6.87 1.35%
Beginning Ending Expenses Paid Annualized Expense Account Value Account Value During Period* Ratio During PeriodPortfolio 7/1/17 12/31/17 7/1/17 - 12/31/17 7/1/17 - 12/31/17

28 Annual Report
Global Strategic Equity Institutional Shares Actual $1,000.00 $1,110.00 $5.90 1.11%Hypothetical (5% Return Before Expenses) $1,000.00 $1,019.61 $5.65 1.11%Open Shares Actual $1,000.00 $ 1,107.80 $7.54 1.42%Hypothetical (5% Return Before Expenses) $1,000.00 $1,018.05 $7.22 1.42%
Managed Equity Volatility Institutional Shares Actual $1,000.00 $1,092.00 $3.95 0.75%Hypothetical (5% Return Before Expenses) $1,000.00 $1,021.42 $3.82 0.75%Open Shares Actual $1,000.00 $1,089.80 $5.53 1.05%Hypothetical (5% Return Before Expenses) $1,000.00 $1,019.91 $5.35 1.05%
* Expenses are equal to the annualized expense ratio, net of expenses waivers and reimbursements, of each Share class multiplied by the averageaccount value over the period, multiplied by 184/365 (to reflect one-half year period).
† The Portfolio commenced operations on September 29, 2017.
Beginning Ending Expenses Paid Annualized Expense Account Value Account Value During Period* Ratio During PeriodPortfolio 7/1/17 12/31/17 7/1/17 - 12/31/17 7/1/17 - 12/31/17
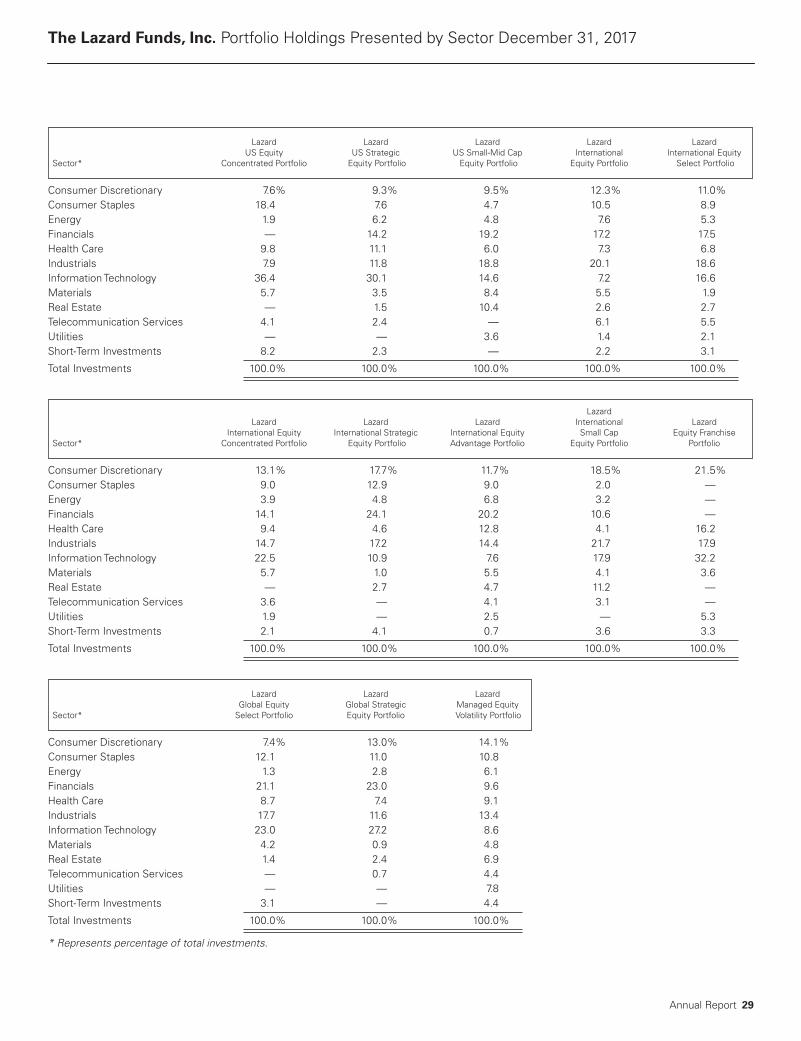
Annual Report 29
Consumer Discretionary 7.6% 9.3% 9.5% 12.3% 11.0%Consumer Staples 18.4 7.6 4.7 10.5 8.9Energy 1.9 6.2 4.8 7.6 5.3Financials — 14.2 19.2 17.2 17.5Health Care 9.8 11.1 6.0 7.3 6.8Industrials 7.9 11.8 18.8 20.1 18.6Information Technology 36.4 30.1 14.6 7.2 16.6Materials 5.7 3.5 8.4 5.5 1.9Real Estate — 1.5 10.4 2.6 2.7Telecommunication Services 4.1 2.4 — 6.1 5.5Utilities — — 3.6 1.4 2.1Short- Term Investments 8.2 2.3 — 2.2 3.1
Total Investments 100.0% 100.0% 100.0% 100.0% 100.0%
Consumer Discretionary 13.1% 17.7% 11.7% 18.5% 21.5%Consumer Staples 9.0 12.9 9.0 2.0 —Energy 3.9 4.8 6.8 3.2 —Financials 14.1 24.1 20.2 10.6 —Health Care 9.4 4.6 12.8 4.1 16.2Industrials 14.7 17.2 14.4 21.7 17.9Information Technology 22.5 10.9 7.6 17.9 32.2Materials 5.7 1.0 5.5 4.1 3.6Real Estate — 2.7 4.7 11.2 —Telecommunication Services 3.6 — 4.1 3.1 —Utilities 1.9 — 2.5 — 5.3Short- Term Investments 2.1 4.1 0.7 3.6 3.3
Total Investments 100.0% 100.0% 100.0% 100.0% 100.0%
Consumer Discretionary 7.4% 13.0% 14.1%Consumer Staples 12.1 11.0 10.8Energy 1.3 2.8 6.1Financials 21.1 23.0 9.6Health Care 8.7 7.4 9.1Industrials 17.7 11.6 13.4Information Technology 23.0 27.2 8.6Materials 4.2 0.9 4.8Real Estate 1.4 2.4 6.9Telecommunication Services — 0.7 4.4Utilities — — 7.8Short- Term Investments 3.1 — 4.4
Total Investments 100.0% 100.0% 100.0%
* Represents percentage of total investments.
Lazard Lazard Lazard Lazard Lazard US Equity US Strategic US Small- Mid Cap International International EquitySector* Concentrated Portfolio Equity Portfolio Equity Portfolio Equity Portfolio Select Portfolio
Lazard Lazard Lazard Lazard International Lazard International Equity International Strategic International Equity Small Cap Equity Franchise Sector* Concentrated Portfolio Equity Portfolio Advantage Portfolio Equity Portfolio Portfolio
Lazard Lazard Lazard Global Equity Global Strategic Managed EquitySector* Select Portfolio Equity Portfolio Volatility Portfolio
The Lazard Funds, Inc. Portfolio Holdings Presented by Sector December 31, 2017

30 Annual Report
The accompanying notes are an integral part of these financial statements.
Lazard US Equity Concentrated Portfolio
Common Stocks | 91.2%
Air Freight & Logistics | 4.9%United Parcel Service, Inc., Class B 657,395 $ 78,328,614
Auto Components | 3.0%Aptiv PLC 566,070 48,019,718
Beverages | 17.2%Molson Coors Brewing Co., Class B 1,657,222 136,008,209The Coca- Cola Co. 3,017,545 138,444,965 274,453,174Communications Equipment | 15.8%Cisco Systems, Inc. 3,961,925 151,741,727Motorola Solutions, Inc. 1,115,481 100,772,554 252,514,281Containers & Packaging | 3.5%Crown Holdings, Inc. (*) 990,860 55,735,875
Diversified Telecommunication
Services | 4.1%AT&T, Inc. 1,698,400 66,033,792
Energy Equipment & Services | 1.8%Schlumberger, Ltd. 438,000 29,516,820
Food Products | 1.1%Kellogg Co. 251,155 17,073,517
Health Care Equipment
& Supplies | 9.8%Medtronic PLC 1,928,730 155,744,947
Internet Software & Services | 11.6%Alphabet, Inc., Class A (*) 103,526 109,054,288eBay, Inc. (*) 2,019,630 76,220,836 185,275,124
IT Services | 4.8%DXC Technology Co. 799,000 $ 75,825,100
Machinery | 2.9%Wabtec Corp. 568,100 46,260,383
Metals & Mining | 2.2%Steel Dynamics, Inc. 823,821 35,531,400
Semiconductors & Semiconductor
Equipment | 4.0%Skyworks Solutions, Inc. 665,525 63,191,599
Specialty Retail | 2.9%AutoZone, Inc. (*) 65,280 46,438,234
Textiles, Apparel & Luxury
Goods | 1.6%Carter’s, Inc. 216,985 25,493,568
Total Common Stocks
(Cost $1,308,765,811) 1,455,436,146
Short- Term Investments | 8.1%State Street Institutional Treasury Money Market Fund, Premier Class, 1.15% (7 day yield) (Cost $130,036,124) 130,036,124 130,036,124
Total Investments | 99.3%(Cost $1,438,801,935) $1,585,472,270
Cash and Other Assets in Excess
of Liabilities | 0.7% 11,071,897
Net Assets | 100.0% $1,596,544,167
FairDescription Shares Value
FairDescription Shares Value
The Lazard Funds, Inc. Portfolios of Investments December 31, 2017
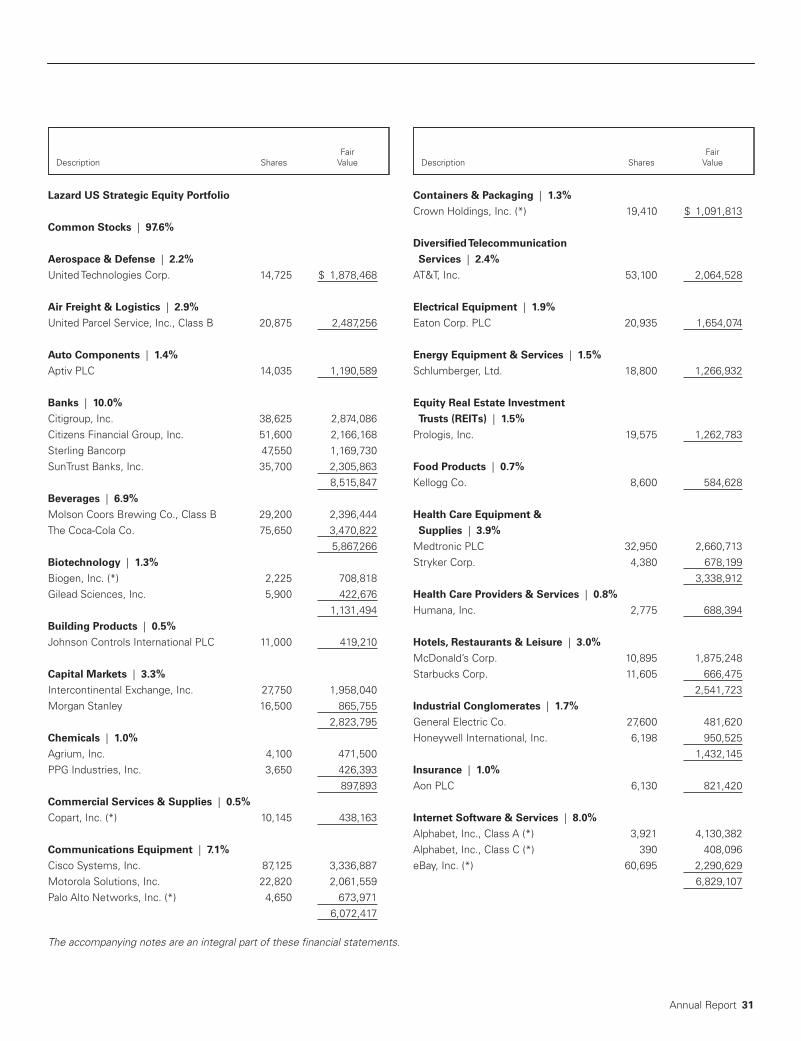
Annual Report 31
The accompanying notes are an integral part of these financial statements.
FairDescription Shares Value
FairDescription Shares Value
Lazard US Strategic Equity Portfolio
Common Stocks | 97.6%
Aerospace & Defense | 2.2%United Technologies Corp. 14,725 $ 1,878,468
Air Freight & Logistics | 2.9%United Parcel Service, Inc., Class B 20,875 2,487,256
Auto Components | 1.4%Aptiv PLC 14,035 1,190,589
Banks | 10.0%Citigroup, Inc. 38,625 2,874,086Citizens Financial Group, Inc. 51,600 2,166,168Sterling Bancorp 47,550 1,169,730SunTrust Banks, Inc. 35,700 2,305,863 8,515,847Beverages | 6.9%Molson Coors Brewing Co., Class B 29,200 2,396,444The Coca- Cola Co. 75,650 3,470,822 5,867,266Biotechnology | 1.3%Biogen, Inc. (*) 2,225 708,818Gilead Sciences, Inc. 5,900 422,676 1,131,494Building Products | 0.5%Johnson Controls International PLC 11,000 419,210
Capital Markets | 3.3%Intercontinental Exchange, Inc. 27,750 1,958,040Morgan Stanley 16,500 865,755 2,823,795Chemicals | 1.0%Agrium, Inc. 4,100 471,500PPG Industries, Inc. 3,650 426,393 897,893Commercial Services & Supplies | 0.5%Copart, Inc. (*) 10,145 438,163
Communications Equipment | 7.1%Cisco Systems, Inc. 87,125 3,336,887Motorola Solutions, Inc. 22,820 2,061,559Palo Alto Networks, Inc. (*) 4,650 673,971 6,072,417
Containers & Packaging | 1.3%Crown Holdings, Inc. (*) 19,410 $ 1,091,813
Diversified Telecommunication
Services | 2.4%AT&T, Inc. 53,100 2,064,528
Electrical Equipment | 1.9%Eaton Corp. PLC 20,935 1,654,074
Energy Equipment & Services | 1.5%Schlumberger, Ltd. 18,800 1,266,932
Equity Real Estate Investment
Trusts (REITs) | 1.5%Prologis, Inc. 19,575 1,262,783
Food Products | 0.7%Kellogg Co. 8,600 584,628
Health Care Equipment &
Supplies | 3.9%Medtronic PLC 32,950 2,660,713Stryker Corp. 4,380 678,199 3,338,912Health Care Providers & Services | 0.8%Humana, Inc. 2,775 688,394
Hotels, Restaurants & Leisure | 3.0%McDonald’s Corp. 10,895 1,875,248Starbucks Corp. 11,605 666,475 2,541,723Industrial Conglomerates | 1.7%General Electric Co. 27,600 481,620Honeywell International, Inc. 6,198 950,525 1,432,145Insurance | 1.0%Aon PLC 6,130 821,420
Internet Software & Services | 8.0%Alphabet, Inc., Class A (*) 3,921 4,130,382Alphabet, Inc., Class C (*) 390 408,096eBay, Inc. (*) 60,695 2,290,629 6,829,107

32 Annual Report
The accompanying notes are an integral part of these financial statements.
Lazard US Strategic Equity Portfolio (concluded)
IT Services | 5.0%CoreLogic, Inc. (*) 16,700 $ 771,707DXC Technology Co. 12,350 1,172,015Vantiv, Inc., Class A (*) 8,100 595,755Visa, Inc., Class A 15,420 1,758,189 4,297,666Machinery | 1.7%Deere & Co. 6,020 942,190Wabtec Corp. 5,800 472,294 1,414,484Marine | 0.4%Kirby Corp. (*) 4,850 323,980
Media | 0.6%The Madison Square Garden Co., Class A (*) 2,258 476,099
Metals & Mining | 1.1%Steel Dynamics, Inc. 22,300 961,799
Multiline Retail | 0.6%Dollar Tree, Inc. (*) 4,800 515,088
Oil, Gas & Consumable Fuels | 4.7%Cimarex Energy Co. 3,900 475,839ConocoPhillips 26,945 1,479,011EOG Resources, Inc. 11,005 1,187,550Pioneer Natural Resources Co. 5,175 894,499 4,036,899Pharmaceuticals | 5.0%Pfizer, Inc. 80,889 2,929,800Zoetis, Inc. 19,004 1,369,048 4,298,848
Semiconductors & Semiconductor
Equipment | 4.0%Cypress Semiconductor Corp. 43,400 $ 661,416Intel Corp. 19,900 918,584Skyworks Solutions, Inc. 19,435 1,845,353 3,425,353Software | 3.6%Microsoft Corp. 35,700 3,053,778
Specialty Retail | 3.0%AutoZone, Inc. (*) 1,840 1,308,921Lowe’s Cos., Inc. 13,700 1,273,278 2,582,199Technology Hardware, Storage
& Peripherals | 2.4%Apple, Inc. 11,952 2,022,637
Textiles, Apparel & Luxury Goods | 0.7%Carter’s, Inc. 5,370 630,921
Total Common Stocks
(Cost $69,183,030) 83,338,608
Short- Term Investments | 2.3%State Street Institutional Treasury Money Market Fund, Premier Class, 1.15% (7 day yield) (Cost $1,947,372) 1,947,372 1,947,372
Total Investments | 99.9%(Cost $71,130,402) $85,285,980
Cash and Other Assets in Excess
of Liabilities | 0.1% 78,668
Net Assets | 100.0% $85,364,648
FairDescription Shares Value
FairDescription Shares Value

Annual Report 33
The accompanying notes are an integral part of these financial statements.
Lazard US Small- Mid Cap Equity Portfolio
Common Stocks | 96.9%
Air Freight & Logistics | 0.9%Echo Global Logistics, Inc. (*) 63,533 $ 1,778,924
Airlines | 1.4%Alaska Air Group, Inc. 38,200 2,808,082
Auto Components | 1.1%Modine Manufacturing Co. (*) 107,245 2,166,349
Banks | 12.7%Bank of the Ozarks, Inc. 74,910 3,629,390Comerica, Inc. 39,905 3,464,153Commerce Bancshares, Inc. 69,992 3,908,353FCB Financial Holdings, Inc., Class A (*) 61,160 3,106,928Home BancShares, Inc. 144,035 3,348,814PacWest Bancorp 44,091 2,222,186Sterling Bancorp 123,285 3,032,811Texas Capital Bancshares, Inc. (*) 33,790 3,003,931 25,716,566Biotechnology | 0.6%Cellectis SA ADR (*) 38,315 1,116,882
Building Products | 1.0%PGT Innovations, Inc. (*) 125,650 2,117,202
Capital Markets | 1.6%Morningstar, Inc. 34,470 3,342,556
Chemicals | 4.4%Ingevity Corp. (*) 26,495 1,867,103Innospec, Inc. 48,195 3,402,567Valvoline, Inc. 144,300 3,616,158 8,885,828Commercial Services & Supplies | 1.9%Deluxe Corp. 50,440 3,875,810
Communications Equipment | 1.1%Ciena Corp. (*) 108,535 2,271,638
Construction & Engineering | 1.0%Dycom Industries, Inc. (*) 17,510 1,951,139
Construction Materials | 1.1%Eagle Materials, Inc. 19,940 $ 2,259,202
Containers & Packaging | 2.0%Graphic Packaging Holding Co. 264,525 4,086,911
Electric Utilities | 1.6%PNM Resources, Inc. 80,000 3,236,000
Electrical Equipment | 5.3%Atkore International Group, Inc. (*) 139,925 3,001,391EnerSys 27,160 1,891,151Generac Holdings, Inc. (*) 54,120 2,680,022Regal Beloit Corp. 40,930 3,135,238 10,707,802Electronic Equipment, Instruments
& Components | 2.5%Belden, Inc. 25,895 1,998,317FLIR Systems, Inc. 67,110 3,128,668 5,126,985Energy Equipment & Services | 4.6%NCS Multistage Holdings, Inc. 102,930 1,517,188Oceaneering International, Inc. 106,655 2,254,687Patterson- UTI Energy, Inc. 116,085 2,671,116U.S. Silica Holdings, Inc. 90,075 2,932,842 9,375,833Equity Real Estate Investment
Trusts (REITs) | 10.1%American Campus Communities, Inc. 53,450 2,193,054Camden Property Trust 28,925 2,662,835DCT Industrial Trust, Inc. 51,173 3,007,949Extra Space Storage, Inc. 35,980 3,146,451Healthcare Realty Trust, Inc. 105,050 3,374,206Kilroy Realty Corp. 39,265 2,931,132UDR, Inc. 80,155 3,087,571 20,403,198Food & Staples Retailing | 1.2%Sprouts Farmers Market, Inc. (*) 103,310 2,515,598
Food Products | 3.3%The J.M. Smucker Co. 31,215 3,878,152The Simply Good Foods Co. (*) 204,140 2,911,036 6,789,188Gas Utilities | 0.7%Northwest Natural Gas Co. 22,320 1,331,388
FairDescription Shares Value
FairDescription Shares Value
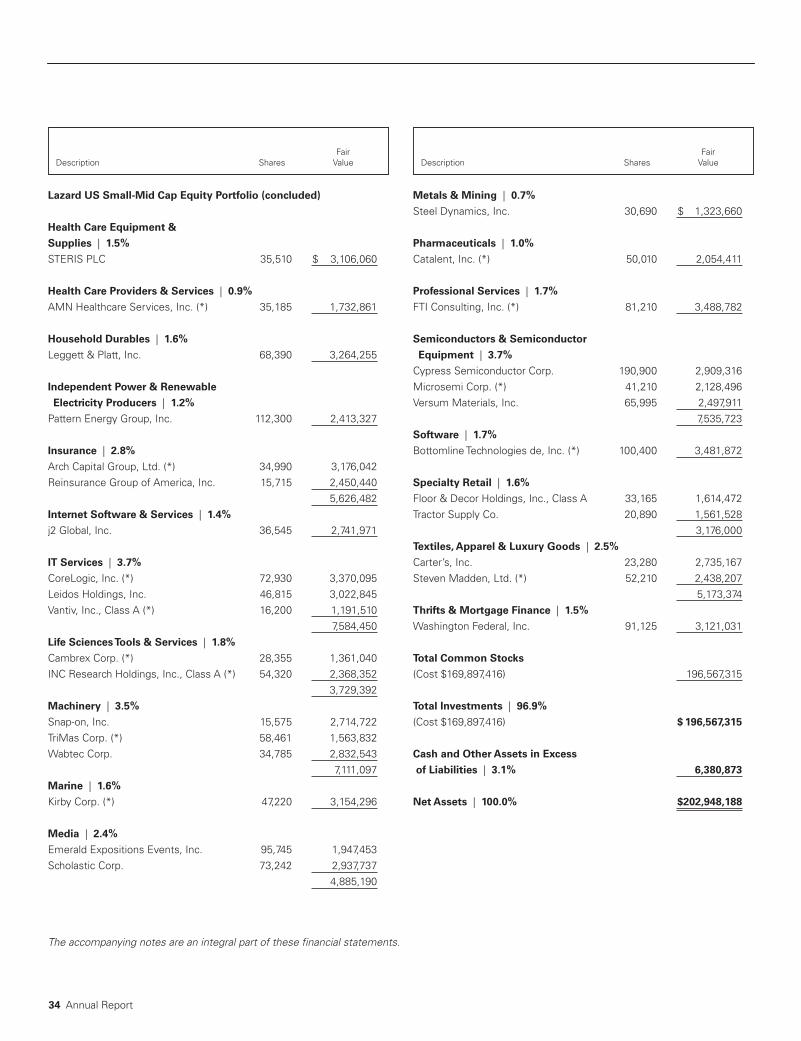
34 Annual Report
The accompanying notes are an integral part of these financial statements.
Lazard US Small- Mid Cap Equity Portfolio (concluded)
Health Care Equipment &
Supplies | 1.5%STERIS PLC 35,510 $ 3,106,060
Health Care Providers & Services | 0.9%AMN Healthcare Services, Inc. (*) 35,185 1,732,861
Household Durables | 1.6%Leggett & Platt, Inc. 68,390 3,264,255
Independent Power & Renewable
Electricity Producers | 1.2%Pattern Energy Group, Inc. 112,300 2,413,327
Insurance | 2.8%Arch Capital Group, Ltd. (*) 34,990 3,176,042Reinsurance Group of America, Inc. 15,715 2,450,440 5,626,482Internet Software & Services | 1.4%j2 Global, Inc. 36,545 2,741,971
IT Services | 3.7%CoreLogic, Inc. (*) 72,930 3,370,095Leidos Holdings, Inc. 46,815 3,022,845Vantiv, Inc., Class A (*) 16,200 1,191,510 7,584,450Life Sciences Tools & Services | 1.8%Cambrex Corp. (*) 28,355 1,361,040INC Research Holdings, Inc., Class A (*) 54,320 2,368,352 3,729,392Machinery | 3.5%Snap- on, Inc. 15,575 2,714,722TriMas Corp. (*) 58,461 1,563,832Wabtec Corp. 34,785 2,832,543 7,111,097Marine | 1.6%Kirby Corp. (*) 47,220 3,154,296
Media | 2.4%Emerald Expositions Events, Inc. 95,745 1,947,453Scholastic Corp. 73,242 2,937,737 4,885,190
Metals & Mining | 0.7%Steel Dynamics, Inc. 30,690 $ 1,323,660
Pharmaceuticals | 1.0%Catalent, Inc. (*) 50,010 2,054,411
Professional Services | 1.7%FTI Consulting, Inc. (*) 81,210 3,488,782
Semiconductors & Semiconductor
Equipment | 3.7%Cypress Semiconductor Corp. 190,900 2,909,316Microsemi Corp. (*) 41,210 2,128,496Versum Materials, Inc. 65,995 2,497,911 7,535,723Software | 1.7%Bottomline Technologies de, Inc. (*) 100,400 3,481,872
Specialty Retail | 1.6%Floor & Decor Holdings, Inc., Class A 33,165 1,614,472Tractor Supply Co. 20,890 1,561,528 3,176,000Textiles, Apparel & Luxury Goods | 2.5%Carter’s, Inc. 23,280 2,735,167Steven Madden, Ltd. (*) 52,210 2,438,207 5,173,374Thrifts & Mortgage Finance | 1.5%Washington Federal, Inc. 91,125 3,121,031
Total Common Stocks
(Cost $169,897,416) 196,567,315
Total Investments | 96.9%(Cost $169,897,416) $ 196,567,315
Cash and Other Assets in Excess
of Liabilities | 3.1% 6,380,873
Net Assets | 100.0% $202,948,188
FairDescription Shares Value
FairDescription Shares Value
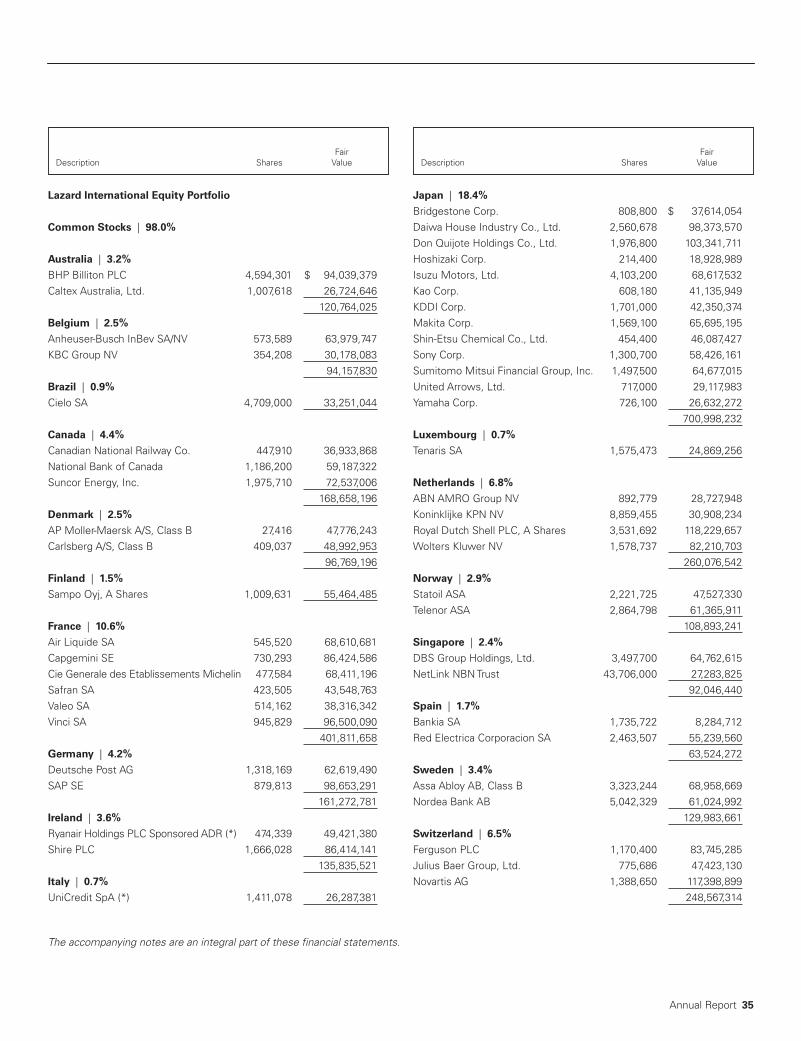
Annual Report 35
The accompanying notes are an integral part of these financial statements.
Lazard International Equity Portfolio
Common Stocks | 98.0%
Australia | 3.2%BHP Billiton PLC 4,594,301 $ 94,039,379Caltex Australia, Ltd. 1,007,618 26,724,646 120,764,025Belgium | 2.5%Anheuser- Busch InBev SA/NV 573,589 63,979,747KBC Group NV 354,208 30,178,083 94,157,830Brazil | 0.9%Cielo SA 4,709,000 33,251,044
Canada | 4.4%Canadian National Railway Co. 447,910 36,933,868National Bank of Canada 1,186,200 59,187,322Suncor Energy, Inc. 1,975,710 72,537,006 168,658,196Denmark | 2.5%AP Moller- Maersk A/S, Class B 27,416 47,776,243Carlsberg A/S, Class B 409,037 48,992,953 96,769,196Finland | 1.5%Sampo Oyj, A Shares 1,009,631 55,464,485
France | 10.6%Air Liquide SA 545,520 68,610,681Capgemini SE 730,293 86,424,586Cie Generale des Etablissements Michelin 477,584 68,411,196Safran SA 423,505 43,548,763Valeo SA 514,162 38,316,342Vinci SA 945,829 96,500,090 401,811,658Germany | 4.2%Deutsche Post AG 1,318,169 62,619,490SAP SE 879,813 98,653,291 161,272,781Ireland | 3.6%Ryanair Holdings PLC Sponsored ADR (*) 474,339 49,421,380Shire PLC 1,666,028 86,414,141 135,835,521Italy | 0.7%UniCredit SpA (*) 1,411,078 26,287,381
Japan | 18.4%Bridgestone Corp. 808,800 $ 37,614,054Daiwa House Industry Co., Ltd. 2,560,678 98,373,570Don Quijote Holdings Co., Ltd. 1,976,800 103,341,711Hoshizaki Corp. 214,400 18,928,989Isuzu Motors, Ltd. 4,103,200 68,617,532Kao Corp. 608,180 41,135,949KDDI Corp. 1,701,000 42,350,374Makita Corp. 1,569,100 65,695,195Shin- Etsu Chemical Co., Ltd. 454,400 46,087,427Sony Corp. 1,300,700 58,426,161Sumitomo Mitsui Financial Group, Inc. 1,497,500 64,677,015United Arrows, Ltd. 717,000 29,117,983Yamaha Corp. 726,100 26,632,272 700,998,232Luxembourg | 0.7%Tenaris SA 1,575,473 24,869,256
Netherlands | 6.8%ABN AMRO Group NV 892,779 28,727,948Koninklijke KPN NV 8,859,455 30,908,234Royal Dutch Shell PLC, A Shares 3,531,692 118,229,657Wolters Kluwer NV 1,578,737 82,210,703 260,076,542Norway | 2.9%Statoil ASA 2,221,725 47,527,330Telenor ASA 2,864,798 61,365,911 108,893,241Singapore | 2.4%DBS Group Holdings, Ltd. 3,497,700 64,762,615NetLink NBN Trust 43,706,000 27,283,825 92,046,440Spain | 1.7%Bankia SA 1,735,722 8,284,712Red Electrica Corporacion SA 2,463,507 55,239,560 63,524,272Sweden | 3.4%Assa Abloy AB, Class B 3,323,244 68,958,669Nordea Bank AB 5,042,329 61,024,992 129,983,661Switzerland | 6.5%Ferguson PLC 1,170,400 83,745,285Julius Baer Group, Ltd. 775,686 47,423,130Novartis AG 1,388,650 117,398,899 248,567,314
FairDescription Shares Value
FairDescription Shares Value

36 Annual Report
The accompanying notes are an integral part of these financial statements.
Lazard International Equity Portfolio (concluded)
Taiwan | 1.5%Taiwan Semiconductor Manufacturing Co., Ltd. Sponsored ADR 1,416,800 $ 56,176,120
Turkey | 1.1%Turkcell Iletisim Hizmetleri AS 10,074,715 41,141,803
United Kingdom | 14.5%British American Tobacco PLC 1,580,638 106,678,005BT Group PLC 7,611,863 27,870,361Diageo PLC 1,758,066 64,342,301Howden Joinery Group PLC 4,690,473 29,542,150Informa PLC 4,091,225 39,798,470Prudential PLC 5,194,160 133,542,729RELX PLC 3,326,248 77,926,428Unilever PLC 1,315,277 72,865,789 552,566,233United States | 4.0%Aon PLC 577,375 77,368,250Medtronic PLC 931,110 75,187,133 152,555,383Total Common Stocks
(Cost $3,150,106,680) 3,725,670,614
Short- Term Investments | 2.2%State Street Institutional Treasury Money Market Fund, Premier Class, 1.15% (7 day yield) (Cost $84,623,777) 84,623,777 $ 84,623,777
Total Investments | 100.2%(Cost $3,234,730,457) $3,810,294,391
Liabilities in Excess of Cash
and Other Assets | (0.2)% (6,274,037)
Net Assets | 100.0% $3,804,020,354
FairDescription Shares Value
FairDescription Shares Value

Annual Report 37
The accompanying notes are an integral part of these financial statements.
Lazard International Equity Select Portfolio
Common Stocks | 96.5%
Australia | 1.9%BHP Billiton, Ltd. 46,149 $ 1,062,270
Belgium | 1.7%Anheuser- Busch InBev SA/NV 8,600 959,268
Brazil | 3.1%BB Seguridade Participacoes SA 71,400 612,085Cia de Saneamento Basico do Estado de Sao Paulo 41,600 433,248
Cielo SA 97,040 685,216 1,730,549Canada | 2.6%Canadian National Railway Co. 6,900 568,962Suncor Energy, Inc. 23,900 877,474 1,446,436China | 3.6%Ping An Insurance (Group) Co. of China, Ltd., Class H 41,500 431,940
Tencent Holdings, Ltd. 31,000 1,602,544 2,034,484Denmark | 1.7%Carlsberg A/S, Class B 8,209 983,244
Finland | 2.0%Sampo Oyj, A Shares 21,105 1,159,412
France | 6.0%Cie Generale des Etablissements Michelin 5,531 792,284Safran SA 4,146 426,331Valeo SA 14,537 1,083,325Vinci SA 11,065 1,128,929 3,430,869Germany | 4.9%Continental AG 2,427 655,229Deutsche Post AG 13,154 624,880SAP SE 13,511 1,514,986 2,795,095India | 1.3%ICICI Bank, Ltd. Sponsored ADR 76,355 742,934
Indonesia | 1.7%PT Telekomunikasi Indonesia (Persero) Tbk Sponsored ADR 30,208 $ 973,302
Ireland | 3.1%Ryanair Holdings PLC Sponsored ADR (*) 6,382 664,941Shire PLC 21,510 1,115,688 1,780,629Japan | 13.0%Daiwa House Industry Co., Ltd. 39,400 1,513,630FANUC Corp. 1,900 456,492Kao Corp. 7,000 473,464KDDI Corp. 20,000 497,947Makita Corp. 25,500 1,067,636Ryohin Keikaku Co., Ltd. 3,600 1,120,879Sony Corp. 15,200 682,769Sumitomo Mitsui Financial Group, Inc. 21,076 910,272Tokyo Electron, Ltd. 3,800 680,686 7,403,775Netherlands | 5.1%ABN AMRO Group NV 15,394 495,350Royal Dutch Shell PLC, A Shares 37,683 1,256,687Wolters Kluwer NV 22,027 1,147,028 2,899,065Norway | 2.7%Statoil ASA 39,451 843,939Telenor ASA 33,353 714,444 1,558,383Philippines | 0.6%Alliance Global Group, Inc. (*) 1,100,900 352,384
Russia | 1.1%Yandex NV Class A (*) 19,355 633,876
Singapore | 1.7%DBS Group Holdings, Ltd. 51,800 959,117
South Africa | 2.1%Mr. Price Group, Ltd. 20,568 406,789Sanlam, Ltd. 112,165 788,102 1,194,891South Korea | 2.4%Samsung Electronics Co., Ltd. 565 1,342,341
Spain | 1.3%Red Electrica Corporacion SA 33,066 741,443
FairDescription Shares Value
FairDescription Shares Value
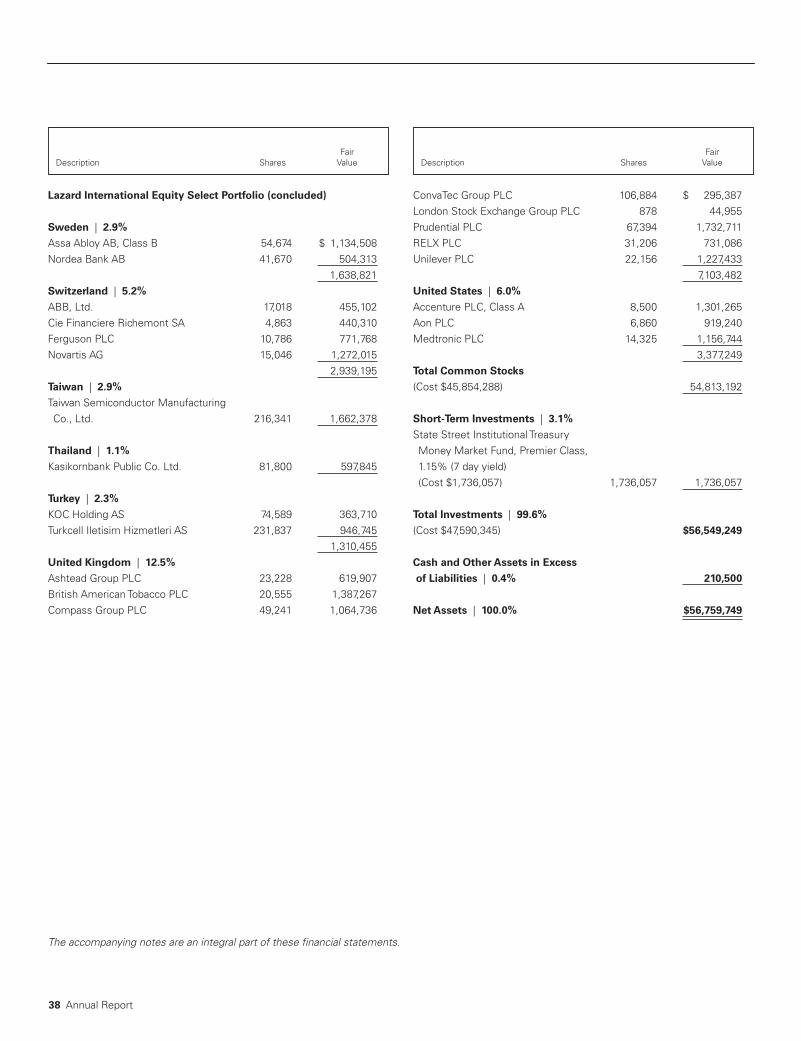
38 Annual Report
The accompanying notes are an integral part of these financial statements.
Lazard International Equity Select Portfolio (concluded)
Sweden | 2.9%Assa Abloy AB, Class B 54,674 $ 1,134,508Nordea Bank AB 41,670 504,313 1,638,821Switzerland | 5.2%ABB, Ltd. 17,018 455,102Cie Financiere Richemont SA 4,863 440,310Ferguson PLC 10,786 771,768Novartis AG 15,046 1,272,015 2,939,195Taiwan | 2.9%Taiwan Semiconductor Manufacturing Co., Ltd. 216,341 1,662,378
Thailand | 1.1%Kasikornbank Public Co. Ltd. 81,800 597,845
Turkey | 2.3%KOC Holding AS 74,589 363,710Turkcell Iletisim Hizmetleri AS 231,837 946,745 1,310,455United Kingdom | 12.5%Ashtead Group PLC 23,228 619,907British American Tobacco PLC 20,555 1,387,267Compass Group PLC 49,241 1,064,736
ConvaTec Group PLC 106,884 $ 295,387London Stock Exchange Group PLC 878 44,955Prudential PLC 67,394 1,732,711RELX PLC 31,206 731,086Unilever PLC 22,156 1,227,433 7,103,482United States | 6.0%Accenture PLC, Class A 8,500 1,301,265Aon PLC 6,860 919,240Medtronic PLC 14,325 1,156,744 3,377,249Total Common Stocks
(Cost $45,854,288) 54,813,192
Short- Term Investments | 3.1%State Street Institutional Treasury Money Market Fund, Premier Class, 1.15% (7 day yield) (Cost $1,736,057) 1,736,057 1,736,057
Total Investments | 99.6%(Cost $47,590,345) $56,549,249
Cash and Other Assets in Excess
of Liabilities | 0.4% 210,500
Net Assets | 100.0% $56,759,749
FairDescription Shares Value
FairDescription Shares Value
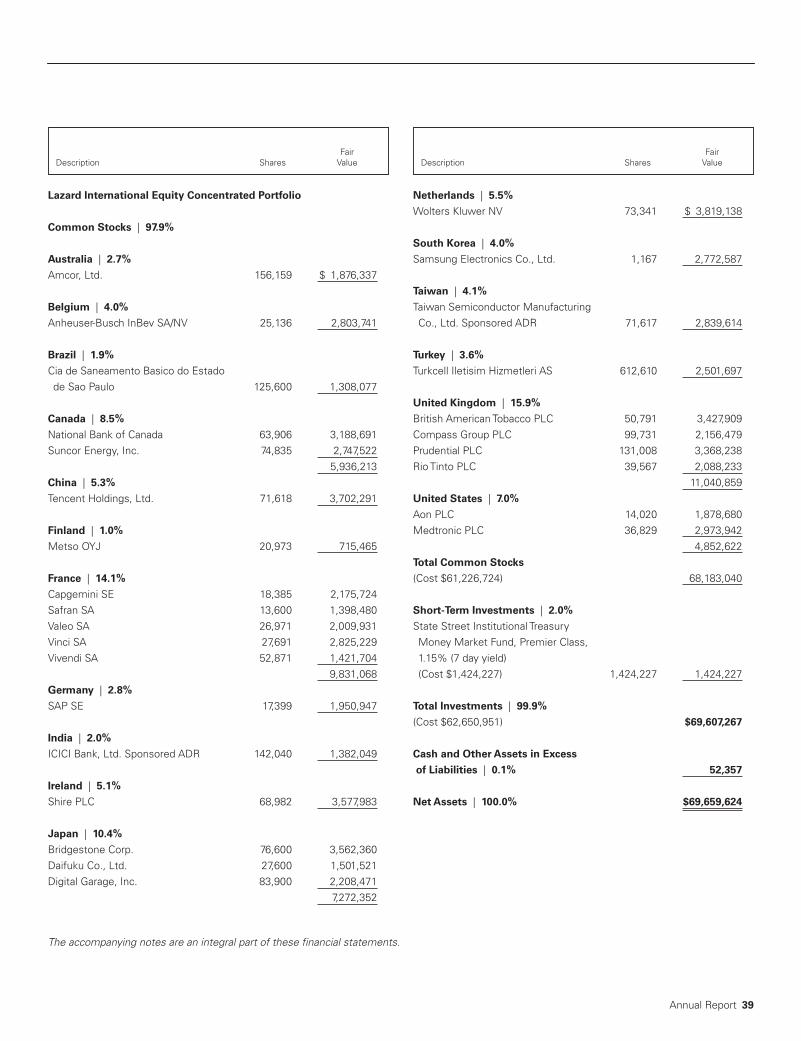
Annual Report 39
The accompanying notes are an integral part of these financial statements.
Lazard International Equity Concentrated Portfolio
Common Stocks | 97.9%
Australia | 2.7%Amcor, Ltd. 156,159 $ 1,876,337
Belgium | 4.0%Anheuser- Busch InBev SA/NV 25,136 2,803,741
Brazil | 1.9%Cia de Saneamento Basico do Estado de Sao Paulo 125,600 1,308,077
Canada | 8.5%National Bank of Canada 63,906 3,188,691Suncor Energy, Inc. 74,835 2,747,522 5,936,213China | 5.3%Tencent Holdings, Ltd. 71,618 3,702,291
Finland | 1.0%Metso OYJ 20,973 715,465
France | 14.1%Capgemini SE 18,385 2,175,724Safran SA 13,600 1,398,480Valeo SA 26,971 2,009,931Vinci SA 27,691 2,825,229Vivendi SA 52,871 1,421,704 9,831,068Germany | 2.8%SAP SE 17,399 1,950,947
India | 2.0%ICICI Bank, Ltd. Sponsored ADR 142,040 1,382,049
Ireland | 5.1%Shire PLC 68,982 3,577,983
Japan | 10.4%Bridgestone Corp. 76,600 3,562,360Daifuku Co., Ltd. 27,600 1,501,521Digital Garage, Inc. 83,900 2,208,471 7,272,352
Netherlands | 5.5%Wolters Kluwer NV 73,341 $ 3,819,138
South Korea | 4.0%Samsung Electronics Co., Ltd. 1,167 2,772,587
Taiwan | 4.1%Taiwan Semiconductor Manufacturing Co., Ltd. Sponsored ADR 71,617 2,839,614
Turkey | 3.6%Turkcell Iletisim Hizmetleri AS 612,610 2,501,697
United Kingdom | 15.9%British American Tobacco PLC 50,791 3,427,909Compass Group PLC 99,731 2,156,479Prudential PLC 131,008 3,368,238Rio Tinto PLC 39,567 2,088,233 11,040,859United States | 7.0%Aon PLC 14,020 1,878,680Medtronic PLC 36,829 2,973,942 4,852,622Total Common Stocks
(Cost $61,226,724) 68,183,040
Short- Term Investments | 2.0%State Street Institutional Treasury Money Market Fund, Premier Class, 1.15% (7 day yield) (Cost $1,424,227) 1,424,227 1,424,227
Total Investments | 99.9%(Cost $62,650,951) $69,607,267
Cash and Other Assets in Excess
of Liabilities | 0.1% 52,357
Net Assets | 100.0% $69,659,624
FairDescription Shares Value
FairDescription Shares Value

40 Annual Report
The accompanying notes are an integral part of these financial statements.
Lazard International Strategic Equity Portfolio
Common Stocks | 96.2%
Brazil | 0.8%Cielo SA 7,724,140 $ 54,541,456
Canada | 6.3%Bombardier, Inc., Class B (*) 38,037,400 91,689,198CAE, Inc. 5,766,270 107,114,085National Bank of Canada 2,602,620 129,861,835Suncor Energy, Inc. 3,458,318 126,970,068 455,635,186China | 3.5%Alibaba Group Holding, Ltd. Sponsored ADR (*) 453,000 78,110,790
Ping An Insurance (Group) Co. of China, Ltd., Class H 6,775,000 70,515,483
Tencent Holdings, Ltd. 1,997,600 103,265,897 251,892,170Denmark | 2.1%Carlsberg A/S, Class B 1,260,280 150,951,722
Finland | 4.0%Metso OYJ 1,128,248 38,488,631Sampo Oyj, A Shares 4,570,923 251,105,495 289,594,126France | 6.9%Faurecia 1,279,688 99,792,029Safran SA 1,094,718 112,569,189Television Francaise 1 3,792,028 55,752,409Ubisoft Entertainment SA (*) 693,012 53,322,969Vivendi SA 6,724,079 180,810,808 502,247,404Germany | 2.5%Fresenius SE & Co. KGaA 997,490 77,664,763KION Group AG 1,169,268 100,880,500 178,545,263India | 1.1%Housing Development Finance Corp., Ltd. 3,024,247 80,939,321
Indonesia | 0.1%PT Media Nusantara Citra Tbk 93,733,100 8,877,206
Ireland | 5.1%Bank of Ireland Group PLC (*) 12,429,973 $ 105,738,886Kerry Group PLC, Class A 713,662 80,035,599Shire PLC 3,559,861 184,644,153 370,418,638Italy | 0.9%UniCredit SpA (*) 3,690,177 68,745,377
Japan | 20.3%AEON Financial Service Co., Ltd. 4,965,900 115,323,961CyberAgent, Inc. 3,038,600 118,682,649Daiwa House Industry Co., Ltd. 5,106,800 196,187,942Don Quijote Holdings Co., Ltd. 4,831,700 252,588,095FANUC Corp. 685,000 164,577,208Hoshizaki Corp. 561,800 49,600,307Kao Corp. 1,531,700 103,600,798Makita Corp. 4,044,400 169,331,238Shimano, Inc. 689,100 96,956,682Tokyo Electron, Ltd. 842,600 150,933,272Yamaha Corp. 1,363,700 50,018,495 1,467,800,647Luxembourg | 1.0%ArcelorMittal (*) 2,263,704 73,310,509
Netherlands | 2.7%ABN AMRO Group NV 1,335,526 42,974,713Wolters Kluwer NV 2,984,966 155,438,273 198,412,986New Zealand | 1.0%Z Energy, Ltd. 12,721,365 68,888,309
Norway | 2.1%Statoil ASA 7,076,407 151,379,101
Philippines | 0.9%GT Capital Holdings, Inc. 2,511,845 65,015,552
Singapore | 1.9%DBS Group Holdings, Ltd. 7,514,000 139,127,509
Spain | 0.8%Bankia SA 12,469,125 59,515,933
Sweden | 2.7%Assa Abloy AB, Class B 5,386,236 111,766,595Hexagon AB, B Shares 1,654,511 82,746,028 194,512,623
FairDescription Shares Value
FairDescription Shares Value

Annual Report 41
The accompanying notes are an integral part of these financial statements.
Lazard International Strategic Equity Portfolio (concluded)
Switzerland | 4.9%Cie Financiere Richemont SA 1,203,412 $ 108,960,421Julius Baer Group, Ltd. 2,753,436 168,336,869Partners Group Holding AG 114,299 78,321,778 355,619,068Taiwan | 1.6%Taiwan Semiconductor Manufacturing Co., Ltd. 15,001,000 115,268,648
United Kingdom | 18.2%Ashtead Group PLC 3,457,676 92,278,155British American Tobacco PLC 3,627,086 244,793,746CNH Industrial NV 4,115,616 55,021,332Coca- Cola European Partners PLC 4,218,292 168,024,341Compass Group PLC 5,635,835 121,863,417Diageo PLC 5,147,626 188,394,578Informa PLC 19,554,440 190,220,972Prudential PLC 10,043,112 258,210,102 1,318,806,643
United States | 4.8%Accenture PLC, Class A 1,005,160 $ 153,879,944Aon PLC 894,440 119,854,960Medtronic PLC 875,900 70,728,925 344,463,829Total Common Stocks
(Cost $5,675,247,605) 6,964,509,226
Short- Term Investments | 4.1%State Street Institutional Treasury Money Market Fund, Premier Class, 1.15% (7 day yield) (Cost $294,877,528) 294,877,528 294,877,528
Total Investments | 100.3%(Cost $5,970,125,133) $7,259,386,754
Liabilities in Excess of Cash
and Other Assets | (0.3)% (20,958,086)
Net Assets | 100.0% $7,238,428,668
FairDescription Shares Value
FairDescription Shares Value
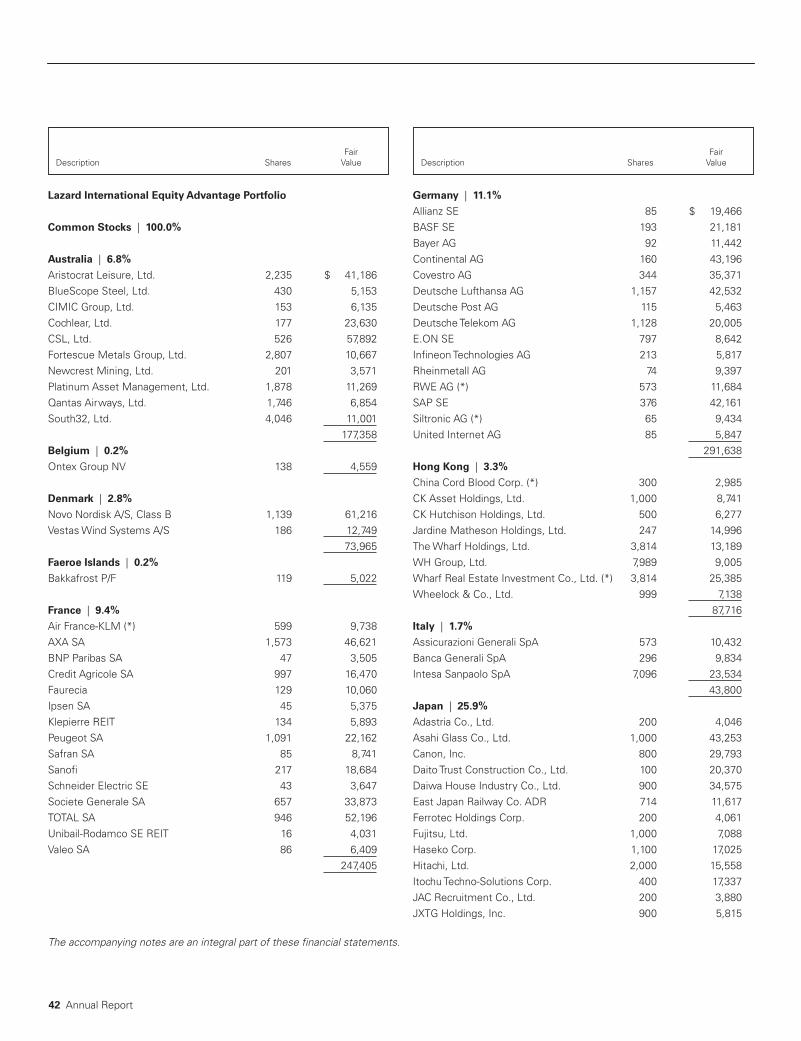
42 Annual Report
The accompanying notes are an integral part of these financial statements.
Lazard International Equity Advantage Portfolio
Common Stocks | 100.0%
Australia | 6.8%Aristocrat Leisure, Ltd. 2,235 $ 41,186BlueScope Steel, Ltd. 430 5,153CIMIC Group, Ltd. 153 6,135Cochlear, Ltd. 177 23,630CSL, Ltd. 526 57,892Fortescue Metals Group, Ltd. 2,807 10,667Newcrest Mining, Ltd. 201 3,571Platinum Asset Management, Ltd. 1,878 11,269Qantas Airways, Ltd. 1,746 6,854South32, Ltd. 4,046 11,001 177,358Belgium | 0.2%Ontex Group NV 138 4,559
Denmark | 2.8%Novo Nordisk A/S, Class B 1,139 61,216Vestas Wind Systems A/S 186 12,749 73,965Faeroe Islands | 0.2%Bakkafrost P/F 119 5,022
France | 9.4%Air France- KLM (*) 599 9,738AXA SA 1,573 46,621BNP Paribas SA 47 3,505Credit Agricole SA 997 16,470Faurecia 129 10,060Ipsen SA 45 5,375Klepierre REIT 134 5,893Peugeot SA 1,091 22,162Safran SA 85 8,741Sanofi 217 18,684Schneider Electric SE 43 3,647Societe Generale SA 657 33,873TOTAL SA 946 52,196Unibail- Rodamco SE REIT 16 4,031Valeo SA 86 6,409 247,405
Germany | 11.1%Allianz SE 85 $ 19,466BASF SE 193 21,181Bayer AG 92 11,442Continental AG 160 43,196Covestro AG 344 35,371Deutsche Lufthansa AG 1,157 42,532Deutsche Post AG 115 5,463Deutsche Telekom AG 1,128 20,005E.ON SE 797 8,642Infineon Technologies AG 213 5,817Rheinmetall AG 74 9,397RWE AG (*) 573 11,684SAP SE 376 42,161Siltronic AG (*) 65 9,434United Internet AG 85 5,847 291,638Hong Kong | 3.3%China Cord Blood Corp. (*) 300 2,985CK Asset Holdings, Ltd. 1,000 8,741CK Hutchison Holdings, Ltd. 500 6,277Jardine Matheson Holdings, Ltd. 247 14,996The Wharf Holdings, Ltd. 3,814 13,189WH Group, Ltd. 7,989 9,005Wharf Real Estate Investment Co., Ltd. (*) 3,814 25,385Wheelock & Co., Ltd. 999 7,138 87,716Italy | 1.7%Assicurazioni Generali SpA 573 10,432Banca Generali SpA 296 9,834Intesa Sanpaolo SpA 7,096 23,534 43,800Japan | 25.9%Adastria Co., Ltd. 200 4,046Asahi Glass Co., Ltd. 1,000 43,253Canon, Inc. 800 29,793Daito Trust Construction Co., Ltd. 100 20,370Daiwa House Industry Co., Ltd. 900 34,575East Japan Railway Co. ADR 714 11,617Ferrotec Holdings Corp. 200 4,061Fujitsu, Ltd. 1,000 7,088Haseko Corp. 1,100 17,025Hitachi, Ltd. 2,000 15,558Itochu Techno- Solutions Corp. 400 17,337JAC Recruitment Co., Ltd. 200 3,880JXTG Holdings, Inc. 900 5,815
FairDescription Shares Value
FairDescription Shares Value
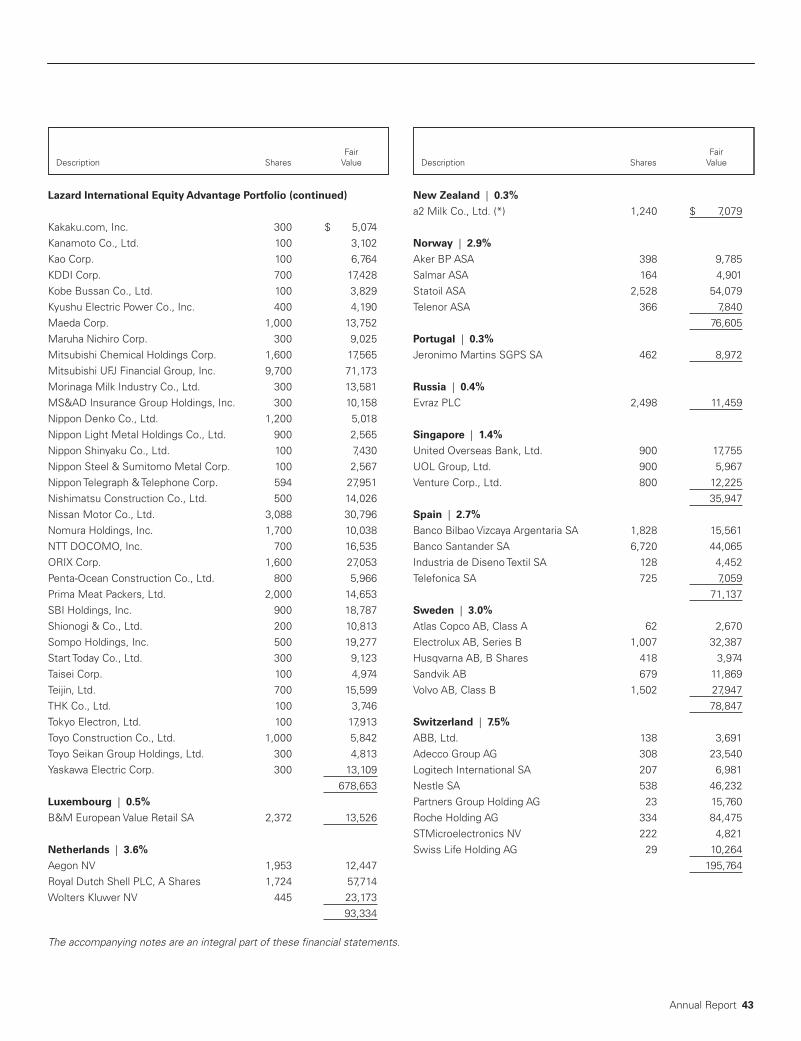
Annual Report 43
The accompanying notes are an integral part of these financial statements.
Lazard International Equity Advantage Portfolio (continued)
Kakaku.com, Inc. 300 $ 5,074Kanamoto Co., Ltd. 100 3,102Kao Corp. 100 6,764KDDI Corp. 700 17,428Kobe Bussan Co., Ltd. 100 3,829Kyushu Electric Power Co., Inc. 400 4,190Maeda Corp. 1,000 13,752Maruha Nichiro Corp. 300 9,025Mitsubishi Chemical Holdings Corp. 1,600 17,565Mitsubishi UFJ Financial Group, Inc. 9,700 71,173Morinaga Milk Industry Co., Ltd. 300 13,581MS&AD Insurance Group Holdings, Inc. 300 10,158Nippon Denko Co., Ltd. 1,200 5,018Nippon Light Metal Holdings Co., Ltd. 900 2,565Nippon Shinyaku Co., Ltd. 100 7,430Nippon Steel & Sumitomo Metal Corp. 100 2,567Nippon Telegraph & Telephone Corp. 594 27,951Nishimatsu Construction Co., Ltd. 500 14,026Nissan Motor Co., Ltd. 3,088 30,796Nomura Holdings, Inc. 1,700 10,038NTT DOCOMO, Inc. 700 16,535ORIX Corp. 1,600 27,053Penta- Ocean Construction Co., Ltd. 800 5,966Prima Meat Packers, Ltd. 2,000 14,653SBI Holdings, Inc. 900 18,787Shionogi & Co., Ltd. 200 10,813Sompo Holdings, Inc. 500 19,277Start Today Co., Ltd. 300 9,123Taisei Corp. 100 4,974Teijin, Ltd. 700 15,599THK Co., Ltd. 100 3,746Tokyo Electron, Ltd. 100 17,913Toyo Construction Co., Ltd. 1,000 5,842Toyo Seikan Group Holdings, Ltd. 300 4,813Yaskawa Electric Corp. 300 13,109 678,653Luxembourg | 0.5%B&M European Value Retail SA 2,372 13,526
Netherlands | 3.6%Aegon NV 1,953 12,447Royal Dutch Shell PLC, A Shares 1,724 57,714Wolters Kluwer NV 445 23,173 93,334
New Zealand | 0.3%a2 Milk Co., Ltd. (*) 1,240 $ 7,079
Norway | 2.9%Aker BP ASA 398 9,785Salmar ASA 164 4,901Statoil ASA 2,528 54,079Telenor ASA 366 7,840 76,605Portugal | 0.3%Jeronimo Martins SGPS SA 462 8,972
Russia | 0.4%Evraz PLC 2,498 11,459
Singapore | 1.4%United Overseas Bank, Ltd. 900 17,755UOL Group, Ltd. 900 5,967Venture Corp., Ltd. 800 12,225 35,947Spain | 2.7%Banco Bilbao Vizcaya Argentaria SA 1,828 15,561Banco Santander SA 6,720 44,065Industria de Diseno Textil SA 128 4,452Telefonica SA 725 7,059 71,137Sweden | 3.0%Atlas Copco AB, Class A 62 2,670Electrolux AB, Series B 1,007 32,387Husqvarna AB, B Shares 418 3,974Sandvik AB 679 11,869Volvo AB, Class B 1,502 27,947 78,847Switzerland | 7.5%ABB, Ltd. 138 3,691Adecco Group AG 308 23,540Logitech International SA 207 6,981Nestle SA 538 46,232Partners Group Holding AG 23 15,760Roche Holding AG 334 84,475STMicroelectronics NV 222 4,821Swiss Life Holding AG 29 10,264 195,764
FairDescription Shares Value
FairDescription Shares Value

44 Annual Report
The accompanying notes are an integral part of these financial statements.
FairDescription Shares Value
FairDescription Shares Value
Lazard International Equity Advantage Portfolio (concluded)
United Kingdom | 14.9%Admiral Group PLC 646 $ 17,421Ashtead Group PLC 487 12,997Associated British Foods PLC 379 14,408AstraZeneca PLC 377 25,871Centrica PLC 5,040 9,332Crest Nicholson Holdings PLC 672 4,921Fevertree Drinks PLC 384 11,826Hargreaves Lansdown PLC 303 7,371Howden Joinery Group PLC 1,267 7,980Imperial Brands PLC 96 4,103International Consolidated Airlines Group SA 3,306 28,663
IQE PLC (*) 2,256 4,140Lloyds Banking Group PLC 34,228 31,342Persimmon PLC 417 15,399Redrow PLC 718 6,360Royal Bank of Scotland Group PLC (*) 7,833 29,216Smith & Nephew PLC 996 17,234SSE PLC 1,798 32,031SSP Group PLC 1,179 10,833Taylor Wimpey PLC 4,026 11,215
Unilever NV 1,317 $ 73,995Vodafone Group PLC 3,173 10,024Whitbread PLC 103 5,563 392,245United States | 1.1%Carnival PLC 263 17,292ICON PLC (*) 100 11,215 28,507Total Common Stocks
(Cost $2,289,438) 2,623,538
Short- Term Investments | 0.7%State Street Institutional Treasury Money Market Fund, Premier Class, 1.15% (7 day yield) (Cost $19,209) 19,209 19,209
Total Investments | 100.7%(Cost $2,308,647) $2,642,747
Liabilities in Excess of Cash
and Other Assets | (0.7)% (18,831)
Net Assets | 100.0% $2,623,916

Annual Report 45
The accompanying notes are an integral part of these financial statements.
Lazard International Small Cap Equity Portfolio
Common Stocks | 96.2%
Australia | 5.4%carsales.com, Ltd. 83,923 $ 946,169Hansen Technologies, Ltd. 269,217 828,635MYOB Group, Ltd. 287,194 810,261Pact Group Holdings, Ltd. 189,493 838,148SpeedCast International, Ltd. 258,082 1,077,403 4,500,616Belgium | 1.5%Kinepolis Group NV 18,912 1,262,793
Canada | 3.9%Alaris Royalty Corp. 30,300 498,251Altus Group, Ltd. 42,165 1,238,786StorageVault Canada, Inc. 361,500 756,360The Descartes Systems Group, Inc. (*) 26,100 742,095 3,235,492Denmark | 0.7%Dfds A/S 11,787 628,723
France | 1.3%Chargeurs SA 35,090 1,065,184
Germany | 9.2%Aroundtown SA 220,282 1,696,613AURELIUS Equity Opportunities SE & Co. KGaA 15,410 1,053,320
CompuGroup Medical SE 19,832 1,298,552Corestate Capital Holding SA 15,305 980,349Duerr AG 6,539 832,912Norma Group SE 14,495 967,864PATRIZIA Immobilien AG (*) 37,791 873,408 7,703,018Hong Kong | 0.7%Tongda Group Holdings, Ltd. 2,320,000 593,144
Ireland | 2.7%Dalata Hotel Group PLC (*) 137,832 1,041,007Glenveagh Properties PLC 347,275 490,849Irish Continental Group PLC 105,884 733,195 2,265,051
Israel | 1.9%Orbotech, Ltd. (*) 14,600 $ 733,504Taptica international, Ltd. 136,577 857,178 1,590,682Italy | 2.4%Cerved Information Solutions SpA 89,922 1,141,977Ei Towers SpA 13,902 891,726 2,033,703Japan | 26.8%ABC- Mart, Inc. 11,500 660,082Ai Holdings Corp. 32,360 782,525Anicom Holdings, Inc. 31,800 1,024,994Ariake Japan Co., Ltd. 9,700 827,516CyberAgent, Inc. 23,100 902,247Daikyonishikawa Corp. 62,500 1,012,040Dip Corp. 35,100 907,440Financial Products Group Co., Ltd. 100,537 1,219,673GMO internet, Inc. 67,600 1,144,623Iriso Electronics Co., Ltd. 15,982 953,526Jafco Co., Ltd. 22,000 1,268,283Macromill, Inc. 27,900 665,940Nissei ASB Machine Co., Ltd. 27,200 1,651,444Open House Co., Ltd. 18,100 971,988Persol Holdings Co., Ltd. 44,500 1,115,670Sanwa Holdings Corp. 86,000 1,184,188Seria Co., Ltd. 14,700 884,878Skylark Co., Ltd. 48,225 685,366TechnoPro Holdings, Inc. 22,845 1,241,025Toridoll Holdings Corp. 35,100 1,307,833USS Co., Ltd. 47,100 996,406Zenkoku Hosho Co., Ltd. 23,142 996,852 22,404,539Luxembourg | 1.5%Stabilus SA 14,212 1,278,418
Netherlands | 1.0%Aalberts Industries NV 17,460 886,523
New Zealand | 0.9%Z Energy, Ltd. 134,850 730,235
Portugal | 0.8%NOS SGPS SA 107,788 708,715
FairDescription Shares Value
FairDescription Shares Value
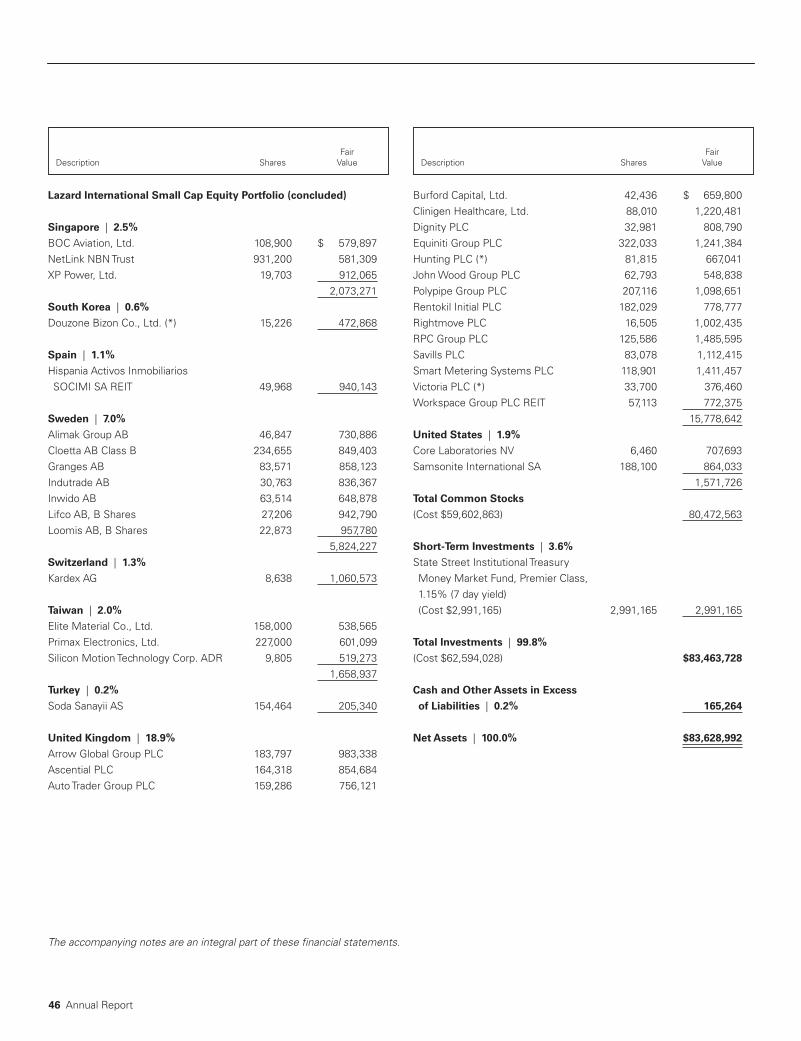
46 Annual Report
The accompanying notes are an integral part of these financial statements.
Lazard International Small Cap Equity Portfolio (concluded)
Singapore | 2.5%BOC Aviation, Ltd. 108,900 $ 579,897NetLink NBN Trust 931,200 581,309XP Power, Ltd. 19,703 912,065 2,073,271South Korea | 0.6%Douzone Bizon Co., Ltd. (*) 15,226 472,868
Spain | 1.1%Hispania Activos Inmobiliarios SOCIMI SA REIT 49,968 940,143
Sweden | 7.0%Alimak Group AB 46,847 730,886Cloetta AB Class B 234,655 849,403Granges AB 83,571 858,123Indutrade AB 30,763 836,367Inwido AB 63,514 648,878Lifco AB, B Shares 27,206 942,790Loomis AB, B Shares 22,873 957,780 5,824,227Switzerland | 1.3%Kardex AG 8,638 1,060,573
Taiwan | 2.0%Elite Material Co., Ltd. 158,000 538,565Primax Electronics, Ltd. 227,000 601,099Silicon Motion Technology Corp. ADR 9,805 519,273 1,658,937Turkey | 0.2%Soda Sanayii AS 154,464 205,340
United Kingdom | 18.9%Arrow Global Group PLC 183,797 983,338Ascential PLC 164,318 854,684Auto Trader Group PLC 159,286 756,121
Burford Capital, Ltd. 42,436 $ 659,800Clinigen Healthcare, Ltd. 88,010 1,220,481Dignity PLC 32,981 808,790Equiniti Group PLC 322,033 1,241,384Hunting PLC (*) 81,815 667,041John Wood Group PLC 62,793 548,838Polypipe Group PLC 207,116 1,098,651Rentokil Initial PLC 182,029 778,777Rightmove PLC 16,505 1,002,435RPC Group PLC 125,586 1,485,595Savills PLC 83,078 1,112,415Smart Metering Systems PLC 118,901 1,411,457Victoria PLC (*) 33,700 376,460Workspace Group PLC REIT 57,113 772,375 15,778,642United States | 1.9%Core Laboratories NV 6,460 707,693Samsonite International SA 188,100 864,033 1,571,726Total Common Stocks
(Cost $59,602,863) 80,472,563
Short- Term Investments | 3.6%State Street Institutional Treasury Money Market Fund, Premier Class, 1.15% (7 day yield) (Cost $2,991,165) 2,991,165 2,991,165
Total Investments | 99.8%(Cost $62,594,028) $83,463,728
Cash and Other Assets in Excess
of Liabilities | 0.2% 165,264
Net Assets | 100.0% $83,628,992
FairDescription Shares Value
FairDescription Shares Value

Annual Report 47
The accompanying notes are an integral part of these financial statements.
Lazard Equity Franchise Portfolio
Common Stocks | 93.9%
Australia | 3.9%Computershare, Ltd. 17,571 $ 223,321
France | 2.5%Societe BIC SA 1,265 139,101
Italy | 6.8%Atlantia SpA 6,684 210,841Terna SpA 30,307 175,989 386,830Japan | 2.0%Miraca Holdings, Inc. 2,700 115,645
Luxembourg | 4.9%SES SA (France) 17,779 277,048
United Kingdom | 2.0%United Utilities Group PLC 10,258 114,811
United States | 71.8%Alphabet, Inc., Class C (*) 215 224,976Cisco Systems, Inc. 6,900 264,270Express Scripts Holding Co. (*) 4,059 302,964H&R Block, Inc. 9,700 254,334Intel Corp. 2,552 117,800International Game Technology PLC 12,290 325,808
MasterCard, Inc., Class A 708 $ 107,163McKesson Corp. 1,495 233,145Medtronic PLC 3,000 242,250Microsoft Corp. 2,478 211,968Monsanto Co. 1,700 198,526Nielsen Holdings PLC 5,831 212,249Omnicom Group, Inc. 3,011 219,291Oracle Corp. 5,250 248,220QUALCOMM, Inc. 4,100 262,482Stericycle, Inc. (*) 4,985 338,930Tapestry, Inc. 2,500 110,575Visa, Inc., Class A 1,000 114,020WW Grainger, Inc. 371 87,649 4,076,620Total Common Stocks
(Cost $5,168,748) 5,333,376
Short- Term Investments | 3.2%State Street Institutional Treasury Money Market Fund, Premier Class, 1.15% (7 day yield) (Cost $180,289) 180,289 180,289
Total Investments | 97.1%(Cost $5,349,037) $5,513,665
Cash and Other Assets in Excess
of Liabilities | 2.9% 162,848
Net Assets | 100.0% $5,676,513
FairDescription Shares Value
FairDescription Shares Value
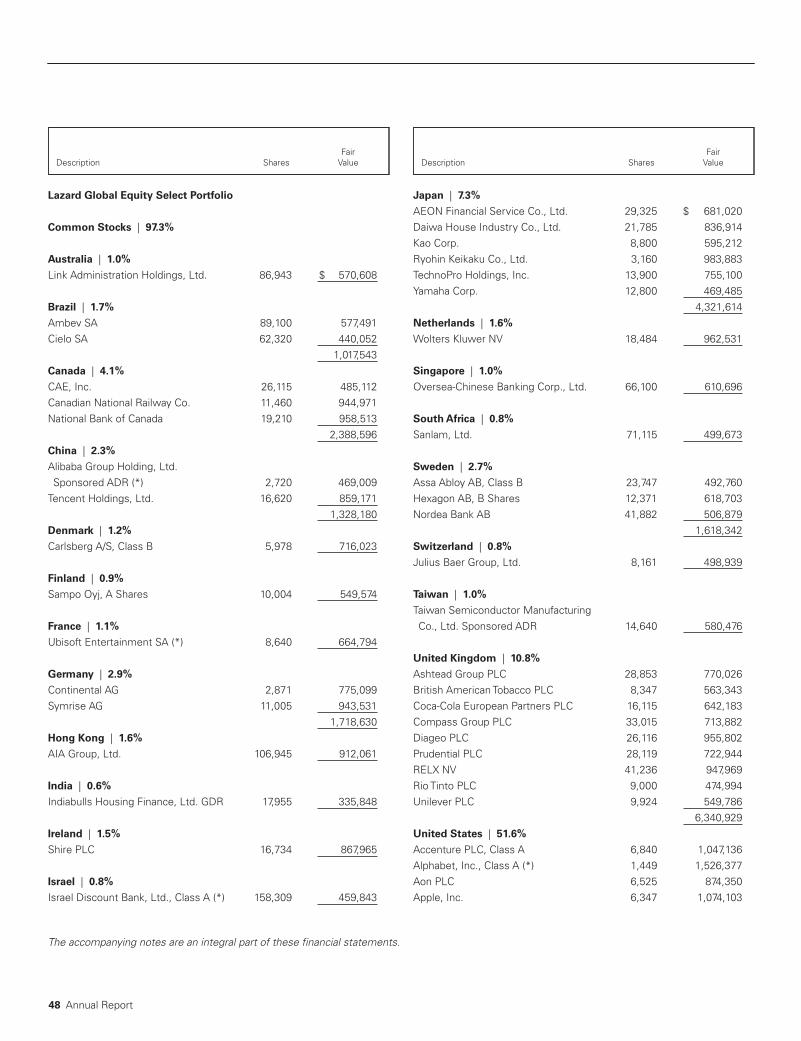
48 Annual Report
The accompanying notes are an integral part of these financial statements.
Lazard Global Equity Select Portfolio
Common Stocks | 97.3%
Australia | 1.0%Link Administration Holdings, Ltd. 86,943 $ 570,608
Brazil | 1.7%Ambev SA 89,100 577,491Cielo SA 62,320 440,052 1,017,543Canada | 4.1%CAE, Inc. 26,115 485,112Canadian National Railway Co. 11,460 944,971National Bank of Canada 19,210 958,513 2,388,596China | 2.3%Alibaba Group Holding, Ltd. Sponsored ADR (*) 2,720 469,009
Tencent Holdings, Ltd. 16,620 859,171 1,328,180Denmark | 1.2%Carlsberg A/S, Class B 5,978 716,023
Finland | 0.9%Sampo Oyj, A Shares 10,004 549,574
France | 1.1%Ubisoft Entertainment SA (*) 8,640 664,794
Germany | 2.9%Continental AG 2,871 775,099Symrise AG 11,005 943,531 1,718,630Hong Kong | 1.6%AIA Group, Ltd. 106,945 912,061
India | 0.6%Indiabulls Housing Finance, Ltd. GDR 17,955 335,848
Ireland | 1.5%Shire PLC 16,734 867,965
Israel | 0.8%Israel Discount Bank, Ltd., Class A (*) 158,309 459,843
Japan | 7.3%AEON Financial Service Co., Ltd. 29,325 $ 681,020Daiwa House Industry Co., Ltd. 21,785 836,914Kao Corp. 8,800 595,212Ryohin Keikaku Co., Ltd. 3,160 983,883TechnoPro Holdings, Inc. 13,900 755,100Yamaha Corp. 12,800 469,485 4,321,614Netherlands | 1.6%Wolters Kluwer NV 18,484 962,531
Singapore | 1.0%Oversea- Chinese Banking Corp., Ltd. 66,100 610,696
South Africa | 0.8%Sanlam, Ltd. 71,115 499,673
Sweden | 2.7%Assa Abloy AB, Class B 23,747 492,760Hexagon AB, B Shares 12,371 618,703Nordea Bank AB 41,882 506,879 1,618,342Switzerland | 0.8%Julius Baer Group, Ltd. 8,161 498,939
Taiwan | 1.0%Taiwan Semiconductor Manufacturing Co., Ltd. Sponsored ADR 14,640 580,476
United Kingdom | 10.8%Ashtead Group PLC 28,853 770,026British American Tobacco PLC 8,347 563,343Coca- Cola European Partners PLC 16,115 642,183Compass Group PLC 33,015 713,882Diageo PLC 26,116 955,802Prudential PLC 28,119 722,944RELX NV 41,236 947,969Rio Tinto PLC 9,000 474,994Unilever PLC 9,924 549,786 6,340,929United States | 51.6%Accenture PLC, Class A 6,840 1,047,136Alphabet, Inc., Class A (*) 1,449 1,526,377Aon PLC 6,525 874,350Apple, Inc. 6,347 1,074,103
FairDescription Shares Value
FairDescription Shares Value

Annual Report 49
The accompanying notes are an integral part of these financial statements.
Lazard Global Equity Select Portfolio (concluded)
Applied Materials, Inc. 7,260 $ 371,131AutoZone, Inc. (*) 889 632,408Biogen, Inc. (*) 2,295 731,118Cisco Systems, Inc. 16,750 641,525Citigroup, Inc. 12,810 953,192Comerica, Inc. 6,970 605,066Commerce Bancshares, Inc. 7,023 392,136Crown Holdings, Inc. (*) 9,220 518,625DXC Technology Co. 5,355 508,190Eaton Corp. PLC 7,750 612,327eBay, Inc. (*) 8,220 310,223Five Below, Inc. (*) 7,865 521,607Honeywell International, Inc. 6,893 1,057,110Intercontinental Exchange, Inc. 14,320 1,010,419IQVIA Holdings, Inc. (*) 8,530 835,087Johnson Controls International PLC 15,700 598,327Medtronic PLC 8,025 648,019Microsoft Corp. 14,940 1,277,968Molson Coors Brewing Co., Class B 7,574 621,598Monsanto Co. 4,680 546,530Motorola Solutions, Inc. 6,160 556,494Rockwell Automation, Inc. 4,795 941,498S&P Global, Inc. 5,755 974,897Schlumberger, Ltd. 11,826 796,954Snap- on, Inc. 2,855 497,627
Starbucks Corp. 5,175 $ 297,200The Charles Schwab Corp. 17,815 915,157The Coca- Cola Co. 28,685 1,316,068The J.M. Smucker Co. 5,350 664,684Thermo Fisher Scientific, Inc. 4,450 844,966United Technologies Corp. 6,619 844,386Vantiv, Inc., Class A (*) 15,205 1,118,328Visa, Inc., Class A 8,408 958,680Welbilt, Inc. (*) 22,810 536,263Zoetis, Inc. 16,537 1,191,325 30,369,099Total Common Stocks
(Cost $47,779,556) 57,331,964
Short- Term Investments | 3.1%State Street Institutional Treasury Money Market Fund, Premier Class, 1.15% (7 day yield) (Cost $1,831,358) 1,831,358 1,831,358
Total Investments | 100.4%(Cost $49,610,914) $59,163,322
Liabilities in Excess of Cash and
Other Assets | (0.4)% (250,878)
Net Assets | 100.0% $58,912,444
FairDescription Shares Value
FairDescription Shares Value

50 Annual Report
The accompanying notes are an integral part of these financial statements.
Lazard Global Strategic Equity Portfolio
Common Stocks | 99.3%
Canada | 1.3%Toromont Industries, Ltd. 856 $ 37,522
China | 2.6%Alibaba Group Holding, Ltd. Sponsored ADR (*) 434 74,835
Denmark | 1.8%AP Moller- Maersk A/S, Class B 13 22,654Carlsberg A/S, Class B 242 28,986 51,640Finland | 2.1%Sampo Oyj, A Shares 1,130 62,077
France | 4.2%Ubisoft Entertainment SA (*) 816 62,786Vivendi SA 2,240 60,234 123,020Germany | 2.1%OSRAM Licht AG 372 33,306Siemens AG 199 27,611 60,917Greece | 0.0%OPAP SA 12 151
Hong Kong | 3.8%AIA Group, Ltd. 7,200 61,404Techtronic Industries Co., Ltd. 7,500 48,884 110,288Indonesia | 0.3%PT Media Nusantara Citra Tbk 94,600 8,959
Ireland | 1.7%Shire PLC 968 50,209
Israel | 1.5%Israel Discount Bank, Ltd., Class A (*) 14,913 43,318
Japan | 6.2%Daiwa House Industry Co., Ltd. 1,800 $ 69,150Don Quijote Holdings Co., Ltd. 800 41,822TechnoPro Holdings, Inc. 600 32,594Tokyo Electron, Ltd. 200 35,826 179,392Netherlands | 1.0%ABN AMRO Group NV 863 27,770
New Zealand | 1.0%Trade Me Group, Ltd. 8,312 28,568
Singapore | 0.7%NetLink NBN Trust 34,100 21,287
South Africa | 3.9%Naspers, Ltd., N Shares 243 67,707PSG Group, Ltd. 711 15,514Sanlam, Ltd. 4,364 30,663 113,884Switzerland | 1.5%Partners Group Holding AG 62 42,485
Taiwan | 2.0%Taiwan Semiconductor Manufacturing Co., Ltd. Sponsored ADR 1,431 56,739
United Kingdom | 10.1%British American Tobacco PLC 1,180 79,639Coca- Cola European Partners PLC 1,400 55,765Dignity PLC 1,102 27,024Informa PLC 6,589 64,096London Stock Exchange Group PLC 582 29,800Prudential PLC 1,411 36,277 292,601United States | 51.5%Accenture PLC, Class A 428 65,523Activision Blizzard, Inc. 921 58,318Alphabet, Inc., Class A (*) 123 129,568Aon PLC 473 63,382Bank of America Corp. 2,041 60,250Biogen, Inc. (*) 180 57,343
FairDescription Shares Value
FairDescription Shares Value
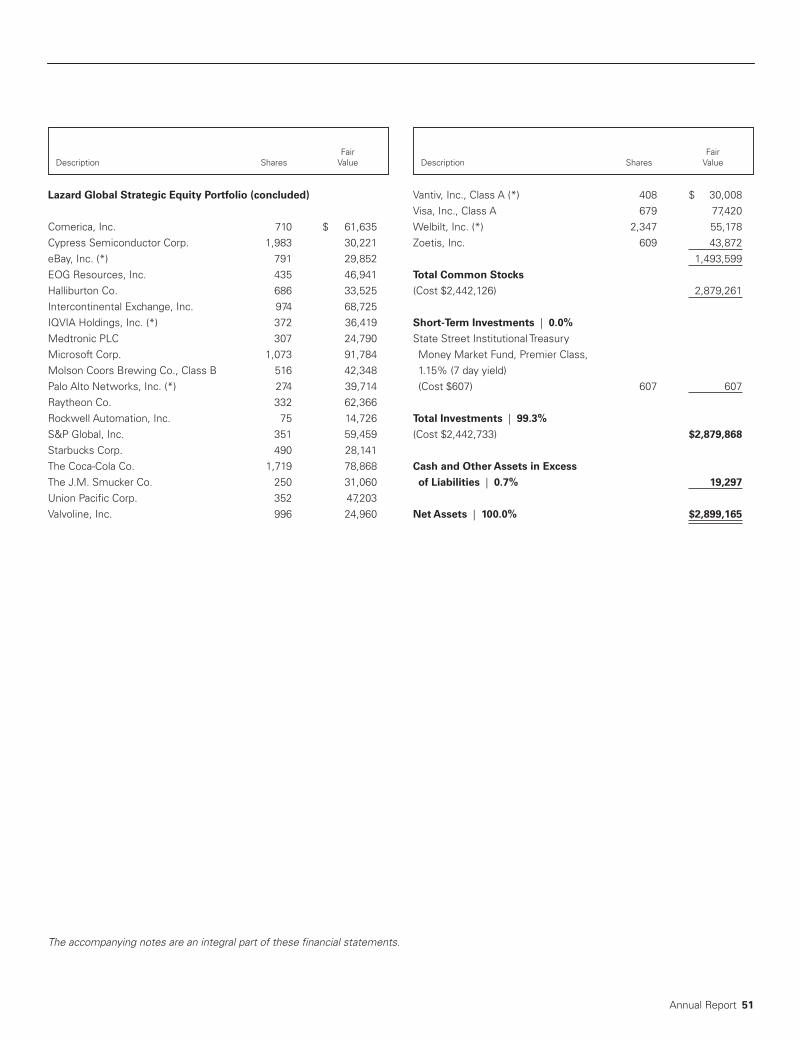
Annual Report 51
The accompanying notes are an integral part of these financial statements.
Lazard Global Strategic Equity Portfolio (concluded)
Comerica, Inc. 710 $ 61,635Cypress Semiconductor Corp. 1,983 30,221eBay, Inc. (*) 791 29,852EOG Resources, Inc. 435 46,941Halliburton Co. 686 33,525Intercontinental Exchange, Inc. 974 68,725IQVIA Holdings, Inc. (*) 372 36,419Medtronic PLC 307 24,790Microsoft Corp. 1,073 91,784Molson Coors Brewing Co., Class B 516 42,348Palo Alto Networks, Inc. (*) 274 39,714Raytheon Co. 332 62,366Rockwell Automation, Inc. 75 14,726S&P Global, Inc. 351 59,459Starbucks Corp. 490 28,141The Coca- Cola Co. 1,719 78,868The J.M. Smucker Co. 250 31,060Union Pacific Corp. 352 47,203Valvoline, Inc. 996 24,960
Vantiv, Inc., Class A (*) 408 $ 30,008Visa, Inc., Class A 679 77,420Welbilt, Inc. (*) 2,347 55,178Zoetis, Inc. 609 43,872 1,493,599Total Common Stocks
(Cost $2,442,126) 2,879,261
Short- Term Investments | 0.0%State Street Institutional Treasury Money Market Fund, Premier Class, 1.15% (7 day yield) (Cost $607) 607 607
Total Investments | 99.3%(Cost $2,442,733) $2,879,868
Cash and Other Assets in Excess
of Liabilities | 0.7% 19,297
Net Assets | 100.0% $2,899,165
FairDescription Shares Value
FairDescription Shares Value

52 Annual Report
The accompanying notes are an integral part of these financial statements.
Lazard Managed Equity Volatility Portfolio
Common Stocks | 96.1%
Australia | 6.1%AGL Energy, Ltd. 605 $ 11,482Aristocrat Leisure, Ltd. 1,650 30,406Cochlear, Ltd. 182 24,297Computershare, Ltd. 956 12,150CSL, Ltd. 495 54,480Investa Office Fund REIT 2,906 10,309Newcrest Mining, Ltd. 1,087 19,314Platinum Asset Management, Ltd. 1,217 7,303Qantas Airways, Ltd. 3,392 13,316Sandfire Resources NL 2,040 10,960Stockland REIT 14,462 50,585The Star Entertainment Group, Ltd. 2,308 10,912Woodside Petroleum, Ltd. 726 18,764 274,278Belgium | 0.3%Proximus SADP 436 14,311
Canada | 7.0%Alimentation Couche- Tard, Inc., Class B 361 18,837ARC Resources, Ltd. 730 8,566BCE, Inc. 273 13,114Canadian Imperial Bank of Commerce 96 9,359CI Financial Corp. 1,086 25,720Colliers International Group, Inc. 225 13,580Crescent Point Energy Corp. 1,262 9,618Detour Gold Corp. (*) 976 11,476Dollarama, Inc. 166 20,740Husky Energy, Inc. (*) 2,441 34,469IAMGOLD Corp. (*) 1,909 11,132Kirkland Lake Gold, Ltd. 588 9,014Metro, Inc. 325 10,407Royal Bank of Canada 242 19,762Suncor Energy, Inc. 1,132 41,561The Toronto- Dominion Bank 206 12,070Thomson Reuters Corp. 1,066 46,465 315,890Denmark | 1.2%Danske Bank A/S 291 11,313Jyske Bank A/S 219 12,428Novo Nordisk A/S, Class B 535 28,754 52,495
France | 0.7%Air France- KLM (*) 787 $ 12,795TOTAL SA 364 20,084 32,879Germany | 1.2%Covestro AG 132 13,573Deutsche Lufthansa AG 797 29,298Rheinmetall AG 96 12,190 55,061Hong Kong | 2.6%CK Asset Holdings, Ltd. 1,000 8,741Jardine Matheson Holdings, Ltd. 100 6,071Kerry Properties, Ltd. 1,500 6,748Sun Hung Kai Properties, Ltd. 1,000 16,658Swire Pacific, Ltd., Class A 1,000 9,256Techtronic Industries Co., Ltd. 2,500 16,294The Wharf Holdings, Ltd. 3,000 10,374Wharf Real Estate Investment Co., Ltd. (*) 1,959 13,038Wheelock & Co., Ltd. 2,000 14,290Yue Yuen Industrial Holdings, Ltd. 4,000 15,696 117,166Israel | 0.5%Israel Discount Bank, Ltd., Class A (*) 3,335 9,687Nice, Ltd. 115 10,497 20,184Japan | 10.8%Amano Corp. 500 13,079ANA Holdings, Inc. 200 8,347Asahi Glass Co., Ltd. 300 12,976Asahi Kasei Corp. 1,300 16,747Central Japan Railway Co. 100 17,896Daito Trust Construction Co., Ltd. 100 20,370Daiwa House Industry Co., Ltd. 500 19,209East Japan Railway Co. 200 19,498Kaken Pharmaceutical Co., Ltd. 200 10,322Kamigumi Co., Ltd. 700 15,471Kao Corp. 200 13,528KDDI Corp. 600 14,938Kuraray Co., Ltd. 500 9,437Maeda Corp. 1,000 13,752Maruha Nichiro Corp. 300 9,025Megmilk Snow Brand Co., Ltd. 400 11,824Morinaga Milk Industry Co., Ltd. 200 9,054MS&AD Insurance Group Holdings, Inc. 300 10,158Nagoya Railroad Co., Ltd. 400 10,067Nichirei Corp. 500 13,808Nippon Telegraph & Telephone Corp. 300 14,117
FairDescription Shares Value
FairDescription Shares Value
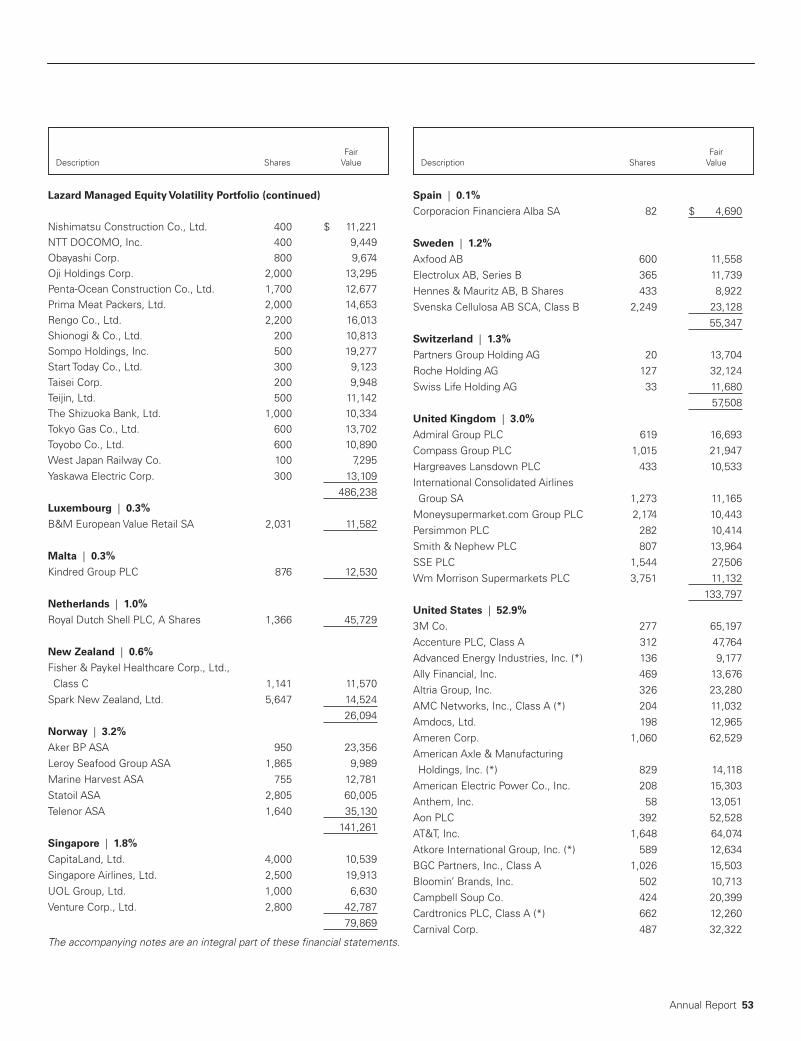
Annual Report 53
The accompanying notes are an integral part of these financial statements.
Lazard Managed Equity Volatility Portfolio (continued)
Nishimatsu Construction Co., Ltd. 400 $ 11,221NTT DOCOMO, Inc. 400 9,449Obayashi Corp. 800 9,674Oji Holdings Corp. 2,000 13,295Penta- Ocean Construction Co., Ltd. 1,700 12,677Prima Meat Packers, Ltd. 2,000 14,653Rengo Co., Ltd. 2,200 16,013Shionogi & Co., Ltd. 200 10,813Sompo Holdings, Inc. 500 19,277Start Today Co., Ltd. 300 9,123Taisei Corp. 200 9,948Teijin, Ltd. 500 11,142The Shizuoka Bank, Ltd. 1,000 10,334Tokyo Gas Co., Ltd. 600 13,702Toyobo Co., Ltd. 600 10,890West Japan Railway Co. 100 7,295Yaskawa Electric Corp. 300 13,109 486,238Luxembourg | 0.3%B&M European Value Retail SA 2,031 11,582
Malta | 0.3%Kindred Group PLC 876 12,530
Netherlands | 1.0%Royal Dutch Shell PLC, A Shares 1,366 45,729
New Zealand | 0.6%Fisher & Paykel Healthcare Corp., Ltd., Class C 1,141 11,570
Spark New Zealand, Ltd. 5,647 14,524 26,094Norway | 3.2%Aker BP ASA 950 23,356Leroy Seafood Group ASA 1,865 9,989Marine Harvest ASA 755 12,781Statoil ASA 2,805 60,005Telenor ASA 1,640 35,130 141,261Singapore | 1.8%CapitaLand, Ltd. 4,000 10,539Singapore Airlines, Ltd. 2,500 19,913UOL Group, Ltd. 1,000 6,630Venture Corp., Ltd. 2,800 42,787 79,869
Spain | 0.1%Corporacion Financiera Alba SA 82 $ 4,690
Sweden | 1.2%Axfood AB 600 11,558Electrolux AB, Series B 365 11,739Hennes & Mauritz AB, B Shares 433 8,922Svenska Cellulosa AB SCA, Class B 2,249 23,128 55,347Switzerland | 1.3%Partners Group Holding AG 20 13,704Roche Holding AG 127 32,124Swiss Life Holding AG 33 11,680 57,508United Kingdom | 3.0%Admiral Group PLC 619 16,693Compass Group PLC 1,015 21,947Hargreaves Lansdown PLC 433 10,533International Consolidated Airlines Group SA 1,273 11,165
Moneysupermarket.com Group PLC 2,174 10,443Persimmon PLC 282 10,414Smith & Nephew PLC 807 13,964SSE PLC 1,544 27,506Wm Morrison Supermarkets PLC 3,751 11,132 133,797United States | 52.9%3M Co. 277 65,197Accenture PLC, Class A 312 47,764Advanced Energy Industries, Inc. (*) 136 9,177Ally Financial, Inc. 469 13,676Altria Group, Inc. 326 23,280AMC Networks, Inc., Class A (*) 204 11,032Amdocs, Ltd. 198 12,965Ameren Corp. 1,060 62,529American Axle & Manufacturing Holdings, Inc. (*) 829 14,118
American Electric Power Co., Inc. 208 15,303Anthem, Inc. 58 13,051Aon PLC 392 52,528AT&T, Inc. 1,648 64,074Atkore International Group, Inc. (*) 589 12,634BGC Partners, Inc., Class A 1,026 15,503Bloomin’ Brands, Inc. 502 10,713Campbell Soup Co. 424 20,399Cardtronics PLC, Class A (*) 662 12,260Carnival Corp. 487 32,322
FairDescription Shares Value
FairDescription Shares Value
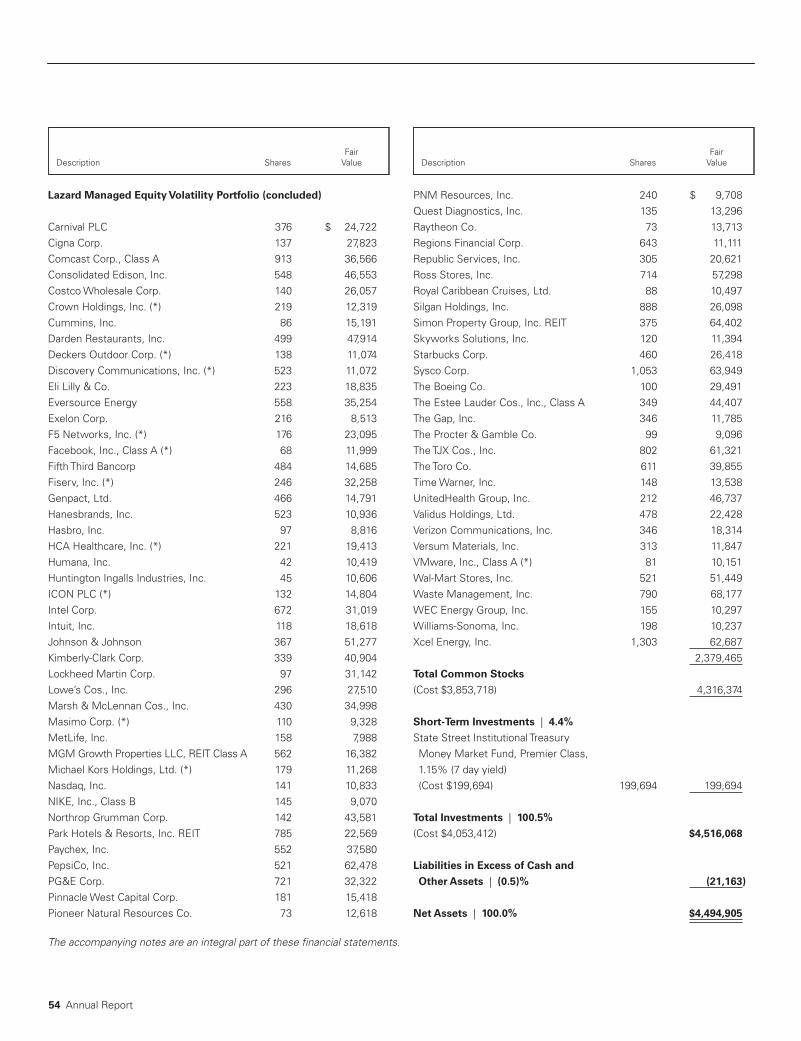
54 Annual Report
The accompanying notes are an integral part of these financial statements.
Lazard Managed Equity Volatility Portfolio (concluded)
Carnival PLC 376 $ 24,722Cigna Corp. 137 27,823Comcast Corp., Class A 913 36,566Consolidated Edison, Inc. 548 46,553Costco Wholesale Corp. 140 26,057Crown Holdings, Inc. (*) 219 12,319Cummins, Inc. 86 15,191Darden Restaurants, Inc. 499 47,914Deckers Outdoor Corp. (*) 138 11,074Discovery Communications, Inc. (*) 523 11,072Eli Lilly & Co. 223 18,835Eversource Energy 558 35,254Exelon Corp. 216 8,513F5 Networks, Inc. (*) 176 23,095Facebook, Inc., Class A (*) 68 11,999Fifth Third Bancorp 484 14,685Fiserv, Inc. (*) 246 32,258Genpact, Ltd. 466 14,791Hanesbrands, Inc. 523 10,936Hasbro, Inc. 97 8,816HCA Healthcare, Inc. (*) 221 19,413Humana, Inc. 42 10,419Huntington Ingalls Industries, Inc. 45 10,606ICON PLC (*) 132 14,804Intel Corp. 672 31,019Intuit, Inc. 118 18,618Johnson & Johnson 367 51,277Kimberly- Clark Corp. 339 40,904Lockheed Martin Corp. 97 31,142Lowe’s Cos., Inc. 296 27,510Marsh & McLennan Cos., Inc. 430 34,998Masimo Corp. (*) 110 9,328MetLife, Inc. 158 7,988MGM Growth Properties LLC, REIT Class A 562 16,382Michael Kors Holdings, Ltd. (*) 179 11,268Nasdaq, Inc. 141 10,833NIKE, Inc., Class B 145 9,070Northrop Grumman Corp. 142 43,581Park Hotels & Resorts, Inc. REIT 785 22,569Paychex, Inc. 552 37,580PepsiCo, Inc. 521 62,478PG&E Corp. 721 32,322Pinnacle West Capital Corp. 181 15,418Pioneer Natural Resources Co. 73 12,618
PNM Resources, Inc. 240 $ 9,708Quest Diagnostics, Inc. 135 13,296Raytheon Co. 73 13,713Regions Financial Corp. 643 11,111Republic Services, Inc. 305 20,621Ross Stores, Inc. 714 57,298Royal Caribbean Cruises, Ltd. 88 10,497Silgan Holdings, Inc. 888 26,098Simon Property Group, Inc. REIT 375 64,402Skyworks Solutions, Inc. 120 11,394Starbucks Corp. 460 26,418Sysco Corp. 1,053 63,949The Boeing Co. 100 29,491The Estee Lauder Cos., Inc., Class A 349 44,407The Gap, Inc. 346 11,785The Procter & Gamble Co. 99 9,096The TJX Cos., Inc. 802 61,321The Toro Co. 611 39,855Time Warner, Inc. 148 13,538UnitedHealth Group, Inc. 212 46,737Validus Holdings, Ltd. 478 22,428Verizon Communications, Inc. 346 18,314Versum Materials, Inc. 313 11,847VMware, Inc., Class A (*) 81 10,151Wal- Mart Stores, Inc. 521 51,449Waste Management, Inc. 790 68,177WEC Energy Group, Inc. 155 10,297Williams- Sonoma, Inc. 198 10,237Xcel Energy, Inc. 1,303 62,687 2,379,465Total Common Stocks
(Cost $3,853,718) 4,316,374
Short- Term Investments | 4.4%State Street Institutional Treasury Money Market Fund, Premier Class, 1.15% (7 day yield) (Cost $199,694) 199,694 199,694
Total Investments | 100.5%(Cost $4,053,412) $4,516,068
Liabilities in Excess of Cash and
Other Assets | (0.5)% (21,163)
Net Assets | 100.0% $4,494,905
FairDescription Shares Value
FairDescription Shares Value
Annual Report 55
The accompanying notes are an integral part of these financial statements.
The Lazard Funds, Inc. Notes to Portfolios of Investments December 31, 2017
(*) Non-income producing security.
Security Abbreviations:
ADR — American Depositary ReceiptGDR — Global Depositary ReceiptREIT — Real Estate Investment Trust

56 Annual Report
The accompanying notes are an integral part of these financial statements.
Portfolio holdings by industry (as a percentage of net assets), for those Portfolios previously presented by country:
Aerospace & Defense 1.1% 0.7% 2.0% 4.3% 0.3% Air Freight & Logistics 1.6 1.1 — — 0.2 Airlines 1.3 1.2 — — 3.3 Auto Components 3.8 4.4 8.0 1.4 2.3 Automobiles 1.8 — — — 2.0 Banks 9.0 7.4 6.6 7.5 10.9 Beverages 4.7 3.4 4.0 7.0 0.5 Biotechnology 2.3 2.0 5.1 2.6 2.2 Building Products 1.8 2.0 — 1.5 1.6 Capital Markets 1.2 0.1 — 3.4 2.8 Chemicals 3.0 — — — 3.4 Commercial Services & Suppliers — — — — — 2 Construction & Engineering 2.5 2.0 4.1 — 1.9 Consumer Finance — — — 1.6 — Containers & Packaging — — 2.7 — 0.2 Diversified Consumer Services — — — — — 1 Diversified Financial Services — — — 0.9 1.0 Diversified Telecommunication Services 3.9 3.0 — — 2.4 Electric Utilities 1.5 1.3 — — 1.4 Electrical Equipment — 0.8 — — 0.8 Electronic Equipment, Instruments & Components — — — 1.1 1.6 Energy Equipment & Services 0.7 — — — — 2 Equity Real Estate Investment Trusts (REITs) — — — — 0.4 Food & Staples Retailing — — — — 0.5 Food Products — — — 1.1 4.7 Gas Utilities — — — — — — — — — 0Health Care Equipment & Supplies 2.0 2.6 4.3 1.0 1.6 Health Care Providers & Services — — — 1.1 0.1 Health Care Technology — — — — — 1 Hotels, Restaurants & Leisure — 1.9 3.1 1.7 2.9 Household Durables 1.5 1.2 — — 3.5 Industrial Conglomerates — 1.3 — — 1.2 Insurance 7.0 9.9 7.5 9.7 5.6 Internet & Catalog Retail — — — — 0.3 Internet Software & Services — 3.9 5.3 2.5 0.4 IT Services 3.1 3.5 6.3 2.9 0.9 Leisure Products 0.7 — — 2.0 — Life Sciences Tools & Services — — — — 0.4 Machinery 2.2 2.7 3.2 8.0 1.8 Marine 1.3 — — — — 1 Media 1.0 — 2.0 7.7 — Metals & Mining 2.5 1.9 3.0 1.0 2.0 Multiline Retail 2.7 2.0 — 3.5 0.5 Multi- Utilities — — — — 1.1 Oil, Gas & Consumable Fuels 7.0 5.2 3.9 4.8 6.8 Paper & Forest Products — — — — — — — — — 0Personal Products 3.0 3.0 — 1.4 3.3
Lazard Lazard Lazard Lazard Lazard International International International International International Equity Strategic Equity Equity Equity Select Concentrated Equity Advantage
Industry† Portfolio Portfolio Portfolio Portfolio Portfolio

Annual Report 57
1 —% —% 2.3% 2.1% 2.9% 1 1 — — — — —
A 1 1 — — — — 2.1 3 1 1.2 — 1.3 — 0.3
1 — — 7.6 6.7 2.5 9 — — 8.2 7.1 1.4
4 — — 2.7 3.7 1.2 2 — — 1.8 — 0.3
1 1 3.5 — 5.8 6.9 2.9 1 4.2 3.5 2.5 0.9 1.4
3 0.2 8.4 — — 2.0 — — — — — 2.1 4.7 2.0 1.4 0.5 2 — — — — 1.3
— — — 1 1.2 — 1.2 — 0.3 — — 2 2.8 — 0.9 — 1.2 — — — — — 1.0 4.5 — 0.9 — — — — 0 4.0 — — 0.5 0.1 3 3.0 — — 0.7 3.9
1 1 — 3.1 — — 4.6 — 0 1.1 — 2.6 1.7 0.3 — — — 1 6.0 — 1.1 — 1.5
0 2.3 — 1.4 1.2 — — — — — 0 2.0 — — — 3.7
— — — — 0 — — — — 4.3 — — — 1 2.0 — 1.1 1.1 2.3
— — — — — — — — — 0.3 2 1 — 4.3 1.1 0.9 1.3 — — — 1 1.1 11.5 — — 2.9 — — — — — 1.6 5.7 1.7 1.0 5.1 — 1 1 3.6 — — 1.7 0.9
1 1 1.0 — — — 1.1 — 1 — — 1.8 0.9 1.9 7 1.2 — 6.0 8.8 3.9
— — — — 0 — — — 1.0 0.2 — 3 5.7 4.0 5.4 8.1 0.5
3 1.5 7.8 7.9 6.0 3.8 0 — — 0.8 — 0.2
— — — — 0 1.5 — 2.9 1.3 0.3 2 8.9 — 1.7 1.9 1.2
1 1.6 — — 0.8 — 1 6.3 8.7 — 6.9 1.6 2 1 1 1.0 — 0.8 — 1.4
2 1.1 — 1.7 1.4 0.7 — — — — 1 — — — — 2.9
7 0.9 — — 1.6 6.1 — — — — — — — — — 0.8
3 1 — — 1.9 — 1.3
L L L Lazard Lazard Lazard L L I I I International Lazard Lazard Global Managed I I E S E Small Cap Equity Global Strategic Equity E E C E A Equity Franchise Equity Select Equity Volatility
P P P P P Portfolio Portfolio Portfolio Portfolio Portfolio

58 Annual Report
The accompanying notes are an integral part of these financial statements.
Portfolio holdings by industry (as a percentage of net assets), for those Portfolios previously presented by country (concluded):
Pharmaceuticals 3.1% 2.2% —% —% 8.6% Professional Services 4.2 3.3 5.5 2.1 1.9 Real Estate Management & Development 2.6 2.7 — 2.7 4.4 Road & Rail 1.0 1.0 — — 0.4 Semiconductors & Semiconductor Equipment 1.5 4.1 4.1 3.7 1.8 Software 2.6 2.7 2.8 0.7 1.6 Specialty Retail 0.8 0.7 — — 0.3 Technology Hardware, Storage & Peripherals — 2.4 4.0 — 1.4 Textiles, Apparel & Luxury Goods — 0.8 — 1.5 — Thrifts & Mortgage Finance — — — 1.1 — Tobacco 2.8 2.4 4.9 3.4 0.2 Trading Companies & Distributors 3.0 2.4 — 1.3 0.9 Transportation Infrastructure — — — — — — 3 Water Utilities — 0.8 1.9 — — — 2 Wireless Telecommunication Services 2.2 2.5 3.6 — 1.7 Subtotal 98.0 96.5 97.9 96.2 100.0 Short- Term Investments 2.2 3.1 2.0 4.1 0.7 Total Investments 100.2% 99.6% 99.9% 100.3% 100.7%
† Industry classifications may be different than those used for compliance monitoring purposes.
Lazard Lazard Lazard Lazard Lazard International International International International International Equity Strategic Equity Equity Equity Select Concentrated Equity Advantage
Industry† Portfolio Portfolio Portfolio Portfolio Portfolio

Annual Report 59
3 —% —% 2.0% 1.5% 3.4% 4 2.8 3.7 4.5 1.1 —
2 9.1 — 1.4 2.4 3.3 1 1 — — 1.6 1.6 1.2
1 0.6 6.7 1.6 4.2 1.4 2 3.4 8.1 3.3 7.3 0.9 0 2.0 — 2.0 — 3.9
— 2 0.7 — 1.8 — —T — 0 1 2.3 1.9 — — 1.3
— — — 1 — — 0.6 — —T 2 — — 1.0 2.7 0.5
3 1 1.7 1.5 1.3 1.3 — — — — — — — 3.7 — — 0.3
— 0 1 — 2.1 — — — 2 — — — — 0.5 9 96.2 93.9 97.3 99.3 96.1
2 3.6 3.2 3.1 — 4.4 1 99.8% 97.1% 100.4% 99.3% 100.5%
L L L Lazard Lazard Lazard L L I I I International Lazard Lazard Global Managed I I E S E Small Cap Equity Global Strategic Equity E E C E A Equity Franchise Equity Select Equity Volatility
P P P P P Portfolio Portfolio Portfolio Portfolio Portfolio
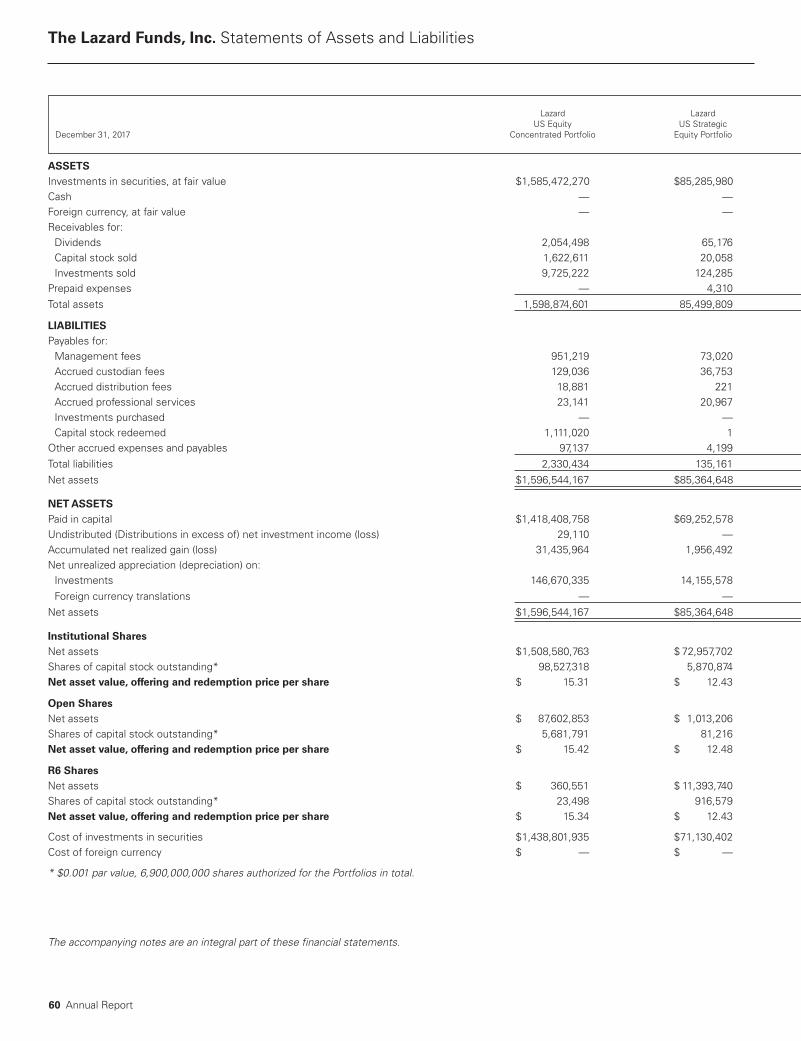
ASSETSInvestments in securities, at fair value $1,585,472,270 $85,285,980 Cash — — 5 Foreign currency, at fair value — — — 1 Receivables for: Dividends 2,054,498 65,176 Capital stock sold 1,622,611 20,058 Investments sold 9,725,222 124,285
Prepaid expenses — 4,310 Total assets 1,598,874,601 85,499,809
LIABILITIESPayables for:Management fees 951,219 73,020 Accrued custodian fees 129,036 36,753 Accrued distribution fees 18,881 221 Accrued professional services 23,141 20,967 Investments purchased — — — 1 Capital stock redeemed 1,111,020 1
Other accrued expenses and payables 97,137 4,199 Total liabilities 2,330,434 135,161 Net assets $1,596,544,167 $85,364,648
NET ASSETSPaid in capital $1,418,408,758 $69,252,578 Undistributed (Distributions in excess of) net investment income (loss) 29,110 — (1 Accumulated net realized gain (loss) 31,435,964 1,956,492 Net unrealized appreciation (depreciation) on:Investments 146,670,335 14,155,578 Foreign currency translations — — — 7 Net assets $1,596,544,167 $85,364,648
Institutional SharesNet assets $1,508,580,763 $ 72,957,702 Shares of capital stock outstanding* 98,527,318 5,870,874 Net asset value, offering and redemption price per share $ 15.31 $ 12.43
Open SharesNet assets $ 87,602,853 $ 1,013,206 Shares of capital stock outstanding* 5,681,791 81,216 Net asset value, offering and redemption price per share $ 15.42 $ 12.48
R6 SharesNet assets $ 360,551 $ 11,393,740 — $ 6 — —Shares of capital stock outstanding* 23,498 916,579 Net asset value, offering and redemption price per share $ 15.34 $ 12.43 — $ 1 — —
Cost of investments in securities $1,438,801,935 $71,130,402 Cost of foreign currency $ — $ — $ — $ 1
* $0.001 par value, 6,900,000,000 shares authorized for the Portfolios in total.
The accompanying notes are an integral part of these financial statements.
Lazard Lazard L L L L US Equity US Strategic U I I I December 31, 2017 Concentrated Portfolio Equity Portfolio E E S C
60 Annual Report
The Lazard Funds, Inc. Statements of Assets and Liabilities

Annual Report 61
$1 $ 196,567,315 $3,810,294,391 $56,549,249 $69,607,267 — — 5,699,484 — — —
F — — — 128,234 1,996 1
D 2 208,648 5,298,722 70,102 131,568 1 185,138 4,472,503 354,242 24,008
9 504,835 1,925 8,749 45,875 — 4 1,805 — 7,823 7,279
1 203,167,225 3,820,195,775 56,992,161 69,815,998
9 127,760 2,433,096 75,928 92,828
1 41,819 431,128 42,385 34,545 1 5,443 42,880 590 46 2 21,083 29,007 33,027 22,457
— — — 1,454,661 21,959 1,210 1 18,451 11,513,332 54,557 1,886
9 4,481 271,317 3,966 3,402 2 219,037 16,175,421 232,412 156,374 $1 $202,948,188 $3,804,020,354 $56,759,749 $69,659,624
$1 $173,758,470 $3,281,865,291 $49,595,631 $63,479,586
2 (191,969) 12,884,788 572,890 (37,517) 3 2,711,788 (66,369,802) (2,368,443) (739,711)
1 26,669,899 575,563,934 8,958,904 6,956,316
— — — 76,143 767 950 $1 $202,948,188 $3,804,020,354 $56,759,749 $69,659,624
$1 $176,975,304 $2,835,261,612 $53,928,849 $69,440,076
9 12,081,329 144,593,511 4,895,525 6,658,885 $ 1 $ 14.65 $ 19.61 $ 11.02 $ 10.43
$ 8 $ 25,972,884 $ 275,014,282 $ 2,830,900 $ 219,548
5 1,893,205 13,869,285 256,624 21,011 $ 1 $ 13.72 $ 19.83 $ 11.03 $ 10.45
$ 3 — $ 693,744,460 — —
S 2 — 35,418,952 — —N $ 1 — $ 19.59 — —
C $1 $ 169,897,416 $3,234,730,457 $47,590,345 $62,650,951 $ — $ — $ — $ 128,229 $ 1,996 $ 1
L L Lazard Lazard Lazard Lazard U U US Small-Mid Cap International International Equity International Equity
C E Equity Portfolio Equity Portfolio Select Portfolio Concentrated Portfolio
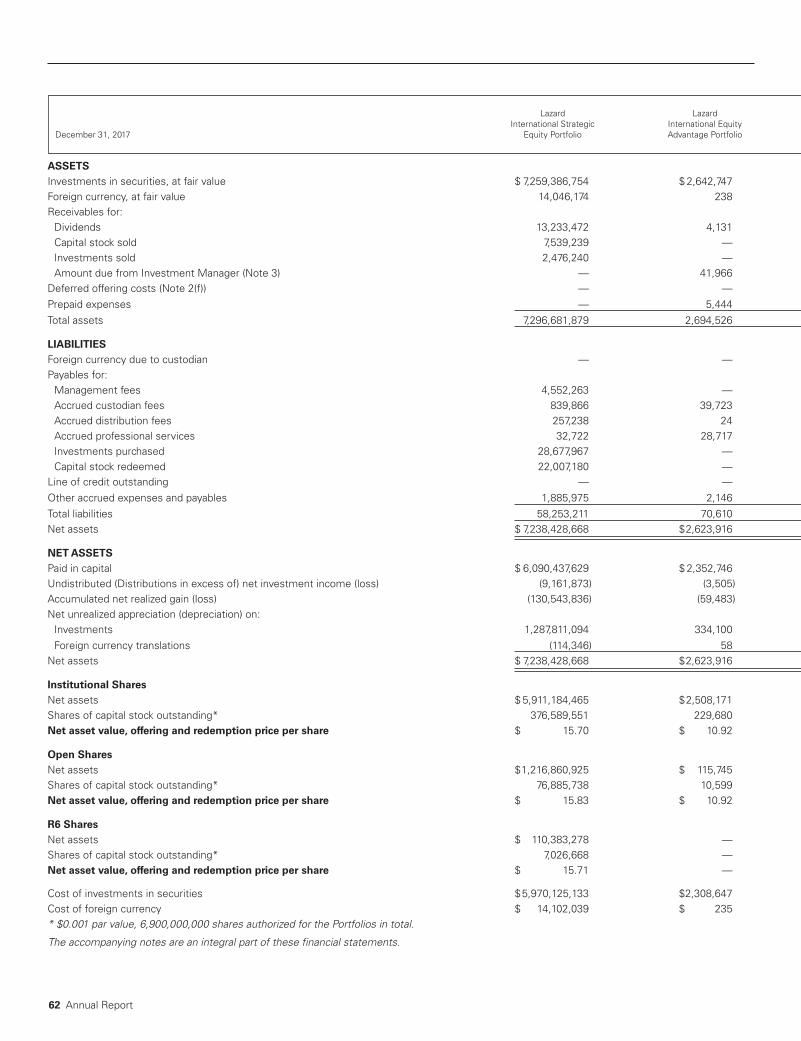
ASSETSInvestments in securities, at fair value $ 7,259,386,754 $ 2,642,747 Foreign currency, at fair value 14,046,174 238 Receivables for:Dividends 13,233,472 4,131 Capital stock sold 7,539,239 — 7 Investments sold 2,476,240 — 1 Amount due from Investment Manager (Note 3) — 41,966
Deferred offering costs (Note 2(f)) — — — 7 Prepaid expenses — 5,444 Total assets 7,296,681,879 2,694,526
LIABILITIESForeign currency due to custodian — — — — — 1 Payables for:Management fees 4,552,263 — 5 Accrued custodian fees 839,866 39,723 Accrued distribution fees 257,238 24 Accrued professional services 32,722 28,717 Investments purchased 28,677,967 — 8 Capital stock redeemed 22,007,180 — 9
Line of credit outstanding — — — — — 1 Other accrued expenses and payables 1,885,975 2,146 2 Total liabilities 58,253,211 70,610 Net assets $ 7,238,428,668 $2,623,916
NET ASSETSPaid in capital $ 6,090,437,629 $ 2,352,746 Undistributed (Distributions in excess of) net investment income (loss) (9,161,873) (3,505) 5 Accumulated net realized gain (loss) (130,543,836) (59,483) (4 Net unrealized appreciation (depreciation) on:Investments 1,287,811,094 334,100 Foreign currency translations (114,346) 58 Net assets $ 7,238,428,668 $2,623,916
Institutional SharesNet assets $ 5,911,184,465 $2,508,171 Shares of capital stock outstanding* 376,589,551 229,680 Net asset value, offering and redemption price per share $ 15.70 $ 10.92
Open SharesNet assets $1,216,860,925 $ 115,745 Shares of capital stock outstanding* 76,885,738 10,599 Net asset value, offering and redemption price per share $ 15.83 $ 10.92
R6 SharesNet assets $ 110,383,278 — — — — — —Shares of capital stock outstanding* 7,026,668 — — — — — —Net asset value, offering and redemption price per share $ 15.71 — — — — — —
Cost of investments in securities $5,970,125,133 $2,308,647 Cost of foreign currency $ 14,102,039 $ 235 * $0.001 par value, 6,900,000,000 shares authorized for the Portfolios in total.
The accompanying notes are an integral part of these financial statements.
Lazard Lazard L L L L L International Strategic International Equity I E G G M December 31, 2017 Equity Portfolio Advantage Portfolio E P S E V
62 Annual Report
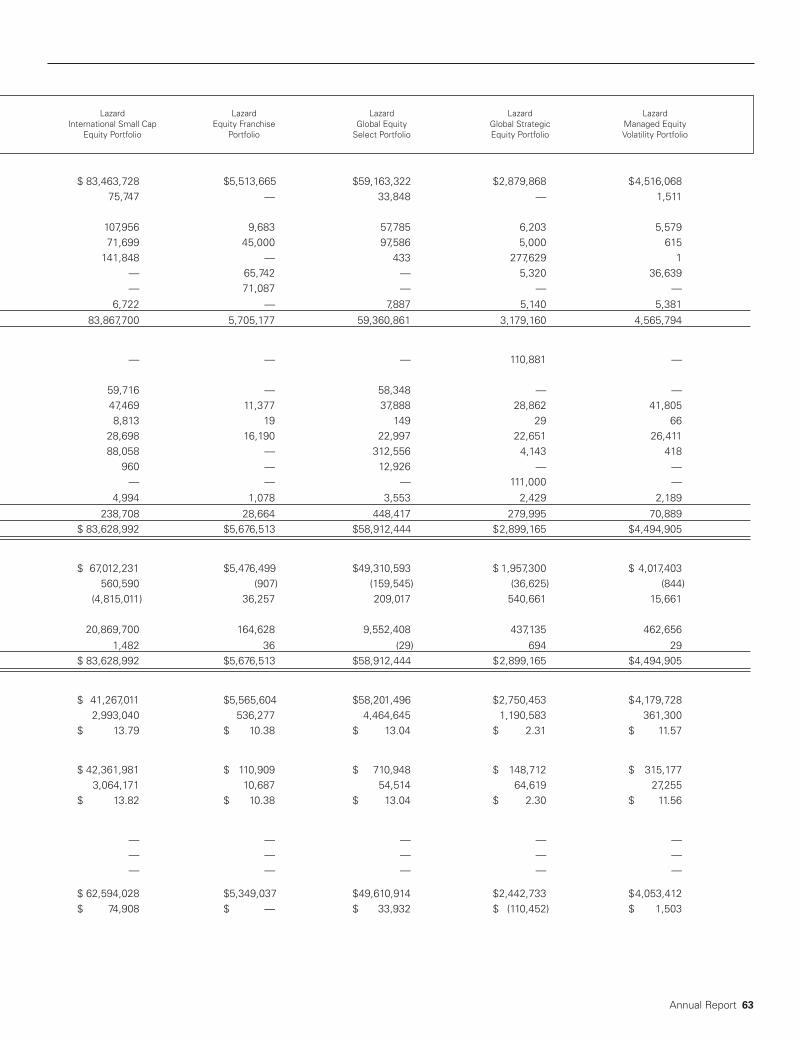
Annual Report 63
$ 7 $ 83,463,728 $5,513,665 $59,163,322 $2,879,868 $4,516,068 1 75,747 — 33,848 — 1,511
1 107,956 9,683 57,785 6,203 5,579
7 71,699 45,000 97,586 5,000 615 2 141,848 — 433 277,629 1
— 4 — 65,742 — 5,320 36,639 — — — 71,087 — — — — 5 6,722 — 7,887 5,140 5,381
7 83,867,700 5,705,177 59,360,861 3,179,160 4,565,794
— — — — — 110,881 —
4 59,716 — 58,348 — —A 8 47,469 11,377 37,888 28,862 41,805
2 8,813 19 149 29 66 3 28,698 16,190 22,997 22,651 26,411
2 88,058 — 312,556 4,143 418 2 960 — 12,926 — —
L — — — — — 111,000 — 1 4,994 1,078 3,553 2,429 2,189 5 238,708 28,664 448,417 279,995 70,889 $ 7 $ 83,628,992 $5,676,513 $58,912,444 $2,899,165 $4,494,905
$ 6 $ 67,012,231 $5,476,499 $49,310,593 $ 1,957,300 $ 4,017,403
(9 560,590 (907) (159,545) (36,625) (844) (1 (4,815,011) 36,257 209,017 540,661 15,661
1 20,869,700 164,628 9,552,408 437,135 462,656
( 1,482 36 (29) 694 29 $ 7 $ 83,628,992 $5,676,513 $58,912,444 $2,899,165 $4,494,905
$ 5 $ 41,267,011 $5,565,604 $58,201,496 $2,750,453 $4,179,728
3 2,993,040 536,277 4,464,645 1,190,583 361,300 $ 1 $ 13.79 $ 10.38 $ 13.04 $ 2.31 $ 11.57
$1 $ 42,361,981 $ 110,909 $ 710,948 $ 148,712 $ 315,177
7 3,064,171 10,687 54,514 64,619 27,255 $ 1 $ 13.82 $ 10.38 $ 13.04 $ 2.30 $ 11.56
$ 1 — — — — — —
S 7 — — — — —N $ 1 — — — — — —
C $5 $ 62,594,028 $5,349,037 $49,610,914 $2,442,733 $4,053,412 $ 1 $ 74,908 $ — $ 33,932 $ (110,452) $ 1,503
L L Lazard Lazard Lazard Lazard Lazard I I International Small Cap Equity Franchise Global Equity Global Strategic Managed Equity
E A Equity Portfolio Portfolio Select Portfolio Equity Portfolio Volatility Portfolio

Investment Income (Loss)
Income
Dividends* $ 25,919,185 $ 1,572,789
Expenses
Management fees (Note 3) 10,957,784 593,365 Distribution fees (Open Shares) 253,005 3,038 Custodian fees 194,552 63,284 Administration fees 217,047 29,104 Shareholders’ reports 81,616 7,934 Shareholders’ meeting 50,792 5,540 Directors’ fees and expenses 55,344 7,991 Professional services 65,044 39,409 Shareholders’ services 61,925 41,592 Registration fees 78,980 34,562 Amortization of offering costs (Note 2(f)) 6,440 — — — — —Other^ 40,870 8,695 Total gross expenses 12,063,399 834,514 Management fees waived and expenses reimbursed (15,448) (194,700) Administration and shareholders’ services fees waived (4,050) — — — — —Total net expenses 12,043,901 639,814 Net investment income (loss) 13,875,284 932,975
Net Realized and Unrealized Gain (Loss) on Investments
and Foreign Currency Transactions
Net realized gain (loss) on:Investments 142,271,974 8,352,420 Foreign currency transactions — — — 8
Total net realized gain (loss) on investments and foreign currency transactions 142,271,974 8,352,420 Net change in unrealized appreciation (depreciation) on:Investments 63,020,970 5,046,521 Foreign currency translations — — — 1
Total net change in unrealized appreciation (depreciation) on investments and foreigncurrency translations 63,020,970 5,046,521
Net realized and unrealized gain (loss) on investments and foreign currency transactions 205,292,944 13,398,941 Net increase (decrease) in net assets resulting from operations $219,168,228 $14,331,916
* Net of foreign withholding taxes of $ — $ 1,641
^ Includes interest on line of credit of $ — $ 89
The accompanying notes are an integral part of these financial statements.
Lazard Lazard L L L L US Equity US Strategic U I I I For the Year Ended December 31, 2017 Concentrated Portfolio Equity Portfolio E E S C
64 Annual Report
The Lazard Funds, Inc. Statements of Operations
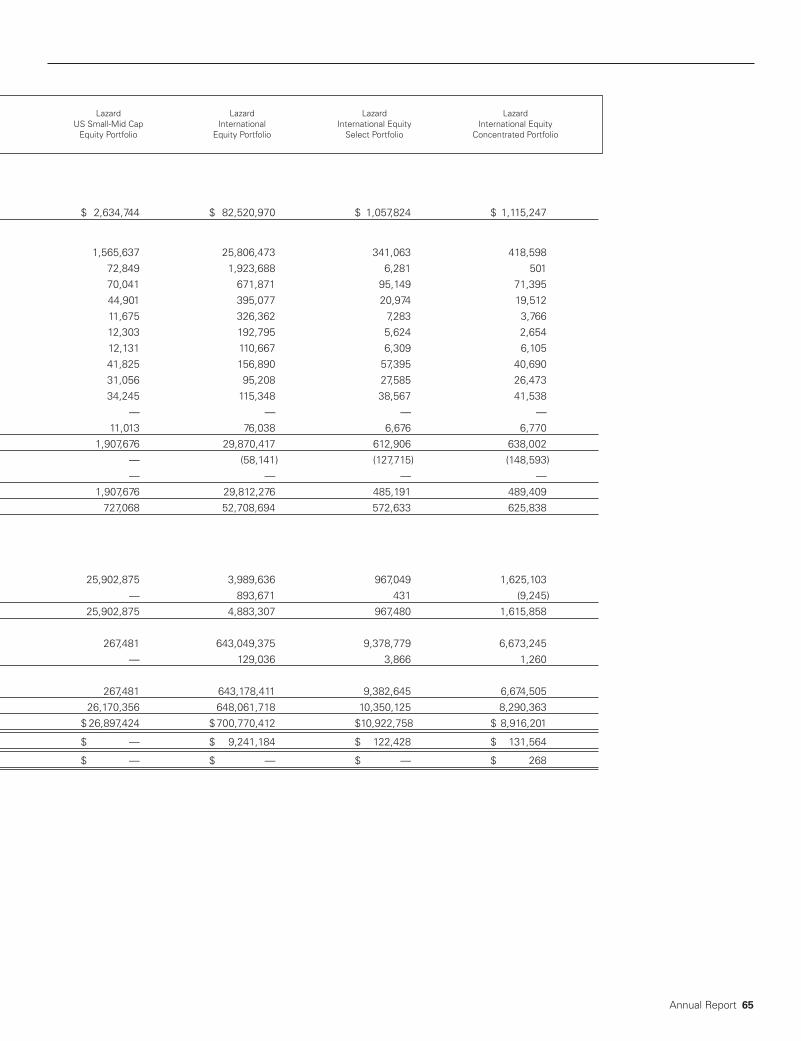
Annual Report 65
$ 2 $ 2,634,744 $ 82,520,970 $ 1,057,824 $ 1,115,247
1 1,565,637 25,806,473 341,063 418,598 2 72,849 1,923,688 6,281 501
1 70,041 671,871 95,149 71,395 2 44,901 395,077 20,974 19,512 8 11,675 326,362 7,283 3,766 5 12,303 192,795 5,624 2,654
5 12,131 110,667 6,309 6,105 6 41,825 156,890 57,395 40,690 6 31,056 95,208 27,585 26,473
7 34,245 115,348 38,567 41,538 6 — — — —
4 11,013 76,038 6,676 6,770 1 1,907,676 29,870,417 612,906 638,002
( — (58,141) (127,715) (148,593) ( — — — —
1 1,907,676 29,812,276 485,191 489,409 1 727,068 52,708,694 572,633 625,838
1 25,902,875 3,989,636 967,049 1,625,103
— — — 893,671 431 (9,245) 25,902,875 4,883,307 967,480 1,615,858
6 267,481 643,049,375 9,378,779 6,673,245 — — — 129,036 3,866 1,260
6 267,481 643,178,411 9,382,645 6,674,505
2 26,170,356 648,061,718 10,350,125 8,290,363 $2 $ 26,897,424 $700,770,412 $10,922,758 $ 8,916,201
$ — $ 1 $ — $ 9,241,184 $ 122,428 $ 131,564
$ — $ 8 $ — $ — $ — $ 268
L L Lazard Lazard Lazard Lazard U U US Small-Mid Cap International International Equity International Equity
C E Equity Portfolio Equity Portfolio Select Portfolio Concentrated Portfolio
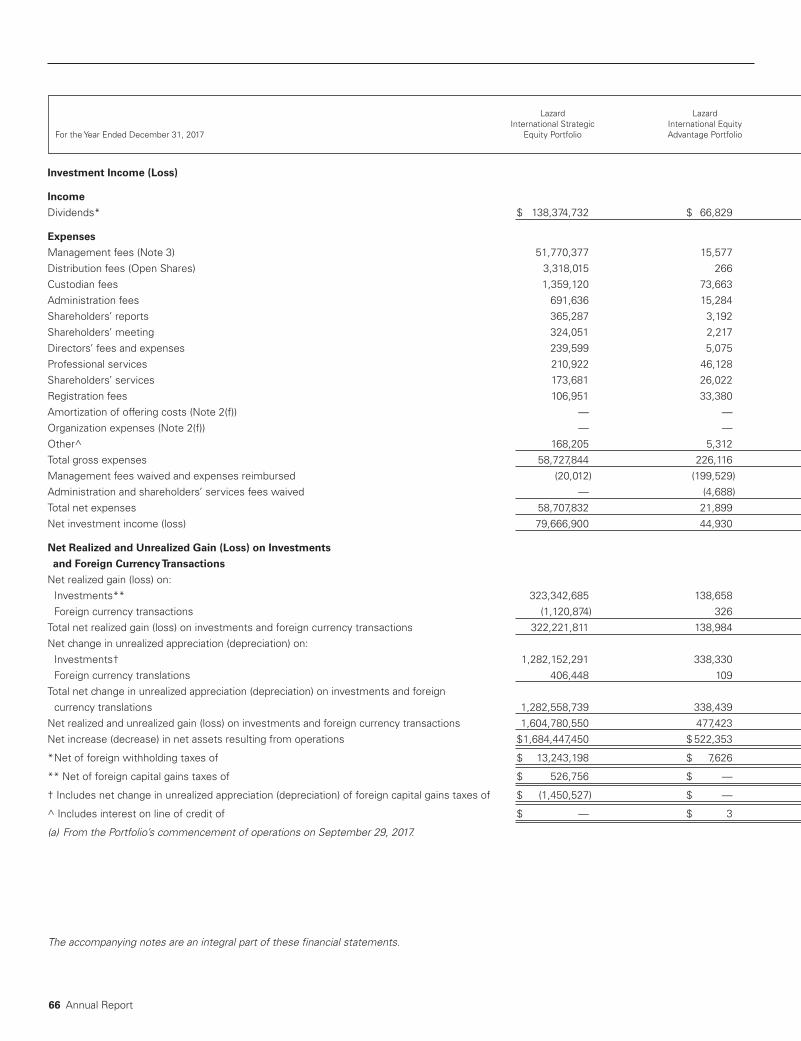
Investment Income (Loss)
Income
Dividends* $ 138,374,732 $ 66,829
Expenses
Management fees (Note 3) 51,770,377 15,577 Distribution fees (Open Shares) 3,318,015 266 Custodian fees 1,359,120 73,663 Administration fees 691,636 15,284 Shareholders’ reports 365,287 3,192 Shareholders’ meeting 324,051 2,217 Directors’ fees and expenses 239,599 5,075 Professional services 210,922 46,128 Shareholders’ services 173,681 26,022 Registration fees 106,951 33,380 Amortization of offering costs (Note 2(f)) — — — 2 Organization expenses (Note 2(f)) — — — 6 Other^ 168,205 5,312 Total gross expenses 58,727,844 226,116 2 Management fees waived and expenses reimbursed (20,012) (199,529) Administration and shareholders’ services fees waived — (4,688) Total net expenses 58,707,832 21,899 Net investment income (loss) 79,666,900 44,930
Net Realized and Unrealized Gain (Loss) on Investments
and Foreign Currency Transactions
Net realized gain (loss) on:Investments** 323,342,685 138,658 Foreign currency transactions (1,120,874) 326
Total net realized gain (loss) on investments and foreign currency transactions 322,221,811 138,984 Net change in unrealized appreciation (depreciation) on:Investments† 1,282,152,291 338,330 Foreign currency translations 406,448 109
Total net change in unrealized appreciation (depreciation) on investments and foreigncurrency translations 1,282,558,739 338,439
Net realized and unrealized gain (loss) on investments and foreign currency transactions 1,604,780,550 477,423 Net increase (decrease) in net assets resulting from operations $1,684,447,450 $ 522,353
*Net of foreign withholding taxes of $ 13,243,198 $ 7,626
** Net of foreign capital gains taxes of $ 526,756 $ — $ 3
† Includes net change in unrealized appreciation (depreciation) of foreign capital gains taxes of $ (1,450,527) $ — $ — $ — $ — $ — $ —
^ Includes interest on line of credit of $ — $ 3
(a) From the Portfolio’s commencement of operations on September 29, 2017.
The accompanying notes are an integral part of these financial statements.
Lazard Lazard L L L L L International Strategic International Equity I E G G M For the Year Ended December 31, 2017 Equity Portfolio Advantage Portfolio E P S E V
66 Annual Report

Annual Report 67
$ 1 $ 1,561,430 $ 29,485 $ 719,038 $ 280,892 $ 81,449
5 602,868 10,681 349,158 128,414 19,884 3 104,139 29 1,525 316 570
1 90,834 11,377 67,779 56,687 73,393 6 26,204 923 20,740 17,016 15,447 3 8,328 17 4,463 3,737 3,118 3 11,917 — 7,060 2,264 2,568
2 7,760 1,289 6,271 5,636 5,097 2 49,739 30,061 41,206 40,351 43,837 1 32,109 9,224 26,780 26,096 26,059
1 37,084 757 51,387 36,852 33,387 — — — 23,610 — — —
O — — — 6,878 — — — 1 8,922 401 6,687 6,551 4,958
5 979,904 95,247 583,056 323,920 228,318 ( — (76,423) (122,728) (152,172) (198,080) — ( — (6,112) — (4,688) (4,688)
5 979,904 12,712 460,328 167,060 25,550 7 581,526 16,773 258,710 113,832 55,899
3 6,261,496 43,392 2,533,357 3,255,214 209,173
( (31,222) (1,205) 3,828 (8,298) (732) 3 6,230,274 42,187 2,537,185 3,246,916 208,441
1 17,979,745 164,628 7,974,960 (242,470) 356,396 4 8,274 36 868 871 42
1 17,988,019 164,664 7,975,828 (241,599) 356,438
1 24,218,293 206,851 10,513,013 3,005,317 564,879 $1 $24,799,819 $ 223,624 $10,771,723 $ 3,119,149 $ 620,778
$ 1 $ 158,985 $ 1,120 $ 36,011 $ 18,872 $ 5,037
$ 5 $ 33,861 $ — $ — $ — $ —
$ — $ — $ — $ — $ —
$ — $ 3 $ 1,329 $ — $ 63 $ 437 $ 3
L L Lazard Lazard Lazard Lazard Lazard I I International Small Cap Equity Franchise Global Equity Global Strategic Managed Equity
E A Equity Portfolio Portfolio (a) Select Portfolio Equity Portfolio Volatility Portfolio
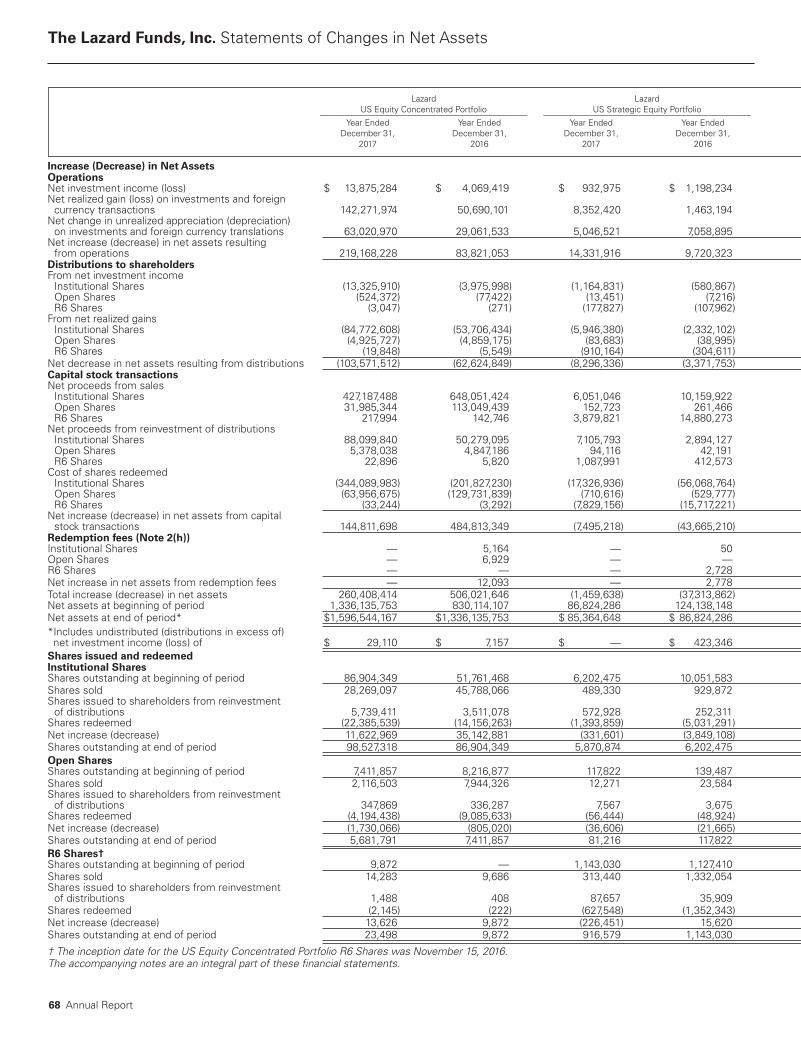
Increase (Decrease) in Net AssetsOperationsNet investment income (loss) $ 13,875,284 $ 4,069,419 $ 932,975 $ 1,198,234 Net realized gain (loss) on investments and foreign currency transactions 142,271,974 50,690,101 8,352,420 1,463,194 Net change in unrealized appreciation (depreciation) on investments and foreign currency translations 63,020,970 29,061,533 5,046,521 7,058,895 Net increase (decrease) in net assets resulting from operations 219,168,228 83,821,053 14,331,916 9,720,323 Distributions to shareholdersFrom net investment income Institutional Shares (13,325,910) (3,975,998) (1,164,831) (580,867) ( Open Shares (524,372) (77,422) (13,451) (7,216) ( R6 Shares (3,047) (271) (177,827) (107,962) From net realized gains Institutional Shares (84,772,608) (53,706,434) (5,946,380) (2,332,102) Open Shares (4,925,727) (4,859,175) (83,683) (38,995) R6 Shares (19,848) (5,549) (910,164) (304,611) Net decrease in net assets resulting from distributions (103,571,512) (62,624,849) (8,296,336) (3,371,753) Capital stock transactionsNet proceeds from sales Institutional Shares 427,187,488 648,051,424 6,051,046 10,159,922 2 Open Shares 31,985,344 113,049,439 152,723 261,466 R6 Shares 217,994 142,746 3,879,821 14,880,273 Net proceeds from reinvestment of distributions Institutional Shares 88,099,840 50,279,095 7,105,793 2,894,127 Open Shares 5,378,038 4,847,186 94,116 42,191 1 R6 Shares 22,896 5,820 1,087,991 412,573 Cost of shares redeemed Institutional Shares (344,089,983) (201,827,230) (17,326,936) (56,068,764) ( Open Shares (63,956,675) (129,731,839) (710,616) (529,777) R6 Shares (33,244) (3,292) (7,829,156) (15,717,221) Net increase (decrease) in net assets from capital stock transactions 144,811,698 484,813,349 (7,495,218) (43,665,210) 9Redemption fees (Note 2(h))Institutional Shares — 5,164 — 50 Open Shares — 6,929 — — — 3 R6 Shares — — — 2,728 Net increase in net assets from redemption fees — 12,093 — 2,778 Total increase (decrease) in net assets 260,408,414 506,021,646 (1,459,638) (37,313,862) Net assets at beginning of period 1,336,135,753 830,114,107 86,824,286 124,138,148 2 Net assets at end of period* $1,596,544,167 $1,336,135,753 $ 85,364,648 $ 86,824,286 *Includes undistributed (distributions in excess of)net investment income (loss) of $ 29,110 $ 7,157 $ — $ 423,346 Shares issued and redeemedInstitutional SharesShares outstanding at beginning of period 86,904,349 51,761,468 6,202,475 10,051,583 2Shares sold 28,269,097 45,788,066 489,330 929,872 Shares issued to shareholders from reinvestment of distributions 5,739,411 3,511,078 572,928 252,311 Shares redeemed (22,385,539) (14,156,263) (1,393,859) (5,031,291) Net increase (decrease) 11,622,969 35,142,881 (331,601) (3,849,108) Shares outstanding at end of period 98,527,318 86,904,349 5,870,874 6,202,475 Open SharesShares outstanding at beginning of period 7,411,857 8,216,877 117,822 139,487 Shares sold 2,116,503 7,944,326 12,271 23,584 Shares issued to shareholders from reinvestment of distributions 347,869 336,287 7,567 3,675 Shares redeemed (4,194,438) (9,085,633) (56,444) (48,924) Net increase (decrease) (1,730,066) (805,020) (36,606) (21,665) Shares outstanding at end of period 5,681,791 7,411,857 81,216 117,822 R6 Shares†Shares outstanding at beginning of period 9,872 — 1,143,030 1,127,410 Shares sold 14,283 9,686 313,440 1,332,054 Shares issued to shareholders from reinvestment of distributions 1,488 408 87,657 35,909 Shares redeemed (2,145) (222) (627,548) (1,352,343) Net increase (decrease) 13,626 9,872 (226,451) 15,620 Shares outstanding at end of period 23,498 9,872 916,579 1,143,030
† The inception date for the US Equity Concentrated Portfolio R6 Shares was November 15, 2016.The accompanying notes are an integral part of these financial statements.
The Lazard Funds, Inc. Statements of Changes in Net Assets
Lazard Lazard L L L US Equity Concentrated Portfolio US Strategic Equity Portfolio U I I ________________________________________________ ________________________________________________ _ _ _ Year Ended Year Ended Year Ended Year Ended Y Y Y Y Y Y December 31, December 31, December 31, December 31, D D D D D D 2017 2016 2017 2016 2 2 2 2 2 2
68 Annual Report

Annual Report 69
$ 1 4 $ 727,068 $ 1,576,332 $ 52,708,694 $ 22,637,381 $ 572,633 $ 341,580
1 5 8 25,902,875 4,381,638 4,883,307 (65,141,894) 967,480 (1,388,258)
5 267,481 24,964,850 643,178,411 (58,887,120) 9,382,645 1,010,846
2 26,897,424 30,922,820 700,770,412 (101,391,633) 10,922,758 (35,832)
( ( (929,922) (1,149,160) (37,101,517) (14,872,435) (326,389) (271,128) ( ( (68,349) (115,498) (6,787,026) (2,352,852) (10,427) (17,608) ( ( — — (9,812,446) (737,825) — —F ( ( (19,496,066) (4,257,321) — — — — ( ( (3,090,224) (822,383) — — — — ( ( ( — — — — — —
( ( (23,584,561) (6,344,362) (53,700,989) (17,963,112) (336,816) (288,736)
4 6 24,700,686 23,332,262 1,609,287,090 1,204,761,178 27,547,397 24,235,519 3 1 9,096,024 6,849,779 279,622,992 1,131,071,739 427,893 560,888 2 3 — — 619,962,012 86,088,875 — —N 8 7 20,069,757 5,343,272 31,790,226 12,229,814 266,756 255,048 5 3,032,378 912,339 6,454,617 2,260,647 9,239 15,433 2 5 — — 9,812,446 737,825 — —C ( ( (60,255,552) (30,998,353) (715,965,738) (369,261,739) (12,174,649) (14,669,520) ( ( ( (16,933,398) (18,104,639) (1,233,044,805) (96,445,823) (293,819) (622,873) ( ( ( — — (115,088,363) (53,911,312) — —N 1 4 (20,290,105) (12,665,340) 492,830,477 1,917,531,204 15,782,817 9,774,495
— 5 — 5 — 460 — 63,133 — —
O — 6 — — — 38 — 944 — — — — — 2 — — — — — — — 1 — 2 — 498 — 64,077 — —
T 2 5 ( (16,977,242) 11,913,616 1,139,899,900 1,798,240,536 26,368,759 9,449,927 1 8 219,925,430 208,011,814 2,664,120,454 865,879,918 30,390,990 20,941,063 $1 $202,948,188 $219,925,430 $3,804,020,354 $2,664,120,454 $ 56,759,749 $30,390,990
$ 2 $ (191,969) $ 263,682 $ 12,884,788 $ 12,983,412 $ 572,890 $ 336,642
8 5 6 13,078,287 13,311,013 93,319,210 43,106,382 3,271,065 2,131,138 2 4 4 1,659,111 1,743,526 88,541,076 71,824,648 2,854,325 2,779,499
5 3 5 1,373,469 387,630 1,648,820 734,086 26,307 27,874 ( ( (4,029,538) (2,363,882) (38,915,595) (22,345,906) (1,256,172) (1,667,446)
1 3 ( (996,958) (232,726) 51,274,301 50,212,828 1,624,460 1,139,927 9 8 5 12,081,329 13,078,287 144,593,511 93,319,210 4,895,525 3,271,065 7 8 1 2,217,138 3,031,413 65,536,029 4,657,031 241,443 247,708 2 1 654,337 586,680 14,688,275 66,560,474 43,876 62,488
3 221,466 70,763 339,995 137,545 908 1,681 ( ( ( (1,199,736) (1,471,718) (66,695,014) (5,819,021) (29,603) (70,434)
( ( (323,933) (814,275) (51,666,744) 60,878,998 15,181 (6,265) 5 7 8 1,893,205 2,217,138 13,869,285 65,536,029 256,624 241,443
9 — 1 — — 4,890,072 2,893,076 — —
S 1 9 3 — — 36,289,913 5,181,473 — —S 1 4 — — 511,373 44,477 — —
( ( — — (6,272,406) (3,228,954) — — 1 9 ( — — 30,528,880 1,996,996 — —
2 9 9 — — 35,418,952 4,890,072 — —
L L Lazard Lazard Lazard U U US Small-Mid Cap Equity Portfolio International Equity Portfolio International Equity Select Portfolio _ _ ________________________________________________ ________________________________________________ ________________________________________________ Y Y Y Y Year Ended Year Ended Year Ended Year Ended Year Ended Year Ended D D D D December 31, December 31, December 31, December 31, December 31, December 31, 2 2 2 2 2017 2016 2017 2016 2017 2016
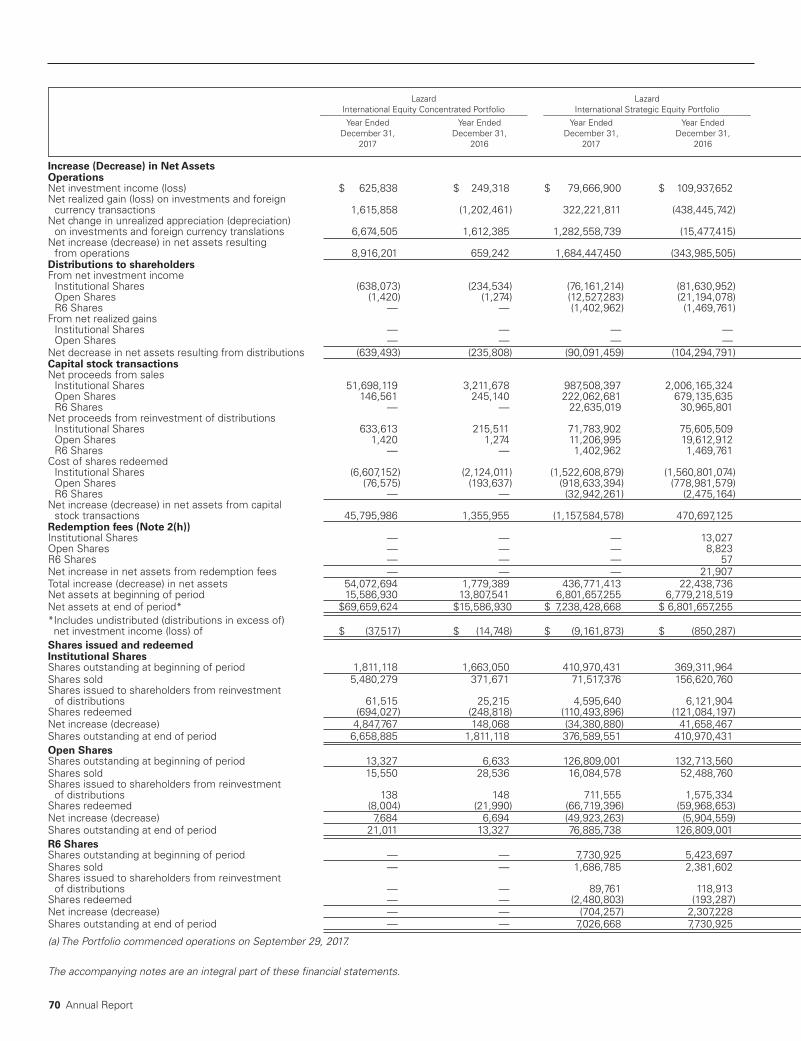
Increase (Decrease) in Net AssetsOperationsNet investment income (loss) $ 625,838 $ 249,318 $ 79,666,900 $ 109,937,652 Net realized gain (loss) on investments and foreign currency transactions 1,615,858 (1,202,461) 322,221,811 (438,445,742) Net change in unrealized appreciation (depreciation) on investments and foreign currency translations 6,674,505 1,612,385 1,282,558,739 (15,477,415) Net increase (decrease) in net assets resulting from operations 8,916,201 659,242 1,684,447,450 (343,985,505) Distributions to shareholdersFrom net investment income Institutional Shares (638,073) (234,534) (76,161,214) (81,630,952) Open Shares (1,420) (1,274) (12,527,283) (21,194,078) R6 Shares — — (1,402,962) (1,469,761) From net realized gains Institutional Shares — — — — — — — — ( Open Shares — — — — — — — — (Net decrease in net assets resulting from distributions (639,493) (235,808) (90,091,459) (104,294,791) Capital stock transactionsNet proceeds from sales Institutional Shares 51,698,119 3,211,678 987,508,397 2,006,165,324 Open Shares 146,561 245,140 222,062,681 679,135,635 R6 Shares — — 22,635,019 30,965,801 Net proceeds from reinvestment of distributions Institutional Shares 633,613 215,511 71,783,902 75,605,509 Open Shares 1,420 1,274 11,206,995 19,612,912 R6 Shares — — 1,402,962 1,469,761 Cost of shares redeemed Institutional Shares (6,607,152) (2,124,011) (1,522,608,879) (1,560,801,074) Open Shares (76,575) (193,637) (918,633,394) (778,981,579) R6 Shares — — (32,942,261) (2,475,164) Net increase (decrease) in net assets from capital stock transactions 45,795,986 1,355,955 (1,157,584,578) 470,697,125 Redemption fees (Note 2(h))Institutional Shares — — — 13,027 Open Shares — — — 8,823 R6 Shares — — — 57 Net increase in net assets from redemption fees — — — 21,907 Total increase (decrease) in net assets 54,072,694 1,779,389 436,771,413 22,438,736 Net assets at beginning of period 15,586,930 13,807,541 6,801,657,255 6,779,218,519 Net assets at end of period* $69,659,624 $15,586,930 $ 7,238,428,668 $ 6,801,657,255 *Includes undistributed (distributions in excess of)net investment income (loss) of $ (37,517) $ (14,748) $ (9,161,873) $ (850,287) Shares issued and redeemedInstitutional SharesShares outstanding at beginning of period 1,811,118 1,663,050 410,970,431 369,311,964 Shares sold 5,480,279 371,671 71,517,376 156,620,760 Shares issued to shareholders from reinvestment of distributions 61,515 25,215 4,595,640 6,121,904 Shares redeemed (694,027) (248,818) (110,493,896) (121,084,197) Net increase (decrease) 4,847,767 148,068 (34,380,880) 41,658,467 Shares outstanding at end of period 6,658,885 1,811,118 376,589,551 410,970,431 Open SharesShares outstanding at beginning of period 13,327 6,633 126,809,001 132,713,560 Shares sold 15,550 28,536 16,084,578 52,488,760 Shares issued to shareholders from reinvestment of distributions 138 148 711,555 1,575,334 Shares redeemed (8,004) (21,990) (66,719,396) (59,968,653) Net increase (decrease) 7,684 6,694 (49,923,263) (5,904,559) Shares outstanding at end of period 21,011 13,327 76,885,738 126,809,001 R6 SharesShares outstanding at beginning of period — — 7,730,925 5,423,697 Shares sold — — 1,686,785 2,381,602 Shares issued to shareholders from reinvestment of distributions — — 89,761 118,913 Shares redeemed — — (2,480,803) (193,287) Net increase (decrease) — — (704,257) 2,307,228 Shares outstanding at end of period — — 7,026,668 7,730,925
(a) The Portfolio commenced operations on September 29, 2017.
The accompanying notes are an integral part of these financial statements.
Lazard Lazard L L L International Equity Concentrated Portfolio International Strategic Equity Portfolio I I F ________________________________________________ ________________________________________________ _ _ _ Year Ended Year Ended Year Ended Year Ended Y P Y Y P December 31, December 31, December 31, December 31, D D D D D 2017 2016 2017 2016 2 2 2 2 2
70 Annual Report

$ 6 $ 44,930 $ 39,193 $ 581,526 $ 1,027,731 $ 16,773
1 3 138,984 (126,778) 6,230,274 5,996,814 42,187
6 1 1 338,439 71,344 17,988,019 (11,397,041) 164,664
8 522,353 (16,241) 24,799,819 (4,372,496) 223,624
( (48,334) (41,907) — (1,048,895) (14,403) ( ( ( (1,892) (1,729) — (1,179,813) (211) — — ( — — — — —F — — — — — — — — (9,517) — — — — — — — — (183)
( (50,226) (43,636) — (2,228,708) (24,314)
5 3 50,001 239,880 7,432,344 16,105,190 5,344,107 1 2 2 — 15,158 5,933,441 17,033,388 108,930 — — 2 — — — — —N 6 7 48,334 41,907 — 1,017,106 23,919 1 1 1 1,892 1,729 — 1,157,576 394 — — 1 — — — — —C ( ( (9,922) (52,500) (15,138,177) (28,945,249) (147) ( ( ( — (14,598) (20,970,648) (25,799,541) — — — ( — — — — —N 4 ( 90,305 231,576 (22,743,040) (19,431,530) 5,477,203
— — — 1 — — — — —
O — — — 8 — — — 996 — — — — 5 — — — — — — — — 2 — — — 996 — 5 1 4 562,432 171,699 2,056,779 (26,031,738) 5,676,513 1 1 6 2,061,484 1,889,785 81,572,213 107,603,951 — $6 $2,623,916 $2,061,484 $ 83,628,992 $ 81,572,213 $ 5,676,513
$ (3 (9 $ (3,505) $ (1,289) $ 560,590 $ (332,173) $ (907)
1 1 4 221,034 195,042 3,668,073 4,752,936 — 5 3 5,171 27,098 612,273 1,520,476 534,004
6 2 4 4,442 4,708 — 98,839 2,287 ( ( ( (967) (5,814) (1,287,306) (2,704,178) (14)
4 1 ( 8,646 25,992 (675,033) (1,084,863) 536,277 6 1 3 229,680 221,034 2,993,040 3,668,073 536,277 1 6 10,425 10,120 4,385,394 5,102,884 — 1 2 1 — 1,803 510,938 1,633,512 10,650
1 1 7 174 194 — 111,443 37 ( ( ( — (1,692) (1,832,161) (2,462,445) —
7 6 ( 174 305 (1,321,223) (717,490) 10,687 2 1 7 10,599 10,425 3,064,171 4,385,394 10,687
— — 7 — — — — —
S — — 1 — — — — —S — — 8 — — — — —
— — ( — — — — — — — ( — — — — —
— — 7 — — — — —
L L Lazard Lazard Lazard Equity I I International Equity Advantage Portfolio International Small Cap Equity Portfolio Franchise Portfolio _ _ ________________________________________________ ________________________________________________ _____________________ Y Y Y Y Year Ended Period Ended Year Ended Year Ended Period Ended D D D D December 31, December 31, December 31, December 31, December 31, 2 2 2 2 2017 2016 2017 2016 2017 (a)
Annual Report 71
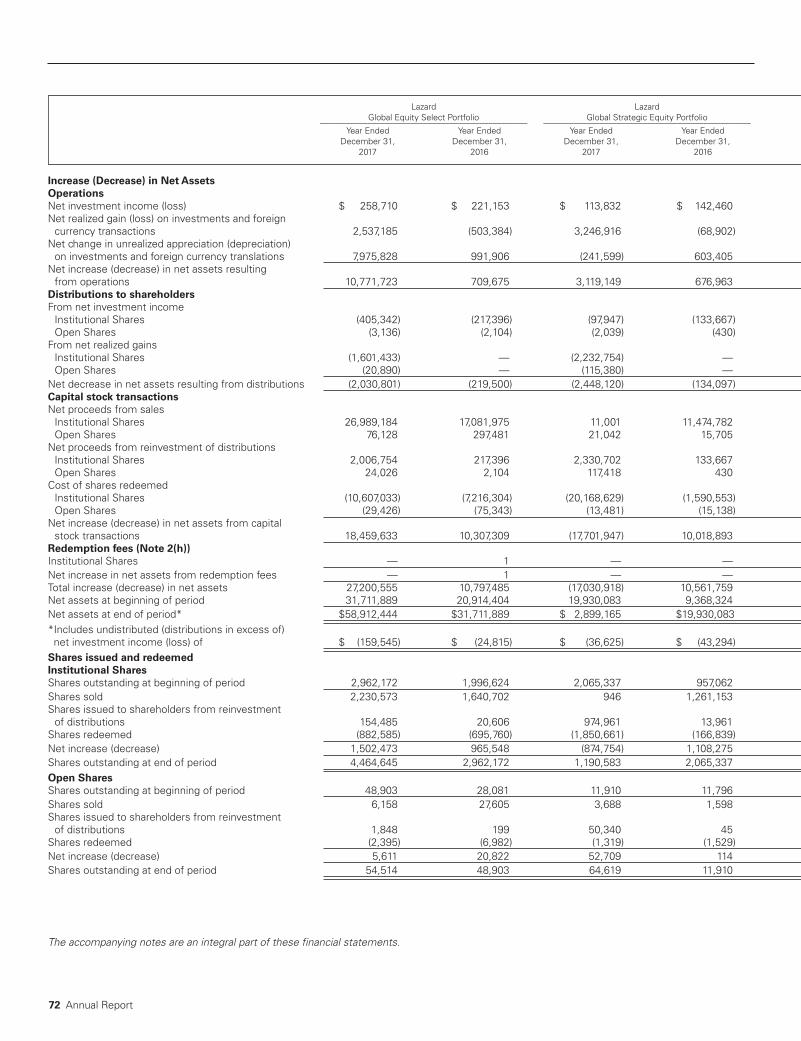
Increase (Decrease) in Net AssetsOperationsNet investment income (loss) $ 258,710 $ 221,153 $ 113,832 $ 142,460 Net realized gain (loss) on investments and foreign currency transactions 2,537,185 (503,384) 3,246,916 (68,902) Net change in unrealized appreciation (depreciation) on investments and foreign currency translations 7,975,828 991,906 (241,599) 603,405 Net increase (decrease) in net assets resulting from operations 10,771,723 709,675 3,119,149 676,963 Distributions to shareholdersFrom net investment income Institutional Shares (405,342) (217,396) (97,947) (133,667) Open Shares (3,136) (2,104) (2,039) (430) From net realized gains Institutional Shares (1,601,433) — (2,232,754) — ( Open Shares (20,890) — (115,380) — ( Net decrease in net assets resulting from distributions (2,030,801) (219,500) (2,448,120) (134,097) Capital stock transactionsNet proceeds from sales Institutional Shares 26,989,184 17,081,975 11,001 11,474,782 Open Shares 76,128 297,481 21,042 15,705 Net proceeds from reinvestment of distributions Institutional Shares 2,006,754 217,396 2,330,702 133,667 Open Shares 24,026 2,104 117,418 430 Cost of shares redeemed Institutional Shares (10,607,033) (7,216,304) (20,168,629) (1,590,553) Open Shares (29,426) (75,343) (13,481) (15,138) Net increase (decrease) in net assets from capital stock transactions 18,459,633 10,307,309 (17,701,947) 10,018,893 Redemption fees (Note 2(h))Institutional Shares — 1 — — — —Net increase in net assets from redemption fees — 1 — — — —Total increase (decrease) in net assets 27,200,555 10,797,485 (17,030,918) 10,561,759 Net assets at beginning of period 31,711,889 20,914,404 19,930,083 9,368,324 Net assets at end of period* $58,912,444 $31,711,889 $ 2,899,165 $19,930,083 *Includes undistributed (distributions in excess of)net investment income (loss) of $ (159,545) $ (24,815) $ (36,625) $ (43,294) Shares issued and redeemedInstitutional SharesShares outstanding at beginning of period 2,962,172 1,996,624 2,065,337 957,062 Shares sold 2,230,573 1,640,702 946 1,261,153 Shares issued to shareholders from reinvestment of distributions 154,485 20,606 974,961 13,961 Shares redeemed (882,585) (695,760) (1,850,661) (166,839) Net increase (decrease) 1,502,473 965,548 (874,754) 1,108,275 Shares outstanding at end of period 4,464,645 2,962,172 1,190,583 2,065,337 Open SharesShares outstanding at beginning of period 48,903 28,081 11,910 11,796 Shares sold 6,158 27,605 3,688 1,598 Shares issued to shareholders from reinvestment of distributions 1,848 199 50,340 45 Shares redeemed (2,395) (6,982) (1,319) (1,529) Net increase (decrease) 5,611 20,822 52,709 114 Shares outstanding at end of period 54,514 48,903 64,619 11,910
The accompanying notes are an integral part of these financial statements.
Lazard Lazard L Global Equity Select Portfolio Global Strategic Equity Portfolio M ________________________________________________ ________________________________________________ _ Year Ended Year Ended Year Ended Year Ended Y Y December 31, December 31, December 31, December 31, D D 2017 2016 2017 2016 2 2
72 Annual Report

Annual Report 73
$ 2 $ 55,899 $ 45,582
2 3 208,441 (728)
( 356,438 115,621
1 3 620,778 160,475
( (57,012) (52,264) ( ( (3,398) (3,182)
( — ( (106,249) — ( — ( (8,094) —
( ( (174,753) (55,446)
2 1 1,184,556 136,000 7 2 103,001 36,078
2 2 163,260 52,264 2 1 11,493 3,182
( ( ( (15,062) (60,203) ( ( ( (1,254) (50,836)
1 1 1,445,994 116,485
— 1 — — — —
— 1 — — — —T 2 1 1,892,019 221,514
3 2 1 2,602,886 2,381,372 $5 $4,494,905 $2,602,886
$ (1 $ (844) $ (3,799)
2 1 2 243,326 229,926 2 1 9 105,129 14,243
1 2 9 14,184 5,204 ( ( ( (1,339) (6,047)
1 ( 117,974 13,400 4 2 1 361,300 243,326 4 2 1 17,240 18,287 6 3 9,125 3,594
1 1 5 999 317 ( ( ( (109) (4,958)
5 5 10,015 (1,047) 5 4 6 27,255 17,240
L L Lazard G G Managed Equity Volatility Portfolio _ _ _____________________________________________ Y Y Y Y Year Ended Year Ended D D D D December 31, December 31, 2 2 2 2 2017 2016

The accompanying notes are an integral part of these financial statements.
The Lazard Funds, Inc. Financial Highlights
LAZARD US EQUITY CONCENTRATED PORTFOLIO
Institutional SharesNet asset value, beginning of period $ 14.16 $ 13.83 $ 13.41 $ 12.59 $ 10.71Income (loss) from investment operations:Net investment income (loss) (a) 0.14 0.06^ 0.05 0.11 0.14Net realized and unrealized gain (loss) 2.05 0.97 0.88 2.23 3.02
Total from investment operations 2.19 1.03 0.93 2.34 3.16Less distributions from:Net investment income (0.14) (0.05) (0.04) (0.09) (0.14)Net realized gains (0.90) (0.65) (0.47) (1.43) (1.14)
Total distributions (1.04) (0.70) (0.51) (1.52) (1.28)
Redemption fees — —(b) —(b) —(b) —(b)
Net asset value, end of period $ 15.31 $ 14.16 $ 13.83 $ 13.41 $ 12.59
Total Return (c) 15.49% 7.37%^ 7.00% 18.88% 29.59%
Ratios and Supplemental Data:Net assets, end of period (in thousands) $1,508,581 $1,230,377 $715,766 $331,074 $228,478Ratios to average net assets:Net expenses 0.75% 0.77%^ 0.79% 0.81% 0.85%Gross expenses 0.75% 0.77% 0.79% 0.81% 0.85%Net investment income (loss) 0.90% 0.39%^ 0.36% 0.79% 1.16%Portfolio turnover rate 86% 84% 74% 63% 108%
Open SharesNet asset value, beginning of period $ 14.25 $ 13.92 $ 13.50 $12.68 $10.77Income (loss) from investment operations:Net investment income (loss) (a) 0.10 0.02^ 0.01 0.05 0.09Net realized and unrealized gain (loss) 2.07 0.97 0.88 2.23 3.04
Total from investment operations 2.17 0.99 0.89 2.28 3.13Less distributions from:Net investment income (0.10) (0.01) —(b) (0.03) (0.08)Net realized gains (0.90) (0.65) (0.47) (1.43) (1.14)
Total distributions (1.00) (0.66) (0.47) (1.46) (1.22)
Redemption fees — —(b) —(b) —(b) —
Net asset value, end of period $ 15.42 $ 14.25 $ 13.92 $13.50 $12.68
Total Return (c) 15.22% 7.06%^ 6.67% 18.28% 29.21%
Ratios and Supplemental Data:Net assets, end of period (in thousands) $87,603 $105,619 $114,348 $8,011 $2,181Ratios to average net assets:Net expenses 1.03% 1.03%^ 1.07% 1.25% 1.25%Gross expenses 1.03% 1.03% 1.07% 1.46% 1.87%Net investment income (loss) 0.62% 0.17%^ 0.08% 0.37% 0.74%Portfolio turnover rate 86% 84% 74% 63% 108%
Year EndedSelected data for a share of capital _________________________________________________________________________________________________________________________________
stock outstanding throughout each period 12/31/17 12/31/16 12/31/15 12/31/14 12/31/13
Year EndedSelected data for a share of capital _________________________________________________________________________________________________________________________________
stock outstanding throughout each period 12/31/17 12/31/16 12/31/15 12/31/14 12/31/13
74 Annual Report
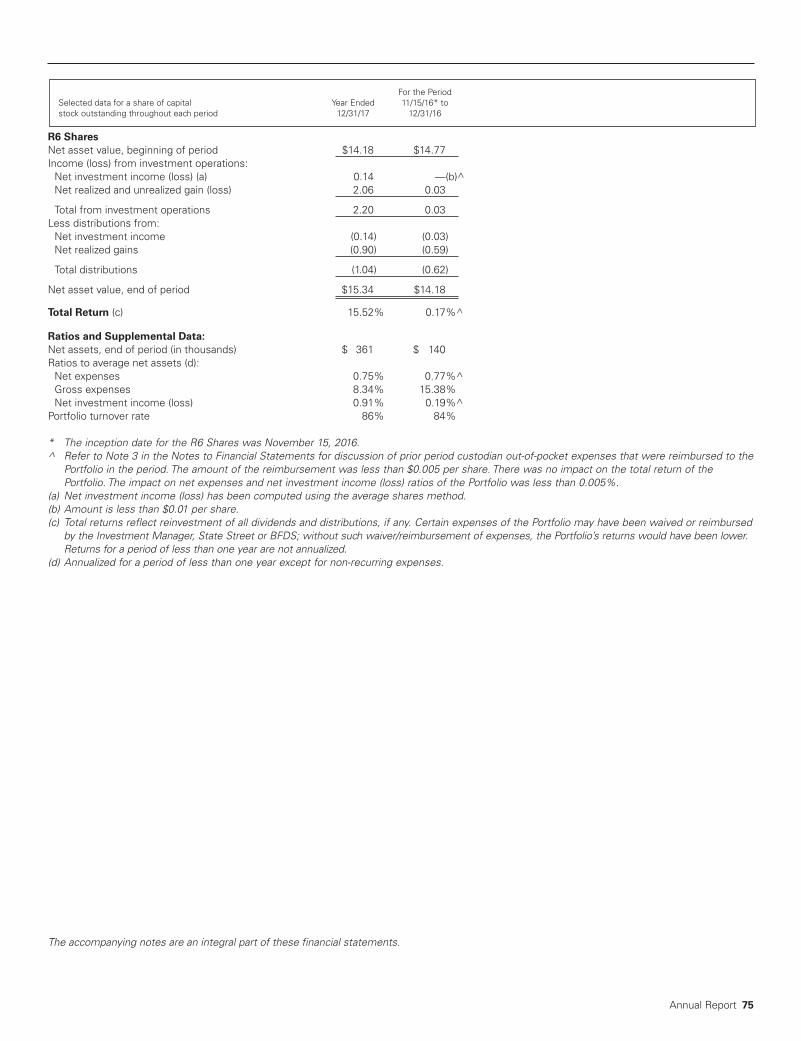
The accompanying notes are an integral part of these financial statements.
R6 SharesNet asset value, beginning of period $14.18 $14.77Income (loss) from investment operations:Net investment income (loss) (a) 0.14 —(b)^Net realized and unrealized gain (loss) 2.06 0.03
Total from investment operations 2.20 0.03Less distributions from:Net investment income (0.14) (0.03)Net realized gains (0.90) (0.59)
Total distributions (1.04) (0.62)
Net asset value, end of period $15.34 $14.18
Total Return (c) 15.52% 0.17%^
Ratios and Supplemental Data:Net assets, end of period (in thousands) $ 361 $ 140Ratios to average net assets (d):Net expenses 0.75% 0.77%^Gross expenses 8.34% 15.38%Net investment income (loss) 0.91% 0.19%^Portfolio turnover rate 86% 84%
* The inception date for the R6 Shares was November 15, 2016.^ Refer to Note 3 in the Notes to Financial Statements for discussion of prior period custodian out- of- pocket expenses that were reimbursed to thePortfolio in the period. The amount of the reimbursement was less than $0.005 per share. There was no impact on the total return of thePortfolio. The impact on net expenses and net investment income (loss) ratios of the Portfolio was less than 0.005%.
(a) Net investment income (loss) has been computed using the average shares method.(b) Amount is less than $0.01 per share.(c) Total returns reflect reinvestment of all dividends and distributions, if any. Certain expenses of the Portfolio may have been waived or reimbursedby the Investment Manager, State Street or BFDS; without such waiver/reimbursement of expenses, the Portfolio’s returns would have been lower.Returns for a period of less than one year are not annualized.
(d) Annualized for a period of less than one year except for non- recurring expenses.
For the PeriodSelected data for a share of capital Year Ended 11/15/16* tostock outstanding throughout each period 12/31/17 12/31/16
Annual Report 75

The accompanying notes are an integral part of these financial statements.
LAZARD US STRATEGIC EQUITY PORTFOLIO
Institutional SharesNet asset value, beginning of period $ 11.63 $ 10.97 $ 12.43 $ 12.49 $ 10.11Income (loss) from investment operations:Net investment income (loss) (a) 0.14 0.12 0.09 0.14 0.14Net realized and unrealized gain (loss) 1.94 0.94 (0.69) 1.73 2.72
Total from investment operations 2.08 1.06 (0.60) 1.87 2.86Less distributions from:Net investment income (0.21) (0.10) (0.10) (0.13) (0.15)Net realized gains (1.07) (0.30) (0.76) (1.80) (0.33)
Total distributions (1.28) (0.40) (0.86) (1.93) (0.48)
Redemption fees — —(b) —(b) —(b) —(b)
Net asset value, end of period $ 12.43 $ 11.63 $ 10.97 $ 12.43 $ 12.49
Total Return (c) 18.17% 9.70% –4.75% 15.04% 28.38%
Ratios and Supplemental Data:Net assets, end of period (in thousands) $72,958 $72,151 $110,243 $119,941 $116,323Ratios to average net assets:Net expenses 0.75% 0.75% 0.75% 0.75% 0.75%Gross expenses 0.95% 0.94% 0.90% 0.90% 0.93%Net investment income (loss) 1.10% 1.08% 0.77% 1.05% 1.21%Portfolio turnover rate 74% 68% 75% 69% 71%
Open SharesNet asset value, beginning of period $ 11.68 $ 11.01 $12.48 $12.53 $10.14Income (loss) from investment operations:Net investment income (loss) (a) 0.10 0.09 0.06 0.10 0.11Net realized and unrealized gain (loss) 1.94 0.94 (0.71) 1.74 2.73
Total from investment operations 2.04 1.03 (0.65) 1.84 2.84Less distributions from:Net investment income (0.17) (0.06) (0.06) (0.09) (0.12)Net realized gains (1.07) (0.30) (0.76) (1.80) (0.33)
Total distributions (1.24) (0.36) (0.82) (1.89) (0.45)
Net asset value, end of period $12.48 $ 11.68 $ 11.01 $12.48 $12.53
Total Return (c) 17.75% 9.46% –5.11% 14.77% 28.04%
Ratios and Supplemental Data:Net assets, end of period (in thousands) $1,013 $1,376 $1,536 $6,833 $ 7,650Ratios to average net assets:Net expenses 1.05% 1.05% 1.05% 1.05% 1.05%Gross expenses 2.30% 2.13% 1.51% 1.31% 1.33%Net investment income (loss) 0.79% 0.80% 0.50% 0.75% 0.95%Portfolio turnover rate 74% 68% 75% 69% 71%
Year EndedSelected data for a share of capital _________________________________________________________________________________________________________________________________
stock outstanding throughout each period 12/31/17 12/31/16 12/31/15 12/31/14 12/31/13
Year EndedSelected data for a share of capital _________________________________________________________________________________________________________________________________
stock outstanding throughout each period 12/31/17 12/31/16 12/31/15 12/31/14 12/31/13
76 Annual Report
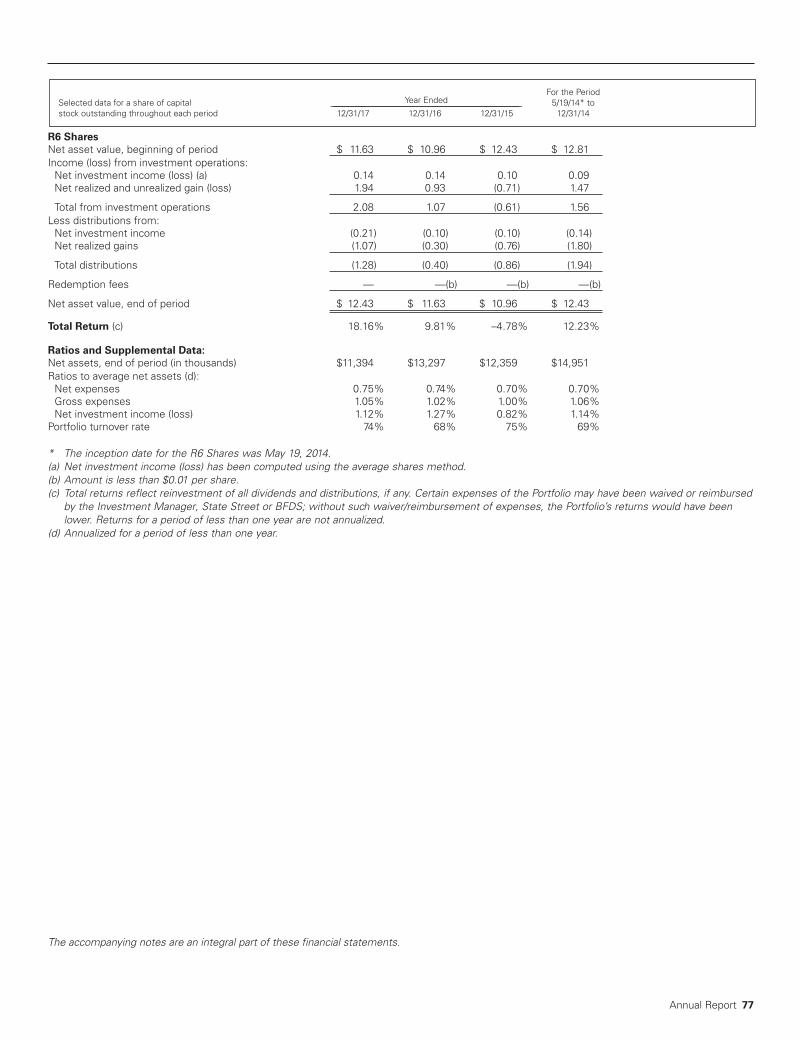
The accompanying notes are an integral part of these financial statements.
R6 SharesNet asset value, beginning of period $ 11.63 $ 10.96 $ 12.43 $ 12.81Income (loss) from investment operations:Net investment income (loss) (a) 0.14 0.14 0.10 0.09Net realized and unrealized gain (loss) 1.94 0.93 (0.71) 1.47
Total from investment operations 2.08 1.07 (0.61) 1.56Less distributions from:Net investment income (0.21) (0.10) (0.10) (0.14)Net realized gains (1.07) (0.30) (0.76) (1.80)
Total distributions (1.28) (0.40) (0.86) (1.94)
Redemption fees — —(b) —(b) —(b)
Net asset value, end of period $ 12.43 $ 11.63 $ 10.96 $ 12.43
Total Return (c) 18.16% 9.81% –4.78% 12.23%
Ratios and Supplemental Data:Net assets, end of period (in thousands) $11,394 $13,297 $12,359 $14,951Ratios to average net assets (d):Net expenses 0.75% 0.74% 0.70% 0.70%Gross expenses 1.05% 1.02% 1.00% 1.06%Net investment income (loss) 1.12% 1.27% 0.82% 1.14%Portfolio turnover rate 74% 68% 75% 69%
* The inception date for the R6 Shares was May 19, 2014.(a) Net investment income (loss) has been computed using the average shares method.(b) Amount is less than $0.01 per share.(c) Total returns reflect reinvestment of all dividends and distributions, if any. Certain expenses of the Portfolio may have been waived or reimbursedby the Investment Manager, State Street or BFDS; without such waiver/reimbursement of expenses, the Portfolio’s returns would have beenlower. Returns for a period of less than one year are not annualized.
(d) Annualized for a period of less than one year.
Year Ended
For the PeriodSelected data for a share of capital _______________________________________________________________________ 5/19/14* tostock outstanding throughout each period 12/31/17 12/31/16 12/31/15 12/31/14
Annual Report 77

The accompanying notes are an integral part of these financial statements.
78 Annual Report
LAZARD US SMALL- MID CAP EQUITY PORTFOLIO
Institutional SharesNet asset value, beginning of period $ 14.50 $ 12.86 $ 14.05 $ 15.97 $ 13.29Income (loss) from investment operations:Net investment income (loss) (a) 0.06 0.11^ 0.02 0.03 0.01Net realized and unrealized gain (loss) 1.95 1.96 (0.34) 1.74 4.70
Total from investment operations 2.01 2.07 (0.32) 1.77 4.71Less distributions from:Net investment income (0.09) (0.09) —(b) (0.01) (0.01)Net realized gains (1.77) (0.34) (0.87) (3.68) (2.02)
Total distributions (1.86) (0.43) (0.87) (3.69) (2.03)
Redemption fees — —(b) —(b) —(b) —(b)
Net asset value, end of period $ 14.65 $ 14.50 $ 12.86 $ 14.05 $ 15.97
Total Return (c) 14.12% 16.28%^ –2.14% 11.39% 35.81%
Ratios and Supplemental Data:Net assets, end of period (in thousands) $176,975 $189,593 $171,152 $157,742 $353,565Ratios to average net assets:Net expenses 0.87% 0.86%^ 0.91% 0.86% 0.86%Gross expenses 0.87% 0.90% 0.91% 0.86% 0.86%Net investment income (loss) 0.39% 0.84%^ 0.13% 0.17% 0.06%Portfolio turnover rate 79% 91% 91% 91% 101%
Open SharesNet asset value, beginning of period $ 13.68 $ 12.16 $ 13.38 $ 15.41 $ 12.92Income (loss) from investment operations:Net investment income (loss) (a) 0.01 0.06^ (0.02) (0.02) (0.04)Net realized and unrealized gain (loss) 1.84 1.85 (0.33) 1.67 4.56
Total from investment operations 1.85 1.91 (0.35) 1.65 4.52Less distributions from:Net investment income (0.04) (0.05) —(b) — (0.01)Net realized gains (1.77) (0.34) (0.87) (3.68) (2.02)
Total distributions (1.81) (0.39) (0.87) (3.68) (2.03)
Redemption fees — —(b) —(b) —(b) —(b)
Net asset value, end of period $ 13.72 $ 13.68 $ 12.16 $ 13.38 $ 15.41
Total Return (c) 13.82% 15.92%^ –2.47% 11.01% 35.47%
Ratios and Supplemental Data:Net assets, end of period (in thousands) $25,973 $30,332 $36,860 $15,851 $14,665Ratios to average net assets:Net expenses 1.17% 1.16%^ 1.20% 1.20% 1.20%Gross expenses 1.17% 1.20% 1.20% 1.20% 1.20%Net investment income (loss) 0.09% 0.51%^ –0.13% –0.15% –0.27%Portfolio turnover rate 79% 91% 91% 91% 101%
^ Refer to Note 3 in the Notes to Financial Statements for discussion of prior period custodian out- of- pocket expenses that were reimbursed to thePortfolio in the period. The impact on the net investment income per share amount was $0.01 per share. There was a 0.08% impact on the totalreturn of the Institutional Shares class of the Portfolio. There was a 0.04% impact on the net expenses and net investment income (loss) ratiosof the Portfolio.
(a) Net investment income (loss) has been computed using the average shares method.(b) Amount is less than $0.01 per share.(c) Total returns reflect reinvestment of all dividends and distributions, if any.
Year EndedSelected data for a share of capital _________________________________________________________________________________________________________________________________
stock outstanding throughout each period 12/31/17 12/31/16 12/31/15 12/31/14 12/31/13
Year EndedSelected data for a share of capital _________________________________________________________________________________________________________________________________
stock outstanding throughout each period 12/31/17 12/31/16 12/31/15 12/31/14 12/31/13

The accompanying notes are an integral part of these financial statements.
LAZARD INTERNATIONAL EQUITY PORTFOLIO
Institutional SharesNet asset value, beginning of period $ 16.20 $ 17.08 $ 16.93 $ 17.85 $ 14.78Income (loss) from investment operations:Net investment income (loss) (a) 0.26 0.27^ 0.27 0.26 0.23Net realized and unrealized gain (loss) 3.43 (0.98) — (1.02) 2.85
Total from investment operations 3.69 (0.71) 0.27 (0.76) 3.08Less distributions from:Net investment income (0.28) (0.17) (0.12) (0.16) (0.01)
Total distributions (0.28) (0.17) (0.12) (0.16) (0.01)
Redemption fees — —(b) —(b) —(b) —(b)
Net asset value, end of period $ 19.61 $ 16.20 $ 17.08 $ 16.93 $ 17.85
Total Return (c) 22.81% –4.18%^ 1.62% –4.29% 20.84%
Ratios and Supplemental Data:Net assets, end of period (in thousands) $2,835,262 $1,511,516 $736,272 $378,488 $185,199Ratios to average net assets:Net expenses 0.81% 0.82%^ 0.86% 0.90% 0.95%Gross expenses 0.81% 0.84% 0.87% 0.90% 0.95%Net investment income (loss) 1.44% 1.62%^ 1.50% 1.46% 1.42%Portfolio turnover rate 31% 25% 30% 36% 43%
Open SharesNet asset value, beginning of period $ 16.38 $ 17.23 $ 17.07 $ 18.00 $ 14.94Income (loss) from investment operations:Net investment income (loss) (a) 0.30 0.13^ 0.23 0.27 0.19Net realized and unrealized gain (loss) 3.38 (0.90) — (1.09) 2.88
Total from investment operations 3.68 (0.77) 0.23 (0.82) 3.07Less distributions from:Net investment income (0.23) (0.08) (0.07) (0.11) (0.01)
Total distributions (0.23) (0.08) (0.07) (0.11) (0.01)
Redemption fees — —(b) —(b) —(b) —(b)
Net asset value, end of period $ 19.83 $ 16.38 $ 17.23 $ 17.07 $ 18.00
Total Return (c) 22.50% –4.46%^ 1.36% –4.57% 20.55%
Ratios and Supplemental Data:Net assets, end of period (in thousands) $275,014 $1,073,486 $80,221 $57,350 $42,370Ratios to average net assets:Net expenses 1.06% 1.07%^ 1.14% 1.17% 1.23%Gross expenses 1.06% 1.10% 1.14% 1.17% 1.23%Net investment income (loss) 1.69% 0.80%^ 1.29% 1.49% 1.18%Portfolio turnover rate 31% 25% 30% 36% 43%
Year EndedSelected data for a share of capital _________________________________________________________________________________________________________________________________
stock outstanding throughout each period 12/31/17 12/31/16 12/31/15 12/31/14 12/31/13
Year EndedSelected data for a share of capital _________________________________________________________________________________________________________________________________
stock outstanding throughout each period 12/31/17 12/31/16 12/31/15 12/31/14 12/31/13
Annual Report 79

The accompanying notes are an integral part of these financial statements.
R6 SharesNet asset value, beginning of period $ 16.18 $ 17.07 $ 17.94Income (loss) from investment operations:Net investment income (loss) (a) 0.31 0.31^ 0.21Net realized and unrealized gain (loss) 3.38 (1.02) (0.95)
Total from investment operations 3.69 (0.71) (0.74)Less distributions from:Net investment income (0.28) (0.18) (0.13)
Total distributions (0.28) (0.18) (0.13)
Net asset value, end of period $ 19.59 $ 16.18 $ 17.07
Total Return (c) 22.85% –4.17%^ –4.10%
Ratios and Supplemental Data:Net assets, end of period (in thousands) $693,744 $79,119 $49,387Ratios to average net assets (d):Net expenses 0.80% 0.80%^ 0.80%Gross expenses 0.81% 0.86% 0.92%Net investment income (loss) 1.68% 1.88%^ 1.55%Portfolio turnover rate 31% 25% 30%
* The inception date for the R6 Shares was April 1, 2015.^ Refer to Note 3 in the Notes to Financial Statements for discussion of prior period custodian out- of- pocket expenses that were reimbursed to thePortfolio in the period. The amount of the reimbursement was less than $0.005 per share. There was no impact on the total return of thePortfolio. There was a 0.02%, 0.03% and 0.02% impact on the net expenses and net investment income (loss) ratios of the Portfolio’sInstitutional, Open and R6 Shares, respectively.
(a) Net investment income (loss) has been computed using the average shares method.(b) Amount is less than $0.01 per share.(c) Total returns reflect reinvestment of all dividends and distributions, if any. Certain expenses of the Portfolio may have been waived or reimbursedby the Investment Manager, State Street or BFDS; without such waiver/reimbursement of expenses, the Portfolio’s returns would have beenlower. Returns for a period of less than one year are not annualized.
(d) Annualized for a period of less than one year.
Year Ended
For the PeriodSelected data for a share of capital ______________________________ 4/1/15* tostock outstanding throughout each period 12/31/17 12/31/16 12/31/15
80 Annual Report
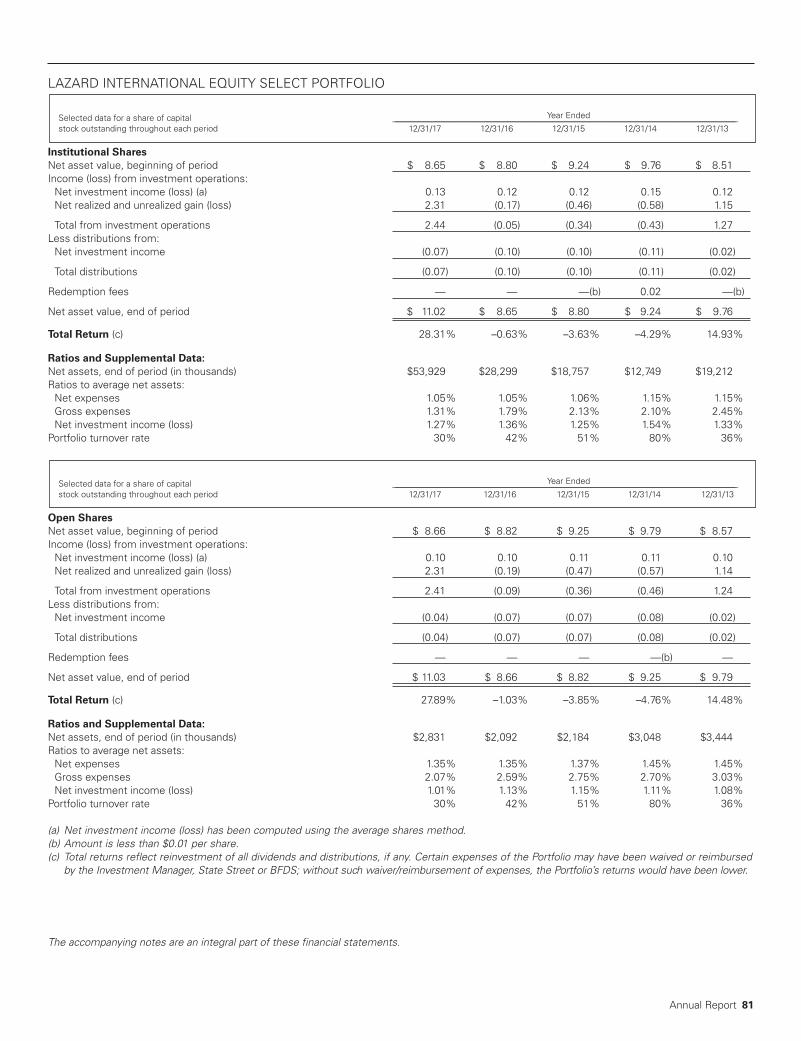
The accompanying notes are an integral part of these financial statements.
LAZARD INTERNATIONAL EQUITY SELECT PORTFOLIO
Institutional SharesNet asset value, beginning of period $ 8.65 $ 8.80 $ 9.24 $ 9.76 $ 8.51Income (loss) from investment operations:Net investment income (loss) (a) 0.13 0.12 0.12 0.15 0.12Net realized and unrealized gain (loss) 2.31 (0.17) (0.46) (0.58) 1.15
Total from investment operations 2.44 (0.05) (0.34) (0.43) 1.27Less distributions from:Net investment income (0.07) (0.10) (0.10) (0.11) (0.02)
Total distributions (0.07) (0.10) (0.10) (0.11) (0.02)
Redemption fees — — —(b) 0.02 —(b)
Net asset value, end of period $ 11.02 $ 8.65 $ 8.80 $ 9.24 $ 9.76
Total Return (c) 28.31% –0.63% –3.63% –4.29% 14.93%
Ratios and Supplemental Data:Net assets, end of period (in thousands) $53,929 $28,299 $18,757 $12,749 $19,212Ratios to average net assets:Net expenses 1.05% 1.05% 1.06% 1.15% 1.15%Gross expenses 1.31% 1.79% 2.13% 2.10% 2.45%Net investment income (loss) 1.27% 1.36% 1.25% 1.54% 1.33%Portfolio turnover rate 30% 42% 51% 80% 36%
Open SharesNet asset value, beginning of period $ 8.66 $ 8.82 $ 9.25 $ 9.79 $ 8.57Income (loss) from investment operations:Net investment income (loss) (a) 0.10 0.10 0.11 0.11 0.10Net realized and unrealized gain (loss) 2.31 (0.19) (0.47) (0.57) 1.14
Total from investment operations 2.41 (0.09) (0.36) (0.46) 1.24Less distributions from:Net investment income (0.04) (0.07) (0.07) (0.08) (0.02)
Total distributions (0.04) (0.07) (0.07) (0.08) (0.02)
Redemption fees — — — —(b) —
Net asset value, end of period $ 11.03 $ 8.66 $ 8.82 $ 9.25 $ 9.79
Total Return (c) 27.89% –1.03% –3.85% –4.76% 14.48%
Ratios and Supplemental Data:Net assets, end of period (in thousands) $2,831 $2,092 $2,184 $3,048 $3,444Ratios to average net assets:Net expenses 1.35% 1.35% 1.37% 1.45% 1.45%Gross expenses 2.07% 2.59% 2.75% 2.70% 3.03%Net investment income (loss) 1.01% 1.13% 1.15% 1.11% 1.08%Portfolio turnover rate 30% 42% 51% 80% 36%
(a) Net investment income (loss) has been computed using the average shares method.(b) Amount is less than $0.01 per share.(c) Total returns reflect reinvestment of all dividends and distributions, if any. Certain expenses of the Portfolio may have been waived or reimbursedby the Investment Manager, State Street or BFDS; without such waiver/reimbursement of expenses, the Portfolio’s returns would have been lower.
Year EndedSelected data for a share of capital _________________________________________________________________________________________________________________________________
stock outstanding throughout each period 12/31/17 12/31/16 12/31/15 12/31/14 12/31/13
Year EndedSelected data for a share of capital _________________________________________________________________________________________________________________________________
stock outstanding throughout each period 12/31/17 12/31/16 12/31/15 12/31/14 12/31/13
Annual Report 81

The accompanying notes are an integral part of these financial statements.
82 Annual Report
LAZARD INTERNATIONAL EQUITY CONCENTRATED PORTFOLIO
Institutional SharesNet asset value, beginning of period $ 8.54 $ 8.27 $ 9.53 $10.00Income (loss) from investment operations:Net investment income (loss) (a) 0.13 0.14 0.10 (0.01)Net realized and unrealized gain (loss) 1.86 0.25 (1.25) (0.45)
Total from investment operations 1.99 0.39 (1.15) (0.46)Less distributions from:Net investment income (0.10) (0.12) (0.11) (0.01)Net realized gains — — — —(b)
Total distributions (0.10) (0.12) (0.11) (0.01)
Redemption fees — — —(b) —
Net asset value, end of period $ 10.43 $ 8.54 $ 8.27 $ 9.53
Total Return (c) 23.29% 4.74% –12.06% –4.60%
Ratios and Supplemental Data:Net assets, end of period (in thousands) $69,440 $15,473 $13,753 $9,103Ratios to average net assets (d):Net expenses 1.05% 1.05% 1.06% 1.15%Gross expenses 1.34% 2.29% 2.96% 7.40%Net investment income (loss) 1.35% 1.64% 1.13% –0.41%Portfolio turnover rate 81% 92% 91% 45%
Open SharesNet asset value, beginning of period $ 8.56 $8.29 $9.53 $10.00Income (loss) from investment operations:Net investment income (loss) (a) 0.10 0.11 0.06 (0.02)Net realized and unrealized gain (loss) 1.86 0.26 (1.22) (0.45)
Total from investment operations 1.96 0.37 (1.16) (0.47)Less distributions from:Net investment income (0.07) (0.10) (0.08) —Net realized gains — — — —(b)
Total distributions (0.07) (0.10) (0.08) —(b)
Redemption fees — — —(b) —
Net asset value, end of period $10.45 $8.56 $8.29 $ 9.53
Total Return (c) 22.87% 4.41% –12.18% –4.66%
Ratios and Supplemental Data:Net assets, end of period (in thousands) $ 220 $ 114 $ 55 $ 559Ratios to average net assets (d):Net expenses 1.35% 1.35% 1.39% 1.45%Gross expenses 8.15% 11.98% 9.93% 12.39%Net investment income (loss) 1.04% 1.32% 0.60% –0.55%Portfolio turnover rate 81% 92% 91% 45%
* The Portfolio commenced operations on August 29, 2014.(a) Net investment income (loss) has been computed using the average shares method.(b) Amount is less than $0.01 per share.(c) Total returns reflect reinvestment of all dividends and distributions, if any. Certain expenses of the Portfolio may have been waived or reimbursedby the Investment Manager, State Street or BFDS; without such waiver/reimbursement of expenses, the Portfolio’s returns would have beenlower. Returns for a period of less than one year are not annualized.
(d) Annualized for a period of less than one year.
Year Ended
For the PeriodSelected data for a share of capital ______________________________________________________________________________ 8/29/14* tostock outstanding throughout each period 12/31/17 12/31/16 12/31/15 12/31/14
Year Ended
For the PeriodSelected data for a share of capital ______________________________________________________________________________ 8/29/14* tostock outstanding throughout each period 12/31/17 12/31/16 12/31/15 12/31/14

The accompanying notes are an integral part of these financial statements.
Annual Report 83
LAZARD INTERNATIONAL STRATEGIC EQUITY PORTFOLIO
Institutional SharesNet asset value, beginning of period $ 12.44 $ 13.33 $ 13.72 $ 14.46 $ 11.71Income (loss) from investment operations:Net investment income (loss) (a) 0.17 0.20^ 0.16 0.19 0.14Net realized and unrealized gain (loss) 3.29 (0.89) (0.40) (0.39) 2.79
Total from investment operations 3.46 (0.69) (0.24) (0.20) 2.93Less distributions from:Net investment income (0.20) (0.20) (0.14) (0.16) (0.10)Net realized gains — — (0.01) (0.38) (0.08)
Total distributions (0.20) (0.20) (0.15) (0.54) (0.18)
Redemption fees — —(b) —(b) —(b) —(b)
Net asset value, end of period $ 15.70 $ 12.44 $ 13.33 $ 13.72 $ 14.46
Total Return (c) 27.85% –5.17%^ –1.70% –1.48% 25.02%
Ratios and Supplemental Data:Net assets, end of period (in thousands) $5,911,184 $5,114,357 $4,923,328 $3,727,391 $2,354,068Ratios to average net assets:Net expenses 0.80% 0.81%^ 0.82% 0.84% 0.86%Gross expenses 0.80% 0.81% 0.82% 0.84% 0.86%Net investment income (loss) 1.20% 1.56%^ 1.15% 1.28% 1.02%Portfolio turnover rate 44% 47% 37% 33% 42%
Open SharesNet asset value, beginning of period $ 12.55 $ 13.44 $ 13.82 $ 14.57 $ 11.80Income (loss) from investment operations:Net investment income (loss) (a) 0.14 0.18^ 0.13 0.16 0.10Net realized and unrealized gain (loss) 3.30 (0.90) (0.40) (0.41) 2.82
Total from investment operations 3.44 (0.72) (0.27) (0.25) 2.92Less distributions from:Net investment income (0.16) (0.17) (0.10) (0.12) (0.07)Net realized gains — — (0.01) (0.38) (0.08)
Total distributions (0.16) (0.17) (0.11) (0.50) (0.15)
Redemption fees — —(b) —(b) —(b) —(b)
Net asset value, end of period $ 15.83 $ 12.55 $ 13.44 $ 13.82 $ 14.57
Total Return (c) 27.44% –5.37%^ –1.89% –1.78% 24.73%
Ratios and Supplemental Data:Net assets, end of period (in thousands) $1,216,861 $1,591,016 $1,783,529 $1,574,106 $868,730Ratios to average net assets:Net expenses 1.06% 1.06%^ 1.08% 1.09% 1.10%Gross expenses 1.06% 1.06% 1.08% 1.09% 1.10%Net investment income (loss) 0.97% 1.34%^ 0.94% 1.06% 0.78%Portfolio turnover rate 44% 47% 37% 33% 42%
Year EndedSelected data for a share of capital _________________________________________________________________________________________________________________________________
stock outstanding throughout each period 12/31/17 12/31/16 12/31/15 12/31/14 12/31/13
Year EndedSelected data for a share of capital _________________________________________________________________________________________________________________________________
stock outstanding throughout each period 12/31/17 12/31/16 12/31/15 12/31/14 12/31/13
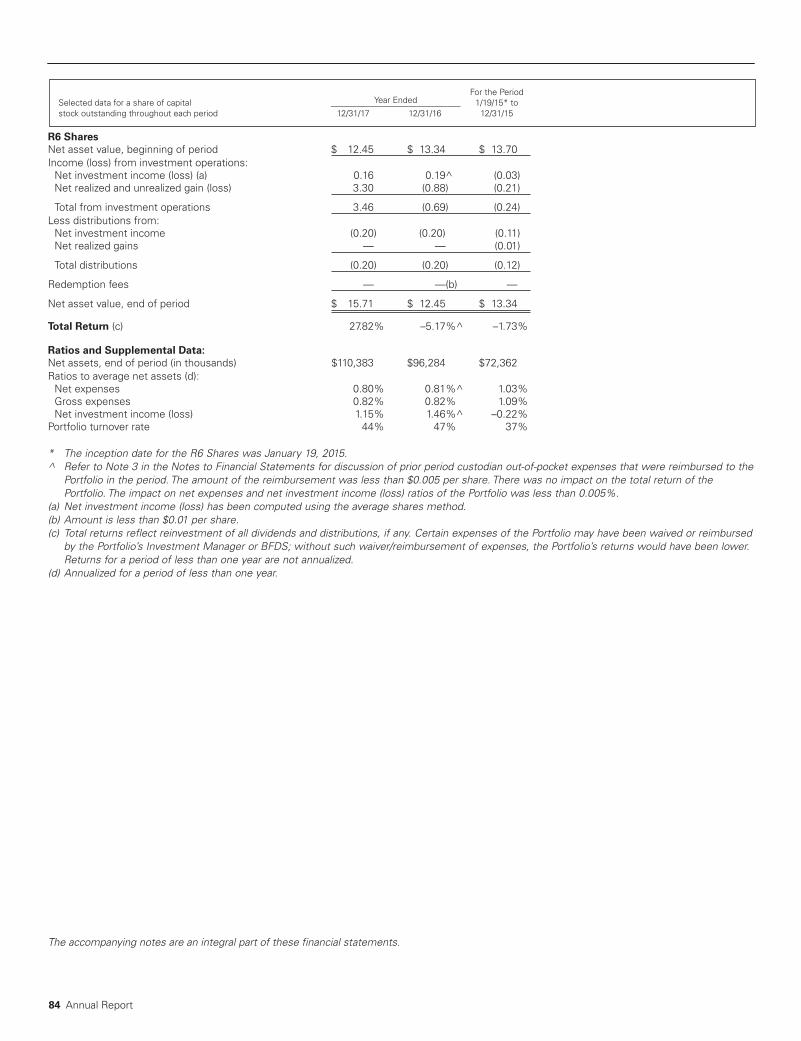
The accompanying notes are an integral part of these financial statements.
R6 SharesNet asset value, beginning of period $ 12.45 $ 13.34 $ 13.70Income (loss) from investment operations:Net investment income (loss) (a) 0.16 0.19^ (0.03)Net realized and unrealized gain (loss) 3.30 (0.88) (0.21)
Total from investment operations 3.46 (0.69) (0.24)Less distributions from:Net investment income (0.20) (0.20) (0.11)Net realized gains — — (0.01)
Total distributions (0.20) (0.20) (0.12)
Redemption fees — —(b) —
Net asset value, end of period $ 15.71 $ 12.45 $ 13.34
Total Return (c) 27.82% –5.17%^ –1.73%
Ratios and Supplemental Data:Net assets, end of period (in thousands) $110,383 $96,284 $72,362Ratios to average net assets (d):Net expenses 0.80% 0.81%^ 1.03%Gross expenses 0.82% 0.82% 1.09%Net investment income (loss) 1.15% 1.46%^ –0.22%Portfolio turnover rate 44% 47% 37%
* The inception date for the R6 Shares was January 19, 2015.^ Refer to Note 3 in the Notes to Financial Statements for discussion of prior period custodian out- of- pocket expenses that were reimbursed to thePortfolio in the period. The amount of the reimbursement was less than $0.005 per share. There was no impact on the total return of thePortfolio. The impact on net expenses and net investment income (loss) ratios of the Portfolio was less than 0.005%.
(a) Net investment income (loss) has been computed using the average shares method.(b) Amount is less than $0.01 per share.(c) Total returns reflect reinvestment of all dividends and distributions, if any. Certain expenses of the Portfolio may have been waived or reimbursedby the Portfolio’s Investment Manager or BFDS; without such waiver/reimbursement of expenses, the Portfolio’s returns would have been lower.Returns for a period of less than one year are not annualized.
(d) Annualized for a period of less than one year.
Year Ended
For the PeriodSelected data for a share of capital ______________________________ 1/19/15* tostock outstanding throughout each period 12/31/17 12/31/16 12/31/15
84 Annual Report

The accompanying notes are an integral part of these financial statements.
LAZARD INTERNATIONAL EQUITY ADVANTAGE PORTFOLIO
Institutional SharesNet asset value, beginning of period $ 8.91 $ 9.21 $10.00Income (loss) from investment operations:Net investment income (loss) (a) 0.19 0.18 0.04Net realized and unrealized gain (loss) 2.03 (0.28) (0.70)
Total from investment operations 2.22 (0.10) (0.66)Less distributions from:Net investment income (0.21) (0.20) (0.13)
Total distributions (0.21) (0.20) (0.13)
Net asset value, end of period $10.92 $8.91 $9.21
Total Return (b) 24.98% –1.13% –6.63%
Ratios and Supplemental Data:Net assets, end of period (in thousands) $2,508 $1,969 $1,797Ratios to average net assets (c):Net expenses 0.90% 0.90% 0.90%Gross expenses 8.91% 13.12% 14.93%Net investment income (loss) 1.89% 2.08% 0.77%Portfolio turnover rate 88% 92% 58%
Open SharesNet asset value, beginning of period $ 8.91 $ 9.21 $10.00Income (loss) from investment operations:Net investment income (loss) (a) 0.16 0.15 0.03Net realized and unrealized gain (loss) 2.03 (0.28) (0.71)
Total from investment operations 2.19 (0.13) (0.68)Less distributions from:Net investment income (0.18) (0.17) (0.11)
Total distributions (0.18) (0.17) (0.11)
Net asset value, end of period $10.92 $ 8.91 $ 9.21
Total Return (b) 24.60% –1.42% –6.80%
Ratios and Supplemental Data:Net assets, end of period (in thousands) $ 116 $ 93 $ 93Ratios to average net assets (c):Net expenses 1.20% 1.20% 1.20%Gross expenses 20.85% 25.85% 30.10%Net investment income (loss) 1.58% 1.74% 0.47%Portfolio turnover rate 88% 92% 58%
* The Portfolio commenced operations on May 29, 2015.(a) Net investment income (loss) has been computed using the average shares method.(b) Total returns reflect reinvestment of all dividends and distributions, if any. Certain expenses of the Portfolio may have been waived or reimbursedby the Investment Manager, State Street or BFDS; without such waiver/reimbursement of expenses, the Portfolio’s returns would have beenlower. Returns for a period of less than one year are not annualized.
(c) Annualized for a period of less than one year.
Year Ended
For the PeriodSelected data for a share of capital ______________________________ 5/29/15* tostock outstanding throughout each period 12/31/17 12/31/16 12/31/15
Year Ended
For the PeriodSelected data for a share of capital ______________________________ 5/29/15* tostock outstanding throughout each period 12/31/17 12/31/16 12/31/15
Annual Report 85

The accompanying notes are an integral part of these financial statements.
86 Annual Report
LAZARD INTERNATIONAL SMALL CAP EQUITY PORTFOLIO
Institutional SharesNet asset value, beginning of period $ 10.10 $ 10.90 $ 10.01 $ 10.54 $ 8.12Income (loss) from investment operations:Net investment income (loss) (a) 0.10 0.12^ 0.10 0.12 0.11Net realized and unrealized gain (loss) 3.59 (0.62) 0.87 (0.40) 2.34
Total from investment operations 3.69 (0.50) 0.97 (0.28) 2.45Less distributions from:Net investment income — (0.30) (0.08) (0.25) (0.03)
Total distributions — (0.30) (0.08) (0.25) (0.03)
Redemption fees — — —(b) —(b) —
Net asset value, end of period $ 13.79 $ 10.10 $ 10.90 $ 10.01 $ 10.54
Total Return (c) 36.53% –4.64%^ 9.71% –2.77% 30.20%
Ratios and Supplemental Data:Net assets, end of period (in thousands) $41,267 $37,049 $51,828 $46,329 $51,508Ratios to average net assets:Net expenses 1.09% 0.96%^ 1.11% 1.13% 1.13%Gross expenses 1.09% 1.06% 1.11% 1.15% 1.19%Net investment income (loss) 0.85% 1.14%^ 0.91% 1.13% 1.15%Portfolio turnover rate 35% 63% 48% 48% 58%
Open SharesNet asset value, beginning of period $ 10.15 $ 10.93 $ 10.03 $ 10.56 $ 8.17Income (loss) from investment operations:Net investment income (loss) (a) 0.07 0.10^ 0.07 0.09 0.08Net realized and unrealized gain (loss) 3.60 (0.63) 0.88 (0.40) 2.34
Total from investment operations 3.67 (0.53) 0.95 (0.31) 2.42Less distributions from:Net investment income — (0.25) (0.05) (0.22) (0.03)
Total distributions — (0.25) (0.05) (0.22) (0.03)
Redemption fees — —(b) —(b) —(b) —(b)
Net asset value, end of period $ 13.82 $ 10.15 $ 10.93 $ 10.03 $ 10.56
Total Return (c) 36.16% –4.92%^ 9.49% –3.05% 29.65%
Ratios and Supplemental Data:Net assets, end of period (in thousands) $42,362 $44,523 $55,776 $19,994 $19,639Ratios to average net assets:Net expenses 1.34% 1.21%^ 1.38% 1.43% 1.43%Gross expenses 1.34% 1.30% 1.38% 1.44% 1.48%Net investment income (loss) 0.61% 0.91%^ 0.63% 0.85% 0.85%Portfolio turnover rate 35% 63% 48% 48% 58%
^ Refer to Note 3 in the Notes to Financial Statements for discussion of prior period custodian out- of- pocket expenses that were reimbursed to thePortfolio in the period. The impact on the net investment income per share amount was $0.01 per share. There was a 0.10% and 0.09% impacton the total return of the Institutional and Open Shares classes, respectively, of the Portfolio. There was a 0.10% and 0.09% impact on the netexpenses and net investment income (loss) ratios of the Portfolio’s Institutional and Open Shares, respectively.
(a) Net investment income (loss) has been computed using the average shares method.(b) Amount is less than $0.01 per share.(c) Total returns reflect reinvestment of all dividends and distributions, if any. Certain expenses of the Portfolio may have been waived or reimbursedby the Investment Manager, State Street or BFDS; without such waiver/reimbursement of expenses, the Portfolio’s returns would have been lower.
Year EndedSelected data for a share of capital _________________________________________________________________________________________________________________________________
stock outstanding throughout each period 12/31/17 12/31/16 12/31/15 12/31/14 12/31/13
Year EndedSelected data for a share of capital _________________________________________________________________________________________________________________________________
stock outstanding throughout each period 12/31/17 12/31/16 12/31/15 12/31/14 12/31/13

The accompanying notes are an integral part of these financial statements.
LAZARD EQUITY FRANCHISE PORTFOLIO
Institutional SharesNet asset value, beginning of period $10.00Income (loss) from investment operations:Net investment income (loss) (a) 0.03Net realized and unrealized gain (loss) 0.40
Total from investment operations 0.43Less distributions from:Net investment income (0.03)Net realized gains (0.02)
Total distributions (0.05)
Net asset value, end of period $10.38
Total Return (b) 4.25%
Ratios and Supplemental Data:Net assets, end of period (in thousands) $5,566Ratios to average net assets (c):Net expenses 0.95%Gross expenses 3.21%Net investment income (loss) 1.26%Portfolio turnover rate 10%
Open SharesNet asset value, beginning of period $10.00Income (loss) from investment operations:Net investment income (loss) (a) 0.03Net realized and unrealized gain (loss) 0.39
Total from investment operations 0.42Less distributions from:Net investment income (0.02)Net realized gains (0.02)
Total distributions (0.04)
Net asset value, end of period $10.38
Total Return (b) 4.18%
Ratios and Supplemental Data:Net assets, end of period (in thousands) $ 111Ratios to average net assets (c):Net expenses 1.20%Gross expenses 23.62%Net investment income (loss) 1.14%Portfolio turnover rate 10%
* The Portfolio commenced operations on September 29, 2017.(a) Net investment income (loss) has been computed using the average shares method.(b) Total returns reflect reinvestment of all dividends and distributions, if any. Certain expenses of the Portfolio may have been waived or reimbursedby the Investment Manager, State Street or BFDS; without such waiver/reimbursement of expenses, the Portfolio’s returns would have beenlower. Returns for a period of less than one year are not annualized.
(c) Annualized for a period of less than one year except for non-recurring expenses.
For the PeriodSelected data for a share of capital 9/29/17* tostock outstanding throughout the period 12/31/17
For the PeriodSelected data for a share of capital 9/29/17* tostock outstanding throughout the period 12/31/17
Annual Report 87
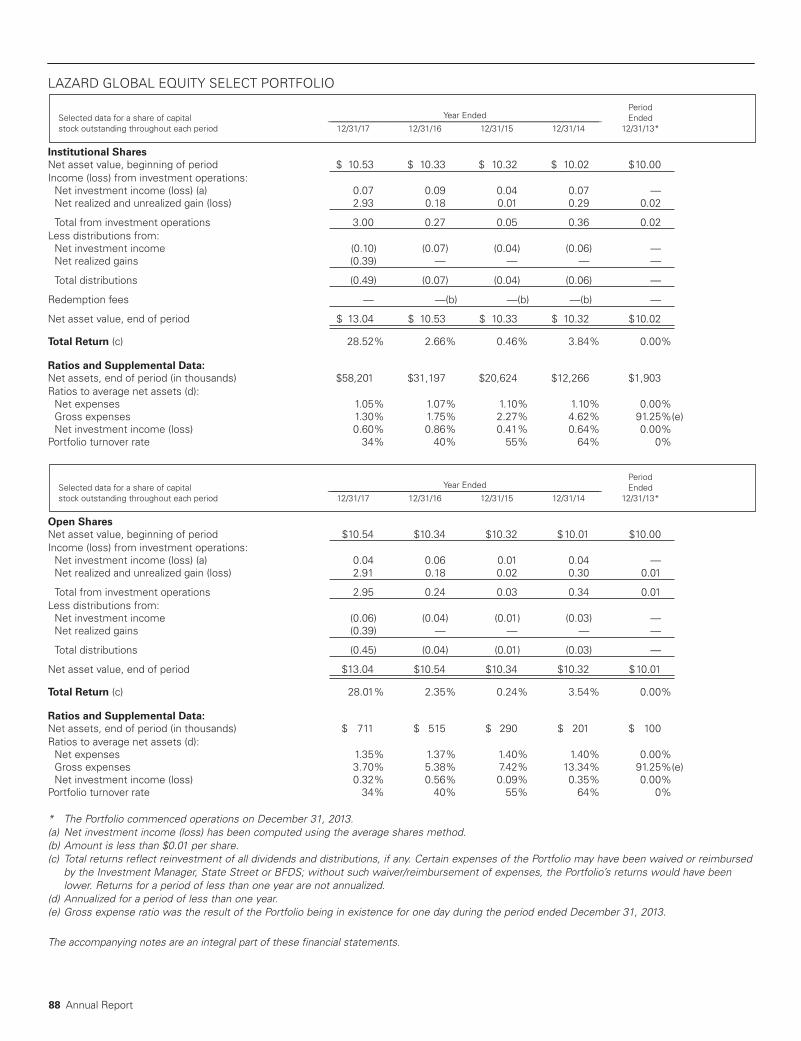
The accompanying notes are an integral part of these financial statements.
LAZARD GLOBAL EQUITY SELECT PORTFOLIO
Institutional SharesNet asset value, beginning of period $ 10.53 $ 10.33 $ 10.32 $ 10.02 $10.00Income (loss) from investment operations:Net investment income (loss) (a) 0.07 0.09 0.04 0.07 —Net realized and unrealized gain (loss) 2.93 0.18 0.01 0.29 0.02
Total from investment operations 3.00 0.27 0.05 0.36 0.02Less distributions from:Net investment income (0.10) (0.07) (0.04) (0.06) —Net realized gains (0.39) — — — —
Total distributions (0.49) (0.07) (0.04) (0.06) —
Redemption fees — —(b) —(b) —(b) —
Net asset value, end of period $ 13.04 $ 10.53 $ 10.33 $ 10.32 $10.02
Total Return (c) 28.52% 2.66% 0.46% 3.84% 0.00%
Ratios and Supplemental Data:Net assets, end of period (in thousands) $58,201 $31,197 $20,624 $12,266 $1,903Ratios to average net assets (d):Net expenses 1.05% 1.07% 1.10% 1.10% 0.00%Gross expenses 1.30% 1.75% 2.27% 4.62% 91.25%(e)Net investment income (loss) 0.60% 0.86% 0.41% 0.64% 0.00%Portfolio turnover rate 34% 40% 55% 64% 0%
Open SharesNet asset value, beginning of period $10.54 $10.34 $10.32 $10.01 $10.00Income (loss) from investment operations:Net investment income (loss) (a) 0.04 0.06 0.01 0.04 —Net realized and unrealized gain (loss) 2.91 0.18 0.02 0.30 0.01
Total from investment operations 2.95 0.24 0.03 0.34 0.01Less distributions from:Net investment income (0.06) (0.04) (0.01) (0.03) —Net realized gains (0.39) — — — —
Total distributions (0.45) (0.04) (0.01) (0.03) —
Net asset value, end of period $13.04 $10.54 $10.34 $10.32 $10.01
Total Return (c) 28.01% 2.35% 0.24% 3.54% 0.00%
Ratios and Supplemental Data:Net assets, end of period (in thousands) $ 711 $ 515 $ 290 $ 201 $ 100Ratios to average net assets (d):Net expenses 1.35% 1.37% 1.40% 1.40% 0.00%Gross expenses 3.70% 5.38% 7.42% 13.34% 91.25%(e)Net investment income (loss) 0.32% 0.56% 0.09% 0.35% 0.00%Portfolio turnover rate 34% 40% 55% 64% 0%
* The Portfolio commenced operations on December 31, 2013.(a) Net investment income (loss) has been computed using the average shares method.(b) Amount is less than $0.01 per share.(c) Total returns reflect reinvestment of all dividends and distributions, if any. Certain expenses of the Portfolio may have been waived or reimbursedby the Investment Manager, State Street or BFDS; without such waiver/reimbursement of expenses, the Portfolio’s returns would have beenlower. Returns for a period of less than one year are not annualized.
(d) Annualized for a period of less than one year.(e) Gross expense ratio was the result of the Portfolio being in existence for one day during the period ended December 31, 2013.
Year Ended
PeriodSelected data for a share of capital ______________________________________________________________________________________________________ Endedstock outstanding throughout each period 12/31/17 12/31/16 12/31/15 12/31/14 12/31/13*
Year Ended
PeriodSelected data for a share of capital ______________________________________________________________________________________________________ Endedstock outstanding throughout each period 12/31/17 12/31/16 12/31/15 12/31/14 12/31/13*
88 Annual Report

The accompanying notes are an integral part of these financial statements.
LAZARD GLOBAL STRATEGIC EQUITY PORTFOLIO
Institutional SharesNet asset value, beginning of period $ 9.59 $ 9.67 $ 9.94 $10.00Income (loss) from investment operations:Net investment income (loss) (a) 0.08 0.07 0.06 —(b)Net realized and unrealized gain (loss) 2.24 (0.08) (0.25) (0.04)
Total from investment operations 2.32 (0.01) (0.19) (0.04)Less distributions from:Net investment income (0.20) (0.07) (0.08) (0.02)Net realized gains (9.40) — — —Return of capital — — — —(b)
Total distributions (9.60) (0.07) (0.08) (0.02)
Net asset value, end of period $ 2.31 $ 9.59 $ 9.67 $ 9.94
Total Return (c) 24.20% –0.15% –1.85% –0.36%
Ratios and Supplemental Data:Net assets, end of period (in thousands) $2,750 $19,816 $9,254 $ 7,112Ratios to average net assets (d):Net expenses 1.10% 1.10% 1.10% 1.10%Gross expenses 2.06% 2.03% 3.83% 7.11%Net investment income (loss) 0.76% 0.76% 0.63% –0.08%Portfolio turnover rate 65% 67% 65% 24%
Open SharesNet asset value, beginning of period $ 9.59 $ 9.67 $ 9.94 $10.00Income (loss) from investment operations:Net investment income (loss) (a) 0.03 0.04 0.03 (0.01)Net realized and unrealized gain (loss) 2.25 (0.08) (0.25) (0.04)
Total from investment operations 2.28 (0.04) (0.22) (0.05)Less distributions from:Net investment income (0.17) (0.04) (0.05) (0.01)Net realized gains (9.40) — — —Return of capital — — — —(b)
Total distributions (9.57) (0.04) (0.05) (0.01)
Net asset value, end of period $ 2.30 $ 9.59 $ 9.67 $ 9.94
Total Return (c) 23.72% –0.45% –2.16% –0.46%
Ratios and Supplemental Data:Net assets, end of period (in thousands) $ 149 $ 114 $ 114 $ 135Ratios to average net assets (d):Net expenses 1.41% 1.40% 1.40% 1.40%Gross expenses 12.33% 13.31% 14.12% 24.52%Net investment income (loss) 0.34% 0.39% 0.30% –0.32%Portfolio turnover rate 65% 67% 65% 24%
* The Portfolio commenced operations on August 29, 2014.(a) Net investment income (loss) has been computed using the average shares method.(b) Amount is less than $0.01 per share.(c) Total returns reflect reinvestment of all dividends and distributions, if any. Certain expenses of the Portfolio may have been waived or reimbursedby the Investment Manager, State Street or BFDS; without such waiver/reimbursement of expenses, the Portfolio’s returns would have beenlower. Returns for a period of less than one year are not annualized.
(d) Annualized for a period of less than one year.
Year Ended
For the PeriodSelected data for a share of capital ______________________________________________________________________________ 8/29/14* tostock outstanding throughout each period 12/31/17 12/31/16 12/31/15 12/31/14
Year Ended
For the PeriodSelected data for a share of capital ______________________________________________________________________________ 8/29/14* tostock outstanding throughout each period 12/31/17 12/31/16 12/31/15 12/31/14
Annual Report 89
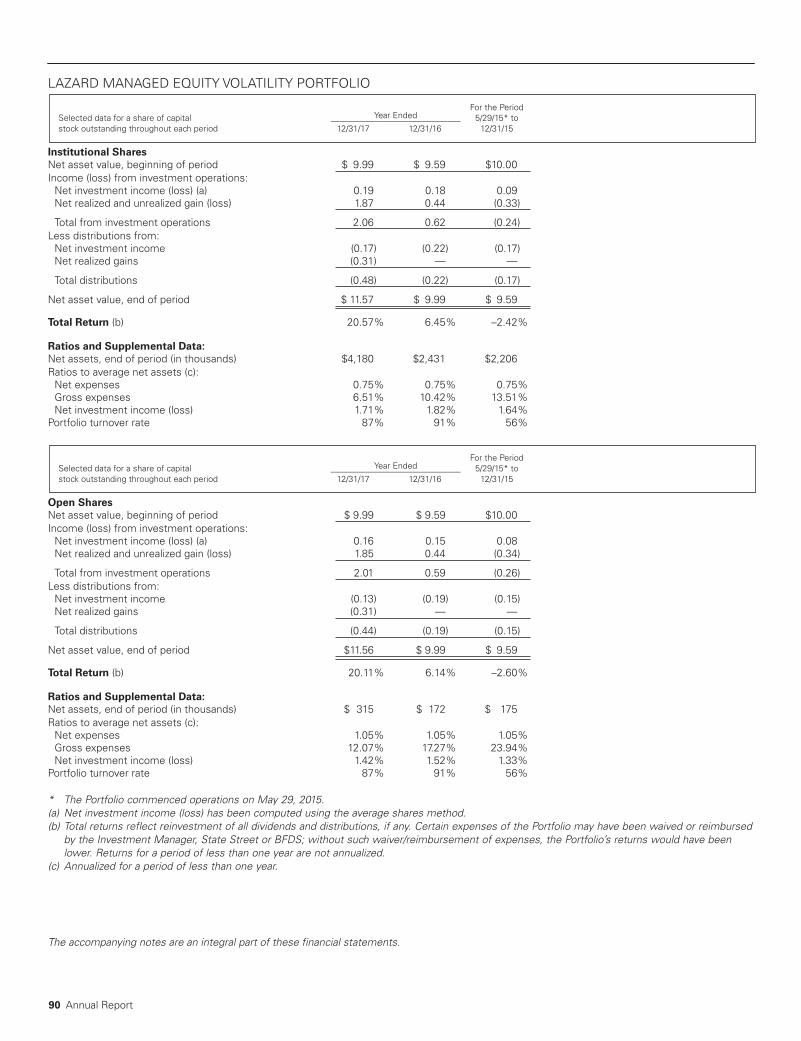
The accompanying notes are an integral part of these financial statements.
LAZARD MANAGED EQUITY VOLATILITY PORTFOLIO
Institutional SharesNet asset value, beginning of period $ 9.99 $ 9.59 $10.00Income (loss) from investment operations:Net investment income (loss) (a) 0.19 0.18 0.09Net realized and unrealized gain (loss) 1.87 0.44 (0.33)
Total from investment operations 2.06 0.62 (0.24)Less distributions from:Net investment income (0.17) (0.22) (0.17)Net realized gains (0.31) — —
Total distributions (0.48) (0.22) (0.17)
Net asset value, end of period $ 11.57 $ 9.99 $ 9.59
Total Return (b) 20.57% 6.45% –2.42%
Ratios and Supplemental Data:Net assets, end of period (in thousands) $4,180 $2,431 $2,206Ratios to average net assets (c):Net expenses 0.75% 0.75% 0.75%Gross expenses 6.51% 10.42% 13.51%Net investment income (loss) 1.71% 1.82% 1.64%Portfolio turnover rate 87% 91% 56%
Open SharesNet asset value, beginning of period $ 9.99 $ 9.59 $10.00Income (loss) from investment operations:Net investment income (loss) (a) 0.16 0.15 0.08Net realized and unrealized gain (loss) 1.85 0.44 (0.34)
Total from investment operations 2.01 0.59 (0.26)Less distributions from:Net investment income (0.13) (0.19) (0.15)Net realized gains (0.31) — —
Total distributions (0.44) (0.19) (0.15)
Net asset value, end of period $11.56 $ 9.99 $ 9.59
Total Return (b) 20.11% 6.14% –2.60%
Ratios and Supplemental Data:Net assets, end of period (in thousands) $ 315 $ 172 $ 175Ratios to average net assets (c):Net expenses 1.05% 1.05% 1.05%Gross expenses 12.07% 17.27% 23.94%Net investment income (loss) 1.42% 1.52% 1.33%Portfolio turnover rate 87% 91% 56%
* The Portfolio commenced operations on May 29, 2015.(a) Net investment income (loss) has been computed using the average shares method.(b) Total returns reflect reinvestment of all dividends and distributions, if any. Certain expenses of the Portfolio may have been waived or reimbursedby the Investment Manager, State Street or BFDS; without such waiver/reimbursement of expenses, the Portfolio’s returns would have beenlower. Returns for a period of less than one year are not annualized.
(c) Annualized for a period of less than one year.
Year Ended
For the PeriodSelected data for a share of capital ______________________________ 5/29/15* tostock outstanding throughout each period 12/31/17 12/31/16 12/31/15
Year Ended
For the PeriodSelected data for a share of capital ______________________________ 5/29/15* tostock outstanding throughout each period 12/31/17 12/31/16 12/31/15
90 Annual Report

Annual Report 91
1. OrganizationThe Lazard Funds, Inc. was incorporated in Marylandon May 17, 1991 and is registered under the Invest-ment Company Act of 1940, as amended (the “1940Act”), as an open-end management investment com-pany. The Fund is comprised of thirty-four no-loadportfolios (each referred to as a “Portfolio”). This reportincludes only the financial statements of US EquityConcentrated, US Strategic Equity, US Small-Mid CapEquity, International Equity, International EquitySelect, International Equity Concentrated, InternationalStrategic Equity, International Equity Advantage, Inter-national Small Cap Equity, Equity Franchise, GlobalEquity Select, Global Strategic Equity and ManagedEquity Volatility Portfolios. The financial statements ofother Portfolios are presented separately.
The Portfolios, other than US Equity Concentrated,International Equity Concentrated and Equity Fran-chise Portfolios, are operated as “diversified” funds,as defined in the 1940 Act.
Each Portfolio currently offers Institutional Shares andOpen Shares, and certain Portfolios offer R6 Shares.Each share class is identical except as to minimuminvestment requirements; eligibility requirements forR6 Shares; the services offered to, and expensesborne by, each class; and the availability of ServicePayments (as defined in the Prospectus).
2. Significant Accounting PoliciesThe accompanying financial statements are presentedin conformity with GAAP. The Fund is an investmentcompany and therefore applies specialized accountingguidance in accordance with Accounting StandardsCodification Topic 946. The following is a summary ofsignificant accounting policies consistently followed bythe Fund in the preparation of the financial statements:
(a) Valuation of Investments—Equity securities tradedon a securities exchange or market, includingexchange-traded option contracts, rights and war-rants, are valued at the last reported sales price (fordomestic equity securities) or the closing price (forforeign equity securities) on the exchange or marketon which the security is principally traded or, for secu-rities trading on the NASDAQ National Market System
(“NASDAQ”), the NASDAQ Official Closing Price. Ifthere is no available closing price for a foreign equitysecurity, the last reported sales price is used. If thereare no reported sales of a security on the valuationdate, the security is valued at the most recent quotedbid price on such date reported by such principalexchange or market. Investments in money marketfunds are valued at the fund’s net asset value (“NAV”)per share.
Calculation of a Portfolio’s NAV may not take placecontemporaneously with the determination of theprices of portfolio assets used in such calculation. Trad-ing on Europe, Latin and South America and Far Eastsecurities exchanges and in over-the-counter marketsordinarily is completed well before the close of busi-ness on each business day in New York (i.e., a day onwhich the New York Stock Exchange (the “NYSE”) isopen). In addition, European or Far Eastern securitiestrading generally, or in a particular country or coun-tries, may not take place on all business days in NewYork and on which the NAV of a Portfolio is calculated.
The Valuation Committee of the Investment Manager,which meets periodically under the direction of theBoard of Directors (the “Board”), may evaluate a vari-ety of factors to determine the fair value of securitiesfor which market quotations are determined not to bereadily available or reliable. These factors include, butare not limited to, the type of security, the value ofcomparable securities, observations from financialinstitutions and relevant news events. Input from theInvestment Manager’s portfolio managers/analystsalso will be considered.
If a significant event materially affecting the value ofsecurities occurs between the close of the exchangeor market on which the security is principally tradedand the time when a Portfolio’s NAV is calculated, orwhen current market quotations otherwise are deter-mined not to be readily available or reliable (includingrestricted or other illiquid securities such as certainderivative instruments), such securities will be valuedat their fair value as determined by, or in accordancewith procedures approved by, the Board. The fairvalue of non-US securities may be determined withthe assistance of an independent pricing service using
The Lazard Funds, Inc. Notes to Financial Statements December 31, 2017
92 Annual Report
correlations between the movement of prices of suchsecurities and indices of US securities and otherappropriate indicators, such as closing market pricesof relevant ADRs or futures contracts. Non-US securi-ties may trade on days when a Portfolio is not openfor business, thus affecting the value of the Portfolio’sassets on days when Portfolio shareholders may notbe able to buy or sell Portfolio shares.
The effect of using fair value pricing is that the NAV ofa Portfolio will reflect the affected securities’ values asdetermined in the judgment of the Board or itsdesignee instead of being determined by the market.Using a fair value pricing methodology to price secu-rities may result in a value that is different from themost recent closing price of a security and from theprices used by other investment companies to calcu-late their portfolios’ NAVs.
(b) Portfolio Securities Transactions and InvestmentIncome—Portfolio securities transactions areaccounted for on trade date. Realized gain (loss) onsales of investments are recorded on a specific identi-fication basis. Dividend income is recorded on the ex-dividend date except for certain dividends fromnon-US securities where the dividend rate is not avail-able. In such cases, the dividend is recorded as soonas the information is received by a Portfolio. Interestincome, if any, is accrued daily.
A Portfolio may be subject to taxes imposed by non-US countries in which it invests. Such taxes are gener-ally based upon income earned or capital gains(realized and/or unrealized). An affected Portfolioaccrues and applies such taxes to net investmentincome, net realized gains and net unrealized gainsconcurrent with the recognition of income earned orcapital gains (realized and/or unrealized) from theapplicable portfolio securities.
As a result of several court cases in certain countriesacross the European Union, the International Equity,International Strategic Equity and International SmallCap Equity Portfolios have filed tax reclaims for previ-ously withheld taxes on dividends earned in thosecountries. These filings are subject to various adminis-
trative proceedings by the local jurisdictions’ taxauthorities within the European Union, as well as anumber of related judicial proceedings. Uncertaintyexists as to the ultimate resolution of these proceed-ings, the likelihood of receipt of these claims, and thepotential timing of payment, and accordingly noamounts are reflected in the financial statements.Such amounts, if and when recorded, could result inan increase in a Portfolio’s NAV per share.
(c) Foreign Currency Translation—The accountingrecords of the Fund are maintained in US dollars.Portfolio securities and other assets and liabilitiesdenominated in a foreign currency are translated dailyinto US dollars at the prevailing rates of exchange.Purchases and sales of securities, income receipts andexpense payments are translated into US dollars atthe prevailing exchange rates on the respectivetransaction dates.
The Portfolios do not isolate the portion of operationsresulting from changes in foreign exchange rates oninvestments from the fluctuations arising fromchanges in their market prices. Such fluctuations areincluded in net realized and unrealized gain (loss) oninvestments. Net realized gain (loss) on foreign cur-rency transactions represents net foreign currencygain (loss) from disposition of foreign currencies, cur-rency gain (loss) realized between the trade and settle-ment dates on securities transactions, and thedifference between the amount of dividends, interestand foreign withholding taxes recorded on the Portfo-lios’ accounting records and the US dollar equivalentamounts actually received or paid. Net change in unre-alized appreciation (depreciation) on foreign currencytranslations reflects the impact of changes in exchangerates on the value of assets and liabilities, other thaninvestments in securities, during the period.
(d) Federal Income Taxes—The Fund’s policy is to haveeach Portfolio qualify as a regulated investment com-pany under Subchapter M of the Internal RevenueCode (the “Code”) and to distribute all of its taxableincome, including any net realized capital gains, toshareholders. Therefore, no federal income tax provi-sion is required.
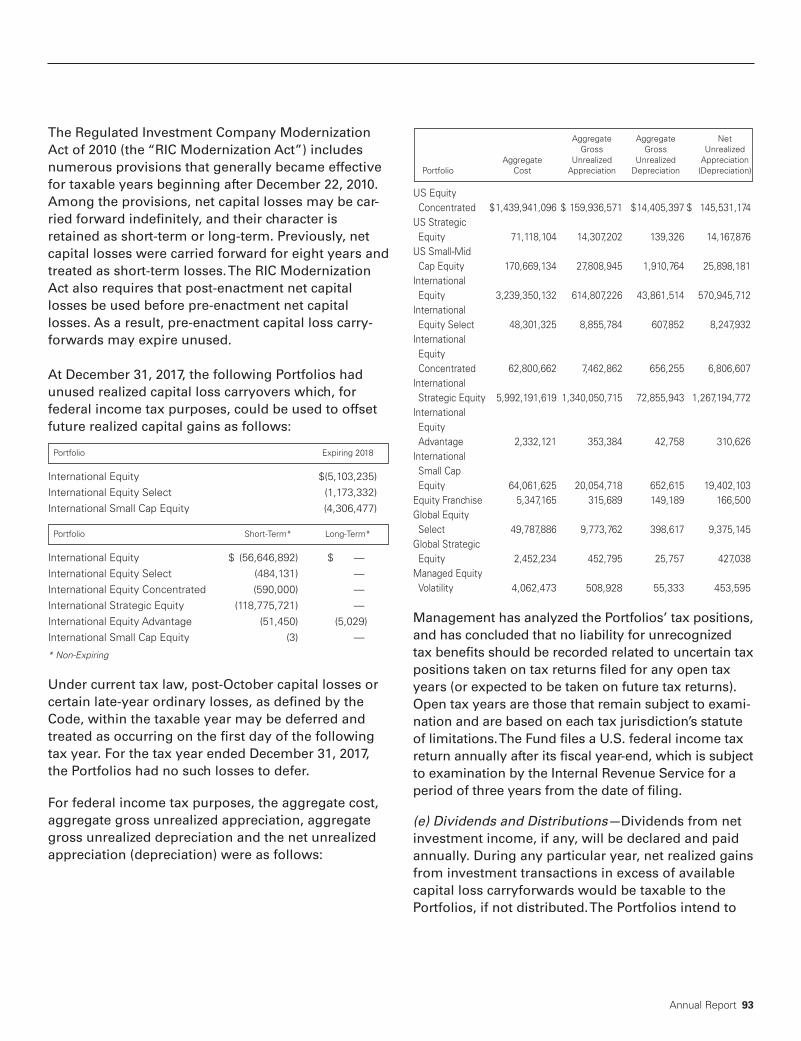
Annual Report 93
The Regulated Investment Company ModernizationAct of 2010 (the “RIC Modernization Act”) includesnumerous provisions that generally became effectivefor taxable years beginning after December 22, 2010.Among the provisions, net capital losses may be car-ried forward indefinitely, and their character isretained as short-term or long-term. Previously, netcapital losses were carried forward for eight years andtreated as short-term losses. The RIC ModernizationAct also requires that post-enactment net capitallosses be used before pre-enactment net capitallosses. As a result, pre-enactment capital loss carry-forwards may expire unused.
At December 31, 2017, the following Portfolios hadunused realized capital loss carryovers which, for federal income tax purposes, could be used to offsetfuture realized capital gains as follows:
International Equity $(5,103,235)International Equity Select (1,173,332)International Small Cap Equity (4,306,477)
International Equity $ (56,646,892) $ —International Equity Select (484,131) —International Equity Concentrated (590,000) —International Strategic Equity (118,775,721) —International Equity Advantage (51,450) (5,029)International Small Cap Equity (3) —
* Non-Expiring
Under current tax law, post-October capital losses orcertain late-year ordinary losses, as defined by theCode, within the taxable year may be deferred andtreated as occurring on the first day of the followingtax year. For the tax year ended December 31, 2017,the Portfolios had no such losses to defer.
For federal income tax purposes, the aggregate cost,aggregate gross unrealized appreciation, aggregategross unrealized depreciation and the net unrealizedappreciation (depreciation) were as follows:
US EquityConcentrated $1,439,941,096 $ 159,936,571 $14,405,397 $ 145,531,174US StrategicEquity 71,118,104 14,307,202 139,326 14,167,876US Small-MidCap Equity 170,669,134 27,808,945 1,910,764 25,898,181InternationalEquity 3,239,350,132 614,807,226 43,861,514 570,945,712InternationalEquity Select 48,301,325 8,855,784 607,852 8,247,932InternationalEquityConcentrated 62,800,662 7,462,862 656,255 6,806,607InternationalStrategic Equity 5,992,191,619 1,340,050,715 72,855,943 1,267,194,772InternationalEquityAdvantage 2,332,121 353,384 42,758 310,626InternationalSmall CapEquity 64,061,625 20,054,718 652,615 19,402,103Equity Franchise 5,347,165 315,689 149,189 166,500Global EquitySelect 49,787,886 9,773,762 398,617 9,375,145Global StrategicEquity 2,452,234 452,795 25,757 427,038Managed EquityVolatility 4,062,473 508,928 55,333 453,595
Management has analyzed the Portfolios’ tax positions,and has concluded that no liability for unrecognizedtax benefits should be recorded related to uncertain taxpositions taken on tax returns filed for any open taxyears (or expected to be taken on future tax returns).Open tax years are those that remain subject to exami-nation and are based on each tax jurisdiction’s statuteof limitations.The Fund files a U.S. federal income taxreturn annually after its fiscal year-end, which is subjectto examination by the Internal Revenue Service for aperiod of three years from the date of filing.
(e) Dividends and Distributions—Dividends from netinvestment income, if any, will be declared and paidannually. During any particular year, net realized gainsfrom investment transactions in excess of availablecapital loss carryforwards would be taxable to thePortfolios, if not distributed. The Portfolios intend to
Portfolio Expiring 2018
Portfolio Short-Term* Long-Term*
Aggregate Aggregate Net Gross Gross Unrealized Aggregate Unrealized Unrealized AppreciationPortfolio Cost Appreciation Depreciation (Depreciation)

94 Annual Report
declare and distribute these amounts, at least annu-ally, to shareholders; however, to avoid taxation, asecond distribution may be required. Differences inper share distributions, by class, are generally due todifferences in class specific expenses.
The US Equity Concentrated, US Strategic Equity andUS Small-Mid Cap Equity Portfolios intend, on their2017 tax returns, to treat as a distribution of invest-ment company taxable income and net capital gainthe portion of redemption proceeds paid to redeem-ing shareholders that represents the redeemingshareholders’ portion of the Portfolios’ undistributedinvestment company taxable income and net capitalgain. This practice, which involves the use of equaliza-tion accounting, will have the effect of reducing theamount of income and gains that the Portfolios wouldotherwise be required to distribute as dividends toshareholders in order for the Portfolios to avoid fed-eral income and excise taxes. This practice reducesthe amount of distributions required to be made tononredeeming shareholders and defers the recogni-tion of taxable income by such shareholders. How-ever, since the amount of any undistributed incomewill be reflected in the value of the Portfolios’ shares,the total return on a shareholder’s investment is notaffected by the Portfolios’ use of equalization.
Income and capital gains distributions are determinedin accordance with federal income tax regulationswhich may differ from GAAP. These book/tax differ-ences, which may result in distribution reclassifica-tions, are primarily due to differing treatments offoreign currency transactions, wash sales, passive for-eign investment companies, expiring capital loss car-ryovers, certain expenses, and distributions from realestate investment trusts and partnerships. The book/taxdifferences relating to shareholder distributionsresulted in reclassifications among certain capitalaccounts as follows:
US Equity Concentrated $15,862,223 $ (2) $(15,862,221)US Strategic Equity 808,100 (212) (807,888)US Small-Mid Cap Equity 3,477,444 (184,448) (3,292,996)International Equity (8,988,349) 893,671 (8,094,678)International Equity Select (38,627) 431 38,196International Equity Concentrated (130) (9,114) 9,244International Strategic Equity 4 2,112,973 (2,112,977)International Equity Advantage 1,474 3,080 (4,554)International SmallCap Equity (45,132,663) 311,237 44,821,426Equity Franchise (704) (3,066) 3,770Global Equity Select — 15,038 (15,038)Global Strategic Equity (30) (7,177) 7,207Managed Equity Volatility — 7,466 (7,466)
The tax character of dividends and distributions paidduring the years ended December 31, were as follows:
US EquityConcentrated $13,853,329 $ 30,745,381 $89,718,183 $31,879,468US StrategicEquity 2,270,214 900,038 6,026,122 2,471,715US Small-MidCap Equity 6,630,713 1,407,443 16,953,848 4,936,919InternationalEquity 53,700,989 17,963,112 — —InternationalEquity Select 336,816 288,736 — —InternationalEquityConcentrated 639,493 235,808 — —InternationalStrategic Equity 90,091,459 104,294,791 — —
Ordinary Income Long-Term Capital Gain
Portfolio 2017 2016 2017 2016
Undistributed (Distributions in Excess of) Net Accumulated Paid in Investment Net RealizedPortfolio Capital Income Gain (Loss)
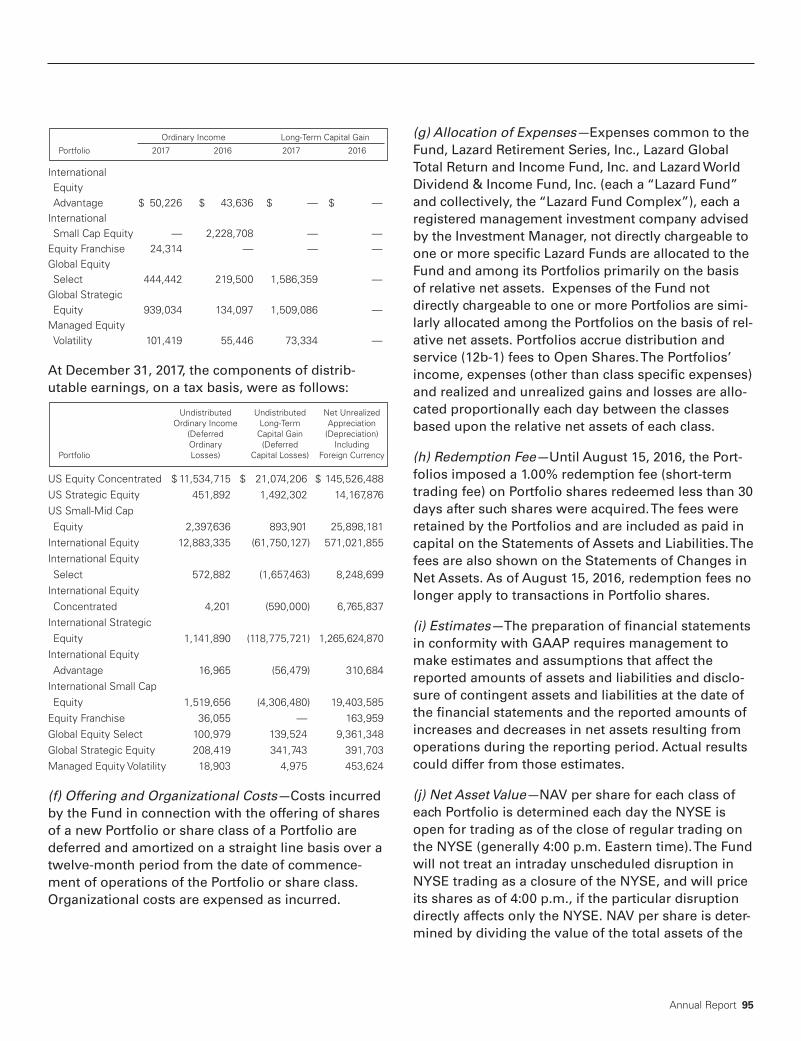
Annual Report 95
InternationalEquityAdvantage $ 50,226 $ 43,636 $ — $ —InternationalSmall Cap Equity — 2,228,708 — —Equity Franchise 24,314 — — —Global EquitySelect 444,442 219,500 1,586,359 —Global StrategicEquity 939,034 134,097 1,509,086 —Managed EquityVolatility 101,419 55,446 73,334 —
At December 31, 2017, the components of distrib-utable earnings, on a tax basis, were as follows:
US Equity Concentrated $ 11,534,715 $ 21,074,206 $ 145,526,488US Strategic Equity 451,892 1,492,302 14,167,876US Small-Mid CapEquity 2,397,636 893,901 25,898,181International Equity 12,883,335 (61,750,127) 571,021,855International EquitySelect 572,882 (1,657,463) 8,248,699International EquityConcentrated 4,201 (590,000) 6,765,837International StrategicEquity 1,141,890 (118,775,721) 1,265,624,870International EquityAdvantage 16,965 (56,479) 310,684International Small CapEquity 1,519,656 (4,306,480) 19,403,585Equity Franchise 36,055 — 163,959Global Equity Select 100,979 139,524 9,361,348Global Strategic Equity 208,419 341,743 391,703Managed Equity Volatility 18,903 4,975 453,624
(f) Offering and Organizational Costs—Costs incurredby the Fund in connection with the offering of sharesof a new Portfolio or share class of a Portfolio aredeferred and amortized on a straight line basis over atwelve-month period from the date of commence-ment of operations of the Portfolio or share class.Organizational costs are expensed as incurred.
(g) Allocation of Expenses—Expenses common to theFund, Lazard Retirement Series, Inc., Lazard GlobalTotal Return and Income Fund, Inc. and Lazard WorldDividend & Income Fund, Inc. (each a “Lazard Fund”and collectively, the “Lazard Fund Complex”), each aregistered management investment company advisedby the Investment Manager, not directly chargeable toone or more specific Lazard Funds are allocated to theFund and among its Portfolios primarily on the basisof relative net assets. Expenses of the Fund notdirectly chargeable to one or more Portfolios are simi-larly allocated among the Portfolios on the basis of rel-ative net assets. Portfolios accrue distribution andservice (12b-1) fees to Open Shares. The Portfolios’income, expenses (other than class specific expenses)and realized and unrealized gains and losses are allo-cated proportionally each day between the classesbased upon the relative net assets of each class.
(h) Redemption Fee—Until August 15, 2016, the Port-folios imposed a 1.00% redemption fee (short-termtrading fee) on Portfolio shares redeemed less than 30days after such shares were acquired. The fees wereretained by the Portfolios and are included as paid incapital on the Statements of Assets and Liabilities. Thefees are also shown on the Statements of Changes inNet Assets. As of August 15, 2016, redemption fees nolonger apply to transactions in Portfolio shares.
(i) Estimates—The preparation of financial statementsin conformity with GAAP requires management tomake estimates and assumptions that affect thereported amounts of assets and liabilities and disclo-sure of contingent assets and liabilities at the date ofthe financial statements and the reported amounts ofincreases and decreases in net assets resulting fromoperations during the reporting period. Actual resultscould differ from those estimates.
(j) Net Asset Value—NAV per share for each class ofeach Portfolio is determined each day the NYSE isopen for trading as of the close of regular trading onthe NYSE (generally 4:00 p.m. Eastern time). The Fundwill not treat an intraday unscheduled disruption inNYSE trading as a closure of the NYSE, and will priceits shares as of 4:00 p.m., if the particular disruptiondirectly affects only the NYSE. NAV per share is deter-mined by dividing the value of the total assets of the
Undistributed Undistributed Net Unrealized Ordinary Income Long-Term Appreciation (Deferred Capital Gain (Depreciation) Ordinary (Deferred IncludingPortfolio Losses) Capital Losses) Foreign Currency
Ordinary Income Long-Term Capital Gain
Portfolio 2017 2016 2017 2016

96 Annual Report
Portfolio represented by such class, less all liabilities,by the total number of Portfolio shares of such classoutstanding.
3. Investment Management, Administration, Custody,Distribution and Transfer Agency AgreementsThe Fund, on behalf of the Portfolios, has entered intoa management agreement (the “Management Agree-ment”) with the Investment Manager. Pursuant to theManagement Agreement, the Investment Managerregularly provides each Portfolio with investmentresearch, advice and supervision and furnishes con-tinuously an investment program for each Portfolioconsistent with its investment objectives and policies,including the purchase, retention and disposition ofsecurities, and provides the Portfolios with adminis-trative, operational and compliance assistance serv-ices. For its services provided to the Portfolios, theInvestment Manager earns a management fee,accrued daily as a percentage of its average daily netassets and payable by each Portfolio monthly, at theannual rate set forth below:
US Equity Concentrated 0.70%US Strategic Equity 0.70 US Small-Mid Cap Equity 0.75 International Equity 0.75 International Equity Select 0.75 International Equity Concentrated 0.90 International Strategic Equity 0.75 International Equity Advantage 0.65 International Small Cap Equity 0.75Equity Franchise 0.80Global Equity Select 0.80Global Strategic Equity 0.85Managed Equity Volatility 0.60
The Investment Manager has voluntarily agreed, untilMay 1 of the year shown below (except as noted), towaive its fees and, if necessary, reimburse the Portfo-lios if the aggregate direct expenses of the Portfolios,exclusive of taxes, brokerage, interest on borrowings,fees and expenses of “Acquired Funds” (as defined inForm N-1A) and extraordinary expenses, but includ-ing the management fee stated in the ManagementAgreement between the Investment Manager and theFund, on behalf of the Portfolios, exceed the followingpercentages of the value of the Portfolios’ averagedaily net assets for the respective shares:
US Equity Concentrated 0.95% 1.25% 0.90% 2018 (a)US Strategic Equity 0.75 1.05 0.75 2018US Small-Mid Cap Equity 1.15 1.45 N/A 2018International Equity 0.85 1.15 0.80 2018International EquitySelect 1.05 1.35 N/A 2018 (b)
International EquityConcentrated 1.05 1.35 N/A 2018
International StrategicEquity 1.15 1.45 1.10 2018
International EquityAdvantage 0.90 1.20 N/A 2018
International Small CapEquity 1.13 1.43 N/A 2018
Equity Franchise 0.95 1.20 N/A 2019 (c)Global Equity Select 1.05 1.35 N/A 2018Global Strategic Equity 1.10 1.40 N/A 2018Managed Equity Volatility 0.75 1.05 N/A 2018
(a) Agreement extends, for May 1, 2018 through May 1, 2027, at rates of 1.10%,1.40% and 1.05%, respectively.
(b) Agreement extends, for May 1, 2018 through May 1, 2027, at rates of 1.15%and 1.45%, respectively.
(c) Agreement is until September 29, 2019.
In addition to the expense limitation agreements, untilMay 1, 2018, to the extent the “Total Annual PortfolioOperating Expenses” (as defined in Form N-1A) of theR6 Shares of a Portfolio exceed the Total Annual Portfo-lio Operating Expenses of the Portfolio’s InstitutionalShares (in each case, not including management fees,custodian fees or other expenses related to the man-agement of the Portfolio’s assets), the Investment Man-ager will bear the expenses of the R6 Shares in theamount of such excess.
During the year ended December 31, 2017, the InvestmentManager waived its management fees and reimbursedthe following Portfolios for other expenses as follows:
US Strategic Equity $146,104 $ — $ 8,520 $ 6,640International EquitySelect 109,693 — 18,022 —International EquityConcentrated 135,023 — 1,796 11,774International EquityAdvantage 14,887 163,994 690 19,958
Portfolio Annual Rate
Institutional Open R6 Portfolio Shares Shares Shares Year
Institutional Shares Open Shares
Management Expenses Management Expenses Portfolio Fees Waived Reimbursed Fees Waived Reimbursed

Annual Report 97
Equity Franchise $ 10,591 $ 63,624 $ 90 $ 2,118Global Equity Select 108,452 — 4,870 9,406Global Strategic Equity 127,341 11,094 1,073 12,664Managed EquityVolatility 18,523 154,875 1,361 23,321
US Equity Concentrated $ 1,799 $13,649US Strategic Equity 33,436 — International Equity 58,141 — International Strategic Equity 20,012 —
The aforementioned waivers and/or reimbursementsare not subject to recoupment by the InvestmentManager.
State Street provides the Fund with custody and cer-tain fund administration and accounting services. Forthe year ended December 31, 2017, State Streetwaived its fund administration fee as follows:
International Equity Advantage $4,688Global Strategic Equity 4,688Managed Equity Volatility 4,688
In December 2015, State Street announced that it hadidentified inconsistencies in the way in which clientswere invoiced for custody out-of-pocket expensesfrom 1998 until 2015. The dollar amount differencebetween what was charged and what should havebeen charged, plus interest, was recorded as a reim-bursement when determined in 2016. Pursuant to theexpense limitations described above, certain Portfoliosexperienced management fee waivers during the yearended December 31, 2016. Accordingly, the reim-bursement of out-of-pocket expenses resulted in thereduction in the waiver of management fees for cer-tain Portfolios for the year ended December 31, 2016.
The Fund has a distribution agreement with LazardAsset Management Securities LLC (the “Distributor”),a wholly-owned subsidiary of the Investment Man-ager, to serve as the distributor for shares of eachPortfolio. The Distributor bears the cost of printing
and mailing prospectuses to potential investors andcertain expenses in connection with the offering ofPortfolio shares.
Under a distribution and servicing plan adopted pur-suant to Rule 12b-1 under the 1940 Act, each Portfoliopays a monthly fee to the Distributor, at an annualrate of 0.25% of the average daily net assets of itsOpen Shares, for distribution and servicing ofaccounts. The Distributor may make payments to cer-tain financial institutions, securities dealers and otherindustry professionals for providing these services.
BFDS is the Fund’s transfer and dividend disbursingagent. For its services, BFDS receives a monthly feecomputed on the basis of the number of shareholderaccounts it maintains, subject to a minimum feeamount per share class in each Portfolio, and is reim-bursed for certain out-of-pocket expenses. BFDS hasagreed to waive the monthly minimum fee for thefirst six months after a new Portfolio or share classhas commenced operations. During the year endedDecember 31, 2017, BFDS waived its fees as follows:
US Equity Concentrated $4,050Equity Franchise 6,112
On January 1, 2018, BFDS changed its name to DSTAsset Manager Solutions, Inc.
4. Directors’ CompensationCertain Directors of the Fund are officers of the Invest-ment Manager. For the year ended December 31, 2017,each Director who is not an affiliated person of theInvestment Manager or any of its affiliates was paid bythe Lazard Fund Complex: (1) an annual retainer of$210,000, (2) an additional annual fee of $30,000 to thelead Independent Director (an “Independent Director”is a Director who is not an “interested person” (asdefined in the 1940 Act) of the Fund), and (3) an addi-tional annual fee of $20,000 to the Audit CommitteeChair. Effective January 1, 2018, the aggregate com-pensation for Independent Directors for the LazardFund Complex is comprised of: (1) an annual retainerof $225,000, (2) an additional annual fee of $32,500 tothe lead Independent Director, and (3) an additionalannual fee of $22,500 to the Audit Committee Chair.
Portfolio Amount
R6 Shares
Management Expenses Portfolio Fees Waived Reimbursed
Institutional Shares Open Shares
Management Expenses Management Expenses Portfolio Fees Waived Reimbursed Fees Waived Reimbursed
Portfolio Amount

98 Annual Report
The Independent Directors may be paid additionalcompensation for participation on ad hoc committeesor other work performed on behalf of the Board. TheIndependent Directors also are reimbursed for traveland other out-of-pocket expenses for attending Boardand committee meetings. The Directors do not receivebenefits from the Fund pursuant to any pension,retirement or similar arrangement. Independent Direc-tors’ fees are allocated among the portfolios in theLazard Fund Complex at a rate of $5,000 per portfoliowith the remainder allocated based upon each portfo-lio’s proportionate share of combined net assets. TheStatements of Operations show the IndependentDirectors’ fees and expenses paid by each Portfolio.
5. Securities Transactions and Transactions withAffiliatesPurchases and sales of portfolio securities (excludingshort-term investments) for the year ended December31, 2017 were as follows:
US Equity Concentrated $1,320,331,255 $1,265,831,671US Strategic Equity 61,819,985 76,790,176US Small-Mid Cap Equity 162,051,905 206,339,623International Equity 1,573,627,047 1,020,440,735International Equity Select 28,573,602 12,860,744International Equity Concentrated 80,709,010 35,859,494International Strategic Equity 2,927,005,955 4,217,312,411International Equity Advantage 2,180,740 2,100,378International Small Cap Equity 27,683,377 50,998,776Equity Franchise 5,660,424 535,067Global Equity Select 31,374,762 14,524,452Global Strategic Equity 8,977,410 28,362,971Managed Equity Volatility 3,988,233 2,875,345
For the year ended December 31, 2017, the Portfoliosdid not engage in any cross-trades in accordance withRule 17a-7 under the 1940 Act, and no brokerage com-missions were paid to affiliates of the InvestmentManager or other affiliates of the Fund for portfoliotransactions executed on behalf of the Fund.
At December 31, 2017, the Investment Managerowned 87.91%, 91.82%, 92.67% and 55.70% of the out-standing shares of the International Equity Advan-tage, Equity Franchise, Global Strategic Equity andManaged Equity Volatility Portfolios, respectively.
6. Line of CreditThe Fund has a $50 million Line of Credit Agreement(the “Agreement”) with State Street, primarily fortemporary or emergency purposes, including themeeting of redemption requests that otherwise mightrequire the untimely disposition of securities. Intereston borrowings is payable at the higher of the FederalFunds rate or One-Month LIBOR rate plus 1.00%, onan annualized basis. Under the Agreement, the Fundhas agreed to pay a 0.20% per annum fee on theunused portion of the commitment, payable quarterlyin arrears. The Fund has also agreed to pay an upfrontfee of 0.05% of the committed line amount. During theyear ended December 31, 2017, the following Portfo-lios had borrowings under the Agreement as follows:
US Strategic Equity $862,500 $1,700,000 1.85% 2International EquityConcentrated 675,875 1,800,000 1.78 8International EquityAdvantage 13,000 15,000 2.07 2International SmallCap Equity 571,208 2,910,000 2.10 37Global Equity Select 609,500 1,200,000 1.85 2Global StrategicEquity 602,473 1,174,000 2.38 11Managed EquityVolatility 5,036 11,500 1.78 11
* For days borrowings were outstanding.
Management believes that the fair value of the liabili-ties under the line of credit is equivalent to therecorded amount based on its short-term maturityand interest rate, which fluctuates with LIBOR. A Port-folio’s outstanding balance on the line of credit, if any,would be categorized as Level 2 (see Note 9).
7. Investment Risks(a) Non-US Securities Risk—A Portfolio’s performancewill be influenced by political, social and economicfactors affecting the non-US countries and companiesin which the Portfolio invests. Non-US securities carryspecial risks, such as less developed or less efficienttrading markets, political instability, a lack of companyinformation, differing auditing and legal standards,and, potentially, less liquidity.
Portfolio Purchases Sales
Weighted Number of Average Maximum Average Days Daily Loan Daily Loan Interest BorrowingsPortfolio Balance* Outstanding Rate were Outstanding

Annual Report 99
(b) Emerging Market Risk—Emerging market countriesgenerally have economic structures that are lessdiverse and mature, and political systems that are lessstable, than those of developed countries. Theeconomies of countries with emerging markets may bebased predominantly on only a few industries, may behighly vulnerable to changes in local or global tradeconditions, and may suffer from extreme debt burdensor volatile inflation rates. The securities markets ofemerging market countries have historically beenextremely volatile. These market conditions may con-tinue or worsen. Investments in these countries maybe subject to political, economic, legal, market and cur-rency risks. The risks may include less protection ofproperty rights and uncertain political and economicpolicies, the imposition of capital controls and/or for-eign investment limitations by a country, nationaliza-tion of businesses and the imposition of sanctions byother countries, such as the US. Significant devaluationof emerging market currencies against the US dollarmay occur subsequent to acquisition of investmentsdenominated in emerging market currencies.
(c) Foreign Currency Risk—Investments denominatedin currencies other than US dollars may experience adecline in value, in US dollar terms, due solely to fluc-tuations in currency exchange rates. A Portfolio’s cur-rency investments could be adversely affected bydelays in, or a refusal to grant, repatriation of funds orconversion of emerging market currencies. The Invest-ment Manager does not intend to actively hedge thePortfolios’ foreign currency exposure.
(d) Non-Diversification Risk—A Portfolio’s NAV maybe more vulnerable to changes in the market value ofa single issuer or group of issuers and may be rela-tively more susceptible to adverse effects from anysingle corporate, industry, economic, market, politicalor regulatory occurrence than if the Portfolio’s invest-ments consisted of securities issued by a larger num-ber of issuers.
8. Contractual ObligationsThe Fund enters into contracts in the normal courseof business that contain a variety of indemnificationprovisions. A Portfolio’s maximum exposure underthese arrangements is unknown. Management has
reviewed the Fund’s existing contracts and expectsthe risk of loss to be remote.
9. Fair Value MeasurementsFair value is defined as the price that a Portfolio wouldreceive to sell an asset, or would pay to transfer a lia-bility, in an orderly transaction between market partici-pants at the date of measurement. The Fair ValueMeasurements and Disclosures provisions of GAAPalso establish a framework for measuring fair value,and a three-level hierarchy for fair value measurementthat is based upon the transparency of inputs to thevaluation of an asset or liability. Inputs may be observ-able or unobservable and refer, broadly, to theassumptions that market participants would use inpricing the asset or liability. Observable inputs reflectthe assumptions that market participants would use inpricing the asset or liability based on market dataobtained from sources independent of the Fund.Unobservable inputs reflect the Fund’s own assump-tions about the assumptions that market participantswould use in pricing the asset or liability, developedbased on the best information available in the circum-stances. The fair value measurement level within thefair value hierarchy for the assets and liabilities of theFund is based on the lowest level of any input that issignificant to the overall fair value measurement. Thethree-level hierarchy of inputs is summarized below:
• Level 1 – unadjusted quoted prices in active marketsfor identical assets and liabilities
• Level 2 – other significant observable inputs (includ-ing unadjusted quoted prices for similar assets andliabilities, interest rates, prepayment speeds, creditrisk, etc.)
• Level 3 – significant unobservable inputs (includingthe Fund’s own assumptions in determining the fairvalue of assets and liabilities)
Changes in valuation technique may result in trans-fers into or out of the current assigned level withinthe hierarchy.
The inputs or methodology used for valuing securitiesare not necessarily an indication of the risks associ-ated with investing in these securities.
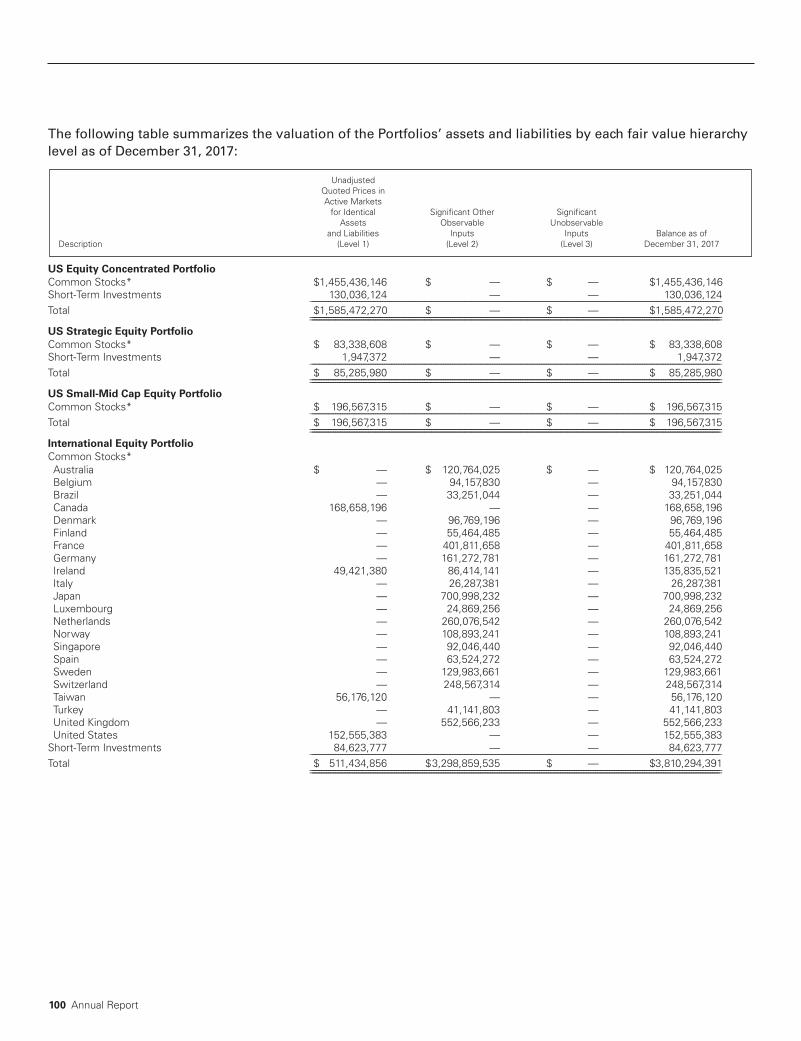
100 Annual Report
The following table summarizes the valuation of the Portfolios’ assets and liabilities by each fair value hierarchylevel as of December 31, 2017:
US Equity Concentrated PortfolioCommon Stocks* $1,455,436,146 $ — $ — $1,455,436,146Short-Term Investments 130,036,124 — — 130,036,124 _______________________________________________________________________________________________________________________________________________________________________________Total $1,585,472,270 $ — $ — $1,585,472,270 _______________________________________________________________________________________________________________________________________________________________________________ _______________________________________________________________________________________________________________________________________________________________________________US Strategic Equity PortfolioCommon Stocks* $ 83,338,608 $ — $ — $ 83,338,608Short-Term Investments 1,947,372 — — 1,947,372 _______________________________________________________________________________________________________________________________________________________________________________Total $ 85,285,980 $ — $ — $ 85,285,980 _______________________________________________________________________________________________________________________________________________________________________________ _______________________________________________________________________________________________________________________________________________________________________________US Small-Mid Cap Equity PortfolioCommon Stocks* $ 196,567,315 $ — $ — $ 196,567,315 _______________________________________________________________________________________________________________________________________________________________________________Total $ 196,567,315 $ — $ — $ 196,567,315 _______________________________________________________________________________________________________________________________________________________________________________ _______________________________________________________________________________________________________________________________________________________________________________International Equity PortfolioCommon Stocks*Australia $ — $ 120,764,025 $ — $ 120,764,025Belgium — 94,157,830 — 94,157,830Brazil — 33,251,044 — 33,251,044Canada 168,658,196 — — 168,658,196Denmark — 96,769,196 — 96,769,196Finland — 55,464,485 — 55,464,485France — 401,811,658 — 401,811,658Germany — 161,272,781 — 161,272,781Ireland 49,421,380 86,414,141 — 135,835,521Italy — 26,287,381 — 26,287,381Japan — 700,998,232 — 700,998,232Luxembourg — 24,869,256 — 24,869,256Netherlands — 260,076,542 — 260,076,542Norway — 108,893,241 — 108,893,241Singapore — 92,046,440 — 92,046,440Spain — 63,524,272 — 63,524,272Sweden — 129,983,661 — 129,983,661Switzerland — 248,567,314 — 248,567,314Taiwan 56,176,120 — — 56,176,120Turkey — 41,141,803 — 41,141,803United Kingdom — 552,566,233 — 552,566,233United States 152,555,383 — — 152,555,383Short-Term Investments 84,623,777 — — 84,623,777 _______________________________________________________________________________________________________________________________________________________________________________Total $ 511,434,856 $3,298,859,535 $ — $3,810,294,391 _______________________________________________________________________________________________________________________________________________________________________________ _______________________________________________________________________________________________________________________________________________________________________________
Unadjusted Quoted Prices in Active Markets for Identical Significant Other Significant Assets Observable Unobservable and Liabilities Inputs Inputs Balance as ofDescription (Level 1) (Level 2) (Level 3) December 31, 2017

Annual Report 101
International Equity Select PortfolioCommon Stocks*Australia $ — $ 1,062,270 $ — $ 1,062,270Belgium — 959,268 — 959,268Brazil — 1,730,549 — 1,730,549Canada 1,446,436 — — 1,446,436China — 2,034,484 — 2,034,484Denmark — 983,244 — 983,244Finland — 1,159,412 — 1,159,412France — 3,430,869 — 3,430,869Germany — 2,795,095 — 2,795,095India 742,934 — — 742,934Indonesia 973,302 — — 973,302Ireland 664,941 1,115,688 — 1,780,629Japan — 7,403,775 — 7,403,775Netherlands — 2,899,065 — 2,899,065Norway — 1,558,383 — 1,558,383Philippines — 352,384 — 352,384Russia 633,876 — — 633,876Singapore — 959,117 — 959,117South Africa — 1,194,891 — 1,194,891South Korea — 1,342,341 — 1,342,341Spain — 741,443 — 741,443Sweden — 1,638,821 — 1,638,821Switzerland — 2,939,195 — 2,939,195Taiwan — 1,662,378 — 1,662,378Thailand — 597,845 — 597,845Turkey — 1,310,455 — 1,310,455United Kingdom — 7,103,482 — 7,103,482United States 3,377,249 — — 3,377,249Short-Term Investments 1,736,057 — — 1,736,057 _______________________________________________________________________________________________________________________________________________________________________________Total $ 9,574,795 $ 46,974,454 $ — $ 56,549,249 _______________________________________________________________________________________________________________________________________________________________________________ _______________________________________________________________________________________________________________________________________________________________________________International Equity Concentrated PortfolioCommon Stocks*Australia $ — $ 1,876,337 $ — $ 1,876,337Belgium — 2,803,741 — 2,803,741Brazil — 1,308,077 — 1,308,077Canada 5,936,213 — — 5,936,213China — 3,702,291 — 3,702,291Finland — 715,465 — 715,465France — 9,831,068 — 9,831,068Germany — 1,950,947 — 1,950,947India 1,382,049 — — 1,382,049Ireland — 3,577,983 — 3,577,983Japan — 7,272,352 — 7,272,352Netherlands — 3,819,138 — 3,819,138South Korea — 2,772,587 — 2,772,587Taiwan 2,839,614 — — 2,839,614Turkey — 2,501,697 — 2,501,697United Kingdom — 11,040,859 — 11,040,859United States 4,852,622 — — 4,852,622Short-Term Investments 1,424,227 — — 1,424,227 _______________________________________________________________________________________________________________________________________________________________________________Total $ 16,434,725 $ 53,172,542 $ — $ 69,607,267 _______________________________________________________________________________________________________________________________________________________________________________ _______________________________________________________________________________________________________________________________________________________________________________
Unadjusted Quoted Prices in Active Markets for Identical Significant Other Significant Assets Observable Unobservable and Liabilities Inputs Inputs Balance as ofDescription (Level 1) (Level 2) (Level 3) December 31, 2017

102 Annual Report
International Strategic Equity PortfolioCommon Stocks*Brazil $ — $ 54,541,456 $ — $ 54,541,456Canada 455,635,186 — — 455,635,186China 78,110,790 173,781,380 — 251,892,170Denmark — 150,951,722 — 150,951,722Finland — 289,594,126 — 289,594,126France — 502,247,404 — 502,247,404Germany — 178,545,263 — 178,545,263India — 80,939,321 — 80,939,321Indonesia — 8,877,206 — 8,877,206Ireland — 370,418,638 — 370,418,638Italy — 68,745,377 — 68,745,377Japan — 1,467,800,647 — 1,467,800,647Luxembourg — 73,310,509 — 73,310,509Netherlands — 198,412,986 — 198,412,986New Zealand — 68,888,309 — 68,888,309Norway — 151,379,101 — 151,379,101Philippines — 65,015,552 — 65,015,552Singapore — 139,127,509 — 139,127,509Spain — 59,515,933 — 59,515,933Sweden — 194,512,623 — 194,512,623Switzerland — 355,619,068 — 355,619,068Taiwan — 115,268,648 — 115,268,648United Kingdom — 1,318,806,643 — 1,318,806,643United States 344,463,829 — — 344,463,829Short-Term Investments 294,877,528 — — 294,877,528 _______________________________________________________________________________________________________________________________________________________________________________Total $ 1,173,087,333 $6,086,299,421 $ — $7,259,386,754 _______________________________________________________________________________________________________________________________________________________________________________ _______________________________________________________________________________________________________________________________________________________________________________International Equity Advantage PortfolioCommon Stocks*Australia $ — $ 177,358 $ — $ 177,358Belgium — 4,559 — 4,559Denmark — 73,965 — 73,965Faeroe Islands — 5,022 — 5,022France — 247,405 — 247,405Germany — 291,638 — 291,638Hong Kong 28,370 59,346 — 87,716Italy — 43,800 — 43,800Japan 11,617 667,036 — 678,653Luxembourg — 13,526 — 13,526Netherlands — 93,334 — 93,334New Zealand — 7,079 — 7,079Norway — 76,605 — 76,605Portugal — 8,972 — 8,972Russia — 11,459 — 11,459Singapore — 35,947 — 35,947Spain — 71,137 — 71,137Sweden — 78,847 — 78,847Switzerland — 195,764 — 195,764United Kingdom — 392,245 — 392,245United States 11,215 17,292 — 28,507Short-Term Investments 19,209 — — 19,209 _______________________________________________________________________________________________________________________________________________________________________________Total $ 70,411 $ 2,572,336 $ — $ 2,642,747 _______________________________________________________________________________________________________________________________________________________________________________ _______________________________________________________________________________________________________________________________________________________________________________
Unadjusted Quoted Prices in Active Markets for Identical Significant Other Significant Assets Observable Unobservable and Liabilities Inputs Inputs Balance as ofDescription (Level 1) (Level 2) (Level 3) December 31, 2017
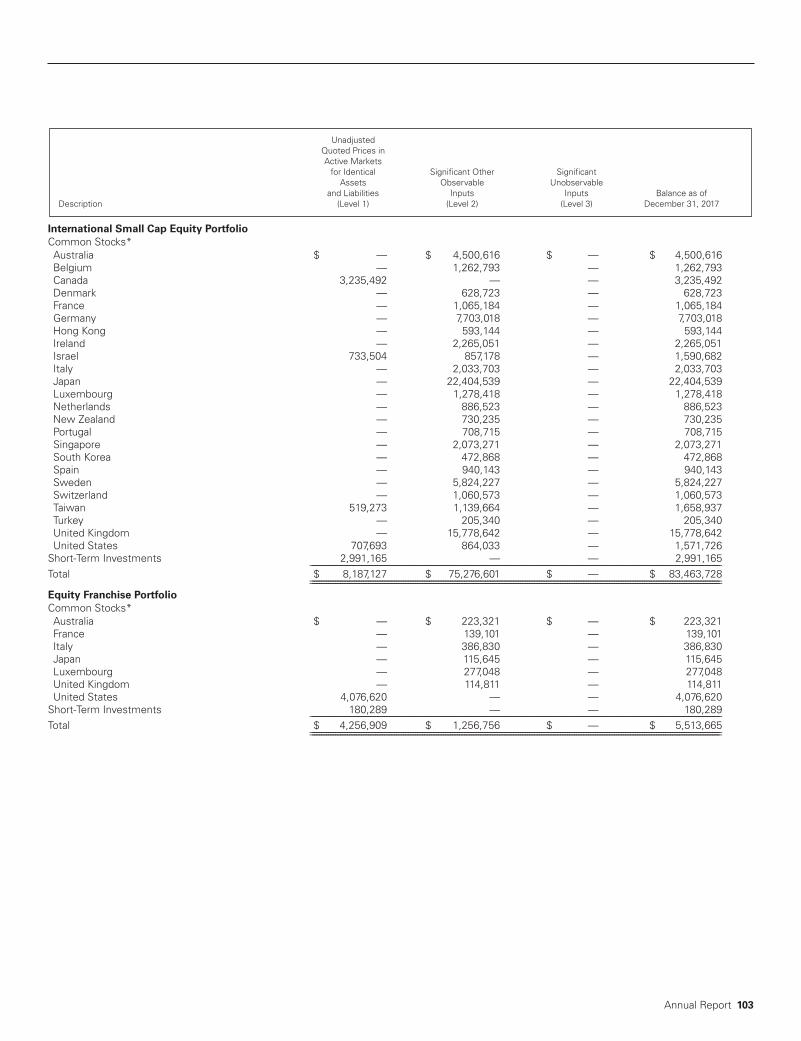
Annual Report 103
International Small Cap Equity PortfolioCommon Stocks*Australia $ — $ 4,500,616 $ — $ 4,500,616Belgium — 1,262,793 — 1,262,793Canada 3,235,492 — — 3,235,492Denmark — 628,723 — 628,723France — 1,065,184 — 1,065,184Germany — 7,703,018 — 7,703,018Hong Kong — 593,144 — 593,144Ireland — 2,265,051 — 2,265,051Israel 733,504 857,178 — 1,590,682Italy — 2,033,703 — 2,033,703Japan — 22,404,539 — 22,404,539Luxembourg — 1,278,418 — 1,278,418Netherlands — 886,523 — 886,523New Zealand — 730,235 — 730,235Portugal — 708,715 — 708,715Singapore — 2,073,271 — 2,073,271South Korea — 472,868 — 472,868Spain — 940,143 — 940,143Sweden — 5,824,227 — 5,824,227Switzerland — 1,060,573 — 1,060,573Taiwan 519,273 1,139,664 — 1,658,937Turkey — 205,340 — 205,340United Kingdom — 15,778,642 — 15,778,642United States 707,693 864,033 — 1,571,726Short-Term Investments 2,991,165 — — 2,991,165 _______________________________________________________________________________________________________________________________________________________________________________Total $ 8,187,127 $ 75,276,601 $ — $ 83,463,728 _______________________________________________________________________________________________________________________________________________________________________________ _______________________________________________________________________________________________________________________________________________________________________________Equity Franchise PortfolioCommon Stocks*Australia $ — $ 223,321 $ — $ 223,321France — 139,101 — 139,101Italy — 386,830 — 386,830Japan — 115,645 — 115,645Luxembourg — 277,048 — 277,048United Kingdom — 114,811 — 114,811United States 4,076,620 — — 4,076,620Short-Term Investments 180,289 — — 180,289 _______________________________________________________________________________________________________________________________________________________________________________Total $ 4,256,909 $ 1,256,756 $ — $ 5,513,665 _______________________________________________________________________________________________________________________________________________________________________________ _______________________________________________________________________________________________________________________________________________________________________________
Unadjusted Quoted Prices in Active Markets for Identical Significant Other Significant Assets Observable Unobservable and Liabilities Inputs Inputs Balance as ofDescription (Level 1) (Level 2) (Level 3) December 31, 2017

104 Annual Report
Global Equity Select PortfolioCommon Stocks*Australia $ — $ 570,608 $ — $ 570,608Brazil — 1,017,543 — 1,017,543Canada 2,388,596 — — 2,388,596China 469,009 859,171 — 1,328,180Denmark — 716,023 — 716,023Finland — 549,574 — 549,574France — 664,794 — 664,794Germany — 1,718,630 — 1,718,630Hong Kong — 912,061 — 912,061India — 335,848 — 335,848Ireland — 867,965 — 867,965Israel — 459,843 — 459,843Japan — 4,321,614 — 4,321,614Netherlands — 962,531 — 962,531Singapore — 610,696 — 610,696South Africa — 499,673 — 499,673Sweden — 1,618,342 — 1,618,342Switzerland — 498,939 — 498,939Taiwan 580,476 — — 580,476United Kingdom 642,183 5,698,746 — 6,340,929United States 30,369,099 — — 30,369,099Short-Term Investments 1,831,358 — — 1,831,358 _______________________________________________________________________________________________________________________________________________________________________________Total $ 36,280,721 $ 22,882,601 $ — $ 59,163,322 _______________________________________________________________________________________________________________________________________________________________________________ _______________________________________________________________________________________________________________________________________________________________________________Global Strategic Equity PortfolioCommon Stocks*Canada $ 37,522 $ — $ — $ 37,522China 74,835 — — 74,835Denmark — 51,640 — 51,640Finland — 62,077 — 62,077France — 123,020 — 123,020Germany — 60,917 — 60,917Greece — 151 — 151Hong Kong — 110,288 — 110,288Indonesia — 8,959 — 8,959Ireland — 50,209 — 50,209Israel — 43,318 — 43,318Japan — 179,392 — 179,392Netherlands — 27,770 — 27,770New Zealand — 28,568 — 28,568Singapore — 21,287 — 21,287South Africa — 113,884 — 113,884Switzerland — 42,485 — 42,485Taiwan 56,739 — — 56,739United Kingdom — 292,601 — 292,601United States 1,493,599 — — 1,493,599Short-Term Investments 607 — — 607 _______________________________________________________________________________________________________________________________________________________________________________Total $ 1,663,302 $ 1,216,566 $ — $ 2,879,868 _______________________________________________________________________________________________________________________________________________________________________________ _______________________________________________________________________________________________________________________________________________________________________________
Unadjusted Quoted Prices in Active Markets for Identical Significant Other Significant Assets Observable Unobservable and Liabilities Inputs Inputs Balance as ofDescription (Level 1) (Level 2) (Level 3) December 31, 2017
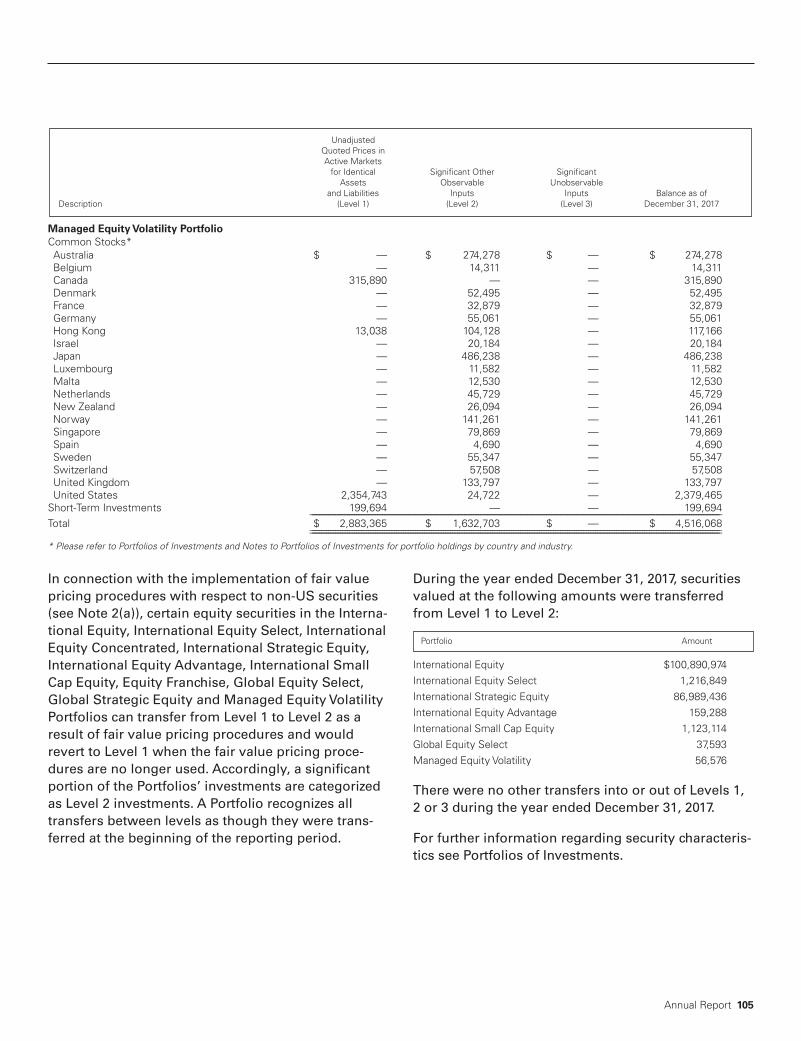
Annual Report 105
Managed Equity Volatility PortfolioCommon Stocks*Australia $ — $ 274,278 $ — $ 274,278Belgium — 14,311 — 14,311Canada 315,890 — — 315,890Denmark — 52,495 — 52,495France — 32,879 — 32,879Germany — 55,061 — 55,061Hong Kong 13,038 104,128 — 117,166Israel — 20,184 — 20,184Japan — 486,238 — 486,238Luxembourg — 11,582 — 11,582Malta — 12,530 — 12,530Netherlands — 45,729 — 45,729New Zealand — 26,094 — 26,094Norway — 141,261 — 141,261Singapore — 79,869 — 79,869Spain — 4,690 — 4,690Sweden — 55,347 — 55,347Switzerland — 57,508 — 57,508United Kingdom — 133,797 — 133,797United States 2,354,743 24,722 — 2,379,465Short-Term Investments 199,694 — — 199,694 _______________________________________________________________________________________________________________________________________________________________________________Total $ 2,883,365 $ 1,632,703 $ — $ 4,516,068 _______________________________________________________________________________________________________________________________________________________________________________ _______________________________________________________________________________________________________________________________________________________________________________
* Please refer to Portfolios of Investments and Notes to Portfolios of Investments for portfolio holdings by country and industry.
Unadjusted Quoted Prices in Active Markets for Identical Significant Other Significant Assets Observable Unobservable and Liabilities Inputs Inputs Balance as ofDescription (Level 1) (Level 2) (Level 3) December 31, 2017
In connection with the implementation of fair valuepricing procedures with respect to non-US securities(see Note 2(a)), certain equity securities in the Interna-tional Equity, International Equity Select, InternationalEquity Concentrated, International Strategic Equity,International Equity Advantage, International SmallCap Equity, Equity Franchise, Global Equity Select,Global Strategic Equity and Managed Equity VolatilityPortfolios can transfer from Level 1 to Level 2 as aresult of fair value pricing procedures and wouldrevert to Level 1 when the fair value pricing proce-dures are no longer used. Accordingly, a significantportion of the Portfolios’ investments are categorizedas Level 2 investments. A Portfolio recognizes alltransfers between levels as though they were trans-ferred at the beginning of the reporting period.
During the year ended December 31, 2017, securitiesvalued at the following amounts were transferredfrom Level 1 to Level 2:
International Equity $100,890,974International Equity Select 1,216,849International Strategic Equity 86,989,436International Equity Advantage 159,288International Small Cap Equity 1,123,114Global Equity Select 37,593Managed Equity Volatility 56,576
There were no other transfers into or out of Levels 1,2 or 3 during the year ended December 31, 2017.
For further information regarding security characteris-tics see Portfolios of Investments.
Portfolio Amount
106 Annual Report
10. Subsequent EventsManagement has evaluated subsequent events affect-ing the Fund through the issuance of the financialstatements and has determined that, aside from itemspreviously disclosed within the Notes to FinancialStatements and the following, there were no subse-quent events that required adjustment or disclosure.
Subsequent to December 31, 2017, the InternationalEquity, International Equity Select, International Strate-gic Equity and International Small Cap Equity Portfo-lios received settlement proceeds in the amount of$4,045,340, $363, $24,287 and $365,412, respectively,from a foreign exchange trading class action lawsuit.The proceeds from the settlement represent a realizedgain and were recorded in the period received.

Annual Report 107
To the Board of Directors of The Lazard Funds, Inc. and Shareholders of Lazard US Equity Concentrated Portfo-lio, Lazard US Strategic Equity Portfolio, Lazard US Small-Mid Cap Equity Portfolio, Lazard International EquityPortfolio, Lazard International Equity Select Portfolio, Lazard International Equity Concentrated Portfolio, LazardInternational Strategic Equity Portfolio, Lazard International Equity Advantage Portfolio, Lazard InternationalSmall Cap Equity Portfolio, Lazard Equity Franchise Portfolio, Lazard Global Equity Select Portfolio, LazardGlobal Strategic Equity Portfolio, and Lazard Managed Equity Volatility Portfolio:
Opinion on the Financial Statements and Financial Highlights We have audited the accompanying statements of assets and liabilities, including the portfolios of investments,of Lazard US Equity Concentrated Portfolio, Lazard US Strategic Equity Portfolio, Lazard US Small-Mid Cap EquityPortfolio, Lazard International Equity Portfolio, Lazard International Equity Select Portfolio, Lazard InternationalEquity Concentrated Portfolio, Lazard International Strategic Equity Portfolio, Lazard International Equity Advan-tage Portfolio, Lazard International Small Cap Equity Portfolio, Lazard Global Equity Select Portfolio, LazardGlobal Strategic Equity Portfolio, and Lazard Managed Equity Volatility Portfolio, twelve of the portfolios constitut-ing The Lazard Funds, Inc. (the “Fund”), as of December 31, 2017, the related statements of operations for the yearthen ended, the statements of changes in net assets for each of the two years in the period then ended, the finan-cial highlights for each of the four years in the period then ended, and the related notes to the financial state-ments. The financial highlights for the year ended December 31, 2013 were audited by other auditors whosereport, dated February 28, 2014, expressed an unqualified opinion on those financial highlights. We have alsoaudited the accompanying statement of assets and liabilities, including the portfolio of investments, of LazardEquity Franchise Portfolio, one of the portfolios constituting the Fund, (collectively with the portfolios mentionedabove, the “Portfolios”), as of December 31, 2017, the related statements of operations and changes in net assetsand the financial highlights for the period from September 29, 2017 (commencement of operations) throughDecember 31, 2017, and the related notes to the financial statements. In our opinion, the financial statements andfinancial highlights present fairly, in all material respects, the financial position of Lazard US Equity ConcentratedPortfolio, Lazard US Strategic Equity Portfolio, Lazard US Small-Mid Cap Equity Portfolio, Lazard InternationalEquity Portfolio, Lazard International Equity Select Portfolio, Lazard International Equity Concentrated Portfolio,Lazard International Strategic Equity Portfolio, Lazard International Equity Advantage Portfolio, Lazard Interna-tional Small Cap Equity Portfolio, Lazard Global Equity Select Portfolio, Lazard Global Strategic Equity Portfolio,and Lazard Managed Equity Volatility Portfolio, as of December 31, 2017, and the results of their operations for theyear then ended, the changes in their net assets for each of the two years in the period then ended, and the finan-cial highlights for each of the four years in the period then ended, and the financial position of Lazard EquityFranchise Portfolio, as of December 31, 2017, and the results of its operations, the changes in its net assets andthe financial highlights for the period from September 29, 2017 (commencement of operations) through Decem-ber 31, 2017, in conformity with accounting principles generally accepted in the United States of America.
Basis for Opinion These financial statements and financial highlights are the responsibility of the Portfolios’ management. Ourresponsibility is to express an opinion on the Portfolios’ financial statements and financial highlights based onour audits. We are a public accounting firm registered with the Public Company Accounting Oversight Board(United States) (PCAOB) and are required to be independent with respect to the Portfolios in accordance withthe U.S. federal securities laws and the applicable rules and regulations of the Securities and Exchange Com-mission and the PCAOB.
We conducted our audits in accordance with the standards of the PCAOB. Those standards require that we planand perform the audit to obtain reasonable assurance about whether the financial statements and financialhighlights are free of material misstatement, whether due to error or fraud. The Portfolios are not required to
The Lazard Funds, Inc. Report of Independent Registered Public Accounting Firm

108 Annual Report
have, nor were we engaged to perform, an audit of their internal control over financial reporting. As part of ouraudits we are required to obtain an understanding of internal control over financial reporting but not for the pur-pose of expressing an opinion on the effectiveness of the Portfolios’ internal control over financial reporting.Accordingly, we express no such opinion.
Our audits included performing procedures to assess the risks of material misstatement of the financial state-ments and financial highlights, whether due to error or fraud, and performing procedures that respond to thoserisks. Such procedures included examining, on a test basis, evidence regarding the amounts and disclosures inthe financial statements and financial highlights. Our audits also included evaluating the accounting principlesused and significant estimates made by management, as well as evaluating the overall presentation of the finan-cial statements and financial highlights. Our procedures included confirmation of securities owned as of Decem-ber 31, 2017, by correspondence with the custodian and brokers; when replies were not received from brokers,we performed other auditing procedures. We believe that our audits provide a reasonable basis for our opinion.
DELOITTE & TOUCHE LLPNewYork, New YorkFebruary 28, 2018
We have served as the auditor of one or more Lazard Fund Complex investment companies since 2004.

Annual Report 109
A Joint Special Meeting of Shareholders of the Fund and Lazard Retirement Series, Inc. was held on October 20,2017, to vote on the following proposals. Except as noted below, the proposals received the required number ofvotes of shareholders and were adopted.
Proposal 1:To elect each of Franci J. Blassberg, Trevor W. Morrison and Nathan A. Paul as a Fund Director.
Franci J. Blassberg 1,322,185,144 18,431,907Trevor W. Morrison 1,323,575,840 17,041,212Nathan A. Paul 1,331,727,319 8,889,732
Proposal 2A:To approve revising the Portfolio's fundamental investment restrictions on issuing senior securities, borrowingand pledging or mortgaging its assets.
US Equity Concentrated 55,236,561 275,958 233,215US Strategic Equity 5,117,457 832 720US Small-Mid Cap Equity* 4,938,201 3,948,804 14,691International Equity 100,274,564 185,666 189,973International Equity Select 3,144,596 16,924 19,954International Strategic Equity 187,361,095 4,238,688 1,845,962International Small Cap Equity* 2,302,579 45,455 28,372Global Equity Select 3,385,435 — —
Proposal 2B:To approve revising the Portfolio's fundamental investment restrictions on purchasing or selling commodities orcommodities contracts.
US Equity Concentrated 55,055,031 462,210 228,492US Strategic Equity 5,117,457 832 720US Small-Mid Cap Equity* 4,944,266 3,943,838 13,592International Equity 100,118,436 328,470 203,297International Equity Select 3,146,192 15,328 19,954International Strategic Equity 187,529,405 4,056,768 1,859,570International Small Cap Equity* 2,298,290 43,817 34,300Global Equity Select 3,385,435 — —
Director For Withhold Authority
Portfolio For Against Abstain
Portfolio For Against Abstain
The Lazard Funds, Inc. Proxy Voting Results (unaudited)
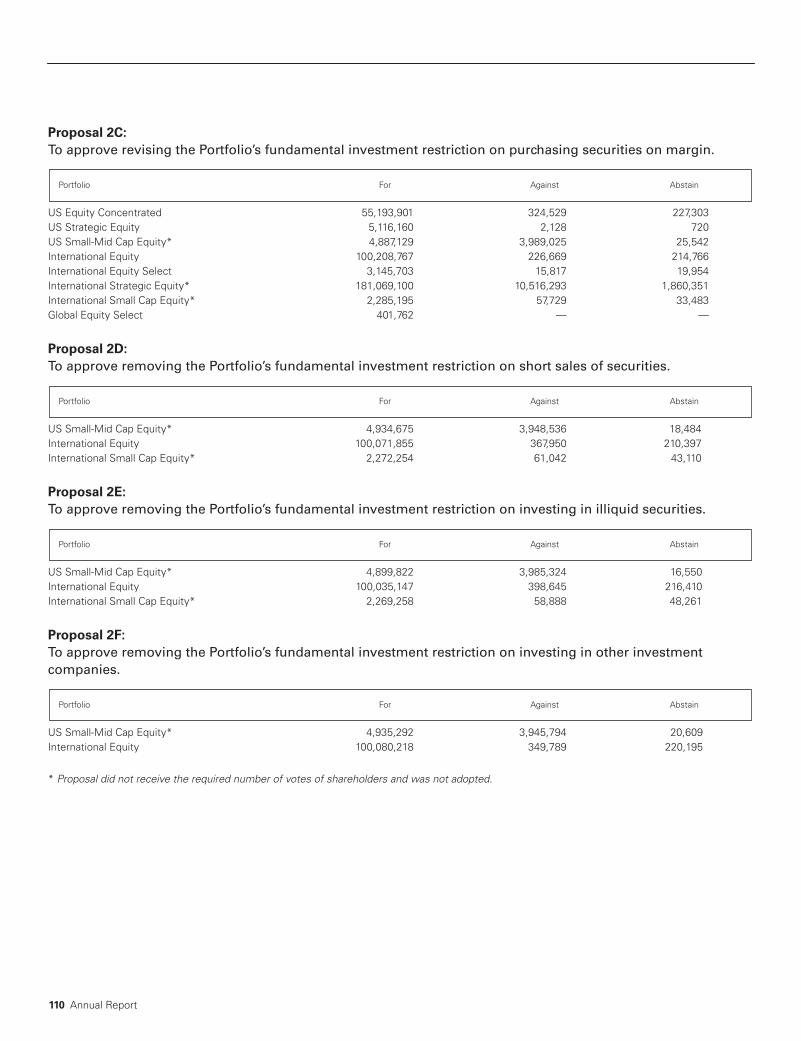
110 Annual Report
Proposal 2C:To approve revising the Portfolio’s fundamental investment restriction on purchasing securities on margin.
US Equity Concentrated 55,193,901 324,529 227,303US Strategic Equity 5,116,160 2,128 720US Small-Mid Cap Equity* 4,887,129 3,989,025 25,542International Equity 100,208,767 226,669 214,766International Equity Select 3,145,703 15,817 19,954International Strategic Equity* 181,069,100 10,516,293 1,860,351International Small Cap Equity* 2,285,195 57,729 33,483Global Equity Select 401,762 — —
Proposal 2D:To approve removing the Portfolio’s fundamental investment restriction on short sales of securities.
US Small-Mid Cap Equity* 4,934,675 3,948,536 18,484International Equity 100,071,855 367,950 210,397International Small Cap Equity* 2,272,254 61,042 43,110
Proposal 2E:To approve removing the Portfolio’s fundamental investment restriction on investing in illiquid securities.
US Small-Mid Cap Equity* 4,899,822 3,985,324 16,550International Equity 100,035,147 398,645 216,410International Small Cap Equity* 2,269,258 58,888 48,261
Proposal 2F:To approve removing the Portfolio’s fundamental investment restriction on investing in other investment companies.
US Small-Mid Cap Equity* 4,935,292 3,945,794 20,609International Equity 100,080,218 349,789 220,195
* Proposal did not receive the required number of votes of shareholders and was not adopted.
Portfolio For Against Abstain
Portfolio For Against Abstain
Portfolio For Against Abstain
Portfolio For Against Abstain
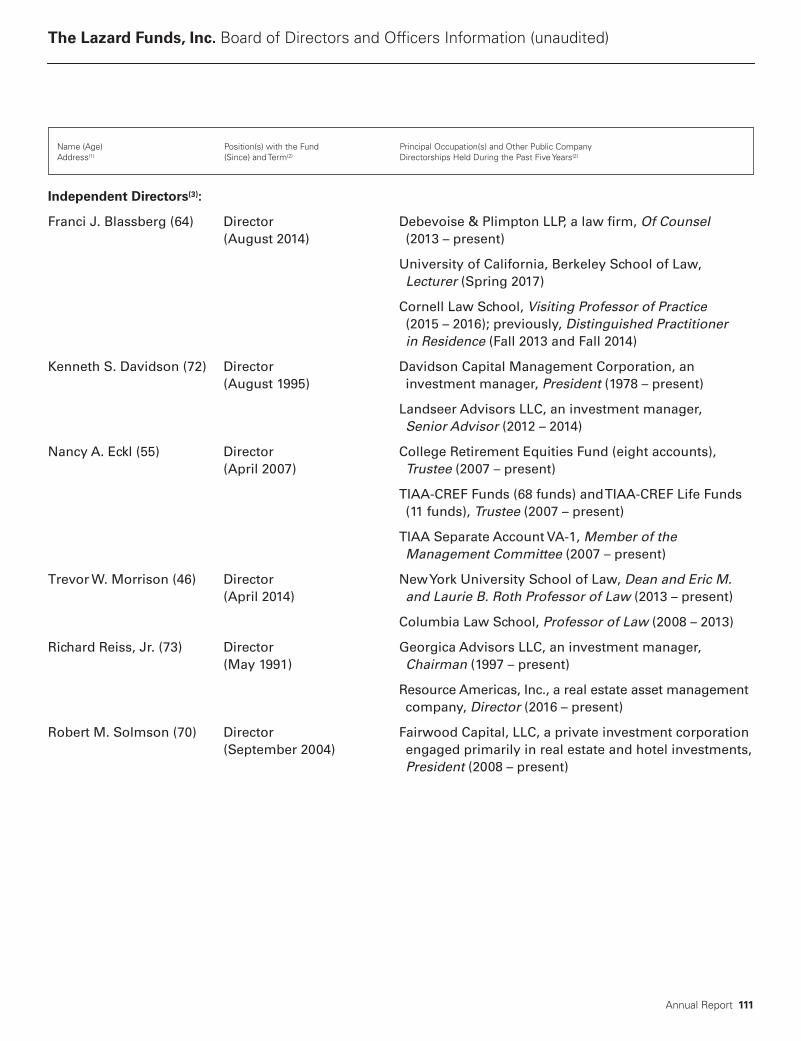
Annual Report 111
Independent Directors(3):
Franci J. Blassberg (64) Director Debevoise & Plimpton LLP, a law firm, Of Counsel (August 2014) (2013 – present)
University of California, Berkeley School of Law,Lecturer (Spring 2017)
Cornell Law School, Visiting Professor of Practice(2015 – 2016); previously, Distinguished Practitionerin Residence (Fall 2013 and Fall 2014)
Kenneth S. Davidson (72) Director Davidson Capital Management Corporation, an (August 1995) investment manager, President (1978 – present)
Landseer Advisors LLC, an investment manager,Senior Advisor (2012 – 2014)
Nancy A. Eckl (55) Director College Retirement Equities Fund (eight accounts), (April 2007) Trustee (2007 – present)
TIAA-CREF Funds (68 funds) and TIAA-CREF Life Funds(11 funds), Trustee (2007 – present)
TIAA Separate Account VA-1, Member of theManagement Committee (2007 – present)
Trevor W. Morrison (46) Director New York University School of Law, Dean and Eric M. (April 2014) and Laurie B. Roth Professor of Law (2013 – present)
Columbia Law School, Professor of Law (2008 – 2013)
Richard Reiss, Jr. (73) Director Georgica Advisors LLC, an investment manager, (May 1991) Chairman (1997 – present)
Resource Americas, Inc., a real estate asset managementcompany, Director (2016 – present)
Robert M. Solmson (70) Director Fairwood Capital, LLC, a private investment corporation (September 2004) engaged primarily in real estate and hotel investments,
President (2008 – present)
The Lazard Funds, Inc. Board of Directors and Officers Information (unaudited)
Name (Age) Position(s) with the Fund Principal Occupation(s) and Other Public CompanyAddress(1) (Since) and Term(2) Directorships Held During the Past Five Years(2)

112 Annual Report
Interested Directors(4):
Ashish Bhutani (57) Director Investment Manager, Chief Executive Officer (July 2005) (2004 – present)
Lazard Ltd, Vice Chairman and Director(2010 – present)
Nathan A. Paul (45) Director (October 2017) Investment Manager, Chief Business Officer Chief Executive Officer and (April 2017 – present) and Managing Director President (February 2017) (2003 – present)
Investment Manager, General Counsel(2002 – April 2017)
(1) The address of each Director of the Fund is Lazard Asset Management LLC, 30 Rockefeller Plaza, New York, New York 10112-6300.(2) Each Director serves as a Director for each of the funds in the Lazard Fund Complex (comprised of, as of January 31, 2018, 41 active investmentportfolios). Each Director serves an indefinite term, until his or her successor is elected, and each Director serves in the same capacity for theother funds in the Lazard Fund Complex.
(3) “Independent Directors” are not “interested persons” (as defined in the 1940 Act) of the Fund.(4) Messrs. Bhutani and Paul are “interested persons” (as defined in the 1940 Act) of the Fund because of their positions with the Investment Manager.
The Fund’s Statement of Additional Information contains further information about the Directors and is available without charge by calling 800-823-6300,or online, at www.lazardassetmanagement.com.
Name (Age) Position(s) with the Fund Principal Occupation(s) and Other Public CompanyAddress(1) (Since) and Term(2) Directorships Held During the Past Five Years(2)

Annual Report 113
Officers(3):
Mark R. Anderson (47) Chief Compliance Officer Managing Director (since February 2017, previously (September 2014), Vice Director), General Counsel (since April 2017) and President and Secretary Chief Compliance Officer (since September 2014) (February 2017) of the Investment Manager
Senior Vice President, Counsel and Deputy ChiefCompliance Officer of AllianceBernstein L.P.(2004 – August 2014)
Christopher Snively (33) Chief Financial Officer Senior Vice President of the Investment Manager (March 2016) (since November 2015)
Assurance Manager at PricewaterhouseCoopers LLP(2008 – November 2015)
Stephen St. Clair (59) Treasurer Vice President of the Investment Manager (May 2003)
Tamar Goldstein (42) Assistant Secretary Director (since February 2016, previously Senior Vice (February 2009) President), and Director of Legal Affairs (since July
2015) of the Investment Manager
Shari L. Soloway (36) Assistant Secretary Senior Vice President, Legal and Compliance, of the (November 2015) Investment Manager (since September 2015)
Vice President and Associate General Counsel of GE Asset Management (July 2011 – September 2015)
Cesar A. Trelles (43) Assistant Treasurer Vice President of the Investment Manager (December 2004)(1) The address of each officer of the Fund is Lazard Asset Management LLC, 30 Rockefeller Plaza, New York, New York 10112-6300.(2) Each officer serves for an indefinite term, until his or her successor is elected and qualifies or until his or her earlier resignation or removal. Eachofficer serves in the same capacity for the other funds in the Lazard Fund Complex.
(3) In addition to Nathan A. Paul, Chief Executive Officer and President (since February 2017; previously, Vice President and Secretary since April2002), whose information is included in the Interested Directors section above.
Name (Age) Position(s) with the FundAddress(1) (Since) and Term(2) Principal Occupation(s) During the Past Five Years

114 Annual Report
Tax InformationYear Ended December 31, 2017The following tax information represents year enddisclosures of the tax benefits passed through toshareholders for 2017:
Of the dividends paid by the Portfolios, the correspon-ding percentage shown below is qualified dividendincome.
US Equity Concentrated 100.00%US Strategic Equity 57.70US Small-Mid Cap Equity 32.80International Equity 100.00International Equity Select 100.00International Equity Concentrated 100.00International Strategic Equity 100.00International Equity Advantage 100.00International Small Cap Equity —Equity Franchise 100.00Global Equity Select 100.00Global Strategic Equity 31.43Managed Equity Volatility 73.88
Of the dividends paid by the Portfolios, the correspon-ding percentage represents the amount of each divi-dend that qualifies for the dividends receiveddeduction available to corporate shareholders.
US Equity Concentrated 85.89%US Strategic Equity 64.57US Small-Mid Cap Equity 23.20International Equity —International Equity Select —International Equity Concentrated —International Strategic Equity —International Equity Advantage —International Small Cap Equity —Equity Franchise 25.30Global Equity Select 44.01Global Strategic Equity 8.57Managed Equity Volatility 27.84
Pursuant to Section 871 of the Code, the Portfolioshave no designated qualified short-term gains for pur-poses of exempting withholding of tax on such distri-butions to US nonresident shareholders.
Proxy VotingA description of the policies and procedures used todetermine how proxies relating to Fund portfoliosecurities are voted is available (1) without charge,upon request, by calling (800) 823-6300 or (2) on theU.S. Securities and Exchange Commission (the “SEC”)website at https://www.sec.gov.
The Fund’s proxy voting record for the most recent12-month period ended June 30 is available (1) with-out charge, upon request, by calling (800) 823-6300 or(2) on the SEC’s website at https://www.sec.gov. Infor-mation as of June 30 each year will generally be avail-able by the following August 31.
Form N-QThe Fund files a complete schedule of each Portfolio’sholdings for the first and third quarters of its fiscal yearwith the SEC on Form N-Q. The Fund’s Forms N-Q areavailable on the SEC’s website at https://www.sec.govand may be reviewed and copied at the SEC’s PublicReference Room in Washington, D.C. Information onthe operation of the SEC’s Public Reference Roommay be obtained by calling 1-800-SEC-0330.
Board Consideration of Management Agreement
Lazard Equity Franchise Portfolio
At a meeting of the Board held on August 8, 2017, theBoard considered the approval of the ManagementAgreement between the Fund, on behalf of LazardEquity Franchise Portfolio (the “New Portfolio”), andthe Investment Manager (the “New Portfolio Manage-ment Agreement”). The Independent Directors wereassisted in their review by independent legal counsel,who advised the Board on relevant legal standardsand met with the Independent Directors in executivesession separate from representatives of the Invest-ment Manager.
Portfolio Percentage
Portfolio Percentage
The Lazard Funds, Inc. Tax and Other Information (unaudited)
Annual Report 115
(1) The New Portfolio has two comparison groups, corresponding to Open and Institutional Shares.
Services ProvidedThe Board previously had received and discussedinformation addressing, among other matters, thenature, extent and quality of services that the Invest-ment Manager provides to the Fund, including a dis-cussion of the Investment Manager and its clients (ofwhich the existing Lazard Funds Complex of 40 activefunds comprised approximately $35 billion of theapproximately $226 billion of total assets under themanagement of the Investment Manager and itsglobal affiliates as of June 30, 2017); the InvestmentManager’s global research, portfolio management,operations, technology, legal and compliance andmarketing infrastructure; and the Investment Man-ager’s personnel, resources, financial condition andexperience. The Board received a presentation on theNew Portfolio from members of the New Portfolio’sproposed portfolio management team, including thestrategies to be employed for the New Portfolio andthe New Portfolio’s portfolio management team,including professional biographies.
The Directors considered the various services to beprovided by the Investment Manager including theInvestment Manager’s research and portfolio manage-ment capabilities and oversight of day-to-day opera-tions, including supervision of fund accounting andadministration-related services and assistance inmeeting legal and regulatory requirements. The Direc-tors also considered the Investment Manager’s infra-structure and agreed that the New Portfolio would beexpected to benefit from the services and infrastruc-ture provided by the Investment Manager. The Direc-tors accepted management’s assertion that suchservices and infrastructure would be greater thanthose typically provided to a $35 billion fund complexnot managed by a large, global firm such as theInvestment Manager.
Comparative Fee, Expense Ratio and PerformanceInformationThe Directors reviewed comparative fee and expenseratio information prepared by Strategic Insight, anindependent provider of investment company data.They noted the methodology and assumptions usedby Strategic Insight.
Advisory Fee and Expense Ratios.The Directors dis-cussed the proposed management fee to be paid tothe Investment Manager (referred to in the StrategicInsight materials as the “advisory fee”) and expenseratios for the New Portfolio (as limited by the Invest-ment Manager (“net”)) and the comparisons providedby Strategic Insight, which compared the contractual(gross) advisory fee and net expense ratios for theNew Portfolio to its respective groups(1) of comparisonfunds (“Groups”). The proposed contractual advisoryfee and expense ratios for the New Portfolio werebelow the medians for the Groups. The Board alsoconsidered the fees paid by other pooled vehiclesadvised by the Investment Manager with investmentobjectives, policies and strategies similar to those ofthe New Portfolio (the “Equity Franchise OtherAccounts”).
Performance. The Directors considered the perform-ance of the Equity Franchise Other Accounts com-pared to the MSCI World Index (the “Index”) for theone-year, three-year and since inception periodsended June 30, 2017; the second quarter of 2017; year-to-date through June 30, 2017; and calendar years2014, 2015 and 2016. The performance of the EquityFranchise Other Accounts (net of fees) was above thatof the Index for all periods, and with slightly lowervolatility (since inception) than the Index.
Investment Manager Profitability and Economies of ScaleRepresentatives of the Investment Manager notedthat because the New Portfolio is newly formed, hasnot commenced operations and the eventual aggre-gate amount of the New Portfolio’s assets was uncer-tain, specific information concerning the cost ofservices to be provided to the New Portfolio and theexpected profits to be realized by the InvestmentManager and its affiliates from their relationships withthe New Portfolio and economies of scale would besubject to a number of assumptions and would bespeculative and not meaningful. The Investment Man-ager’s representatives stated that they did not expectthe Investment Manager to realize any current profitson the New Portfolio initially, noting the InvestmentManager’s agreement to waive its fees and/or

116 Annual Report
reimburse expenses of the New Portfolio for at leasttwo years following the New Portfolio’s commence-ment of operations to maintain the expense ratiosreflected in the Strategic Insight materials. The Boarddetermined to revisit this issue no later than when itnext reviewed the investment management fee inconnection with renewal of the New Portfolio Man-agement Agreement. The Investment Manager’s rep-resentatives reviewed with the Board informationprovided on the Investment Manager’s brokerage andsoft dollar practices. The Investment Manager’s repre-sentatives stated that neither the Investment Managernor its affiliates were expected to receive any othersignificant indirect benefits from the Investment Man-ager acting as investment adviser to the New Portfo-lio. The representatives of the Investment Managerstated that the Investment Manager intends to sup-port distribution relationships through direct pay-ments from its or its affiliates’ own resources to thirdparties in connection with distribution and share-holder servicing and/or administrative and record-keeping services, and noted that the New Portfoliowould not bear any related costs other than the 0.25%12b-1 fee pursuant to the Distribution and ServicingPlan adopted for the New Portfolio’s Open Shares.
At the conclusion of these discussions, each of theDirectors expressed the opinion that he or she hadbeen furnished with such information as may reason-ably be necessary to make an informed business deci-sion with respect to the approval of the New PortfolioManagement Agreement. Based on its discussions andconsiderations as described above, the Board madethe following conclusions and determinations withregard to the New Portfolio Management Agreement:
• The Board concluded that the nature, extent andquality of the services to be provided by the Invest-ment Manager are adequate and appropriate, not-ing the benefits of advisory and research servicesand other services and infrastructure (as discussedabove) associated with an approximately $226 bil-lion global asset management business.
• The Board was satisfied with the resources theInvestment Manager was to devote to managementof the New Portfolio.
• The Board concluded that the fees to be paid to theInvestment Manager were appropriate in light of thetotality of the services to be provided as discussedabove.
• The Board recognized that economies of scale maybe realized as the assets of the New Portfolioincrease. The Board determined it would seek tohave the Investment Manager share any materialeconomies of scale with the New Portfolio.
In evaluating the New Portfolio Management Agree-ment, the Board relied on the information describedabove as well as other information provided by theInvestment Manager. The Board considered these con-clusions and determinations in their totality and deter-mined to approve the New Portfolio ManagementAgreement. In deciding whether to vote to approvethe New Portfolio Management Agreement, eachDirector may have accorded different weights to dif-ferent factors so that each Director may have had adifferent basis for his or her decision.
The Lazard Funds, Inc.30 Rockefeller PlazaNew York, New York 10112-6300Telephone: 800-823-6300https://www.lazardassetmanagement.com
Investment ManagerLazard Asset Management LLC30 Rockefeller PlazaNew York, New York 10112-6300Telephone: 800-823-6300
DistributorLazard Asset Management Securities LLC30 Rockefeller PlazaNew York, New York 10112-6300
CustodianState Street Bank and Trust CompanyOne Iron StreetBoston, Massachusetts 02210
Transfer Agent and Dividend Disbursing AgentDST Asset Manager Solutions, Inc.P.O. Box 8514Boston, Massachusetts 02266-8514Telephone: 800-986-3455
Independent Registered Public Accounting FirmDeloitte & Touche LLP30 Rockefeller PlazaNew York, New York 10112-0015
Legal CounselProskauer Rose LLPEleven Times SquareNew York, New York 10036-8299http://www.proskauer.com

Performance information as of the most recent month end is available online at www.lazardassetmanagement.com.
Lazard Asset Management LLC • 30 Rockefeller Plaza • New York, NY 10112 • www.lazardassetmanagement.com
UFCW® 888
LZDPS020
Related Documents