Journal of Fluorescence, Vol. 8, No. 4, 1998 Laurdan and Prodan as Polarity-Sensitive Fluorescent Membrane Probes Tiziana Parasassi, 1,3 Ewa K. Krasnowska, 1 Luis Bagatolli, 2 and Enrico Gratton 2 Received February 25, 1998; Accepted July 13, 1998 The steady-state and dynamic fluorescence spectral properties of 2-dimethylamino-6-lauroylna- phthalene (LAURDAN) and several other naphthalene derivatives are summarized to illustrate their sensitivity to the polarity of the environment. Results obtained both in solvents of different polarity and in phospholipid vesicles in two phase states are presented. The emission red shift observed in polar solvents and in the phospholipid liquid–crystalline phase is explained on the basis of dipolar relaxation of solvent molecules surrounding the fluorescent naphthalene moiety of these probes. In phospholipid environments, experimental evidence is shown that excludes the intramolecular relative reorientation of the dimethylamino and carbonyl groups in the naphthalene and the reo- rientation of the entire fluorescent moiety. The solvent dipolar relaxation observed for LAURDAN and PRODAN in phospholipid bilayers has been attributed to a small number of water molecules present at the membrane interface. A comparison between LAURDAN emission in phospholipid vesicles prepared in D 2 O and in H 2 O is also presented. The definition and the derivation of the generalized polarization function are also discussed. KEY WORDS: Dipolar relaxation; generalized polarization; oxygen-quenching; time-resolved spectra; water. NAPHTHALENE DERIVATIVES FOR THE STUDY OF SOLVENT DIPOLAR RELAXATION The two naphthalene derivatives, 6-lauroyl and 6- propiony1-2-dimethylamino naphthalene, LAURDAN and PRODAN, respectively (Fig. 1), were first designed and synthesized by Gregorio Weber [1,2] to study the phenomenon of dipolar relaxation. The fluorescent naph- thalene moiety of these probes possesses a dipole mo- ment due to a partial charge separation between the 2-dimethylamino and the 6-carbonyl residues. This di- pole moment increases upon excitation and may cause reorientation of the solvent dipoles. The energy required for solvent reorientation decreases the probe's excited 1 Istituto di Medicina Sperimentale, CNR, viale Marx 15, 00137 Roma, Italy. 2 Laboratory for Fluorescence Dynamics, Department of Physics, Uni- versity of Illinois at Urbana-Champaign, 1110 West Green Street, Urbana 61801, Illinois. 3 To whom correspondence should be addressed. 365 state energy, which is reflected in a continuous red shift of the probe's steady-state emission spectrum. A sche- matic diagram of this relaxation process is given in Fig. 2. Of course the solvent dipolar relaxation phenomenon can be observed only in polar solvents. A bluer emission is observed in apolar solvents, while a redder emission is observed in polar solvents. LAURDAN sensitivity to solvent polarity can be illustrated by the linear Lippert plot [3] and by the increasing red shift observed in LAURDAN's emission spectrum with increasing solvent polarity. For instance, LAURDAN's emission maximum in dodecane is =380 nm, in dimethylsulfoxide =460 nm, and in methanol =490 nm [4]. DIPOLAR RELAXATION OBSERVED IN PHOSPHOLIPID BILAYERS The emission maxima of LAURDAN and PRO- DAN in phospholipid bilayers depend upon the phase 1053-0509/98/1200-0365$15.00/0 C 1998 Plenum Publishing Corporation

Welcome message from author
This document is posted to help you gain knowledge. Please leave a comment to let me know what you think about it! Share it to your friends and learn new things together.
Transcript
Journal of Fluorescence, Vol. 8, No. 4, 1998
Laurdan and Prodan as Polarity-Sensitive FluorescentMembrane Probes
Tiziana Parasassi,1,3 Ewa K. Krasnowska,1 Luis Bagatolli,2 and Enrico Gratton2
Received February 25, 1998; Accepted July 13, 1998
The steady-state and dynamic fluorescence spectral properties of 2-dimethylamino-6-lauroylna-phthalene (LAURDAN) and several other naphthalene derivatives are summarized to illustrate theirsensitivity to the polarity of the environment. Results obtained both in solvents of different polarityand in phospholipid vesicles in two phase states are presented. The emission red shift observed inpolar solvents and in the phospholipid liquid–crystalline phase is explained on the basis of dipolarrelaxation of solvent molecules surrounding the fluorescent naphthalene moiety of these probes.In phospholipid environments, experimental evidence is shown that excludes the intramolecularrelative reorientation of the dimethylamino and carbonyl groups in the naphthalene and the reo-rientation of the entire fluorescent moiety. The solvent dipolar relaxation observed for LAURDANand PRODAN in phospholipid bilayers has been attributed to a small number of water moleculespresent at the membrane interface. A comparison between LAURDAN emission in phospholipidvesicles prepared in D2O and in H2O is also presented. The definition and the derivation of thegeneralized polarization function are also discussed.
KEY WORDS: Dipolar relaxation; generalized polarization; oxygen-quenching; time-resolved spectra; water.
NAPHTHALENE DERIVATIVES FOR THESTUDY OF SOLVENT DIPOLAR RELAXATION
The two naphthalene derivatives, 6-lauroyl and 6-propiony1-2-dimethylamino naphthalene, LAURDANand PRODAN, respectively (Fig. 1), were first designedand synthesized by Gregorio Weber [1,2] to study thephenomenon of dipolar relaxation. The fluorescent naph-thalene moiety of these probes possesses a dipole mo-ment due to a partial charge separation between the2-dimethylamino and the 6-carbonyl residues. This di-pole moment increases upon excitation and may causereorientation of the solvent dipoles. The energy requiredfor solvent reorientation decreases the probe's excited
1 Istituto di Medicina Sperimentale, CNR, viale Marx 15, 00137 Roma,Italy.
2 Laboratory for Fluorescence Dynamics, Department of Physics, Uni-versity of Illinois at Urbana-Champaign, 1110 West Green Street,Urbana 61801, Illinois.
3 To whom correspondence should be addressed.
365
state energy, which is reflected in a continuous red shiftof the probe's steady-state emission spectrum. A sche-matic diagram of this relaxation process is given in Fig.2. Of course the solvent dipolar relaxation phenomenoncan be observed only in polar solvents. A bluer emissionis observed in apolar solvents, while a redder emissionis observed in polar solvents. LAURDAN sensitivity tosolvent polarity can be illustrated by the linear Lippertplot [3] and by the increasing red shift observed inLAURDAN's emission spectrum with increasing solventpolarity. For instance, LAURDAN's emission maximumin dodecane is =380 nm, in dimethylsulfoxide =460 nm,and in methanol =490 nm [4].
DIPOLAR RELAXATION OBSERVED INPHOSPHOLIPID BILAYERS
The emission maxima of LAURDAN and PRO-DAN in phospholipid bilayers depend upon the phase
1053-0509/98/1200-0365$15.00/0 C 1998 Plenum Publishing Corporation

366 Parasassi, Krasnowska, Bagatolli, and Gratton
Fig. 1. Chemical structures of 2-dimethylamino-6-lauroylnaphthalene(LAURDAN), 2-dimethylamino-6-propionylnaphthalene (PRODAN),2-diisopropylamino-6-lauroylnaphthalene (LAURISAN), 2-hydroxy-6-lauroylnaphthalene (LAURNA), and 2-methoxy-6-lauroyInaphthalene(LAURMEN). PRODAN and LAURDAN are from Molecular ProbesInc., Eugene, OR. LAURISAN, LAURNA, and LAURMEN were agenerous gift of Gregorio Weber, synthesized following the proceduredescribed in Ref. 1.
Fig. 3. Emission spectra of (A) LAURDAN in dilauroyl-phosphati-dylcholine (DLPC) vesicles as a function of temperature, from 0 to60 D C, and (B) PRODAN in dipalmitoyl-phosphatidylcholine (DPPC)vesicles as a function of temperature, from 20 to 60 D C. DPPC andDLPC (Avanti Polar Lipids, Inc., Alabaster AL) multilamellar vesicleswere prepared and labeled using standard procedures [3]. The spectrawere acquired using a GREG 200 fluorometer (ISS Inc., Champaign,IL), equipped with photon counting electronic (P01, ISS Inc.), with axenon arc lamp as the light source, 8-nm excitation and emission band-passes, and continuous mild stirring of the samples. The cell holderwas thermostated at ± 0.1 D C using a circulating water bath.
hibits a temperature-dependent shift of the emissionmaximum. Instead, at temperatures above the phospho-lipid phase transition, a continuous red shift of the emis-sion is observed, to a limiting green emission at thehighest temperatures, with a maximum at about 490 nm(Fig. 3). This shift of the emission spectrum has beenattributed to dipolar relaxation processes occurring in thephospholipid liquid–crystalline phase but not in the gelphase.
To investigate the molecular entities in the phos-pholipid bilayer that reorient around LAURDAN andPRODAN excited-state dipoles, experiments have beenperformed in bilayers with different polar head compo-
Fig. 2. Schematics of the ground (S0) and excited-state (S1) energylevels in the presence of the solvent dipolar relaxation. S1 decreasesin energy as solvent dipolar relaxation proceeds.
state of the phospholipids, being blue in the gel (maxi-mum emission =440 nm) and green in the liquid crys-talline phase (maximum emission =490 nm) (Fig. 3).Moreover, in gel phase phospholipids, neither probe ex-

Solvent Dipolar Relaxation Viewed by LAURDAN and PRODAN 367
Fig. 4. Schematic representation of LAURDAN and PRODAN locations in thephospholipid bilayer.
sition and charge, i.e., different phospholipids at pH val-ues between 4.0 and 10.0. The red spectral shift has beenfound to be independent of the polar head residue andof its charge. Instead, this shift depends only on thephase state of the bilayer [4]. Thus, the origin of thedipolar relaxation observed in phospholipids has beenattributed to a few water molecules present in the bilayerat the level of the glycerol backbone, where the fluores-cent moiety of LAURDAN and PRODAN resides (Fig.4). The concentration and the molecular dynamics ofthese water molecules change in the two phospholipidphase states, i.e., the water reorientation along the probesexcited-state dipole occurs only in the liquid–crystallinephase. In the tightly packed gel phase phospholipid bi-layers, red shift of the emission cannot be observed. In-stead, the continuous red shift of the emission observedin the liquid–crystalline phase with increasing tempera-ture is due both to the increased concentration of waterin the bilayer and to its increased mobility.
Experiments have also been performed using D2Oinstead of H2O as a solvent for the phospholipid vesiclespreparation. Due to the slower dynamics of D2O com-
pared to H2O, bluer emission spectra were observedwhen the vesicles were prepared in D2O. In Fig. 5 thisblue shift is reported as the difference between the GP(AGP) values measured in dimyristoyl-phosphatidylcho-line (DMPC) vesicles prepared using D2O and H2O atdifferent temperatures (the definition and discussion ofthe GP value are given below). The AGP increases atthe transition temperature and reaches the maximumvalue in the liquid–crystalline state. We conclude thatthe origin of the dipolar relaxation observed during thephospholipid transition and in the liquid015–crystallinephase is actually due to water molecules surrounding thenaphthalene fluorescence moiety as proposed previously[4]. Similar results have been obtained with LAURDANin deuterated methanol (not shown).
COMPARISON BETWEEN LAURDAN ANDPRODAN
In phospholipid bilayers LAURDAN is tightly an-chored in the hydrophobic core by the cooperative van

368 Parasassi, Krasnowska, Bagatolli, and Gratton
Fig. 5. Difference between the GP values (AGP) measured in dimy-ristoyl-phosphatidylcholine (DMPC) vesicles prepared in D2O and inH2O. The GP values were calculated following Eq. (1) from emissionspectra. The spectra were acquired using a PCI photon counting spec-trofluorometer (1SS Inc., Champaign, IL), with a xenon arc lamp asthe light source, with 2-nm excitation and emission bandpasses. Thecell holder was thermostated at ± 0.1 D C using a circulating water bath.Excitation at 360 nm.
Fig. 6. LAURDAN and PRODAN GP values measured in DPPC ves-icles as a function of temperature following Eq. (1). Excitation wave-length was 340 nm. Measurements were performed as described in thelegend to Fig. 3.
der Waals interactions between the lauric acid tail andthe lipid hydrocarbon chains, with its fluorescent moietyresiding at the level of the phospholipid glycerol back-bone [5]. Being virtually insoluble in water, LAURDANemission originates entirely from probes within thephospholipid environment [6]. PRODAN, however, with
its shorter propionyl tail, is more loosely anchored to thebilayer [7] and is also water soluble. PRODAN showsan appreciable fluorescence in water, with a maximumat about 515 nm (Fig. 3B). Relative to LAURDAN,PRODAN is located closer to the aqueous surface of thebilayer, in a more polar environment and is able to sensethe more freely rotating water dipoles (Fig. 4). SincePRODAN also partitions in the aqueous environment,where its emission maximum is near 515 nm, and sinceits partitioning in the bilayer decreases when the mem-brane is tightly packed in the gel phase, the PRODANemission spectra reported in Fig. 3B show some pecu-liarities: (1) the band at about 515 nm is particularlyclear at low temperatures; (2) its total emission intensityincreases with temperature in the phospholipid transition(for DPPC at temperatures >40 D C); and (3) when PRO-DAN spectral red shift is used to monitor the phospho-lipid phase transition, with increasing temperature wefirst observe a blue emission in the gel phase, followedby a progressive red shift starting at temperatures cor-responding to the phospholipid polar-head pretransition.Instead, when LAURDAN's spectral shift is used for thesame purpose, with increasing temperature we observea red emission shift only at temperatures correspondingto the main acyl chain transition. By observing LAUR-DAN's and PRODAN's GP values (see below for thederivation of the GP function) in DPPC vesicles as afunction of temperature, we can clearly detect the polar-head pretransition only in the case of PRODAN (Fig.6).
TIME-RESOLVED EMISSION SPECTRA
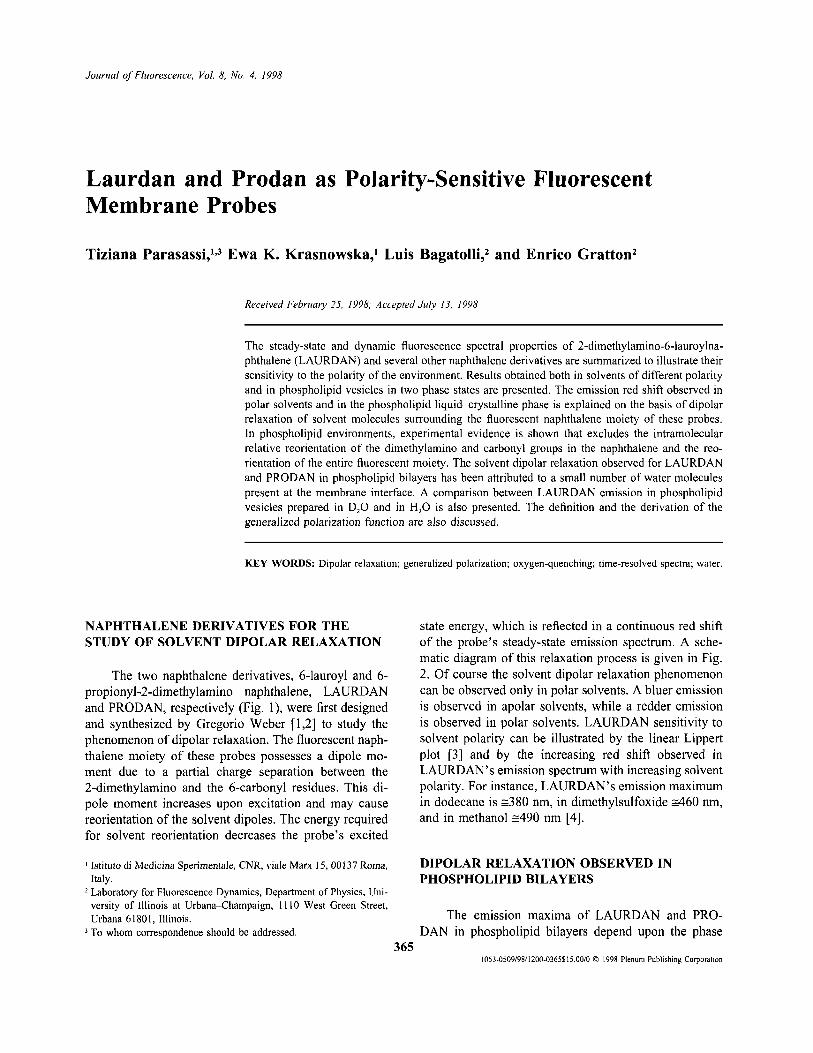
In addition to the observation of the steady-stateemission spectral shift, a dynamic determination of thedipolar relaxation rate can be achieved by the measure-ment of time-resolved emission spectra. We observedthat in a polar environment those probe molecules witha bluer emission spectrum have a shorter lifetime valuethan the molecules emitting with a redder emission. Inother words, if we look at the emission spectrum as afunction of time after excitation we observe a continuoustime-dependent red spectral shift (Fig. 7) [3,8]. This redshift of the emission spectrum is particularly clear whenwe plot the emission center of mass as a function of thetime after excitation (Fig. 8). Of course, this time-de-pendent red spectral shift can be observed only in a polarenvironment and only when the dynamics of the solventdipoles is on the same time scale as the probe's lifetime.Consistent with the steady-state observations, the time-resolved spectral shifts also depend on the composition
Solvent Dipolar Relaxation Viewed by LAURDAN and PRODAN 369
Fig. 7. Normalized PRODAN time-resolved emission spectra in DLPCvesicles at 25 D C. Fluorescence lifetime measurements were performedusing a K2 phase fluorometer (ISS Inc.), with a xenon arc lamp as thelight source. Excitation was at 360 nm. An additional polarizer wasinserted in the excitation light path, with an angle of 35° with respectto the vertical. A solution of 2,2'-p-phenylene-bis-(5-phenyl)oxazole(POPOP) in ethanol was used as the reference (lifetime = 1.35 ns).During measurements, samples were continuously stirred. The samplecompartment was kept at 25 ± 0.1 D C by a circulating water bath. Theemission was observed through a series of seven interference filters,from 420 to 540 nm, with a 10-nm bandwidth and at 20–nm intervals.Phase and modulation data were acquired at each emission wavelengthusing a set of 10 frequencies, logarithmically spaced from 25 to 250MHz. To obtain the time-resolved spectra, data were analyzed usingthe Globals Unlimited software (Laboratory for Fluorescence Dynam-ics, University of Illinois at Urbana-Champaign).
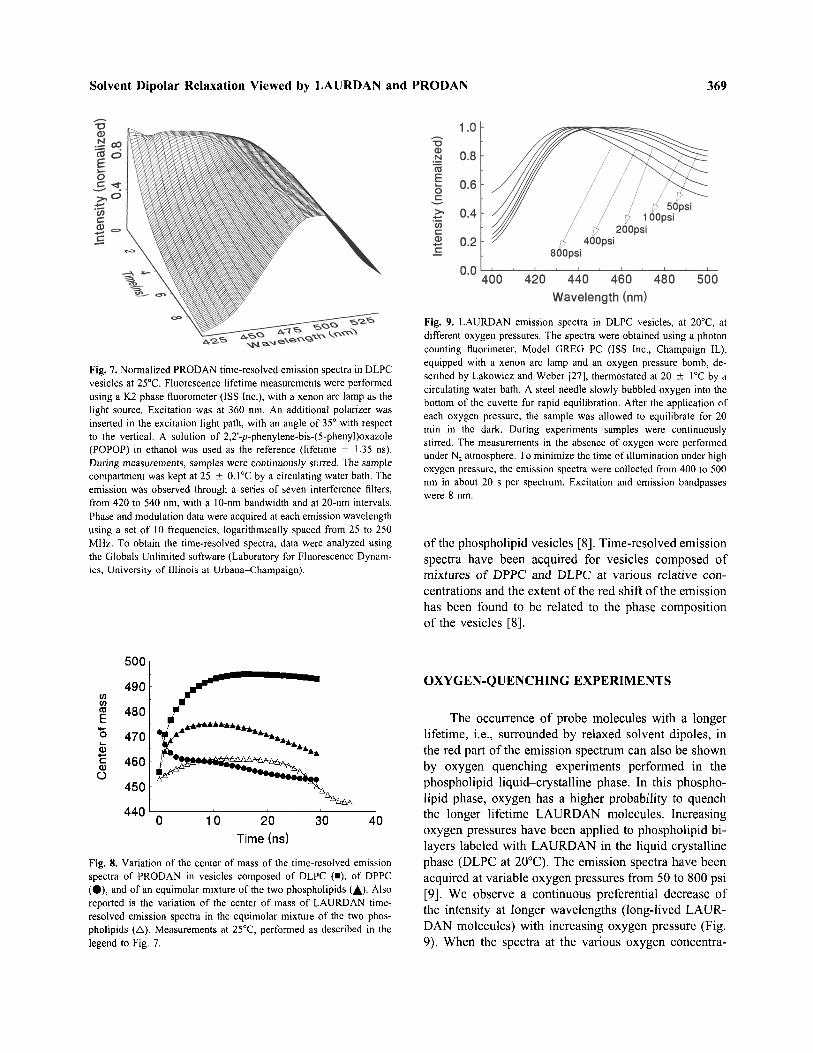
Fig. 9. LAURDAN emission spectra in DLPC vesicles, at 20 D C, atdifferent oxygen pressures. The spectra were obtained using a photoncounting fluorimeter, Model GREG PC (ISS Inc., Champaign IL),equipped with a xenon arc lamp and an oxygen pressure bomb, de-scribed by Lakowicz and Weber [27], thermostated at 20 ± 1 D C by acirculating water bath. A steel needle slowly bubbled oxygen into thebottom of the cuvette for rapid equilibration. After the application ofeach oxygen pressure, the sample was allowed to equilibrate for 20min in the dark. During experiments samples were continuouslystirred. The measurements in the absence of oxygen were performedunder N2 atmosphere. To minimize the time of illumination under highoxygen pressure, the emission spectra were collected from 400 to 500nm in about 20 s per spectrum. Excitation and emission bandpasseswere 8 nm.
of the phospholipid vesicles [8]. Time-resolved emissionspectra have been acquired for vesicles composed ofmixtures of DPPC and DLPC at various relative con-centrations and the extent of the red shift of the emissionhas been found to be related to the phase compositionof the vesicles [8].
Fig. 8. Variation of the center of mass of the time-resolved emissionspectra of PRODAN in vesicles composed of DLPC (Square), of DPPC(Circle), and of an equimolar mixture of the two phospholipids (Triangle). Alsoreported is the variation of the center of mass of LAURDAN time-resolved emission spectra in the equimolar mixture of the two phos-pholipids (A). Measurements at 25 D C, performed as described in thelegend to Fig. 7.
OXYGEN-QUENCHING EXPERIMENTS
The occurrence of probe molecules with a longerlifetime, i.e., surrounded by relaxed solvent dipoles, inthe red part of the emission spectrum can also be shownby oxygen quenching experiments performed in thephospholipid liquid-crystalline phase. In this phospho-lipid phase, oxygen has a higher probability to quenchthe longer lifetime LAURDAN molecules. Increasingoxygen pressures have been applied to phospholipid bi-layers labeled with LAURDAN in the liquid crystallinephase (DLPC at 20 D C). The emission spectra have beenacquired at variable oxygen pressures from 50 to 800 psi[9]. We observe a continuous preferential decrease ofthe intensity at longer wavelengths (long-lived LAUR-DAN molecules) with increasing oxygen pressure (Fig.9). When the spectra at the various oxygen concentra-

370 Parasassi, Krasnowska, Bagatolli, and Gratton
Fig. 10. Model of dipolar relaxation due to the reorientation of watermolecules (A) and to the reorientation of the naphthalene moiety (B).
Fig. 11. Polarization emission spectra of LAURDAN in DLPC vesi-cles, at 20 D C, obtained with the instrumentation described in the legendto Fig. 3. Excitation at 340 nm.
Fig. 12. Model of the LAURDAN locally excited state and chargetransfer excited state.
tions are normalized to their total intensity, we could notobserve an isosbestic point. This observation rules outthe possibility that only two molecular species of theprobe are responsible for the emission red shift, as dis-cussed further below.
WATER RELAXATION VERSUS PROBEREORIENTATION
An explanation of the emission red shift alternativeto the reorientation of a few water molecules present atthe bilayer interface (Fig. 10A) can be hypothesized. Thefluorescent naphthalene residue could reorient with re-spect to its molecular axis (Fig. 10B). Indeed, in thelatter case, these different orientations of the moleculedipole should be observed in the polarization emissionspectrum. The extent of spectral shift and the angle ofrotation should be correlated. LAURDAN's polarizationemission spectrum has been measured in phospholipidsin the liquid-crystalline phase (Fig. 11) [3]. The datashow an initial decrease of the polarization, up to about460 nm, and then a constant value. If the spectral shiftand the angle of rotation were correlated, then the po-larization decrease should also continue at longer emis-sion wavelengths. Instead, the decrease in polarizationat shorter wavelengths and its constant value at longerwavelengths can be completely explained on the basisof the dependence of the emission wavelength on thelifetime (Figs. 7 and 8). Moreover, in the case sketchedin Fig. 10B, the reorientation of the probe fluorescentmoiety should be sensitive to the charge in the polarhead residue, which, instead, was not observed [4].
INTRAMOLECULAR REORIENTATION ANDDIPOLAR RELAXATION
Recently, a reinterpretation of LAURDAN's spec-troscopic behavior in phospholipids has been proposed,based on measurements performed on the probe in eth-anol [10] and on previous theoretical calculations re-ported on PRODAN crystals [11], The proposed modelinvolves the relative reorientation of the dimethylaminoand carbonyl residues, giving rise to two states, the lo-cally excited state and the charge transfer state [10], thefirst with a blue emission and the second with a red-shifted emission. Of these two relative orientation, onlythe charge transfer state can give rise to the reorientationof the surrounding solvent dipoles (Fig. 12). FollowingViard et al. [10], the locally excited state should pre-dominate in apolar solvents and in polar solvents at verylow temperatures. In our measurements performed inapolar solvents, such as dodecane and cyclohexane, wedid observe a relevant blue shift of LAURDAN emission[4]. In agreement with the hypothesis of the locally ex-cited state, in these apolar solvents, LAURDAN's quan-tum yield is very low and its lifetime is very short, about0.1 ns. However, we do not have evidence of this locally

Solvent Dipolar Relaxation Viewed by LAURDAN and PRODAN 371
Fig. 13. (A) Emission and excitation spectra in ethanol at 20°C ofLAURDAN (Triangle), LAURMEN (Square), and LAURNA (Circle). LAURDANfixed excitation and emission wavelengths were 350 and 490 run foremission and excitation spectra, respectively. LAURMEN andLAURNA fixed excitation and emission wavelengths were 340 and420 nm, for emission and excitation spectra, respectively. (B) Emis-sion spectra in phospholipids of LAURDAN (open symbols) andLAURISAN (filled symbols) in vesicles composed of DLPC (Circle, Circle(b)),of DPPC (Square, Square(b)), and of an equimolar mixture of the two phospholipids(Triangle, Triangle(b)). Measurements at 25 D C performed as reported in the legendto the Fig. 3.
excited state when LAURDAN (as PRODAN) is in-serted in phospholipid vesicles. In bilayers, (1) the quan-tum yield of both probes is quite high; (2) their lifetimevalue ranges between 4 and 6 ns, depending on the phos-pholipid phase state; and (3) an isosbestic point indica-tive of a transition between two conformations is notobserved (Fig. 3), such as reported for LAURDAN'sspectra in ethanol at low temperatures [10].
Several LAURDAN derivatives were synthesizedby Gregorio Weber, with the purpose of (1) ascertainingthat a partial charge separation in the naphthalene moietyis necessary for the emission red shift, and (2) studyingthe effect of the intramolecular reorientation. In Fig. 13Awe report the excitation and emission spectra in ethanol
of LAURDAN together with those of 2-hydroxy- 6-lau-roylnaphthalene (LAURNA) and of 2-methoxy-6-lau-roylnaphthalene (LAURMEN). We can clearly observethat when the partial positive charge of the dimethylam-ino residue is substituted with an hydroxy or methoxyresidue, the emission spectra are blue-shifted (maximumat about 420 nm) with respect to LAURDAN's emission(maximum at about 490 nm), demonstrating that thecharge transfer state cannot be formed. In Fig. 13B wereport the emission spectra in phospholipids of LAUR-DAN and of 2-isopropyl-6-lauroylnaphthalene (LAUR-ISAN). The LAURDAN and LAURISAN spectra almostoverlap, proving that, in LAURISAN, the steric hin-drance to an intramolecular reorientation due to the is-opropyl residue has no effect on the red shift observedin the liquid–crystalline phase. These results show thatthe molecular entity responsible for the dipolar relaxa-tion cannot be the fluorophore itself.
GROUND-STATE CONFORMATIONS
In addition to the emission spectral features of thesenaphthalene probes, their excitation spectra also showthe existence of different excitation states. In polar sol-vents, the excitation spectra of LAURDAN and PRO-DAN are composed of at least two bands, centered atabout 350 and 390 nm. The red excitation band is par-ticularly intense in gel phase phospholipids. UsingLAURMEN and LAURNA, we were able to show that,in polar solvents, the excitation spectra of these twoprobes do not show the second red excitation band. InFig. 13A the excitation spectra of LAURMEN andLAURNA in ethanol are reported, together with the ex-citation spectra of LAURDAN (and PRODAN). Thepresence of a partial charge separation due to the di-methylamino residue of LAURDAN appears necessaryfor obtaining a second red excitation band in polar sol-vent. The second red excitation band at 390 nm has beeninterpreted as due to the absorption by LAURDAN mol-ecules stabilized in a ground-state La conformation [3]by surrounding dipoles.
Also in phospholipid vesicles, the excitation spectraof LAURDAN and PRODAN are composed of at leasttwo bands. With respect to polar solvents, the red ex-citation band is particularly intense, especially in gel-phase vesicles (Fig. 14). For LAURDAN in gel-phasephospholipids this red excitation band also constitutesthe excitation maximum. In the phospholipid liquid-crystalline phase, the red excitation band is less intensethan in the gel phase (Fig. 14). In the presence of thetwo coexisting phases, the LAURDAN red excitation

372 Parasassi, Krasnowska, Bagatolli, and Gratton
Fig. 14. Excitation spectra of LAURDAN in DPPC vesicles (Square) andin DLPC vesicles (Circle) at 25 D C. To enhance the intensity variation ofthe red excitation band, the spectra have been normalized at 340 nm.Emission at 440 nm. Measurements were performed as described inthe legend to Fig. 3.
Fig. 15. LAURDAN excitation GP spectra in phospholipid vesicles,at 20 D C, composed of DPPC (top spectrum), DLPC (bottom spectrum),and of the equimolar mixture of the two phospholipids (middle spec-trum). For the calculation of the GP values [Eq. (1)] the emissionwavelengths were 440 and 490 nm. Measurements were performed asdescribed in the legend to Fig. 3.
band is mainly populated by those probe molecules sur-rounded by phospholipids in the gel phase [3].
In analogy with the fluorescence polarization, wedeveloped the generalized polarization function (GP) [3]
where Ig and Il are the steady-state intensities at the max-imum emission wavelengths in the gel and in the liquid-crystalline phase, respectively, at about 440 and 490 nm.When using different excitation wavelengths, i.e., in theblue or in the red excitation band, the GP value providesa quantitative measurement of what proportion of theinitially photoselected LAURDAN molecules are sur-
rounded mainly by the liquid-crystalline or mainly bygel-phase phospholipids. Of course, the GP measure-ment does not imply the use of polarizers. Due to thesolvent dipolar relaxation, the emission spectrum ofLAURDAN (and of PRODAN) shows a continuous redshift with temperature, with no isoemissive point (Fig.3). Thus the GP function also contains information onthe dipolar relaxation process. Indeed, the excitation GPspectra (analogous to the excitation polarization spectra)do not show abrupt GP changes as a function of theexcitation wavelength (Fig. 14). Instead, we observe ei-ther constant GP values (in the gel phase) or a contin-uous change with a negative (in the case of thehomogeneous liquid-crystalline phase) or positive slope(in the case of coexisting domains of the two phases)(Fig. 15). The GP value can be used for the evaluationof the rate and extent of solvent dipolar relaxation pro-cesses [8]. The slope of the excitation GP spectrum canbe used to ascertain the coexistence of the two phos-pholipid phases [6]. From the favorable spectroscopicproperties of LAURDAN, with its red excitation bandpopulated mainly by molecules stabilized in the La con-formation by oriented solvent dipoles, and by moleculessurrounded by phospholipids in the gel phase, we caneasily distinguish between homogeneous and mixedphases. In the case of coexisting phases, LAURDANmolecules surrounded by gel phase will be mainly ex-cited in the red band and will emit with a blue spectrum,i.e., with a high GP value. In this case, by moving theexcitation toward the red the GP value increases. In thecase of a homogeneous liquid-crystalline phase, the al-ready relaxed LAURDAN molecules in the La confor-mation will emit with a red spectrum, i.e., with a lowGP value. In this case, at longer excitation wavelengthsthe GP value will decrease (Fig. 15)
Since the GP possesses all the properties of the"classical" fluorescence polarization [12], it was usedto quantify the relative amount of the two coexistingphospholipid phases [3]. In conjunction with oxygenquenching experiments, the GP value was used to obtainthe rate of the dipolar relaxation using an approach sim-ilar to the Perrin equation [9].
CONCLUSIONS: MODEL AND NATURALMEMBRANE STUDIES
The sensitivity of LAURDAN and PRODAN to theenvironment polarity has been used in studies of the po-larity variations in synthetic bilayers, micelles, and nat-ural membranes [13-16]. The GP function [Eq. (1)]offers the advantages of facile and rapid measurements
Solvent Dipolar Relaxation Viewed by LAURDAN and PRODAN 373
of membrane polarity as well as high sensitivity. Amongseveral applications [17-25], the sensitivity of LAUR-DAN and PRODAN to the bilayer polarity can be usedto study structural changes involving the modification ofwater concentration in the bilayer [7]. Due to their dif-ferent chemical affinity for the bilayer, i.e., their differ-ent location in the bilayer, LAURDAN and PRODANreport on water concentration at different membrane lo-cations. For instance, in bilayers damaged by ionizingradiation, the higher penetration of water at the mem-brane surface can be monitored by the decrease in thePRODAN GP value, while the relocation of LAURDANdeeper in the bilayer is seen by the increase in the GPvalue [7].
The recent development of two-photon excitationmicroscopy, with its inherently reduced photobleachingand phototoxicity, allowed the measurement of LAUR-DAN GP values in phospholipid vesicle, natural mem-branes, and whole cells [26]. These microscopy meas-urements allowed the spatial resolution of the polaritymicroheterogeneity of synthetic and natural membranes.In particular, a broad distribution of GP values was ob-served in microscopy measurements of vesicles in theliquid-crystalline phase.
ACKNOWLEDGMENTS
This work was supported by CNR (T.P., E.K.K.)and by NIH RR03155 (L.B., E.G.). We thank RuthRusch for acquiring the steady-state spectra of LAUR-DAN derivatives.
REFERENCES
1. G. Weber and F. J. Farris (1979) Biochemistry 18, 3075-3078.2. R. B. MacGregor and G. Weber (1981) Ann. N.Y. Acad. Sci. 366,
140-154.
3. T. Parasassi, G. De Stasio, A. d'Ubaldo, and E. Gratton (1990)Biophys.J. 57, 179-186.
4. T. Parasassi, G. De Stasio, G. Ravagnan, R. M. Rusch, and E.Gratton (1991) Biophys. J. 60, 179-189.
5. P. L.-G. Chong and P. T. T. Wong (1993) Biochim. Biophys. Acta1149, 260–266.
6. T. Parasassi, M. Loiero, M. Raimondi, G. Ravagnan, and E. Grat-ton (1993) Biochim. Biophys. Acta 1153, 143-154.
7. T. Parasassi, A. M. Giusti, E. Gratton, E. Monaco, M. Raimondi,G. Ravagnan, and 0. Sapora (1994) Int. J. Radiat. Biol. 65, 329-334.
8. T. Parasassi, G. Ravagnan, R. M. Rusch, and E. Gratton (1993)Photochem. Photobiol, 57, 403–410.
9. T. Parasassi and E. Gratton (1992) J. Fluoresc. 1, 167-174.10. M. Viard, J. Gallay, M. Vincent, O. Meyer, B. Robert, and M.
Paternostre (1997) Biophys. J. 73, 2221-2234.11. P. Ilich and F. G. Prendergast (1989) J. Phys. Chem. 93, 4441-
4447.12. G. Weber (1951) Biochem. J. 51, 145-154.13. K. H. Cheng, M. Ruonala, J. Virtanen, and P. Somerharju (1997)
Biophys. J. 73, 1967-1976.14. L. A. Bagatolli, B. Maggio, F. Aguilar, C. P. Sotomayor, and G.
D. Fidelio (1997) Biochim. Biophys. Acta 1325, 80-90.15. H. A. Garda, A. M. Bernasconi, R. R. Brenner, F. Aguilar, M. A.
Soto, and C. P. Sotomayor (1997) Biochim. Biophys. Acta 1323,97-104.
16. W. Yu, P. T. So, T. French, and E. Gratton (1996) Biophys. J.70, 626-636.
17. N. Dousset, G. Ferretti, T. Galeazzi, M. Taus, V. Gouaze, G. Ber-thon, and G. Curatola (1997) Free Radic. Res. 27, 291-299.
18. M. Levi, P. Wilson, S. Nguyen, E. Iorio, O. Sapora, and T. Par-asassi (1997) Mech. Age. Dev. 97, 109-119.
19. W. Huang, L. P. Vernon, L. D. Hansen, and J. D. Bell (1997)Biochemistry 36, 2860–2866.
20. R. Gabbianelli, G. Falcioni, A. M. Santroni, G. Caulini, L. Greci,and E. Damiani (1997) Free Radic. Biol. Med. 23, 278-284.
21. G. Barshtein, L. Bergelson, A. Dagan, E. Gratton, and S. Yedgar(1997) Am. J. Physiol. 272(1, Pt 2), H538-H543.
22. L. P. Zanello, E. Aztiria, S. Antollini, and F. J. Barrantes (1996)Biophys. J. 70, 2155-2164.
23. M. G. Salgo, R. Cueto, and W. A. Pryor (1995) Free Radic. Biol.Med. 19, 609–616.
24. M. J. Sheffield, B. L. Baker, D. Li, N. L. Owen, M. L. Baker, andJ. D. Bell (1995) Biochemistry 34, 7796–7806.
25. S. S. Antollini, M. A. Soto, I. Bonini de Romanelli, C. Gutierrez-Merino, P. Sotomayor, and F. J. Barrantes (1996) Biophys. J. 70,1275-1284.
26. T. Parasassi, E. Gratton, W. M. Yu, P. Wilson, and M. Levi (1997)Biophys. J. 72, 2413-2429.
27. J. R. Lakowicz and G. Weber (1973) Biochemistry 12,4161-4170.
Related Documents