International Journal for Quality Research 15(1) 125–138 ISSN 1800-6450 1 Corresponding author: Laura Karnai Email: [email protected] 125 Laura Karnai 1 László Szőllősi Andrea Bauerné Gáthy István Szűcs Article info: Received 10.08.2019 Accepted 20.07.2020 UDC – 005.311 DOI – 10.24874/IJQR15.01-07 ATTITUDES OF DEBRECEN UNIVERSITY STUDENTS TOWARDS HEALTHY LIFE BASED ON THEIR DIETARY HABITS Abstract: Our consumption habits affect our body from childhood on, changes in eating habits can lead to various eating disorders and cause problems, especially in adulthood. For this reason, we need to pay attention to what we eat and drink throughout our lives, as a close correlation is observed between consumed foods and health. The primary purpose of the study is to survey the daily eating habits of Debrecen students, to compare their regularity and composition in terms of quality in order to reveal any correlations between the BMI-based categories and the quality of consumption. In order to examine this aspect, we conducted a questionnaire survey among 500 students of the University of Debrecen. There is a significant relationship between body mass index and food groups only in the case of coffee, but there is no correlation between the degree of obesity of Debrecen students and the frequency of food consumed. Keywords: BMI-index; Consumer behaviour; Healthy diet; Hungary; Young people. 1. Introduction Unhealthy nutrition and a sedentary lifestyle have become the most significant risk factors for the total population of the Earth and are therefore a priority in international specialized research (Törőcsik, 2007). All these facts pose new challenges to the food industry, which requires the development and production of foods which, due to their health-protecting effect, slow down the spread of civilization diseases that plague society. As a result, there is an increasing number of food products on store shelves that not only have outstanding taste but also a positive effect on health. Examples include the increase of certain minerals (e.g. Mg, Ca), reducing energy by reducing sugars or fat, or by using spices and vitamins beneficial to health in what is known in the technical literature as functional foods (Szakály, 1994; Biró, 2004; Hawkes, 2004). Functional foods are gaining market share from year to year and are increasingly becoming the driving force for the food industry (Menrad, 2003; Piskóti et al., 2006). The reason for this development is that people increasingly believe that the food they consume directly contributes to the maintenance and improvement of their health (Young, 2000; Mollet & Rowland, 2002; Barna, 2007; Mendis et al., 2011). The close relationship between food consumption and health was already known in ancient times. In 400 BC, Hippocrates said "Let food be thy medicine and medicine be thy food." (Szőllősi et al., 2017). Today, one's diet is basically determined by the habits, rules, social values and beliefs of the narrower and wider environment. In

Welcome message from author
This document is posted to help you gain knowledge. Please leave a comment to let me know what you think about it! Share it to your friends and learn new things together.
Transcript
International Journal for Quality Research 15(1) 125–138
ISSN 1800-6450
1 Corresponding author: Laura Karnai
Email: [email protected]
125
Laura Karnai1
László Szőllősi
Andrea Bauerné
Gáthy
István Szűcs
Article info:
Received 10.08.2019
Accepted 20.07.2020
UDC – 005.311
DOI – 10.24874/IJQR15.01-07
ATTITUDES OF DEBRECEN UNIVERSITY
STUDENTS TOWARDS HEALTHY LIFE
BASED ON THEIR DIETARY HABITS
Abstract: Our consumption habits affect our body from
childhood on, changes in eating habits can lead to various
eating disorders and cause problems, especially in
adulthood. For this reason, we need to pay attention to
what we eat and drink throughout our lives, as a close
correlation is observed between consumed foods and
health. The primary purpose of the study is to survey the
daily eating habits of Debrecen students, to compare their
regularity and composition in terms of quality in order to
reveal any correlations between the BMI-based categories
and the quality of consumption. In order to examine this
aspect, we conducted a questionnaire survey among 500
students of the University of Debrecen. There is a
significant relationship between body mass index and food
groups only in the case of coffee, but there is no correlation
between the degree of obesity of Debrecen students and the
frequency of food consumed.
Keywords: BMI-index; Consumer behaviour; Healthy diet;
Hungary; Young people.
1. Introduction
Unhealthy nutrition and a sedentary lifestyle
have become the most significant risk factors
for the total population of the Earth and are
therefore a priority in international
specialized research (Törőcsik, 2007). All
these facts pose new challenges to the food
industry, which requires the development
and production of foods which, due to their
health-protecting effect, slow down the
spread of civilization diseases that plague
society. As a result, there is an increasing
number of food products on store shelves
that not only have outstanding taste but also
a positive effect on health. Examples include
the increase of certain minerals (e.g. Mg,
Ca), reducing energy by reducing sugars or
fat, or by using spices and vitamins
beneficial to health in what is known in the
technical literature as functional foods
(Szakály, 1994; Biró, 2004; Hawkes, 2004).
Functional foods are gaining market share
from year to year and are increasingly
becoming the driving force for the food
industry (Menrad, 2003; Piskóti et al., 2006).
The reason for this development is that
people increasingly believe that the food
they consume directly contributes to the
maintenance and improvement of their
health (Young, 2000; Mollet & Rowland,
2002; Barna, 2007; Mendis et al., 2011). The
close relationship between food consumption
and health was already known in ancient
times. In 400 BC, Hippocrates said "Let food
be thy medicine and medicine be thy food."
(Szőllősi et al., 2017).
Today, one's diet is basically determined by
the habits, rules, social values and beliefs of
the narrower and wider environment. In
126 L. Karnai, L. Szőllősi, A.Bauerné Gáthy, I. Szűcs
order to get the changed and overturned
eating habits back into the right course, it
would be important to spread health-
conscious nutrition to the general public,
where healthy and health-preserving
(functional) foods could play a major role
(Barcs & Jenes, 2017). With all this
information, consumers in developed
countries are increasingly concerned with
maintaining their health, gaining more
information about healthy lifestyles, and
seeking to prevent disease and the
deterioration of their health rather than cure
(Enser, 2001). As a result, today, due to the
constant changes, it is often a problem that
people do not know what is recommended
and not recommended to eat, or what is
meant by healthy nutrition.
It is important to clarify the fact that healthy
eating does not mean eating foods that are
commonly known as healthy, since most of
the foods on the market today are considered
healthy. Hidvégi et al. (2015) stated: “A
healthy diet means the regular consumption
of a variety of foods and beverages in
appropriate proportions and quantities, with
sufficient variety. This will minimize the risk
of disease. A healthy diet should contain the
right amounts of energy-efficient nutrients
(proteins, fats, carbohydrates) and non-
energy nutrients (vitamins, minerals, and
trace elements). Try to diversify your diet,
using as many raw materials and trying as
many cooking methods as possible”
(Hidvégi et al., 2015, p. 39). However,
nutrition and food security are closely
linked, which in recent decades has caused
consumer confidence to shake as a result of
various food scandals. Consuming “unsafe
foods” poses a health risk and that is why
WHO is constantly striving to make safe
food available to all (Bánáti, 2011; WHO,
2019).
According to researchers, a healthy diet is
based on physical activity and regular meals
and that it is the quality and not the quantity
of foods that a healthy and balanced daily
diet is based on. Basically, there is "no good
and bad food", only "the right amount" and
one can distinguish between good and bad
diets accordingly. However, there are foods
of which nutrition science recommends
consuming more, and some others of which
less is recommended (Szakály, 2004 and
Zsarnóczay, 2009 cit. Szőllősi et al., 2017).
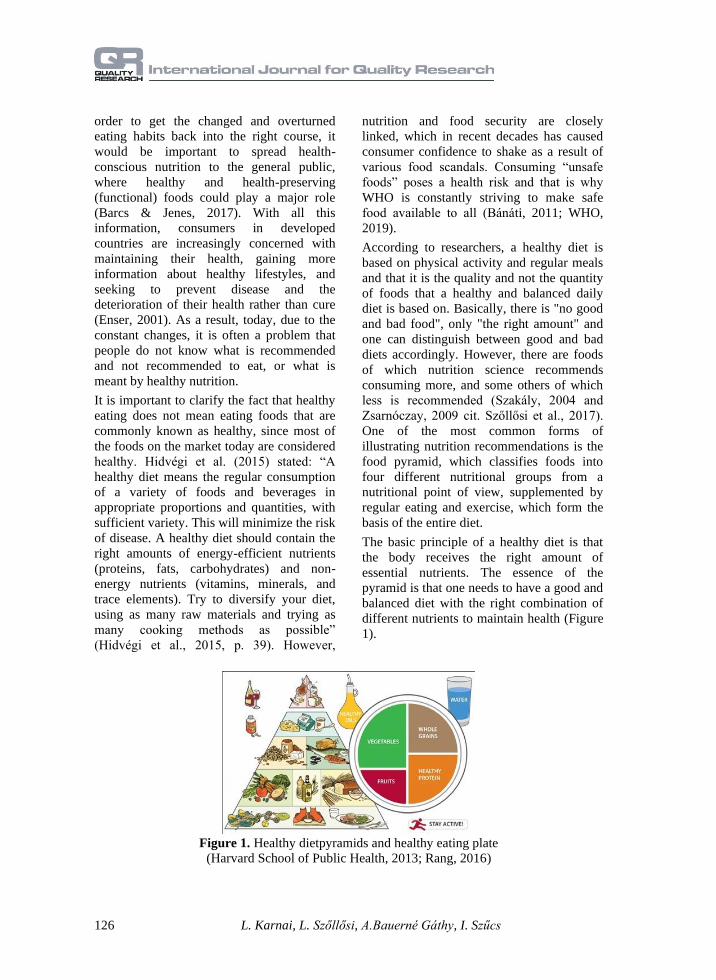
One of the most common forms of
illustrating nutrition recommendations is the
food pyramid, which classifies foods into
four different nutritional groups from a
nutritional point of view, supplemented by
regular eating and exercise, which form the
basis of the entire diet.
The basic principle of a healthy diet is that
the body receives the right amount of
essential nutrients. The essence of the
pyramid is that one needs to have a good and
balanced diet with the right combination of
different nutrients to maintain health (Figure
1).
Figure 1. Healthy dietpyramids and healthy eating plate
(Harvard School of Public Health, 2013; Rang, 2016)

127
The diet is based on fiber-rich cereals, which
are essential from the aspect of health.
Instead of refined flour, white rice and white
bread, it is preferable to eat whole grain
pasta or brown rice. Meals include lots of
vegetables and fruits, as well as whole
grains, seeds, and healthy fats, which should
be included several times a week in one’s
meals, which should be as diverse as
possible. In addition, healthy sources of
protein, such as white meat or fish instead of
red meat, should be preferred. Compared to
other foods, sweets and fats have the lowest
recommended levels of consumption
(Rodler, 2005; Balázs, 2010; Huszka, 2012).
When examining nutrition, it is important to
note that many other factors, such as food
sensitivity, food allergies, or even beliefs,
influence the regular or less regular
consumption of foods considered to be
appropriate in the technical literature.
Christianity in the European culture does not
impose prohibitions on food consumption,
but some other cultures pose major
restrictions on certain foods, especially
meats (De Boer et al., 2016; Vida & Szűcs,
2016).
It is important to emphasize that many diet
pyramids have been published in recent
decades, and the most widely cited
recommendation is the US Department of
Agriculture (USDA) diet pyramid, first
released in 1992 and revised in 2005.
The diet pyramid was updated in the form of
MyPlate in 2011. The pyramid is structured
in a way that the most important food groups
in our diet are located at the bottom, and as
we move towards the summit, the
recommended consumption frequency of the
foods (e.g. fats, oils, sweets) is decreasing
(Welsh et al., 1992; Ruini et al., 2015). The
2005 concept is more than a guideline, since
in essence, the basic principles have not
changed in the last 30 years, but they carry a
different message. The plate concept also
helps in practical implementation by
showing what is on our plate and illustrating
the healthy proportion of bread and cereals,
vegetables, fruits, proteins and dairy
products and their recommendations for
daily eating (Haven et al., 2006). In addition
to the basic pyramid, the special
Mediterranean food pyramid has an
increasing popularity. This pyramid
developed in 1990 and it is based on
Mediterranean foods, such as fruits,
vegetables, cereals, olive oil, beans,
legumes, nuts, seeds, herbs and spices, as
well as fish and fish products. Because of
their prominent role in health-conscious
lifestyles, fish and seafood are a prominent
item and they are recommended to be
consumed several times a week. Poultry,
eggs, yogurt and dairy products are less
frequently recommended, while red meat
and sweets are less are suggested to be
consumed even less often (Bach-Faig et al.,
2011; Davis et al., 2015).
Our diet and healthy lifestyle are heavily
influenced by parenting, that is, parents'
exemplary behaviour and attitudes towards a
healthy lifestyle, which develops mainly at a
young age. At the same time, young people
(18-30) can do much more for their health
and to maintain their health (Berke et al.,
2012). At the international level, it is a major
problem that the increasing proportion of
illness in the case of young people is related
to their diet and lifestyle (Taylor et al., 2015;
Decosta et al., 2017). An increasing amount
of research is proving that eating habits in
young people are leading to more severe
health problems, such as overweight,
diabetes, cardiac disease, circulatory
problems, the increasingly often mentioned
gastrointestinal diseases, and possibly
cancer, which are further exacerbated by
lack of exercise, smoking and alcohol
consumption (Mcginnis et al., 2006;
Szakály, 2011; Ramsden et al., 2016;
Trautwein et al., 2018). In Hungary, the
obesity rate is extremely high among the
general population, which can be observed
increasingly among young people. In
addition to hereditary predisposition,
overnutrition is primarily caused by poor
diet sedentary lifestyle. In Hungary, one in
128 L. Karnai, L. Szőllősi, A.Bauerné Gáthy, I. Szűcs
two people is considered to be
overnourished, according to the WHO's
Body Mass Index (BMI), based on which a
person is considered to be obese if his/her
BMI is above 30 kg/m2 (Népegészségügyi,
2015). Attitudes towards sport are also low
in society, as in the Northern Great Plain the
share of the respondent with an indirect
attitude is only 13.3% (Bácsné et al., 2018).
For this reason, a healthy and balanced diet,
i.e., adequate quality and quantity of
nutrients, as well as regular exercise and the
related motivation and awareness raising are
key issues (Marjainé et al., 2012). Almost
one third of the 18-29 age group can be
considered as followers of the current trends,
i.e., they are more likely to be led to
environmentally conscious and healthy
eating (Szakály et al., 2017). These facts
make it necessary to assess and get to know
the nutritional habits of university students
(between the ages of 20 and 30), since the
examination of the health consciousness of
this age group has a prominent role both at
the national and international level. The
topicality of this issue is due to the hectic
eating style resulting from the fast-paced
lifestyle in the current accelerated world.
People between the ages of 20 and 30 are
already independent decision makers about
their own meals, i.e., they have unique and
independent food consumption habits (Marty
et al., 2018). At the same time, they
presumably do not yet feel responsible for
preserving their own health, since most of
them have not yet suffered from a serious
illness, except for those suffering from food
sensitivity. This age group tends to eat for
the sake of pleasure and the tastes and their
food preferences are greatly influenced by
fashion and advertisements (Lude & Prügl,
2018). Food is not only a source of nutrients
for them, it is also becoming a status symbol
(Papp & Lugosi, 2018).
The primary purpose of this study is to
survey the extent to which the daily eating
habits of students in Debrecen follow the
recommendations of the diet pyramid of
foods required for health conscious and
proper nutrition compiled by dietitians, with
particular regard to the frequency and quality
of meals. The following research questions
were formulated in relation to the objective:
• What is the eating frequency of the
university students of Debrecen?
• What ingredients are consumed and
how often do students consume
them?
• Is there a relationship between
student nutrition practice and BMI
index based on weight and height?
Tasks assigned to responding to these
questions:
• Assessing and evaluating students'
daily food consumption habits.
• Calculation and comparison of BMI
index with different food
categories.
2. Material and Methods
As a first research step, secondary data and
information was collected, during which we
performed the collection, processing and
systematisation of the related technical
literature sources. The most relevant, up-to-
date and relevant sources were analysed for
the research topic, examining Hungarian and
international models and research findings.
In addition to the secondary research,
primary data collection and processing was
also performed.
2.1. Sample
The performed qualitative methods primarily
focused on exploring causal relationships
and they provided sufficient information for
a further quantitative survey. During the
quantitative research, we used the most
common technique to acquire information,
i.e., the questionnaire survey among the
students of the University of Debrecen. Data
were collected between March and June
2019. Our research focused mainly on the
study period, as we believe that this period is
significant for the students and regularity can
129
also be better observed. Both the online
questionnaire survey and the offline
sampling method (personal, paper-based
questionnaire) were used, while trying to
target students who have different
knowledge of the basics of health-conscious
eating. The reason for choosing the
questionnaire survey method is due to
several reasons, the main factor of which is
that students are active Internet users and
they need to use the online interface in their
daily activities, but printed questionnaires
were also needed to facilitate easier
completion.
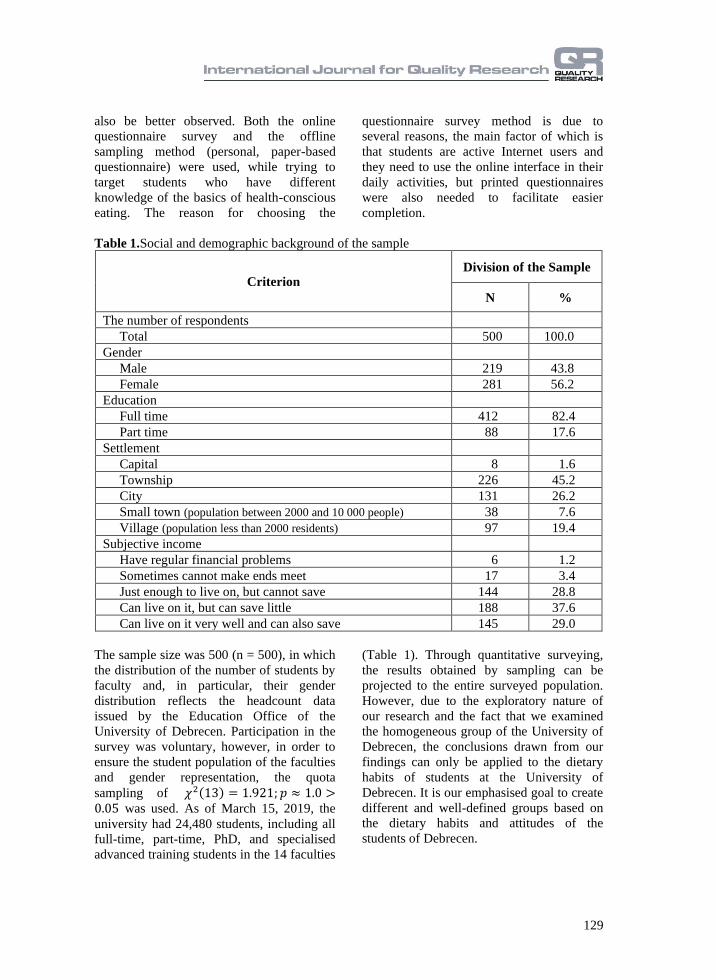
Table 1.Social and demographic background of the sample
Criterion
Division of the Sample
N %
The number of respondents
Total 500 100.0
Gender
Male 219 43.8
Female 281 56.2
Education
Full time 412 82.4
Part time 88 17.6
Settlement
Capital 8 1.6
Township 226 45.2
City 131 26.2
Small town (population between 2000 and 10 000 people) 38 7.6
Village (population less than 2000 residents) 97 19.4
Subjective income
Have regular financial problems 6 1.2
Sometimes cannot make ends meet 17 3.4
Just enough to live on, but cannot save 144 28.8
Can live on it, but can save little 188 37.6
Can live on it very well and can also save 145 29.0
The sample size was 500 (n = 500), in which
the distribution of the number of students by
faculty and, in particular, their gender
distribution reflects the headcount data
issued by the Education Office of the
University of Debrecen. Participation in the
survey was voluntary, however, in order to
ensure the student population of the faculties
and gender representation, the quota
sampling of 𝜒2(13) = 1.921; 𝑝 ≈ 1.0 >0.05 was used. As of March 15, 2019, the
university had 24,480 students, including all
full-time, part-time, PhD, and specialised
advanced training students in the 14 faculties
(Table 1). Through quantitative surveying,
the results obtained by sampling can be
projected to the entire surveyed population.
However, due to the exploratory nature of
our research and the fact that we examined
the homogeneous group of the University of
Debrecen, the conclusions drawn from our
findings can only be applied to the dietary
habits of students at the University of
Debrecen. It is our emphasised goal to create
different and well-defined groups based on
the dietary habits and attitudes of the
students of Debrecen.

130 L. Karnai, L. Szőllősi, A.Bauerné Gáthy, I. Szűcs
2.2. Questionnaire
The main part of the questionnaire focuses
on measuring the frequency of consumption
of different foods (based on the categories of
the food pyramid). In terms of frequency, we
used a seven-step scale, where the options
"never" and "daily" represented the two
extreme values of the scale. Special mention
was made of the meals in between the main
meals, their location and frequency with
regard to both foods and drinks. At the end
of the questionnaire, socio-demographic
background variables (gender, age, height,
weight, education, type of settlement,
housing, monthly income) were surveyed
and segmentation was performed
accordingly, such as gender or BMI index.
The data obtained during the questionnaire
research were processed with a
mathematical-statistical analytical software
(SPSS 23.0). The data was recorded
immediately after the questionnaire survey
and the filtering out of data entry errors, i.e.,
outliers (data cleaning process). We used
basic descriptive statistical methods
(minimum, maximum, mean, standard
deviation) to process the obtained data.
2.3. BMI index
Body Mass Index (BMI) is a widely used
statistical method to measure the extent of
obesity and to thereby identify potential
health risks, using the ratio of body mass and
height (Formula 1). The method is based on
dividing the body weight expressed in
kilograms by the square of height expressed
in meters. However, this method may distort
the result in the case of different physiques.
The method has been criticized due to the
fact that even individuals with above-
average lean muscle mass may be classified
as overweight (Keys et al., 1972).
(Formula 1)
𝐵𝑀𝐼 =𝑏𝑜𝑑𝑦 𝑤𝑒𝑖𝑔ℎ𝑡 (𝑘𝑔)
ℎ𝑒𝑖𝑔ℎ𝑡 𝑠𝑞𝑢𝑎𝑟𝑒𝑑 (𝑚)2
For the sake of ease, the extent of obesity
can be divided into 4 groups by the uniform
categorization of the obtained values (Table
2).
Table 2. Categorisation of body mass index
(BMI) (WHO, 2019)
Women Men Evaluation
<18.5 underweight
18.6-24 18.6-25 normal
24.1-28.9 25.1-29.9 overweight
29< 30< obese
It is important to note that the values in this
table are for the adult age range and are
subject to change in children and the elderly.
In our study, we examined whether there is a
difference in the frequency of consumption
between different food categories in the case
of different BMI categories, especially with
regard to gender.
3. Results
3.1. Examination of the food
categorisation of the questionnaire
The results obtained during the quantitative
survey are close to the nutritional structure
considered appropriate by nutritionists.
However, it is important to note that in this
case, the consumption frequencies were
established on a seven-step scale, where we
looked at the regularity between the two
extreme consumption values of "never" and
"daily" (Figure 2).
According to the technical literature, in order
to keep a proper diet, the most commonly
consumed food groups are fruits, vegetables,
healthy oils and whole grains, as these foods
should be consumed at least three times a
day. The obtained results showed that
students consumed vegetables and fruits
during meals 2-3 times a week on average,
and there was no one who never consumed
vegetables and fruits (vegetable standard
deviation: 1.10, mode: daily; fruit standard
deviation: 1.13, mode: 2-3 times a week).

131
There is no significant difference in terms of
gender, but women are more likely to
consume vegetables and fruits than men.
The importance of healthy fats and oils was
undetectable and they are consumed several
times a year (standard deviation: 1.67, mode:
monthly). In the case of whole grain cereals,
the different opinions of respondents were
distributed among the range of potential
answers with almost the same response rate
(standard deviation: 1.98, mode: 2-3 times a
week). Students consume nuts and legumes
mostly twice a week and none of them eat
these foods weekly (nuts standard deviation:
1.52, mode: weekly; legume standard
deviation: 1.34, mode: weekly). The next
category is milk and dairy products, which,
according to our research, appear between
once and 2-3 times a week on average
(standard deviation: 1.71; mode: daily),
mainly with coffee, which is mainly (64.7%)
observed in women. In addition, the
consumption different cheese products are
also significant (average: 2-3 times a week;
standard deviation: 1.31; mode: 2-3 times a
week). When examining this food category,
it can be observed that 40% of the
respondents consume this product on a daily
basis, and another 21.6% consume it several
times a week. Milk consumption is mainly
concentrated on cow's milk purchased from
stores, and only 33.8% of those surveyed
consume other dairy products of plant origin,
e.g. rice milk, however, very rarely (average:
less than monthly; standard deviation: 1.53;
mode: never). Cheese is consumed
predominantly (41.6%) 2-3 times a week,
while sour cream is consumed less often.
Figure 2. Nutrition criteria of students based on the questionnaire survey (N=500) (Note: averages 1- never; 2- less often than once a month, 3- once a month; 4- once in two weeks
5- weekly; 6- 2-3 times a week; 7- daily)
Eggs are a significant part of protein intake,
and most students (67.2%) consume it
weekly, while a fairly low proportion, 7.4%
(3.7 people) never consume them (standard
deviation: 1.26; mode: 2-3 times). Sugar is
consumed daily, as approximately 33.6% of
respondents eat sugar and only 4.6% (2.3
persons) avoid it. Again, sugar is mainly
consumed as the flavouring of coffee and tea
in such high proportions on a daily basis by
both women (mean: 5.25) and men (mean:
5.29), but sweets, in the form of cakes or
candies, are consumed monthly.
0 1 2 3 4 5 6 7
refined cereals
durum pasta
pasta from 4/8 eggs
eggs
yogurt, kephir
sour cream
cheese
milk
legumes (e.g. peas, beans)
nuts, oilseeds
whole grain cereals
fruits
vegetables
Mean

132 L. Karnai, L. Szőllősi, A.Bauerné Gáthy, I. Szűcs
It is important to note that this data
collection examined frequency and analysed
each meal separately. As a result, it can also
be stated that regular coffee drinkers
consume mainly coffee, with milk and sugar,
which has become their daily routine, so we
realized high values in terms of these factors.
This is also supported by the results of Bryan
et al., (2012), according to which coffee
consumption is mainly done by adding milk
and sugar.
Figure 3. Students' meat consumption characteristics (N=500)
More than half (61.6%) of the respondents
do not consume fish and fish products on a
monthly basis, and only 1.4% (7 persons)
indicated that they eat these products daily.
In terms of gender, men (mean: 3.33) are
slightly more likely to consume seafood and
pond fish than women (mean: 3.06). Meat
consumption, as a worldwide trend, has the
highest frequency in the case of poultry and
meat products (2-3 times a week on
average), with 69.4% of those surveyed
consuming poultry in some form weekly or
even on a daily basis (standard deviation:
1.25; mode: 2-3 times a week) (Figure 3).
As regards the consumed beverages,
compared to the recommended 2.5 liters of
daily fluid intake, the average liquid intake
of the majority (51.1%), including soup and
other liquids, is 2 liters per day, with 12.8%
(6.4 persons) consuming more than 3 liters
per day. 50.7% of those completing the
questionnaire consume sugary, carbonated
soft drinks very rarely or 1-3 times a month,
and 4.6% drink such beverages daily, which
shows a positive picture for the whole
population. Alcohol is quite common in this
age group, as 24.8% of the students surveyed
drink beer once a week or more often, and
almost the same amount of students (23.4%)
do not drink alcohol at all (standard
deviation: 1.72 mode: never). In addition, the
highest proportion of wine and pálinka
(brandy) (31.2% wine, 39.4% brandy) was
found in the category of less often than once
per month. Sweet liqueurs are a less
favoured alcoholic beverage for this age
group, as the range of answers shift even
more towards never or very rarely, with
81.0% never consuming such beverages or
drinking them less often than monthly. In the
case of caffeine-containing beverages, we
observed a high consumption of coffee, as
47.8% of respondents consume coffee daily,
and 69.8% drink coffee once or several times
a week, including daily consumption. In
contrast, 6.0% of the respondents drink
energy on a daily basis and 37.4% do not
drink it at all (standard deviation: 1.93;
mode: never).
3.2. Comparing BMI index and food
groups
According to technical literature sources,
both our health status and body weight are
influenced by how much we pay attention to
ourselves and our diet. When examining the
0% 10% 20% 30% 40% 50% 60% 70% 80% 90% 100%
fish, fish products
poultry and poultry products
pork and pork products
beef and beef products
cold cuts
never less often than monthly monthly biweekly weekly 2-3 times a week daily
133
body mass index of the examined population
based on consumption parameters, it can be
concluded that, the BMI index of the
respondents was 23.72 on average (min:
16.73; max: 42.97) and normal body weight
is observed in the case of women (mean:
22.51; min: 16.73; max: 42.97), while men
tend to be slightly overweight (mean: 25.21;
min: 17.16; max: 40.56).
During the evaluation of the obtained results,
we also aimed to examine those groups of
foods for obesity that are consumed at least
once a week, according to the previously
presented values. 69.6% of women who
consume vegetables on a daily basis are in
the normal body weight class, but even
41.2% of overweight people consume some
form of vegetables on a daily basis. In
contrast, 44.2% of men consuming
vegetables daily belong to the normal body
weight category and 41.6% belong to the
overweight category, but no significant
correlation can be observed in either case.
The majority of men who consume fruit
daily are in the obese category, while those
in the underweight category consume fruit
less often than once per day. For those who
fall into the obese category despite consume
fruit daily, it can be observed that their
consumption of sweets and repeated
consumption of biscuits can be found on a
daily basis. 74.5% of women in the normal
weight group consume fruit more often than
the average, but overweight people (49.1%)
mainly incorporate fruits into their meals 2-3
times a week. In the case of poultry meat and
meat products, 71.6% of women with normal
body weight and 82.1% of overweight
women consume more than the average. In
contrast, 37.5% of underweight men
consume poultry products 2-3 times a week,
while the amount of daily consumers is the
highest in the normal body weight category
(51.7%). Pork is not consumed at all by
underweight men, but 50.0% of those in this
category eat such food at least 2-3 times a
week, while the highest proportion of daily
pork consumers were observed in the
overweight category (47.6%). In the case of
women, the proportion of those who
consume pork daily is higher in the normal
body weight class (76.9%), and very low
among overweight women (2 people). 61.5%
of those with normal body mass index and
70.5% of overweight people consume pork
and pork products once per week or more
often. 68.8% of women who consume eggs
on a daily basis are of normal weight, while
those in the underweight category eat eggs
mostly (28.6%) once per week. In the case of
men, those belonging to the underweight
category do not consume this main source of
protein at all, while those with normal body
weight (45.5%) and overweight men (42.4%)
represent a high proportion of those
consuming eggs on a daily basis. Similar
values can be observed in the case of milk
and cheese as men consume more than 50%
above the average in all categories, and high
values were obtained for the frequency of 2-
3 times a week, which is also the case for
women. In the case of sour cream, the
average frequency of consumption is close to
and below the average for both women and
men. Women and men in the underweight
category do not consume sour cream on a
daily basis, and women tend to be below the
average compared to men's respective
average value. Sugar intake and a healthy
diet are closely linked, as excessive sugar
intake can lead to obesity. 35.8% of women
surveyed who consume sugar daily can be
classified in the normal category based on
their body mass index, but 39.2% of
overweight people consume sugar daily and
33.3% consume sugar 2-3 times a week for
the purpose of flavouring. The obtained
results also show the same tendency in men,
as 37.0% of normal weight people use it in
their meals daily.
Foods consumed at least once a week also
include coffee, which shows a significant
association between BMI index in men,
showing that there is a relationship between
body mass index categories and the
frequency of coffee consumption (χ2 test,
p<0.05; Cramer's V coefficient = 0.252).
Based on the results obtained, the proportion
134 L. Karnai, L. Szőllősi, A.Bauerné Gáthy, I. Szűcs
of normal-weight consumers whose coffee
consumption is above average (54.6%) is
higher than that of overweight people
(55.5%). However, 38.6% of those in the
underweight category drink coffee daily. In
the case of women, 62.9% of the daily
consumers are of normal weight and those in
all four categories consume more than 50%
more coffee above the average (underweight:
57.1%; normal: 63.6%; obese: 52.4%;
overweight: 70.6%).
4. Conclusions and
Recommendations
Regarding consumed foods, it can be
concluded on the basis of the quantitative
research findings that the eating habits of the
students of Debrecen differ from those
considered healthy at one or two points but
do not show any drastic values. The results
of the population survey questionnaire are
much closer to the healthy diets defined by
professionals in terms of frequency.
Examining the components of the different
meals, sweets were highly represented,
which shows high sugar consumption. The
reason for this phenomenon is the frequent
consumption of caffeine-containing drinks
(coffee, tea). Based on the available data, it
became evident that the high milk and sugar
consumption of the students of Debrecen
was mainly observed during coffee
consumption. Respondents consume coffee
several times a day, but very low
consumption was shown for energy drink,
even though it is considered to be a
substitute of coffee by many. As regards
these drinks, the majority of respondents do
not use natural sweeteners, such as honey,
but sugar. The rising popularity of natural
sweeteners is a particularly important
criterion for a healthy lifestyle. In addition to
irregular eating habits, the low amount of
fluid intake is problematic, as the average
daily intake of 1.8-2 liters/person is below
recommended levels, even though this value
varied from 0.7 liter to 3 liters daily among
the respondents, with only 15% consuming
less than 2 liters of liquid and 33.9%
consuming 3 liters or more per day. In the
case of total consumption, sugary soft drinks
appear with a higher value in addition to
water, and only a small part are energy
drinks. Another method of promoting fluid
intake is that, in addition to the total fluid
intake, fluid supplementation in the form of
a greater amount of soup should be
emphasised, as the optimal amount of fluid
intake is essential for the proper functioning
of the body.
Nutrition has a significant impact on body
weight, which, according to the BMI index,
can be categorized as overweight for men on
average and normal for women. This means
that, in order to maintain body weight and
maintain a healthy life, women should not
take in more energy than a certain amount
per day, or they should increase their
physical activity. In the case of men, the
majority should pay particular attention to
developing the proper body weight in order
to avoid health problems in the future. A
comparison of food intake once a week or
more often and the body mass index shows a
significant relationship between men and
coffee alone, but its potency is not
significant. Consequently, the frequency of
consumption of different foods and the
degree of obesity categorized on the basis of
the BMI index do not correlate with each
other and it cannot be stated that overweight
students in Debrecen consume foods high in
sugar that is less beneficial to their health.
The main contribution of the presented
article consists of the consumer habits of the
university students of Debrecen.
Furthermore, its significance lies in the fact
that it examines one of the most significant
age groups in terms of adulthood, which has
become increasingly come to the front in
various international and domestic
researches. The reason is that this age group
already makes an independent decision about
their own meals. It was important for us to
examine the extent to which members of this
135
age group can be considered health
conscious.
The article may be limited by its research
focus on just one selected university in
Hungary, so we can only generalize based on
the obtained data. In the future will be
subservient to compare a similar survey at
other similar higher education institutions
and to compare findings, even at the
international level, as there may be
significant differences in the health status of
countries and regions. However, the survey
has not further examined in the amount of
consumption and the time elapsed between
meals, proportion of cooked dishes and raw
foods, in the future it will be useful to
examine these factors as well in order to
form a comprehensive picture of
consumption.
5. Summary
Altogether, the collected and analysed data
suggest that the eating habits of the studied
age group differ slightly in frequency from
the nutritional structure considered to be
healthy by technical literature sources. In the
qualitative survey, the most commonly
consumed foods on average were vegetables
and fruits, milk and cheese, and even eggs
(average: 2-3 times a week). In terms of
frequency, the lowest mode of respondents,
i.e. “never”, was observed for durum pasta,
while honey is consumed less often than
once per month. Based on the obtained
results, the structure of consumption is based
on regular meals and a slight quality problem
is observed, which is due to the fast meals
between classes in the study period. The
results show that there is no significant
difference in the frequency of consumption,
except in the case of foods high values.
There is a significant relationship between
BMI index and food groups only in the case
of coffee. In other cases, there is no
correlation between the degree of obesity of
Debrecen students and the frequency of food
consumption.
Acknowledgment: The work/publication is
supported by the EFOP-3.6.1-16-2016-
00022 project. The project is co-financed by
the European Union and the European Social
Fund.
References:
Bach-Faig, A., Berry, E. M., Lairon, D., Reguant, J., Trichopoulou, A., Dernini, S., ..., &
Serra-Majem, L. (2011). Mediterranean Diet Pyramid Today. Science and Cultural Updates.
Mediterranean Diet Foundation Expert Group. Public Health Nutrition, 14(12A), 2274-2284.
Bácsné Bába, É., Fenyves, V., Szabados, Gy., Pető, K., Bács, Z., & Dajnoki, K. (2018). Sport
Involvement Analysis in Hungary, in the North Great Plain Region. Sustainability, 10(5), 16-
29. doi: 10.3390/su10051629.
Balázs, A. (2010). Gyógynövények szerepe az elhízás megelőzésében és kezelésében [Role of
phytotherapy in the prevention and treatment of obesity]. OrvosiHetilap, 151(19), 763-773.
Bánáti, D. (2011). Consumer response to food scandals and scares. Trends in Food Science &
Technology, 22(2-3), 56-60.
Barcs, J., & Jenes, B. (2017). Funkcionális élelmiszerek növekvő népszerűsége – a hazai
cereáliapiac fogyasztói megítélése [Growing demand for functional foods – the customer
perception of the domestic cereal market]. Táplálkozás marketing, 4(1-2), 23-37.
doi:10.20494/ tm/4/1-2/3.
Barna, M. (2007). A táplálkozás és az egészség szempontjai az élelmiszeripar fejlődésében
[Aspects of nutrition and health in the development of the food industry]. The future of the
food industry. Budapest: ÉFOSZ.

136 L. Karnai, L. Szőllősi, A.Bauerné Gáthy, I. Szűcs
Berke, Sz., Huszka, P., Laki-Lukács, A., & Iglói, N. (2012). Az egészséges életmód és a
testmozgás megítélése kaposvári fiatalok körében [Perception of a healthy lifestyle and
exercise among the young people of Kaposvár]. Entrepreneurial and Economic Trends in
the Carpathian Basin Volume I. (ed.: Fejér-Király, G. &Lázár, E.). Csíkszereda:
StátusKiadó, 86-97.
Biró, Gy. (2004). Új funkcionális élelmiszer alkotórészek – A rosszindulatú daganatok és az
oxidatív degradáció [New functional food ingredients - Malignanties and oxidative
degradation]. Édesipar, 50(4), 137-146.
Bryan, J., Tuckey, M., Einöther, S. j. L., Garczarek, U., Garrick, A., & De Bruin, E. A. (2012).
Relationships between tea and other beverage consumption to work performance and mood.
Appetite, 58(1), 339-346. doi:10.1016/j.appet.2011.11.009.
Davis, C.,Bryan, J., Hodgson, J., & Murphy, K. (2015). Definition of the Mediterranean Diet;
A Literature Review. Nutrients, 7(11), 9139-9153.
De Boer, J., & Aiking, H. (2018). Prospects for Pro-Environmental Protein Consumption in
Europe: Cultural, Culinary, Economic and Psychological Factors. Appetite, 121, 29-40.
doi:10.1016/j.appet.2017.10.042.
DeCosta, P., Møller, P., Frøst, M. B., & Olsen, A.(2017). Changing Children’s Eating
Behavior – A Review of Experimental Research. Appetite, 113, 327-357.
doi:10.1016/j.appet.2017.03.004.
Enser, M. (2001). „Hústermékek az egészséges táplálkozás szolgálatában” Beszámoló a
hústudományés Technológia 46. NemzetköziKongresszusáról [“Meat products for a healthy
diet”. Report on the 46th International Congress of Meat Science and Technology]. A Hús,
11(1), 9-30.
Harvard School of Public Health (2013). Healthy Eating Plate. Retrieved on May, 25, 2019,
from: https://www.shape.hu/27778_egeszseges_taplalkozasi_piramis_a_harvard_kutatoitol
and https://www.hsph.harvard.edu/nutritionsource/healthy-eating-plate/
Haven, J., Burns, A., Britten, P., & Davis, C. (2006). Developing the Consumer Interface for
the MyPyramid Food Guidance System. Journal of Nutrition Education and Behavior, 38(6),
124-135.
Hawkes, C. (2004). Nutrition labels and health claims: the global regulatory environment.
World Health Organization, 1-88.
Hidvégi, P., Kopkáné Plachy, J., & Müller, A. (2015). Az egészséges életmód [A healthy
lifestyle] (ed.: Hidvégi P.). Eger: Eszterházy Károly Főiskola, Sporttudományi Intézet.
Huszka, P. (2012). Néhány gondolat a 13-14 éves korosztály táplálkozási szokásairól. „A
marketing újtendenciái” [Some thoughts on eating habits for 13-14 year olds. „New
marketing trends”]. A Kautz Gyula Gazdaságtudományi Kar és a Regionális- és
Gazdaságtudományi Doktori Iskola konferenciája, Győr, 2012.12.11. 236-253.
Keys, A., Fidanza, F., Karvonen, M. J., Kimura, N., & Taylor, H. L. (1972). Indices of relative
weight and obesity. J Chronic Dis, 25(6), 329-343.
Lude, M., & Prügl, R. (2018). Why the Family Business Brand Matters: Brand Authenticity
and the Family Firm Trust Inference. Journal of Business Research, 89(August), 121-134.
doi:10.1016/j.jbusres.2018.03.040.

137
Marjainé Szerényi, Zs., Zsóka, Á., Kocsis, T., & Széchy, A. (2012). A
fiatalokfogyasztásiéséletmódbeliszokásai a környezetineveléstükrében [Consumption and
lifestyle habits of young people in the light of environmental
education].ÚjPedagógiaiSzemle,62(11-12), 15-36.
Marty, L., Chambaron, S., Nicklaus, S., & Monnery-Patris, S. (2018). Learned pleasure from
eating: An opportunity to promote healthy eating in children? Appetite, 120, 265-274.
doi:10.1016/j.appet.2017.09.006.
McGinnis, J. M., Appleton Gootman, J., & Kraak, V. I. (2006). Food marketing to chidren and
youth. Threat or Opportunity. Washington: The National Academies Press.
Mendis, S., Puska, P., & Norrving, B. (2011). Global Atlas on Cardiovascular Disease
Prevention and Control. World Health Organization, Geneva, 2011. Retrieved on May, 20,
2019 from:http://whqlibdoc.who.int/ publications/2011/9789241564373_eng.pdf
Menrad, K. (2003). Market and marketing of functional food in Europe. Journal of Food
Engineering, 56(2-3), 181-188.
Mollet, B., & Rowland, I. (2002). Functional foods: At the frontier between food and pharma.
Current Opinion in Biotechnology, 13(1), 483-485.
Népegészségügyi (2015). Észak-Magyarországi Regionális Népegészségügyijelentés 2015
[Northern Hungary Regional Public Health Report 2015]. Retrieved on May, 25, 2019,
from: www.kormanyhivatal.hu/.../Regionalis...Jelentes_2015.pdf
Papp, A., & Lugasi, A. (2018). Finom, egészséges és népszerű – gasztronómiai kihívások
gyermek-és fiatalkorban [Delicious, healthy and popular - gastronomic challenges for
children and adolescents]. In: A magya rgyermekek és fiatalok életmódja: táplálkozás,
testmozgás és lélek (Szerk.: Antal, E., Pilling, R.), TÉT Platform Egyesület, 2018.
Piskóti, I., Nagy, Sz., & Kovács, A. T. (2006). Fogyasztóimagatartás a
funkcionálisélelmiszerekpiacán [Consumer behavior in the functional food market].
Marketing Kaleidoszkóp, Miskolc, 117-127.
Ramsden, C. E., Zamora, D., Majchrzak-Hong, S., Faurot, K. R., Broste, S. K., Frantz, R. P.,
..., & Hibbeln, J. R. (2016). Re-Evaluation of the Traditional Diet-Heart Hypothesis:
Analysis of Recovered Data from Minnesota Coronary Experiment (1968-73). BMJ, 353
i1246. doi:10.1136/bmj.i1246.
Rang, V. (2016). Food Pyramid. Retrieved on June, 02, 2019, from: https://viralrang.com/food-
pyramid/
Rodler, I. (ed.) (2005). Újtápanyagtáblázat[New food composition table]. Budapest:
MedicinaKönyvkiadó Rt.
Ruini, L. F., Ciati, R., Pratesi, C. A., Marino, M., Principato, L., & Vannuzzi, E. (2015).
Working Toward Healthy and Sustainable Diets: The “Double Pyramid Model” Developed
by the Barilla Center for Food and Nutrition to Raise Awareness about the Environmental
and Nutritional Impact of Foods. Frontiers in Nutrition, 2(9). doi:10.3389/fnut.2015.00009.
Szakály, Z. (2011). Táplálkozásmarketing [Nutrition Marketing]. Budapest: MezőgazdaKiadó.
Szakály, Z. (1994). Korszerű állati eredetű alapélelmiszerek piacképességének vizsgálata
[Investigation of the marketability of modern basic foodstuffs of animal origin]. Kandidátusi
Értekezés, Kaposvár: PATE, Állattenyésztési Kar,1-200.
Szakály, Z. (2004). Táplálkozási dilemmák és az élelmiszerek fejlesztésének világstratégiai
irányai [Dilemmas of nutrition and world strategic trends of development of foodstuffs].
Élelmiszer, Táplálkozásés Marketing,1(1-2),1-11.

138 L. Karnai, L. Szőllősi, A.Bauerné Gáthy, I. Szűcs
Szakály, Z., Popp, J., Kontor, E., Kovács, S., Pető, K., & Jasák, H. (2017). Attitudes of the
Lifestyle of Health and Sustainability Segment in Hungary. Sustainability, 9(10), 1-16.
doi:10.3390/su9101763.
Szőllősi, L., Molnár, Sz., Molnár, Gy., Horn, P., & Sütő, Z. (2017). A tojás, mint alapvető és
funkcionális élelmiszer táplálkozás-élettani jelentősége [Nutritional significance of eggs as a
basic and functional food]. Táplálkozásmarketing, 4(1-2), 7-22. doi:10.20494/TM/4/1-2/2.
Taylor, C. M., Wernimont, S. M., Northstone, K., & Emmett, P. M. (2015). Picky/Fussy Eating
in Children: Review of Definitions, Assessment, Prevalence and Dietary Intakes. Appetite,
95, 349-359. doi:10.1016/j. appet.2015.07.026.
Törőcsik, M. (2007). Food-trendek és trendi vásárlói csoportok [Food trends and trendy
customer groups]. Budapest: Akadémiai Kiadó.
Trautwein, E. A., Koppenol, W. P., de Jong, A., Hiemstra, H., Vermeer, M. A., Noakes, M., &
LuscombeMarsh, N. D. (2018). Plant Sterols Lower LDL-Cholesterol and Triglycerides in
Dyslipidemic Individuals with or at Risk of Developing Type 2 Diabetes; a Randomized,
Double-Blind, Placebo Controlled Study. Nutrition and Diabetes, 8(1), 1-13.
doi:10.1038/s41387-018-0039-8.
Vida, V., & Szűcs, I. (2016): Társadalmi-kulturális kérdések és a tradíciók szerepe a
sertéshúsfogyasztásban [The role of socio-cultural issues and traditions regarding pork
consumption]. Táplálkozásmarketing 3(2), 79-89. doi:10.20494/TM/3/2/6.
Welsh, S., Davis, C., & Shaw, A. (1992): Development of the Food Guide Pyramid. Nutrition
Today, 27(6), 12-23.
World Health Organization (2019): Nutrition and food security. Retrieved on June, 02, 2019,
from: https://www.who.int/foodsafety/areas_work/nutrition/en/
Young, Y. (2000). Functional foods and the European consumer. In: Functional foods. II.
Claims and evidence. (ed.: Buttriss, J. &Saltmarsh, M.), London, UK: The Royal Society of
Chemistry. 25-34.
Zsarnóczay, G. (2009). A vöröshúsokszerepe a táplálkozásban[The role of the red meats in
human nutrition].Élelmiszer, Táplálkozásés Marketing, 6(1-2), 51-58.
Laura Karnai University of Debrecen,
Faculty of Economics and
Business,
Debrecen, Hungary
László Szőllősi University of Debrecen, Faculty
of Economics and Business,
Debrecen, Hungary
Andrea Bauerné Gáthy University of Debrecen, Faculty
of Economics and Business,
Debrecen, Hungary
deb.hu
István Szűcs University of Debrecen,
Faculty of Economics and
Business,
Debrecen, Hungary
Related Documents