Laterality in Persons with Intellectual Disability. I—Do Patients with Trisomy 21 and Williams–Beuren Syndrome Differ from Typically Developing Persons? Miche` le Carlier, 1,2,10 Silvia Stefanini, 3 Christine Deruelle, 4 Virginia Volterra, 5 Anne-Lise Doyen, 6 Christine Lamard, 1 Ve´ronique de Portzamparc, 7 Stefano Vicari, 8 and Gene Fisch 9 Received 5 Mar. 2005—Final 2 July 2005 Persons with trisomy 21 (T21) and Williams–Beuren syndrome (WBS) have different brain abnormalities which may affect manual laterality. We assessed 45 persons with T21 and 34 with WBS (mean age 13) and 81 typically developing children (TD). Manual laterality was assessed with a fifteen-item task administered two times, and Bishop’s card-reaching task. We found more left-handers in the T21 group compared to the other two groups. Inconsistent laterality was higher in the two groups with genetic diseases than in the TD group. For Bishop’s test, both T21 and WBS participants were less right-oriented than the TD group. They displayed different response patterns in midline crossing when reaching for the cards, but did not display more midline crossing inhibition than the TD group. Is atypical handedness linked to specific genetic syndromes and, more specifically for persons with T21, to the trisomy of some of the genes? KEY WORDS: Genetic diseases; handedness; mental retardation; trisomy 21; Williams–Beuren syndrome. INTRODUCTION The present investigation explores manual laterality preference in persons with one of two genetic syn- dromes: trisomy 21 and Williams–Beuren syndrome (abbreviated as T21 and WBS). Persons with T21 and WBS clearly show different psychological profiles, with differences both between the two genetic disease groups and between them and the typically develop- ing (TD) group. Persons with T21 and WBS have specific brain particularities which may in turn affect laterality (see below). To the best of our knowledge, these two groups of patients have never been com- pared for manual laterality. Previously, it has been shown that mental impairment is linked to atypical laterality (with more non-right handedness or more mixed-handedness in mentally deficient populations) but it is not clear if this atypical laterality is the consequence of the mental impairment or a specific feature of the syndrome itself. To address this ques- tion it is necessary ‘‘to distinguish between etiological groups rather than selecting subjects purely on the basis of intellectual level’’, as proposed by Bishop (1990, p. 109, line 12) and later by McManus and Cornish (1997). 1 Centre de Recherche PsyCL E, UFR PSE, Universite´ de Provence, 13621, Aix en Provence cedex 1, France. 2 University Institute of France, France. 3 Department of Neuroscience, University of Parma, Parma, Italy. 4 Institut de Neurosciences Cognitives de la Me´diterrane´e, CNRS, Marseille, France. 5 Institute of Cognitive Sciences and Technologies, National Research Council (CNR), Roma, Italy. 6 IUFM Orle´ans Tours, Orle´ans, France. 7 Institut Je´roˆme Lejeune, Paris, France. 8 Institute of Research Children Hospital Bambino Gesu´, Santa Marinella and LUMSA University, Rome, Italy. 9 Yeshiva University, and CUNY/Lehman College, New York, USA. 10 To whom correspondence should be addressed at UFR PSE, Universite´ de Provence, 29 Avenue Robert Schuman, 13621, Aix en Provence cedex 1, France. Tel.: +33-442-933-999; Fax: +33- 442-389-170; e-mail: [email protected] 365 0001-8244/06/0500-0365/0 Ó 2006 Springer Science+Business Media, Inc. Behavior Genetics, Vol. 36, No. 3, May 2006 (Ó 2006) DOI: 10.1007/s10519-006-9048-9

Welcome message from author
This document is posted to help you gain knowledge. Please leave a comment to let me know what you think about it! Share it to your friends and learn new things together.
Transcript
Laterality in Persons with Intellectual Disability. I—Do
Patients with Trisomy 21 and Williams–Beuren SyndromeDiffer from Typically Developing Persons?
Michele Carlier,1,2,10 Silvia Stefanini,3 Christine Deruelle,4 Virginia Volterra,5 Anne-Lise
Doyen,6 Christine Lamard,1 Veronique de Portzamparc,7 Stefano Vicari,8 and Gene Fisch9
Received 5 Mar. 2005—Final 2 July 2005
Persons with trisomy 21 (T21) and Williams–Beuren syndrome (WBS) have different brainabnormalities which may affect manual laterality. We assessed 45 persons with T21 and 34
with WBS (mean age 13) and 81 typically developing children (TD). Manual laterality wasassessed with a fifteen-item task administered two times, and Bishop’s card-reaching task. Wefound more left-handers in the T21 group compared to the other two groups. Inconsistent
laterality was higher in the two groups with genetic diseases than in the TD group. ForBishop’s test, both T21 and WBS participants were less right-oriented than the TD group.They displayed different response patterns in midline crossing when reaching for the cards, butdid not display more midline crossing inhibition than the TD group. Is atypical handedness
linked to specific genetic syndromes and, more specifically for persons with T21, to the trisomyof some of the genes?
KEY WORDS: Genetic diseases; handedness; mental retardation; trisomy 21; Williams–Beurensyndrome.
INTRODUCTION
The present investigation explores manual lateralitypreference in persons with one of two genetic syn-dromes: trisomy 21 and Williams–Beuren syndrome
(abbreviated as T21 and WBS). Persons with T21 andWBS clearly show different psychological profiles,with differences both between the two genetic diseasegroups and between them and the typically develop-ing (TD) group. Persons with T21 and WBS havespecific brain particularities which may in turn affectlaterality (see below). To the best of our knowledge,these two groups of patients have never been com-pared for manual laterality. Previously, it has beenshown that mental impairment is linked to atypicallaterality (with more non-right handedness or moremixed-handedness in mentally deficient populations)but it is not clear if this atypical laterality is theconsequence of the mental impairment or a specificfeature of the syndrome itself. To address this ques-tion it is necessary ‘‘to distinguish between etiologicalgroups rather than selecting subjects purely on the basisof intellectual level’’, as proposed by Bishop (1990,p. 109, line 12) and later by McManus and Cornish(1997).
1 Centre de Recherche PsyCL�E, UFR PSE, Universite de
Provence, 13621, Aix en Provence cedex 1, France.2 University Institute of France, France.3 Department of Neuroscience, University of Parma, Parma, Italy.4 Institut de Neurosciences Cognitives de la Mediterranee, CNRS,
Marseille, France.5 Institute of Cognitive Sciences and Technologies, National
Research Council (CNR), Roma, Italy.6 IUFM Orleans Tours, Orleans, France.7 Institut Jerome Lejeune, Paris, France.8 Institute of Research Children Hospital Bambino Gesu, Santa
Marinella and LUMSA University, Rome, Italy.9 Yeshiva University, and CUNY/Lehman College, New York,
USA.10 To whom correspondence should be addressed at UFR PSE,
Universite de Provence, 29 Avenue Robert Schuman, 13621, Aix
en Provence cedex 1, France. Tel.: +33-442-933-999; Fax: +33-
442-389-170; e-mail: [email protected]
365
0001-8244/06/0500-0365/0 � 2006 Springer Science+Business Media, Inc.
Behavior Genetics, Vol. 36, No. 3, May 2006 (� 2006)DOI: 10.1007/s10519-006-9048-9
Trisomy 21 is the most common form of geneticmental retardation occurring in about 1 in 700 livebirths (Lejeune, 1990). In most cases, it is due to thepresence of an entire extra copy of chromosome 21.The physical and neuropsychological characteristicshave been fully described by Vicari (2006, same is-sue), and Teipel and Hampel (2006, same issue).Williams–Beuren syndrome (WBS) is a rare geneticsyndrome (incidence ranging from 1 in 7500 to 1 in25,000 live births) resulting from a hemyzigous dele-tion of genes at the long arm of chromosome 7 at7q11.23. In 95% of affected persons, the size of thedeletion is 1.6 Mb which encompasses at least 24genes. The specific contributions of most of thesedeleted genes to the phenotype are not clear. Thepsychological profile of the WBS phenotype is typi-fied by mental retardation, with aspects of languagedevelopment relatively intact, while visual–spatialprocessing ability, counting, planning and implicitlearning are severely impaired. This was demon-strated in studies comparing WBS children with T21children (see inter alia Bellugi et al., 1999; Klein andMervis, 1999; Mervis et al., 2000; Vicari et al., 2002;Vicari, 2006). Retarded brain development in WBSchildren is characterized by marked atrophy of theposterior regions of the brain and the basal ganglia.While some authors (Bellugi et al., 1999; Jerniganet al., 1993) have concluded that cerebellar volume isrelatively preserved, a more recent study foundabnormal cerebellar enlargement in WBS infants andtoddlers (Jones et al., 2002). Abnormal developmentof the corpus callosum (colossal shape and volume ofdifferent parts) has also been reported (Schmitt et al.,2001; Tomaiuolo et al., 2002). In contrast, personswith T21 have a lower brain weight with a smallcerebellum, frontal and small temporal lobes (Teipeland Hampel, 2006; Vicari, 2006).
In a review published in 1988, Pipe concludedthat atypical laterality is more frequent in retardedpersons. Two-years later, Bishop (1990) published anexcellent book on links between handedness anddevelopmental disorders. One of her conclusionsstated that ‘‘Findings of excess non-right-handednessare robust for conditions in which there is evidence ofunderlying neurological damage: mental impairment,infantile autism and, to a lesser extent, epilepsy’’(p. 163, line 19), in agreement with Pipe (1988).However, in chapter 9 of her book, Bishop (1990)noted that the nature of increases in non-right-handedness in mentally disabled persons was notfully understood. She emphasized the need to dis-tinguish left-handedness from mixed-handedness
(or ambiguous laterality, i.e. with the preferencevarying between but not within the tasks) and lack ofhand preference (or inconsistent laterality where thepreference varies within the tasks; inconsistent later-ality may also refer to non-concordance betweenhand preference and hand skill—McManus andCornish, 1997). In spite of Bishop’s recommenda-tion, since 1990 relatively few papers have beenpublished on sensory and motor laterality in personswith genetic disorders. An excess of left- or mixed-handedness, assessed using the Edinburgh Handed-ness Inventory (Oldfield, 1971) was reported in pa-tients according to schizophrenic subtypes (Dollfuset al., 2002), but this excess was not confirmed in agroup of children who later developed a schizo-phrenia spectrum disorder (Schiffman et al., 2005).And in longitudinal studies on offspring of schizo-phrenic parents by Erlenmeyer-Kimling et al. (2005),no significant differences were observed in the off-spring who developed schizophrenic disorders.Umansky et al. (2003) found a left-hand preferenceof 33% in a group of 145 patients with Rett syn-drome. Cornish and McManus (1996) assessedyoung (3–5 years) and older (11–13 years) childrenwith autism (N=35), 26 children with learning dis-abilities, and 89 typically developing (TD) children.Hand preference was measured three times using aset of 10 symmetrically presented unimanual prefer-ence tasks (e.g. coloring a square and eating with aspoon). Hand skill asymmetry was assessed using theAnnett Pegboard (Annett 1970; Annett, 2002; Doyenand Carlier, 2002, for recent references). Left-hand-edness, which was defined as greater use of the lefthand in the preference tasks, was more common inthe two groups of disabled children than in the TDgroup (23% individuals with autism, 11.5% withlearning disabilities, and 4% TD). However, theprevalence of left-handedness in the TD group wasmuch lower than the general average. Consistency ofhandedness calculated across all pairs of replicatesfor each preference task was highest in the 11–13 year-old groups (disabled and TD) and higher inthe TD group for all ages, compared to the twogroups of disabled children.
Since 1990, several studies have compared T21individuals with other groups of disabled children.Lewin et al. (1993) selected adult hospital residents,classifying them in using three diagnostic categories:T21 (N=20), epilepsy (N=20) and autism (N=18).Handedness was established using a 10-item task. Theauthors did not present any information at all on thecriteria used to define right- or left-handers. They
366 Carlier et al.
observed a higher prevalence of non-right-handers inthe patient groups than in general population, inde-pendent of the diagnosis (19% left-handed, 17%mixed-handed). No differences in handedness wereobserved between groups with severe-to-profoundlearning disabilities and groups withmild-to-moderatelearning disabilities. Cornish et al. (1997) assessedhand preference and hand skill in 27 children withFragile-X syndrome, 20 children with T21, and 20whowere TD. Laterality assessment followed the protocoldescribed above (Cornish and McManus, 1996). Nodifference was observed across the three groups foreither the proportion of left-handedness nor consis-tency of handedness. It should be noted that the per-centages of left-handers were unusually low in the T21and TD groups in this study (3.3 and 3.4).
Other studies focused only on individuals withT21. Devenny and Silverman (1990) tested 31 adultswith T21 in a five-item task (pencil, comb, tooth-brush, ball, and scissors). They were classified asright- or left-handed if all five objects were used withthe same hand. The others were designated as mixed-handed. With such classification, 48% of participantswere right-handed, 13% left-handed and 39% mixed-handed. A summed score of laterality did not corre-late to IQ. No group of TD persons was assessed forcomparison, which makes it difficult to have any clearinterpretation of the data. Vlachos and Karapetsas(1999) used 10 items from the Edinburgh HandednessInventory to classify children with T21 (7–9-yearsold) and teenagers with T21 (13–15-years old), com-paring them to typically developing persons. Left-and mixed-handedness were more frequent amongindividuals with T21 than TD individuals. The au-thors did not include any information on the per-centage of left-handers and mixed-handers in theirsamples.
Taken together, the more recent papers do notalways confirm earlier studies showing higher preva-lence of left- or mixed-handedness in persons withT21 (Batheja and McManus, 1985; Pipe 1987). Oneof the difficulties in studies of atypical persons is thelimited number of participants; this is because ofproblems recruiting patients. And when the TDgroup is small, random differences may be expected.Another drawback is the difficulty in assessing man-ual preference. There is a great deal of literature onthis topic, but still no agreement on the best instru-ment, although some items are almost always chosen.Several inventories are available (see inter alia An-nett, 1970, 2002; Delatollas et al., 1988; Oldfield,1971; Perelle and Ehman, 1994; Stenhuis and Bryden,
1989). The prevalence of left-handedness differsaccording to the items used, and classifications ofparticipants are dependent on the laterality indexchosen. This was illustrated by Peters (1992) andmore recently by Medland et al. (2004), and sum-marized by Fagard (2004). The same difficulty ariseswhen performance tests are used, instead of a pref-erence test (Carlier et al., 1993a, 1993b), and the sit-uation is even more complicated by the fact that thestructures of manual preference inventories are notthe same for right- and left-handers (Peters andMurphy, 1993; Doyen et al., 2001), assuming too thatwe are able to classify participants in those twocategories.
From the literature cited above, we can draw atleast three conclusions to improve our knowledge onlinks between manual laterality and mental impair-ment: (1) information is needed on the cause(s) of themental impairment; (2) different methods must beused for measuring manual laterality in the sameresearch project; and (3) a distinction must be madebetween mixed laterality and inconsistent laterality.The manual preference tasks must therefore beadministered at least two times.
MATERIALS AND METHOD
Participants
Data have been collected by three teams based inFrance, Italy and USA. The participants with T21and WBS therefore came from different countries.There were 45 persons with T21 (33 from France and12 from Italy) and 34 persons with WBS (13 fromFrance, 15 from Italy and 6 from the USA). Therewas no difference in the mean age of the two geneticgroups (T21: 13.96±0.88, range: 8–34; WBS: 13.76±0.76, range: 8–26, t[77]=0.16, p=0.87). All partici-pants were recruited from medical consulting servicesor parents’ associations. Participants lived with theirfamilies who gave their informed consent. TheWilliams--Beuren syndrome diagnoses had beenestablished by pediatricians and confirmed bymolecular analyses (homozygous deletion of theelastin gene, 7q11.2, Mari et al., 1995). Intellectuallevels were obtained from psychological records ofthese patients (mainly on the Stanford-Binet andWechsler scales). The mean intellectual levels were47.31±1.56 (range: 30–72) for T21, and 52.70±2.28(range: 36–93) for WBS. Four individuals were inthe borderline to low-normal range, i.e. above 70;one was in the T21 group and 3 in the WBS group.
367Laterality in Trisomy 21 and Williams–Beuren Syndrome
The difference in IQ between the two groups was sta-tistically significant (t[76]=2.02, p=0.05), with theWBS group having a higher IQ. It should be notedthat the difference between the two groups was smallerthan previous observations in the literature (5.4 pointscompared to approximately 10 points). This is becausecertain persons with T21 with a very low intellectuallevel were not included in our sample as they wereunable to follow the protocol. Our aim was not tomatch the two groups for their intellectual levels asthere is no evidence in the literature of comparisons ofsamples with mild to moderate intellectual levelsshowing a correlation between the level of intelligenceand laterality (Bradshaw-McAnulty et al., 1984;Devenny and Silverman, 1990; Lewin et al., 1993;Lucas et al., 1989). Both sexes were included (male/female ratio: 1.05 and 1.27 for the T21 and WBSgroups respectively). None of the participants hadany obvious physical disability that could influ-ence limb preference. Each participant was testedindividually.
The comparison group of typically developingpersons deserves some comment. Since 1998, we haveassessed manual laterality in 492 typically developingpersons aged from 3 to 34. One hundred fifty-sevenparticipated in a familial study and had a minimumof two left-handers in each family (Doyen, 2000). Asthey had been selected for left-handedness, they werenot included in our comparison group. Of theremaining 335, 81 were aged 8 or above and theyformed the comparison group. Of these 81 children,24 formed the typically developing group for com-parison with the two groups of persons with T21 andWBS when assessing variables measuring inconsis-tent laterality. The remaining 57 children had beentested before the current study began (Carlier et al.,in press), using Annett’s item task and Bishop’s card-reaching test, and had not done the item task a sec-ond time, or the four additional items (see below). Itwas therefore impossible to assess their level ofmanual inconsistency. The TD group was youngerthan the T21 and WBS groups (mean age:8.26±0.05), but laterality in TD persons is fullydeveloped by the age of 8, particularly for the tasksin our study (Carlier, Doyen, Lamard, in press). Butthis did not preclude a posteriori assessment of an ageeffect in the two patient groups which has been donehere by regression analyses. All the children wereseen individually at school and their parents gaveinformed consent. There was no differential selectionof the children as very few parents refused theirconsent.
Procedure
Laterality was assessed with two methods soas to avoid some of the drawbacks discussed in theliterature. The testing session lasted approximately30 min.
Item Task
The eleven-item task of Annett’s questionnairewas administered: writing, throwing, holding aracket, cutting with scissors, threading a needle, usinga broom, shoveling, dealing cards, hammering, usinga toothbrush, and unscrewing the lid of a jar (see interalia, Annett, 1970, 2002; Doyen et al., 2001). Theparticipant performed the action requested and thehand used was recorded. The match-striking item wasexcluded as children are not allowed to play withmatches. For the sub-sample of the 24 TD childrenand the WBS and T21 groups, four items were added(winding on a reel, combing hair, holding a spoonwhen eating, and putting a key in a lock), and theitem task was administered two times, with the card-reaching test between the two trials.
Card-reaching Test
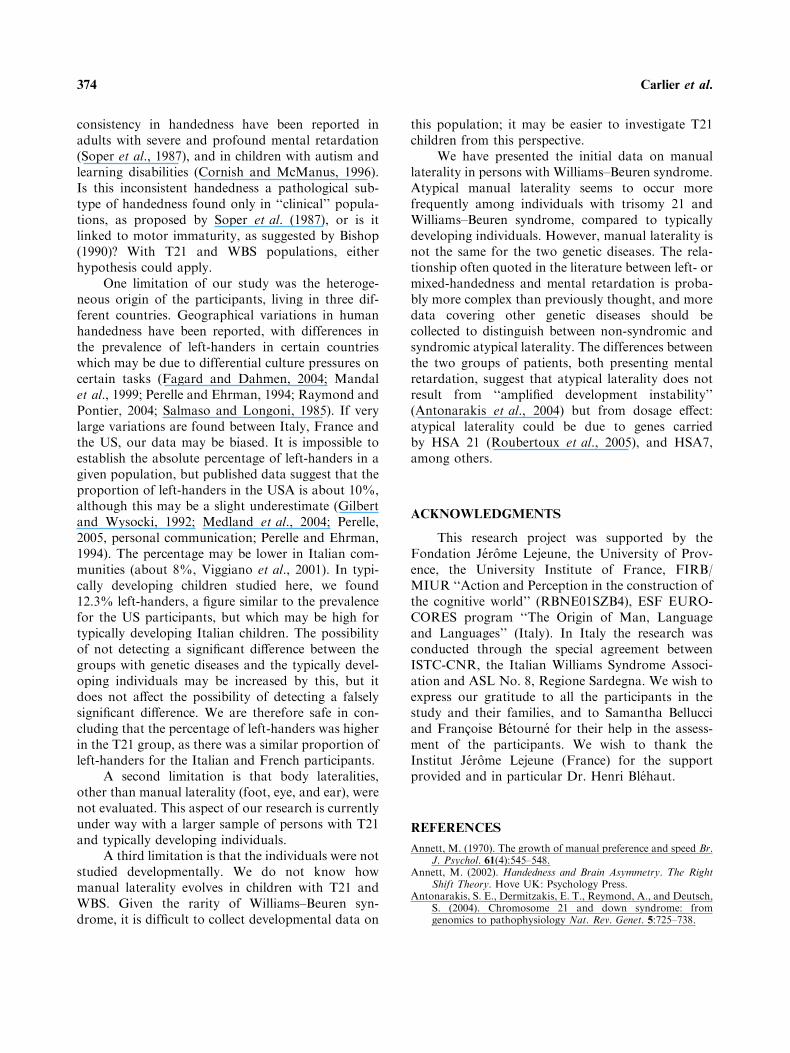
We thought it inappropriate to use performancetests on participants known to be slow in movementand frequently awkward (as persons with T21 oftenare). The card-reaching test proposed by Bishop et al.(1996) was therefore chosen; it provides a behavioralmeasure of degree and direction of hand preference. Inthe English adult version, a cardboard template placedin front of the participant is used to mark sevenpositions, each at a distance of 40 cm from the mid-point of a baseline, at successive 30 degree intervals.Position 4 is the midline. Positions 1, 2 and 3 are sit-uated on the left hand side of the semicircle; positions5, 6 and 7 are located on the right hand side of thesemicircle. Three cards are placed at each of the 7positions. The participant is seated at a table in frontof the cardboard template with his/her hand resting onthe table on either side of a box aligned with themidline of the body. He/she is asked by the experi-menter to pick up a card at a given position indicatedby a number marked just above the card, and to put itin the box (see Fig. 1). The order was random. Thereare no time limits and the task is easy to performprovided the participant can read the numbers indi-cating the position of the card and has no seriousmotor impairment. In a previous research projectstudying adult populations (Doyen and Carlier,2002), we changed the original procedure slightly: the
368 Carlier et al.
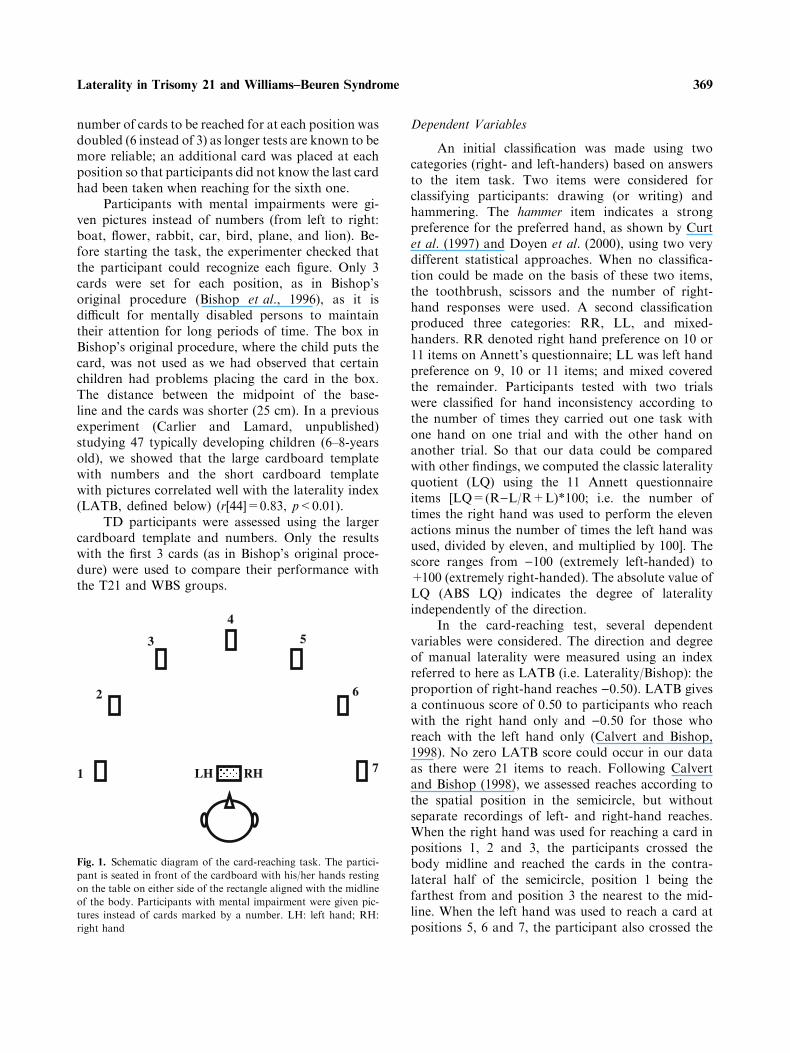
number of cards to be reached for at each position wasdoubled (6 instead of 3) as longer tests are known to bemore reliable; an additional card was placed at eachposition so that participants did not know the last cardhad been taken when reaching for the sixth one.
Participants with mental impairments were gi-ven pictures instead of numbers (from left to right:boat, flower, rabbit, car, bird, plane, and lion). Be-fore starting the task, the experimenter checked thatthe participant could recognize each figure. Only 3cards were set for each position, as in Bishop’soriginal procedure (Bishop et al., 1996), as it isdifficult for mentally disabled persons to maintaintheir attention for long periods of time. The box inBishop’s original procedure, where the child puts thecard, was not used as we had observed that certainchildren had problems placing the card in the box.The distance between the midpoint of the base-line and the cards was shorter (25 cm). In a previousexperiment (Carlier and Lamard, unpublished)studying 47 typically developing children (6–8-yearsold), we showed that the large cardboard templatewith numbers and the short cardboard templatewith pictures correlated well with the laterality index(LATB, defined below) (r[44]=0.83, p<0.01).
TD participants were assessed using the largercardboard template and numbers. Only the resultswith the first 3 cards (as in Bishop’s original proce-dure) were used to compare their performance withthe T21 and WBS groups.
Dependent Variables
An initial classification was made using twocategories (right- and left-handers) based on answersto the item task. Two items were considered forclassifying participants: drawing (or writing) andhammering. The hammer item indicates a strongpreference for the preferred hand, as shown by Curtet al. (1997) and Doyen et al. (2000), using two verydifferent statistical approaches. When no classifica-tion could be made on the basis of these two items,the toothbrush, scissors and the number of right-hand responses were used. A second classificationproduced three categories: RR, LL, and mixed-handers. RR denoted right hand preference on 10 or11 items on Annett’s questionnaire; LL was left handpreference on 9, 10 or 11 items; and mixed coveredthe remainder. Participants tested with two trialswere classified for hand inconsistency according tothe number of times they carried out one task withone hand on one trial and with the other hand onanother trial. So that our data could be comparedwith other findings, we computed the classic lateralityquotient (LQ) using the 11 Annett questionnaireitems [LQ=(R)L/R+L)*100; i.e. the number oftimes the right hand was used to perform the elevenactions minus the number of times the left hand wasused, divided by eleven, and multiplied by 100]. Thescore ranges from )100 (extremely left-handed) to+100 (extremely right-handed). The absolute value ofLQ (ABS LQ) indicates the degree of lateralityindependently of the direction.
In the card-reaching test, several dependentvariables were considered. The direction and degreeof manual laterality were measured using an indexreferred to here as LATB (i.e. Laterality/Bishop): theproportion of right-hand reaches )0.50). LATB givesa continuous score of 0.50 to participants who reachwith the right hand only and )0.50 for those whoreach with the left hand only (Calvert and Bishop,1998). No zero LATB score could occur in our dataas there were 21 items to reach. Following Calvertand Bishop (1998), we assessed reaches according tothe spatial position in the semicircle, but withoutseparate recordings of left- and right-hand reaches.When the right hand was used for reaching a card inpositions 1, 2 and 3, the participants crossed thebody midline and reached the cards in the contra-lateral half of the semicircle, position 1 being thefarthest from and position 3 the nearest to the mid-line. When the left hand was used to reach a card atpositions 5, 6 and 7, the participant also crossed the
4
53
2 6
1 7LH RH
Fig. 1. Schematic diagram of the card-reaching task. The partici-
pant is seated in front of the cardboard with his/her hands resting
on the table on either side of the rectangle aligned with the midline
of the body. Participants with mental impairment were given pic-
tures instead of cards marked by a number. LH: left hand; RH:
right hand
369Laterality in Trisomy 21 and Williams–Beuren Syndrome
midline, in this case, position 7 being the farthestfrom and 5 the nearest to the midline. We calculatedthe number of times the reaches crossed the midline.One reach with the right hand to position 1 wasadded to one reach with the left hand to position 7(farthest positions), and so on for positions 2 and6 (middle), and positions 3 and 5 (near the mid-line)—see Figure 1. With this method of scoring, allparticipants could be included in the same analysis(i.e. right-handed and left-handed), and distancefrom the midline was the only parameter considered.This increased the power of the statistical tests. Thetotal number of crossings of each participant wasalso calculated and this score correlated highly withthe absolute LATB value as individuals who fre-quently cross the midline are obviously more later-alized (right or left).
Participants were classified as right-handerswhen reaching for the cards with the right hand atleast 11 times (LATB ‡ 0.02), and left-handers whenreaching for the cards with the left hand at least11 times (LATB £ )0.02). Another three-categoryclassification was made against the values of 0.31or )0.31 that were close to the means of LATB intypically developing persons who had positive andnegative scores in the card-reaching test. (1) RR:LATB scores ‡0.31 (i.e. 17 of 21 reaches with theright hand); (2) LL: LATB £ )0.31; and (3) mixed:)0.31<LATB<0.31.
Statistical Analyses
We used the SPSS package for all analyses. Theproportions of left- right- and mixed-handers werecompared using the chi-square test. The three groupsof participants were compared (between-subjectsfactor) with analyses of variances (ANOVA) for fourvariables: LQ, ABS LQ, hand changes, and LATB.Two-way ANOVA was conducted to test differencesacross the three spatial positions (within-subjectsfactor) and differences across the three groups ofparticipants in the card-reaching test. Post-hoc com-parisons using the LSD procedure (Least Small Dif-ference, Howell, 1998) were made when appropriate.Statistical significance was set at p £ 0.05. Exactp values are given in the Tables, but not for p>0.10.When means were compared, effect sizes have alsobeen given (g2
p, proportion of the effect plus errorvariance, attributed to the effect, i.e. the proportionof the variability in the dependent measure that isattributable to a factor).
RESULTS
The Item Task (see Tables I and II)
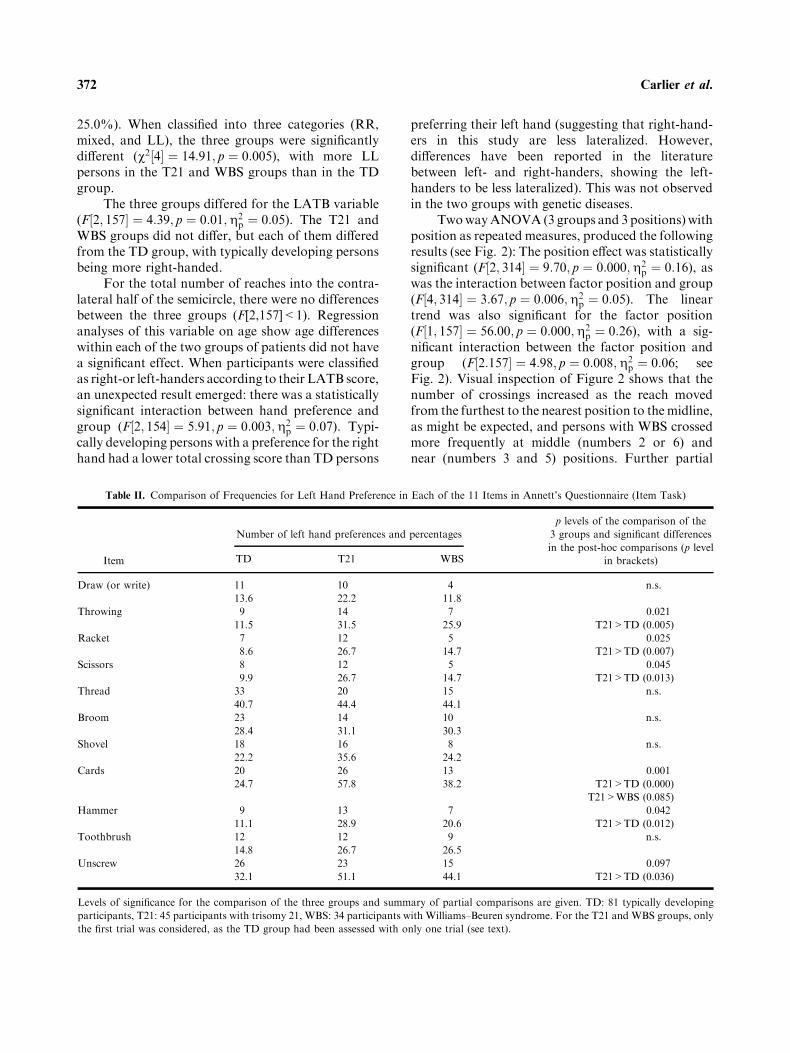
The three groups of participants were statisti-cally significantly different for the proportion of left-handers (v2½2� ¼ 8:94; p ¼ 0:018). The T21 group hada larger proportion of left-handers than the WBSgroup (v2½2� ¼ 4:12; p ¼ 0:042), and the TD group(v2½2� ¼ 6:60; p ¼ 0:01). The WBS group did notdiffer from the TD group (see Table I). The propor-tion of left-handers was very similar in the Frenchand Italian T21 groups (French: 10/33, 30.3%; Ital-ian: 4/12, 33.3%). The number of left-handers in theWBS group was small and, therefore, precluded anystatistical comparison between countries. An analysisof individual items showed that the 3 groups differed(p<0.05) for throwing, racket, scissors, cards andhammer. For each item, the T21 group had a higherproportion of left-hand preferences (p<0.05) anddiffered from the TD group (see Table II).
The proportion of RR, mixed, or LL hand-ers also differed across the three groups(v2½4� ¼ 11:55; p ¼ 0:021). The two groups withgenetic disorders did not differ from one another, butthe T21 group did differ from the TD group(v2½2� ¼ 10:55; p ¼ 0:005). A larger proportion ofmixed-handedness was observed in the T21 group(see Table I).
Variable LQ gave a similar picture: typicallydeveloping persons had a higher laterality quotient(being more right-handed) than persons with T21. TheWBS group had an intermediate score and did notdiffer from either the TD or the T21 group. The degreeof laterality (ABS LQ) differed across the tree groups[Fð2; 157Þ ¼ 7:61; p ¼ 0:001;g2
p ¼ 0:09]. Typicallydeveloping persons were more lateralized than per-sons with T21 and the WBS groups obtained again anintermediate score (see Table I)
The number of hand changes in the two trialsshowed a significant difference between the threegroups [Fð2; 99Þ ¼ 10:33; p ¼ 0:000;g2
p ¼ 0:17]. Thepersons with T21 and WBS recorded a higher numberof hand changes compared to the TD group (seeTable I). Subsequent analyses showed that thefrequencies of changes differed statistically betweenthe three groups of participants for the hammer(v2½2� ¼ 7:54; p ¼ 0:023 – with WBS>T21), andspoon (v2½2� ¼ 1:10; p ¼ 0:006 – with T21>WBS).Additional statistical analyses were performed on theT21 and WBS groups where more changes wererecorded. When these participants were classifiedas right- and left-handers, according to their hand
370 Carlier et al.
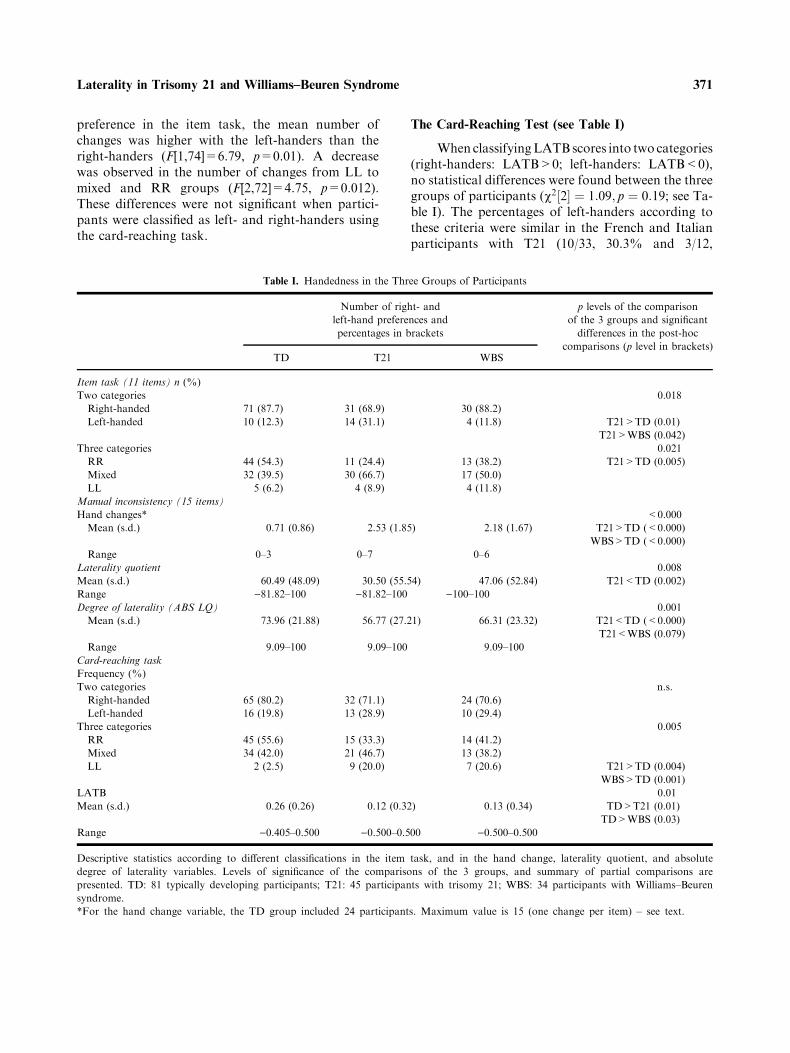
preference in the item task, the mean number ofchanges was higher with the left-handers than theright-handers (F[1,74]=6.79, p=0.01). A decreasewas observed in the number of changes from LL tomixed and RR groups (F[2,72]=4.75, p=0.012).These differences were not significant when partici-pants were classified as left- and right-handers usingthe card-reaching task.
The Card-Reaching Test (see Table I)
When classifyingLATBscores into two categories(right-handers: LATB>0; left-handers: LATB<0),no statistical differences were found between the threegroups of participants (v2½2� ¼ 1:09; p ¼ 0:19; see Ta-ble I). The percentages of left-handers according tothese criteria were similar in the French and Italianparticipants with T21 (10/33, 30.3% and 3/12,
Table I. Handedness in the Three Groups of Participants
Number of right- and
left-hand preferences and
percentages in brackets
p levels of the comparison
of the 3 groups and significant
differences in the post-hoc
comparisons (p level in brackets)TD T21 WBS
Item task (11 items) n (%)
Two categories 0.018
Right-handed 71 (87.7) 31 (68.9) 30 (88.2)
Left-handed 10 (12.3) 14 (31.1) 4 (11.8) T21>TD (0.01)
T21>WBS (0.042)
Three categories 0.021
RR 44 (54.3) 11 (24.4) 13 (38.2) T21>TD (0.005)
Mixed 32 (39.5) 30 (66.7) 17 (50.0)
LL 5 (6.2) 4 (8.9) 4 (11.8)
Manual inconsistency (15 items)
Hand changes* <0.000
Mean (s.d.) 0.71 (0.86) 2.53 (1.85) 2.18 (1.67) T21>TD (<0.000)
WBS>TD (<0.000)
Range 0–3 0–7 0–6
Laterality quotient 0.008
Mean (s.d.) 60.49 (48.09) 30.50 (55.54) 47.06 (52.84) T21<TD (0.002)
Range )81.82–100 )81.82–100 )100–100Degree of laterality (ABS LQ) 0.001
Mean (s.d.) 73.96 (21.88) 56.77 (27.21) 66.31 (23.32) T21<TD (<0.000)
T21<WBS (0.079)
Range 9.09–100 9.09–100 9.09–100
Card-reaching task
Frequency (%)
Two categories n.s.
Right-handed 65 (80.2) 32 (71.1) 24 (70.6)
Left-handed 16 (19.8) 13 (28.9) 10 (29.4)
Three categories 0.005
RR 45 (55.6) 15 (33.3) 14 (41.2)
Mixed 34 (42.0) 21 (46.7) 13 (38.2)
LL 2 (2.5) 9 (20.0) 7 (20.6) T21>TD (0.004)
WBS>TD (0.001)
LATB 0.01
Mean (s.d.) 0.26 (0.26) 0.12 (0.32) 0.13 (0.34) TD>T21 (0.01)
TD>WBS (0.03)
Range )0.405–0.500 )0.500–0.500 )0.500–0.500
Descriptive statistics according to different classifications in the item task, and in the hand change, laterality quotient, and absolute
degree of laterality variables. Levels of significance of the comparisons of the 3 groups, and summary of partial comparisons are
presented. TD: 81 typically developing participants; T21: 45 participants with trisomy 21; WBS: 34 participants with Williams–Beuren
syndrome.
*For the hand change variable, the TD group included 24 participants. Maximum value is 15 (one change per item) – see text.
371Laterality in Trisomy 21 and Williams–Beuren Syndrome
25.0%). When classified into three categories (RR,mixed, and LL), the three groups were significantlydifferent (v2½4� ¼ 14:91; p ¼ 0:005), with more LLpersons in the T21 and WBS groups than in the TDgroup.
The three groups differed for the LATB variable(F½2; 157� ¼ 4:39; p ¼ 0:01;g2
p ¼ 0:05). The T21 andWBS groups did not differ, but each of them differedfrom the TD group, with typically developing personsbeing more right-handed.
For the total number of reaches into the contra-lateral half of the semicircle, there were no differencesbetween the three groups (F[2,157]<1). Regressionanalyses of this variable on age show age differenceswithin each of the two groups of patients did not havea significant effect. When participants were classifiedas right-or left-handers according to their LATB score,an unexpected result emerged: there was a statisticallysignificant interaction between hand preference andgroup (F½2; 154� ¼ 5:91; p ¼ 0:003;g2
p ¼ 0:07). Typi-cally developing persons with a preference for the righthand had a lower total crossing score than TD persons
preferring their left hand (suggesting that right-hand-ers in this study are less lateralized. However,differences have been reported in the literaturebetween left- and right-handers, showing the left-handers to be less lateralized). This was not observedin the two groups with genetic diseases.
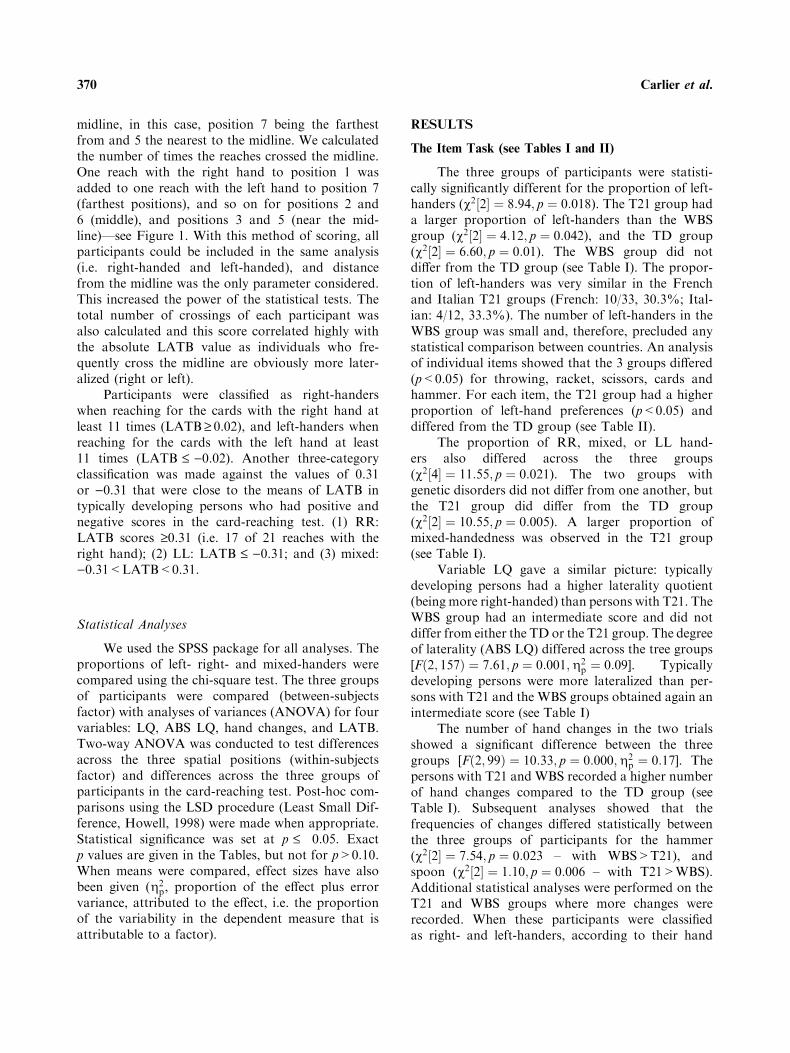
TwowayANOVA (3 groups and 3 positions)withposition as repeated measures, produced the followingresults (see Fig. 2): The position effect was statisticallysignificant (F½2; 314� ¼ 9:70; p ¼ 0:000;g2
p ¼ 0:16), aswas the interaction between factor position and group(F½4; 314� ¼ 3:67; p ¼ 0:006;g2
p ¼ 0:05). The lineartrend was also significant for the factor position(F½1; 157� ¼ 56:00; p ¼ 0:000;g2
p ¼ 0:26), with a sig-nificant interaction between the factor position andgroup (F½2:157� ¼ 4:98; p ¼ 0:008;g2
p ¼ 0:06; seeFig. 2). Visual inspection of Figure 2 shows that thenumber of crossings increased as the reach movedfrom the furthest to the nearest position to themidline,as might be expected, and persons with WBS crossedmore frequently at middle (numbers 2 or 6) andnear (numbers 3 and 5) positions. Further partial
Table II. Comparison of Frequencies for Left Hand Preference in Each of the 11 Items in Annett’s Questionnaire (Item Task)
Item
Number of left hand preferences and percentages
p levels of the comparison of the
3 groups and significant differences
in the post-hoc comparisons (p level
in brackets)TD T21 WBS
Draw (or write) 11 10 4 n.s.
13.6 22.2 11.8
Throwing 9 14 7 0.021
11.5 31.5 25.9 T21>TD (0.005)
Racket 7 12 5 0.025
8.6 26.7 14.7 T21>TD (0.007)
Scissors 8 12 5 0.045
9.9 26.7 14.7 T21>TD (0.013)
Thread 33 20 15 n.s.
40.7 44.4 44.1
Broom 23 14 10 n.s.
28.4 31.1 30.3
Shovel 18 16 8 n.s.
22.2 35.6 24.2
Cards 20 26 13 0.001
24.7 57.8 38.2 T21>TD (0.000)
T21>WBS (0.085)
Hammer 9 13 7 0.042
11.1 28.9 20.6 T21>TD (0.012)
Toothbrush 12 12 9 n.s.
14.8 26.7 26.5
Unscrew 26 23 15 0.097
32.1 51.1 44.1 T21>TD (0.036)
Levels of significance for the comparison of the three groups and summary of partial comparisons are given. TD: 81 typically developing
participants, T21: 45 participants with trisomy 21, WBS: 34 participants with Williams–Beuren syndrome. For the T21 and WBS groups, only
the first trial was considered, as the TD group had been assessed with only one trial (see text).
372 Carlier et al.
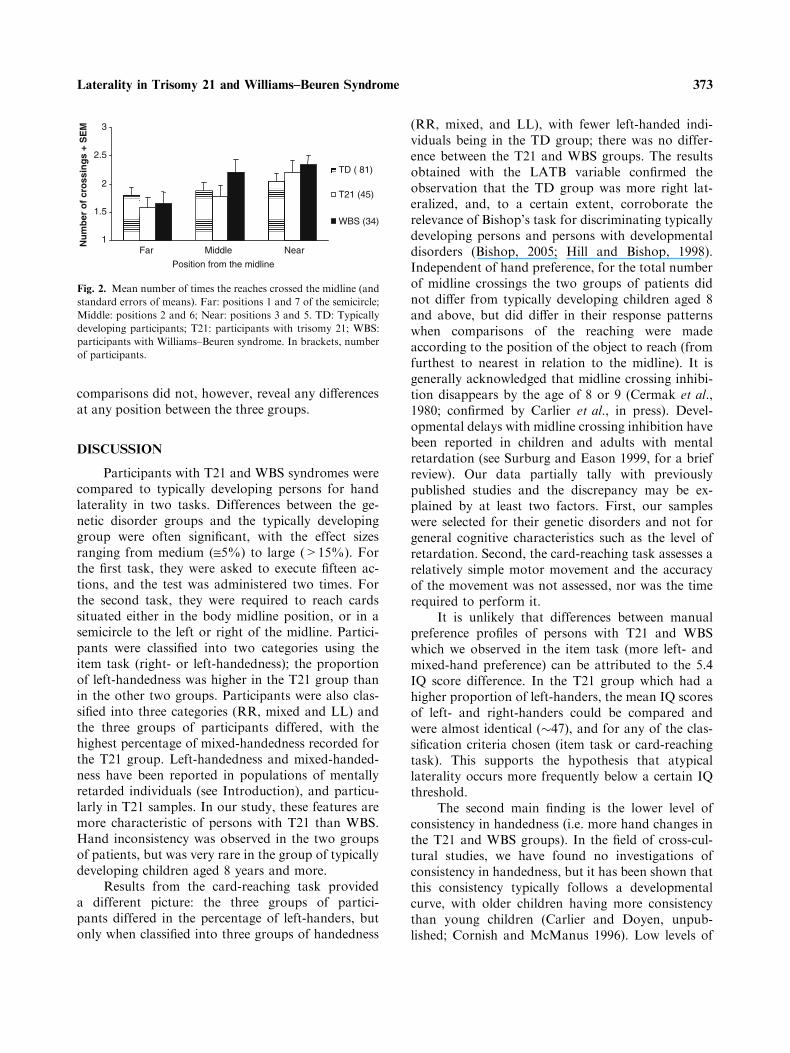
comparisons did not, however, reveal any differencesat any position between the three groups.
DISCUSSION
Participants with T21 and WBS syndromes werecompared to typically developing persons for handlaterality in two tasks. Differences between the ge-netic disorder groups and the typically developinggroup were often significant, with the effect sizesranging from medium (@5%) to large (>15%). Forthe first task, they were asked to execute fifteen ac-tions, and the test was administered two times. Forthe second task, they were required to reach cardssituated either in the body midline position, or in asemicircle to the left or right of the midline. Partici-pants were classified into two categories using theitem task (right- or left-handedness); the proportionof left-handedness was higher in the T21 group thanin the other two groups. Participants were also clas-sified into three categories (RR, mixed and LL) andthe three groups of participants differed, with thehighest percentage of mixed-handedness recorded forthe T21 group. Left-handedness and mixed-handed-ness have been reported in populations of mentallyretarded individuals (see Introduction), and particu-larly in T21 samples. In our study, these features aremore characteristic of persons with T21 than WBS.Hand inconsistency was observed in the two groupsof patients, but was very rare in the group of typicallydeveloping children aged 8 years and more.
Results from the card-reaching task provideda different picture: the three groups of partici-pants differed in the percentage of left-handers, butonly when classified into three groups of handedness
(RR, mixed, and LL), with fewer left-handed indi-viduals being in the TD group; there was no differ-ence between the T21 and WBS groups. The resultsobtained with the LATB variable confirmed theobservation that the TD group was more right lat-eralized, and, to a certain extent, corroborate therelevance of Bishop’s task for discriminating typicallydeveloping persons and persons with developmentaldisorders (Bishop, 2005; Hill and Bishop, 1998).Independent of hand preference, for the total numberof midline crossings the two groups of patients didnot differ from typically developing children aged 8and above, but did differ in their response patternswhen comparisons of the reaching were madeaccording to the position of the object to reach (fromfurthest to nearest in relation to the midline). It isgenerally acknowledged that midline crossing inhibi-tion disappears by the age of 8 or 9 (Cermak et al.,1980; confirmed by Carlier et al., in press). Devel-opmental delays with midline crossing inhibition havebeen reported in children and adults with mentalretardation (see Surburg and Eason 1999, for a briefreview). Our data partially tally with previouslypublished studies and the discrepancy may be ex-plained by at least two factors. First, our sampleswere selected for their genetic disorders and not forgeneral cognitive characteristics such as the level ofretardation. Second, the card-reaching task assesses arelatively simple motor movement and the accuracyof the movement was not assessed, nor was the timerequired to perform it.
It is unlikely that differences between manualpreference profiles of persons with T21 and WBSwhich we observed in the item task (more left- andmixed-hand preference) can be attributed to the 5.4IQ score difference. In the T21 group which had ahigher proportion of left-handers, the mean IQ scoresof left- and right-handers could be compared andwere almost identical (�47), and for any of the clas-sification criteria chosen (item task or card-reachingtask). This supports the hypothesis that atypicallaterality occurs more frequently below a certain IQthreshold.
The second main finding is the lower level ofconsistency in handedness (i.e. more hand changes inthe T21 and WBS groups). In the field of cross-cul-tural studies, we have found no investigations ofconsistency in handedness, but it has been shown thatthis consistency typically follows a developmentalcurve, with older children having more consistencythan young children (Carlier and Doyen, unpub-lished; Cornish and McManus 1996). Low levels of
1
1.5
2
2.5
3
Far Middle Near
Position from the midline
Nu
mb
er o
f cr
oss
ing
s +
SE
M
TD ( 81)
T21 (45)
WBS (34)
Fig. 2. Mean number of times the reaches crossed the midline (and
standard errors of means). Far: positions 1 and 7 of the semicircle;
Middle: positions 2 and 6; Near: positions 3 and 5. TD: Typically
developing participants; T21: participants with trisomy 21; WBS:
participants with Williams–Beuren syndrome. In brackets, number
of participants.
373Laterality in Trisomy 21 and Williams–Beuren Syndrome
consistency in handedness have been reported inadults with severe and profound mental retardation(Soper et al., 1987), and in children with autism andlearning disabilities (Cornish and McManus, 1996).Is this inconsistent handedness a pathological sub-type of handedness found only in ‘‘clinical’’ popula-tions, as proposed by Soper et al. (1987), or is itlinked to motor immaturity, as suggested by Bishop(1990)? With T21 and WBS populations, eitherhypothesis could apply.
One limitation of our study was the heteroge-neous origin of the participants, living in three dif-ferent countries. Geographical variations in humanhandedness have been reported, with differences inthe prevalence of left-handers in certain countrieswhich may be due to differential culture pressures oncertain tasks (Fagard and Dahmen, 2004; Mandalet al., 1999; Perelle and Ehrman, 1994; Raymond andPontier, 2004; Salmaso and Longoni, 1985). If verylarge variations are found between Italy, France andthe US, our data may be biased. It is impossible toestablish the absolute percentage of left-handers in agiven population, but published data suggest that theproportion of left-handers in the USA is about 10%,although this may be a slight underestimate (Gilbertand Wysocki, 1992; Medland et al., 2004; Perelle,2005, personal communication; Perelle and Ehrman,1994). The percentage may be lower in Italian com-munities (about 8%, Viggiano et al., 2001). In typi-cally developing children studied here, we found12.3% left-handers, a figure similar to the prevalencefor the US participants, but which may be high fortypically developing Italian children. The possibilityof not detecting a significant difference between thegroups with genetic diseases and the typically devel-oping individuals may be increased by this, but itdoes not affect the possibility of detecting a falselysignificant difference. We are therefore safe in con-cluding that the percentage of left-handers was higherin the T21 group, as there was a similar proportion ofleft-handers for the Italian and French participants.
A second limitation is that body lateralities,other than manual laterality (foot, eye, and ear), werenot evaluated. This aspect of our research is currentlyunder way with a larger sample of persons with T21and typically developing individuals.
A third limitation is that the individuals were notstudied developmentally. We do not know howmanual laterality evolves in children with T21 andWBS. Given the rarity of Williams–Beuren syn-drome, it is difficult to collect developmental data on
this population; it may be easier to investigate T21children from this perspective.
We have presented the initial data on manuallaterality in persons with Williams–Beuren syndrome.Atypical manual laterality seems to occur morefrequently among individuals with trisomy 21 andWilliams–Beuren syndrome, compared to typicallydeveloping individuals. However, manual laterality isnot the same for the two genetic diseases. The rela-tionship often quoted in the literature between left- ormixed-handedness and mental retardation is proba-bly more complex than previously thought, and moredata covering other genetic diseases should becollected to distinguish between non-syndromic andsyndromic atypical laterality. The differences betweenthe two groups of patients, both presenting mentalretardation, suggest that atypical laterality does notresult from ‘‘amplified development instability’’(Antonarakis et al., 2004) but from dosage effect:atypical laterality could be due to genes carriedby HSA 21 (Roubertoux et al., 2005), and HSA7,among others.
ACKNOWLEDGMENTS
This research project was supported by theFondation Jerome Lejeune, the University of Prov-ence, the University Institute of France, FIRB/MIUR ‘‘Action and Perception in the construction ofthe cognitive world’’ (RBNE01SZB4), ESF EURO-CORES program ‘‘The Origin of Man, Languageand Languages’’ (Italy). In Italy the research wasconducted through the special agreement betweenISTC-CNR, the Italian Williams Syndrome Associ-ation and ASL No. 8, Regione Sardegna. We wish toexpress our gratitude to all the participants in thestudy and their families, and to Samantha Bellucciand Francoise Betourne for their help in the assess-ment of the participants. We wish to thank theInstitut Jerome Lejeune (France) for the supportprovided and in particular Dr. Henri Blehaut.
REFERENCES
Annett, M. (1970). The growth of manual preference and speed Br.J. Psychol. 61(4):545–548.
Annett, M. (2002). Handedness and Brain Asymmetry. The RightShift Theory. Hove UK: Psychology Press.
Antonarakis, S. E., Dermitzakis, E. T., Reymond, A., and Deutsch,S. (2004). Chromosome 21 and down syndrome: fromgenomics to pathophysiology Nat. Rev. Genet. 5:725–738.
374 Carlier et al.
Batheja, M., and McManus, I. C. (1985). Handedness in mentallydisabled Dev. Med. Child Neurol. 27:63–68.
Bellugi, U., Lichtenberger, L., Mills, D., Galaburda, A., andKorenberg, J. R. (1999). Bridging cognition, the brain andmolecular genetics: evidence from Williams syndrome TrendsNeurosc. 22:197–207.
Bishop, D. V. M. (1990). Handedness and Developmental Disorder.Hove: Lawrence Erlbaum.
Bishop, D. V. (2005). Handedness and specific language impair-ment: a study of 6-year-old twins Dev. Psychobiol. 4:362–369.
Bishop, D. V. M., Ross, V., Daniels, M. S., and Bright, P. (1996).The measurement of hand preference. A validation studycomparing three groups of right-handers Br. J. Psychol.87:269–285.
Bradshaw-McAnulty, G., Hicks, R. E., and Kinsbourne, M.(1984). Pathological left-handedness and familial sinistrality inrelation to degree of mental retardation Brain Cognit. 3:349–356.
Calvert, G. A., and Bishop, D. V. M. (1998). Quantifying handpreference using a behavioural continuum Laterality 3:255–268.
Carlier, M., Doyen, A. L., and Lamard, C. (in press). Midlinecrossing: developmental trend from 3 to 10 years of age in apreferential card-reaching task. Brain Cognit.
Carlier, M., Dumont, A.-M., Beau, J., and Michel, F. (1993a).Hand performance of French children on a finger-tapping testin relation to handedness, sex, and age Percep. Mot. Skills76:931–940.
Carlier, M., Duyme, M., Capron, C., Dumont, A.-M., and Perez-Diaz, F. (1993b). Is a dot-filling group test a good tool forassessing manual performance in children? Neuropsychologia31:233–240.
Cermak, S. A., Quintero, E. J., and Cohen, P. M. (1980). Devel-opmental age trends in crossing the body midline in normalchildren Am. J. Occupational Therapy 34:313–319.
Cornish, K. M., and McManus, I. C. (1996). Hand preference andhand skill in children with autism J. Autism Develop. Dis.26:597–609.
Cornish, K. M., Pigram, J., and Shaw, K. (1997). Do anomalies ofhandedness exist in children with fragile-X syndrome? Later-ality 2:91–101.
Curt, F., Mesbah, J., Lellouch, J., and Delatollas, G. (1997).Handedness scale: how many and which item Laterality 2:137–154.
Delatollas, G., De Agostini, M., Jallon, P., Poncet, M., Rey, M.,and Lellouch, J. (1988). Mesure de la preference manuelle parautoquestionnaire dans la population francaise adulte Rev.Psycho. Appl. 38:117–136.
Devenny, D. A., and Silverman, W. P. (1990). Speech dysfluencyand manual specialization in Down’s syndrome J. Ment. Def.Res. 34:253–260.
Dolfuss, S., Buijrogge, J. A., Benali, K., Delamillieure, P., andBrazo, P. (2002). Sinistrality in subtypes of schizophrenia Eur.Psychiat. 17:272–277.
Doyen, A.- L. (2000). Etude de la lateralite manuelle: aspectscomportementaux, ressemblance familiale, hypothese gene-tique. These de doctorat de l’Universite Paris 6
Doyen, A.-L., Duquenne, V., Nuques, S., and Carlier, M. (2001).What can be learned from a lattice analysis of a lateralityquestionnaire? Behav. Genet. 31:193–207.
Doyen, A.-L., and Carlier, M. (2002). Measuring Handedness: avalidation study of the Bishop’s Card-reaching test Laterality7:115–130.
Erlenmeyer-Kimling, L., Hans, S., Ingraham, L., Marcus, J.,Wynne, E., Rehman, A., Roberts, S. A., and Auerbach, J.(2005). Handedness in children of schizophrenic patients: datafrom three high-risk studies Behav. Genet. 35:351–358.
Fagard, J. (2004). Droitiers/gauchers: des asymetries dans tous lessens. Marseille: Solal.
Fagard, J., and Dahmen, R. (2004). Cultural differences on thedevelopment of lateral preferences: a comparison betweenFrench and Tunisian children Laterality 9:61–78.
Gilbert, A., and Wysocki, C. J. (1992). Hand preference and age inthe United States Neuropsychologia 30:601–608.
Hill, E. L., and Bishop, D. V. M. (1998). A card-reaching testreveals weak hand preference in specific language impairmentand developmental co-ordination disorder Laterality 3:295–310.
Howell, D. C. (1998). Methodes statistiques en sciences humaines.De Boeck: Paris, Bruxelles. Translated from StatisticalMethods for Psychology, (4th ed.), 1997.
Jernigan, T. L., Bellugi, U., Sowell, E., Doherty, S., and Hesselink,J. R. (1993). Cerebral morphological distinctions betweenWilliams and Down syndromes Arch. Neurol. 50:186–191.
Jones, W., Hesselink, J., Courchesne, E., Duncan, T., Matsuda, K.,and Bellugi, U. (2002). Cerebellar abnormalities in infants andtoddlers with Williams syndrome Dev. Med. Child Neurol.44:688–694.
Klein, B. P., and Mervis, C. B. (1999). Contrasting patterns ofcognitive abilities of 9- and 10-year old with Williams Syn-drome or Down syndrome Dev. Neuropsychol. 16:177–196.
Lejeune, J. (1990). Pathogenesis of mental deficiency in Trisomy 21Am. J. Hum. Genet. Suppl. 7:20–30.
Lewin, J., Kohen, D., and Mathew, G. (1993). Handedness inmental handicap: investigation into population of Down’ssyndrome, epilepsy and autism Br. J. Psychiat. 163:674–676.
Lucas, J. A., Rosenstein, L. D., and Bigler, E. (1989). Handednessand language among the mentally retarded: implication for themodel of pathological left-handedness and gender differencesin hemispheric specialization Neuropsychologia 27:713–723.
Mandal, K., Ida, Y., Harizuka, S., and Upadhaya, N. (1999).Cultural difference in hand preference: evidence form Indaiand Japon Int. J. Psychol. 34:59–66.
McManus, I. C., and Cornish, K. M. (1997). Fractioning hand-edness in mental retardation: what is the role of the cerebel-lum? Laterality 2:81–90.
Mari, A., Amati, F., Mingarellli, R., Giannotti, A., Sebastio, G.,Collorio, V., Novelli, G., and Dallapicola, B. (1995). Analysisof the elastin gene in 60 patients with clinical diagnosis ofWilliams Syndrome Hum. Genet. 96:444–448.
Medland, S. E., Perelle, I., De Monte, V., and Ehrman, L. (2004).Effects of culture, sex, and age on the distribution of hand-edness: an evaluation of the sensitivity of three measures ofhandedness Laterality 9:287–297.
Mervis, C. B., Robinson, B. F., Bertrand, J., Morris, C. A., Klein-Tasman, B. P., and Armstrong, S. C. (2000). The WilliamsSyndrome Cognitive Profile Brain Cognit. 44:604–628.
Oldfield, R. C. (1971). The assessment and analysis of handedness:the Edinburgh inventory Neuropsychologia 9:97–113.
Peters, M. (1992). How sensitive are handedness prevalence figuresto differences in handedness classification procedures ? BrainCognit. 18:208–215.
Peters, M., and Murphy, K. (1993). Factor analyses of pooled handquestionnaire data are of questionable value Cortex 29:305–14.
Perelle, I. B., and Ehman, L. (1994). An international study ofhuman handedness Behav. Genet. 24:217–227.
Pipe, M.-E. (1987). Pathological left-handedness: is it familial?Neuropsychologia 25:571–577.
Pipe, M.-E. (1988). Atypical laterality and retardation Psychol.Bull. 104:343–347.
Raymond, M., and Pontier, D. (2004). Is there geographical vari-ation in human handedness? Laterality 9:35–51.
Roubertoux, P. L., Bichler, Z., Pinoteau, W., Seregaza, Z.,Fortes, S., Jamon, M., Smith, D. J., Rubin, E., Migliore-Samour, S., and Carlier, M. (2005). Functional analysis ofgenes implicated in Down syndrome: 2. Laterality andcorpus callosum size in mice transpolygenic for Down
375Laterality in Trisomy 21 and Williams–Beuren Syndrome
syndrome chromosomal region-1 (DCR-1) Behav. Genet.35:333–341.
Salmaso, D., and Longoni, A. M. (1985). Problems in the assess-ment of hand preference Cortex 21:533–549.
Schiffman, J., Pestle, S., Mednick, S., Elstrom, M., Sorensen, H.,and Mednick, S. (2005). Childhood laterality and adultschizophrenia spectrum disorders: a prospective investigationSchizophrenia Res. 72:151–160.
Schmitt, J. E., Eliez, S., Warsofsky, I. S., Bellugi, U., and Reiss,A.L. (2001). Corpus callosum morphology of Williamssyndrome: relation to genetics and behaviour Develop. Med.Child Neurol. 43:155–159.
Soper, H. V., Salts, P., Orsini, D. L., Van Gorp, W. G., and Green,M. F. (1987). Handedness distribution in a residential popu-lation with severe or profound mental retardation Am J. Ment.Defic. 92:94–102.
Stenhuis, R. H., and Bryden, M. P. (1989). Different dimensions ofhand preference that relate to skilled and unskilled activitiesCortex 25:289–304.
Surburg, P. R., and Eason, B. (1999). Midline-crossing inhibition:an indicator of development delay Laterality 4:333–343.
Teipel, S. J., and Hampel, H. (2006). Neuroanatomy of Downsyndrome in vivo: a model of preclinical Alzheimer disease.Behav. Genet., in press.
Tomaiuolo, F., Di Paola, M., Caravale, B., Vicari, S., Petrides, M.,and Caltagirone, C. (2002). Morphology and morphometry ofthe corpus callosum in Williams syndrome: a TI-weightedMRI study NeuroReport 13:2281–2284.
Umansky, R., Watson, J. S., Colvin, L., Fyfe, S., Leonard, S., deKlerk, N., and Leonard, H. (2003). Hand preference, extent oflaterality, and functional hand use in Rett syndrome J. ChildNeurol. 18:481–487.
Vicari, S. (2006). Motor development and neuropsychological pat-terns in persons with Down Syndrome. Behav. Genet., in press.
Vicari, S., Caselli, M. C., Gagliardi, C., Tonucci, F., and Volterra,V. (2002). Langage acquisition in special populations: acomparison between Down and Williams syndrome Neuro-psychologia 40:2461–2470.
Viggiano,M. P., Borelli, P., Vannucci,M., andRocchetti, G. (2001).Hand preference in Italian student Laterality 6:283–286.
Vlachos, F. M., and Karapetsas, F. M. (1999). A developmentalstudy of handedness in Down syndrome pupils Percep. Mot.Skills 88:427–428.
Edited by Pierre L. Roubertoux
376 Carlier et al.
Related Documents