"LATERAL TYRE FORCES ON OFF-ROAD SURFACES" by ARAFA SAYED AHMED EL-RAZAZ - I, - B. Sc. & M. Sc. Mech. Eng. A Thesis submitted to the University of Leeds in fulfillment of the requirements for the Degree of Doctor of Philosophy DepartmentOf Mechanical Engineering The University Of Leeds September 1988

Welcome message from author
This document is posted to help you gain knowledge. Please leave a comment to let me know what you think about it! Share it to your friends and learn new things together.
Transcript
"LATERAL TYRE FORCES ON OFF-ROAD SURFACES"
by
ARAFA SAYED AHMED EL-RAZAZ - I, -
B. Sc. & M. Sc. Mech. Eng.
A Thesis submitted to the University of Leeds
in fulfillment of the requirements for the
Degree of Doctor of Philosophy
Department Of Mechanical Engineering
The University Of Leeds
September 1988
SYNOPSIS
A successful model for off-road tyres must be reliable, efficient and capable of
reproducing and predicting the main system phenomena. Mathematical models are
proposed for longitudinal, lateral and combined lateral and longitudinal force
generation characteristics of off-road tyres.
For a better understanding of off-road tyre behaviour, the study of the interaction
between the tyre forces and those generated by the deformed soil is very important.
Details of the force system in the contact patch, therefore, are used as a basis for
developing models for the prediction of the tractive performance and comering
characteristics of off-road tyres.
Previous work of the relevant literature pertaining to tyre behaviour is reviewed
to provide the reader with background information on off-road tyre characteristics.
Various models for off-road tyres of differing degrees of complexity but which
all incorporate the key features of off-road tyre problems are then developed.
Previous methods of analysing the combined lateral and longitudinal forces
generated by off-road tyres on deformable surfaces are investigated. A modified
version of a previous model is then proposed which is based on a different and
original method foz investigating tyre behaviour in the contact region. An entirely
new model is then developed which is based on a modification of the "multi-spoke"
tyre model used for road vehicle studies. Predicted results are compared with those
obtained from other models and with reported experimental data.
The usefulness of such models is in problems involving the steering, braking and handling behaviour of off-road vehicles. Hence, the models are formulated so that
they can be applied to such vehicle problems by enabling lateral and longitudinal
forces on the tyre to be predicted from any combined conditions of wheelslip,
wheelskid and slip angle.
The proposed models provide an improved qualitative description of behaviour
in the contact region. Although slightly more complex than previous models, the
computational load is nevertheless sufficiently small that the tyre models can
conveniently be incorporated in off-road vehicle handling models.
Suggestions for future recommendations are discussed with particular reference
to improving the predictive models and for a possible extension of the study to
generate more detailed practical results for tyre. forces under controlled experimental
conditions.
ACKNOWLEDGEMENTS
I wish to express my deep gratitude to Dr. CROLLA D. A. for his invaluable
advice and guidance throughout this research. The considerate and thorough way in
which he supervised this research work is much appreciated.
I would also like to express my deep gratitude and thanks to the
MISR GOVERNMENT (ARAB REPUBLIC OF EGYPT) who made this scholarship
available and financially supported me throughout the period of this study.
The author wishes to acknowledge, with gratitude, all the academic staff of the
Mechanical Engineering Department at Leeds University who have offered help by
any means, in particular Mr. SHARP R. S. for his helpful discussion and readiness to
offer assistance.
Many thanks to Mr. Hockley, C. who assisted in reading the manuscript and
making helpful suggestions.
The Author also acknowledges with thanks for discussions with Dr. SINGH G.
Staff at Civil Engineering Department, University of Leeds.
Finally, I offer my deepest personal thanks to my wife , my sons Kareem and Moamen and my family for their patience, support of writing this thesis.
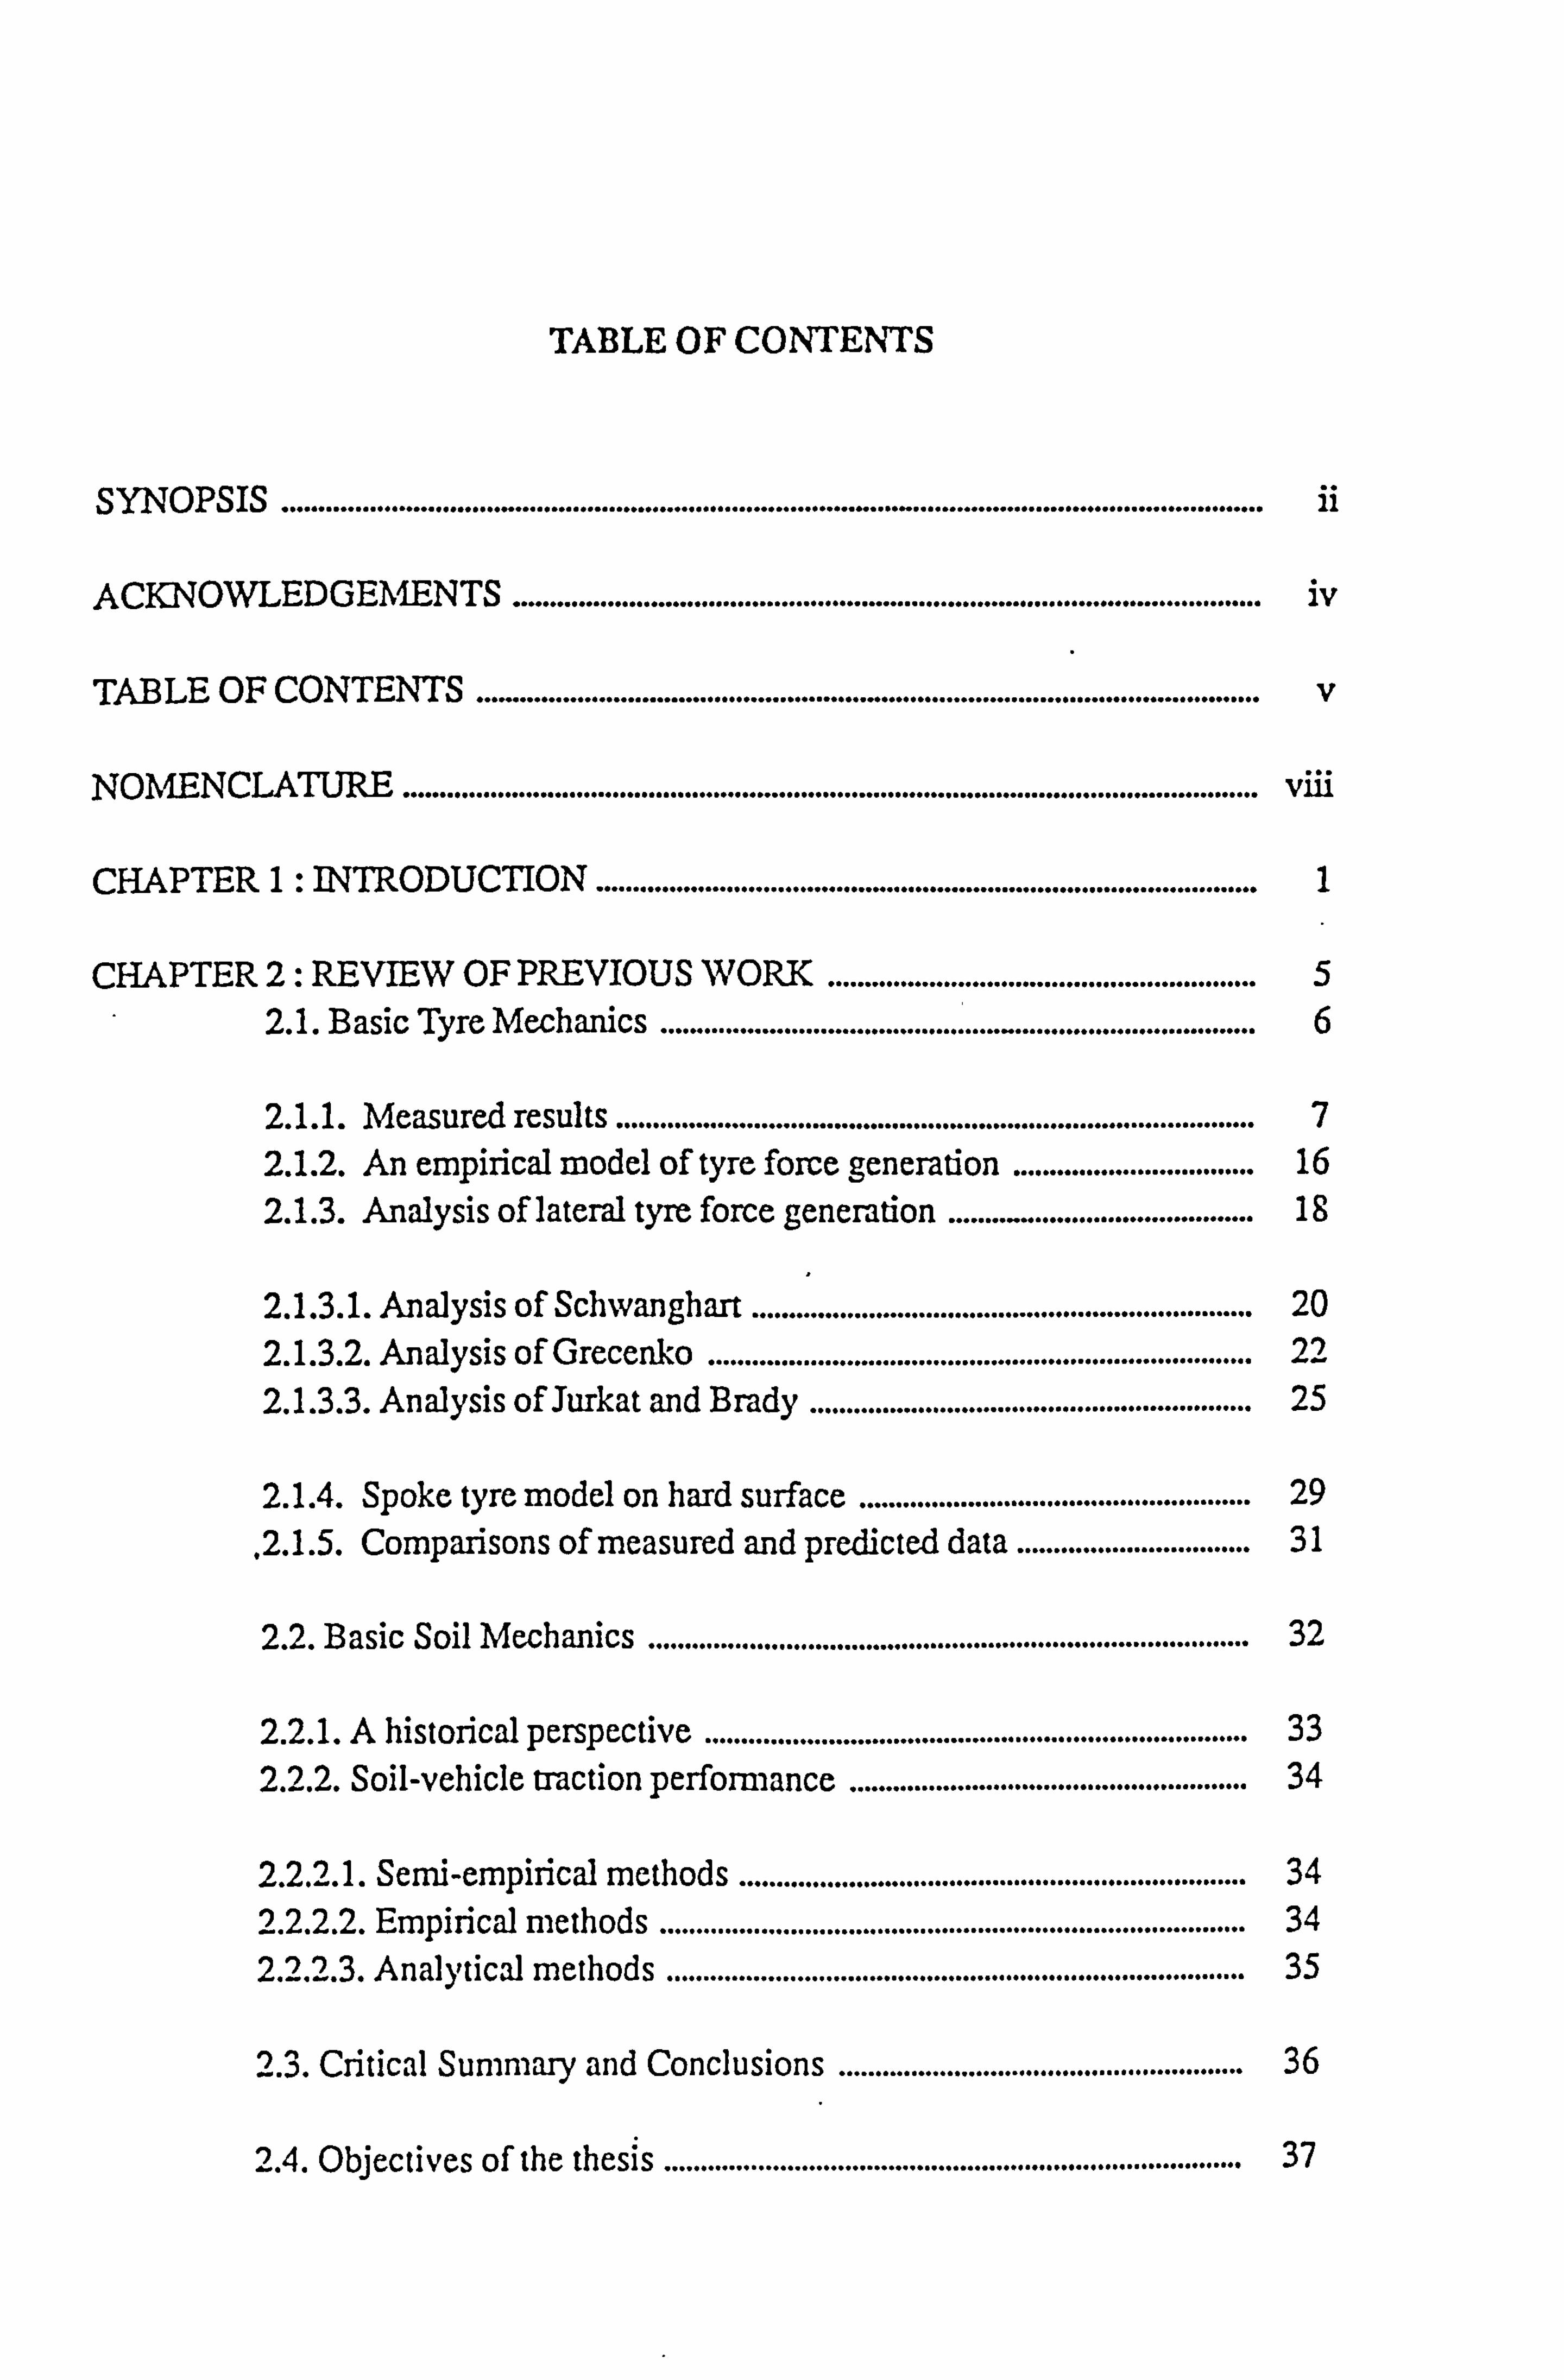
TABLE OF CONTENTS
SYNOPSIS .............................. . ..................................................... ................................................. ii
ACKNOWLEDGEMENTS ....................................................................................................... iv
TABLE OF CONTENTS ............................................................................................................
NOMENCLATURE ...................................................................................................................... viii
CHAPTER 1: INTRODUCTION ...........................................................................................
CHAPTER 2: REVIEW OF PREVIOUS WORK ........................................................... 5 2.1. Basic Tyre Mechanics ............................................... . .................................
6
2.1.1. Measured results ........................................................................................ 7 2.1.2. An empirical model of tYre force generation ................................. 16 2.1.3. Analysis of lateral tyre force generation ........ ................................. 18
2.1.3.1. Analysis of Schwanghart: ........ ********'******"""**********"**'***********"***'******'* 20 2.1.3.2. Analysis of Grecenk-o ........................................................................... 22 2.1.3.3. Analysis of Jurkat and Brady .............................................................
25
2.1.4. Spoke tyre model on hard surface ...................................................... 29
. 2.1.5. Comparisons of measured and predicted data ................................ 31
2.2. Basic Soil Mechanics ................................................................................... 32
2.2.1. A historical perspective ........................................................................... 33
2.2.2. Soil-vehicle traction perfomiance ....................................................... 34
2.2.2.1. Sen-ý-empirical methods ...................................................................... 34
2.2.2.2. Empirical methods ................................................................................. 34
2.2.2.3. Analytical methods ................................................................................ 35
2.33. Oitical Surnmaq and Conclusions ........................................................ 36
2.4. Objectives of the thesis ................................................................................ 37
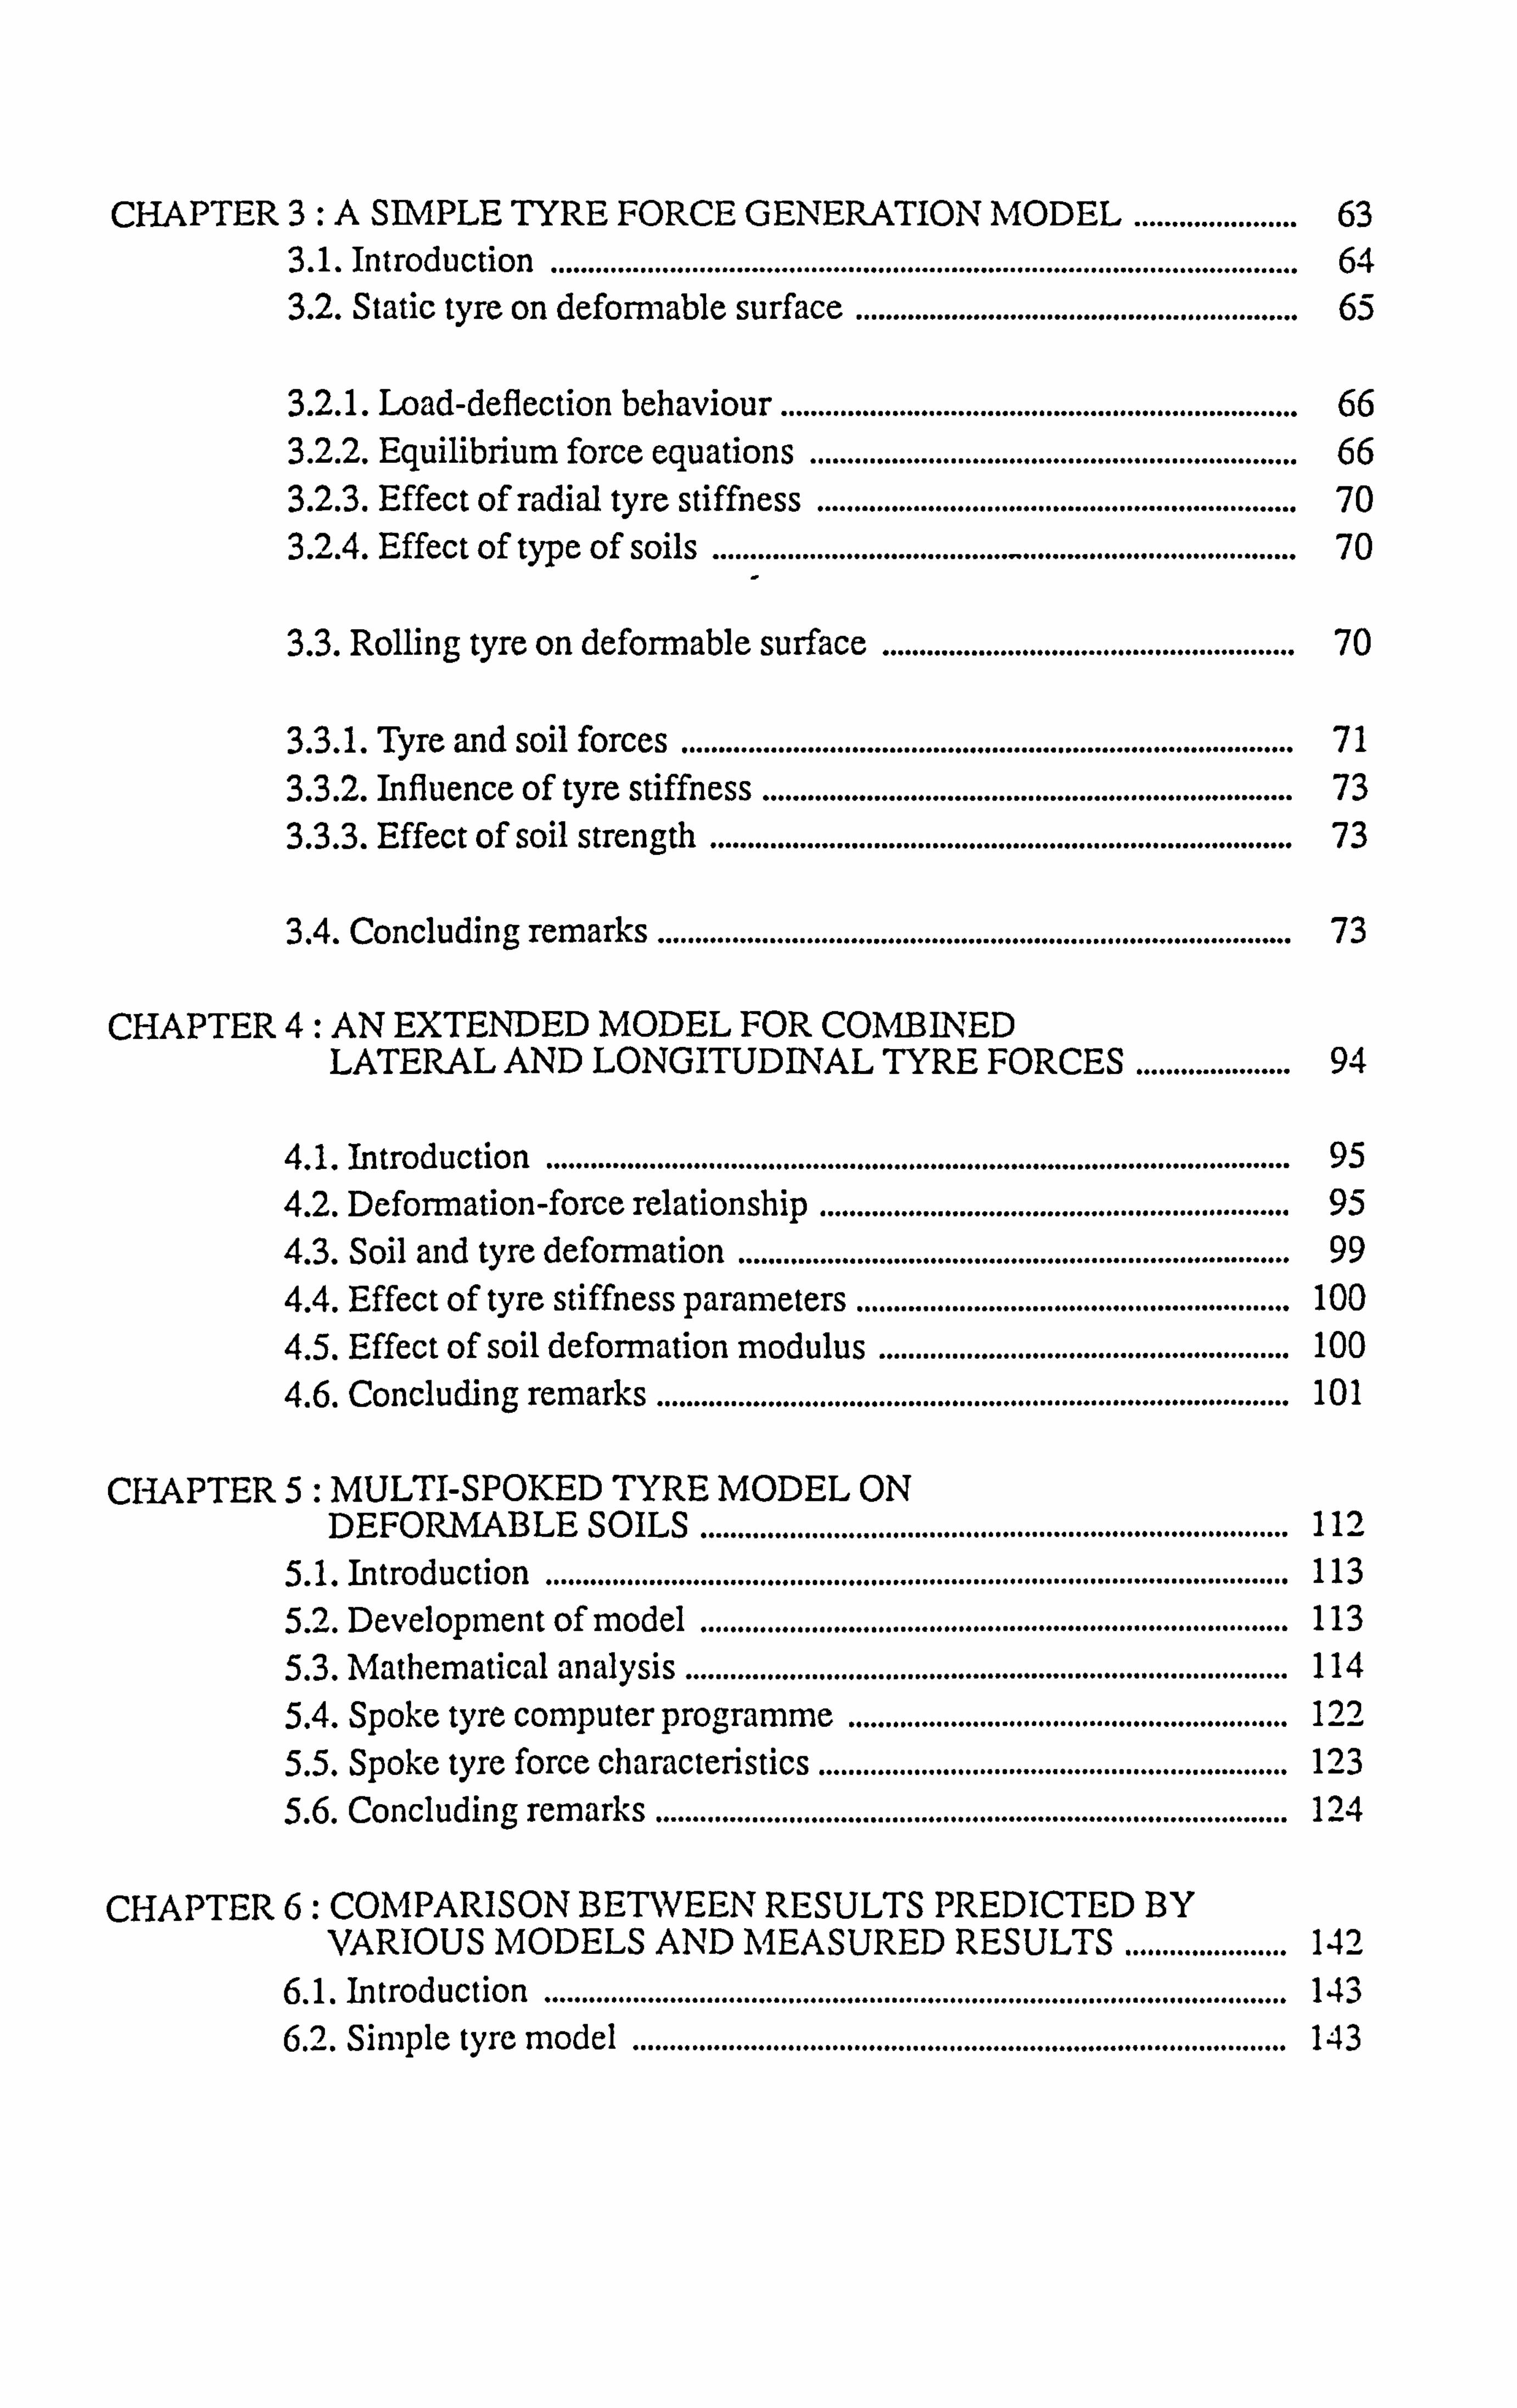
CHAPTER 3: A SIMPLE TYRE FORCE GENERATION MODEL ...................... 63
3.1. Introduction ..................................................................................................... 64 3.2. Static tyre on deforrnable surface ............................................................
65
3.2.1. Load-deflection behaviour ...................................................................... 66 3.2.2. Equilibrium force equations .................................................................. 66 3.2.3. Effect of radial tyre stiffness ................................................................. 70 3.2.4. Effect of type of soils ........................................ . ..................................... 70
3.3. Rolling tyre on deformable surface ........................................................ 70
3.3.1. Tyre and soil forces ................................................................................... 71
3.3.2. Influence of tyre stiffness ........................................................................ 73 3.3.3. Effect of soil strength ............................................................................... 73
3.4. Concluding remarks ...................................................................................... 73
CHAPTER 4: AN EXTENDED MODEL FOR COMBINED LATERAL AND LONGITUDINTAL TYRE FORCES ..................... 94
4.1. Introduction ..................................................................................................... 95 4.2. Deformation-force relationship ................................................................ 95 4.3. Soil and tyre deformation ........................................................................... 99 4.4. Effect of tyre stiffness parameters ........................................................... 100 4.5. Effect of soil deformation modulus ........................................................ 100 4.6. Concluding remarks ...................................................................................... 101
CHAPTER 5: MULTI-SPOKED TYRE MODEL ON DEFORMABLE SOILS ................................................................................ 112
5.1. Introduction ..................................................................................................... 113 5.2. Development of model ................................................................................ 113 5.3. Mathematical analysis .................................................................................. 114 5.4. Spoke tyre computer programme ............................................................ 122 5.5. Spoke tyre force characteristics ................................................................ 123 5.6. Concluding remarks ...................................................................................... 124
CHAPTER 6: COMPARISON BETWEEN RESULTS PREDICTED BY VARIOUS MODELS AND MEASURED RESULTS ...................... 142
6.1. Introduction ..................................................................................................... 143 6.2. Simple tyre model ......................................................................................... 143
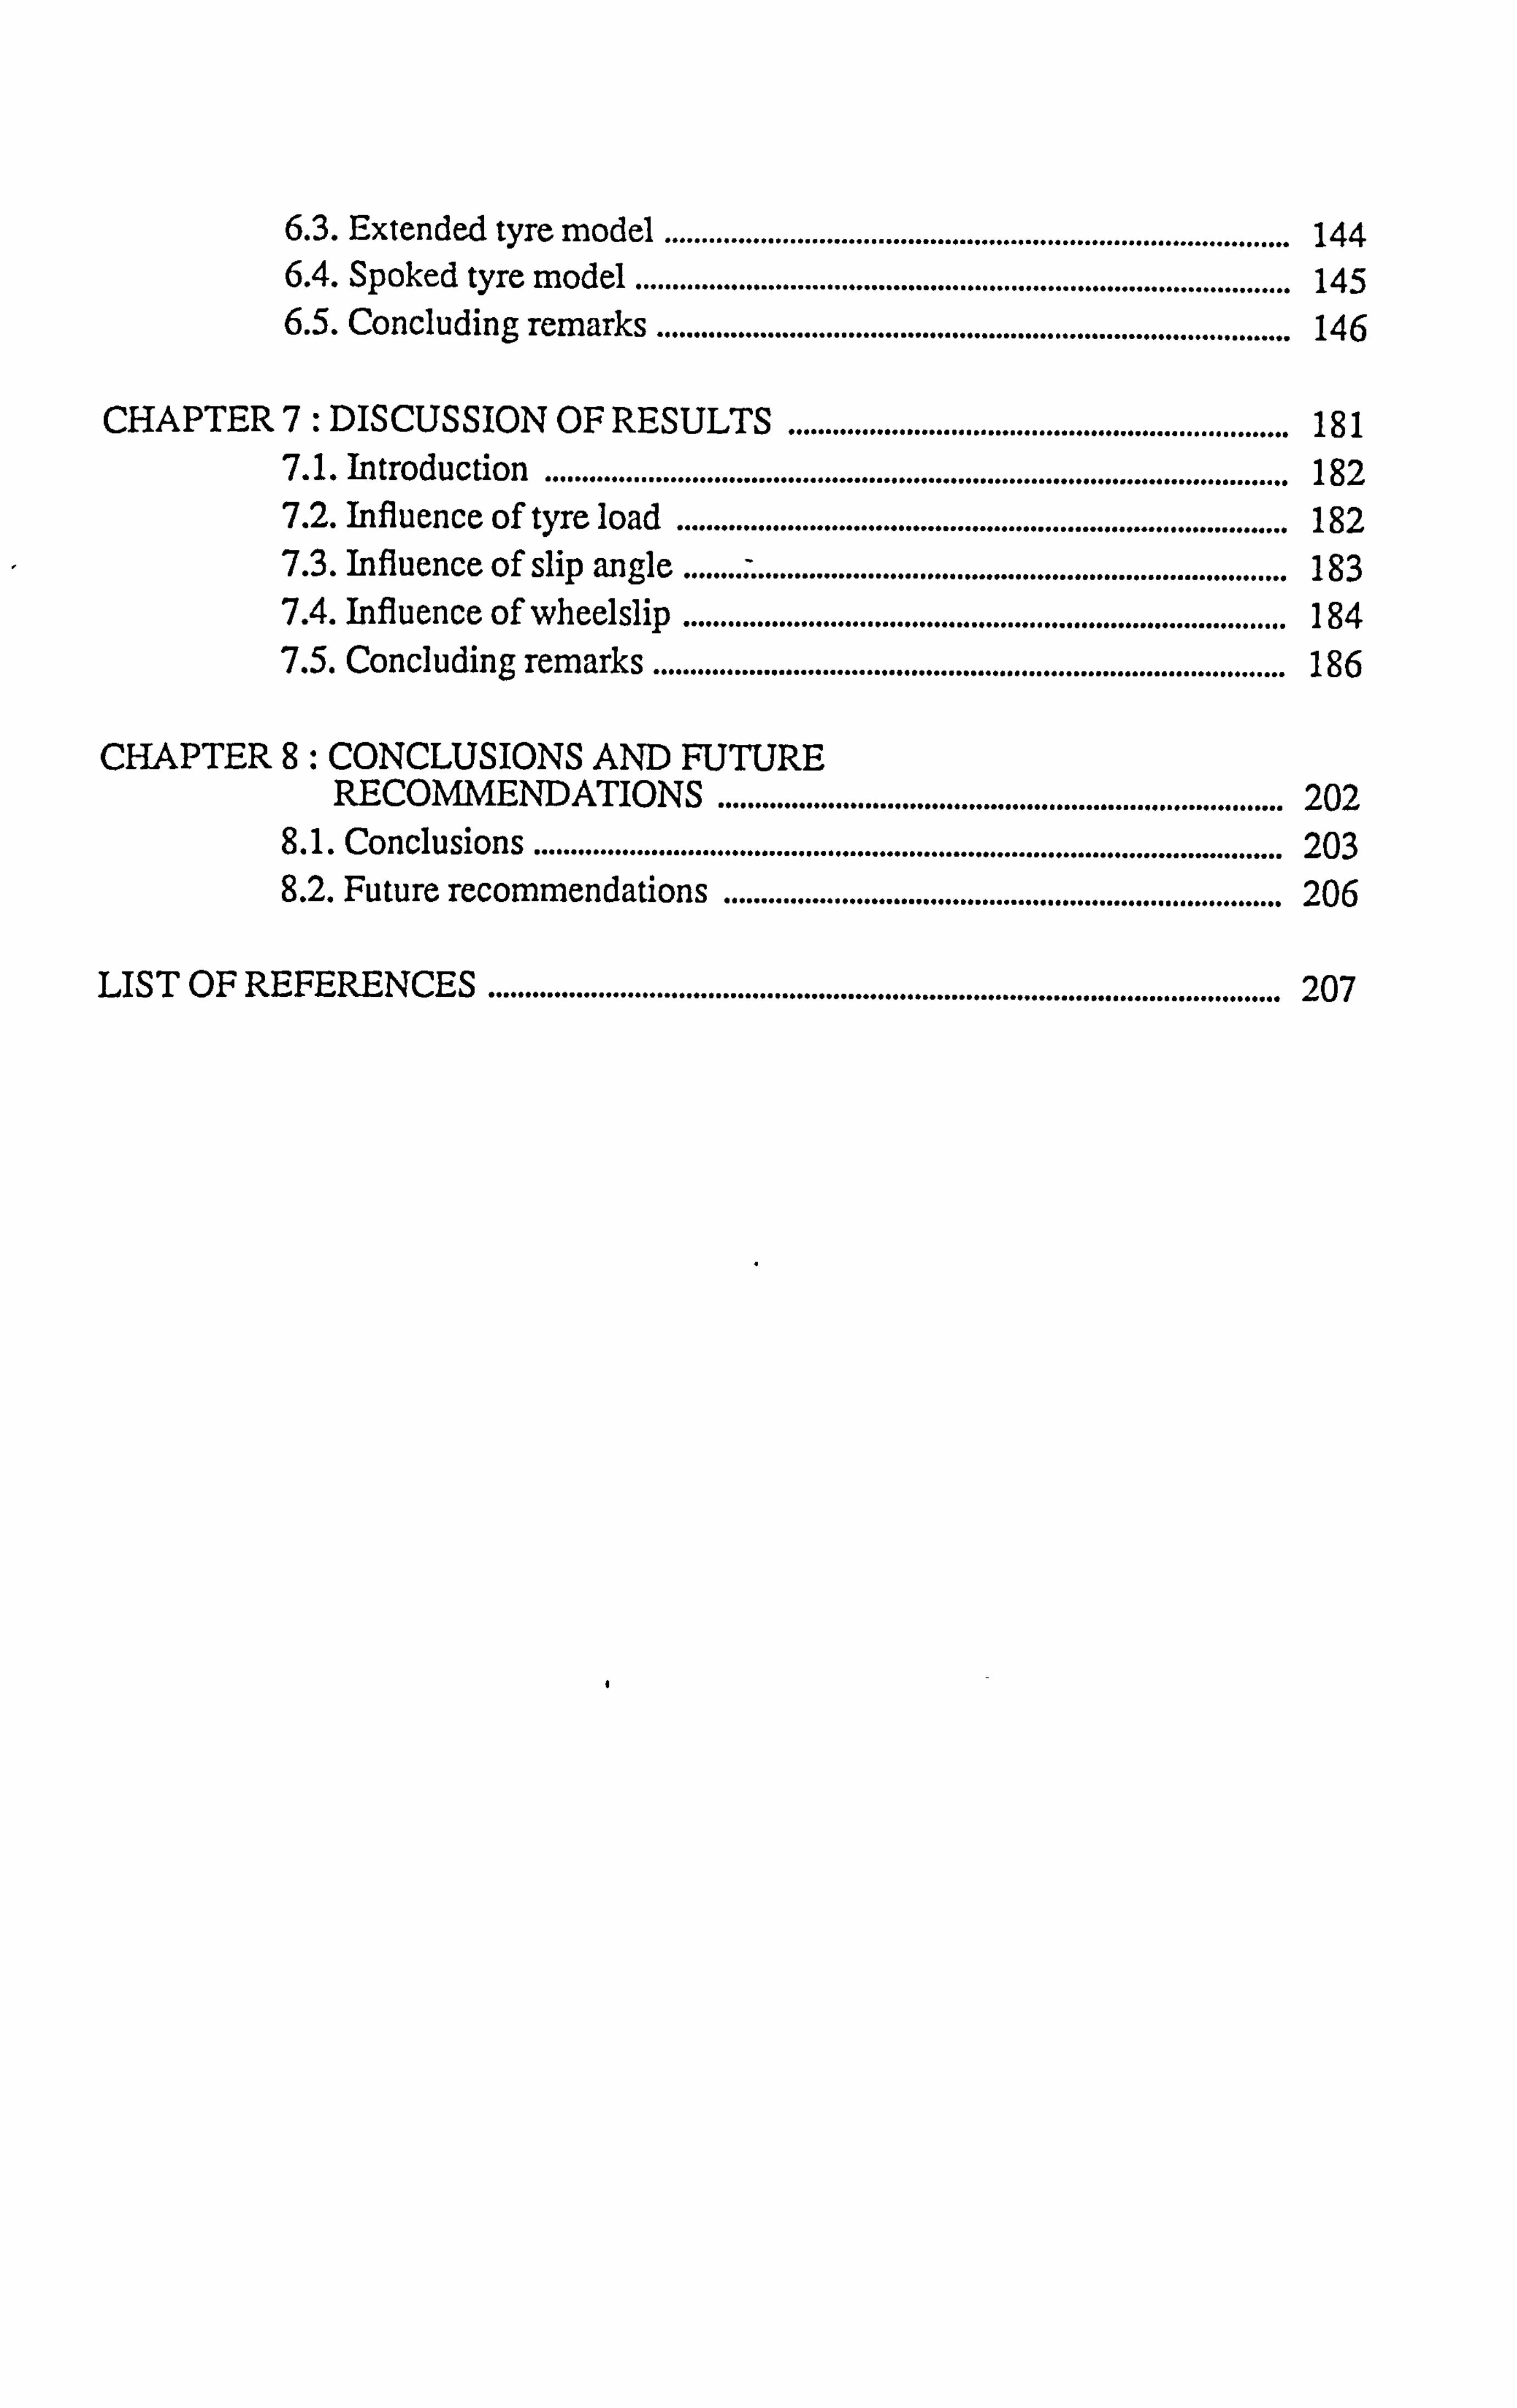
6.3. Extended tyre model ..................................................................................... 144 6.4. Spoked tyre model ......................................................................................... 145 6.5. Concluding remarks ...................................................................................... 146
CHAPTER 7: DISCUSSION OF RESULTS .................................................................... 181 7.1. Introduction ..................................................................................................... 182 7.2. Influence of tyre, load ................................................................................... 182 7.3. Influence of slip angle ................................................................................... 183 7.4. Influence of wheelslip .................................................................................. 184 7.5. Concluding remarks ...................................................................................... 186
CHAPTER 8: CONCLUSIONS AND FUTURE RECOMMENDATIONS ............................................................................. 202
8.1. Conclusions ...................................................................................................... 203 8.2. Future recommendations ............................................................................ 206
LIST OF REFERENCES ............................................................................................................ 207
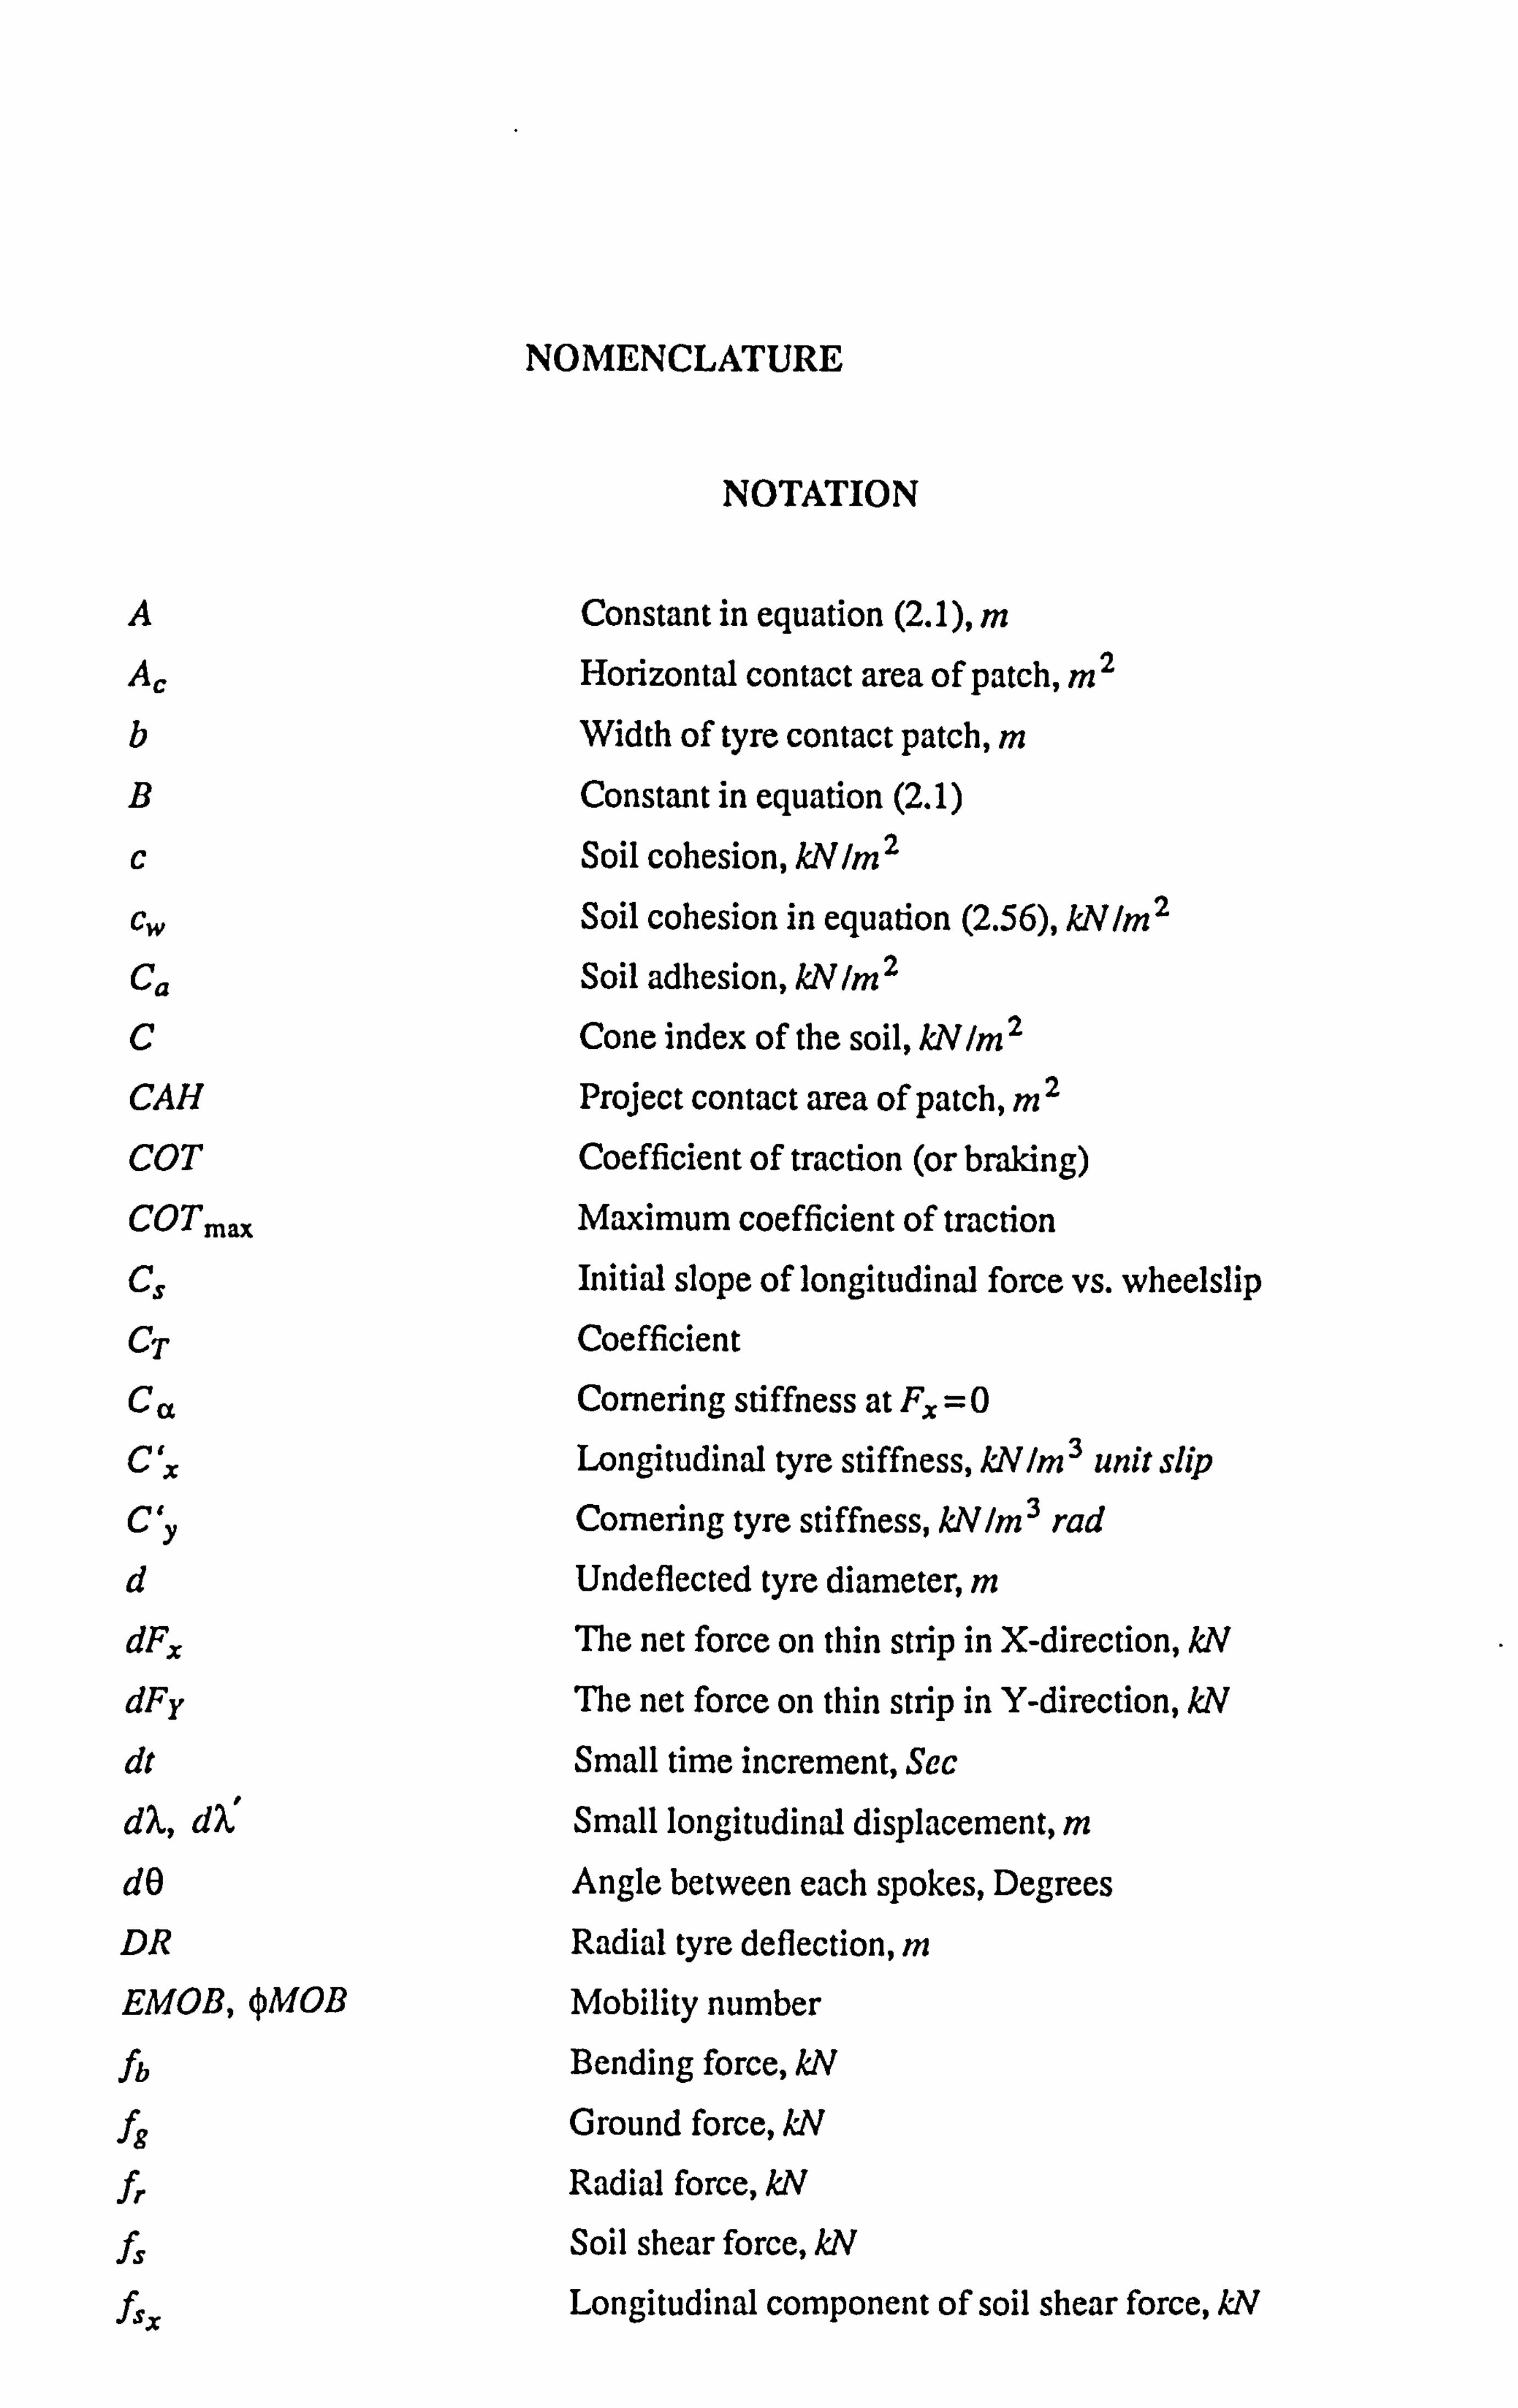
NOMENCLATURE
NOTATION
A Constant in equation (2.1), m A, Horizontal contact area of patch, m2 b Width of tyre contact patch, m B Constant in equation (2.1)
C Soil cohesion, k1V/M2
CW Soil cohesion in equation (2.56), kNIM2 Ca Soil adhesion, kN /M 2
C Cone index of the soil, kN /M 2
CAH Project contact area of patch, M2
COT Coefficient of traction (or braking)
COT,,,,, Maximum coefficient of traction
CS Initial slope of longitudinal force vs. wheelslip
CT Coefficient
Ca Comering stiffness at Fx =0
C'X Longitudinal tyre stiffness, k1VIM 3 unit slip
CIY Comering tyre stiffness, kNIM3 rad
d Undeflected tyre diameter, m
dFx Ile net force on thin strip in X-direction, k1V
dFy The net force on thin strip in Y-direction, k1V
dt Small time increment, Sec
A, & Small longitudinal displacement, m
dO Angle between each spokes, Degrees
DR Radial tyre deflection, m
EMOB, ýMOB Mobility number
A Bending force, kN
f9 Ground force, kN
fr Radial force, kN
fs Soil shear force, kN
fSX Longitudinal component of soil shear force, kN
fSY Lateral component of soil shear force, kZV
ft Elastic resultant spoke force in X-Y Plane, k? V
fX Spoke force in fore and aft direction, kIV
fy Spoke force in lateral direction, kIV
fz Spoke force in vertical direction, kIV
F General tyre force, kIV
F., Tyre force in fore and aft direction, MV
F , Longitudinal force in equation (2.51) ,, .
Fy Tyre force in lateral direction, kIV
Fy, Lateral force in equation (2.52)
F, s Steady state value of tyre force, W
Fz Tyre force in vertical direction, k1V
h Tyre section height, m i Soil shear displacement, m ix Longitudinal soil shear displacement, m jy Lateral soil shear displacement, m Jk Soil deformation coefficient K Soil deformation modulus, m K1, K2, K4, K5, K6, K7 Tyre stiffness parameters K, Cohesive soil modulus, Wlm"'
K,, Radial tyre stiffness, kIVIM
Kx Circumferential tyre stiffness, kIVIm
Kxn Longitudinal tyre stiffness, W In, 3 unit slip
KYn Cornering tyre stiffness, kIVIM3 rad
Ký Frictional soil modulus, k1V /Mn+2
I Length of the tyre contact patch, m
Ir Tyre relaxation length, m
LFC Lateral force coefficient
LFCmax Constant for particular conditions
n Exponent of soil deformation
N Number of spokes in the contact region MY, N,,, Nq, N, Nr, N,,,, Soil coefficients
P The resultant force in equation (2.56), W
P, P9 Normal ground pressure, kNIM
Pf Soil resistance, kNIm
Pe Soil reaction forve against the pseudo interface, kN
q Surcharge, kIVIM2
R Undeflected tyre radius, m
S Wheel slip (or skid), %
S Laplace operator in equation (2.16)
T Time constant in equation (2.16)
U Constant in equation (2.28)
U Total force in equation (2.30), k1V
U Forward velocity of tyre, m Isec
Um Maximum resultant force in equation (2.32), k1V
V Lateral velocity of tyre, m Isec
W Simply relates to the case in which a wedge is formed
W Tyre load, k1V
X, X, Distance in longitudinal direction, m
Y Total lateral displacement, m ZI ZW Soil sinkage, m Zmax Maximum Soil sinkage, m
(X Tyre slip angle, Degrees
CCU Generalized resultant force
8 Tyre deflection under load, m 5f Soil-rubber angle of friction, Degrees
5S Tyre steer angle, Degrees
51 Time increment, Sec
5X Longitudinal tyre deflection, m 8. Y Lateral tyre deformation, m
Entry spoke angle in equation (2.57), Degrees
The tyre tread Deformation, m TIX Circumferential spoke deflection, m '1Xk Circumferential spoke deflection in Kinematic position, m
Tly Lateral spoke deflection, m Ilyk Lateral spoke deflection in Kinematic position, m
7 Camber angle, Degrees
ly Soil specific weight in equation (2.55), kIVIM3
Longitudinal coordinate in the contact region Longitudinal displacement, m Coefficient of friction
Spin velocity of the tyre, rad1sec Soil internal angle of friction, Degrees
O(PO) Radial force an the spoke tip equation (2.60), N
P, PO Radial spoke deflection in equation (2.57), N
CY Normal ground pressure, kIV IM 2
Ir Shear stress, kIV /M 2
're Soil shear density
Tex Longitudinal component of density
Tey Lateral component of density
Tfriction Soil stress due to friction, kIVIM2
Tk Stress due to. friction in equation (2.48), ktV/M2
Tmax Soil shear strength, kIVIM 2
Ts, Tsoil, Tiread Soil shear stress, k1V/M2
TX Component of soil shear stress in X-directionAIWM2
Ty Component of soil shear stress in Y-direction, kN/M 2
0 Spoke angle position, Degrees
01 Entry angle, Degrees 02 Rear angle, Degrees
4 Angle of the total resultant force, Degrees
ý' ýO Longitudinal spoke deflection in equation (2.57), m
Subscripts
i Spoke number
max Maximum
min Minimum
r Radial
X, Y, Z Coordinate system
Abbreviation
atm Atmospheric pressure
Cm Centimetres
f, (tany), f2(5) Functions
Fig. Figure
in. inch
kIV Kilonewton
1b, Ibs Pound, Pounds
M Meter
MM Millimeters
N Newton
0 Degrees
rad Radian
sec Second
S Distance vector a Partial derivative f Integration
Sum
References
CHAPTER1
INTRODUCTION
The background to the growing requirement for off-road tyre
models is explained and the overall objectives of the
thesis are outlined. Also the main subject matter
of each chapter is indicated to summarise
the overall structure of the thesis.
-2-
One of the important factors that influences the steerability of off-road vehicles
is the magnitude of the lateral force developed between the tyre and soil contact area
when the plane of the tyre is turned at an angle to the direction of travel. When a tyre
operates at a slip angle, tyre distortion occurs and the contact region is displaced
laterally relative to the wheel plane.
This study is aimed at an improved understanding of the mechanism of lateral
tyre force generation on off-road surfaces. Work to date on the force generated by
off-road tyres has been dominated by analyses, measurements and predictions of
tractive and rolling resistance behaviour. By comparison, the lateral force
characteristics have received little attention, though their importance is becoming
more widely recognised, mainly because of the pressure for increased speeds in many
agricultural vehicles.
Lateral forces generated at the tyres are responsible for controlling the steering,
cornering, and sideslope operation of vehicles. If one reasonably excludes the effects
of aerodynamic forces on agricultural vehicles, then the only external forces to make
the vehicle move in any direction, longitudinally or laterally, are generated at the
tyres.
Traditionally, studies of the steering and handling of agricultural vehicles have
taken an emphatic second place to the analysis and prediction of their tractive
capabilities. T'his relative position has reinforced the traditional view of, for example,
the tractor as a low speed, draught producer. This view is already changing and the
change seems likely to accelerate with trends towards higher speeds for conventional
tractors and the development of more specialised vehicles. To support this view,
recent studies ( Crolla and Horton [1984] and Gohlich [1984] ) have pointed to the
high percentage of time spent by tractors on transportation and other light dudes,
operating with the power take off perhaps, for which work rates can be increased
simply by increased speed.
-3-
Ile overall picture, therefore, is of a changing emphasis on the requirements of
tractors and other agricultural vehicles with one of the design priorities being on safe
and stable handling behaviour both on and off the road. Hence, the interest in lateral
force characteristics of the tyres fitted to such vehicles.
The main objectives of the study presented in this thesis are
1) To analyse the lateral force characteristics of off-road tyres.
2) To develop mathematical models which describe the characteristics of off-
road tyres in the above respect.
3) To validate the models by comparison with measured results.
An outline of the contents of the thesis is as follows :
A review of the relevant literature pertaining to tyre behaviour is given in
Chapter 2. The object of this is to provide the reader with background information on
the subject matter, some of which is essential and some peripheral to the work detailed
in this thesis. Previous work is critically reviewed in the context of the objectives
above. Documents devoted to methods of theoretical analyses and off-road vehicle
dynamics problems are referenced where necessary in the main body of the text.
An approach leading to the off-road tyre force model which is simple but which
also incorporates the key features of the problem is given in Chapter 3.
In Chapter 4, this is extended to include the combined lateral and longitudinal
tyre force characteristics. Results from a computer model suitable for use in
combination with vehicle handling models are presented.
A more detailed model is presented in Chapter 5. This model is called the multi-
spoke tyre model and the basis of this model is to use a transfer matrix method to
calculate the tyre deflections in the circumferential, lateral and radial directions and to
recalculate by an iterative method the tyre forces generated when the tyre moves on
an off-road surfaces .
-4-
The objective of Chapter 6, is to compare the results obtained from tyre models
presented in Chapters 3,4 and 5 with those results obtained by a range of authors
presented in the literature. Comments regarding the accuracy and applicability of
each model are made.
Chapter 7 contains a discussion of the main results obtained from models
presented in this thesis and concentrates on analysing the relationship between real
tyre behaviour and the representation of tyre model behaviour. Conclusions together
with a set of recommendations for future work are given in Chapter 8.
0
CHAPTER2
REVIEW OF PREVIOUS WORK
A summary of published work to date is presented,
concentrating on theoretical and experimental
results for off-road tyre forces.
-6-
71is chapter contains a review of the available work that has been done on the
behaviour of off-road tyres in generating lateral and longitudinal forces. Although the
behaviour of off-road tyres in generating longitudinal forces in particular tractive
forces has received an enormous amount of attention, this work is summarised and not
reviewed in detail because it is restricted to the case of the wheel travelling in a straight
line. In contrast, studies which include either the generation of lateral forces alone or
the combined force generation system are given the most attention because they are
central to the theme of the thesis. This work can be categorised into two main basic
parts : - 1. BASIC TYRE MECHANICS 2. BASIC SOIL MECHANICS
2.1. BASIC TYRE MECHANICS
The lateral force generated by a tyre, whether on hard or deformable surfaces, depends
on the "slip angle" at which the tyre is operating. Slip angle, cc, defined in Fig. (2.1), is
most conveniently defined as the angle between the direction the tyre is pointing and
the direction it is actually going. This definition applies whether or not the wheel is
steered. The steer angle, 8,, is the angle the wheel is pointing relative to a longitudinal
axis fixed in the vehicle body.
The forces acting at the tyre and ground interface can be defined in two ways:
"Relative to the direction of travel" or "relative to the plane of the wheel".
The more convenient of these for vehicle studies is the latter and so throughout
this work, tyre forces are defined relative to the plane of the wheel. The forces defined
by each of these methods are simply related via the slip angle. Throughout the
literature, the terms "side force", "lateral force" and "comering force" are all used and
care must be taken in comparing results to note the definition system used.
Because the effective line of action of tile lateral force does not coincide with the
centre of the wheel axis, a self-aligning torque is generated. Pneumatic trail is the term
used to describe the effective moment arm at which the lateral force acts relative to the
-7-
wheel axis centreline.
When a tyre operates at a slip angle, tyre distortion occurs and the contact region
is displaced laterally relative to the wheel plane. This is shown in Fig. (2.2), the most
important feature being the distortion of the line representing the equatorial line around
the circumference of the tyre treadband. This distortion is described in more detail in
Fig. (23), which shows how the forces are produced by the tyre. Iliese characteristics
apply to a hard surface but it will be shown in the next chapters that they can easily be
modified for deformable surface conditions.
The literature on the force generated by off-road tyres has been dominated by
analyses, measurements and predictions of tractive and rolling resistance behaviour.
However, some lateral tyre force investigations have been made with the aim of a better
understanding of off-road vehicle handling behaviour. These investigations, theoretical
and experimental, have mainly been made on towed, steered pneumatic tyres, although
a number of attempts have been made to develop lateral and longitudinal tyre forces on
different types of soil.
2.1.1. MEASURED RESULTS
Measurements of soil forces acting on a driven or undriven steered wheel have been
made several times in the recent past, and a good summary of results is given by Crolla
and Hales [1979] for off-road vehicles. These forces are required for the study of two
main aspects of vehicle behaviour:
1) To investigate stability for level ground and side slope operation.
2) To investigate handling characteristics.
Crolla and Horton [1984], have reviewed the available information on the lateral
force characteristics of off-road tyres. The main idea of this was to provide a
comprehensive summary of existing measurements with a view to using the tyre data in
off-road vehicle handling and stability studies.
-8-
Phillips [1959] measured and compared reaction forces from a 6.00 x 16
implement tyre with those on a rigid cast iron wheel, on a purpose built experimental
rig towed over a grassland surface. With the pneumatic tyre it was found possible to
make tests over a fairly wide range from 100 to 1000 Ib of vertical load, and from 0 to
85' of slip angle. For the cast iron wheel, however, the region within which the
apparatus would function properly was considerably reduced. Limits of 400 to 1200 Ib
of vertical load and from 0 to 300 slip angle were made for the cast iron tests.
T'he results showed that for a given tyre load, the lateral force increased with
increased slip angle and reached a maximum value at about 170 of slip angle.
Taylor and Birtwistle [1966] investigated three tread designs for 7.50 x 16 6-ply
front tractor tyres in the following operating conditions :
1) A multi-rib or compactor tyre on sandy loam soil.
2) A multi-rib or farm tmctor tyre on silty clay soil.
Tests were made under two tyre loads of 1000 and 1500 Ibs. with a range of slip angle
between 0 to 15'. They showed that for a given tyre load, the lateral force coefficient
increased with slip angle but the rate of increase reduced after approximately 10' of
slip angle.
Schwanghart [1968] using a soil bin made a comprehensive study of a range of
tyres, mainly tractor front tyres, and reached several interesting conclusions regarding
operation in loose soil. The relationship between lateral force and slip angle was
markedly different in loose soil from that on concrete. On concrete the lateral force
reached a peak at about 15' slip angle and then decreased, but in loose soil the curve
was much flatter and had not reached a peak even at 30' slip angle. For a 5.50 x 16
tyre, the lateral force coefficient decreased slightly as vertical load was increased from
1 to 4 kIV, and for small variations in vertical load a constant figure could be assumed.
Ile most comprehensive work of tyres driven on off-road surface was carried out
by Krick [1973]. His results are one of the few which include driving, braking, and
-9-
lateral forces. The tests were carried out in a soil bin. Two different sets of test were
made, the first set was on sandy loam soil with 14% water content and the second set
was on plastic slippery soil at 22% water content. Front tractor tyres were used with
two different sizes, a 7.50 x 18 AS and 12.50-20 EM at an inflation pressure of 1 atm.
For each tyre tested, wheelslip was kept constant while variation of slip angle ranged
between 0 to 30' and tyre loads of 330,430 and 530 kp.
The results, represented as a set of curves, showed that when the tyre travelled in a
straight line (at zero slip angle) there were no changes noticeable from the previous
work. As the slip angle increased, the driving force largely dropped. Also with an
increased driving force at constant slip angle, the lateral force was considerably
reduced.
The tyre characteristics were presented as friction ellipse graphs for a 7.50 x 18
AS tYre. Loads of 430 and 530 kp were used in the tests at 1 atm inflation pressure.
With the variation of slip angle, the negative driving force was a maximum at 55%
wheelslip and the positive driving force was maximum at a range of 55 to 100%
wheelslip. The tyre characteristic graphs showed a significant relationship between the
longitudinal force and lateral force for varying slip angle and wheelslip. As a result, the
interaction of the lateral force and driving force significantly affects the motion of a
vehicle.
The results obtained by Gilfillan, Spencer and Rowe [1976] for a 7.50 x 16 tractor
front tyre were on two types of soil, grass on soft ground and stubble soils with tyre
loads of 308,608,958 and 1258 lbs at 100 Win 2 cone index. The results were
presented in terms of forces lying in the ground plane and applied by the ground to the
wheel, i. e. side force and rolling resistance.
These forces are defined with reference to the direction of travel of the wheel.
They defined the steer angle as the angle between the direction of travel and the line of
intersection of the wheel vertical plane with the ground plane.
- 10-
Meyer et al [1978) described measurements of tractor rear tYre performance by
measuring the lateral forces generated on sloping ground. Different tyre tread patterns
resulted in significantly different lateral forces. The results showed that the influence of
sloping ground on the tyre behaviour rather than constraining the tyre to operate at a
slip angle.
Work was carried out at N. I. A. E. [1978] to measure lateral tyre forces and
involved six different tyre sizes, carefully arranged into three series of experiments to
establish the effect of the tread pattern on tyre behaviour. Each of three experiments
was carried out on many field surfaces, predominantly stubble and the side force results
were analyzed by fitting a curve of the form:
LFC =A (1-e-Ba ) (2.1)
Equation (2.1) is an empirically obtained result based on fitting curves to
measured results. Various forms of equations, including polynominals of different
levels, have been tried but the exponential form has the advantage of being reasonably
accurate and simple. The constants, A and B, refer of course to a particular set of tyre
parameters and ground conditions. Typical examples for three different surfaces are
shown in Fig. (2.4) and data such as this is convenient for representing the performance
of off-road tyre behaviour in modelling studies.
Del Rosario (1980] has described an investigation of four types of steered
pneumatic tyre described below :-
7.50 x 16 8-ply ribless,
7.50 x 16 8-ply traction,
7.50 x 16 8-ply shallow ribbed and
7.50 x 16 6-ply traction
A single wheel tester was designed and developed including ancillary devices to meet
the requirements of the tyre behaviour. Results show the significant effect of rib size as
a factor on the lateral force. Slip angle was measured from 5 to 25', and wheelslip from
-11-
0 to 50% .A soil tank in the laboratory at Silsoe College was used for the project, with
the soil kept at about 8% dry basis.
Gee-Clough and Sommer [1981] measured two tyres, a 4.00 x8 smooth
implement tyre and a 18 x 9.50 8-ply terra-type buffed smooth tyre, in a soil bin. Loam
soil was used at four soil strength values, described by cone index values of
approximately 150,300,550 and 900 kPa. Tyre loads and pressures were varied and a
speed of 0.5 m Isec was maintained throughout.
Their results were a good fit to the relationship described by the equation
LFC = LFC. 2,, (1 -e -B cc ) (2.2)
where
LFC = Lateral force coefficient
LFCn,,,,,, B= Constants for particular conditions
cc = Slip angle
They then tried to correlate the results with four different forms of mobility number, of
which the two most important were:
EMOB =Cbd1 (2.3) w1 +b12d
ýMOB cbdI ýn (2.4) w1 +b12d
Relationships between these numerics and two parameters in equation (2.1) were
sought : namely LFCmax and B. LFCmax which is the initial slope of the LFC vs. (x
curve. Examples of the results using EMOB were:
0.89-0.14 EMOB (2.5)
B. LFCmax = 2.18 + 0.38 EMOB (2.6)
Equation (2.5) was not statistically significant though it provided a good subjective fit
to the data, whereas equation (2.6) was significant at the 2% level.
-12-
McAllister's work [1981,84] used six different tyres including tractor front,
implement and trailer tyres in 38 field conditions. Tyres size were 7.50 x 16 and 12.00 x
18 and forward speed was 1 m1sec throughout. Details of the test rig are given in
reference [1984] and measurements were made up to slip angle of 401.
McAllister found good correlation between measured results and equation (2.1).
Ms attempts to correlate the results with mobility number led to the following CD
expressions :
For cross-ply tyres
0.69 LFCmax - EMOB + 0.61 (2.7)
(significant at 5% level)
BLFCmax = 2.34 + 0.088 EMOB (2.8)
(significant at 0.1 % level)
For radial-ply tyres
There was no significant relationship between LFC,,,,, and EMOB, but:
B. LFCm, x = 2.79 + 0.16 EMOB (2.9)
These are compared with Gee-Clough's results in Fig. (2.5). Equation (2.7) is a
surprising result because it indicates that maximum lateral force increases as soil
strength (described by cone index values) decreases.
There have been two recent and important contributions to the lateral tyre forces
generation presented at the 1981 I. S. T. V. S. conference. Schwanghart [19811 described
measurements made on two tractor front tyres, a 7.50 x 18 with a T85 non-driven type
profile and a 6.50 x 20 with an A7 lugged profile. A specially designed frame towed
behind a Unimog tractor was used on 8 different surfaces. Slip angle was varied from 0
to 301 and vertical tyre load varied from 1 to 8 kIV, so that a wide range of conditions
was covered . Only a sample of the results are published in his work and the lateral
force data for a 7.50 x 16 tyre are shown in Figs. (2.6 and 2.7). The relationship of
-13-
lateral force with vertical load is given in Fig. (2.6) and the classic lateral force
coefficient/slip angle curves are shown in Fig. (2.7). Ile curves which are fitted to the
data are second and third order polynomials respectively.
There is a lot of information to digest here and obviously it is subject to
considerable experimental scatter. From Fig. (2.7), however, it appears that the effect of
vertical load varies dramatically with the surface.
The work done by Janosi, Kamm and Wray [1981] concentrated on three military
truck tyres in the range 9.00 x 20 to 10.00 x 20. An interesting measuring rig was
adopted using a four wheel drive military truck. The front wheel hubs were
instrumented to measure forces in three directions and slip angles were achieved by
adjusting the toe-in or toe-out values of both front wheels. The effect of braking or
tractive forces on lateral force as shown in Fig. (2.8) could be studied by braking or
driving the appropriate axle on the vehicle.
This technique, which could be applied to a four wheel drive tractor for example,
appeared to be successful although it was only used up to slip angles of 9'. The
parameters varied were vertical load, tyre pressure and braking and tractive force to
give a total of 1300 measurements over the three surfaces used; smooth concrete, hard
soil and the same soil scarified to produce a6 inch soft sandy top layer.
The results of particular interest are those in which braking or tractive forces were
used. The examples are shown for concrete, hard soil and soft soil surfaces. I'lley
appear to substantiate the proposed friction ellipse model. The authors comment that
although the analysis of results is not yet completed, there is a trend for the maximum
longitudinal force to be greater than the maximum lateral force, implying a friction
ellipse rather than a friction circle relationship.
It is worth surnmarising their initial findings :-
1) Lateral force decreases with decreasing tyre pressure on concrete and hard soils
whereas on soft soils it increases.
- 14-
2) 'Me greater the load and the lower the tyre pressure, the smaller the difference
in lateral force on soft and hard surfaces.
3) The greater the load, the higher the sensitivity to inflation pressure.
4) Lightly loaded tyres at low inflation pressure produce the most uniform
handling characteristics over different surfaces.
5) In soft soil, the lateral force peaks at lower slip angles and is less sensitive to
load and inflation pressure than on the hard surfaces.
6) At high inflation pressures, there was little difference between the radial and
cross ply tyre results ; at low pressure the radial tyre always generates more lateral
force.
Both Schwanghart [1981] and Janosi et al [1981] included measurements on road
surfaces. Of particular interest are the comparisons between a wet and dry road
Fig. (2.7). In certain cases, e. g. 10' slip angle with a lightly loaded tyre, the lateral
force coefficient changes from 0.9 to 0.05 in going from a dry to a wet surface.
The overall conclusion to be drawn from the measured results is that vehicles
which travel both on and off the road have special problems. The tyre characteristics
vary dramatically between surface conditions and so the vehicle handling behaviour
will also be affected. Tractors with different lug patterns on the front and rear tyres will
be especially sensitive to changes in the handling balance due to different surfaces.
Different tyre pressures for on and off the road operation are indicated if optimum
performance is aimed for.
This is analogous to the conflicting tyre pressure requirements of low pressure for
tractive perfonnance and higher pressures for transport and road work. However, if
changes in inflation pressure to match the task are impractical, the lightly loaded tyres
of low inflation pressures offer the best compromise for consistent lateral force
- 15 -
behaviour.
When the tyre is driven or braked, the lateral force behaviour is modified
significantly. This was shown in 1973 by Krick [1973] who measured lateral forces at
up to 350 of slip angle for various driven tyres in a soil bin with sandy loam soil.
Under these conditions, he calculated that the approximate relationship between lateral
and longitudinal force was given by :-
Fy = (1±CTF., )Ccc cc (2.10)
where
Fy Lateral force
F., Tractive (+) or braking (-) force
a= Slip angle
C,, = Cornering stiffness at F,, =0
CT = Coefficient relating the variation in lateral force with tractive or
braking force.
The plus/minus sign in equation (2.10) refers to braking or tractive force respectively.
For a given slip angle, lateral force decreases as tractive force increases but increases as
braking force increases. This behaviour agrees with Krick's measured results for a 7.50
x 18 tyre although they were measured for relatively small variations in longitudinal
force and so the application of equation (2.10) should be restricted to this range.
Ile only other published data on combined lateral and longitudinal forces for
off-road tyres were measured by Janosi, Kamm and Wray [1981]. Cross country truck
tyres, 9.00-20 and 11.00-20, were used in this work and an example of their results is
shown in Fig. (2.8). The soft soil surface had a 150 mm top layer of scarified sand.
These results are rather different from Krick's and show similar trends to those
expected from road tyre experience. When these results are extended to the limiting
conditions in any direction they are referred to as friction-ellipse characteristic of the
tyre.
-16-
2.1.2. AN EMPIRICAL MODEL OF TYRE FORCE GENERATION
In order to model either lateral or longitudinal behaviour independently of each other,
equations (2.2) and (2.11), can be, used. However, when both forces are generated in
combination the following approach offers an approximate representation of behaviour.
The shape of the lateral force coefficient vs. slip angle curve is assumed to be
controlled by the tractive or braking force generated ;
LFC = LFC.,,, (1-e -B a) (2.2)
where LFC.,,,, is now given by the equation:
LFCmax ( COT 1 (2.11)
LFC'Max COTm,, x
where
LFC'm,,., = maximum value of LFCma,, at COT =0
COT. ý.. = maximum value of COT .. a,, at LFC =0
This relationship is shown in Fig. (2.9), plotted in the friction ellipse form for the
measured results shown earlier.
If equation (2.11) is to be used in any vehicle dynamics study, there are several
other points to consider. First, the vertical load (F,. ) on each tyre will normally by
varying and the above analysis assumes a linear relationship between lateral and
tractive forces with vertical load. If the variations of load are small, then the above
analysis is satisfactory , the "constants" LFCmax, COTma,, and B being referred to the
mean load condition. If the variations in load are great, then the above parameters
should be included as function of (F. ). Second, the relationships only apply to the case
in which the wheel is rolling. If it is locked and therefore sliding, then the distinction
between lateral and longitudinal forces ceases to be meaningful.
There is only one resultant force and it may be assumed to act in the opposite
direction to the resultant sliding velocity, although there are few measurements
available in these conditions. Since LFC'ma,, and COT.. may not, in general, be the

- 17 -
same, a friction ellipse characteristic occurs again and the resultant force can be
calculated from the angle of the resultant velocity, Fig. (2.10) shows the angle of the
resultant velocity for which :
Resultant force =! CF: z F., COTmax LFC'max
(2.12) -qLF ma,, cos'a + COT'ma., sin'(x
Ibird, the relationships assume steady state conditions. However, for any change
in operating condition, i. e. change in wheelslip or slip angle, tyres have a finite
response time relating to the time taken for the contact region to assume a new distorted
shape. For road vehicle tyres, this aspect of dynamic response has been widely
measured and can be approximated by :-
F= F� (1 -e-xl" ) (2.13)
where
F= Force, lateral or longitudinal
F,, = Steady state value of force
x= Distance
1, = Relaxation length
The relaxation length, 1, for the case of lateral force build up is approximately equal to
the rolling radius of the tyre. Although no published measurements are available for
off-road tyres, this type of response characteristic is a fundamental property of the tyre
and there is no reason to expect off-road tyres to behave differently from road tyres. In
1U the time domain, the response is of first order lag with break freque.....,
T-I, . For
road vehicle parameters the break frequency is sufficiently high that tyre dynamic
response does not affect the vehicle response. But for off-road vehicles, where U is low
and I., can be large, e. g. tractor rear tyres, the tyre dynamic response may be important.
In transfer function terms, equation (2.13) becomes :
F-1 (2.14) Fss 1+ST
- 18 -
where
S= Laplace operator
T= Time constant = Ir U
For example, if Ir =1m and U=1.5 m Isec, the break frequency = 1.5 rad Isec (0.24
Hz). So for these conditions, the tyre dynamic response would be important since the
frequency range of interest goes up at least 3 Hz for handling motion and say 4 to 5 Hz
for lateral ride motions.
2.1.3. ANALYSIS OF LATERAL TYRE FORCE GENERATION
Three simplified analyses of lateral tyre force generation on off-road surfaces have
been done by the following authors:
Schwanghart [1968,81], Grecenko [1969,75], Jurkat and Brady [1981]. In addition,
Karaflath and Nowatzki [1978] have proposed a finite element based model to predict
all soil-tyre forces under any condition of load, longitudinal and lateral slip. This
model, however, is rather too elaborate to use in vehicle handling studies since the
calculations required for each set of conditions are extensive and to incorporate it in a
vehicle model would require the calculations to be repeated every time step.
Ile other three models have distinct similarities in their approach. The main
features are as follows :
1) A pressure distribution in the contact region is either assumed or calculated.
This involves the important assumption that the force systems in the vertical and
lateral directions can be decoupled, i. e. that the lateral force and slip angle do not
affect the normal pressure distribution. Clearly, this is not the case since the soil in
the contact region is subjected to three dimensional stress, but as a first order
approximation it is reasonable.
-19-
2) Ile lateral force generated is a function of two parameters :-
a. Lateral deformation of the tyre.
b. Soil lateral defonnation due to soil shear.
The first of these implies a force at the soil-tyre interface due to a displacement of the
tyre tread or carcass. Tle force is usually assumed to be a linear function of lateral tyre
deflection. For the second, the displacement can be described by the well-known
relationship as :
1-e -J (2.15)
where
0r (Pg taný +c) (2.16)
Although all three models use the same basic approach, there are differences.
Schwanghart is the only one to assume a deep rut, and so he calculates an additional
lateral force component acting on the tyre sidewall. He does not, however, include
longitudinal forces in his analysis whereas the other two theories include the
longitudinal force vs. wheelslip relationship. Finally, a slightly different approach to
calculating the: tyre deformation is used in each model.
'Me analysis of Del Rosario [1980] is not included as a separate model here
because it is based on Grecenko's work, apart from the passive soil terms. He assumes
that the total lateral force has three components, due to soil-rubber friction, soil shear in
the contact region and passive soil failure against the tyre sidewall. He describes the
shear stress due to friction by the equation --
=(C,, + (y tan 5f ) (2.17)
k
where
-20-
C,, = adhesion
Bf = Soil-rubber angle of friction
He also uses a friction forces vs. creep relationship which is similar in form to
equation (2.15) and has a similar deformation constant. Hence, the analysis for the
shear stresses due to friction and soil shear are identical. A simplified version of
Grecenko's theory is used in which the longitudinal slip of the tyre is ignored and the
normal pressure distribution is assumed to be governed by a pressure vs. sinkage
relationship of the form:
P= (Kc +K, ) Zn (2.18) b
where the sinkage, Z, increases linearly from zero at the front of the contact patch to its
maximum and the decreases linearly to zero at the back of the contact patch. I
where
n= an exponent
K, Ko = Bekker's sinkage parameters
b= Width of the contact area
This gives a parabolic pressure distribution in the contact region rather than the
constant pressure distribution assumed by Grecenko.
2.1.3.1. ANALYSIS OF SCHWANGHART
For tyres with deep treads, he assumes that tyre deformation is dominated by bending
of the lugs and so carcass deformation can be neglected. Thus, the shear force arising
from the lug is:
'Utread --' C" 11 (2.19)
where 11 is deformation of the tyre tread and the stiffness, C", can be measured by
applying static lateral forces to the tyre. Soil shear stress, Tsoil is given by equation
(2.15).
-21-
Ilen, for a slip angle, cc, the total lateral displacement, y, depends on the
longitudinal coordinate in the contact region, X, i. e. :
tana (2.20)
This is the same as the line [ defined in Fig. (2.3) ) that the tyre centreline would
follow under ideal Idnematic conditions if there were no slip or soil shear. Recognising
that the total lateral displacement results from (i) tread deformation, (ii) soil
deformation, and (iii) slip after exceeding maximum soil deformation, Schwanghart
writes :
+ il =X tana (2.21)
where the terms (ii) and (iii) are both included in j. 'Men combining equations (2.19),
(2.20) and (2.2 1) gives:
-K log 1- Tsai Tiread X tana (2.22)
a tano +cI'C,
For equilibrium at any small area in the contact region, the shear stress generated in the
soil must equal that due to tyre, deformation i. e.
'rsoil ý-- Ilread ý-- C' 11 (2.23)
and so substituting this in Equation (2.22) gives:
il-Klog 1- * C, 11 1
Tiread tan cc (2.24)
1
cy taný +cC,
This allows, 71, to be found and hence, j, and then the total shear stress. Schematically,
these parameters are plotted throughout the contact region in Fig. (2.1 1) for two
assumed pressure distributions. Schwanghart differentiates between soil deformation
and slip by approximating equation (2.24) to a bilinear form in which :
-T - Tmax (2.25) K
-22-
until r.,,, is reached. This is shown in Fig. (2.12). When r is defined by equation
(2.25), he calls it soil deformation, whereas when r=r. u it is referred to as slip. Not
surprisingly, as tyre slip angle is increased, the point in the contact region at which this
changeover occurs, moves forward.
The component due to the sidewall of the tyre is calculated from the expression
for the passive soil resistance of a blade moving through the soil as given by Reece
[19651.
The importance of this term depends on the particular tyre and soil condition.
Schwanghart's calculations for a 6.00 x 20 tyre in loose soil gave an average sinkage of
12 cm and he showed that for these conditions the sidewall component was of a similar
order of magnitude to the contact patch component. With less sinkage and shallower
rut, its effect is less important and the following two authors ignore it in their analyses.
2.1.3.2. ANALYSIS OF GRECENKO
The main assumptions of his analysis are that:
1) I'lie contact area is rectangular.
2) The total resultant force, U= 4H-"'-+-Y; -17
as seen in Fig. (2.13) acts at an angle, ý, to the wheel plane.
3) Rolling resistance force arises mainly from compaction and is constant for slip
angles less than 40', where, slip angle.
4) The rut is shallow.
5) The normal pressure distribution is constant.
The total deformation in the horizontal plane, j, arises from soil deformation. From
Fig. (2.13) and for steady-state conditions, Grecenko derives the relationship :
-23-
ux
where
x= distance along the contact patch.
u=a constant depending on the particular slip and slip angle conditions.
(2.26)
This assumes that the resulting contact patch does not distort relative to the wheel
centreline, so the tyre deformation is ignored and the force generated is due solely to
the effect of soil deformation.
The force, U, and displacement vector, j, act in the same direction. The force on a
small element, dx, of the contact region is :
dU = cb dx
where, r = soil shear force.
(2.27)
Therefore, the total force is obtained by integrating this expression over the whole
contact region :
U=b fr dx 0
where
rm (1_e_»K)
, r. = Soil shear strength.
Substituting for j, and integrating gives :
(2.28)
U=bl, rm 1- Jk
1 (2.29)
-24-
where Jk =11, a deformation coefficient. The maximum resultant force, U, as K
a is :
b 1, r.. (2.30)
so that the generalised resultant force, cc., may be expressed solely in terms of the
parameter Jk as:
-il CCU -u
O-e A)
um Jk (2.31)
Alternatively, Grecenko derives a similar relationship but based on the bilinear
form of the shear stress vs. displacement equation rather that the exponential form
given in equation (2.15).
Grecenko then goes on to compare the forces generated as a function of wheelslip
and slip angle.
Wheelslip, s= ix j cos4
=u sin4 (2.32)
xx 1-s
Slip angle, tany jy j sin4 u sin4 (2.33)
x -jx x -j COS4 1-s
Equations (2.32) and (2.33) can be combined to give :-
-s )' tan2y + s2 (2.34)
Now, substituting into equation (2.20) for two special cases, gives --
for s=0, (x,, = f, (tany) at H=0 (2.35)
for y=O, cc. = f2(s) atY=o (2.36)
Since these two functions are identical :
f, (tany) = f2 (s) (2.37)
Grecenko refers to this as the "principle of equivalence". It means that for a given set of
soil and tyre parameters, the relationship between longitudinal force and wheelslip (at
-25-
zero slip angle) is the same as that between lateral force and the tangent of slip angle (at
zero wheelslip).
In the more general case when both forces (H and Y) are present, these forces
may be calculated from a knowledge of the wheel motion described by s and y.
Alternatively, knowing the forces, the wheel motion may be calculated.
Notice that equation (2.29) is identical to the result of Schwanghart for the special
case in which H=s=0 and C' is very stiff so that the tyre deformation, il, approaches
zero.
2.1.3.3. ANALYSIS OF JURKAT AND BRADY
This model is based completely on an early version of a road vehicle tyre model
developed by Dugoff, Fanche Ir
and Segel [1970] at U. M. T. R. I., Nfichigan. It is modified
by introducing an extra failure mode due to soil shear in addition to the possibility of
exceeding the available friction force in the contact region.
The assumed distortion of the tyre under longitudinal and lateral forces is shown
in Fig. (2.14). Point P is in the contact patch whereas P' is in the centre plane of the
tyre. When no forces act, P' is directly above P but when forces act they cause a
distortion of the contact patch and P moves away from P'. Notice that X is defined in
the tyre coordinates whereas V is defined in the contact patch, the relationship between
them being:
V= X(l-s) (2.38)
The position of P relative to a point directly below P' is defined by the vector:
ý=Xs, 2, tancc 1
(2.39)
whose magnitude j=IsI
As the distance into the contact region, X, increases the distortion between P and
P' increases. At some point, the shear force due to tyre deformation equals the
-26-
minimum of
a. tyre/ground friction,
b. soil shear strength.
This point is defined by V, So for V< %',, elastic deformation of the tyre occurs
with no sIdd or soil shear. And for X" > V, the tyre/ground friction or soil strength
cannot support further tyre deformation and skid or soil shear occurs.
In the initial part of the contact region, the elastic shear stresses, 'T, x and 'r, Y, are
assumed to be linearly related to the strains so:
'rex = kx,, Xs (2.40)
, rey = ky, 2, tancc (2.41)
where
k. 1 n= CS
(2.42) b 12
kyn = Ca
(2.43) b 12
DFx and C. =C., (Fý) = 5s- ls=cc=o (2.44)
DF C cc =Ca (Fz)
Da Is = cc =0 (2.45)
and are determined empirically.
Thinking of the contact region as being divided into strips of length A and width
b, the shear density, z,. (k), for each strip is approximately
'Ce (k) = q(k.,,, (?, ) S )' + (k,. y,, (k) tanu)' (2.46)
This stress increases as ?, increases and Xs may exceed the stress due to :
friction, rk (k) =g cr (k) (2.47)
or soil slicar, -r, (%) =(c+a (k) taný )(1-e -j'K ) (2.48)
-27-
Ilerefore, V, = ks (1 -s ) defines the coordinate of the point at which :
Te (X) = min
1
'Ck (I)p 'Cs (X)l (2.49)
In the region 0<X<W, the forces are given by :
2! 2
cý Te (X) dX = k�. sb (2.50)
Fy =bW. (X) A= ky,, tan ab V2
(2.51) ef
Te), 2(1-s) 0
The total forces over the whole contact region consist of the above terrns plus the
components developed in the region V,
+bsf min k(X)f us(%) 4s-7 +-ta-n-7-a W,
f1c
Fy = Fy, +b tancc
. qs 2+ tan2 CC
1 f nün k (X)s 'ls (1) dX ý!.
11r 1
(2.52)
(2.53)
Jurkat and Brady point out the important fact that for road surfaces r, (%) will be
very much greater than ck (k) and their model conveniently reduces to one already
commonly used for road vehicle handling studies.
The force generated by the side wall of the tyre is calculated in the analysis of
Schwanghart [1968] and Del Rosario [1980]. Ile other authors assume that for small
values of sinkage, this component may be ignored. Both analyses are based on the
fundamental equation of earthmoving mechanics for passive soil resistance of a wall or
blade embedded in the soil :-
p' = (, yZ2 Ny +cZ Nc +qZ Nq) cosSf (2.54)
where
-28-
p, = Soil resistance/unit length
y= Soil specific weight
C= Soil cohesion
q= Surcharge load/unit area
Sinkage
8f = Soil-rubber angle of friction
N,, Nq = Soil coefficients
The use of this equation and charts containing the soil coefficient are discussed by
Reece [1965] and Hettiaratchi [1969].
In Schwanghart's use of this equation, he substitutes a parabolic distribution of
sinkage in the contact region. He also calculates surcharge load by first calculating the
volume of soil which is displaced laterally by the tyre and then assuming that this can
be taken as an additional distributed load acting on the shear zone. This results in a
value for P' as a function of distance in the contact patch which is then integrated over
the contact length to give a total force.
Del Rosario [1980] identifies another possible mode of failure in addition to the
passive failure described by equation (2.54). Following the work of Hettiarachi [1966],
he points to the case in which a soil wedge appears and becomes part of the interface.
The resultant force is then given by :-
pe N, +, yZ2 Ny� + c� Zý N�, (2.55)
where P, = Soil reaction force against the pseudo interface and suffix, w, simply relates
to the case in which a wedge is formed.
in using equation (2.54), he assumes a linear relationship between sinkage and
distance in the contact patch and lie also assumes that there is no surcharge load. He
does, however, calculate an extra small contribution to the total force due to the
adhesion force acting along the interface.
-29-
Overall, therefore, these two approaches are similar and hinge around the
application of equation (2.55) which is slightly more difficult for a rolling, slipping
wheels than for a rigid plate. The importance of this term in the total lateral force
generated by the tyre depends on the value of tyre sinkage in the soil.
2.1.4. SPOKED TYRE MODEL ON HARD SURFACE
Ile spoke tyre model is depicted in Fig. (2.15) and represented as a single plane wheel
consisting of a multi-spoke structure. The spokes are cantilevers fixed to the wheel hub
at their inner ends. The other ends form a complete circle in the unloaded condition.
The wheel model diameter is equal to the real tyre diameter, and the number of
spokes are chosen to make the calculation economical on the one hand, and hopefully
realistic on the other. The spokes are radially flexible as shown in the Fig. (2.14). They
are also assumed to be flexible in the circumferential and lateral directions. The
summations of the spoke stiffnesses in the normal, circumferential and lateral
directions are considered to be comparable with the pneumatic tyre stiffnesses.
The spokes are free to deflect in the radial, longitudinal 'and lateral directions
when the wheel is rolling along. These deflections will be related to the normal and
shear forces generated. Because there is no connection between the spoke tips, the
spokes outside the contact line are unstressed and, therefore, unstrained until they enter
the contact region.
The spoke tips are assumed not to slide across the surface until the elastic forces in
the surface plane implied by the absence of any sliding become greater than the friction
force available. When sliding occurs the spoke tips will move across the road to
establish a balance between the elastic force and the friction force.
EI-Nashar [1985] predicted results that qualitatively agree with those obtained
from a range of published work. His model is built on fundamental ideas and does not
include any empirical formula. Consequently, the model behaviour reflects rather than
closely follows that of a real tyre. The model can, therefore, be used to give the user an
-30-
improved appreciation of the relationship between tyre carcass stiffness properties,
tyre/road friction properties and the shear force generation process.
Sharp and EI-Nashar [19861 have recently reviewed and studied tyre behaviour.
Their study is based on an mathematical model called a multi-spoke tyre model for
predicting the generation of tyre shear forces. The model specifies wheel motion which
in turn leads to a complete tyre force and moment system, and has been aimed at
economical digital computer simulation. The model consists of a single plane of equi-
spaced discrete radial spokes interconnected through the wheel hub, each spoke having
radial, lateral and longitudinal tip flexibilities. The force components are normal to
ground and in ground plane, so that the total force and moment system acting on the
tyre can be obtained by summation over all the spokes in the contact region.
A transform axis system as shown in Fig. (2.17) was used to calculate tyre force
components generated under steady-state condition on a hard surface. To explain this
analysis, Fig. (2.18) shows the simple example for a rolling tyre in a straight running
condition, with zero camber angle, i. e. a two dimensional case.
According to Fig. (2.18), point 0, represents the position of the tyre centre at time
zero and, OP, the first spoke just entering into the contact region at this time. OP, will
have length, R, called the free radius of each spoke, and will be at an angle, C, to the
vertical plane. At time, t, the tyre centre will be at 0', where, 00' =Ut, the spoke tip
will be at Q, and O'Q will have components as follows:
(R +p) Sin ( F, - 92 t)+ Cos (e-Qt) along the X direction.
(R +p) cos (e-Qt)- sin ( F, - 92 t) along the Z direction.
For Q and P to be at the same height (steady-state condition) :-
R Cose = (R + p) cos (F- - K2 t)-ý sin (P- - K2 t) (2.56)
R Sine=(R+p) sin(c-92t)+ý cos(e-92t)+Ut (2.57)
Sharp and EI-Nashar assumed that the spokes are positioned at l' intervals and
chose t such that Qt IC . They then solved equations (2.56) and (2.57) for p and 180
-31-
These values of p and C then become po and CO, which are the initial second estimated
for the next spoke. By using a bisection method, they corrected values of spoke tip
deflections if there was not sufficient friction available to prevent sliding.
The normal force applied to the spoke tip by the ground surface is
fz = ý(p)cos(e-ilt)-ý K4 sin(F, -flt) (2.58)
and the shear force is :
f, = ý(po)sin(F--üt)+ý K4 cos (F, -nt) (2.59)
where ý (po) is the radial force an the spoke tip and K4 is the constant circumferential
spoke tip stiffness.
The main idea of their model is that the wheel motion and properties (spoke
radius, spoke stiffnesses and spoke tip to road ffiction coefficient) will be specified and
the force system will then be deduced. The calculations started from the point when the
spoke whose motion is to be followed is right at the front of the contact region.
2.1.5. COMPARISONS OF MEASURED AND PREDICTED DATA
From the previous work concerning the relationship between the lateral force
coefficient and slip angle, it is concluded that the tyre and soil data are the most
predominant parameters in this relation.
Comparison between the measured and predicted results for the above relation is
shown in Figs. (2.19 to 2.25). Fig. (2.19) shows the comparison between Schwanghart's
results and those predicted by Grecenko for a 5.50-16 tractor front tyre under soft soil
condition. The plot shows that the characteristics of the curves follow a similar pattem
except that the rate of change of the slope in the measured results is higher than that of
the predicted one. The results also show a quantitative agreement at a point where the
two curves intersect at about 16' of slip angle and slight discrepancies over the other
range of slip angles.
-32-
For results measured by Del Rosario, Fig. (2.20) he indicates that the measured
and predicted results have similar trends although in quantitative terms, there are some
differences. The same behaviour as Fig. (2.19) is shown in Fig. (2.21) with slight
variation in agreement and pattern for McAllister's results. The intersection between
the two curves occurs at about 15' of slip angle.
In Fig. (2.22) the intersection between the curve measured by Krick and predicted
results occurs at about 18' of slip angle. Figs. (2.23) and (2-24) show the same overall
behaviour as Fig. (2.20) for a different tyre size and range of operating conditions. Both
figures have the same trends and the predicted results are consistently higher than the
measured results.
Measured results obtained by Gilfillan show a maximum value of lateral force at
about 180 of slip angle as seen in Fig. (2.25). Ile intersection between the measured
and predicted results are in the range from 10 to 250 of slip angle.
'Mese figures ( Figs. (2.19 to 2.25) ) show the typical measured data compared with
predicted results based on Grecenko's theory [1975], this theory being adaptable for
each set of conditions. Some of the measured results were obtained from the field and
some of them obtained by laboratory tests. It is necessary to estimate various
parameters that are not described in the experimental data. This obviously introduces a
degree of uncertainty into the results, but the exercise does attempt to test the theory
over a reasonably wide range of conditions. Comparison of measured data and
predicted results is often difficult because of the lack of soil and tyre parameters quoted
in the reports of measurements.
2.2. BASIC SOIL MECHANICS
In agricultural soil mechanics, the most relevant soil properties are the reactions of soils
to applied forces. For simplicity these properties are called "strength properties". For a
given soil they will change with time under the influence of climate, soil management
and plant growth. Ile strength properties of a given soil and their change with time are
-33-
determined by the following factors : -
1) Number of particles per unit of volume.
2) Spatial distribution of particles.
Moisture content as a percentage of total volume.
4) Moisture distribution.
5) Bonds between particles.
6) Distribution of bonds.
2.2.1. A HISTORICAL PERSPECTIVE
The development of a traction theory for off-road vehicles (agricultural, construction
and forestry ) dates from the 1940's. A considerable role in this development was
played by Bekker [1956,60,69,741. Traction theory depends upon the measurement of
the fundamental soil shearing strength and the establishment of a "deformation
modulus" to characterise the variation of shearing strength with deformation.
Significant research effort from the 1950's through the 1970's was directed
toward the development of analysis systems for evaluating mobility and predicting
tractive performance. These research efforts have led to systems which permit
evaluation of new traction mobility vehicles and concepts which minin-tise
experimental effort.
Terrain-vehicle problems involving self-powered vehicles, have a lengthy history.
Current trends of traction and mobility technology and their applications to vehicle
design have been discussed recently by Burt and Turner [1983). In ten-ns of the
relevance of traction and mobility calculations to vehicle, a number of problems still
remain. In particular, the descriptions of soil strength remains today as a major obstacle
-34-
to the development of a fully acceptable and accurate soil-mobility terrain mechanics
description.
2.2.2. SOIL-VEHICLE TRACTION PERFORMANCE
The various approaches that have been taken to analyze soil-vehicle systems can be
broadly categorised into three types :-
2.2.2.1. Semi-empirical methods
This modelling approach is based on theoretical mechanics concepts (equilibrium and
soil strength theories) coupled with empirical pressure-sinkage relationships for soil.
The maximum thrust developed by a tractive device is taken to be the local value of the
maximum soil shear stress underneath the device, integrated over the contact area. The
maximum soil shear stress acting on the device is estimated from simple Mohr-
Coulomb Failure 'Meory for cohesive-frictional soils.
An empirically developed pressure-sinkage relationship for soil is used to
calculate motion resistance to forward movement. Net pull force of a traction element
is calculated as the difference between developed thrust and forward motion resistance.
The semi-empirical approach was developed by Bekker [1956,60] for applications
to rigid wheels, pneumatic tyres and tracked vehicles. I'his analysis technique has not
been widely adopted for use in off-road vehicle design.
2.2.2.2. Empirical methods
Empirical analysis methods based on the theory of dimensional analysis and have been
developed and applied to a variety of soil-vehicle problems. The basic approach
involves the identification of dimensionless groups of pertinent variables relevant to the
problem, followed by experimentation in order to empirically relate these parameters.
'Mus, modelling laws are empirically derived through experimentation as opposed
to analytically derived through solution of fundamental equations which describe the
-35-
phenomena of interest. Ibrough application of this approach one can possibly avoid
explicit formulation and solution of the governing (typically differential) equations Of
the system.
One of the first attempts at applying the theory of dimensional analysis to tyre-soil
systems was reported by Freitag [1968]. This report successfully derived tyre mobility
numbers, i. e. independent dimensionless terms that led to empirical prediction
equations for tyre traction and rolling resistance performance in dry sand and saturated
clay soils. The mobility numbers comprise variables which describe tyre and soil
properties.
Most importantly, cone index can be measured in field conditions with a relatively
simple instrument, unlike most other common measurements of soil strength. Empirical
equations were experimentally validated over a practical spectrum of tyre-soil
conditions relative to agricultural earthmoving and forestry applications. These
equations allow prediction of maximum tractive effort and rolling resistance of a single
tyre based on tyre geometry, normal load, rate of slip and soil cone index.
Nevertheless, empirical methods using cone index was found to be much more
reliable than the semi-empirical methods as reported by Domier and Williams [1979].
2.2.2.3. Analytical methods
This approach to vehicle-soil mobility is an outgrowth from the application of soil
plasticity concepts to foundation and footing stability problems. I'lle first attempt to
apply soil plasticity analysis to problems of vehicle mobility, was reported by Karafiath
[19701.77his work was motivated by an interest in problems associated with lunar
locomotion.
The assumption of perfectly plastic soil behaviour is inherent in this analysis, thus
situations in which elastic soil deformation is of importance as referred to by Karaflath
and Nowatzki [19781 cannot be treated.
-36-
Another analytical method that is beginning to evolve for application to soil-
vehicle problems is the "finite element method". 'nis is a technique which provides a
means of representing differential equations with approximate algebraic equations. 'Me
technique has received much attention since the early 1960's and has been applied to a
variety of physical phenomena, stress, deformation, heat transfer, fluid flow, diffusion
processes and electromagnetic fields.
Numerous applications of the finite element method to problems of soil and rock
mechanics have appeared only over the last decade. Far less effort has been directed
towards finite element modelling of soil traction problems. Ibis modelling approach
reported by Chung and Lee [1975] was more ambitious and treated the soil as a
nonlinear viscoelasto-plastic material.
The finite element meth , od will most likely be the vehicle for implementation of
the theory. The major disadvantages of this method are associated with the large
computer resource and costs and the complexity of the software required to conduct a
general nonlinear analysis.
2.3. CRITICAL SUMMARY AND CONCLUSIONS
The above survey has shown that, most of the tyre studies to date have been directed
towards the tractive behaviour of off-road tyres. In contrast, for fewer measurements
have been concerned with the lateral behaviour of off-road tyres.
Reports of measurements of combined lateral and longitudinal forces are even
more scarce and consequently, empirical or analytical descriptions of the behaviour of
off-road tyres in generating these forces are not generally accepted although some
attempts have been made to develop such descriptions.
Because of the small amount of work done on lateral off-road tyre, behaviour and
on measurements of the associated soil parameters, little success has been achieved
either in relating tyre forces to soil properties or in developing predictive expressions
from a fundamental soil mechanics viewpoint.
-37-
According to the above summary and literature survey, it is suggested that better
off-road tyre models are needed, firstly, to represent tyre behaviour more accurately,
secondly, to understand the tyre-soil interaction in more detail and finally, for use in
off-road vehicle handling and stability models.
2.4. OBJECTIVE OF THE THESIS
The objectives of the work described in this thesis are :-
(a) to understand the mechanisms by which tyres generate forces on deformable
surfaces.
(b) to develop models of varying degrees of complexity to describe this behaviour.
(c) to compare results predicted by these models with available data for tyre
forces.
(d) to draw conclusions about the accuracy of the models and make
recommendations about their usefulness in off-road vehicle dynamics problems.
"dVECHSITY LIBRARY LEEDS
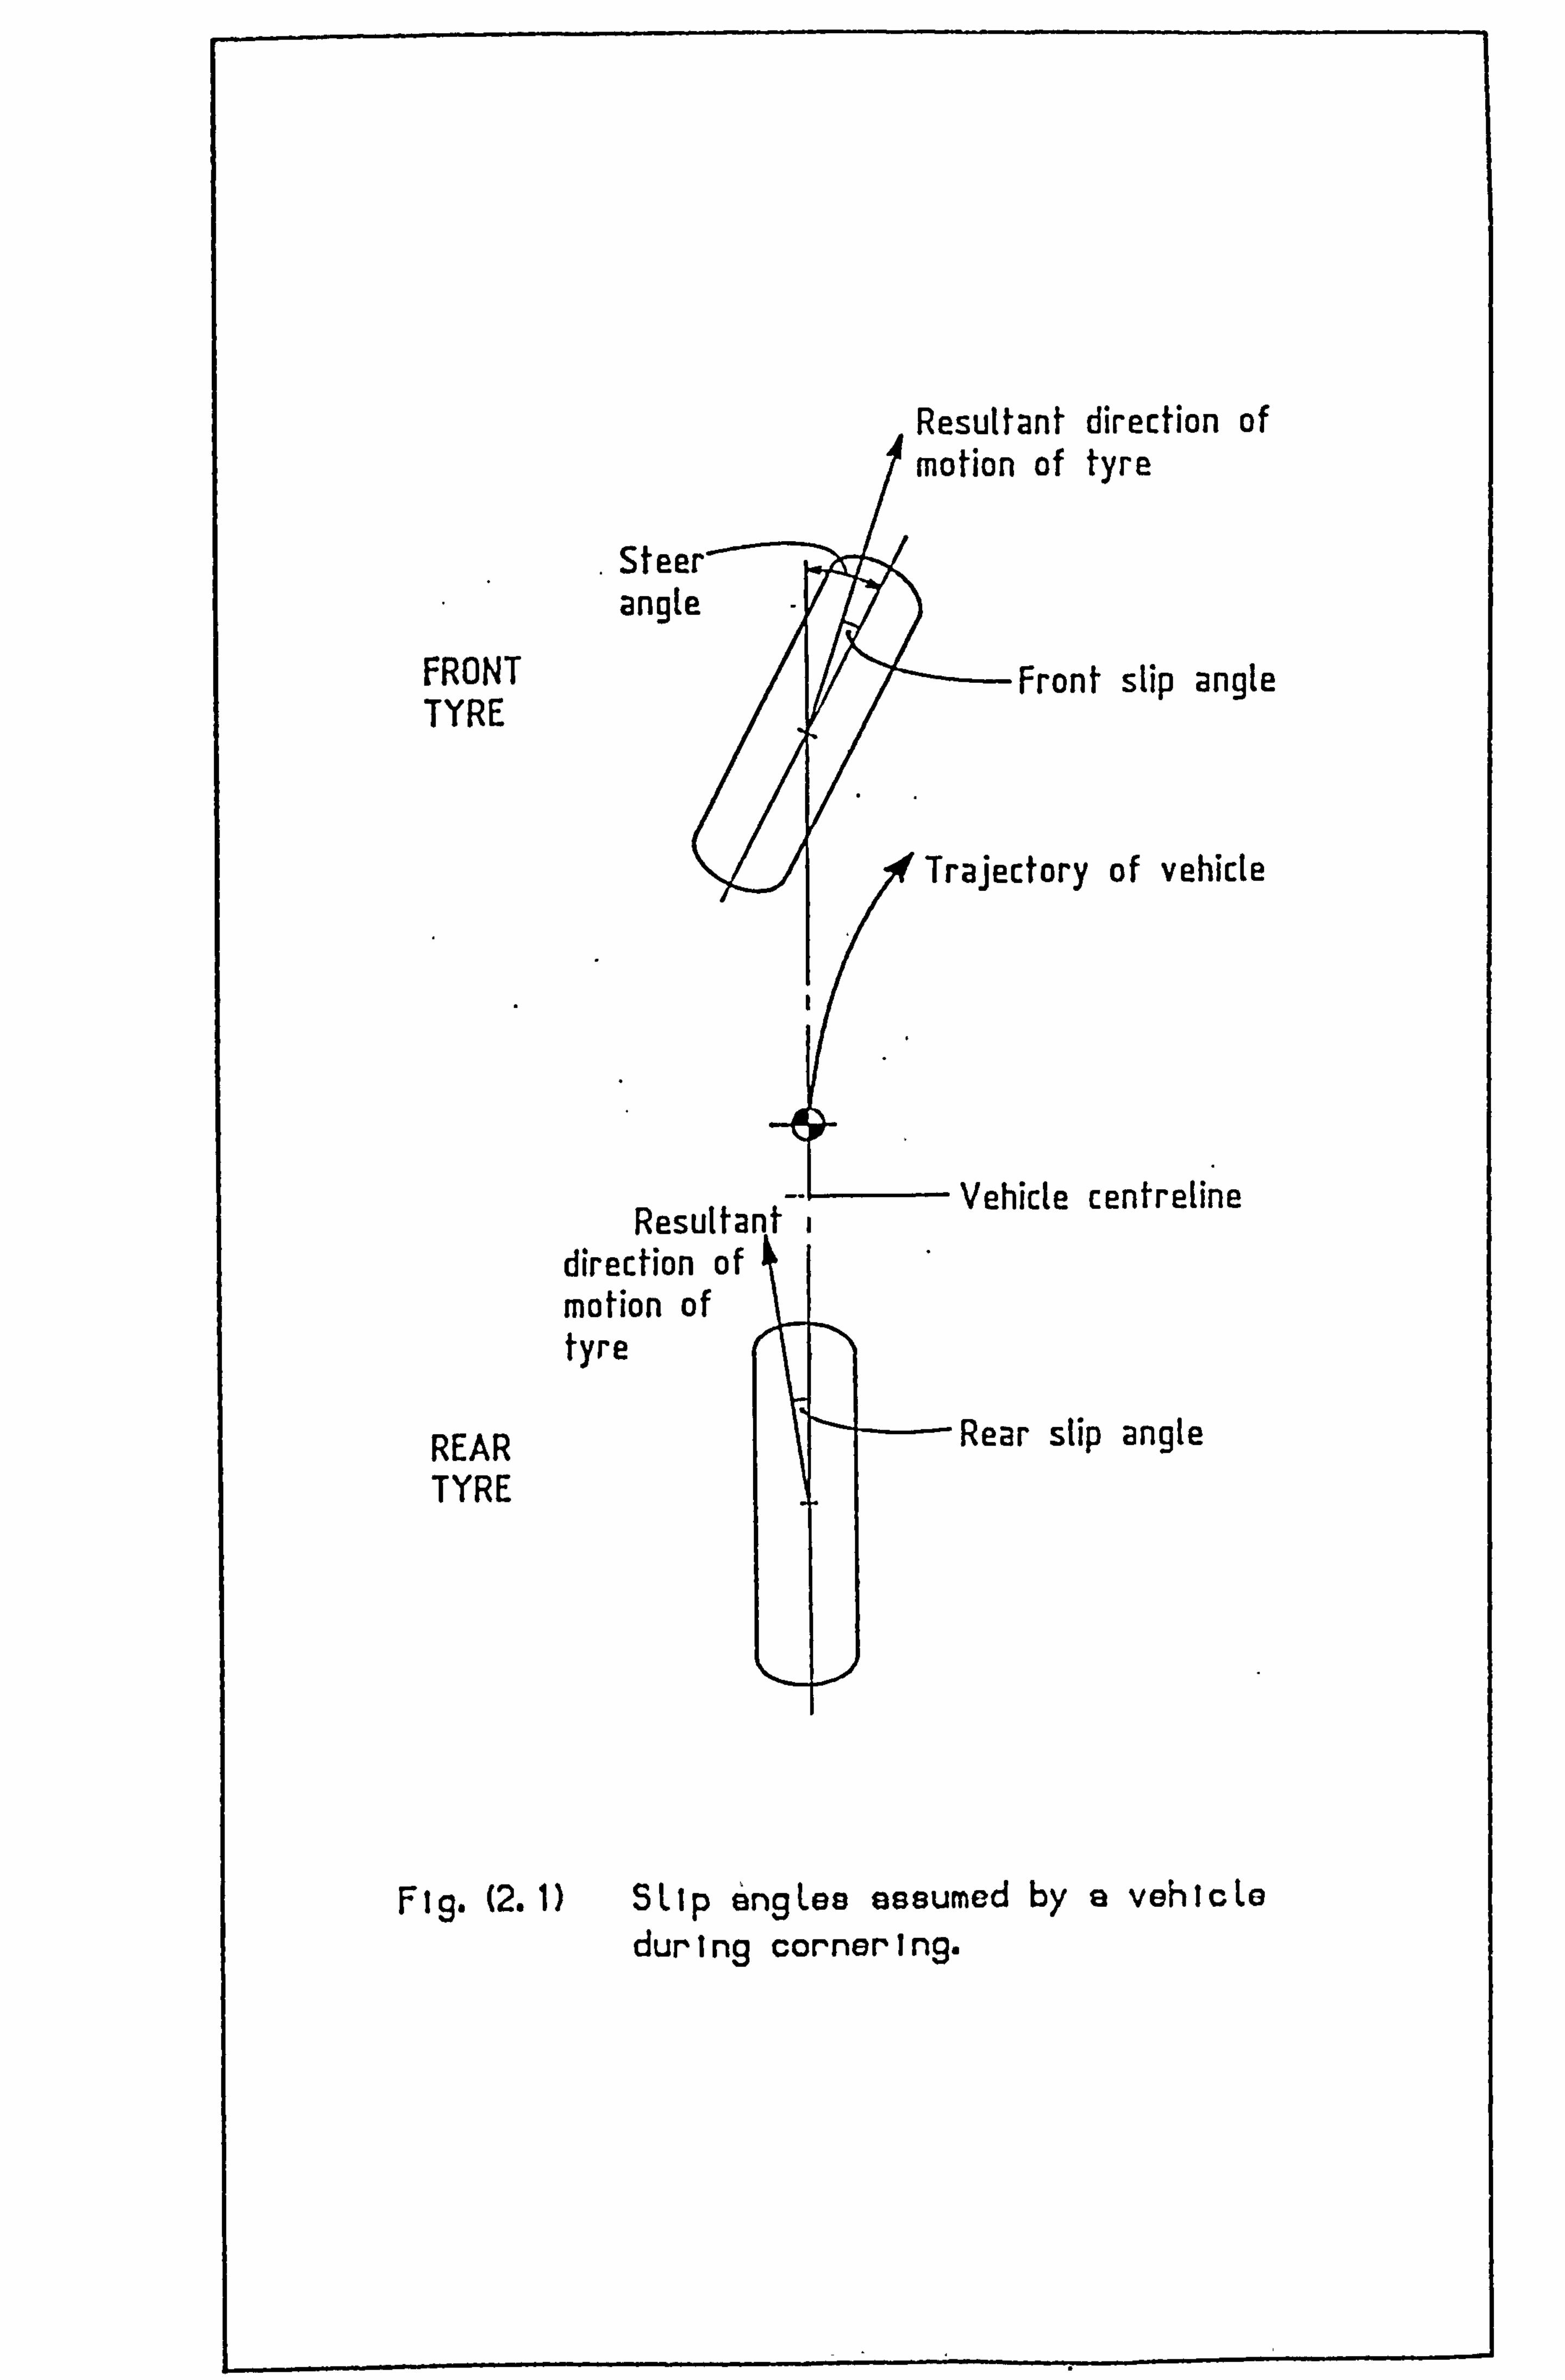
Resultant direction of motion of tyre
FRONT TYRE
REAR TYRE
Steer' angle
Front slip angle
Trajectory of vehicle
Resultant I -Vehicle centre[ine direction of motion of tyre
k
Rear slip angle
(2.1) SLIp 6ngLes assumed by a vehicLe during cornering.
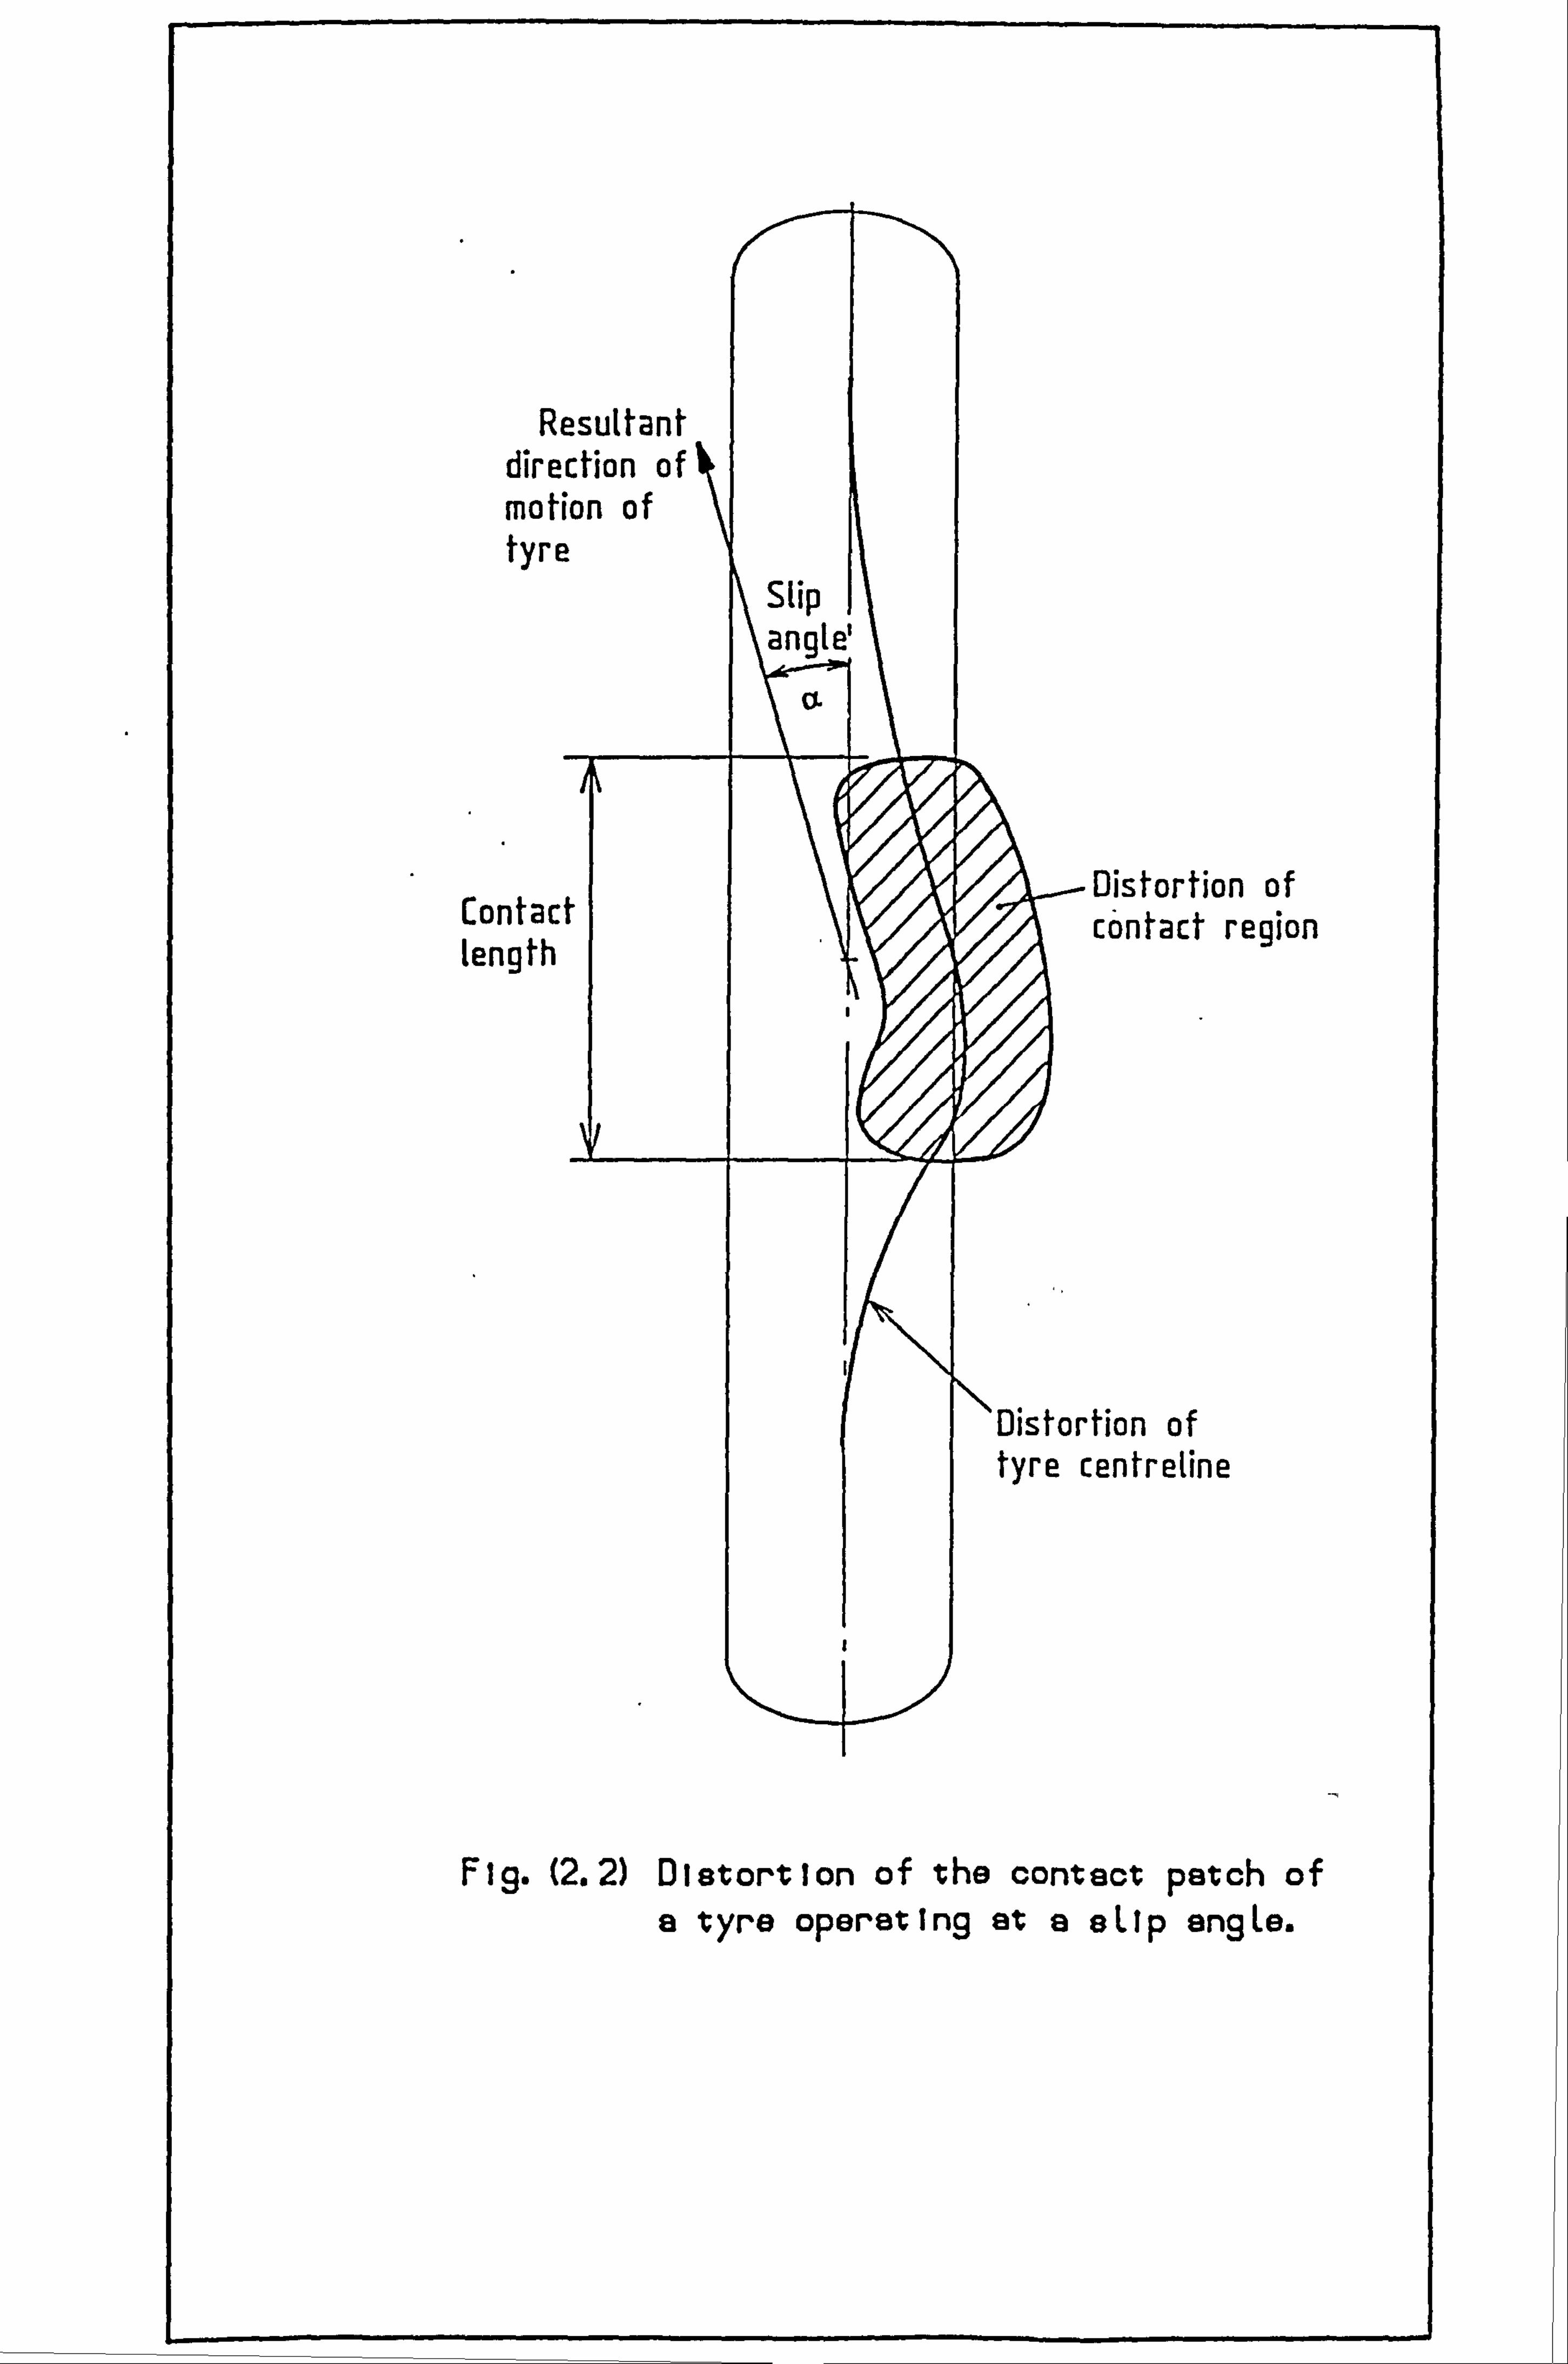
Resultant direction of motion of tyre
Slip r I angle:
a
Contact D* istortion of
length contact region
Distortion of tyre centreline
Fig. (2.2) Distortion of the contact patch of a tyre operating at a sLIp angLe.
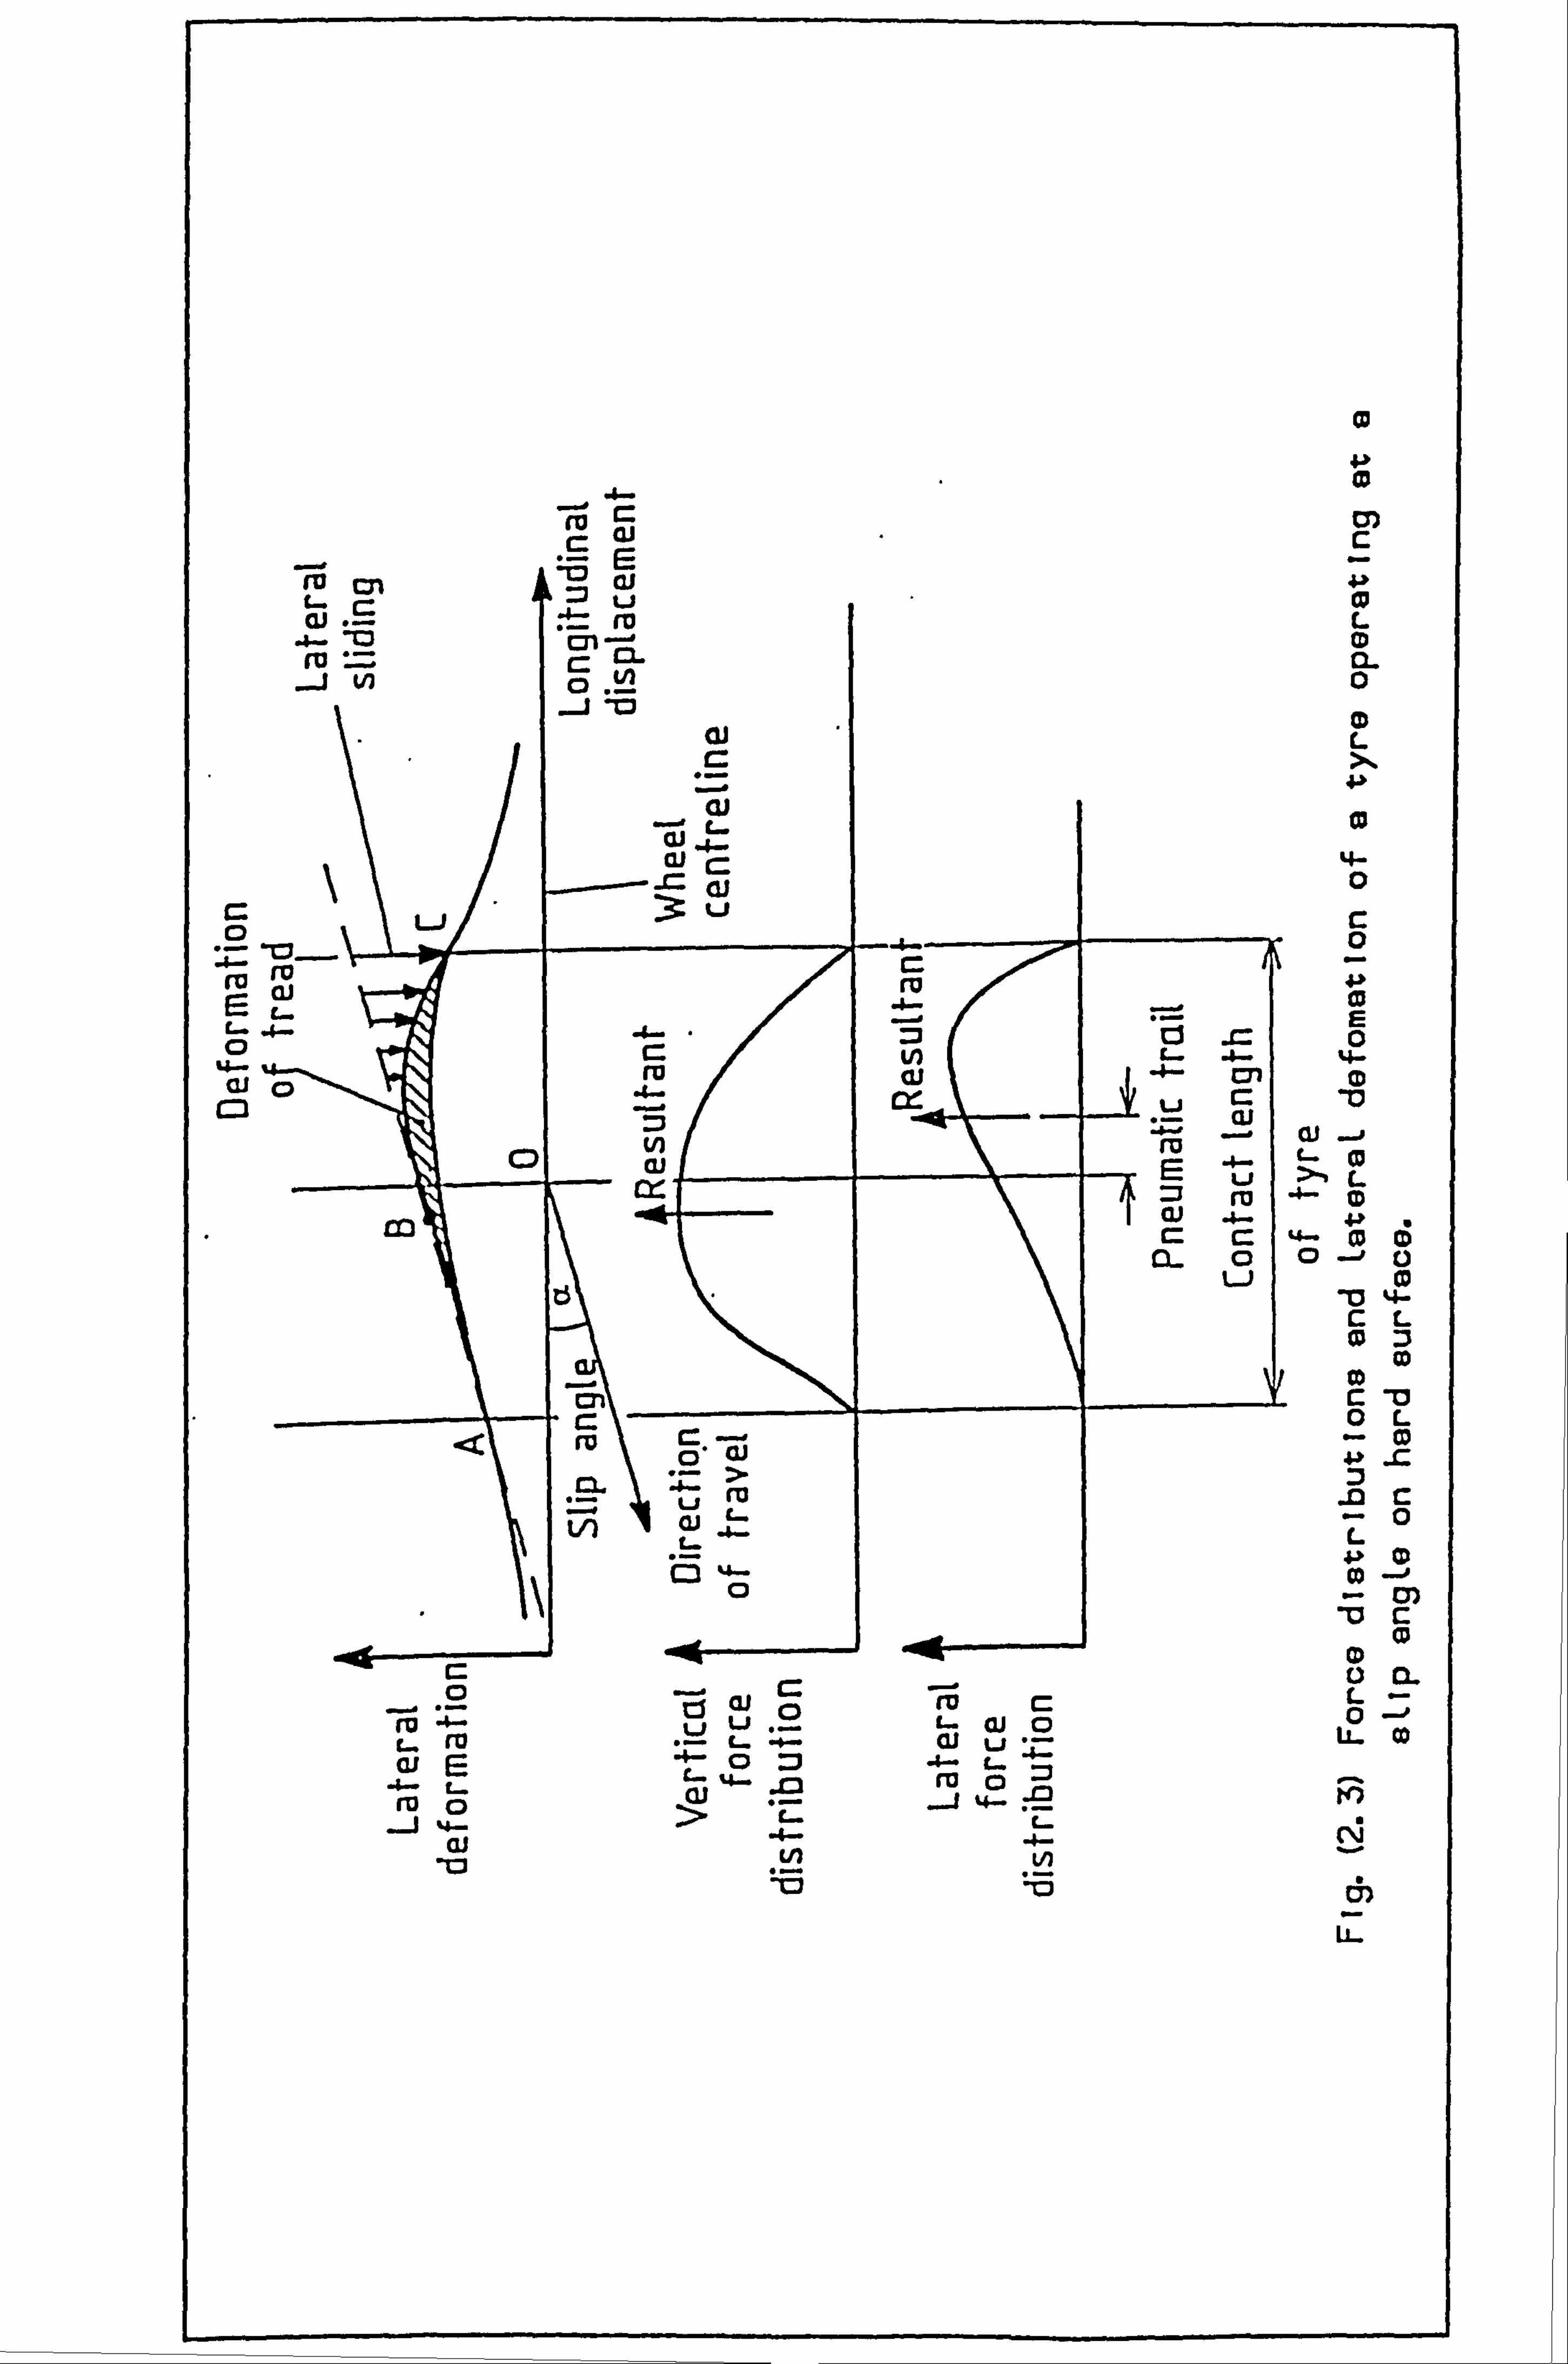
c3 4. -1
CM 9 M tj w - c: ro L
CL Cl-
L
ý t- CD 4-
L i w
= 'C2_ -4- -
ra ro r_
13 E 0
ru 4- c71 (IJ
c2
v vi a ai i vi
- üý 1
123 (1) r_ . 4-
C ts- Cß 0; CL 0 (D , 0
L-i (0
C L
cn c Z] 0 L
. - CD c) OJ
=> ru Ja c Li vi L 0
CD C»
M r_ (9
(D r_
-c - fi L
(2- tj (U 0 LJ W . -
ru L-
r_ cii C) C)
u Co C- to .- L- -s- C>
(11 -4-
ti = t- -
a) ra C: )
(U CD
ai Ln
ZD i-
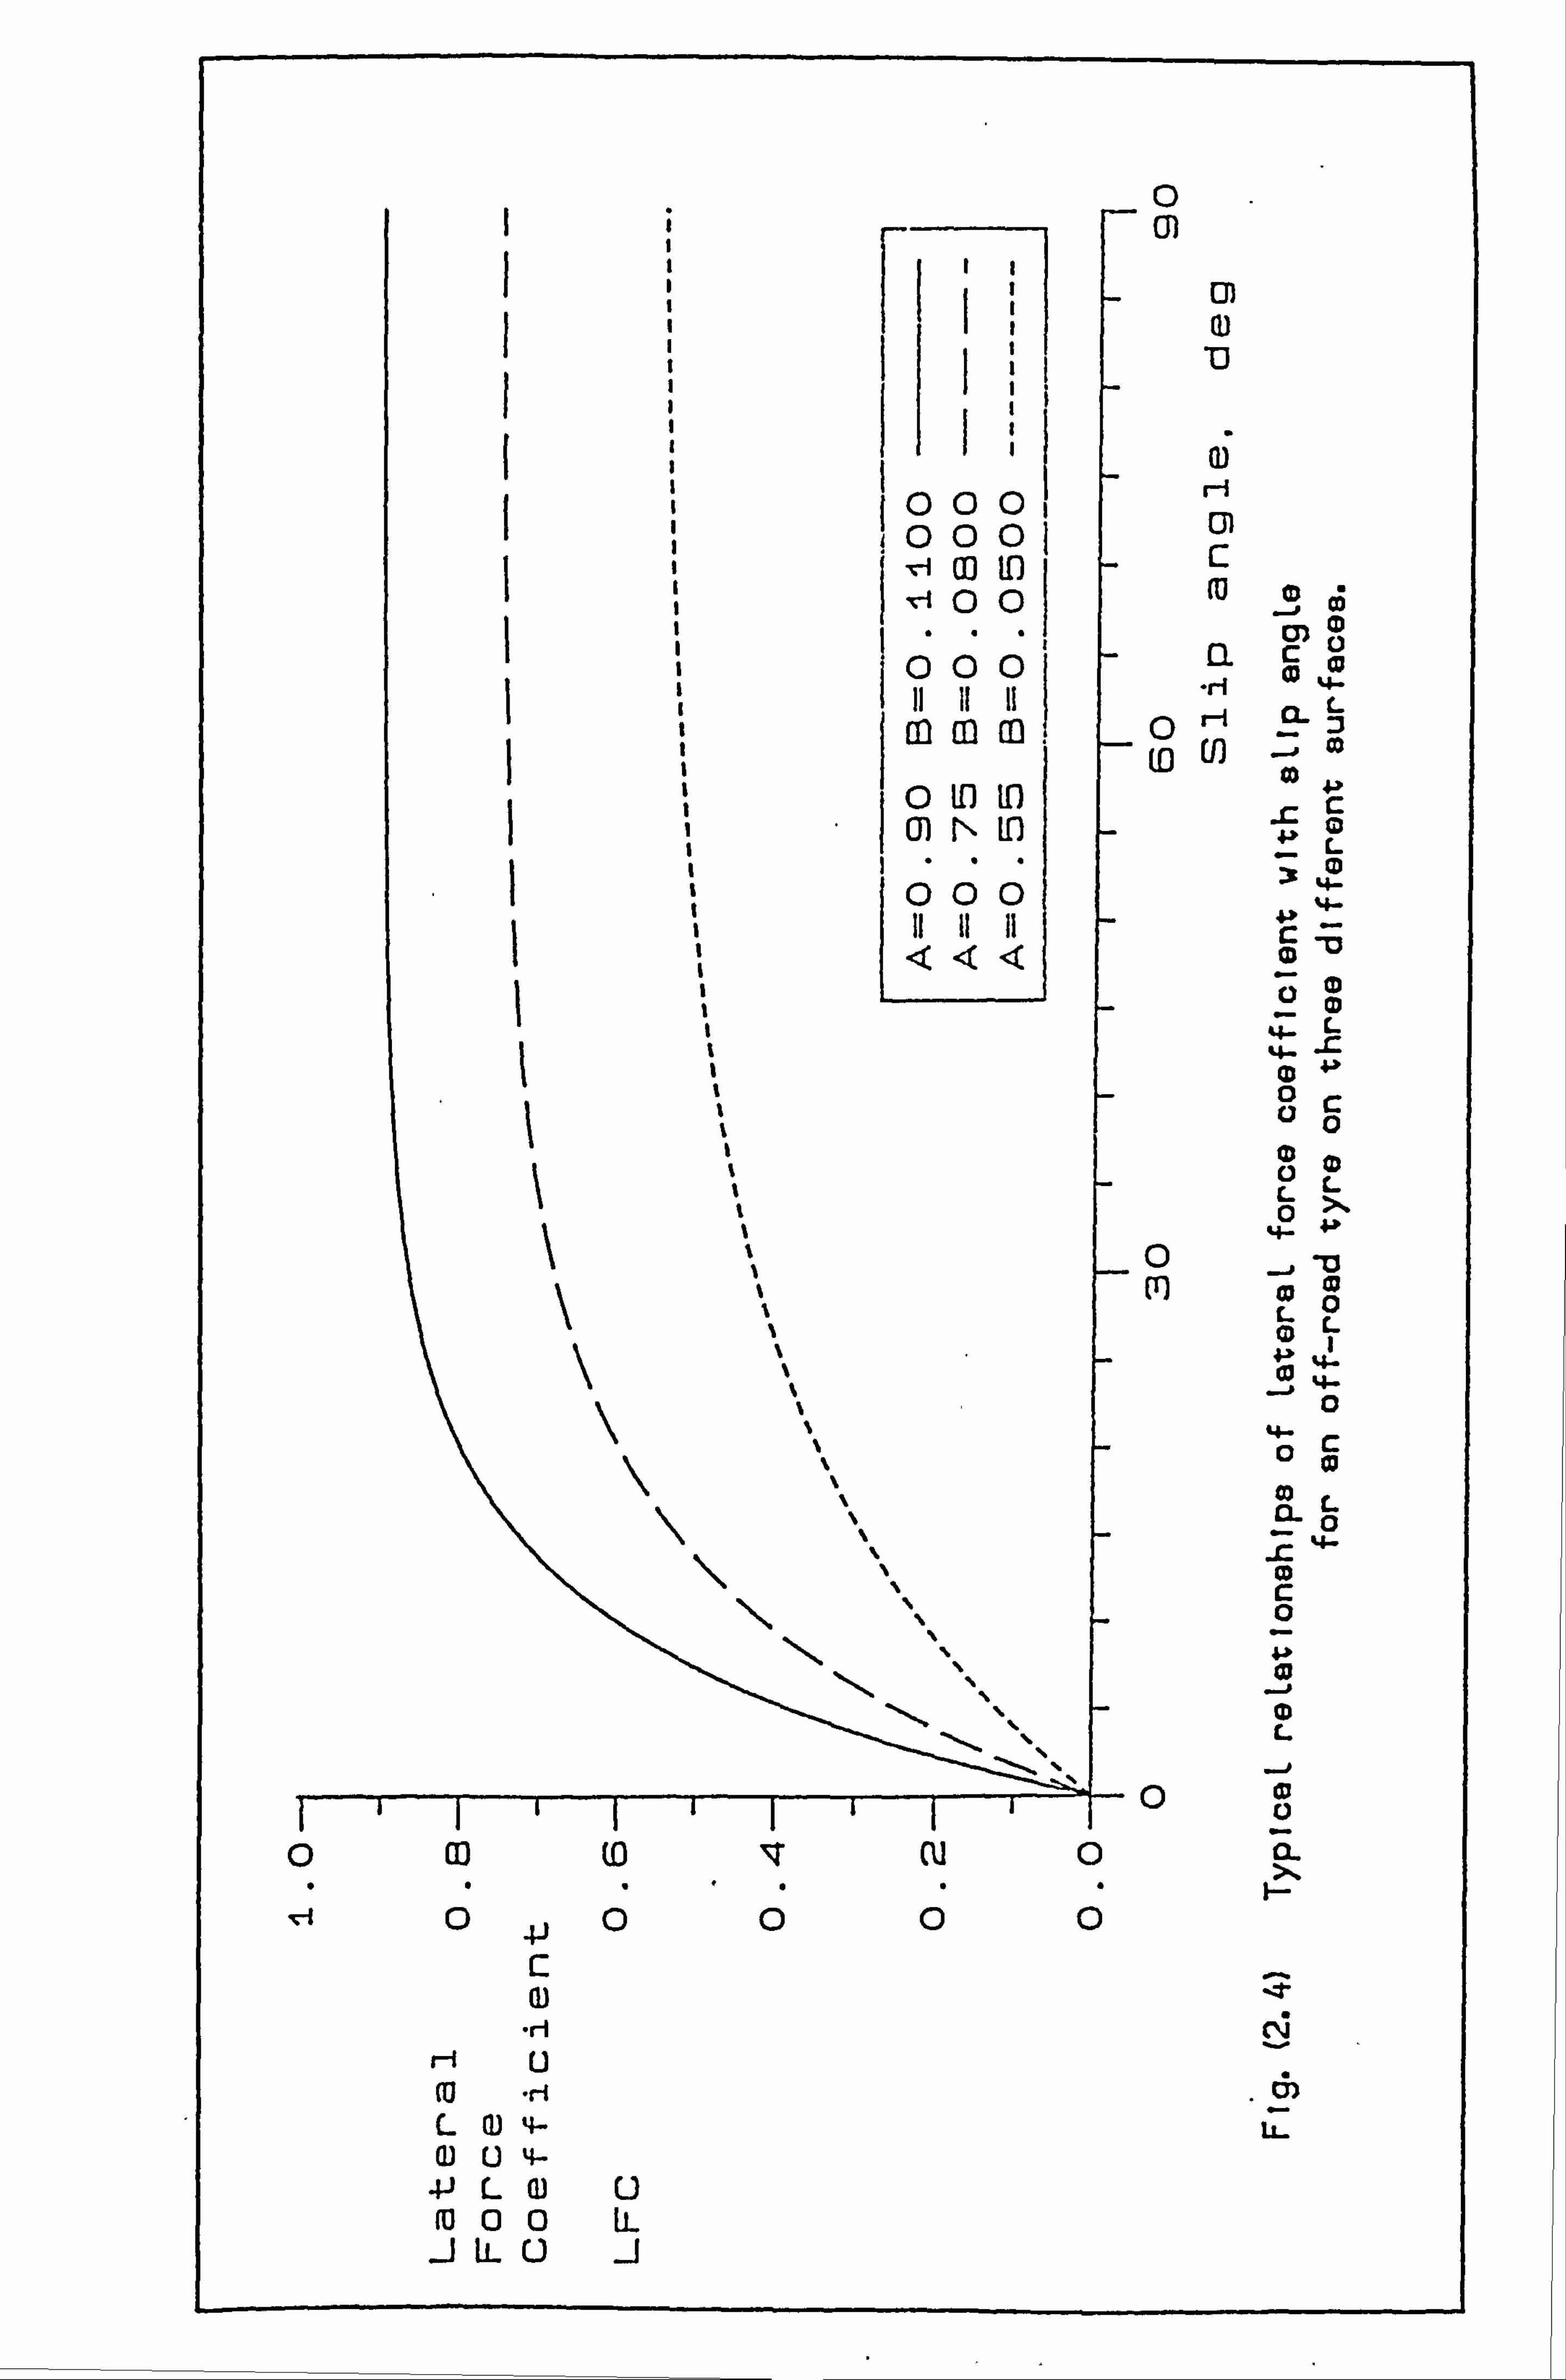
0
10001 00 01
03 to
I 1-1
00 .20;
Im (D It
-a 'C
000 11 11 11 rf
02 M (11 0c to II
co 0 ID to c
-C Q If) L CD
4-
-13
CD 0
0 (D LL 0
-0 m L0
oL 4>
0 % 4- c
%0 93
%0L
%
c
CD ri
0 (1) (D 17 (U 0i
0V0000
c-
a) -ýr . rl L)
L 0) '4- L (D 0 4- VL a) u fu 00 -i IL L)
1.0
x CD E -Gee Ou h
u 0.8 g
CD
0.6 - Cross ply tyres, %4-
L#_ \
COT from McAllister CD 0 / nax 0
CD 0&4 L 0 %4-
0.2 Ca
00 10 15 20
10
x E6- U U- --I
C6 k. C0T,, ax
Ile lArgVICter 1ý > U U-
. 01 0
0 . 01 CL 0 ross
CO t C 1-6
0 05 10 15 20
MoblLity number, EMOB
Fig. (2.5) EmpiricaL reLationships of tyro force parameters with moblLity number.
At
4 JC
o s
1 km :ý
REA
: 20 O IS .
20
. 25:
. 10
.3 cr
-e
FIELb. PLOWED 04 25::
u cc
91 35ý. 4A
1LM5
a : 3e
25:
70 ROA ET 45*
2(f 2 18:
3cr
ýe
Q'- 123& kN 5 WHEEL LOAD
3: 1"
15"" -
L kN5
L kN5
i
U
w 01 iA-
GRAVEL
is*
a
. 10. 2v
5ý
0' 123L kN b
3 4L ]FIE ONE 7
N 2ý5 0 'TILLED
23L kN 5 WHEEL LOAD
FTq. (2.6) Effect of verticaL Load on the LateraL force for a tractor tyre on 8 different surfuces with various sLip angLes, Schwanghert 1981.
3: 10
- ROAO. DRY Wal L kN z DiRl
:, L
%n W. 11
LL LL LU 0
4ý -- r/vý
2- 'ý37 37
LL w 6
39
was. u wos u 47 2 11-) 2 0 LL
w
Ln W
a too 200 0 10* 20* 3e
ý: 1.01
MEADOW 3: 1.0
SANDY
Ln 4. n LOAM. DRY
w LL w L
LL LL w W--25kN
31' * 0 u LB 31 / ý31 0
u 2 s - \,
w 05 A. - w 05 , - u
LL W 1.3ktl
w
0 '13
09 - Ln
0 100 20* 30' 0 low 200 30' 1.0 IFIELD. 3:
1.0 GRAVEL
WZITSICN PLOWED
LL LL LL Ws LI kN
Uj w
w 05- 26 u w 0.5
. --s< u
Cz 3r. u
cc 25 LL. LL
ul 9 - uj 0 -
13 Ln
0 20' 3e 0 10 20,30" to
ROAO. WET 1.0
FIELD. AT-7
Ln TILLED
I
U: LL Ln
WXLT 'PH U: u w 05
L8 33 1' LL ui 805 WOL IcN
u Ir 2 ! 6ý
i I ui u 7 7ý\
II
LL ý --, - -- - L
tu 7
P: ý
Ln 53 - )73*
2(f Zn
0 to 2: f 30' WRIFT ASSLE a DRIFT ANGLE a
Fig. (2.7) LateraL force coefficient/sLip angLe reLationships for a 7.50 x 16 tyre with di fferent verticaL Load, Schwanghert 1981.
Wal L kN ;Q ROAO. DRY
2 7
MEADOW
L LB 31
.. Z. *25
W 1.3kt
ROAQ. WET
WXLT 'p N L8/33
26
W. 11 r DIRT ROAD
61
47 25ý1
SANDY LOAM. DRY
. DRY
W--25kN 3.
13 09 -
GRAVEL
Ws Ll kN L9 3 3\
j 2 5_
ý x
/11 t llý Vl*'
--I -I
13
FIELD. AT-7 TILLED
WOL IcN
77ý
" 55 173
LateraL Force, Lbf
1500
1000
500
0
-500
-1000 -500 0 500 1000
(Braking) (Driving) LongitudinaL force ,
lbf
1500 2000
Flq. (2.8) The forces messured by Janoel 1981 for a tyre on soft sol L.
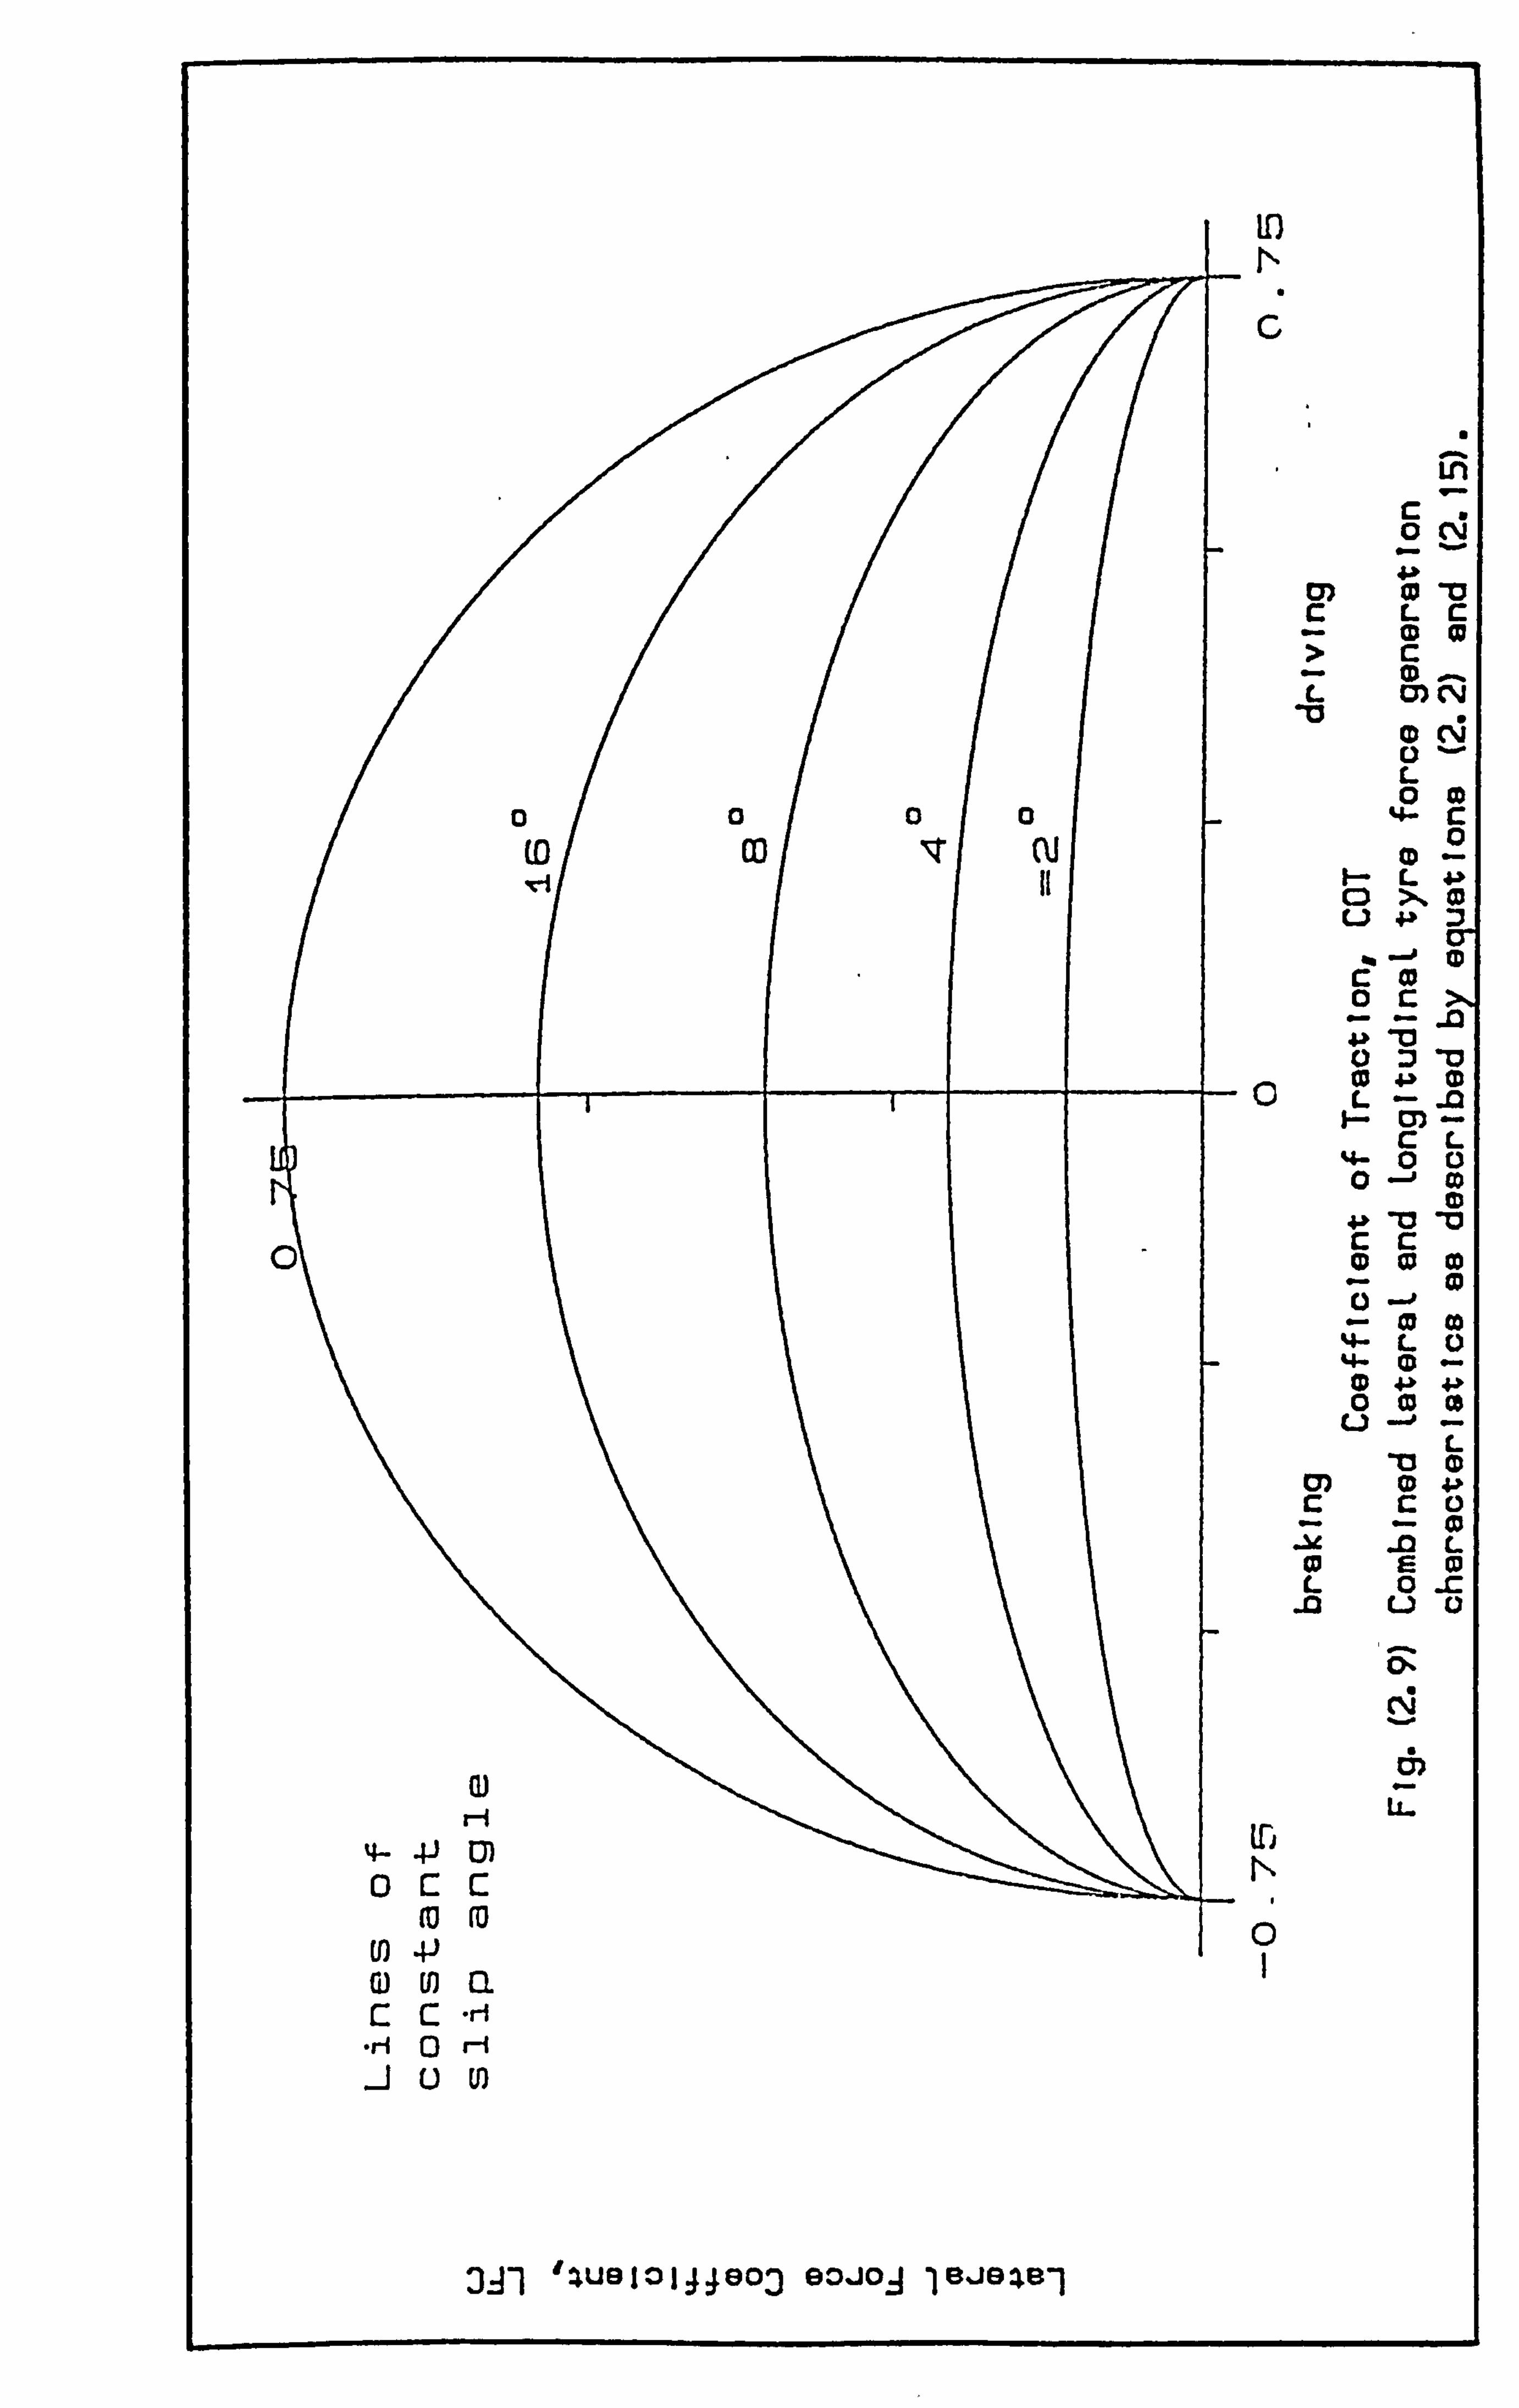
0 c%] 4. * m 0 -0 c LC im im
> c im - 7
c» ry lu 0
Co Z (U F- L 4. % CD X0 LJ :3
r c ID
0cX M
0Z 10
- 0 4.3.0
11 c L- -0 CL 0 fi
4. > -CI M
0 Co L0
00 Co
L 'Z] (D
ML E cu
L 0 _c
0) - ri 4j
(U 10
0
U U)
331 #ZU910144903 90-jo3 lejezel
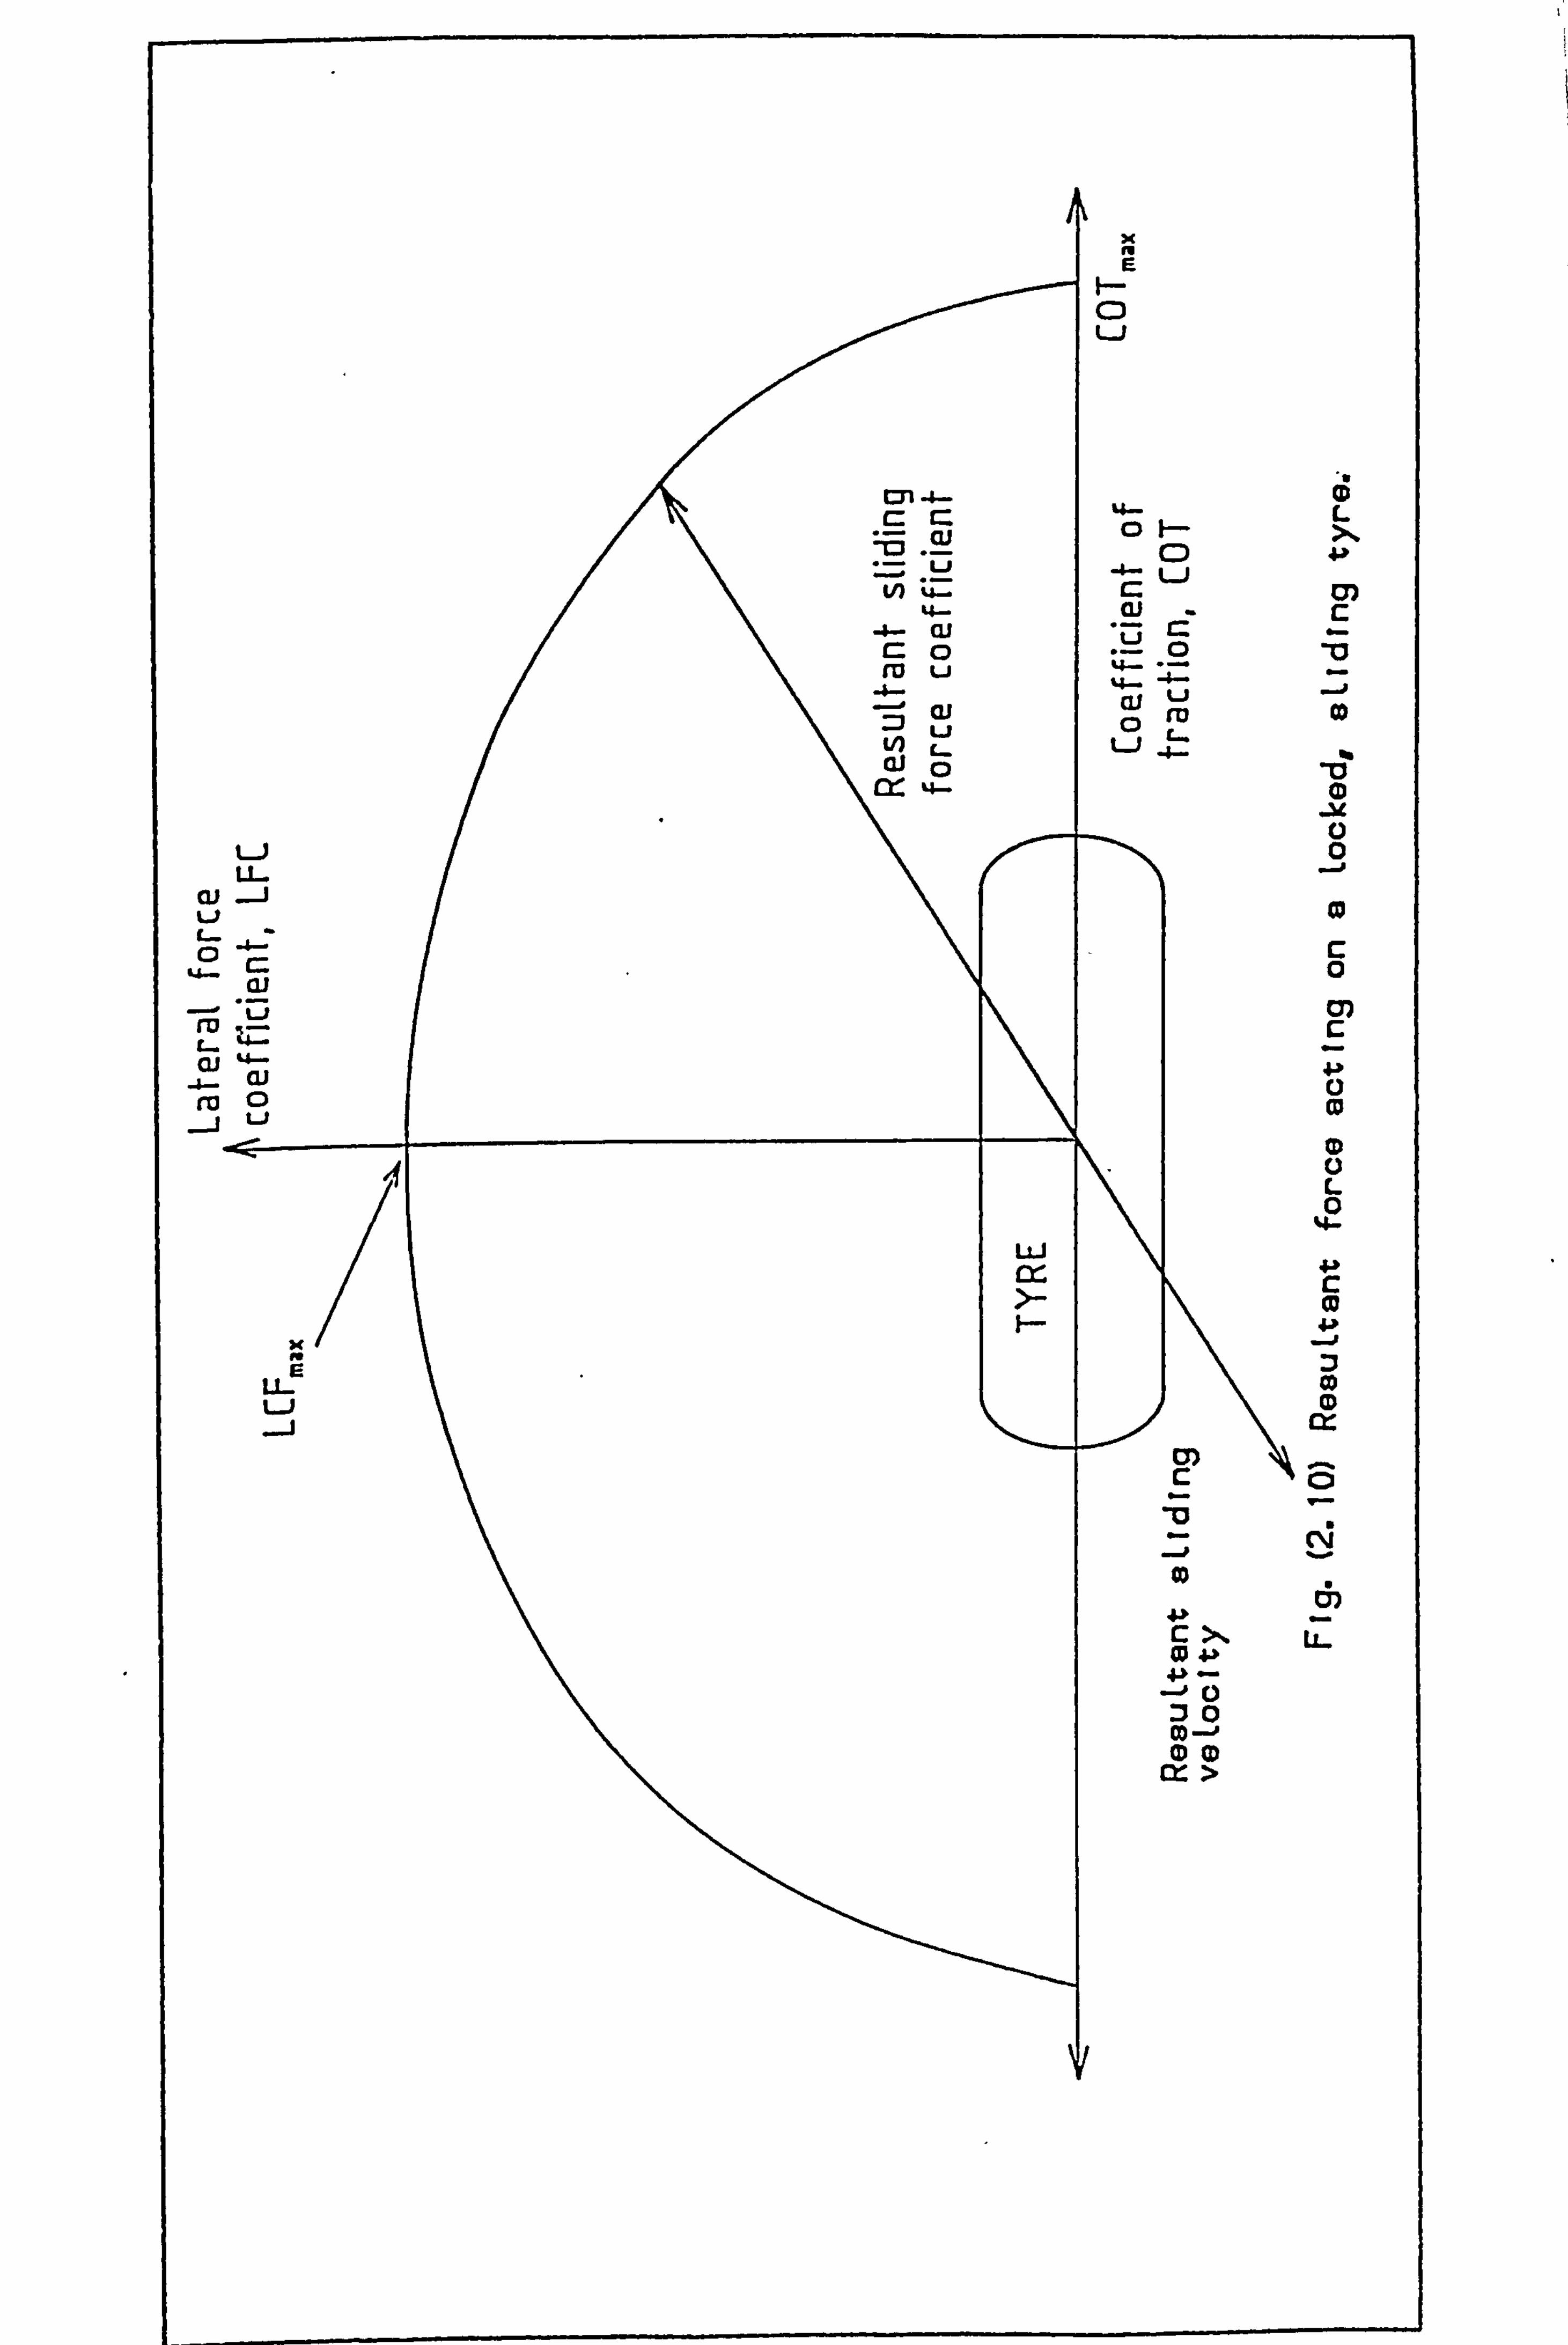
E F- C: )
CD
K&- ai - c -4. - cii
CD 0
w Z Cli m CD
Co Li 0 L- Li
GJ C) -0 0
Li 0
cii _j
al LJ
cu -4. - (Li ra C: ) 0
(D 0 L
LLJ
u (D
CD
Co 6) 4. > - cX
:x0 M --0 (DM
>
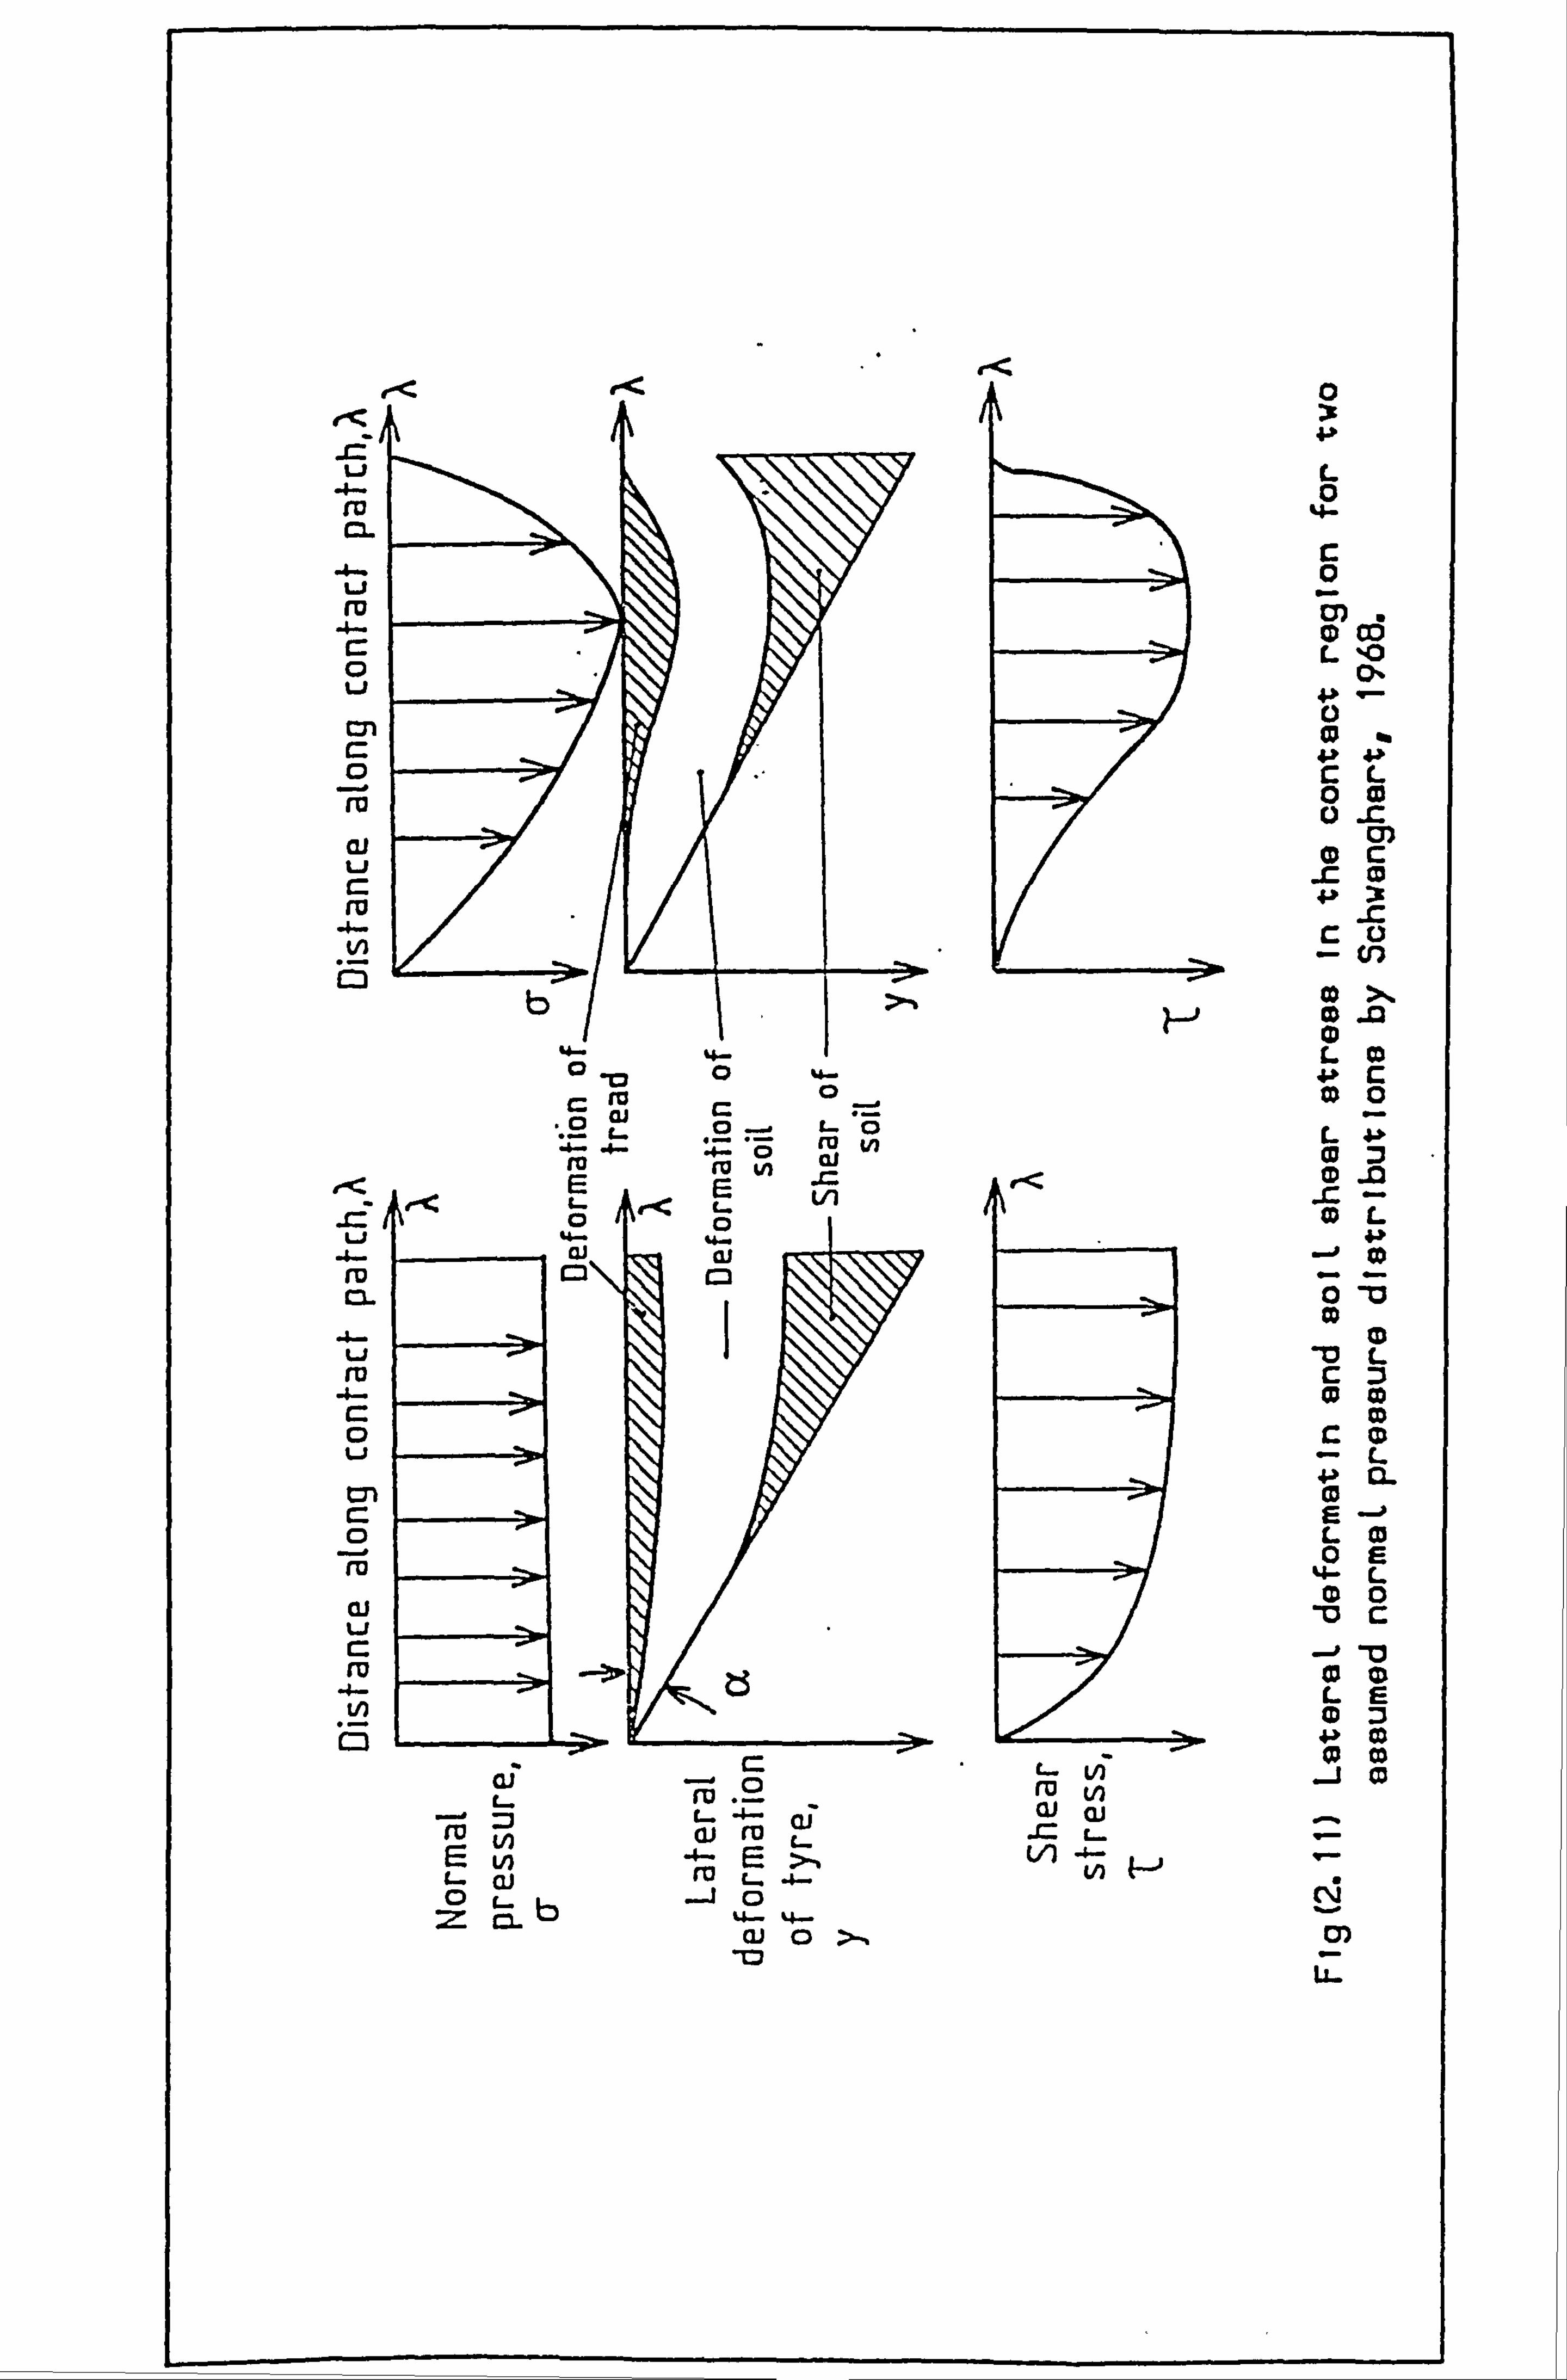
e< ffi A :c i ý 4. >
.d
4. 0 Co cz
L 10 0-
rn r_ CD c: L m 00
0 _c ai CI)
0c 0
ro X -4. - c ri V)
0
9- =
#-< vi r= (D 12
C- CO L
Li -4. - (D CL 0 -11
> 1
Li _O L
tn
L0 0E m 4- L 00
ai -0 c
m LE
r= Ln 4. - n 9- ci m t- -4. - t 0 '- b __j 0 tý
- = c2- t. 6. - 4. - ai 0 m
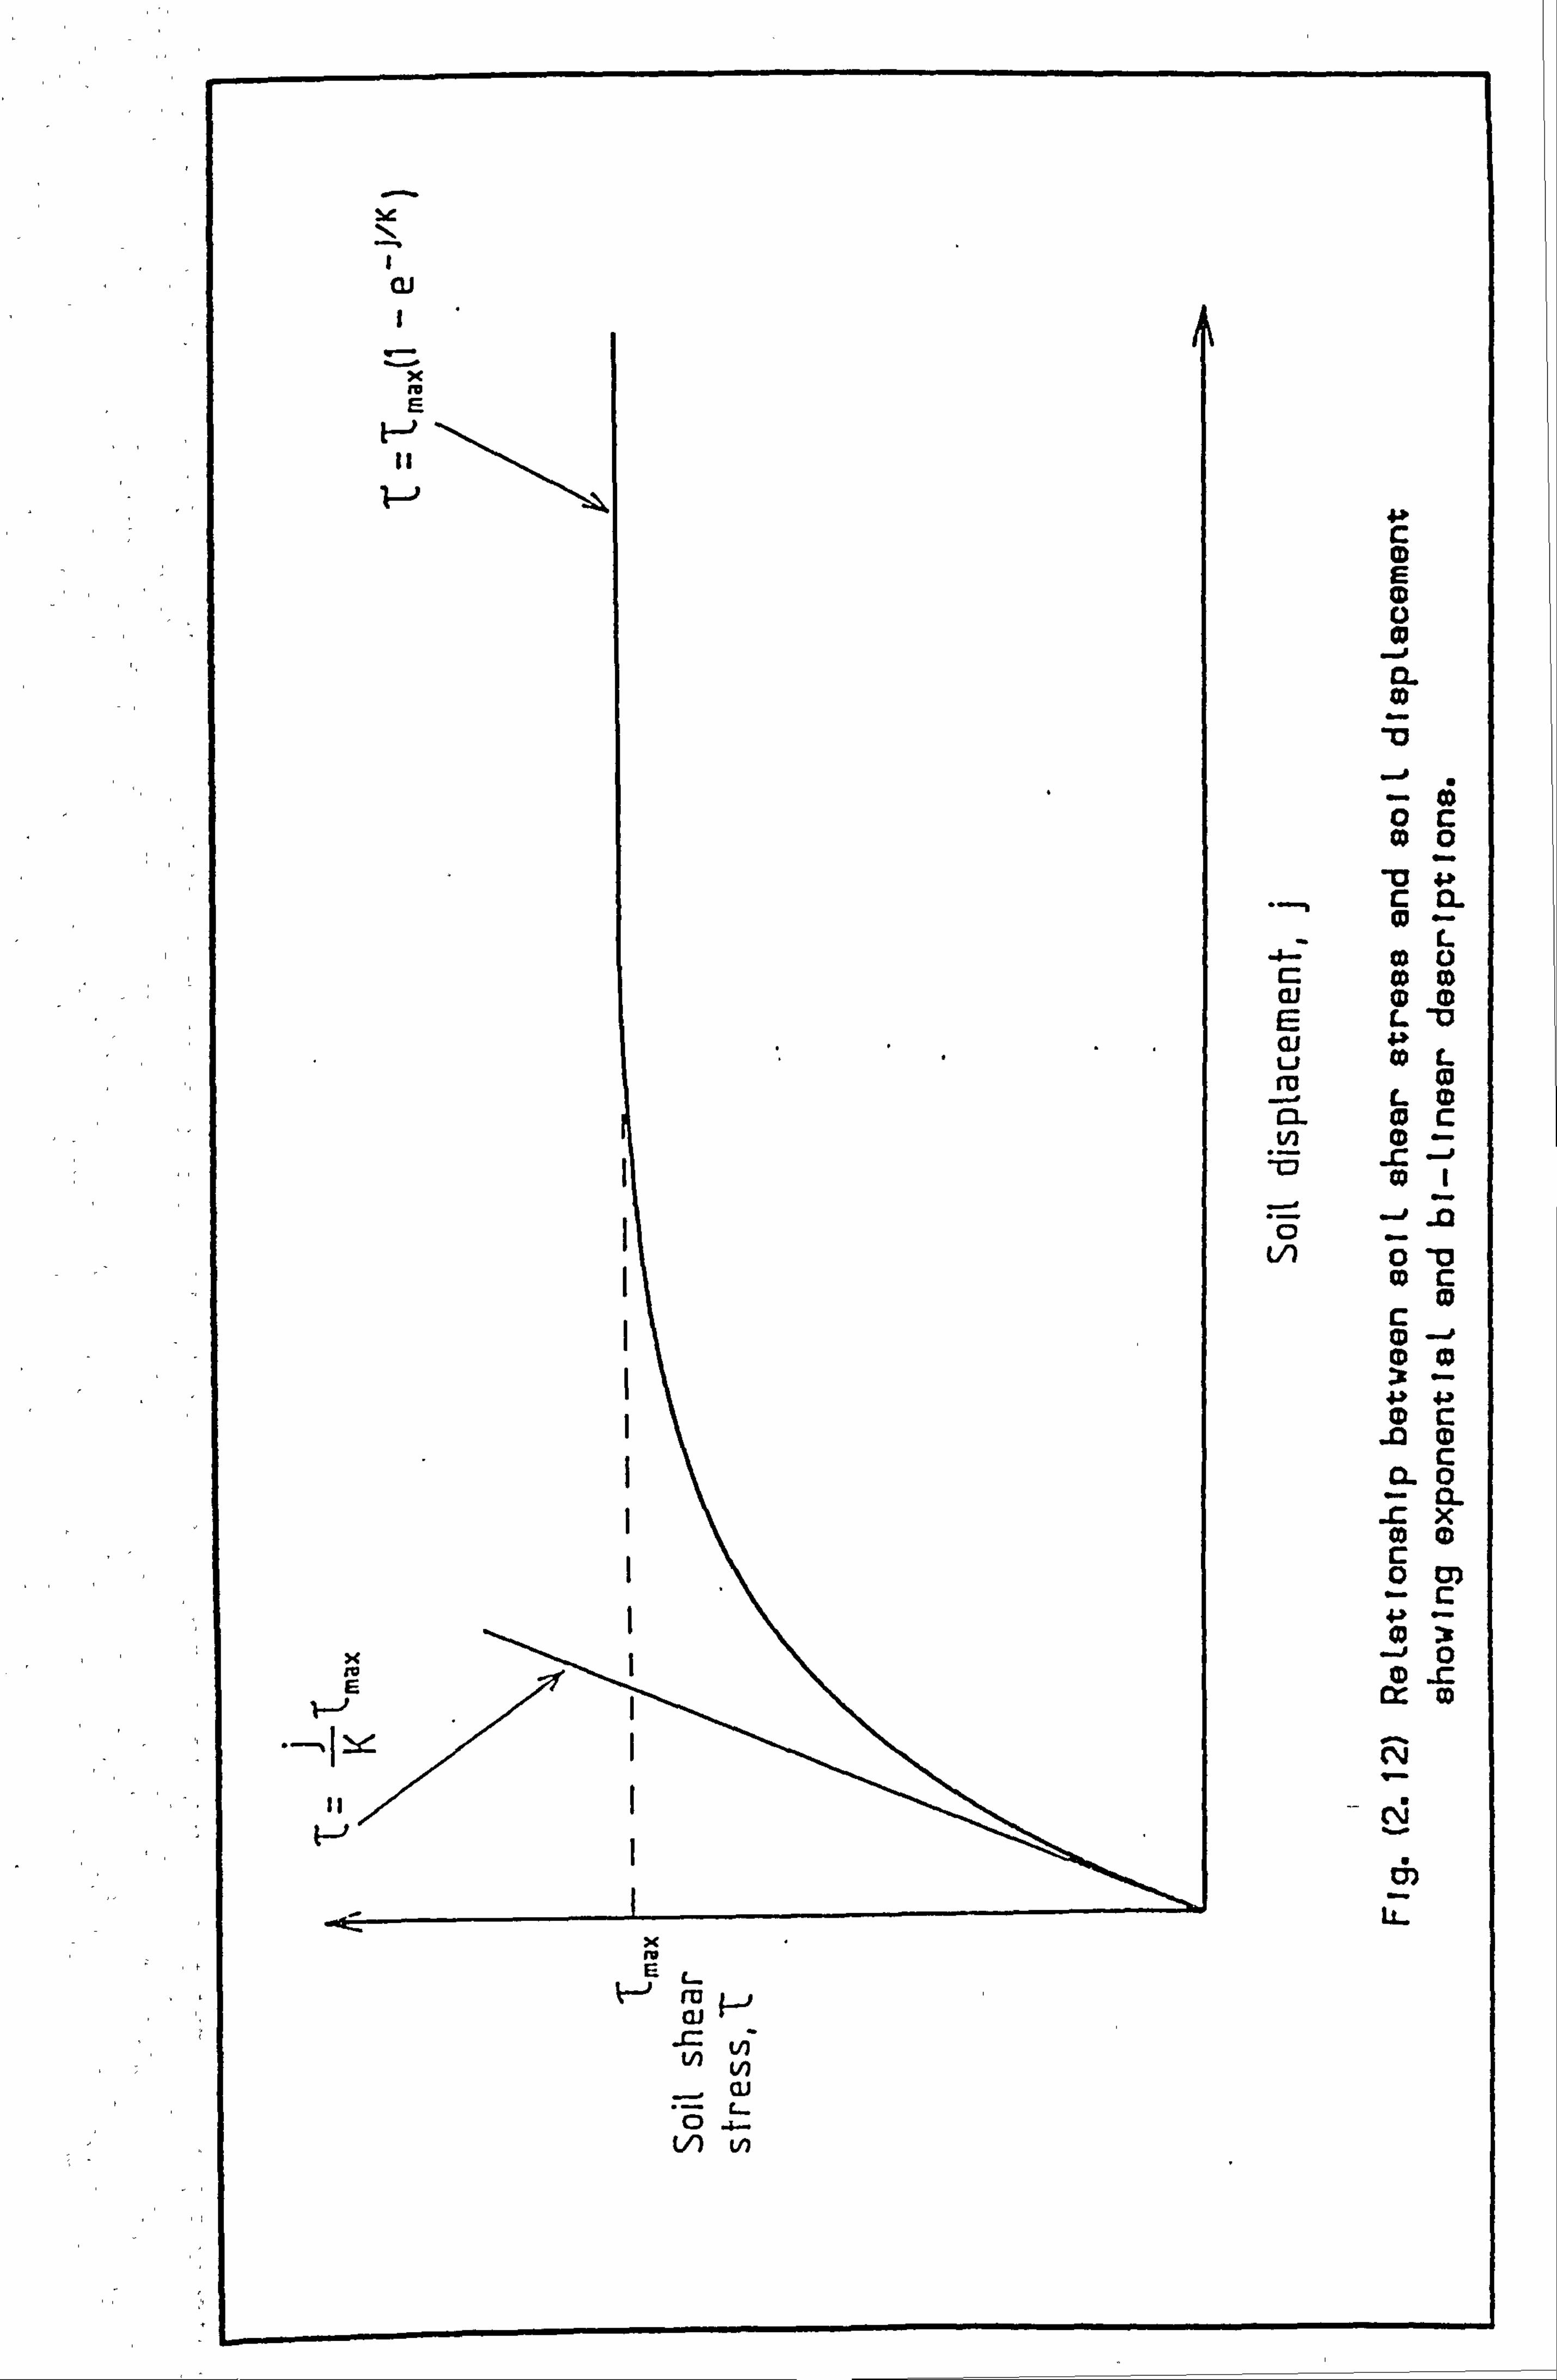
ei
E
--0 92-
L '10
Li CO L m 0
L (D CL 0c !2 (D -
.
LA
0c Co c (D 0
ID C .M (D CL 0
92- .Z
E a: Co
VT vi tn
In
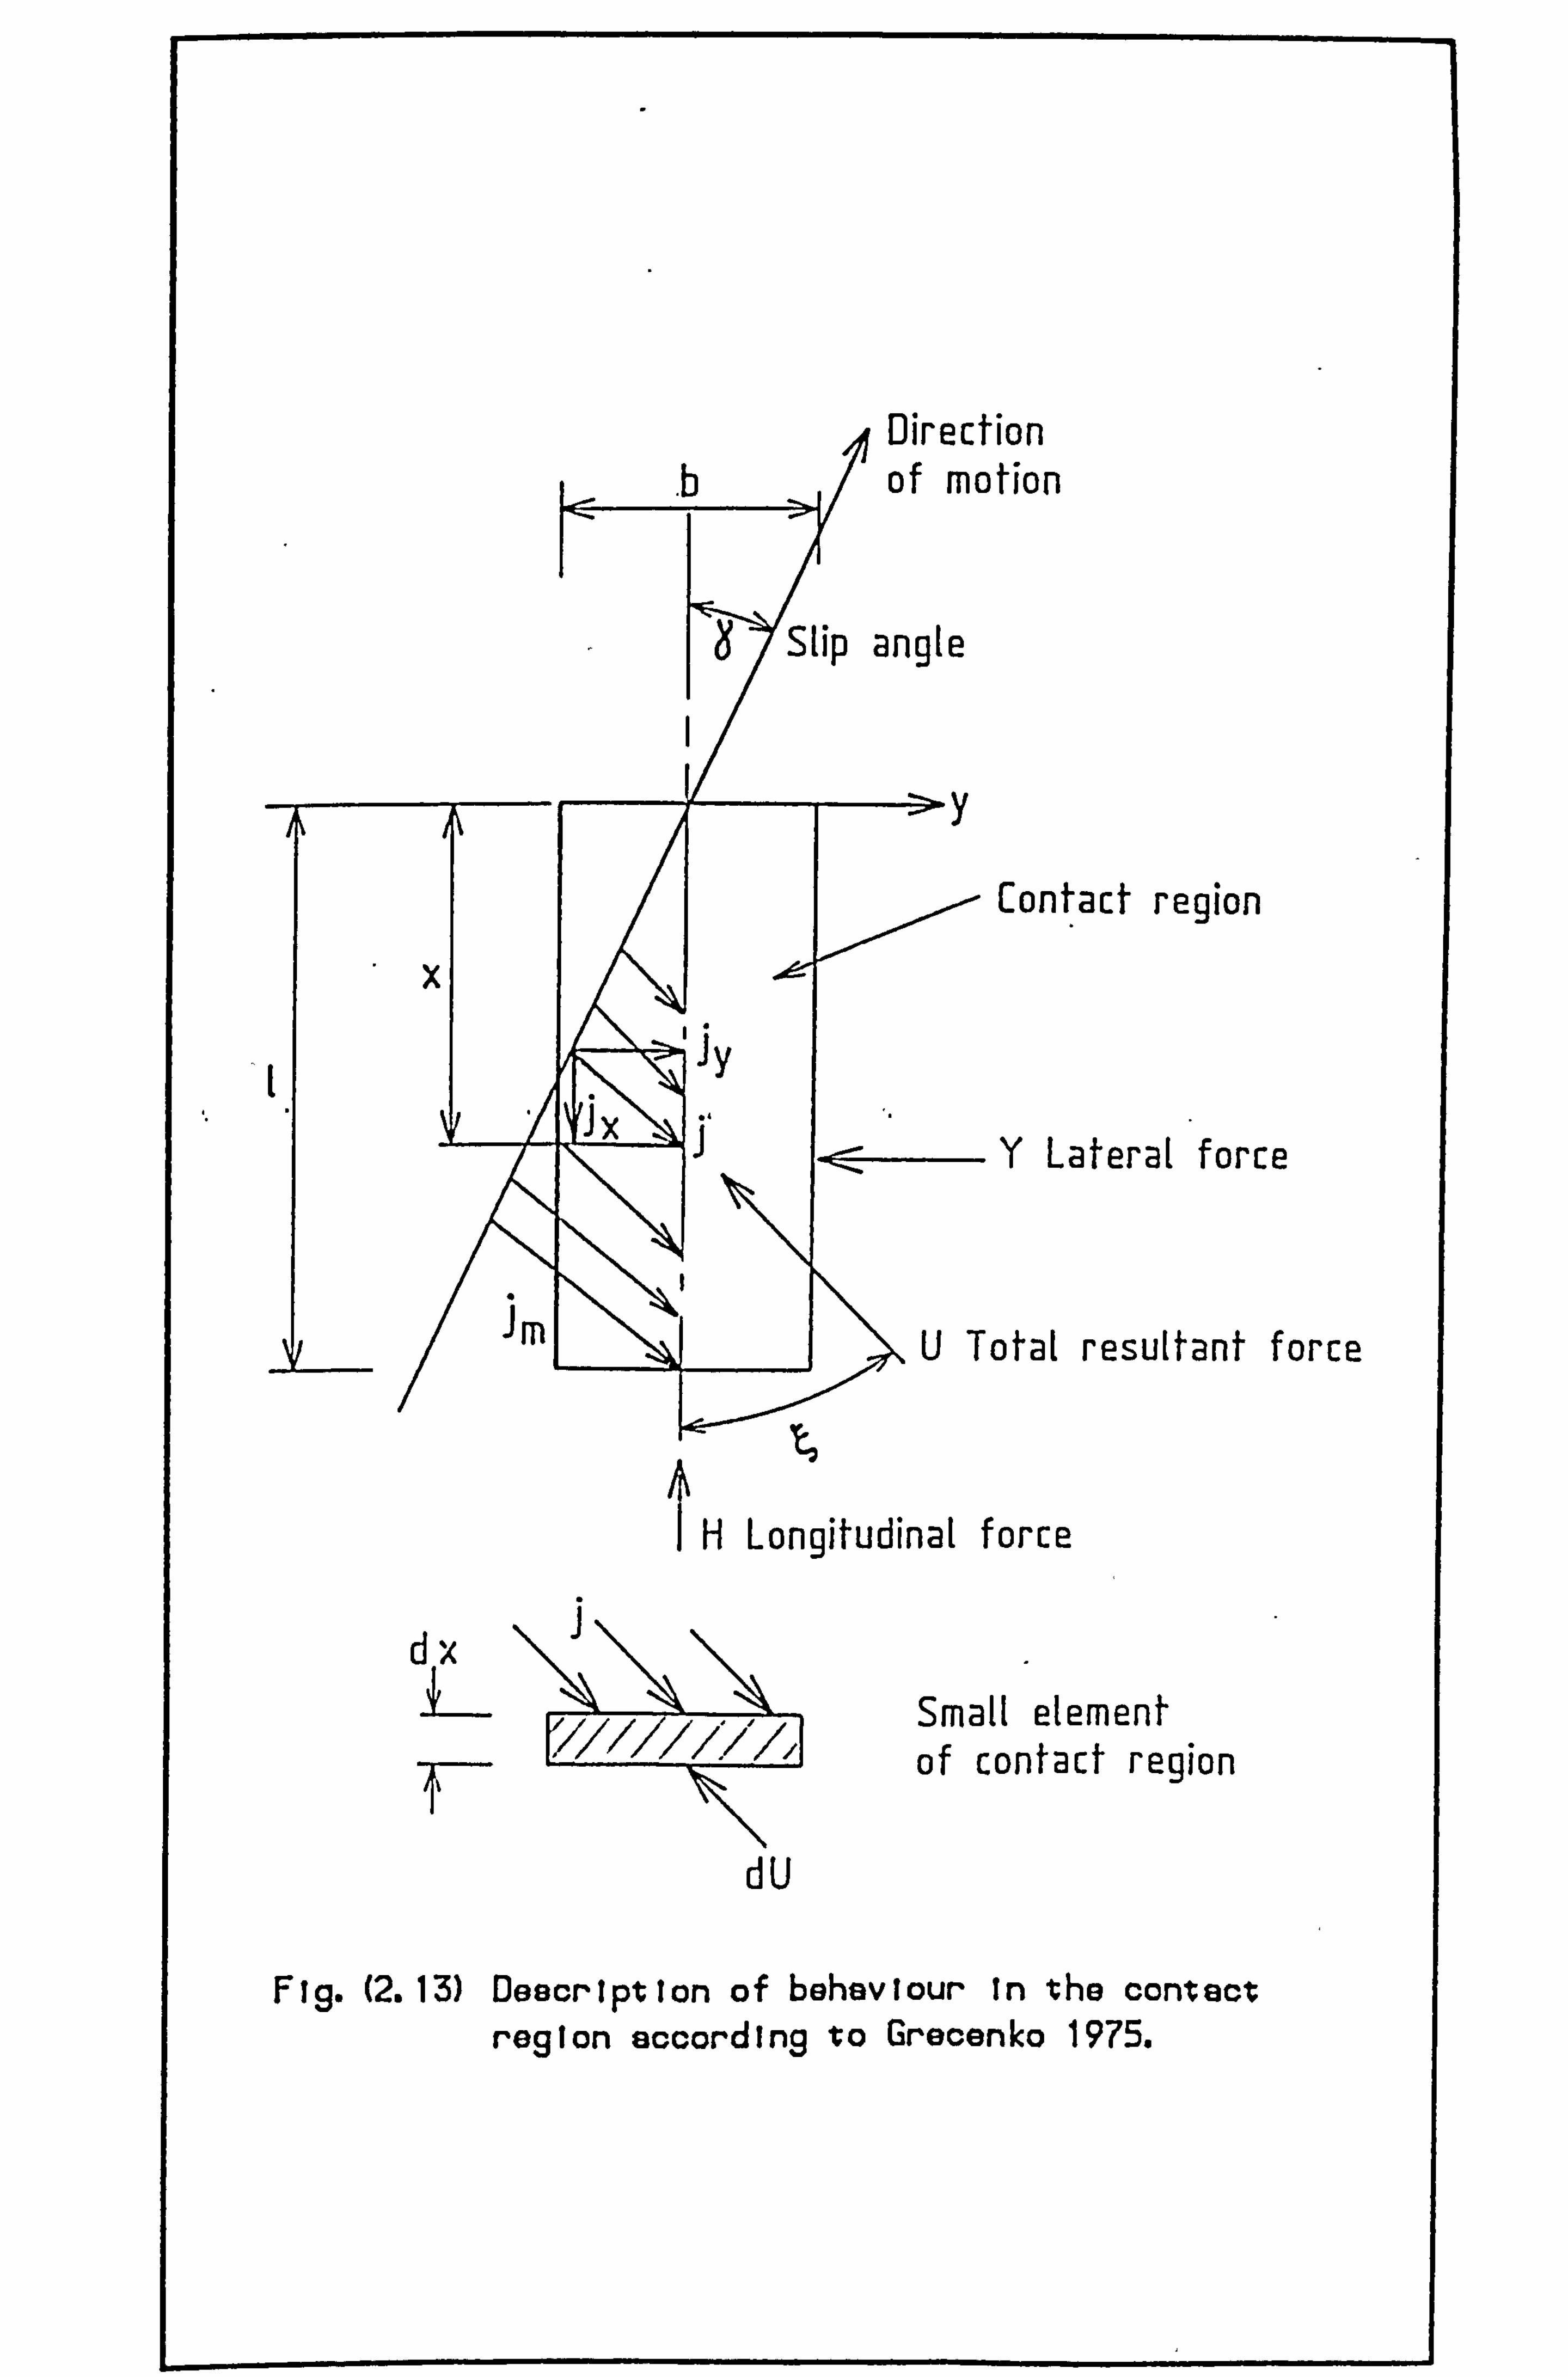
Direction of motion
Contact region
Y Laterai force
otat resultant force
1-2
H Longitudinal force
dx
T- dU
Small element of contact region
Fig. (2.13) Description of behaviour in the con-tact region according to Grecanko 1975.
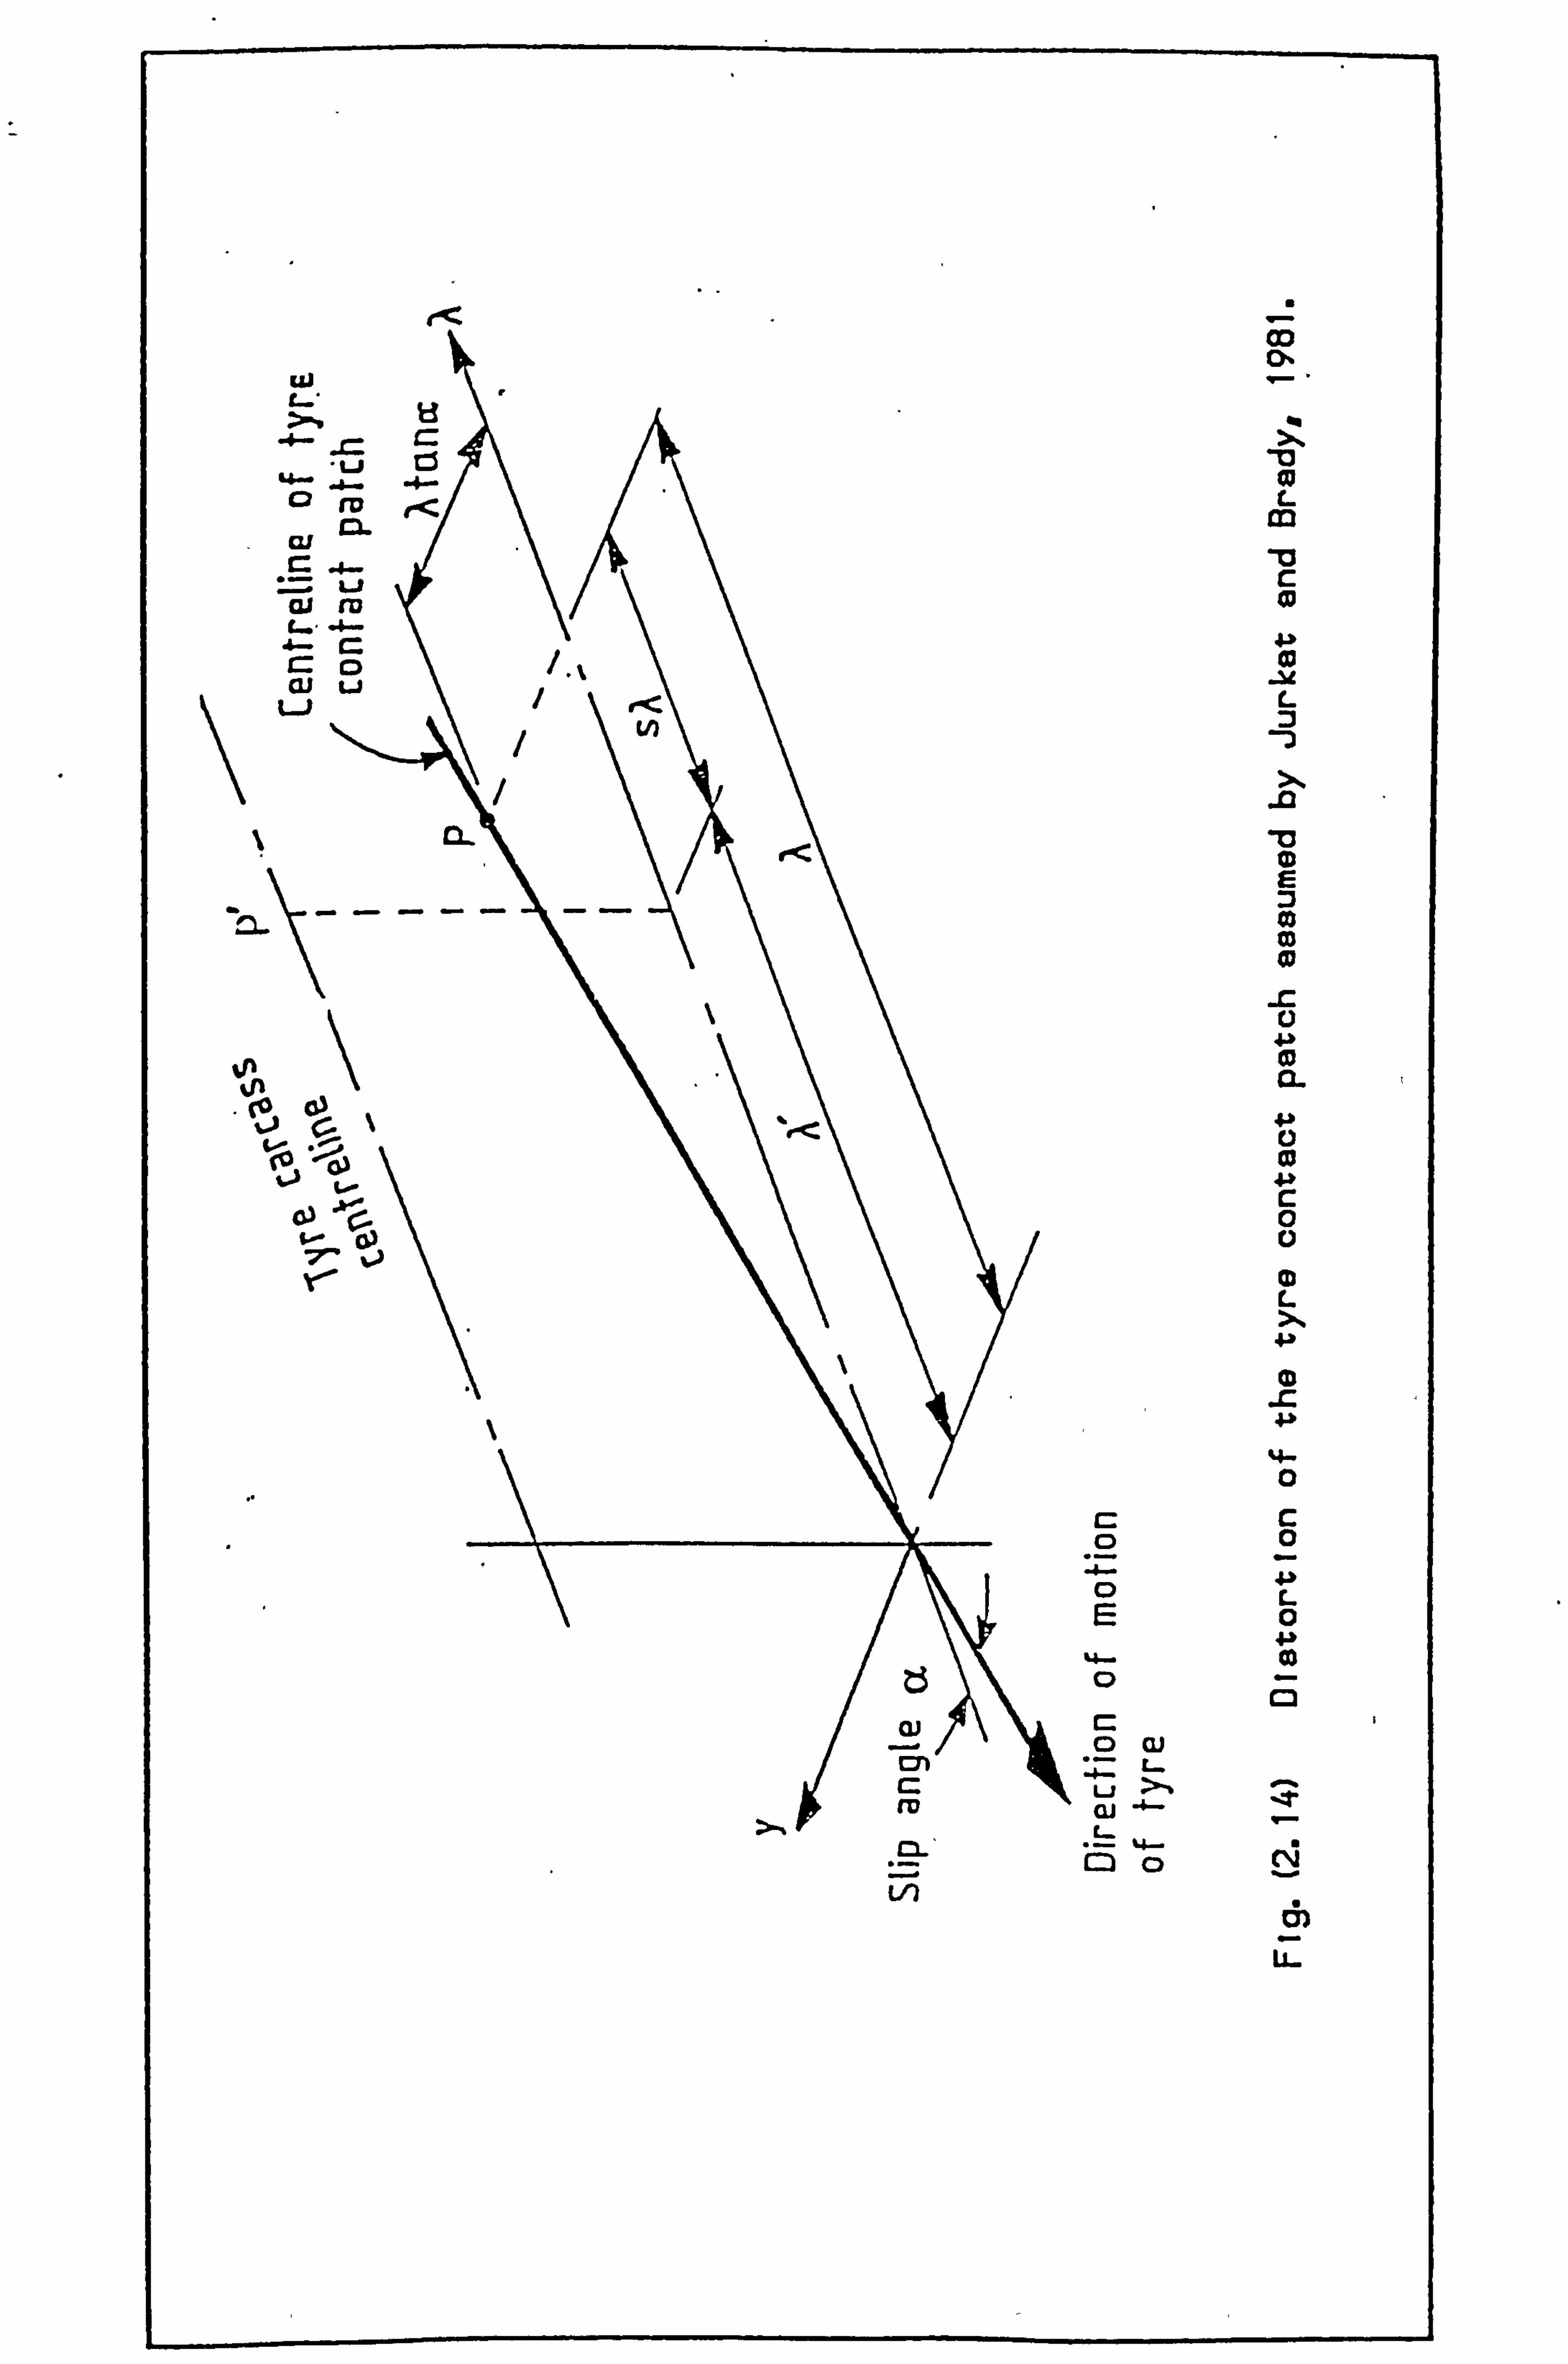
co 0% LAJ
Id Li
. &- -4- ru r<
L
cu CL m
r- " -0
= Li c aj ro CD
ci Li L
X X
13 0
co co - -\-
--
CD
-C
un CD CL
4-b
0
VII a) L
C
0
C: c 0
0L E0
M. - 0
C3
7
Z3 a) Cý
0 cu Cn = L-
Li cli A=
M
lz
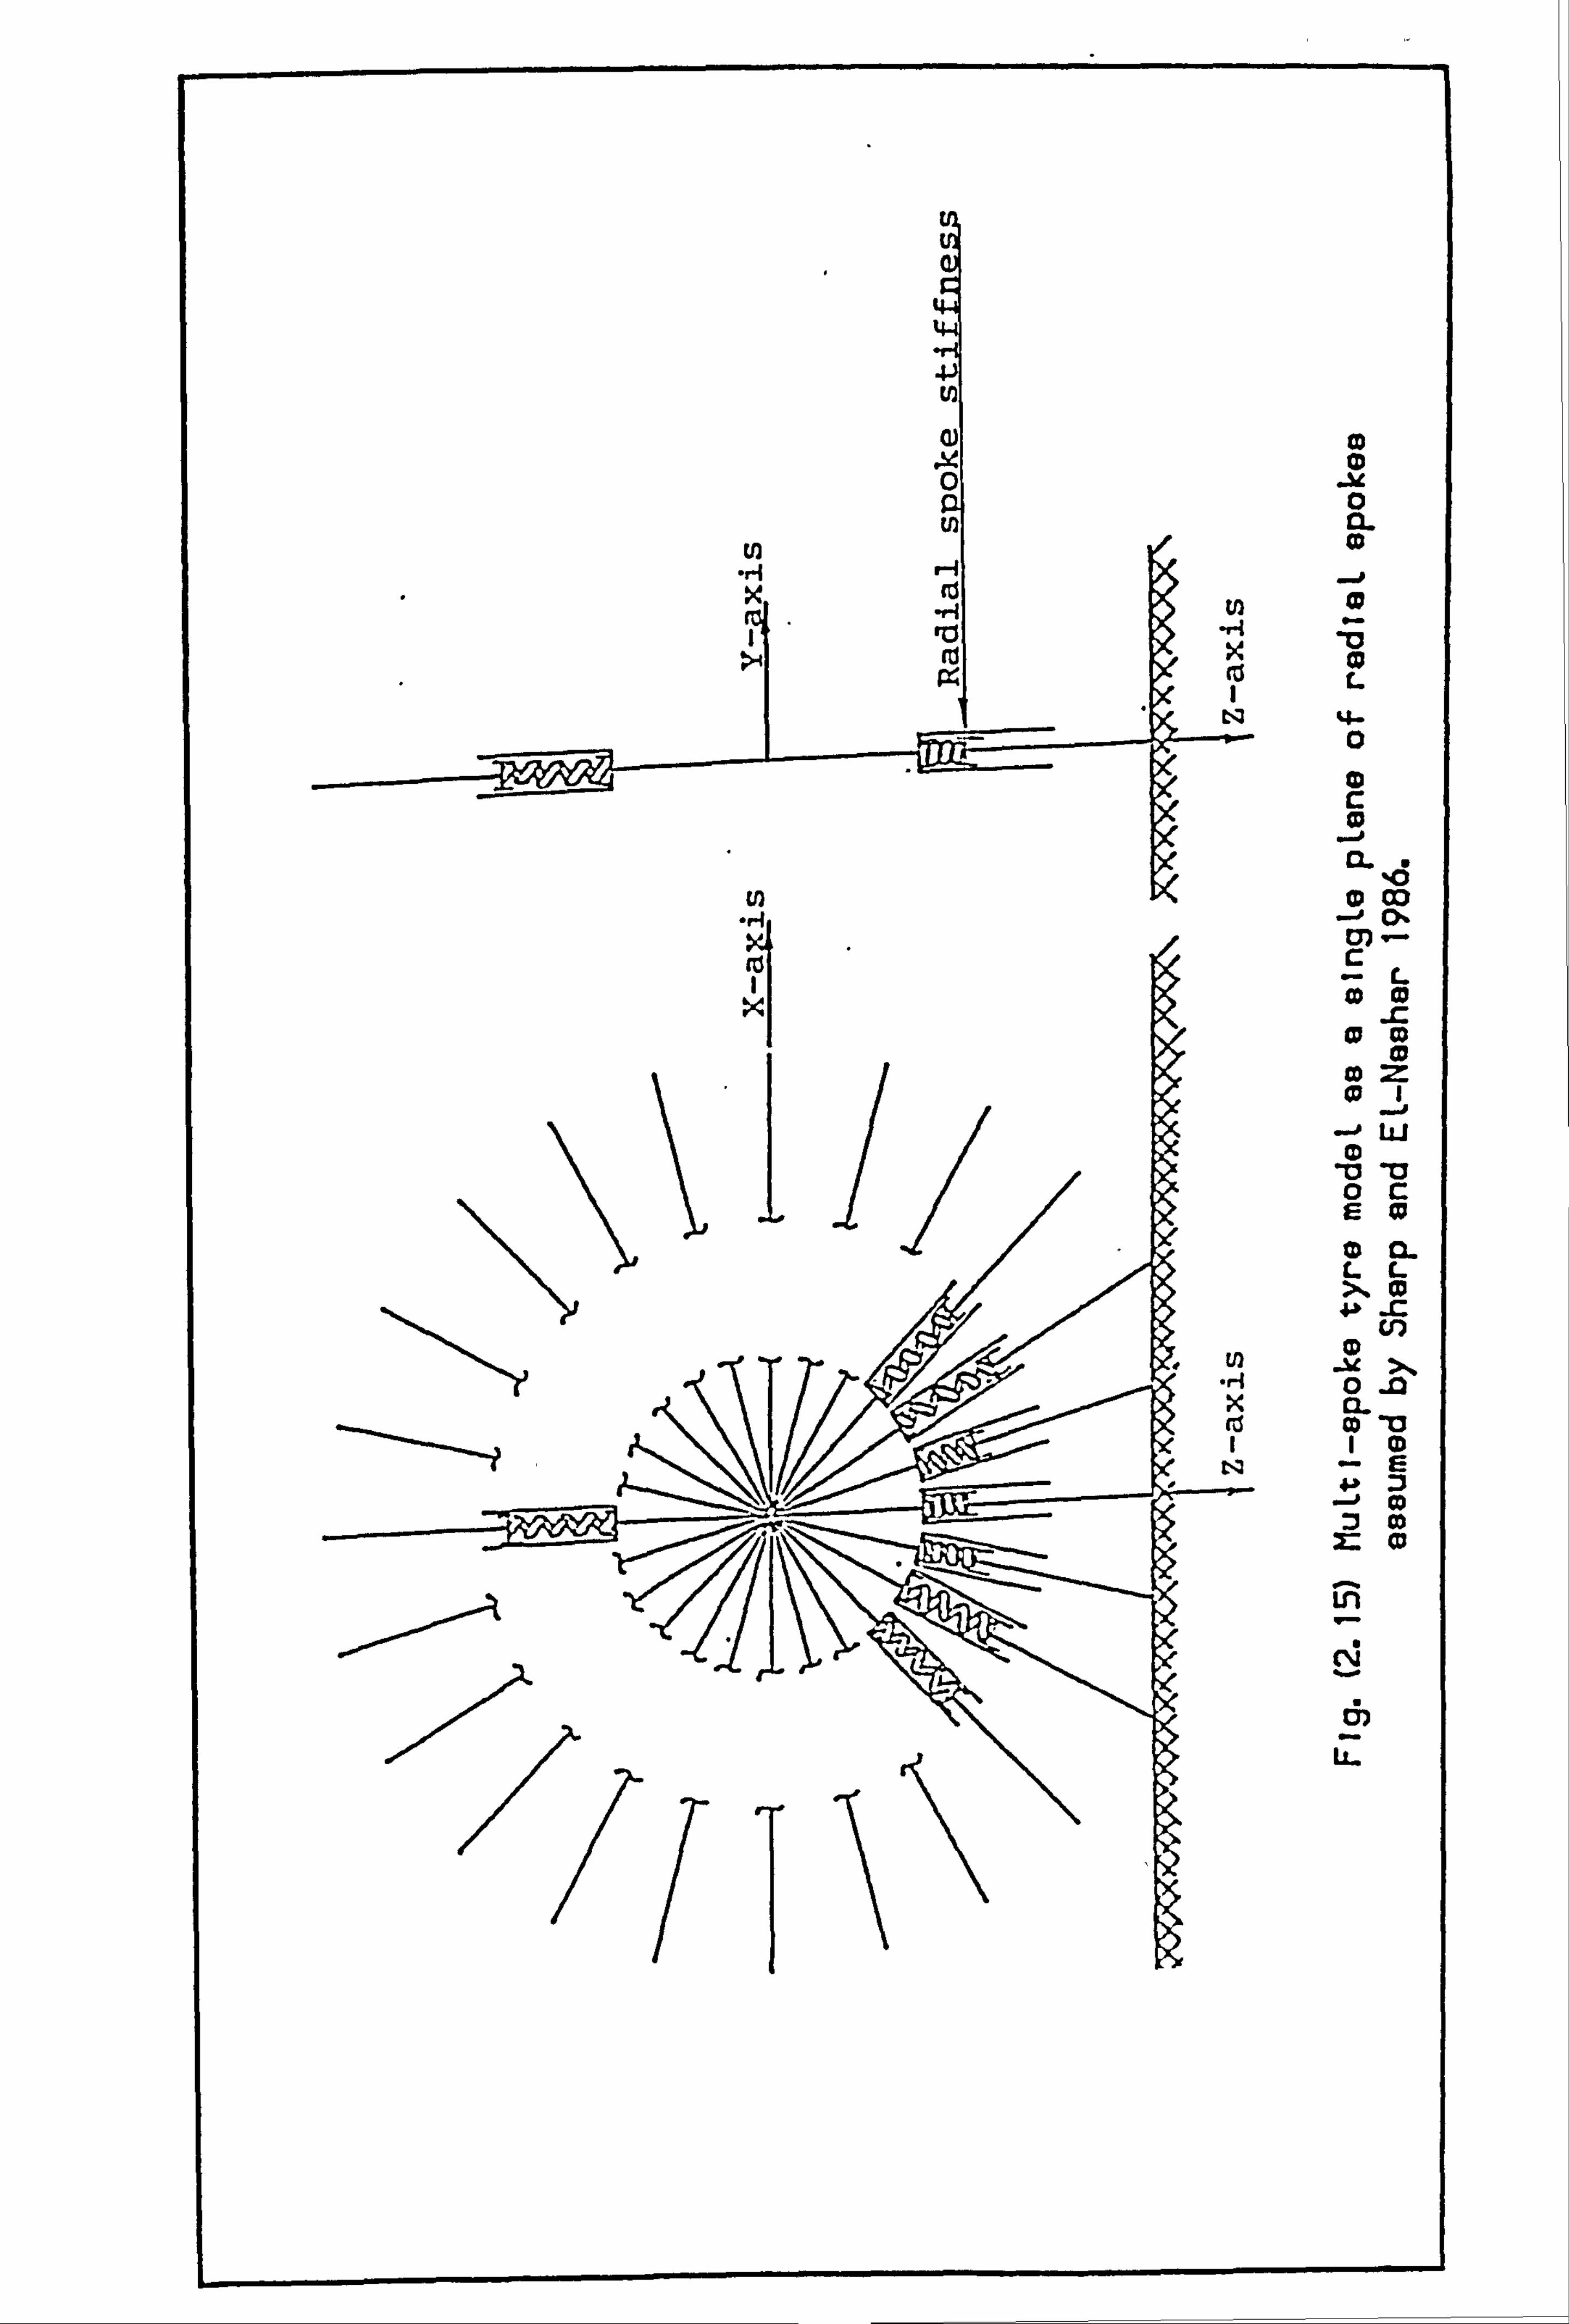
Z 4-
0 ul CL
tn
ro -0 L
Co tn 0 CO - CX
M L
cp c2 0
Co
--0 LLI 0
, Z] Ty 0c
LL X0
ul
x CL R5 CD -0
1 (D
= cu
Ln
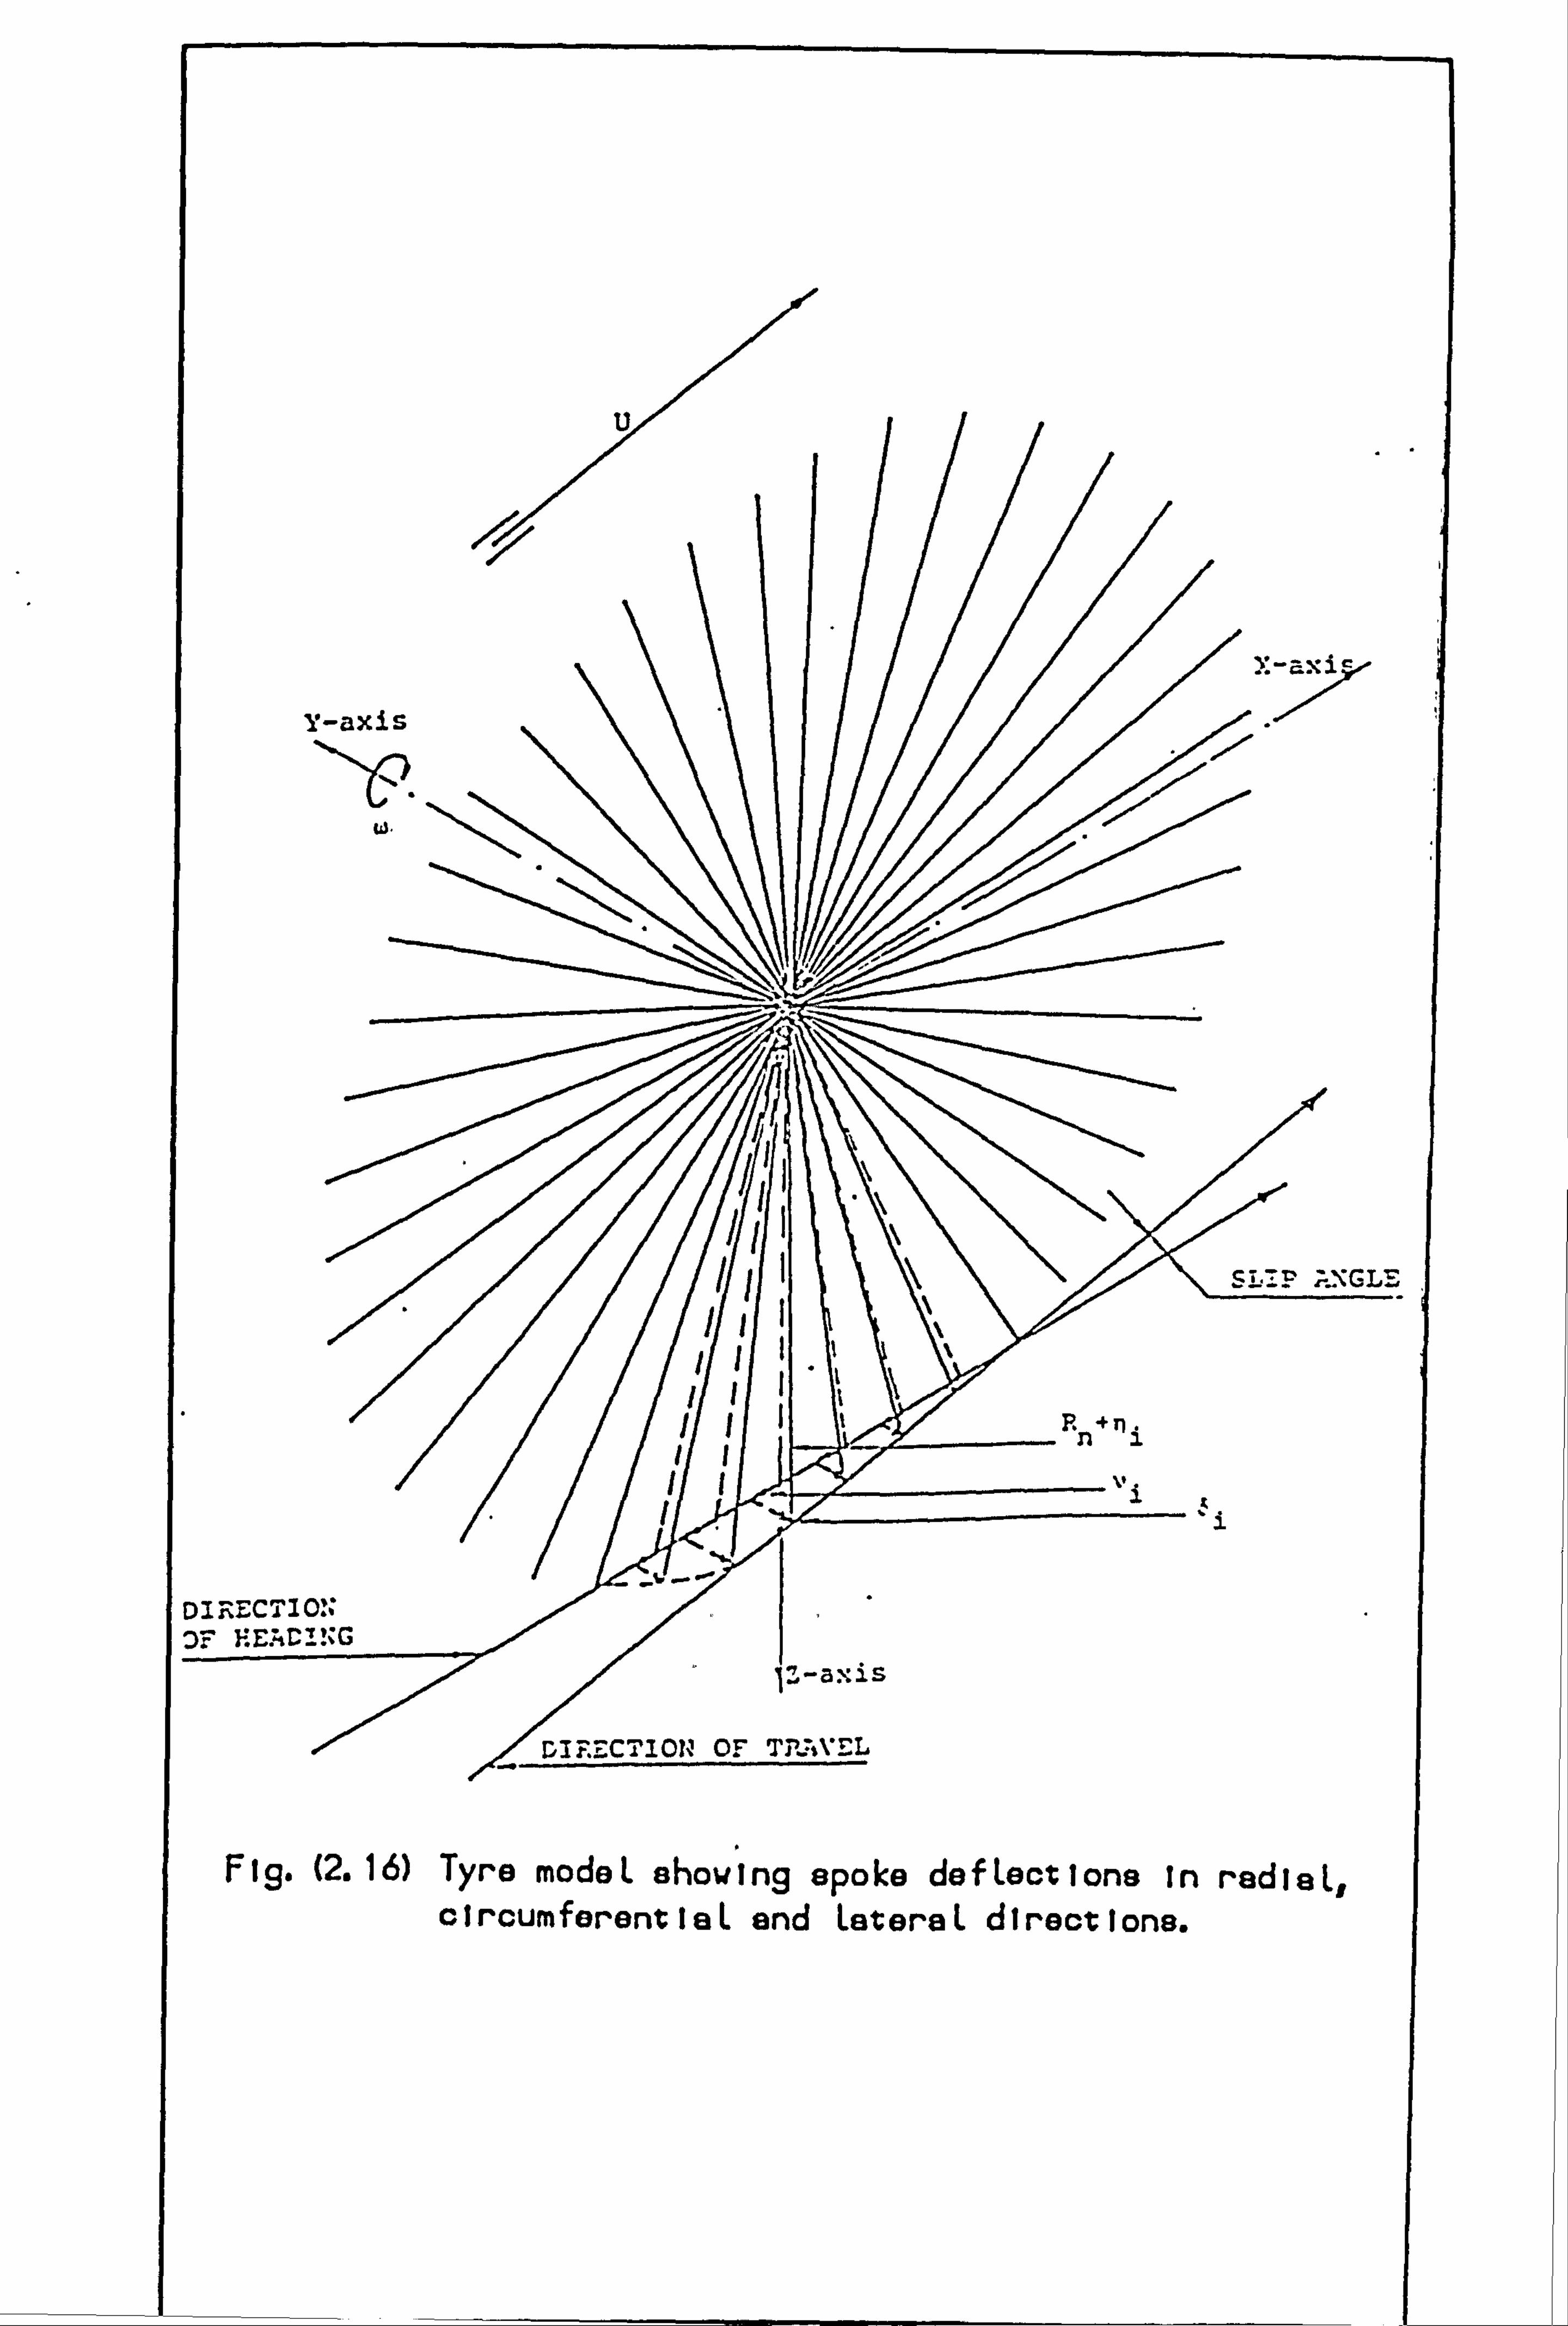
19. (2.16) Tyre mode L show ng spo ke do f Lect I one in red IaL, circumforentiaL and LateraL directions.
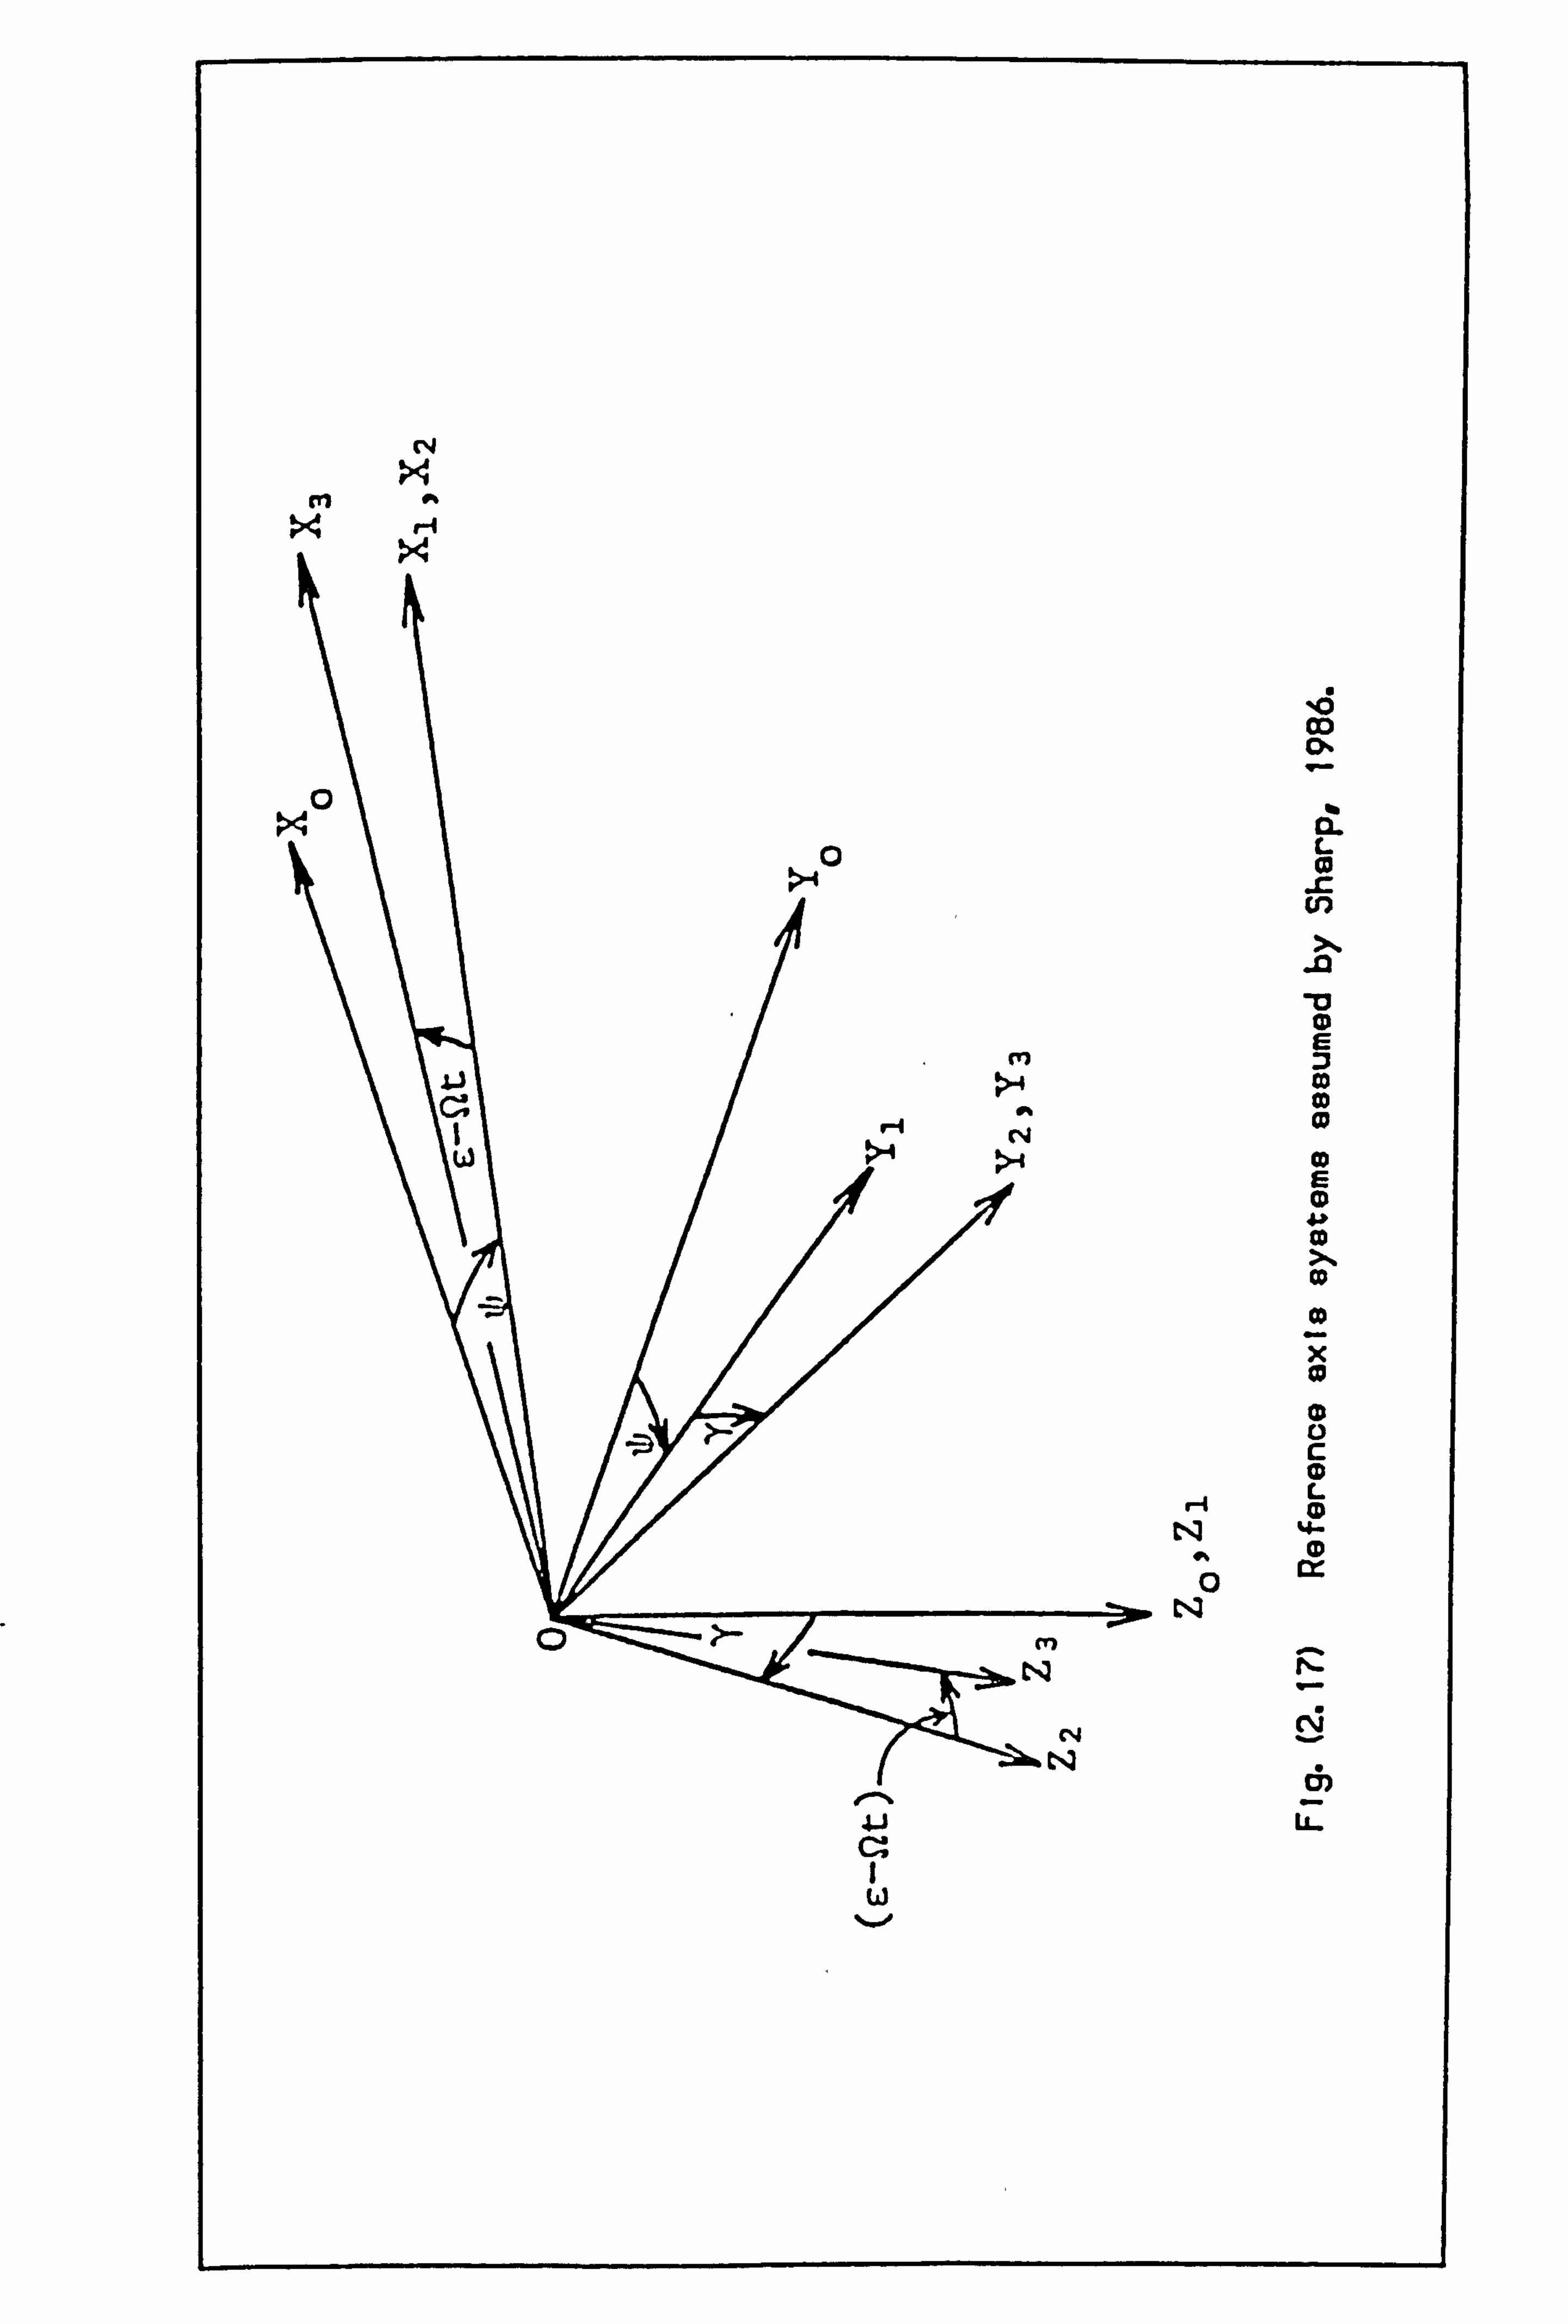
r4
Co
13 Co
Co
CD L 0
0 [x
r4
4.1
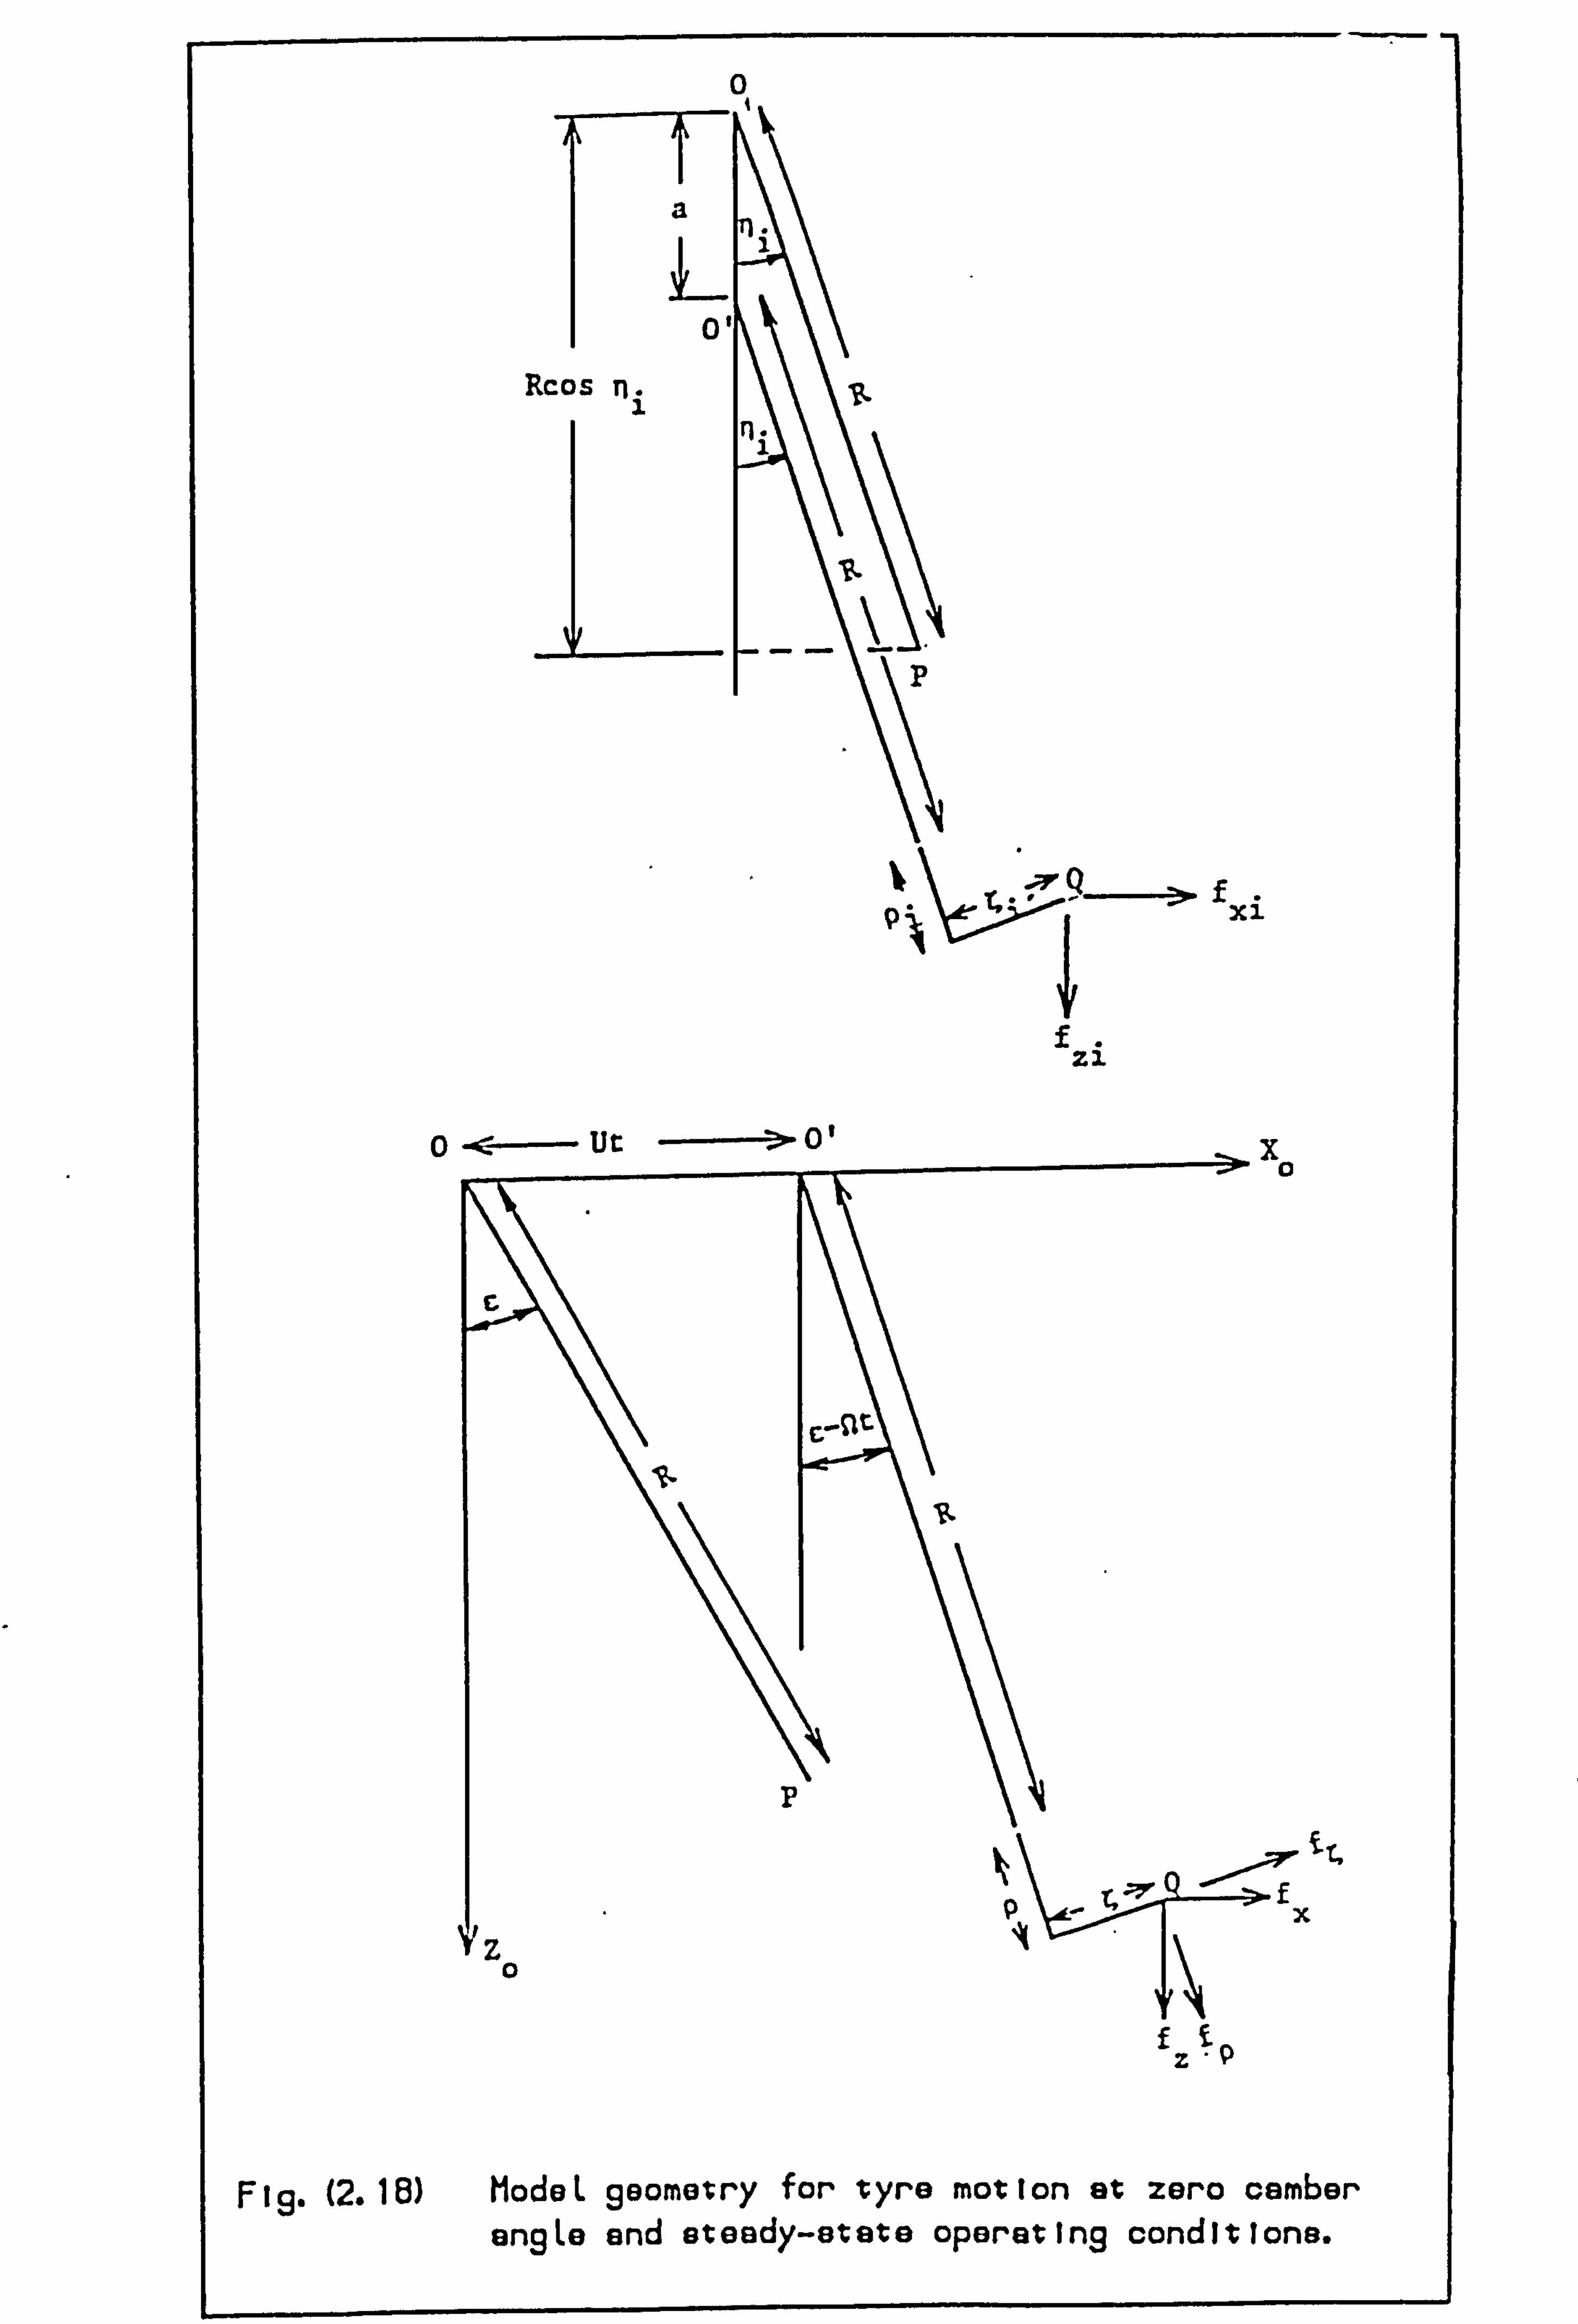
0
TI
Rcos
X1
zi Ut x
tt,
x
Fig. (2.18) ModeL geometry for tyro motion at zero camber angLe and steady-state operating conditions.
fz
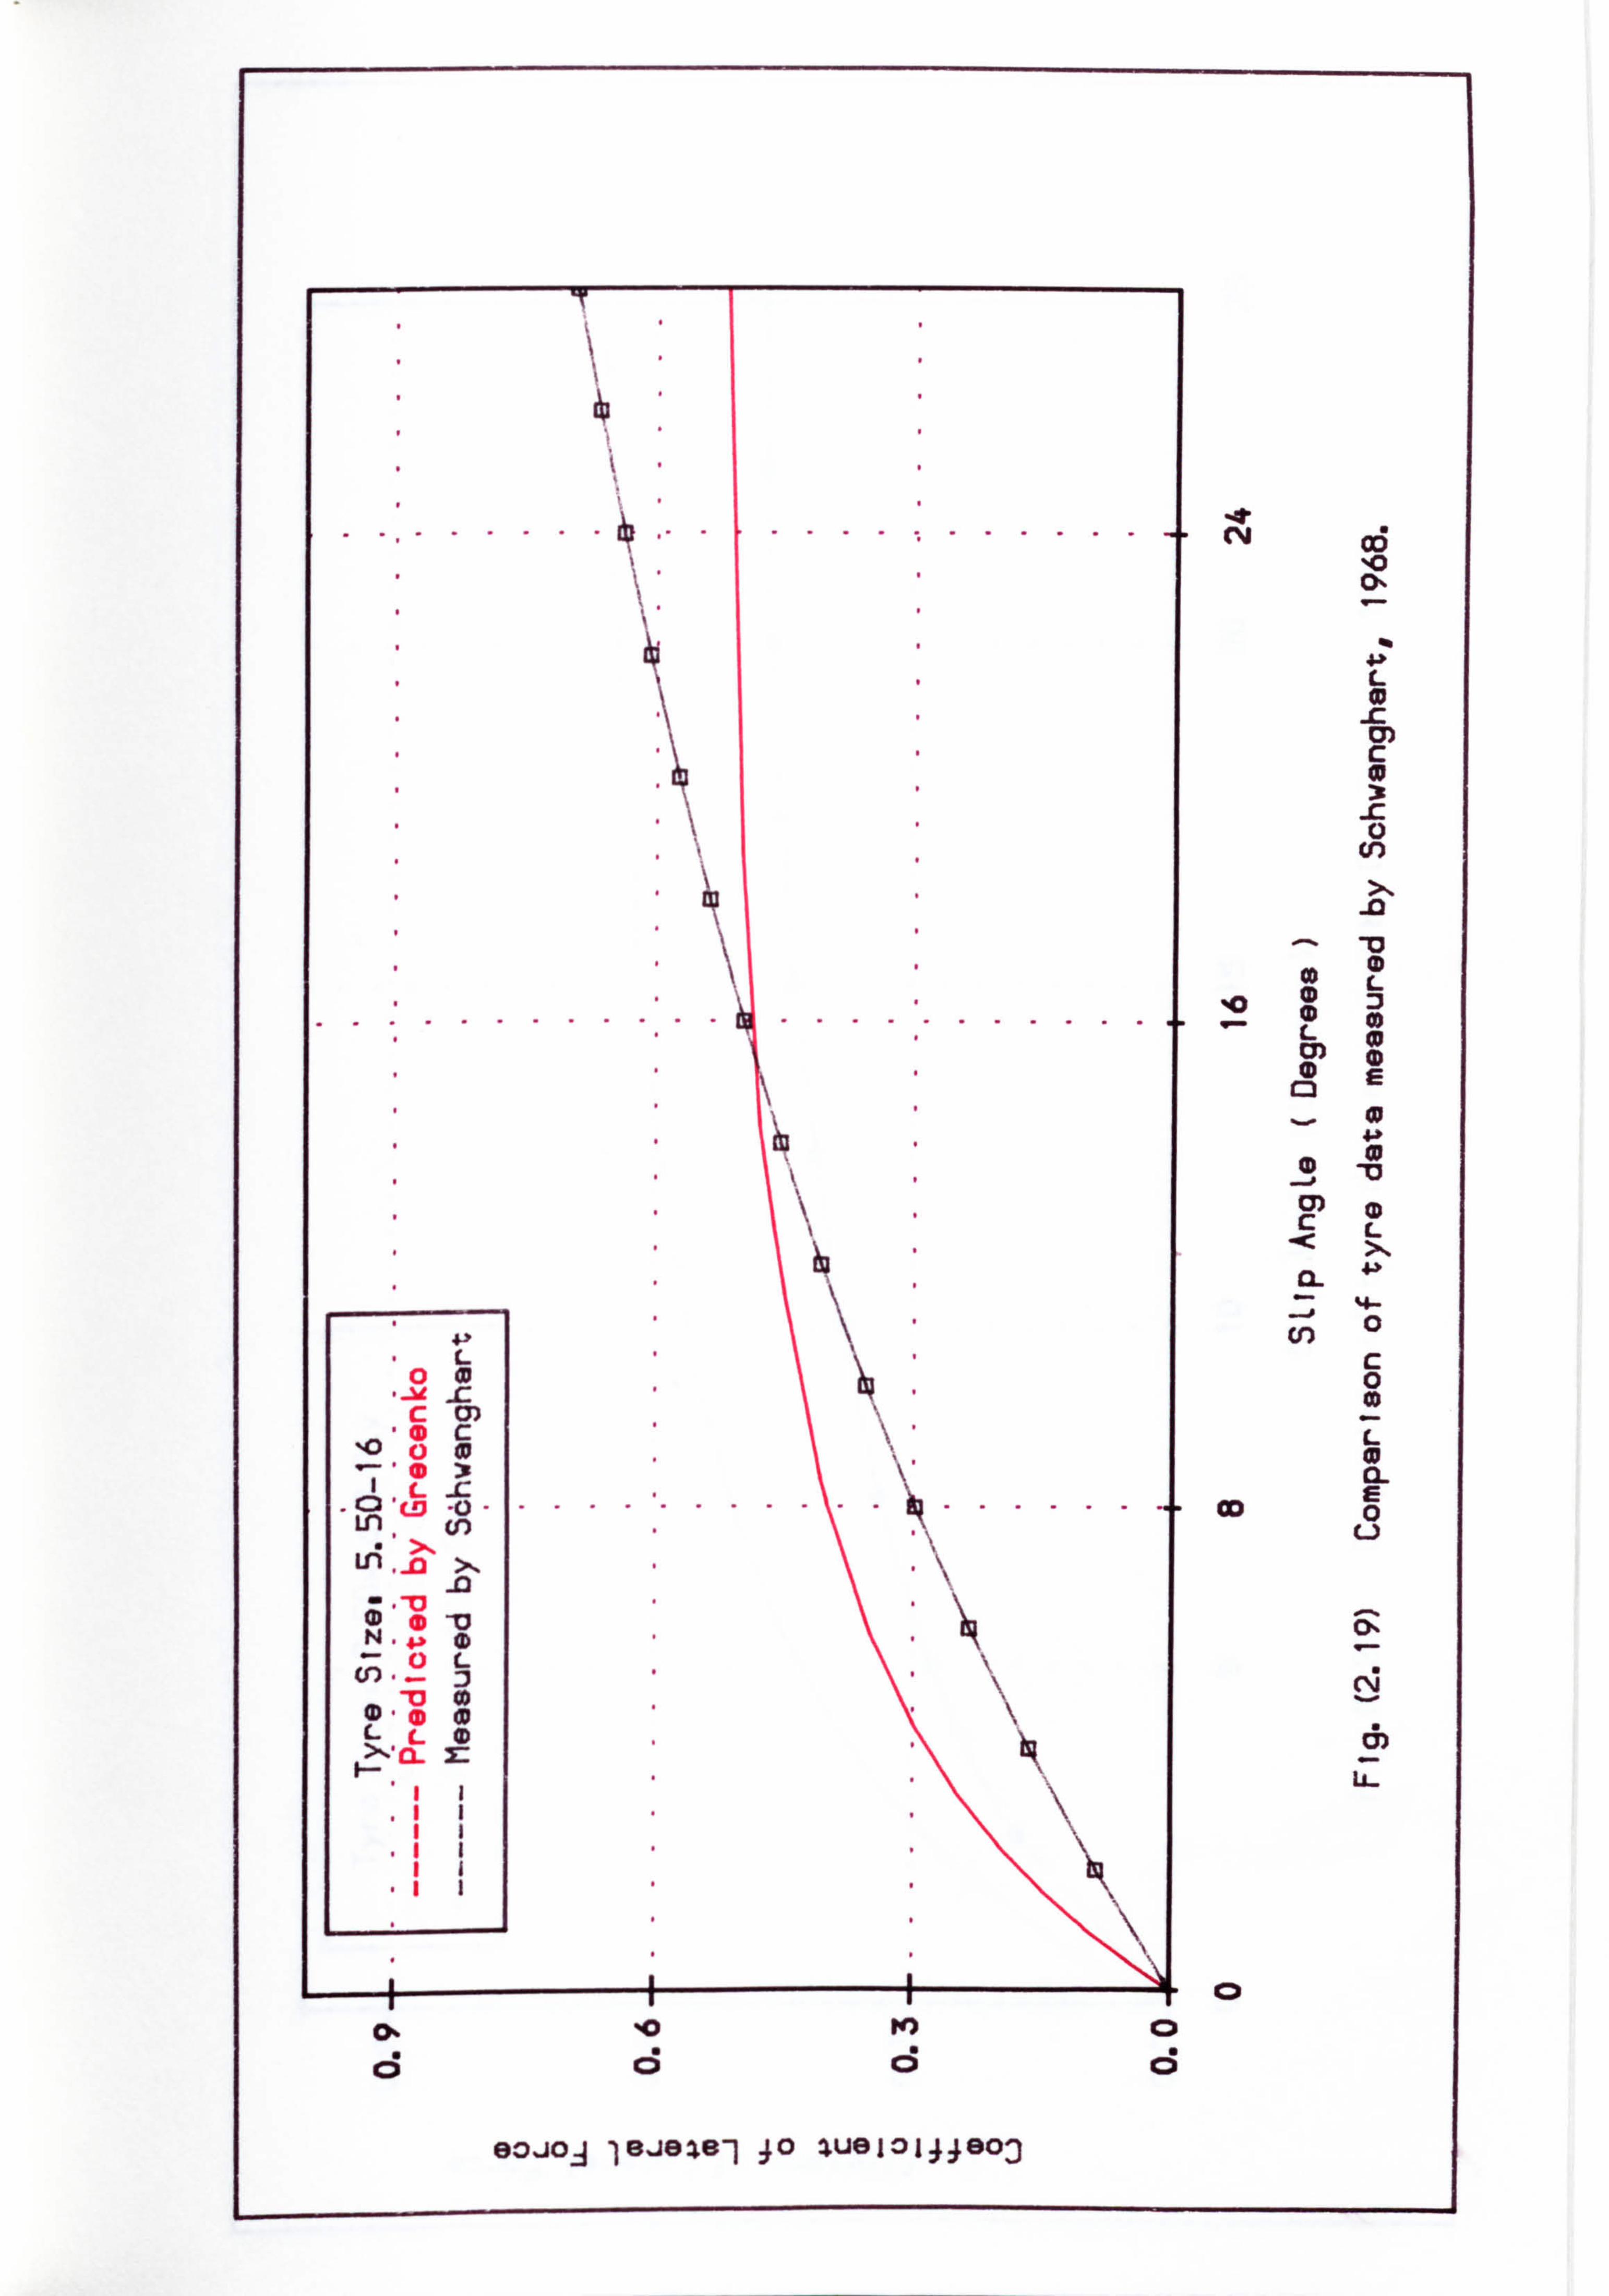
. ... ..... ..... C%j C6 NO
L
.... ........ ........... CD M L M a
C3
0)
c Im L
P, (n 0
0 . -M
L 0
-C
c 0
c (D
10 C) CD
Cr) c L
L C: )' . . ... - (D Ln
. .0..... . OD
N.
J; -. 2 -u (D W LL 0
0- 10 14) CD
cs cs d
80JO. A 18J8181 40 W813144800
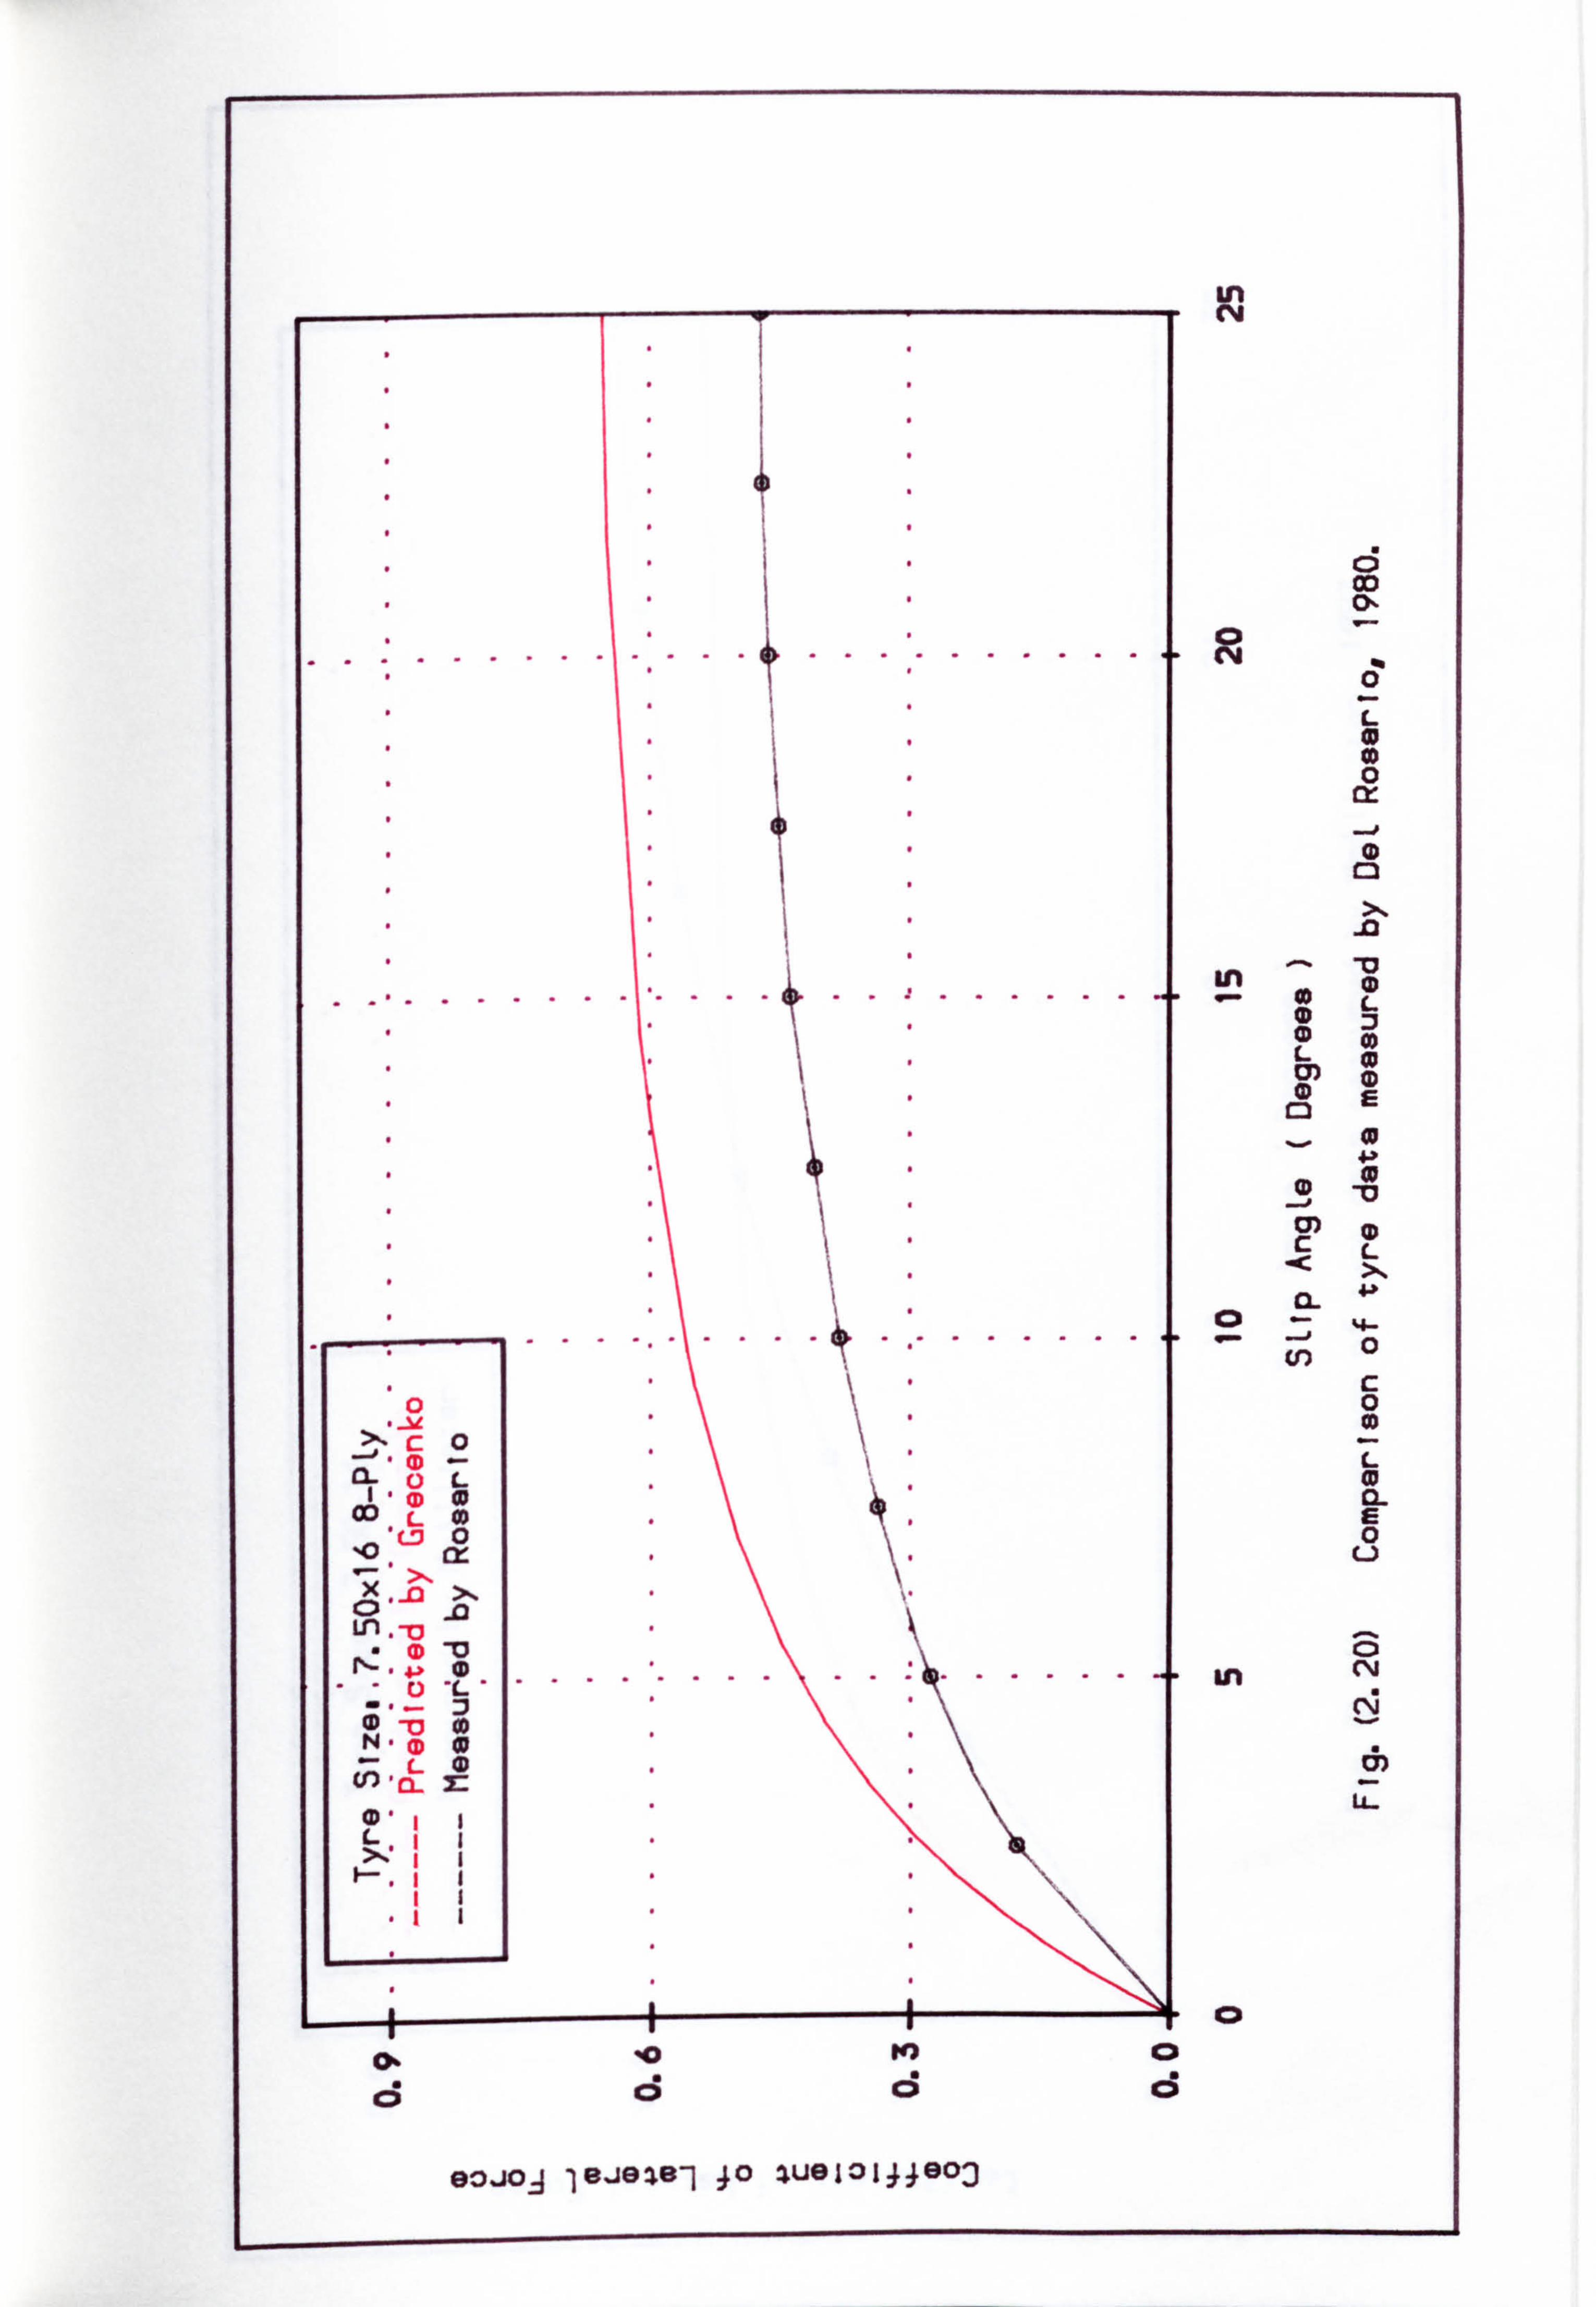
...........
...........
,0 C-5
-. >,
N- (D
0.1 1
""
""\" "
\
................
10 cs cs
93JOA IBJGI, 81 40 WeI3144803
Ln cm
ö OD
--0 (D c2
X
tn L
L c2
L X
(n 0 c 0 .2 L
0 L. )
a in C%j
03 d) L
0
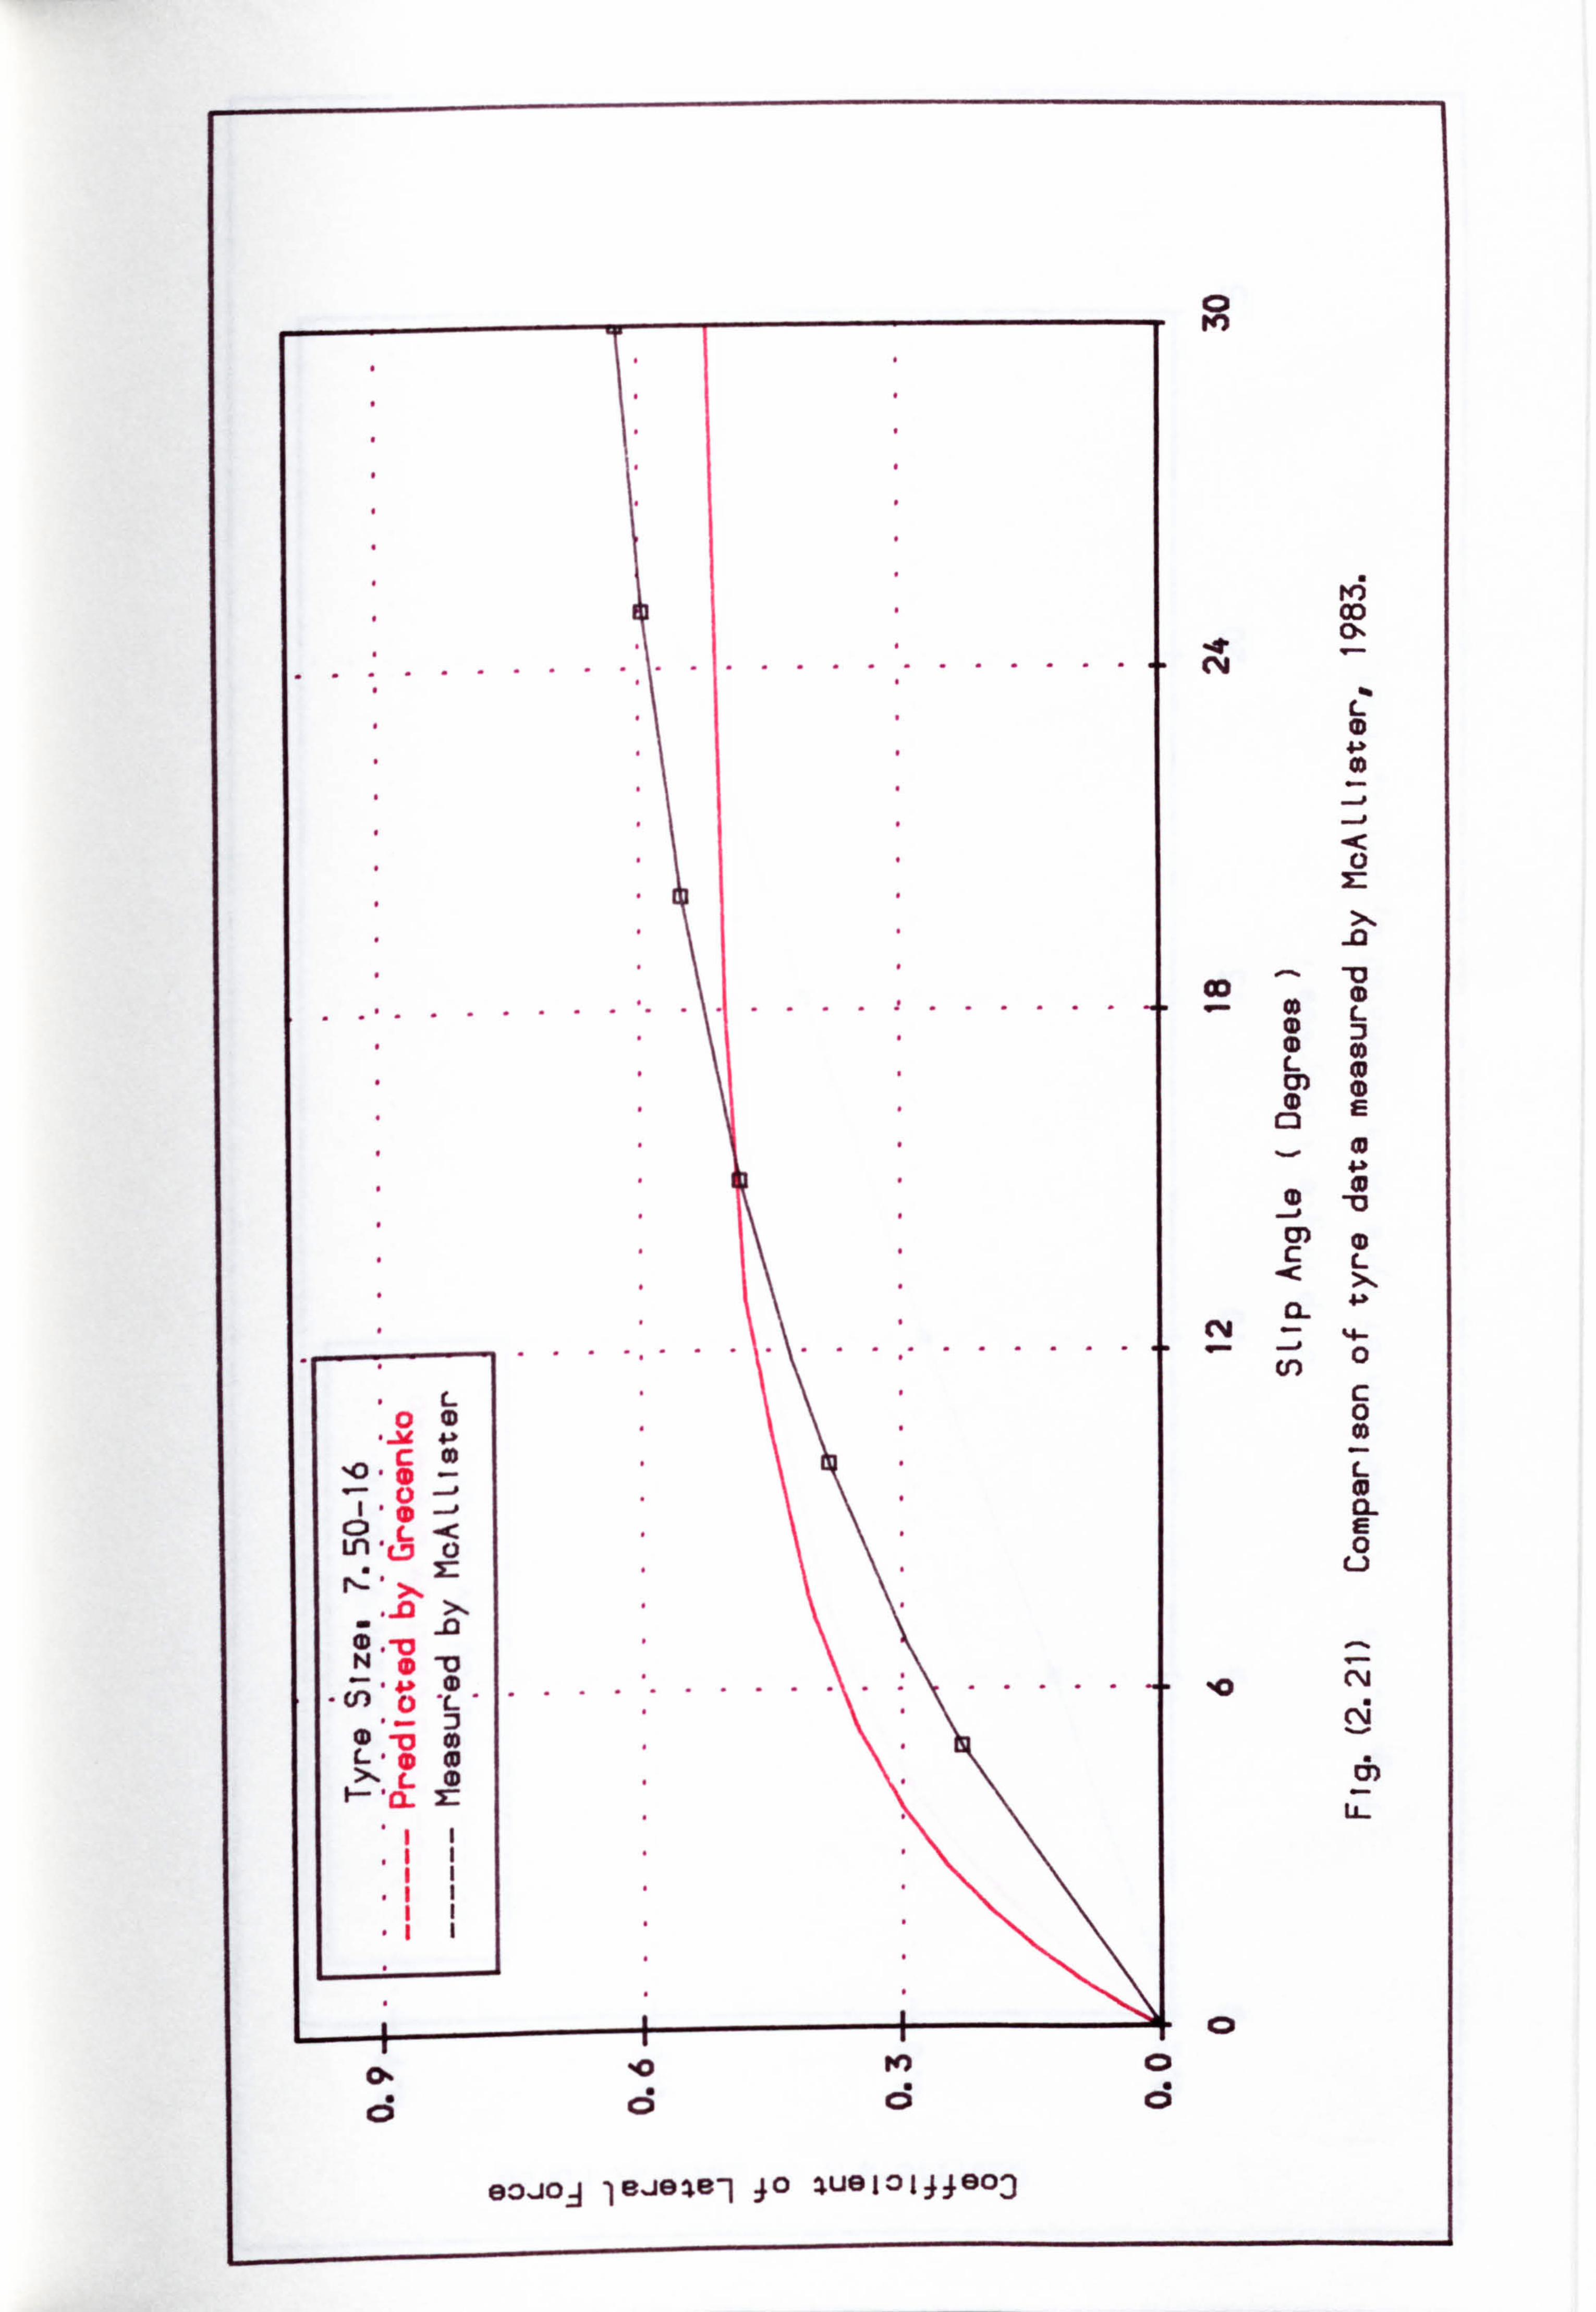
-"---7-
C 10 - CD -
1. (P _--, CD
tc Ln (! j r.. >,
. -m >,
(D -ja L. 00 XL
ci ci ci
go-ioj je-igze-j 40 zuglolýýo03
0 tf)
fei OD 01
cm
L 0
L
L
c2
0 0
CI) cL
X
0 c 0
L 0 a- E 0
NO FM cm
m
LL.
a 0
S
0
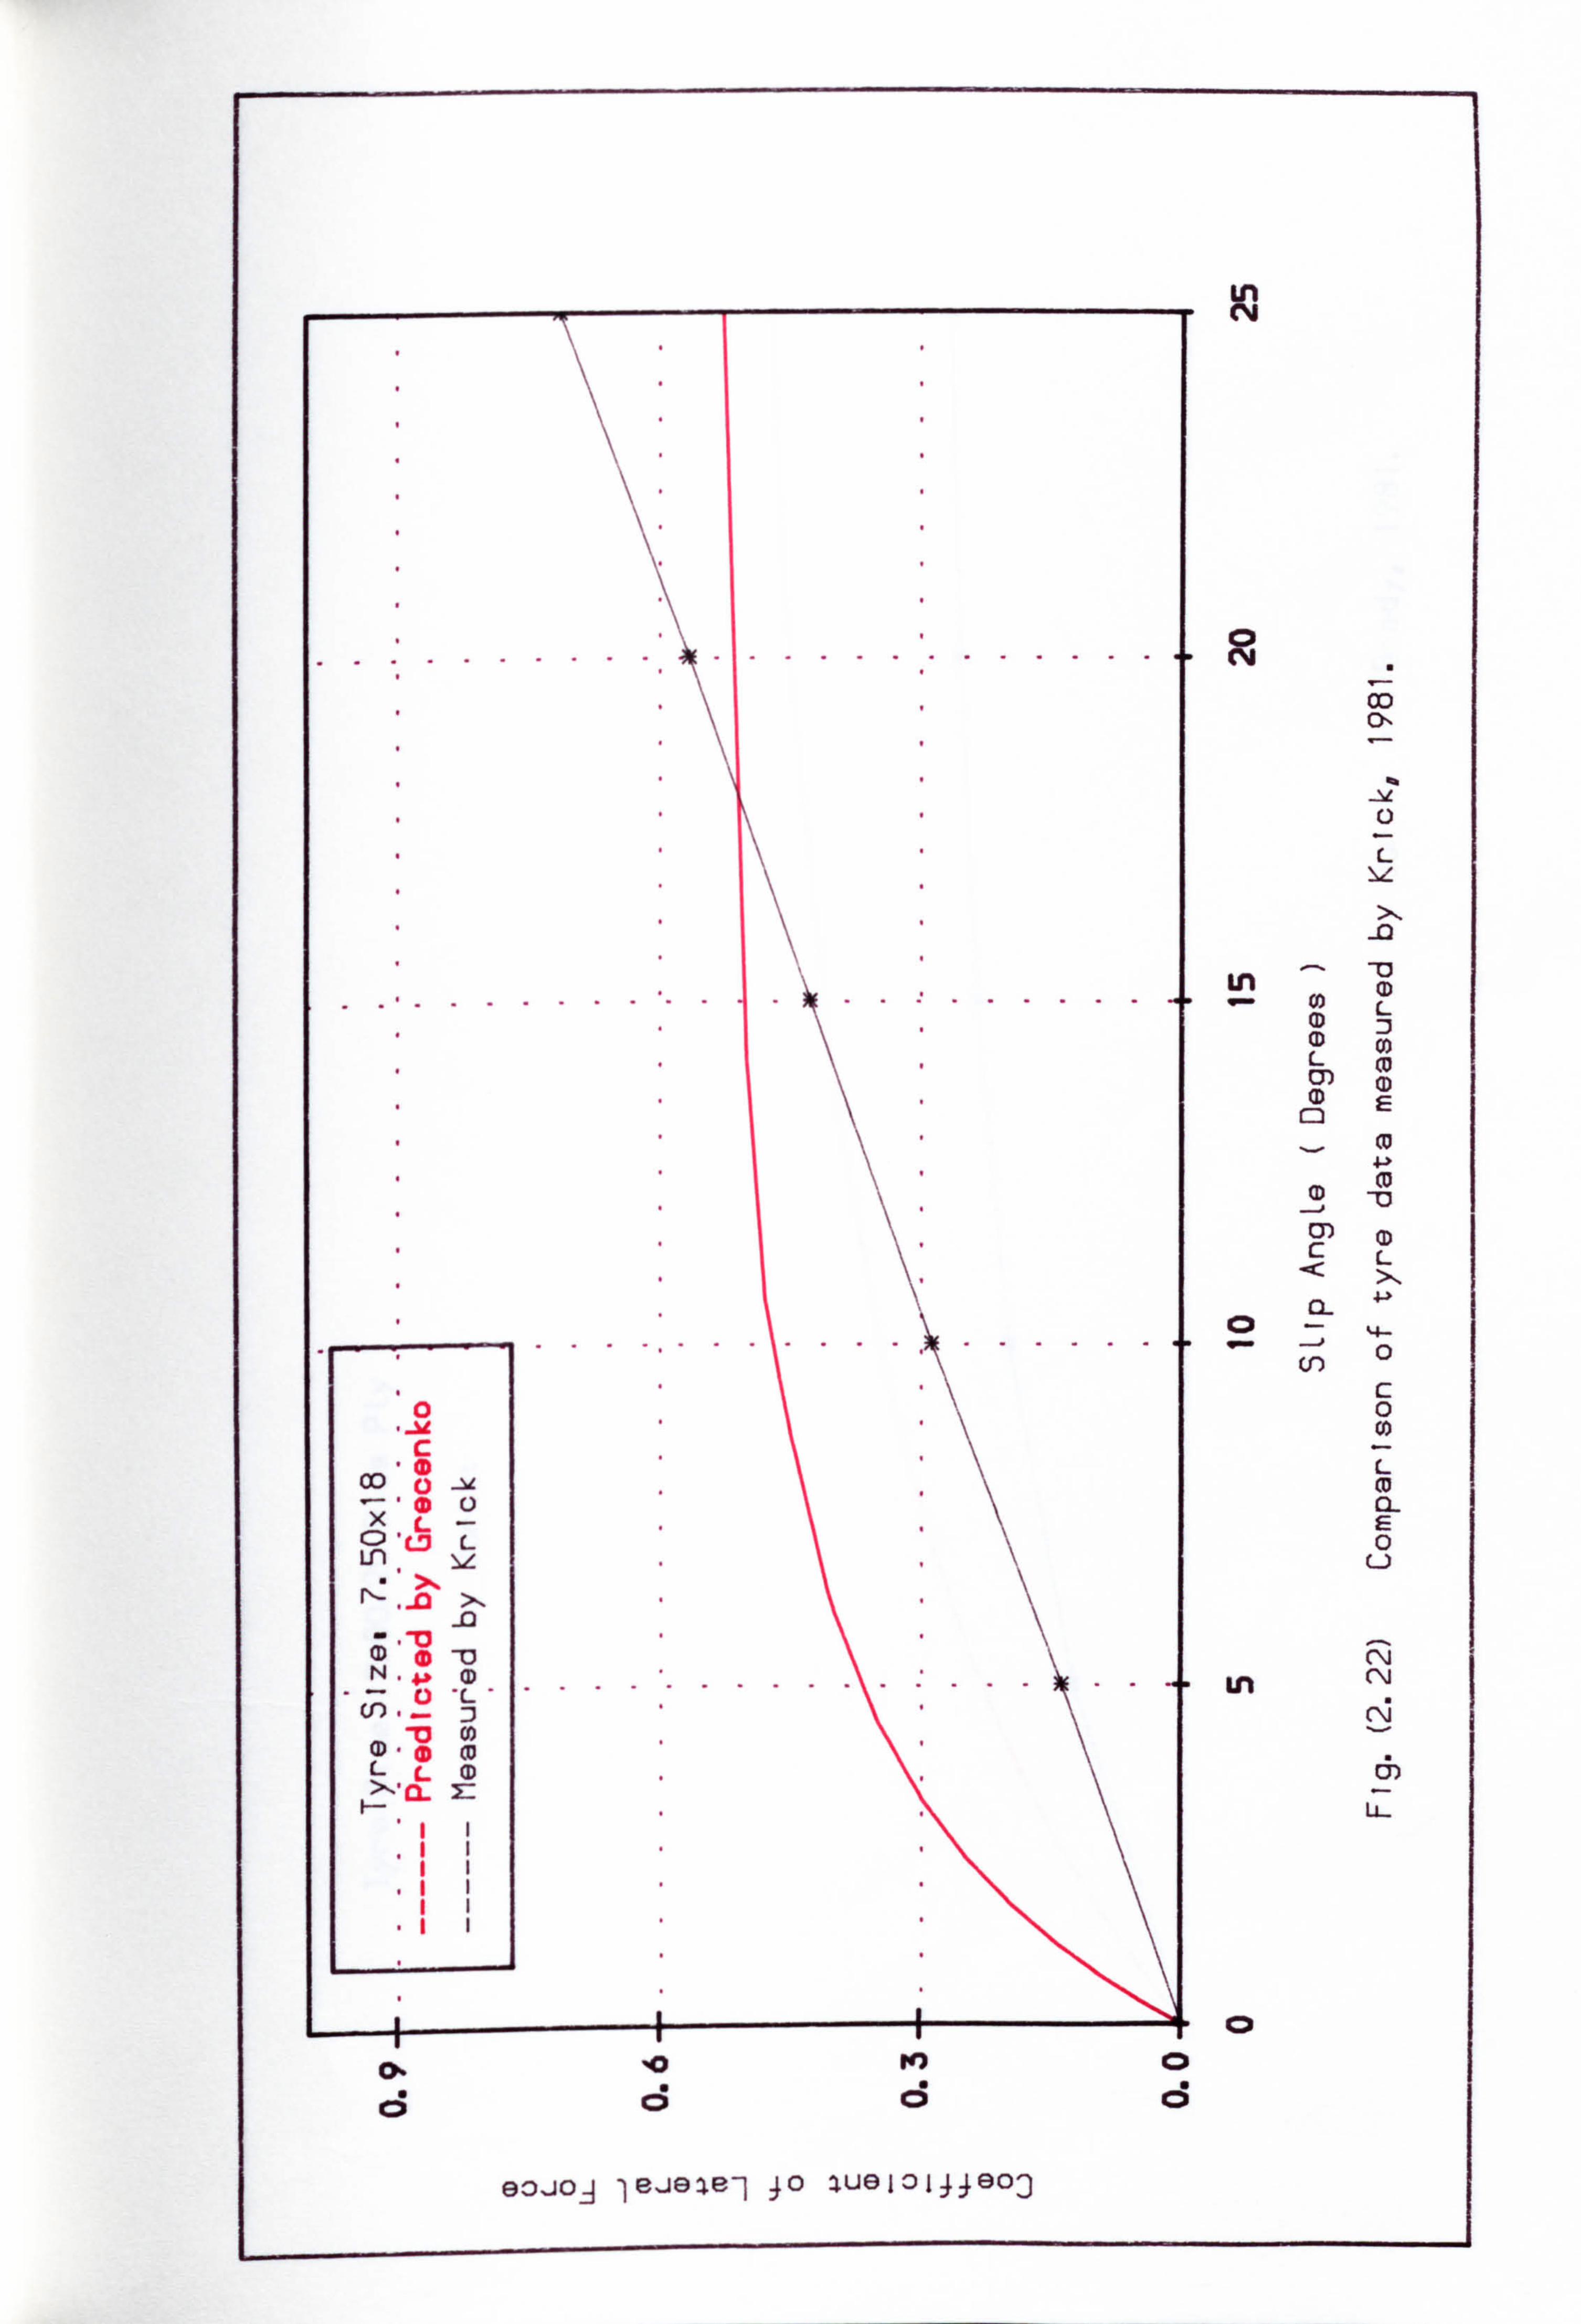
\
0 c 0
OD C)
x. 0 L
CD cm L Ln V X
-0 g. -CI 0 -0
N (D
U') 0 0)
ID *0 (0 LL (D
1- X
c; c; c;
9: D-J0A jejel-eý ýo iueloljý903
Ln cm
0 CM
OD 01
L
_0 Ln a) Co L
(D 0) L Co CY)
- (0 4ý (0
L X
0
c 0 (0
tn (N
0)
U-
"0 0
U
0
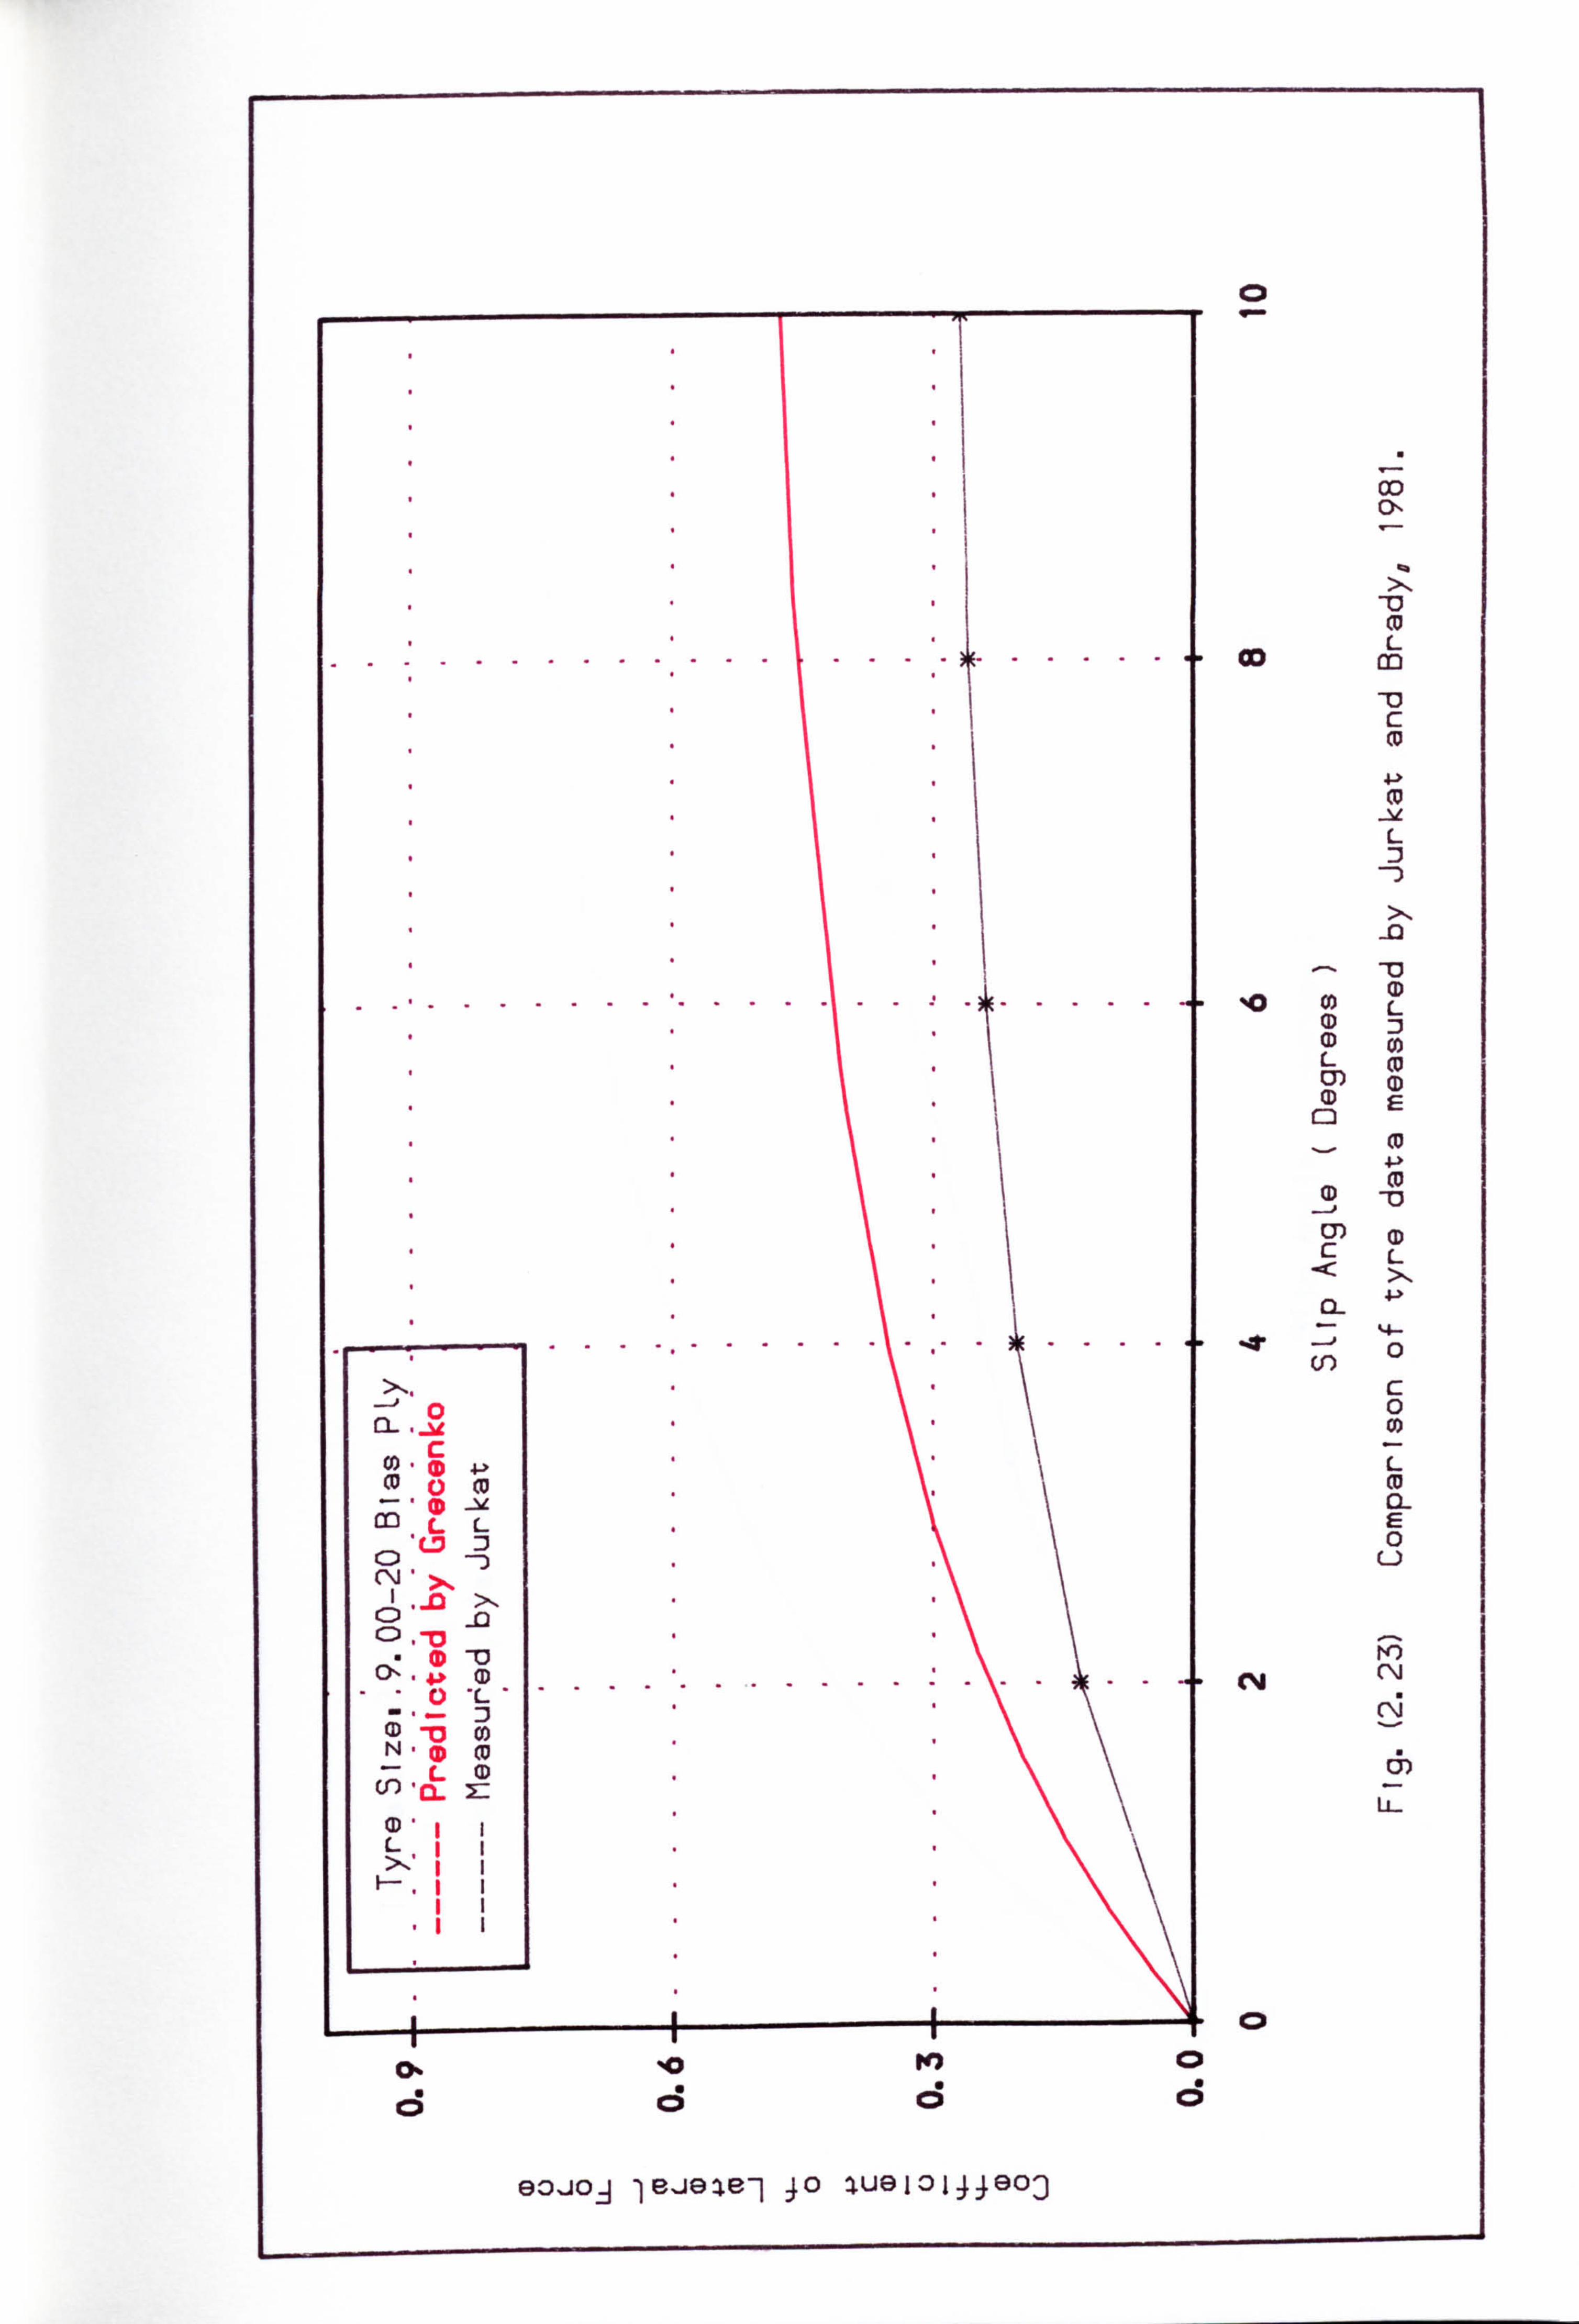
-- ---- --- ------
..........................
.......... ....
c. CD
...............
N
%0 d
eojoA jejew-1 40 : Luel0144903
0
OD
;, l Co m
(0 -ii L
X -0
- -0 0) L (D L
4-> (0
L X
0- 4->
CO 0
c 0 Co
L
0 u
cm
Cb LL-
"0 0 0
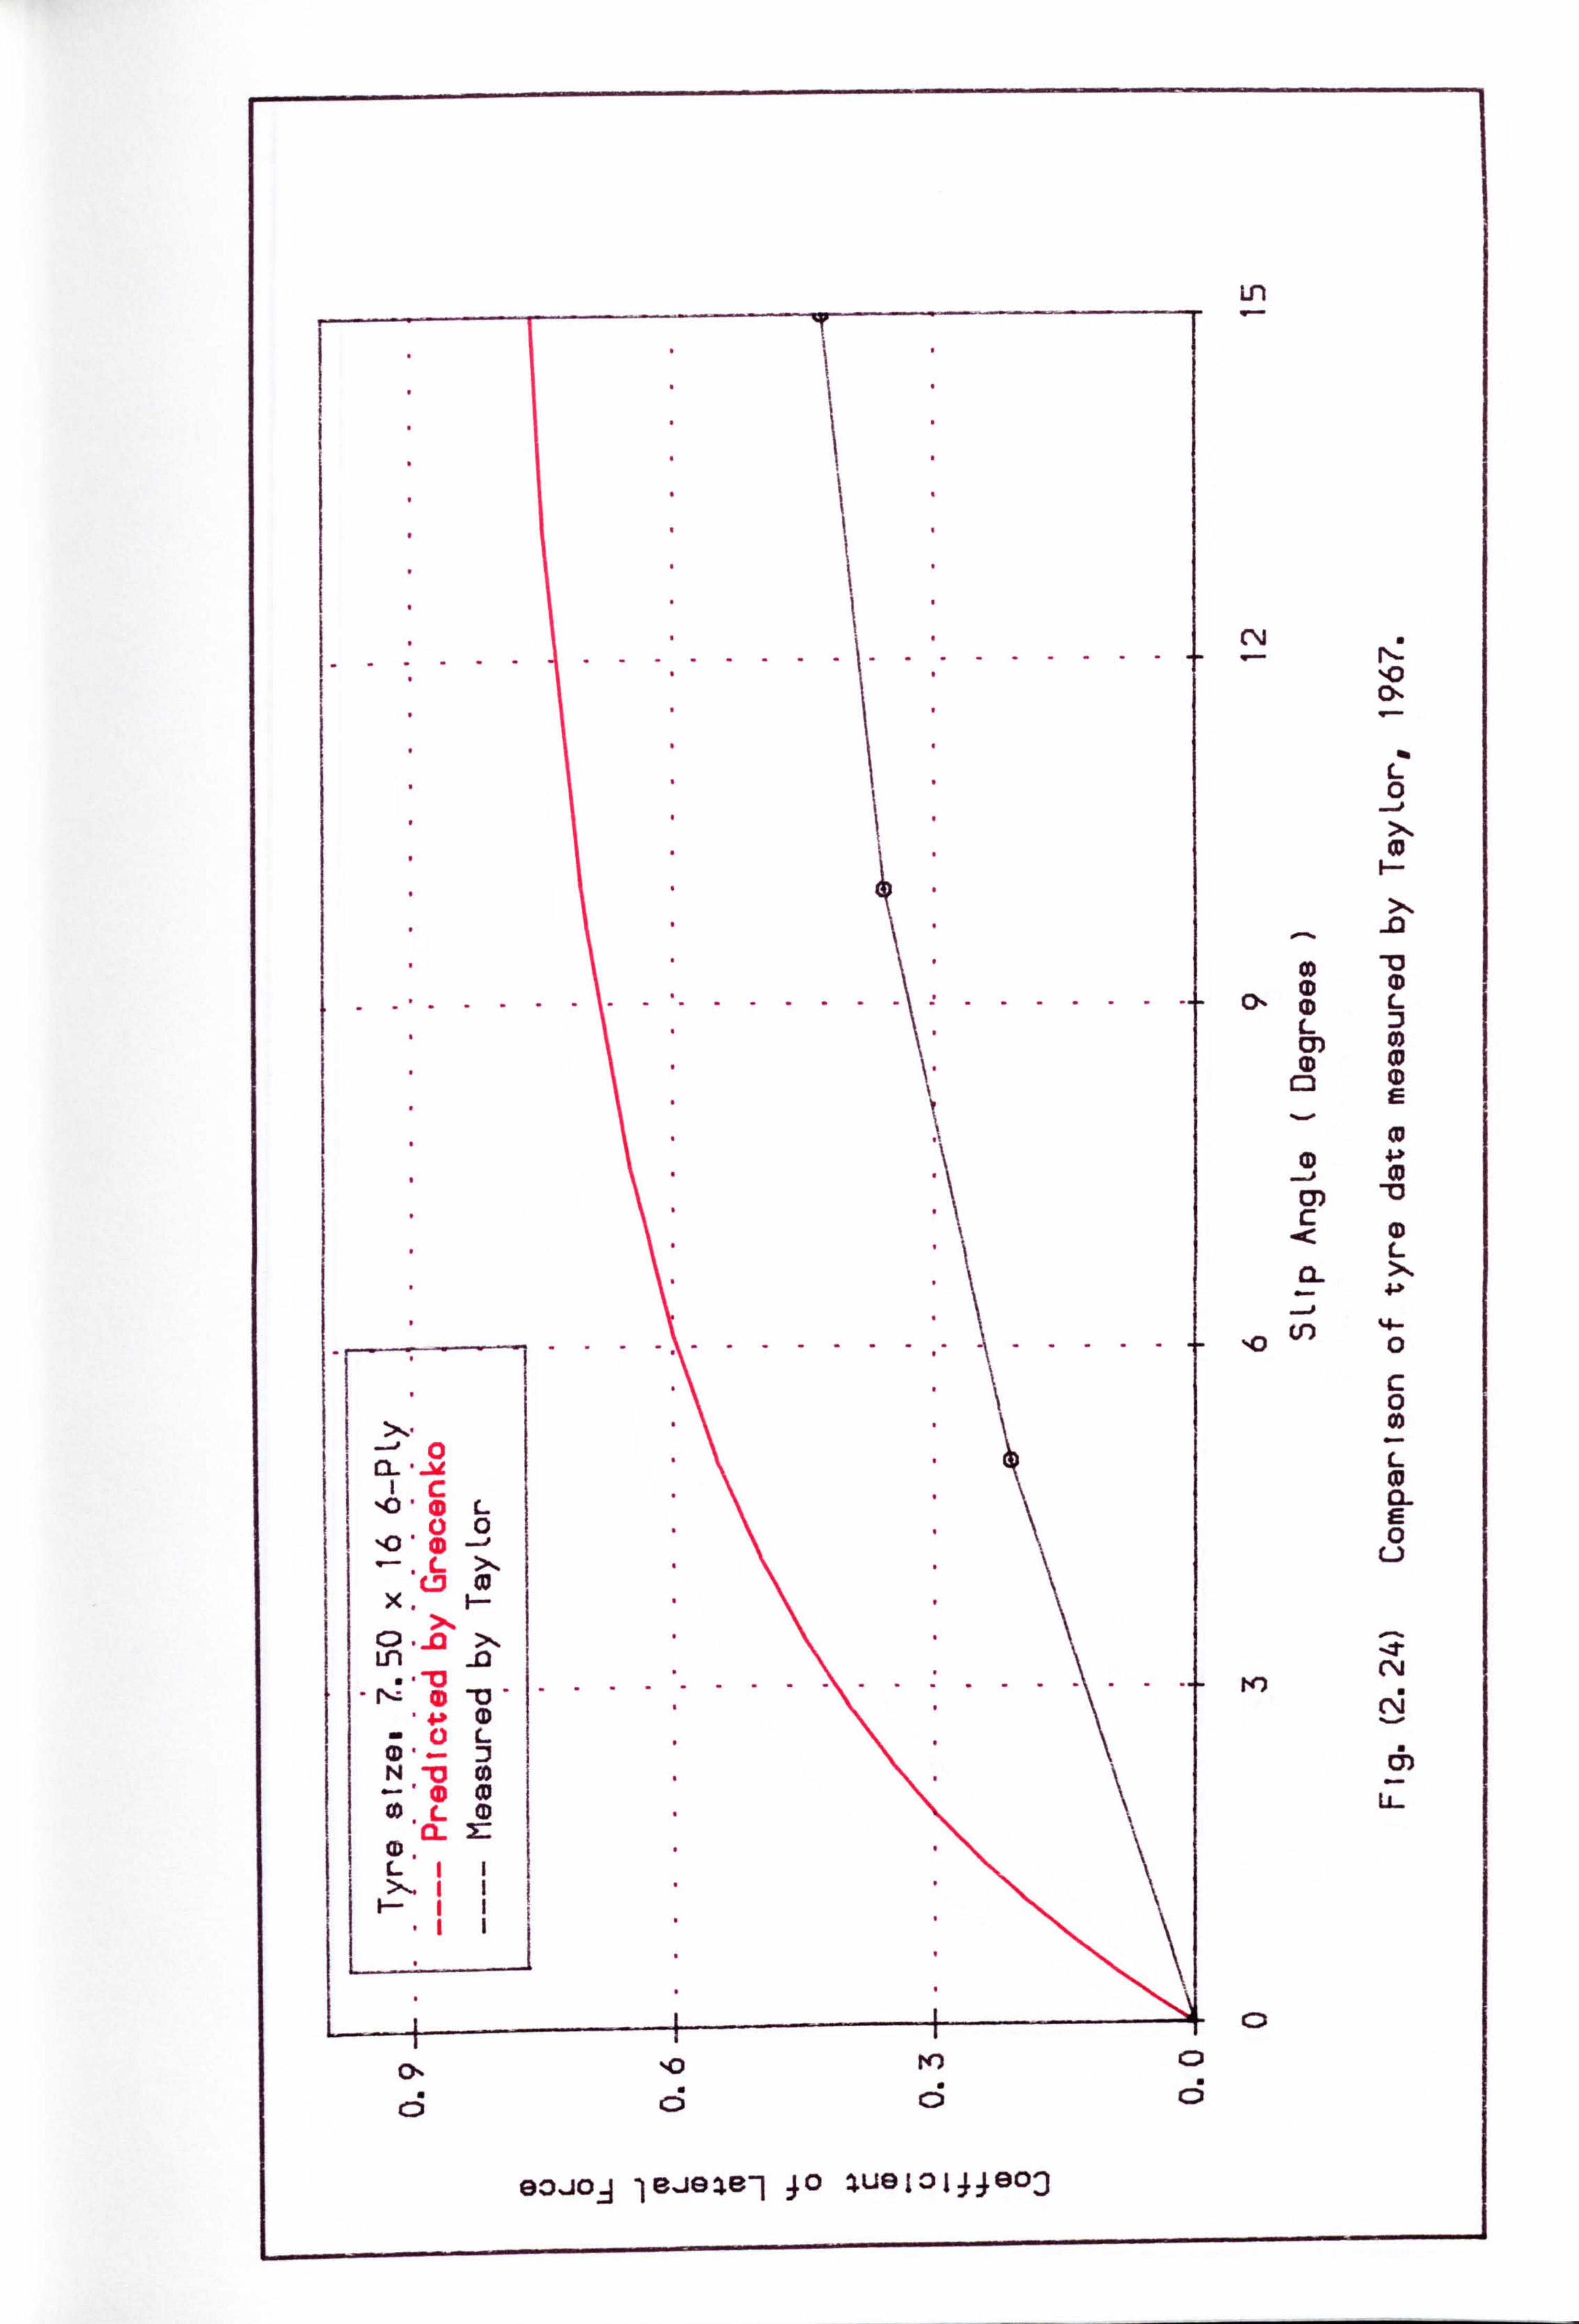
0
C , 0.0 L1
LX cm 01
xX
Ln -13 - ri -ri .
1-9 N. -13 0i ý001
.L0 CL X: ,
............... ...
............
Ln
C\j
%0 0%
0 __j X
CD C>- (D L
L ED 0) 0) Im
C3 0
(D 44
c L
%0 0
c 0
L
0 L)
te) C%j
C5) Li
10 910
c; c; c3
90, ioA leiele-1 ýo zugiolýýg03
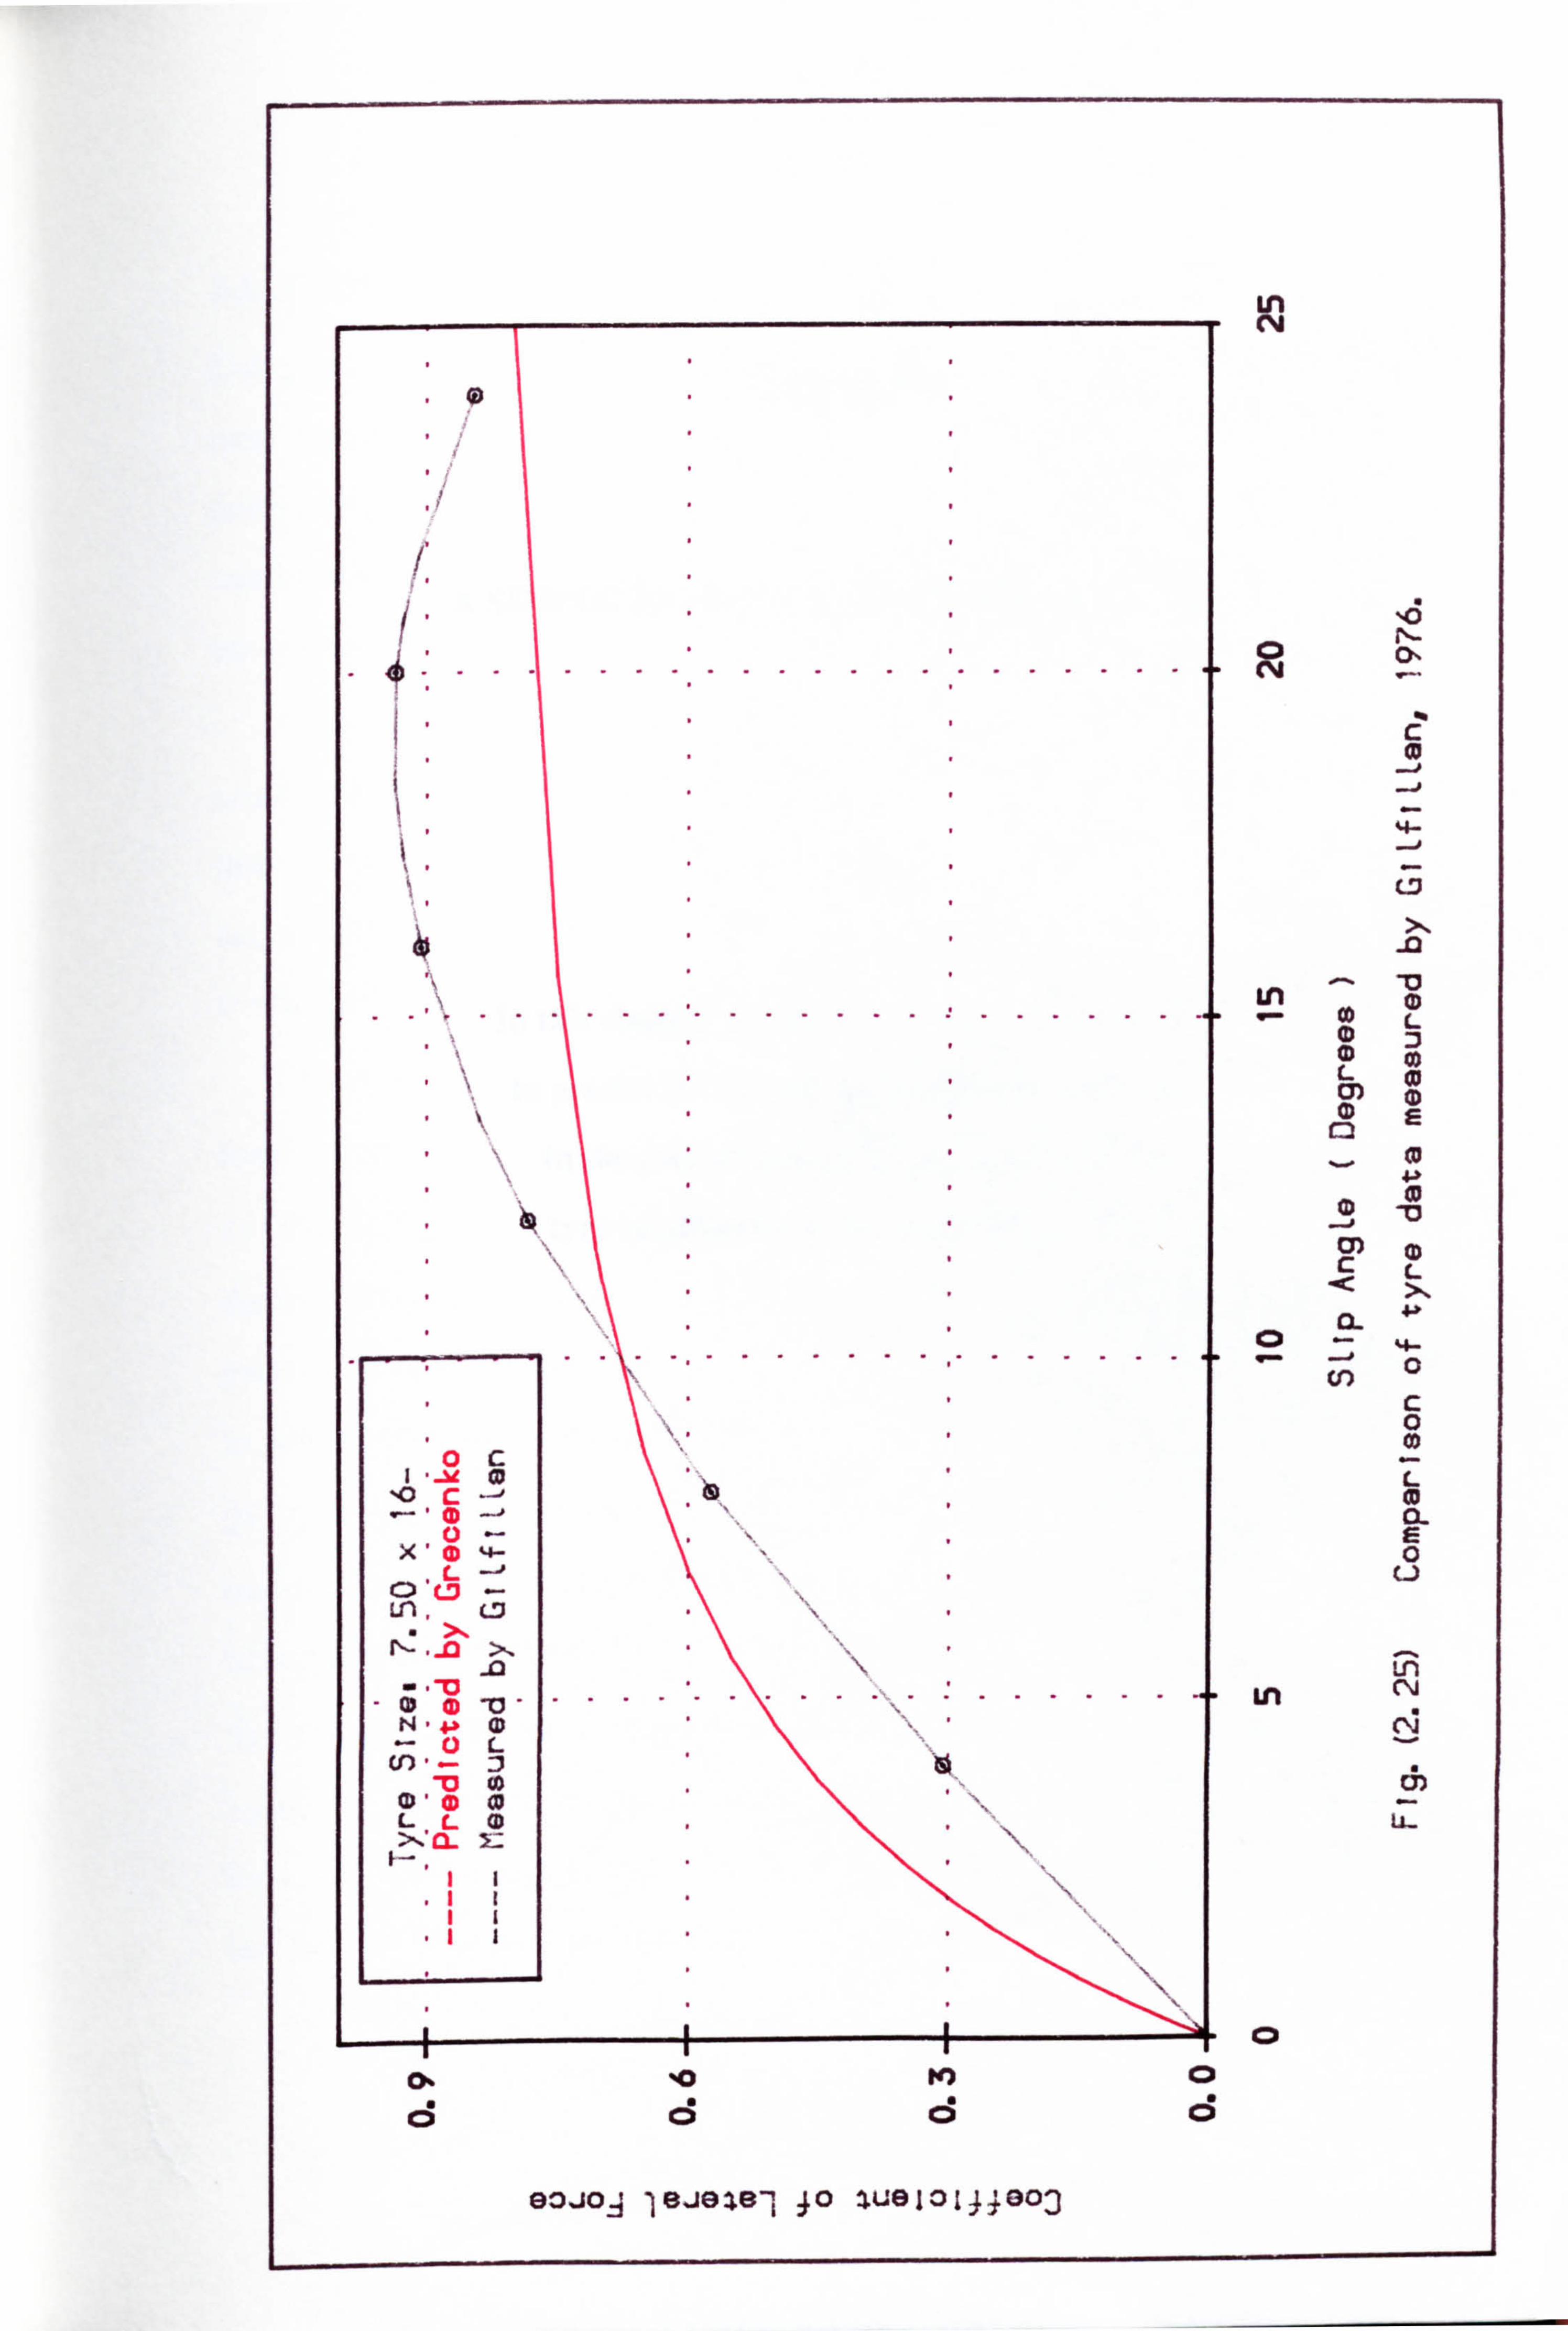
" 0
/
...................
..................
0c 'o C: -' CD
X' L
C) C)
Ln X -0
....... ..... N, 0L
-19 Cf) _0 cc I,, 10 ' (D W
LL0 CL j::
CX %0 m)
ci (3
93J0A leia2,9-t 40 tugiolýýa03
Ln N
. 45 rl_ Ol
c
- -0 0) L
4-31 0
CD 13
L
0 c 0 co
0- E 0 u
Ln Ln N
cli
0 0
S
0
CHAPTER3
A SIMPLE TYRE FORCE GENERATION MODEL
In this chapter a simple tyre model is presented
to predict the vertical and longitudinal forces
in the case of stationary and steady state
tyre conditions on a deformable surface.
-64-
3.1. INTRODUCTION
Using existing work on modelling the behaviour of on-road tyres as a background, a
new simple model to represent the tyre forces gefierated between a tyre and a
deformable surface is developed. It is based on a simplified calculation involving the
combination of a multi-spoke representation of the tyre and simple soil mechanics
equations.
The model predicts the forces in the vertical and longitudinal directions for a
stationary and rolling tyre in steady state conditions. Distributions of the forces
throughout the contact region are presented and discussed. The effect of tyre stiffness
and soil strength parameters are discussed and the model is intended to establish a basis
for further off-road tyre model studies.
Most previous studies to describe the behaviour of off-road tyres in generating
longitudinal and vertical forces are based on one of the three following points : -
1) ale soil is compact and harder than the tyre. In this situation, the deformation of
the tyre is completely dominant, and the interface is assumed to be flat. Therefore, the
proposed model becomes exactly like those used for road vehicle tyres with differences
in parameters to describe the off-road tyre.
2) The tyre is harder than the soil, thus the tyre deformation is smaller and the
interface has a convex shape. The proposed model then becomes similar to those used
to describe the behaviour of a rigid wheel in soil.
3) The case in between the previous cases, in which there is tyre deformation in the
contact region, and at the same time the ground is affected and deformed by the tyre
load. This case, which is obviously closest to the practical situation, is the one which
has received little attention in the literature.
-65-
3.2. STATIC TYRE ON DEFORMABLE SURFACE
Let us consider a tyre, standing on ground either hard or deformable at tyre load, W,
with zero camber angle, y, as shown in Fig. (3.1). The shape of the contact surface
depends on the tyre deflection. In general, the shape of the surface is slightly shorter
and wider than would follow from an imaginary, intersecting plane between the tyre in
its unloaded shape and the supporting surface. The shape of the contact region depends
on the particular tyre type and the inflation pressure. However, Fig. (3.1a) shows the
cross section of the impression that is obtained when a non-rotating (static) tyre is
lowered vertically onto hard ground. An entirely different impression is found when
the tyre inflation pressure is increased to the maximum range (as a rigid wheel), and
lowered vertically onto a soft surface as shown in Fig. (3.1b).
If the tyre has a low inflation pressure and is standing on a soft surface, it will
deflect and sink to a certain extent. The process in the contact region incorporates
aspects of the tyre on a hard ground as well as aspects of a rigid wheel (or tyre at high
inflation pressure) with sinkage. Fig. (3.1c) shows the tyre standing at tyre load, W, on a
deformable soil.
It is interesting to note that the most the soils are deformed when subjected to
load. This deformation is elastic when the soil regains its original shape upon removal
of the load. Plastic deformations occur for stresses exceeding the elastic limit of the
soil, and elasto-plastic deformations occur in soils which have no clearly defined elastic
limit (or properties). In general, when the load is removed from the soils, very little
deformation is recovered by elastic rebound, as illustrated in Fig. (3.2). This is because
the principal soil deformations are state changes caused by relative particle motion.
only a very small amount of the soil deformation occurs from particle distortion and is
elastically recoverable.
To sum up, when the soil shear stress becomes equal to the soil shear strength, and
the normal load is released, which is. indicated by "A", then if is there no elastic
recovery for this soil, the soil shear stress decreases to zero value at "B "', but if the soil
-66-
has an elastic recovery behaviour then the soil shear stress will decrease to zero value at
3.2.1. LOAD-DEFLECTION BEHAVIOUR
To describe the behaviour of off-road tyres and the forces acting on them, it is
necessary to define an axis system that serves as a reference for the definitions of
various pammeters. Ile axis systems used in this tyre model are shown in Fig. (3.3).
The origin of the axis system is the centre of the line of tyre contact with the ground.
The X axis is the intersection of the wheel plane and the ground plane with a positive
direction forward. The Z axis is perpendicular to the ground plane with a positive
direction downward. 7le Y axis is in the ground plane, its direction being chosen to
make the axis system orthogonal.
There are three main forces acting on the tyre from the ground, longitudinal force,
fx, which is the component in the X direction of the resultant force acting on the tyre,
lateral force, fy, which is the component in the Y direction and normal force, fz-, which
is the component in the Z direction of the resultant force acting on the tyre from the
load. With this axis system many performance parameters of the tyre can conveniently
be defined.
3.2.2. EQUILIBRIUM FORCE EQUATIONS
When the tyre load applied to the deformable surface exceeds a certain limit, the stress
level within a certain boundary of the surface may reach a point which is denoted by K
on the idealised stress-strain relationship shown in Fig. (3.4). An infinitely small
increase of stress beyond point K produces a rapid increase of strain, which constitutes
plastic flow. Ilie state that precedes plastic flow is usually referred to as plastic
equilibrium.
Ilere are a number of criteria proposed for the failure of soils under tyre, load and
of other similar materials. One of the widely used and simplest criteria is that due to
-67-
Mohr-Coulomb. It postulates that the shear stress in the material is related to
displacement according to the following condition :-
, r, = (c+Pgtaný)(1-c-i1K)
where
, c, = Soil shear stress
Pg = Nonnal ground pressure
c= Soil cohesion
ý= Soil internal angle of friction
Soil shear displacement
K= Soil deformation modulus
The basis of the Bekker theory [1969] is a relationship between the ground pressure,
Pg, and soil sinkage, Z, as follows: -
c p (! -+K, ) Zn (3.2) 9ýb
where
K, = Cohesive soil moduli
KO = Frictional soil moduli
b= Width of tyre contact patch
n= Exponent of soil deformation
in which Kc, Ký and n are empirically measured, soil describing constants.
The use of basic equations (3.1) and (3.2) can perhaps best be appreciated by
considering the case of a static tyre on deformable surfaces. At the interface between
the tyre and the off-road sur-face an element of tyre surface area is acted upon by forces
which can be expressed as two components, one perpendicular to the contact region,
called the normal force, fg, and other tangential to the contact region, called shear
force, f, This is shown in Fig. (3.5). The idea behind the modelling is that at any point
-68-
point of the interaction between the tyre and ground, the shear and normal forces must
equal the bending and radial forces generated by the tyre. Accordingly the tyre and soil
forces are :-
fs = (c + Pg ta#) (1 -e-j'K) Ac (3.3)
c fg = (L+KO)ZnAc (3.4) b
fb = ljx Kx (3.5)
f, = DR K,, (3.6)
where
A, = Horizontal contact area
71., = Circumferential deflection
K, = Circumferential tyre stiffness
DR = Radial tyre deflection
K, = Radial tyre stiffness
ne equilibrium force equations can be written as following
fs "' fb (3.7)
f9 = fr (3.8)
Substitution of equations (3.3) to (3.6) into equations (3.7) and (3.8) give:
(c + Pg tano) (I -e-j'K) Ac = il., K, (3.9)
Kc + KO) Z' Ac = DR K, (3.10) b
and from the tyre geometry as shown in Fig. (3.5), the relation between the tyre
deflections and the soil sinkage at any point through the contact region is :-
R Cos01 +Z +ilx Sin0 = (R-DR) Cos0
-69-
where
Undeflected tyre mdius
dO = Spoke angle position
01 = Entry angle
0= 01 -dO and
i= lix
The simplified model contains two main assumptions:
The area of contact region between the tyre and the surface is assumed to be
rectangular, i. e. (area =b 1) and divided into infinitely thin strips.
where I is length of the tyre contact patch.
2) The tyre load/deflection relationship is assumed to be a linear function.
Equilibrium force equations (3.9), (3.10) and (3.11) can be solved for DR, 71., and Z.
The vertical and horizontal tyre force components would be :-
DR K., Cos 0+ 71., K, Sin 0 (3.12)
fx = DR Kr SinO + lix Kx CosO (3.13)
Ilie summation of vertical tyre force components is :-
0=-Ol
0=01 (3.14)
0=-Ol Fz = Y, (DR K,, cosO + Tjx Kx sinO (3.15)
0=01
The total vertical force, F, must be equal to the tyre load, TV. If not, then there is
a subroutine called "Angle" to recalculate the correct value of 01 for which F., = IV.
Fig. (3.6) shows the load distribution of a 7.50 x 18 front tractor tyre along the length of
the contact region. The longitudinal shear force distribution is shown in Fig. (3.7).
-70-
3.2.3. EFFECT OF RADIAL TYRE STIFFNESS
Fig. (3.8) shows the influence of the radial tyre stiffness on the radial tyre deflection and
the soil sinkage for a static tyre on deformable soil. Vertical and horizontal components
of tyre force generation are affected by different values of radial tyre stiffness as shown
in Fig. (3.9).
3.2.4. EFFECT OF TYPE OF SOILS
Simple tyre model results are affected significantly by three type of soils, clay soil,
loose soil and sandy loam soil. Fig. (3.10) illustrates the radial tyre deflection and soil
sinkage distributions along the length of the contact region. Vertical and horizontal
force distributions are shown in Fig. (3.11).
3.3. ROLLING TYRE ON DEFORMABLE SURFACE
With constant forward speed, U, and constant spin velocity, CO, there will be combined
tyre deflection and soil deformation. The deformations of the tyre and the soil are
dependent on several important parameters, such as tyre stiffnesses, tyre inflation
pressure, soil type and soil strength.
Fig. (3.12) shows how the tyre moves in steady state conditions on hard ground
(a), rigid wheel on soft surface (b) and tyre on deformable surface (c). The entry angle,
01, in case (c) is greater than that in case (a), but less than that in case (b). However, the
soil sinkage, Z, increases with increasing tyre inflation pressure until a maximum value,
which is the same as the case of the rigid wheel, is reached.
According to Fig. (3.12), the interface between the tyre and a deformable surface
is assumed to be split into two main regions as follows: -
1) Deformable region, that is the region at the front of the tyre contact patch, where all
the soil defonnation occurs.
2) Compacted region, that is the region at the rear of the tyre contact patch, the tyre
forces are decreased and the soil reaches a maximum sinkage.
-71-
3.3.1. TYRE AND SOIL FORCES
As mentioned earlier in equations (3.3) and (3.4), the forces acting on the tyre from the
ground are f, and fg. Ilese forces must be equal to those forces generated by the tyre
deformations. In order to describe the behaviour of the rolling tyre on deformable
surfaces, the equilibrium force equations are :-
Deformable region
Kc + K, ) Zn Ac = DR Kr (3.16) b
(c + Pg taný) (I -e-j'K) Ac = 11., K, (3.17)
R CosOl +Z+ ilx SinO = (R -DR) CosO (3.18)
R Sin0l =U dt + (R-DR) SinO +ljx CosO (3.19)
where
dt = time increment =A Co
and A= 1'.
Equations (3.16) to (3.19) can be solved for DR, %, j and Z Then the vertical and
longitudinal tyre force components can be resolved :-
fz = DR Kr Cos 0+ ilx Kx Sin 0 (3.20)
L= DR K., SinO B+ il, K., CosO (3.21)
Compacted region
To determine the tyre and soil force components in the second half of the tyre, the
approximate relation between the entry angle, 01, and the rear angle, 02, is as follows --
02 ý-- COS-1 COSOI + Zmax
(3.22) R
where Zm,,., is maximum soil sinkage.
-72-
The equilibrium force equations in this region are:
R C05 02 = (R -DR) Cos 0+ 71x Sin 0 (3.23)
R Sin02 =U dt + (R-DR) SinO-ilx CosO (3.24)
The solution of equations (3.23) and (3.24) in DR and il., are used to calculate the tyre
force components in vertical and longitudinal directions as follows :-
f, = DR K., Cos 0+ 11., K, Sin 0 (3.25)
=DRK., SinO-ij., K,, COSO (3.26)
The total vertical tyre force through the length of contact region is :- 0"= -02
0=01 (3.27)
07-02
Fz = F, (DR Kr CosO + ilx Kx SinO) (3.28) 0=01
Fig. (3.13) shows the behaviour of soil sinkage and the radial tyre deflection
through the length of the contact region for rolling steady state tyre on sandy loam soil.
Both soil sinkage and radial deflection reach a maximum value at the centre of the tyre.
In the second half of the contact length, the soil sinkage stays. The radial deflection
behaviour is similar to the soil sinkage up to the centreline of the tyre. After that point
the soil sinkage remains constant because force decreases and soil behaviour is clearly
not elastic recovery.
The longitudinal and vertical force distributions along the contact region of a
rolling tyre moving under steady-state conditions on sandy loam soil are shown in
Fig. (3.14). The longitudinal force distribution takes form which has a small part at the
rear of the figure. Rolling resistance can be found by a summation of the longitudinal
force over the length of the contact region. Pressure distribution along the contact
region is presented also in Fig. (3.14). The centre of pressure remains in front of the tyre
which is ahead of the centre of the contact region.
-73-
3.3.2. INFLUENCE OF TYRE STIFFNESS
For the steady state tyre, Fig. (3.15) illustrates the influence of the radial tyre stiffness
on the radial tyre deflection and soil sinkage. With increasing tyre stiffness, tyre
deflection is decreased, while the soil sinkage increases. 7be distributions of tyre force
are indicated in Fig-(3.16) for various tyre stiffnesses. The soil parameters remain
constant, an increase in tyre stiffness parameters results in less radial tyre deflection and
a reduction, therefore, in the length of the contact region.
3.3.3. EFFECT OF SOIL STRENGTH
Fig. (3.17) and Fig. (3.18) show the influence of the soil strength on the tyre deflection,
soil sinkage and force distributions for vertical and horizontal directions. The dominant
feature is that since the tyre load is maintained constant, an increase in soil strength
results in less sinkage and a reduction, therefore, in the length of the contact region and
an increase in ground pressure.
3.4. CONCLUDING REMARKS
A simple tyre model for vertipl and longitudinal force generation of an off-
road surfaces in the case of stationary and rolling tyre in steady state conditions has
been presented.
(2) In predicting the longitudinal and vertical force distributions within an off-
road tyre, the model forms a basis for an extension of the analysis to include lateral
force behaviour.
(3) The presented results cover the static and steady state cases for a wide range
off-road surfaces.
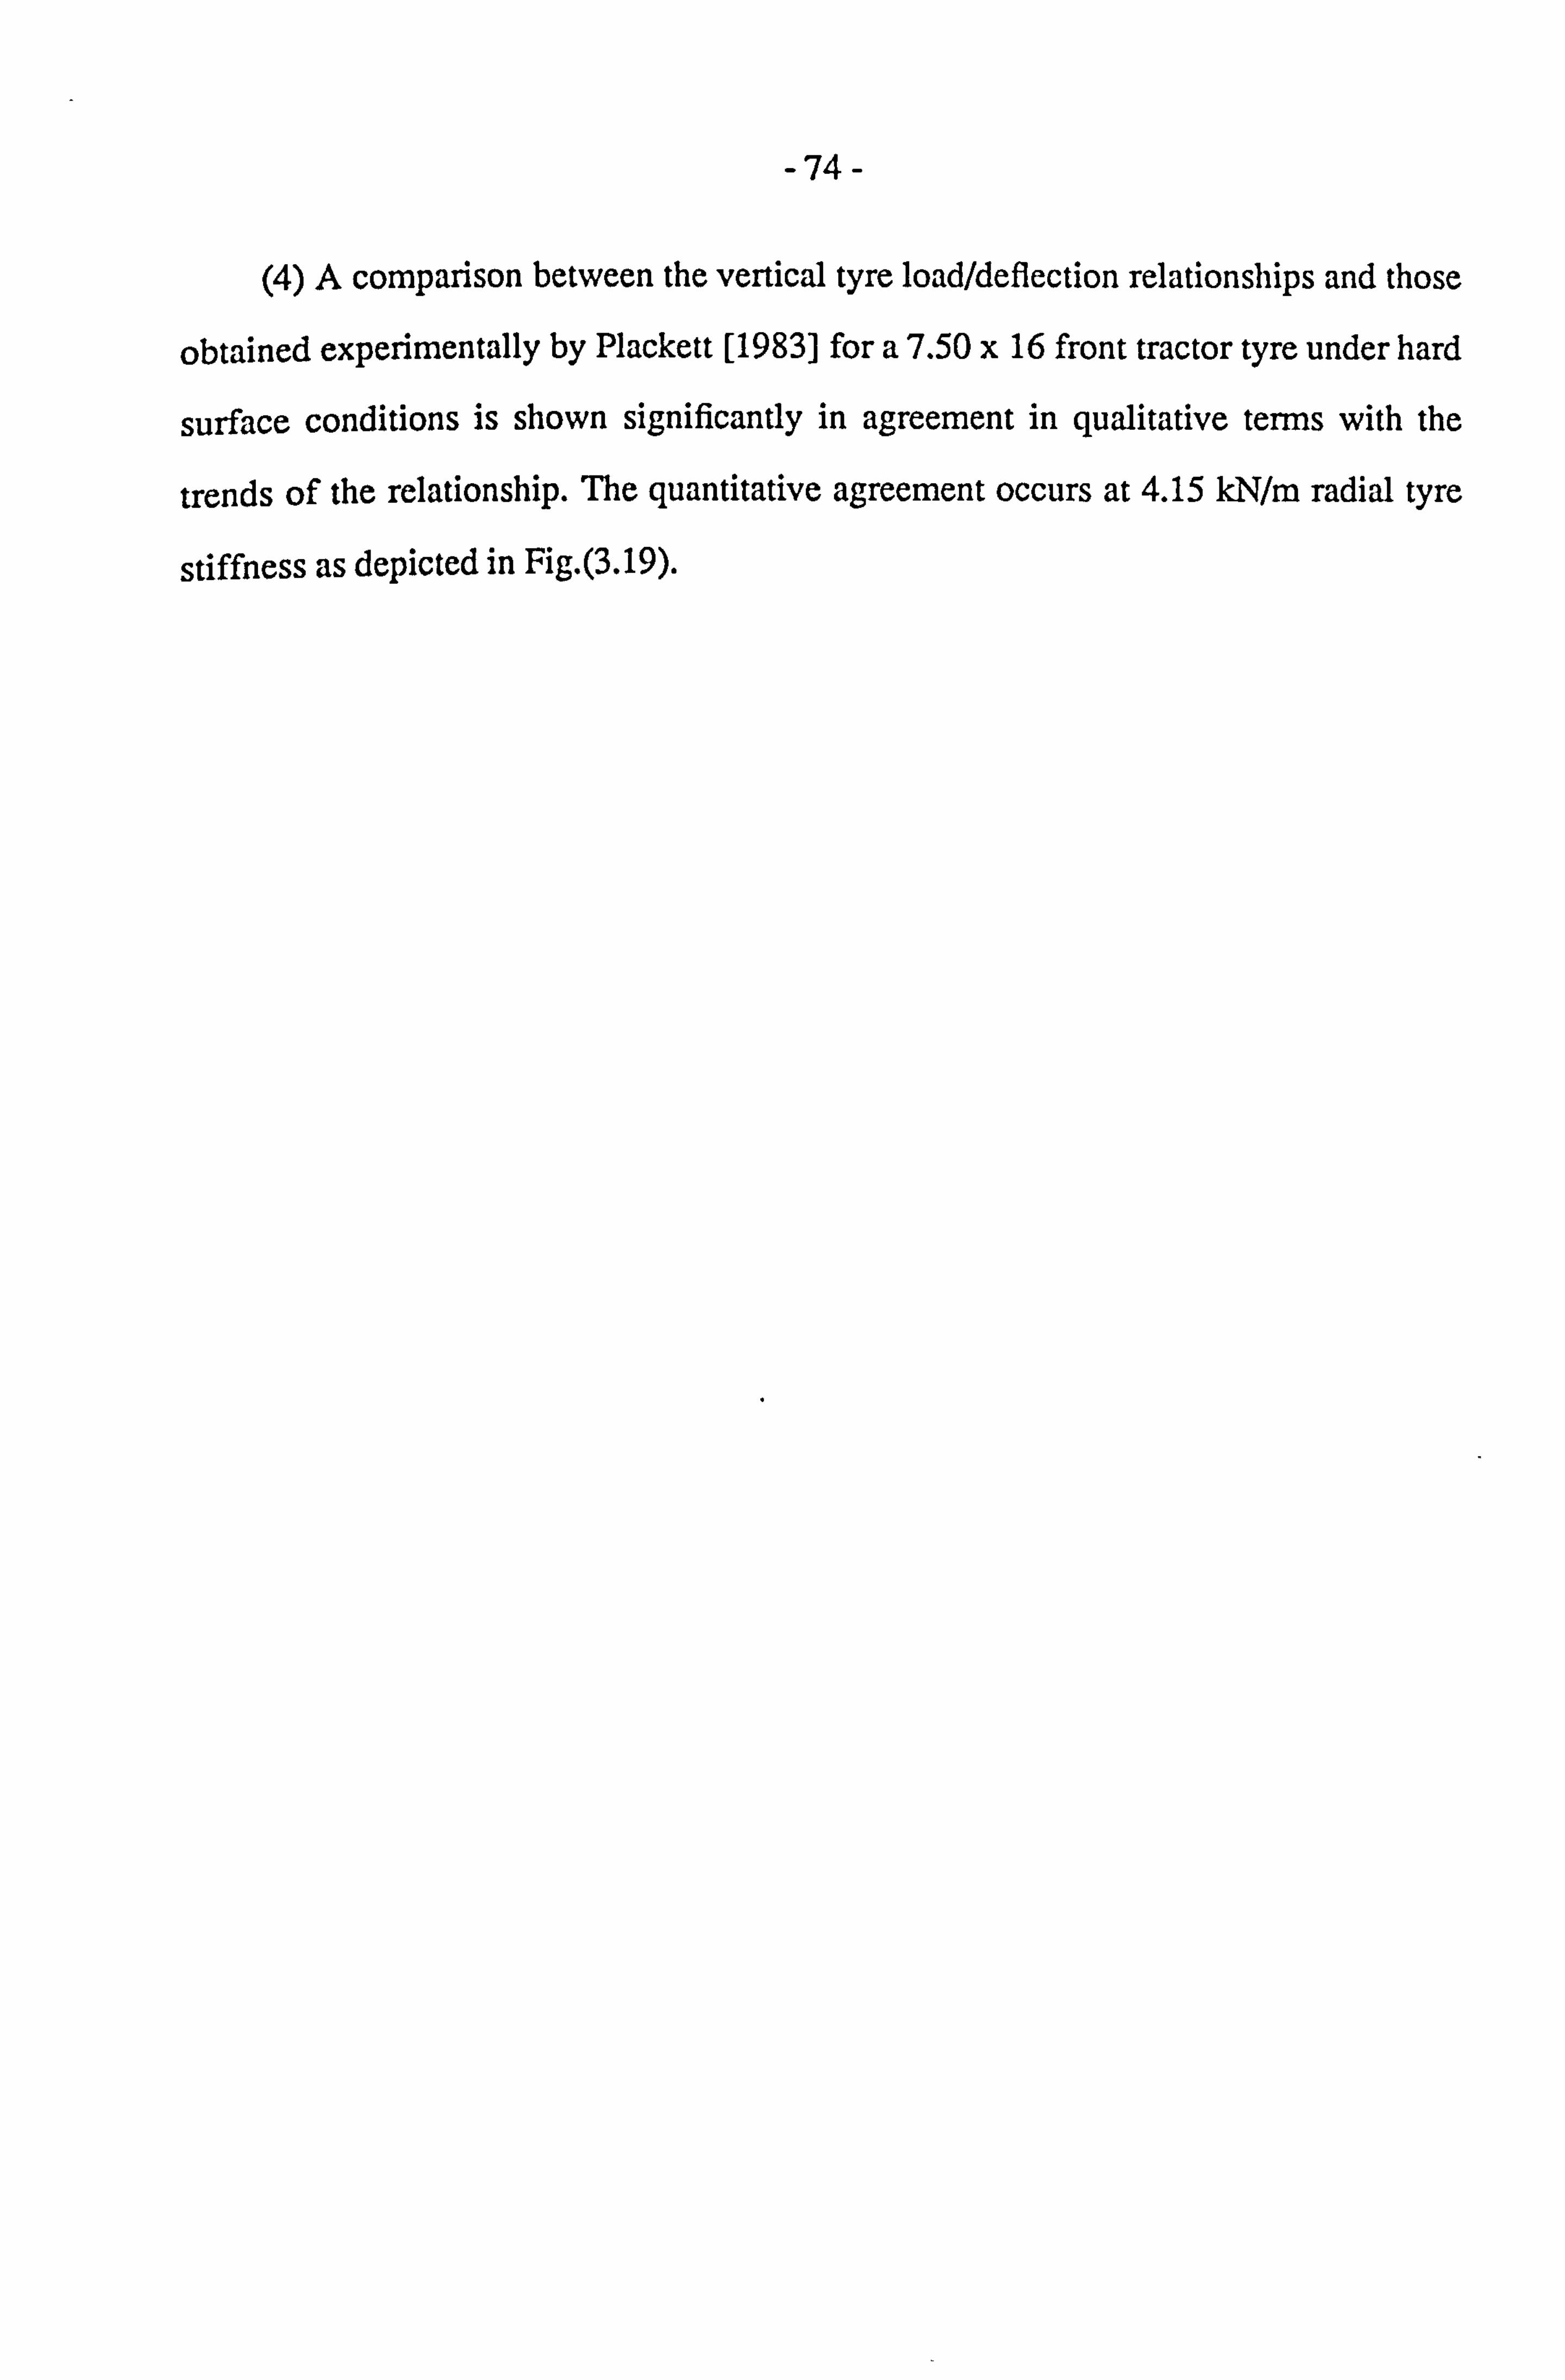
-74-
(4) A comparison between the vertical tyre load/deflection relationships and those
obtained experimentally by Plackett [1983] for a 7.50 x 16 front tractor tyre under hard
surface conditions is shown significantly in agreement in qualitative terms with the
trends of the relationship. The quantitative agreement occurs at 4.15 kN/m radial tyre
stiffness as depicted in Fig. (3.19).
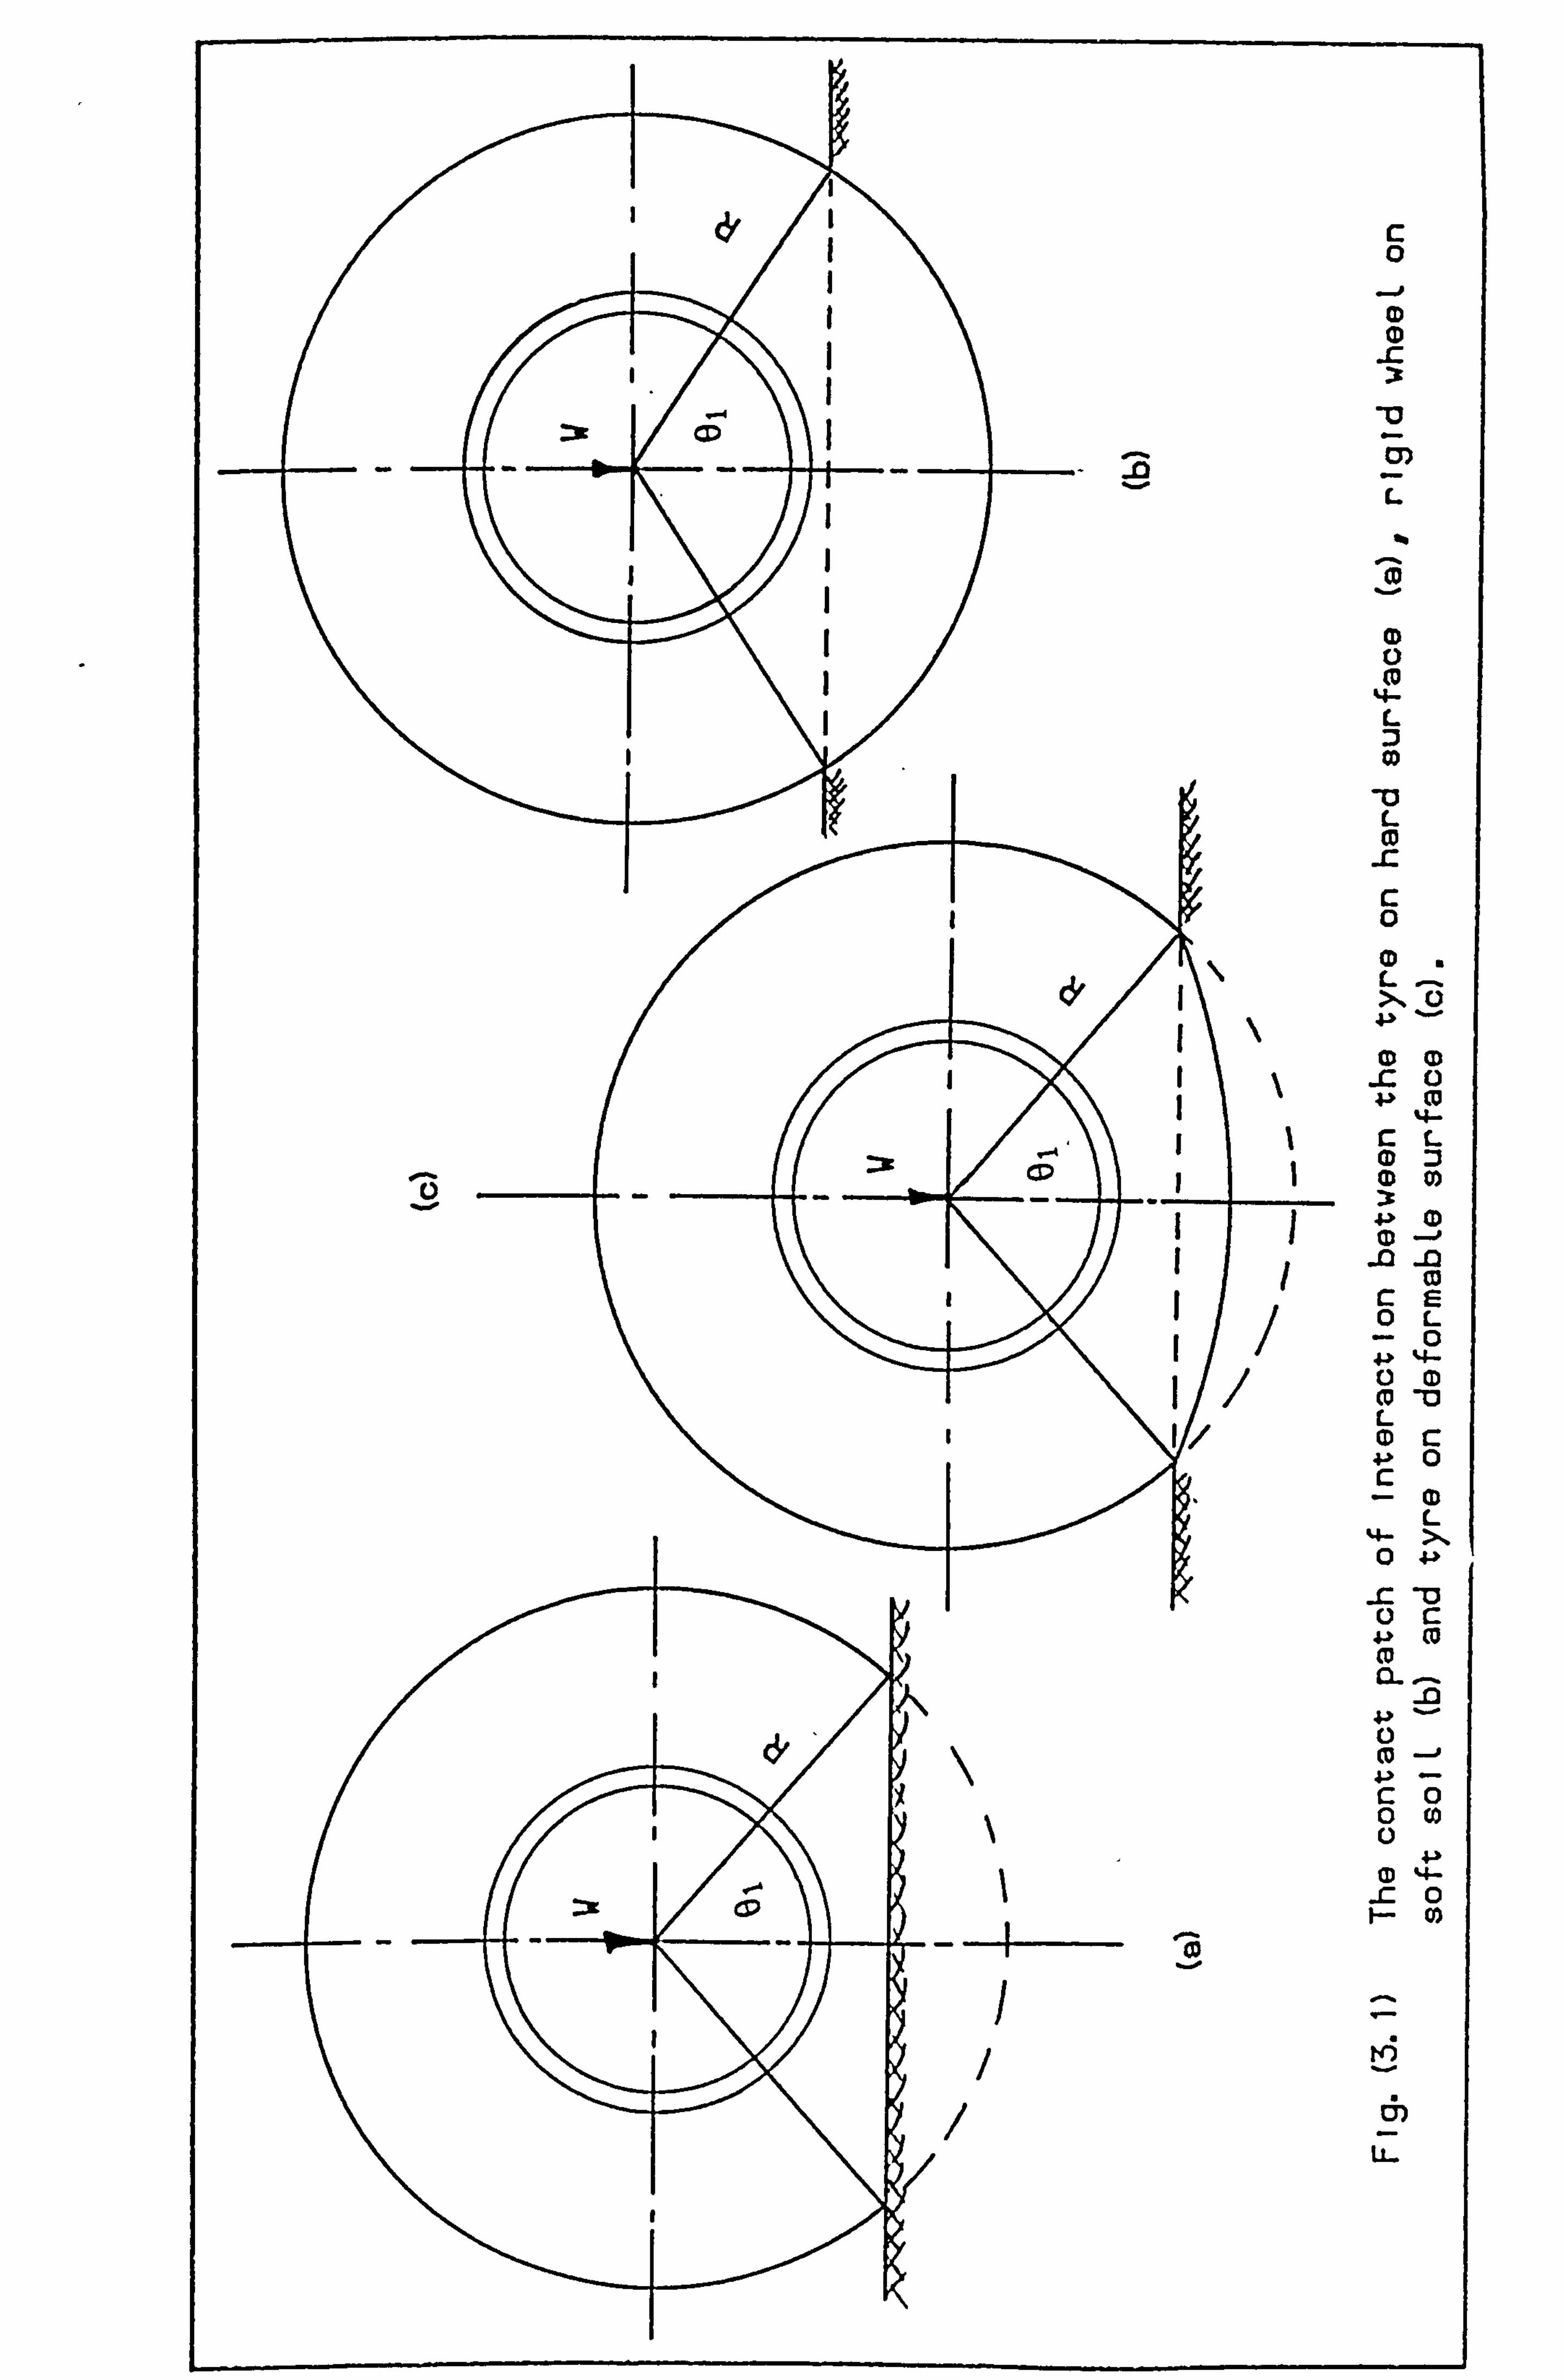
c3) _i2
11 (D
1 (0 4- L 3
L CD
Z
0 L X0
(D 0
r_ L CP 11 1
0Z 0 0) 0
1
1 -0 -a 1 Co c: E
0L 1
0 _ID L 0c 4-> 0 c
L
0
-r- 0c 4> (0
(U --i
0 (0
_c 0
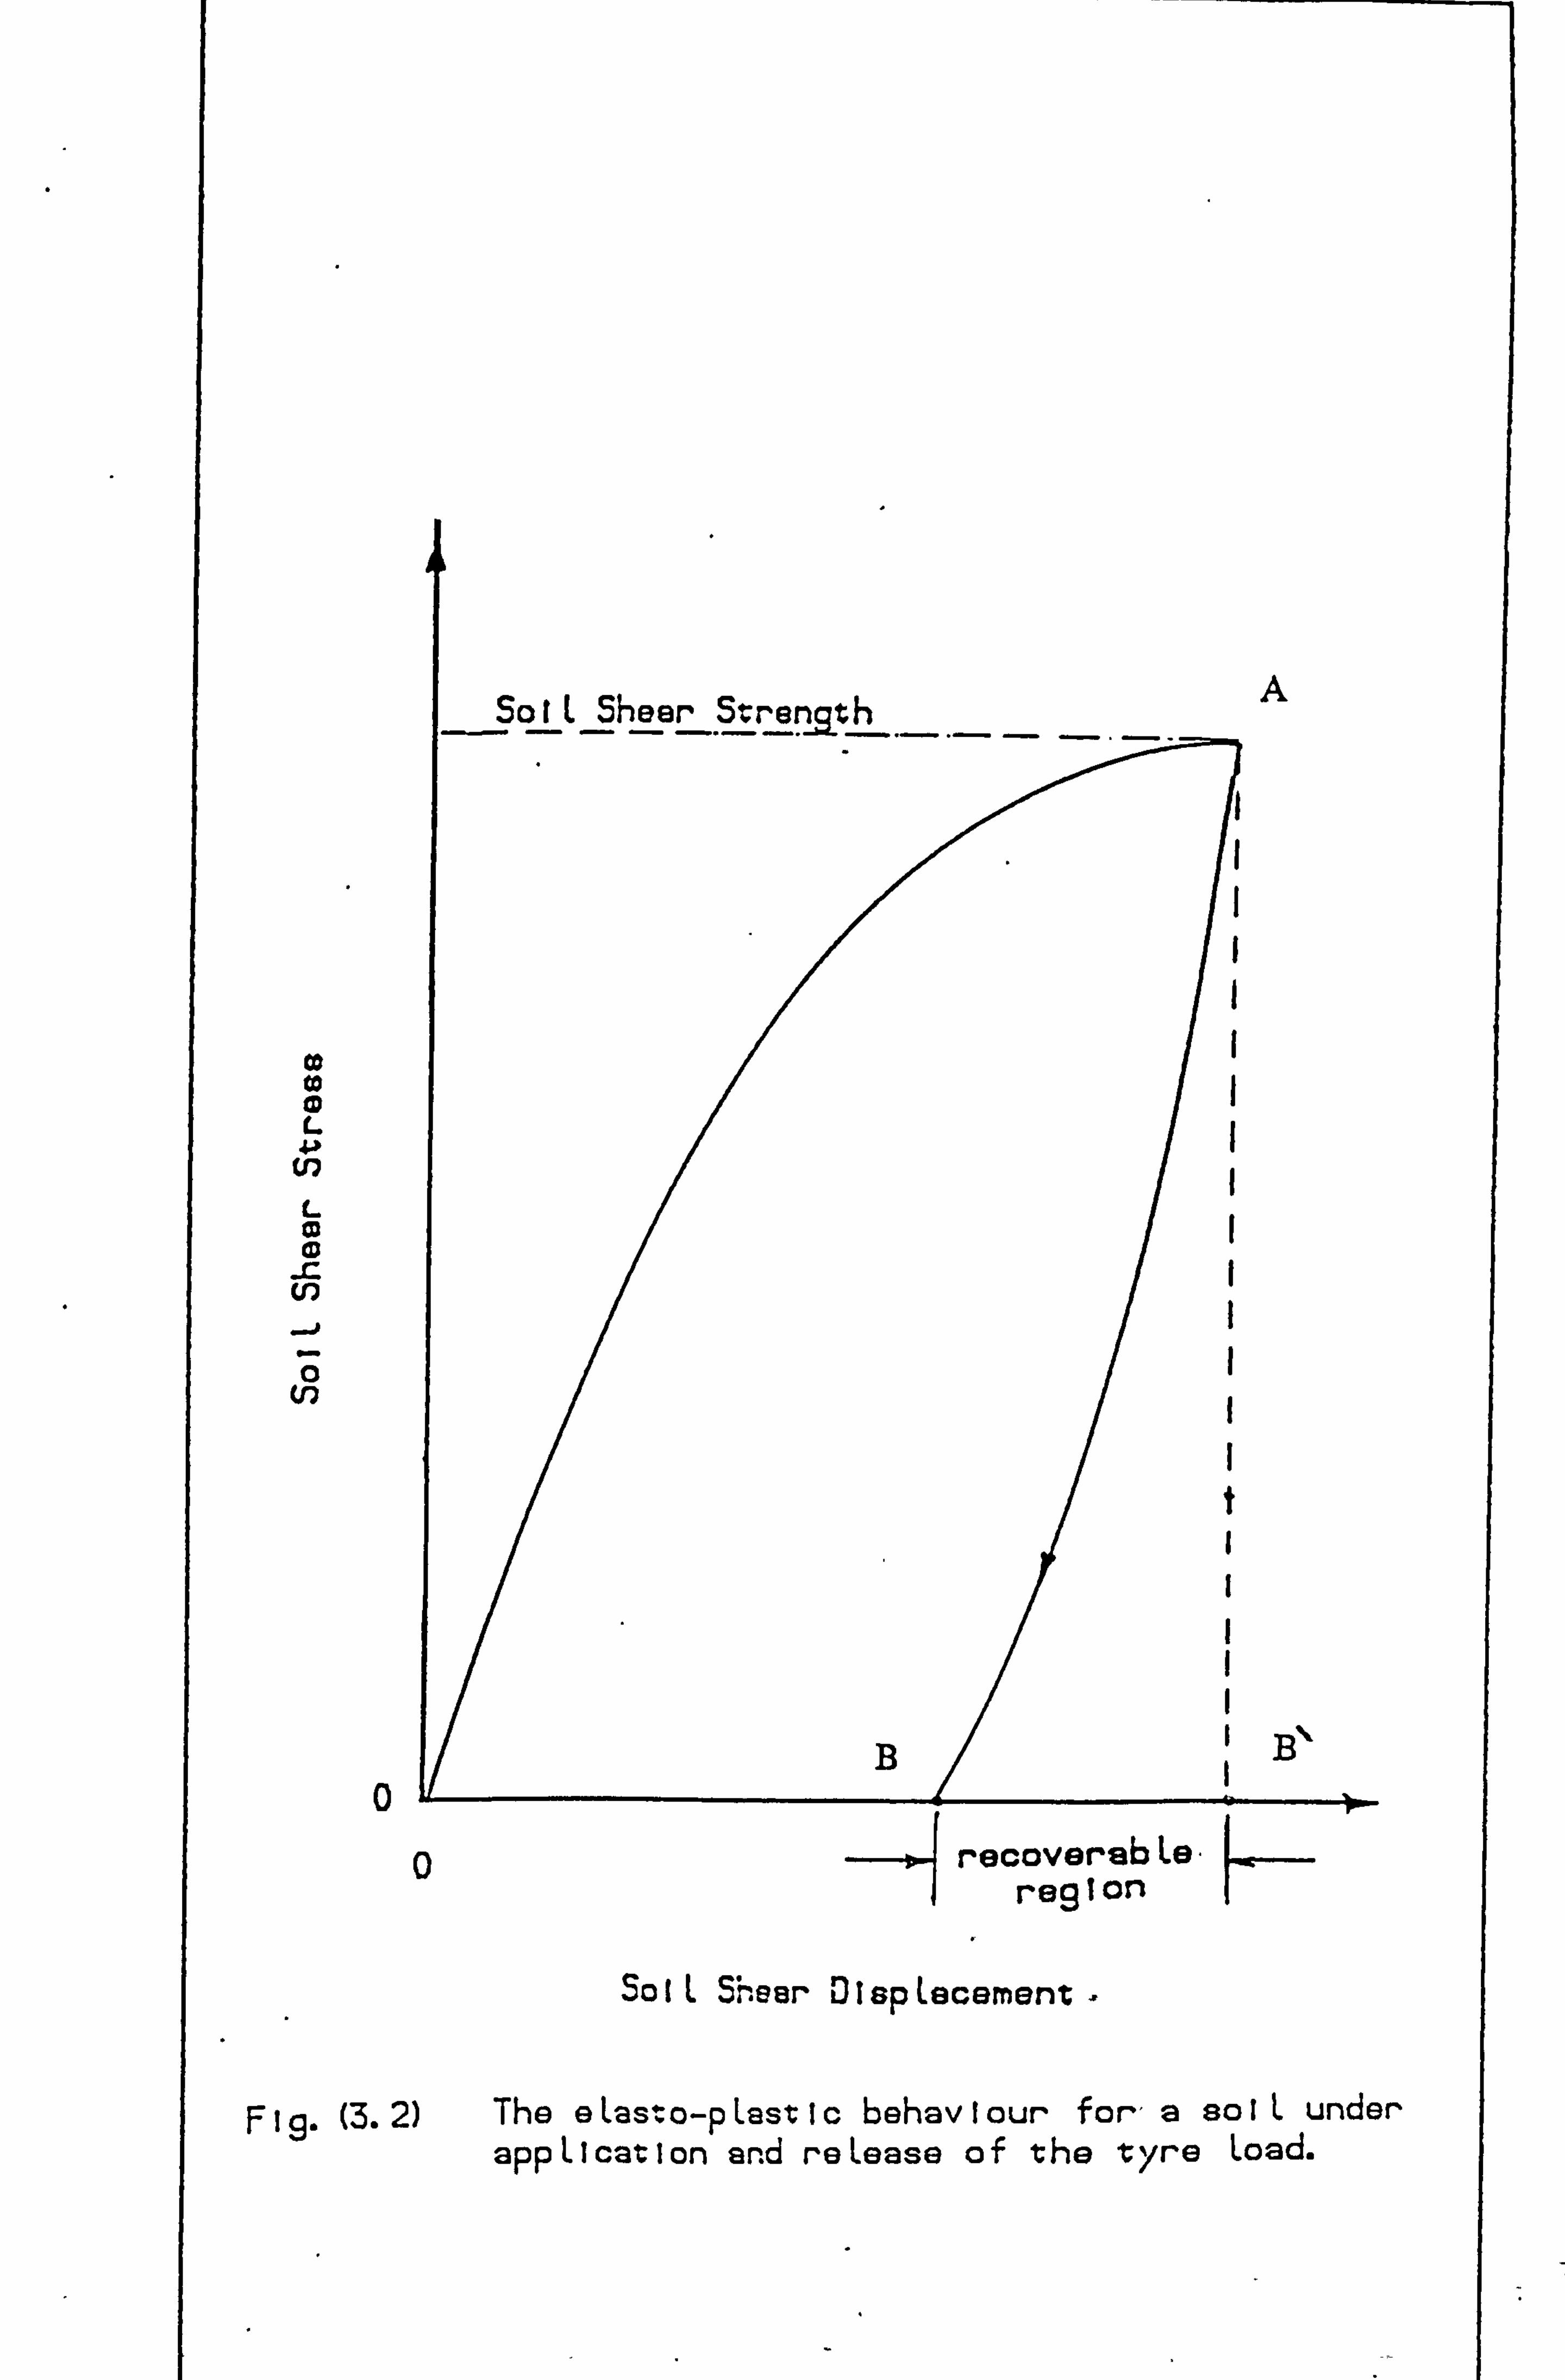
0
0
So IL 5ear 01 sp Lecement ý
to-p Last Ic behav I our f or, a so IL under 9. (3.2) The e Las. appLication and reLease of the tyre Load.
recovers b Le. region
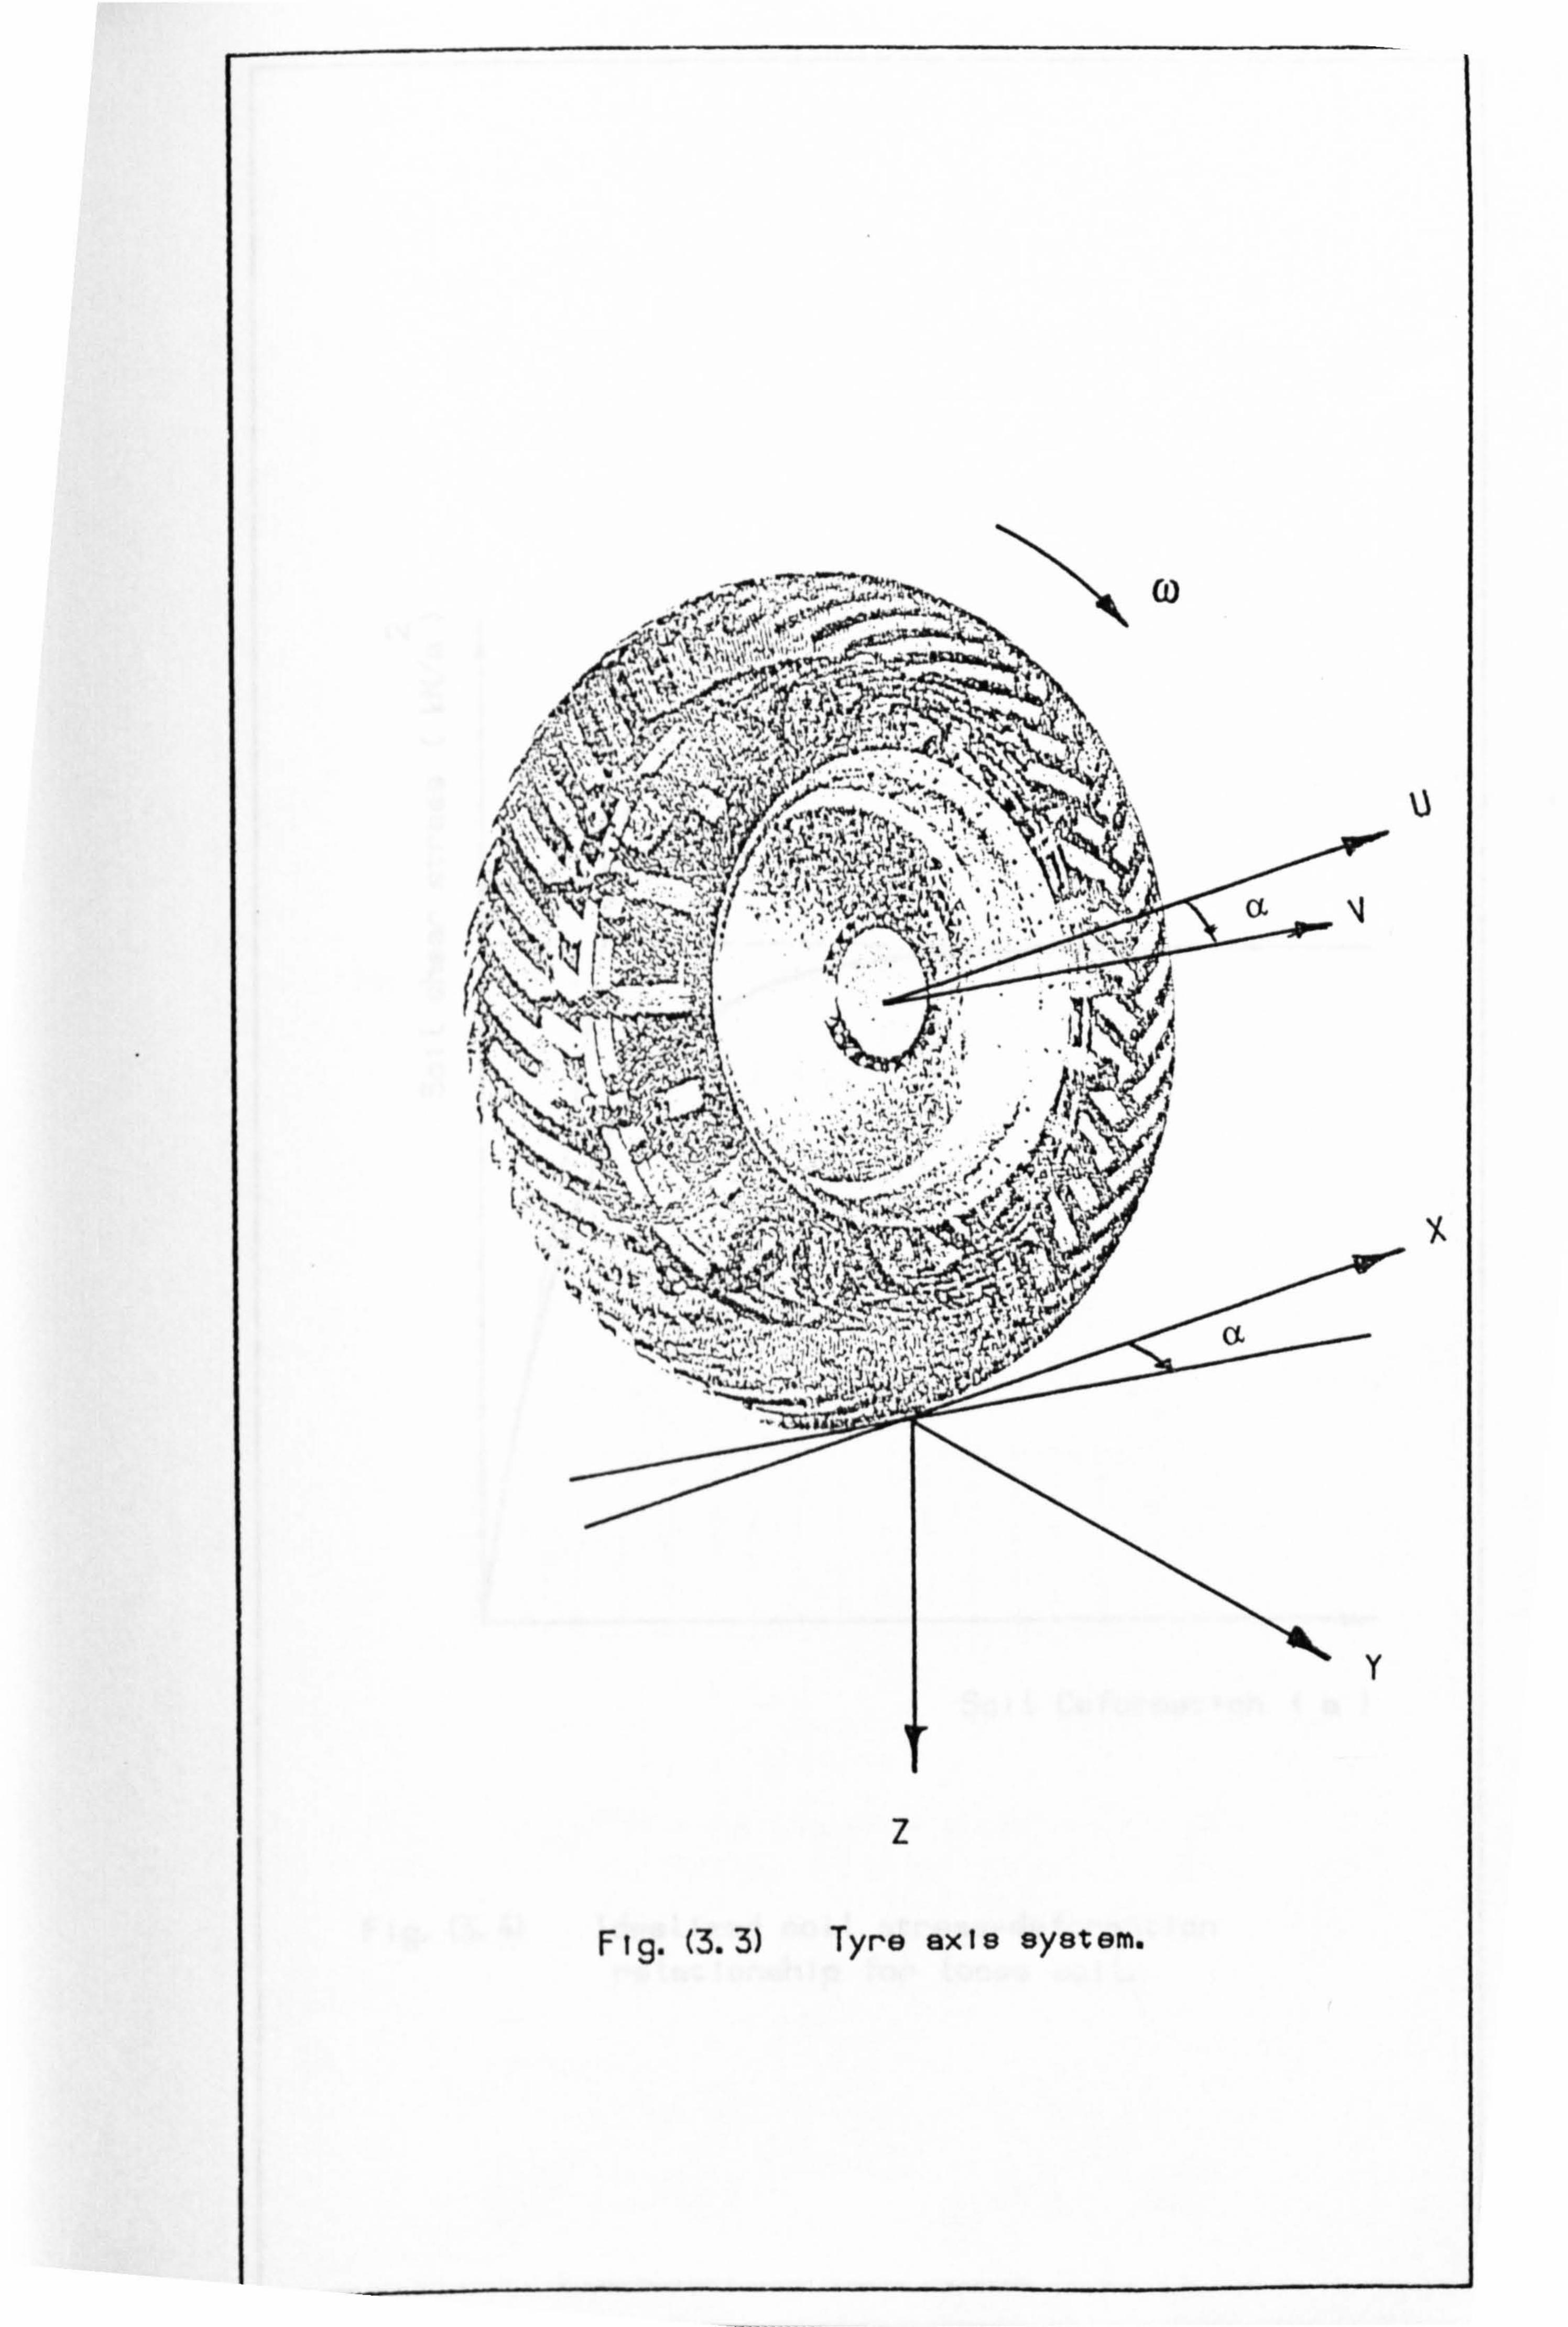
ý3
Y,
Fig. (3.3) Tyre axis system.
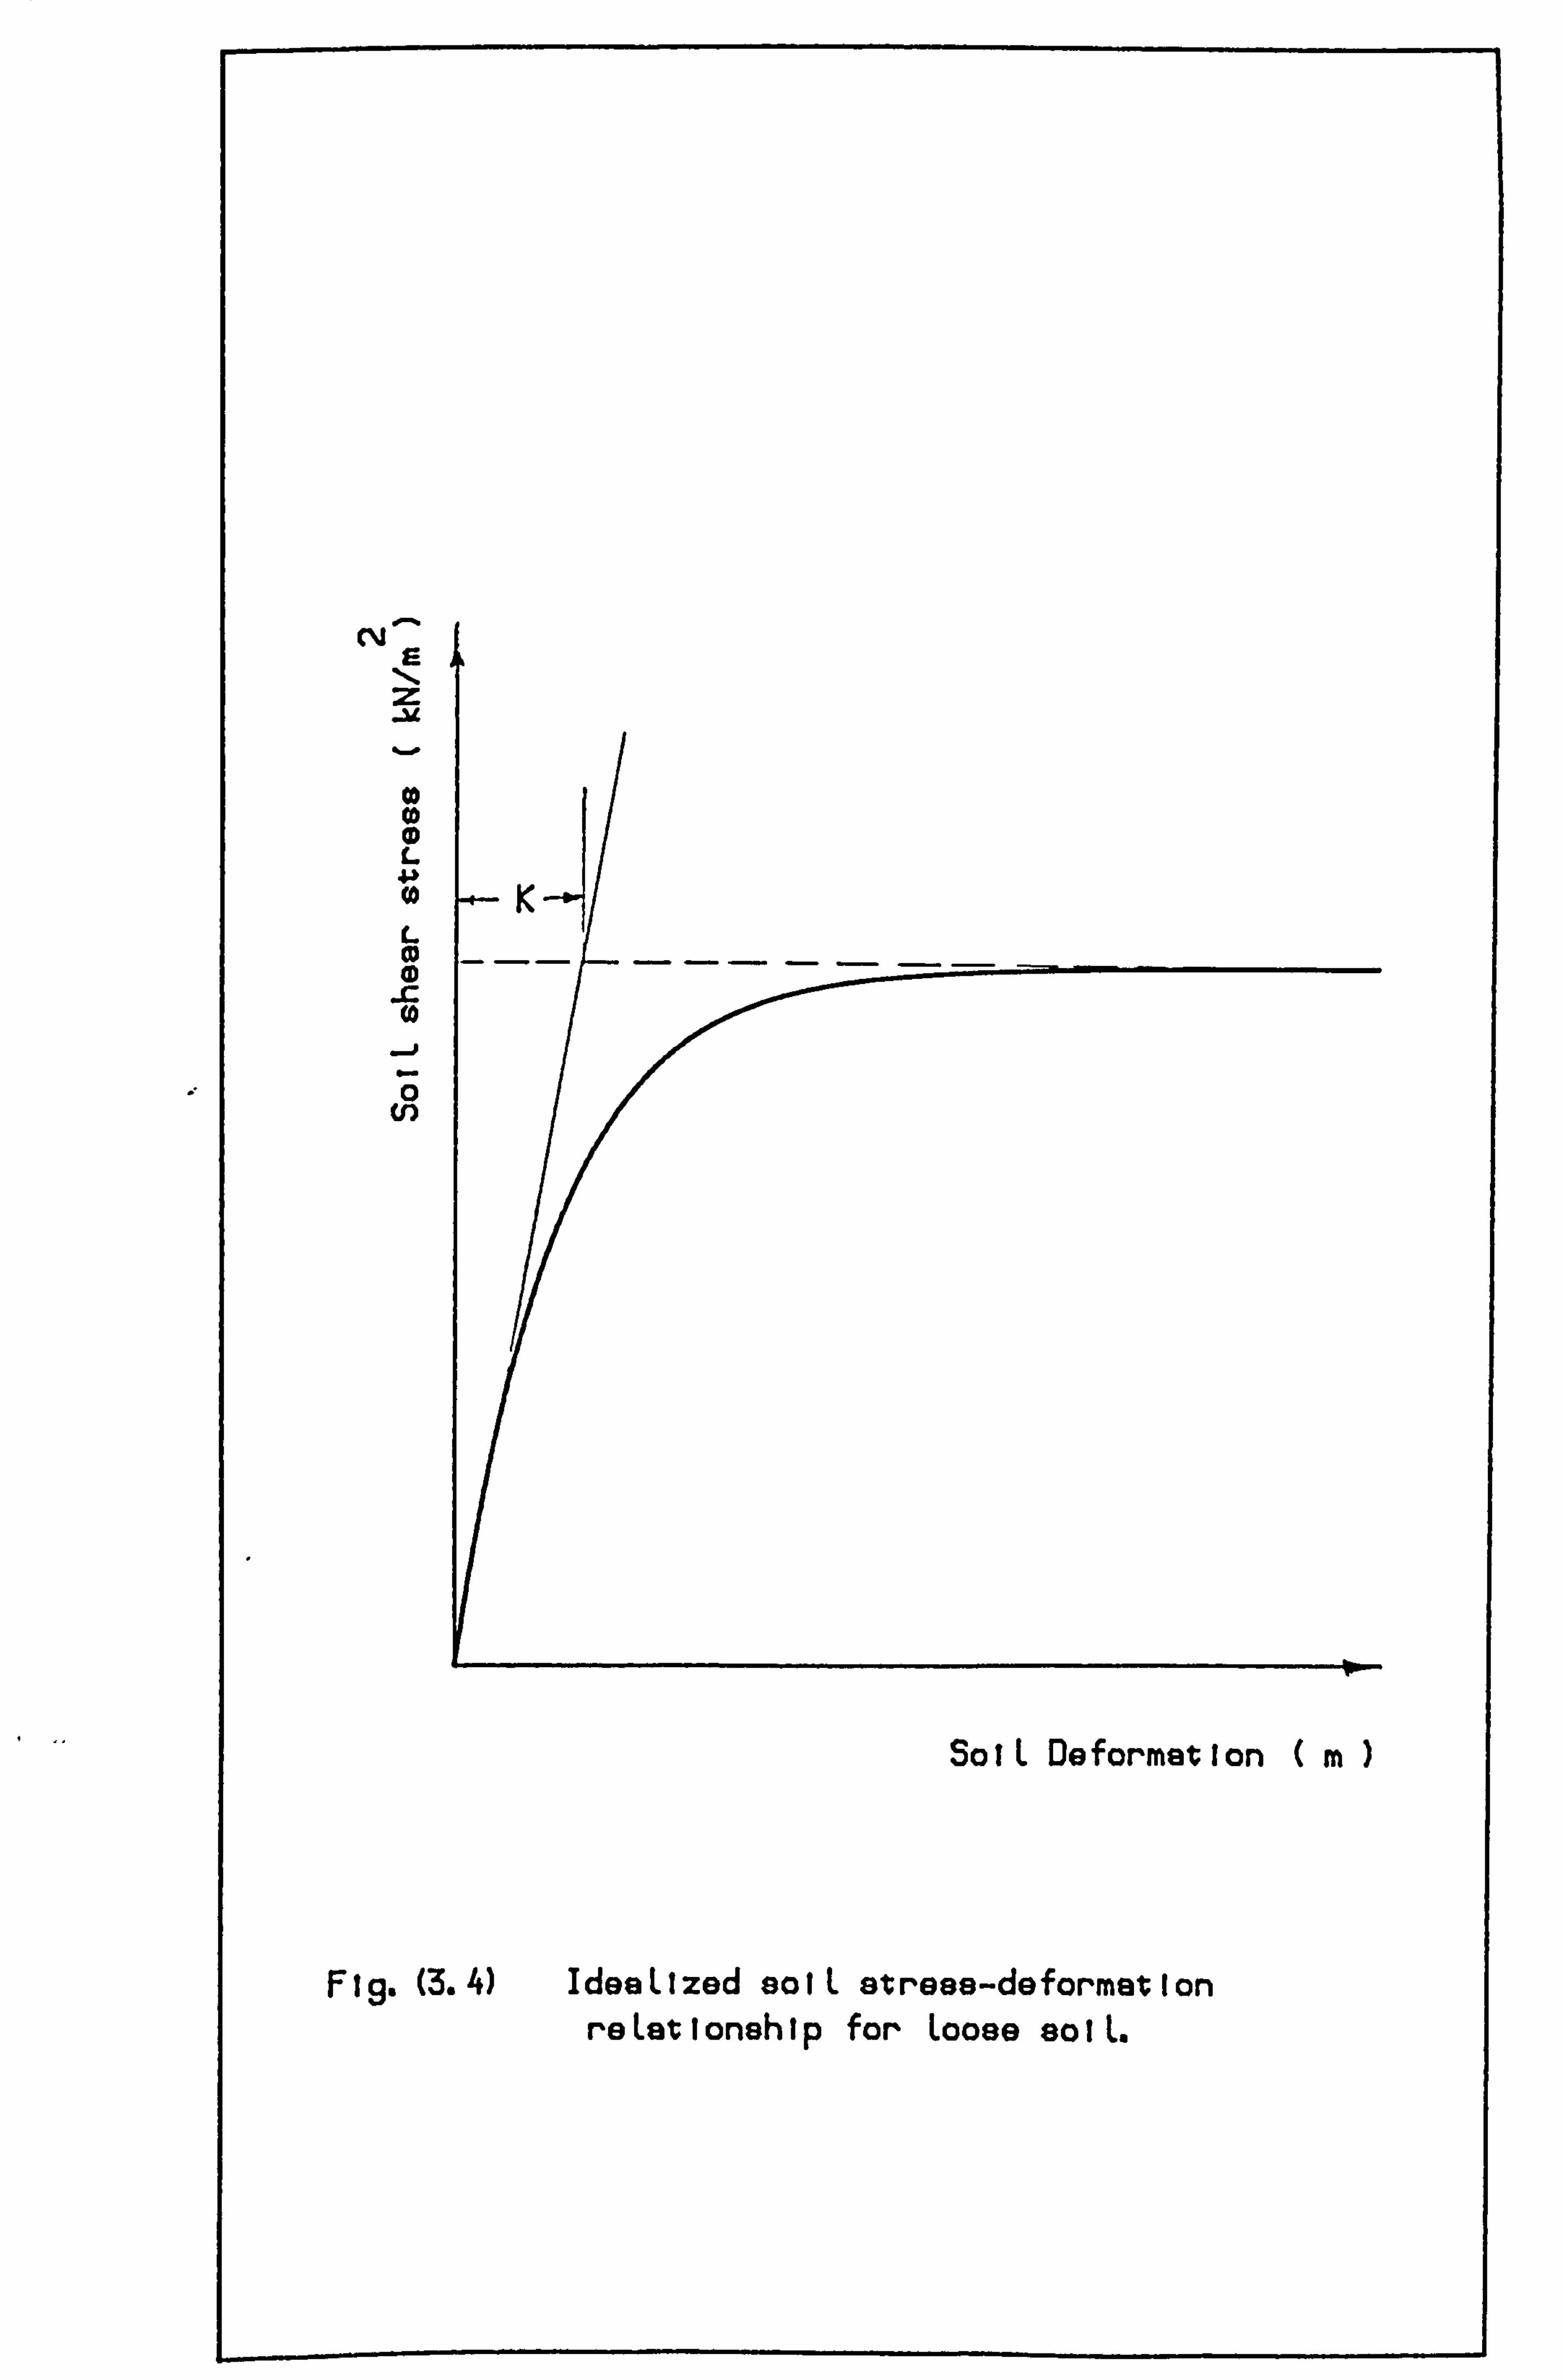
C--j
z
L
K-1 L CD --- -- -- -- -- CD
.C (0
cn
vp
SoIL Deformation (m
Fig. (3.4) IdeaLized solL strese-deformation re Let I onsh Ipf or Looee so I L.
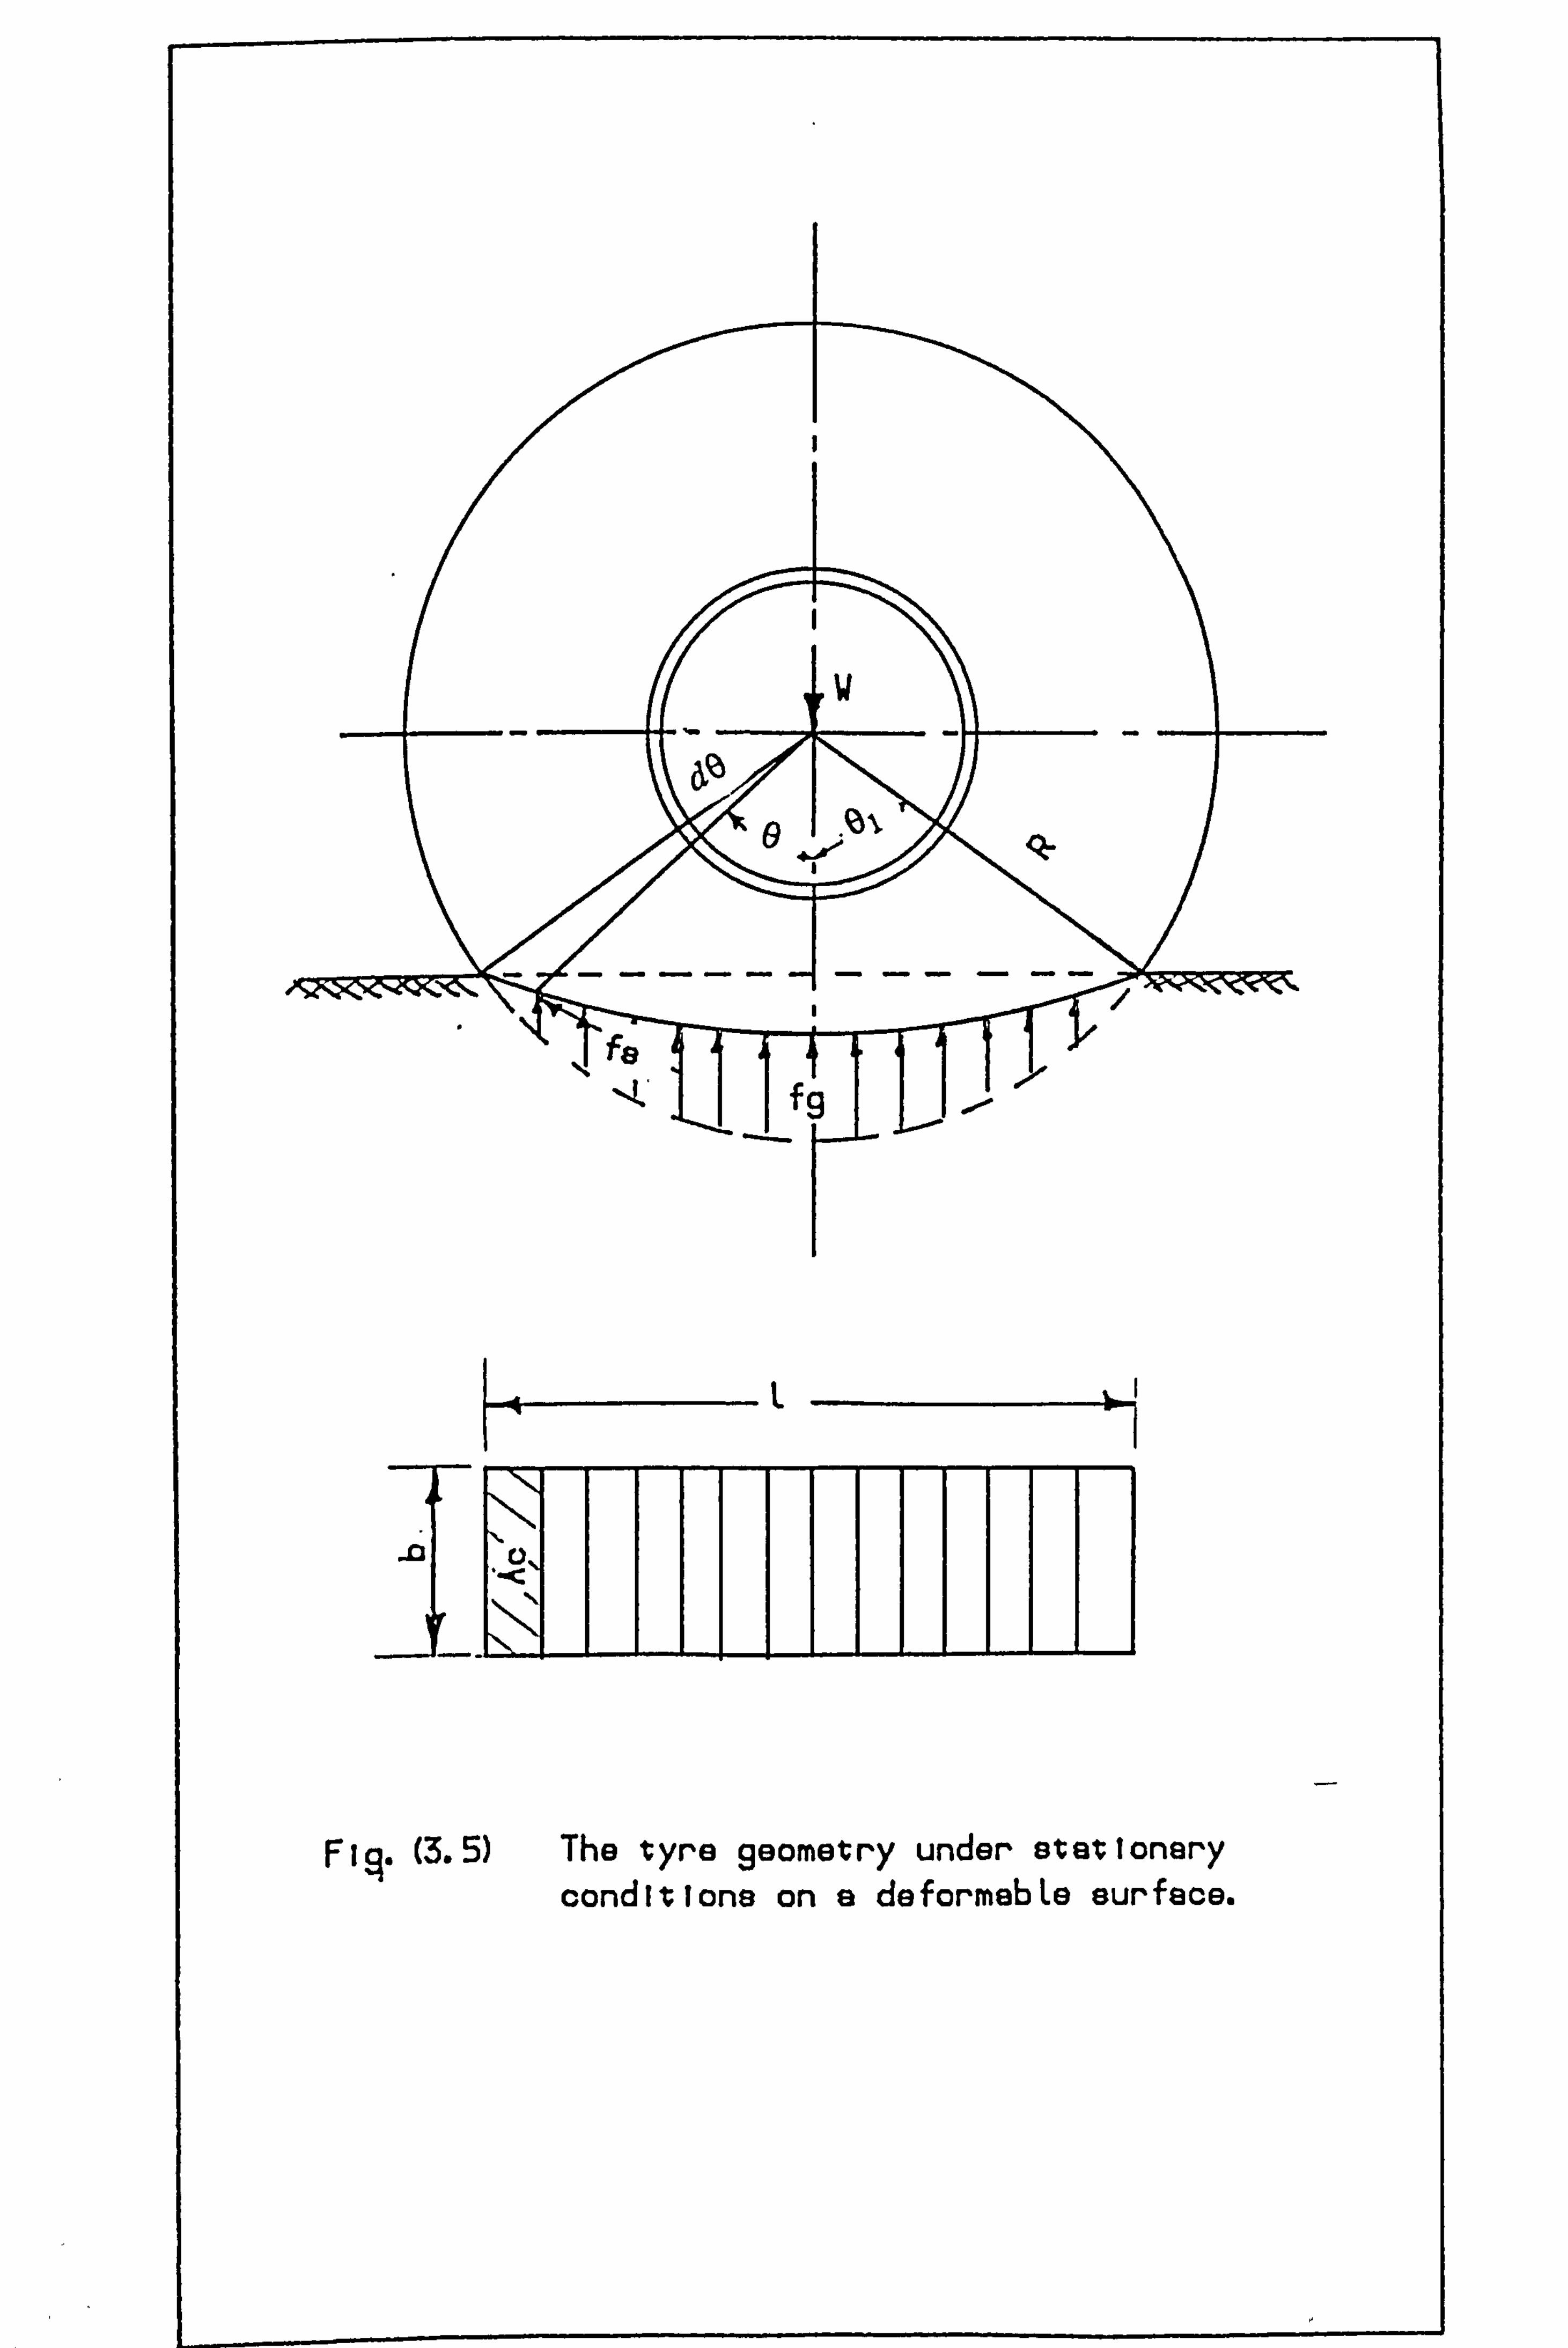
.0 . 0,
Fig-(3.5) The tyre geometry under stationary conditions an a deformebLe surface.
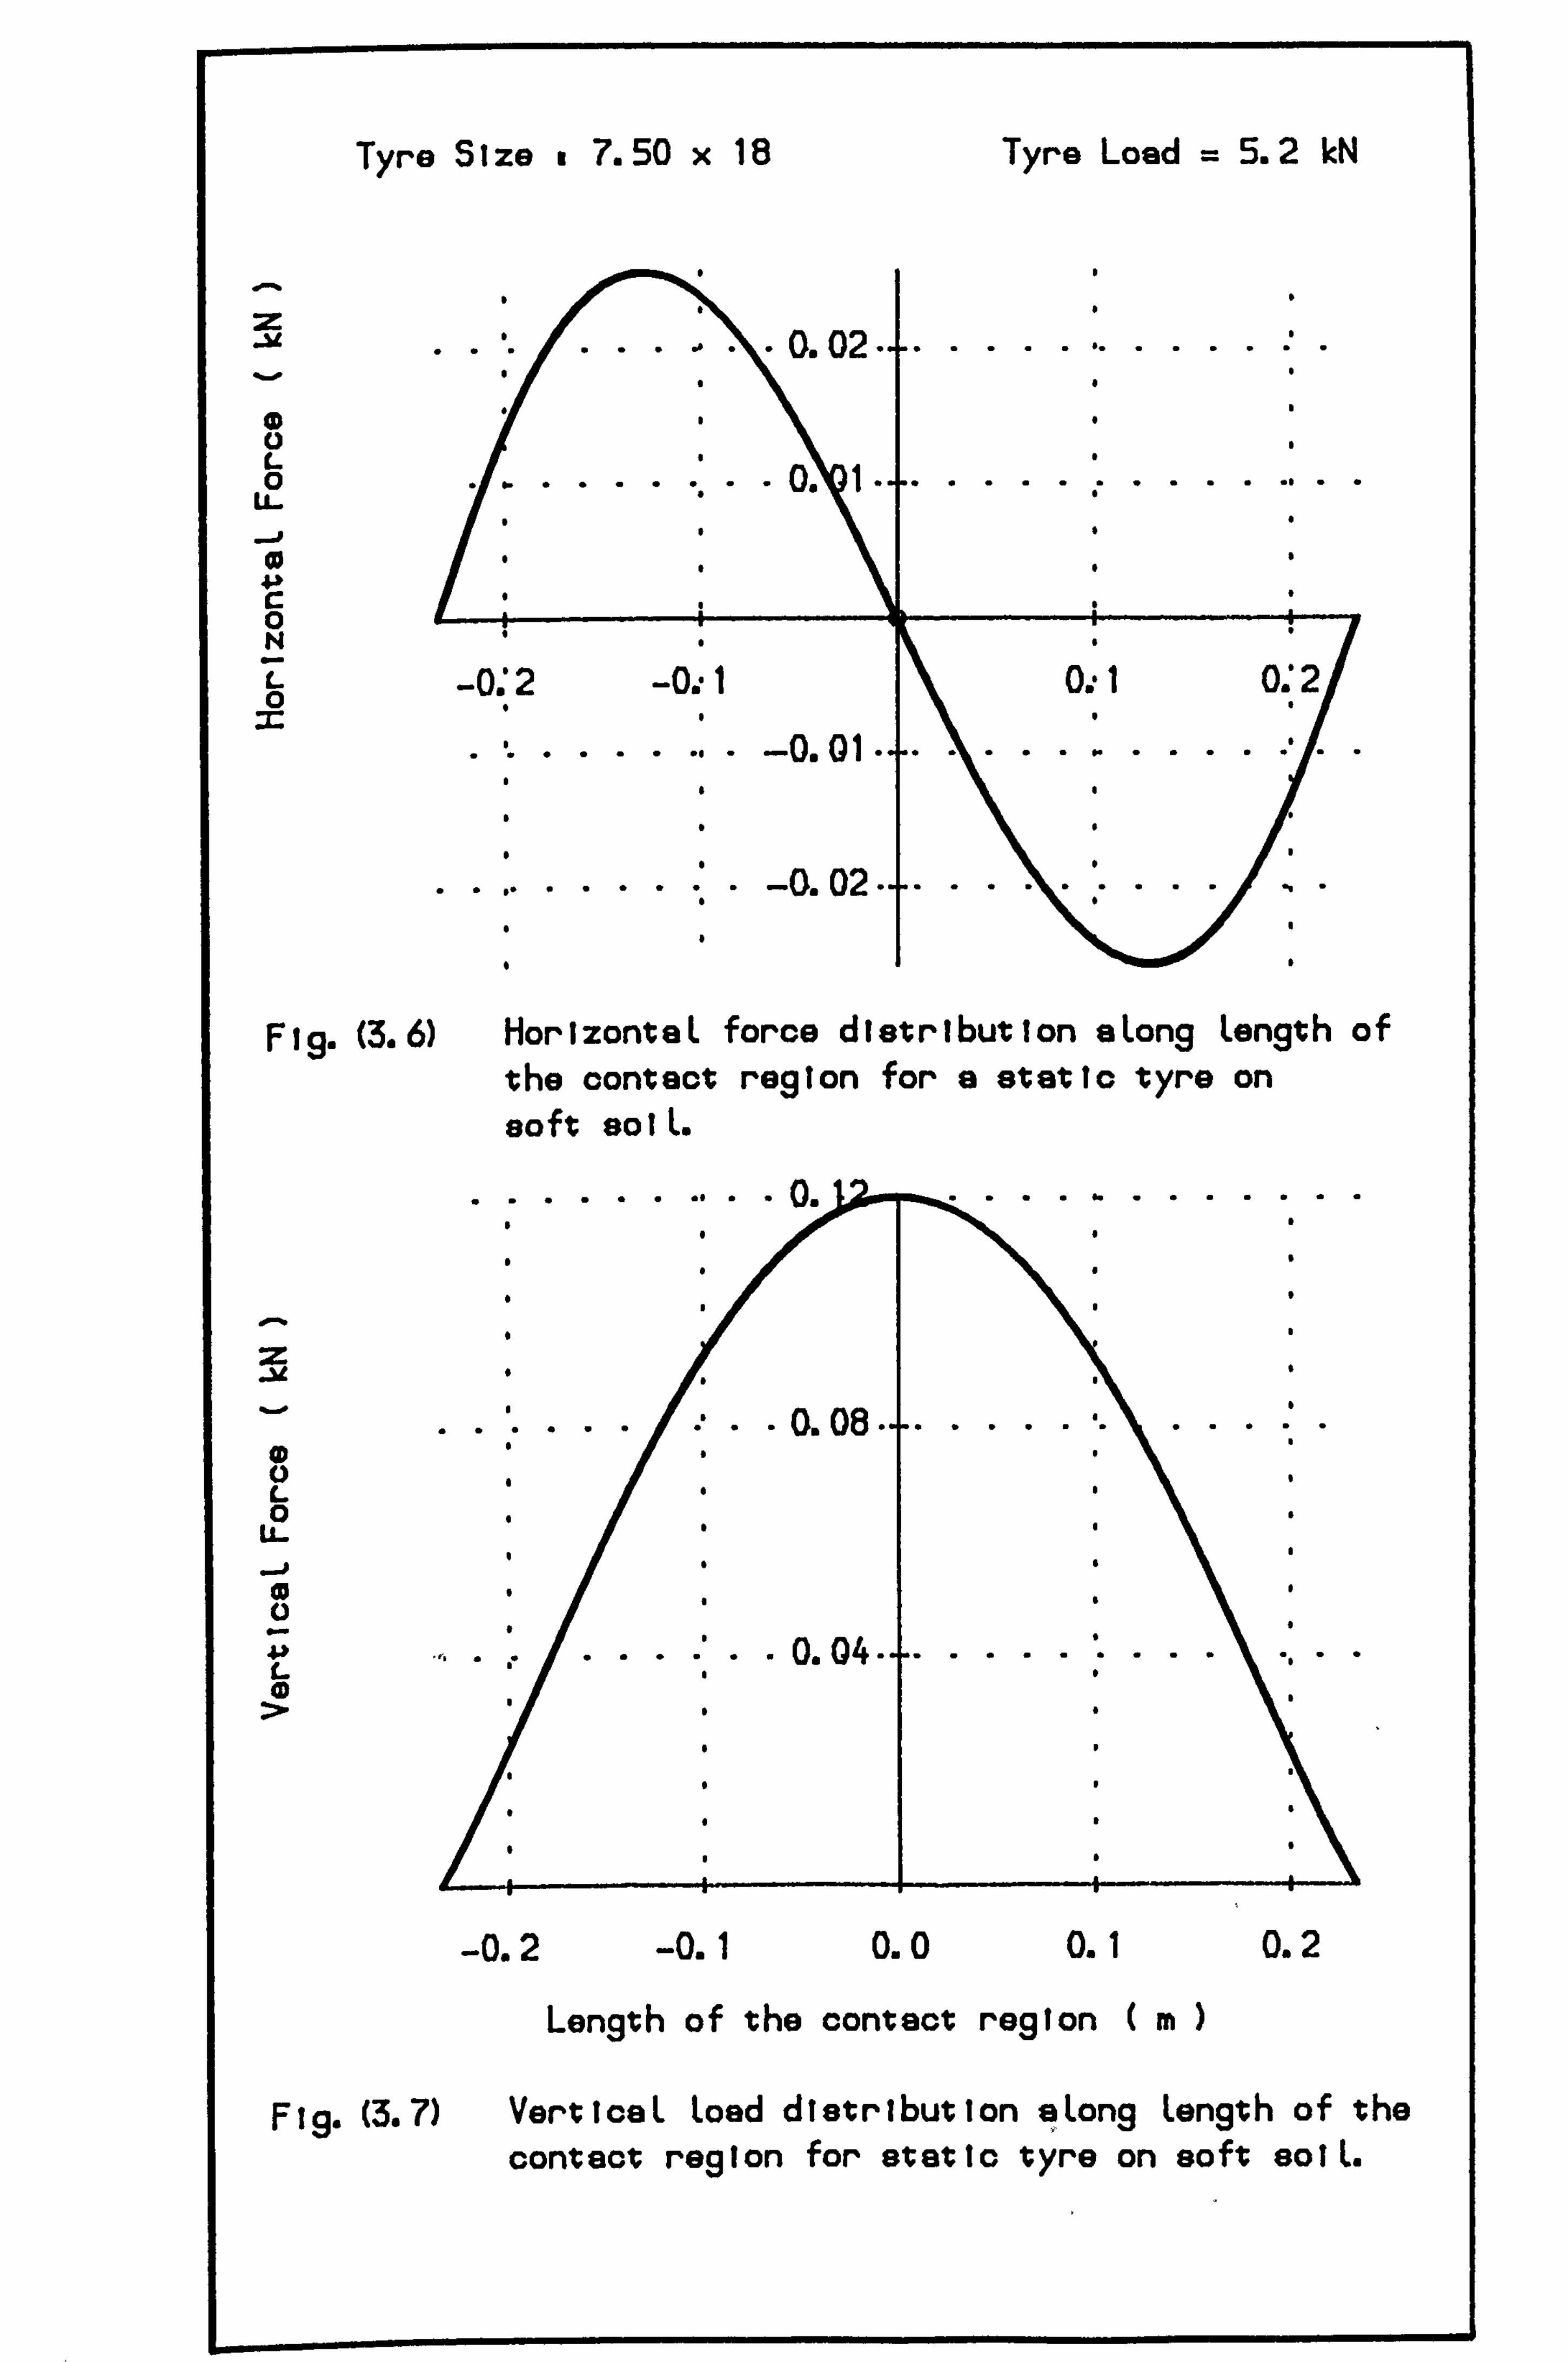
Tyre Size o 7.50 x 18
0 C- 0
LL
-I 0 4) 0 N
C. - 0
Tyre Load = 5.2 M
......... 00.02 - \. 02 -
0.1.. ......... ol I.... .... *II**,:. .
, j10..
2
.......... .
-0. '2 -0. -1 0. -1 0.2
........ -0.02.
Fig. (3.6) HorizontaL force distribution eLong Length of the contact region for a static tyro on soft so I L.
cß 0
Length of the contact region (m)
Fl! g. (3.7) VerticaL Load distribution aLong Length of the contact region for static tyre on soft solL.
-0.2 -0.1 0.0 0.1 0.2
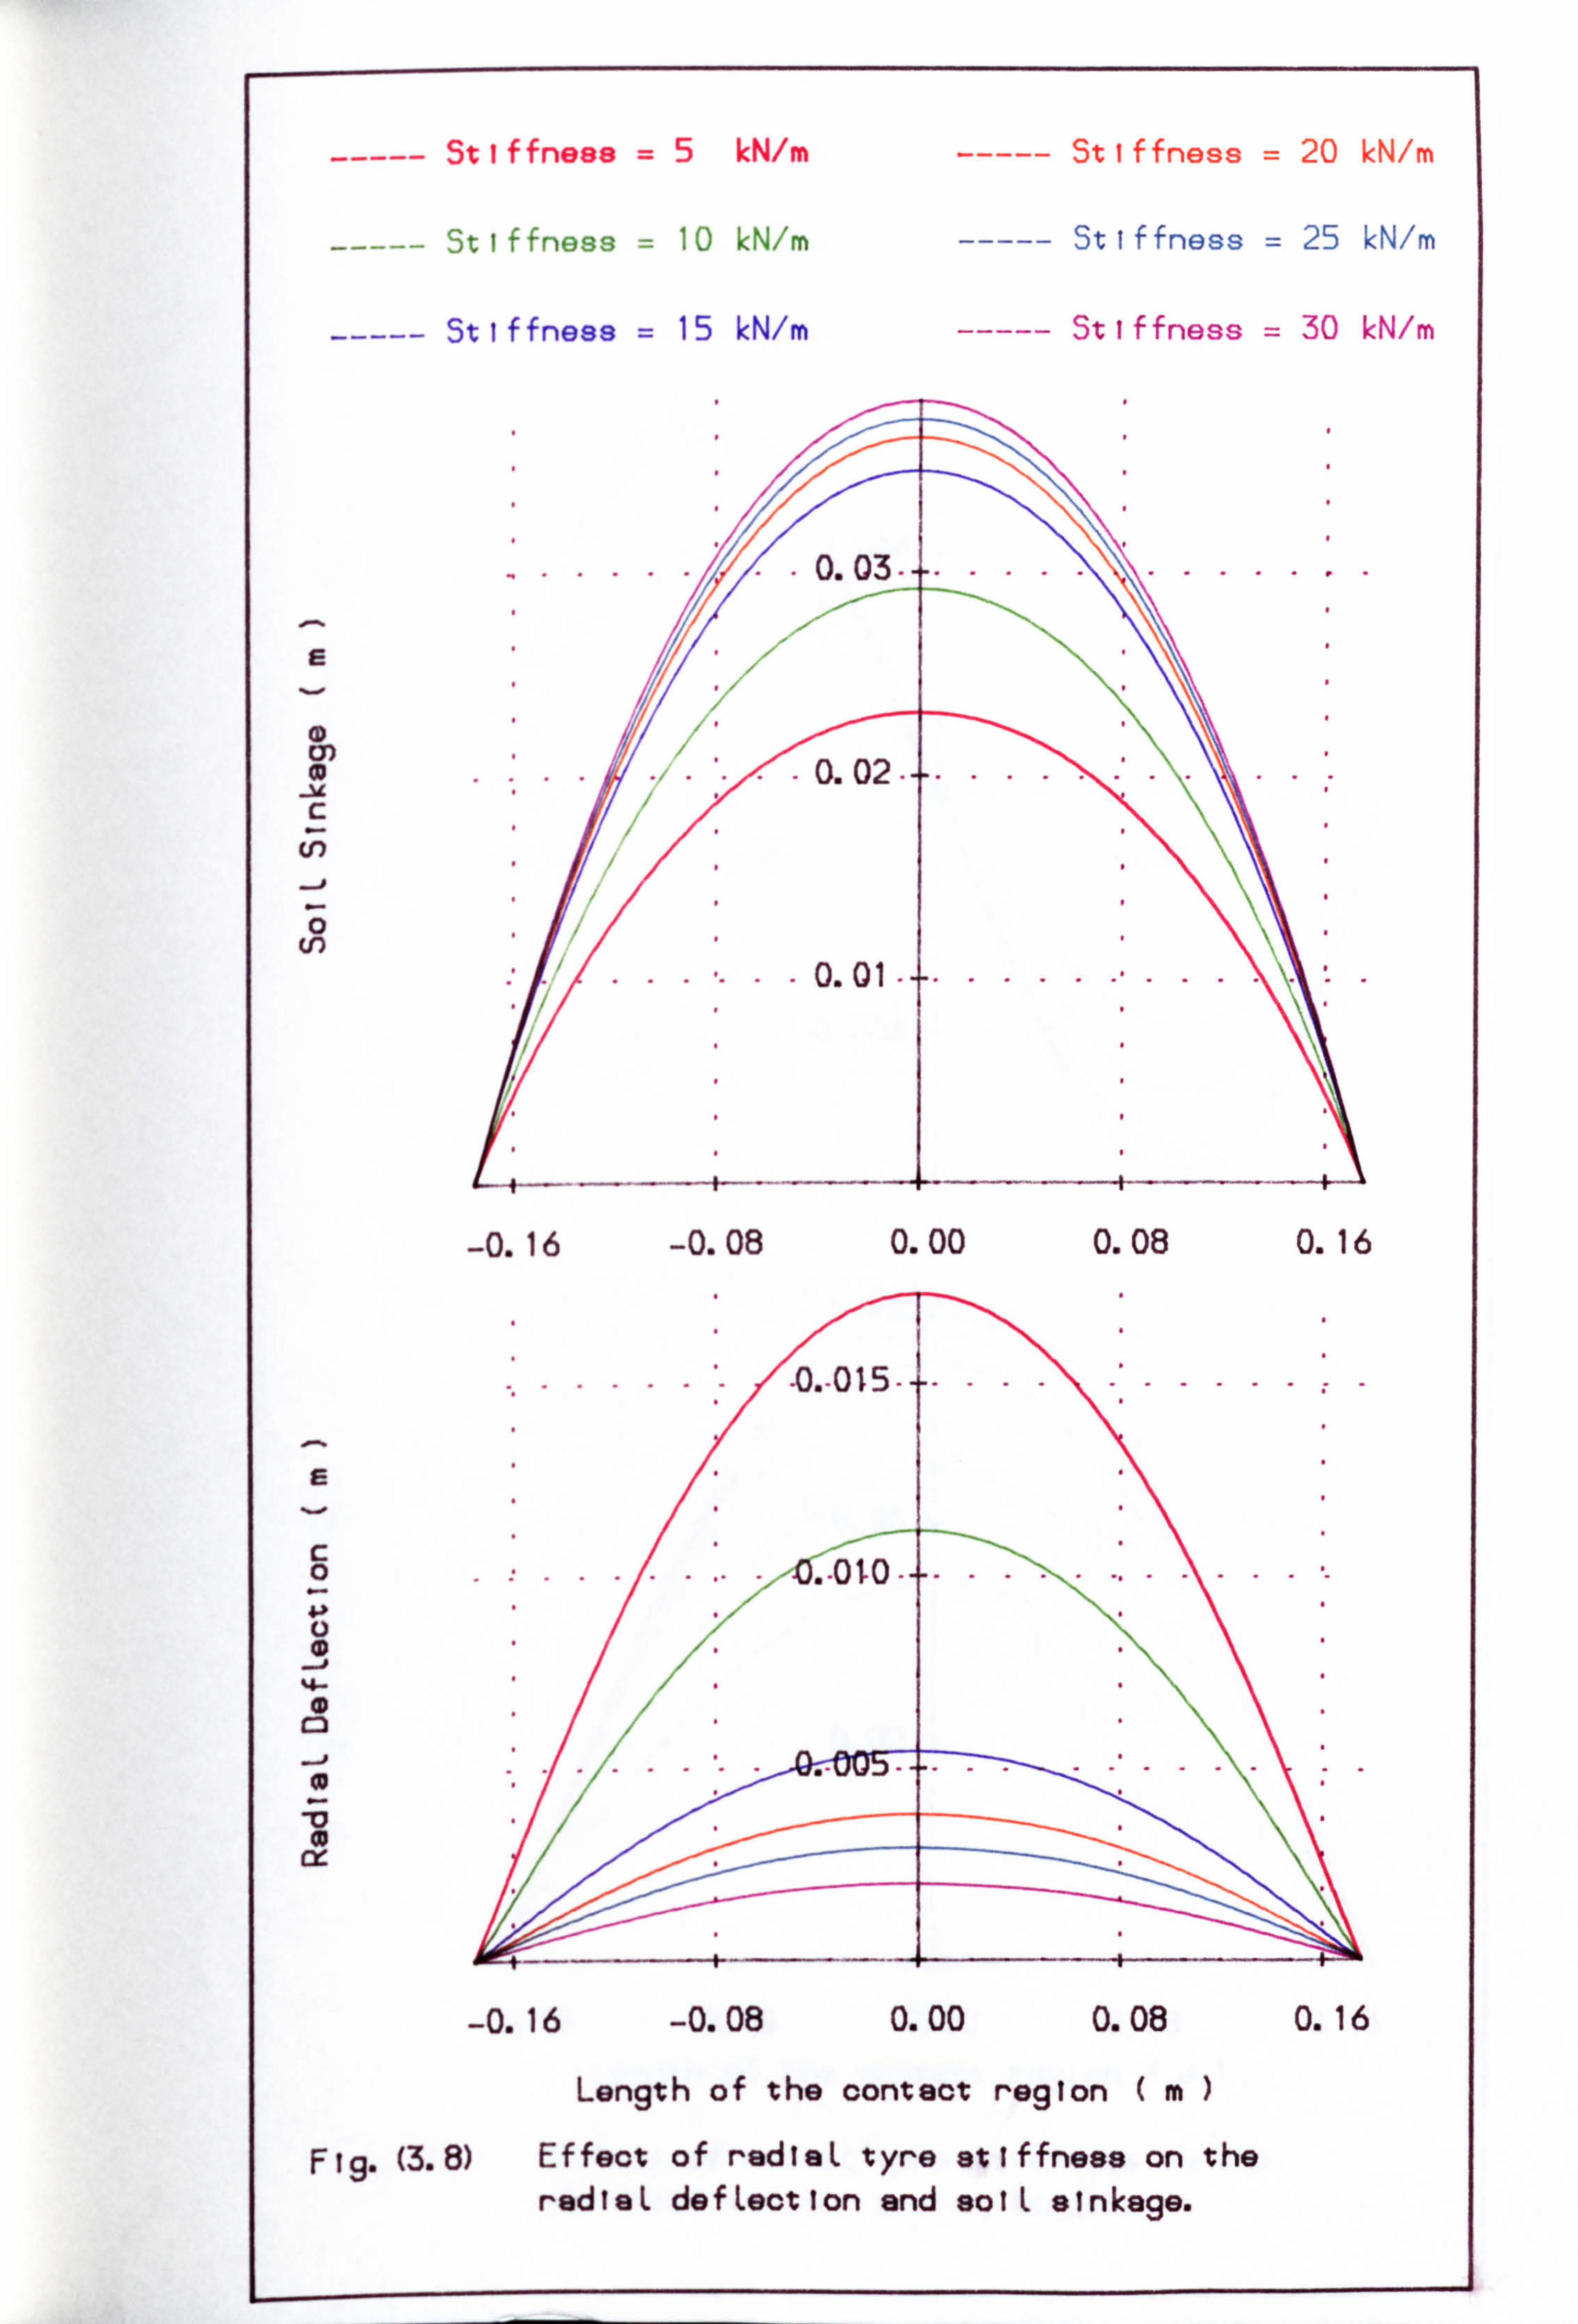
----- Stiffness =5 kN/m ----- Stiffness = 20 kN/m
----- Stiffness = 10 kN/m ----- Stiffness = 25 kN/m
----- Stiffness = 15 kN/m ----- Stiffness = 30 kN/m
I....... 0.03 - --- ----.......
E
0.02 - C
U)
........ 0.01 .... ...... .......
/o
A
-0.16 -0.08 0.00 0.08 0.16
-0,015 -
E
C 0 O-, -O--t 0
M
0
-0.16 -0.08 0.00 0.08 0.16
Length of the contact region (m
Fig. (3.8) Effect of rediaL tyro stiffness on the rediaL defLection and solL sinkage.
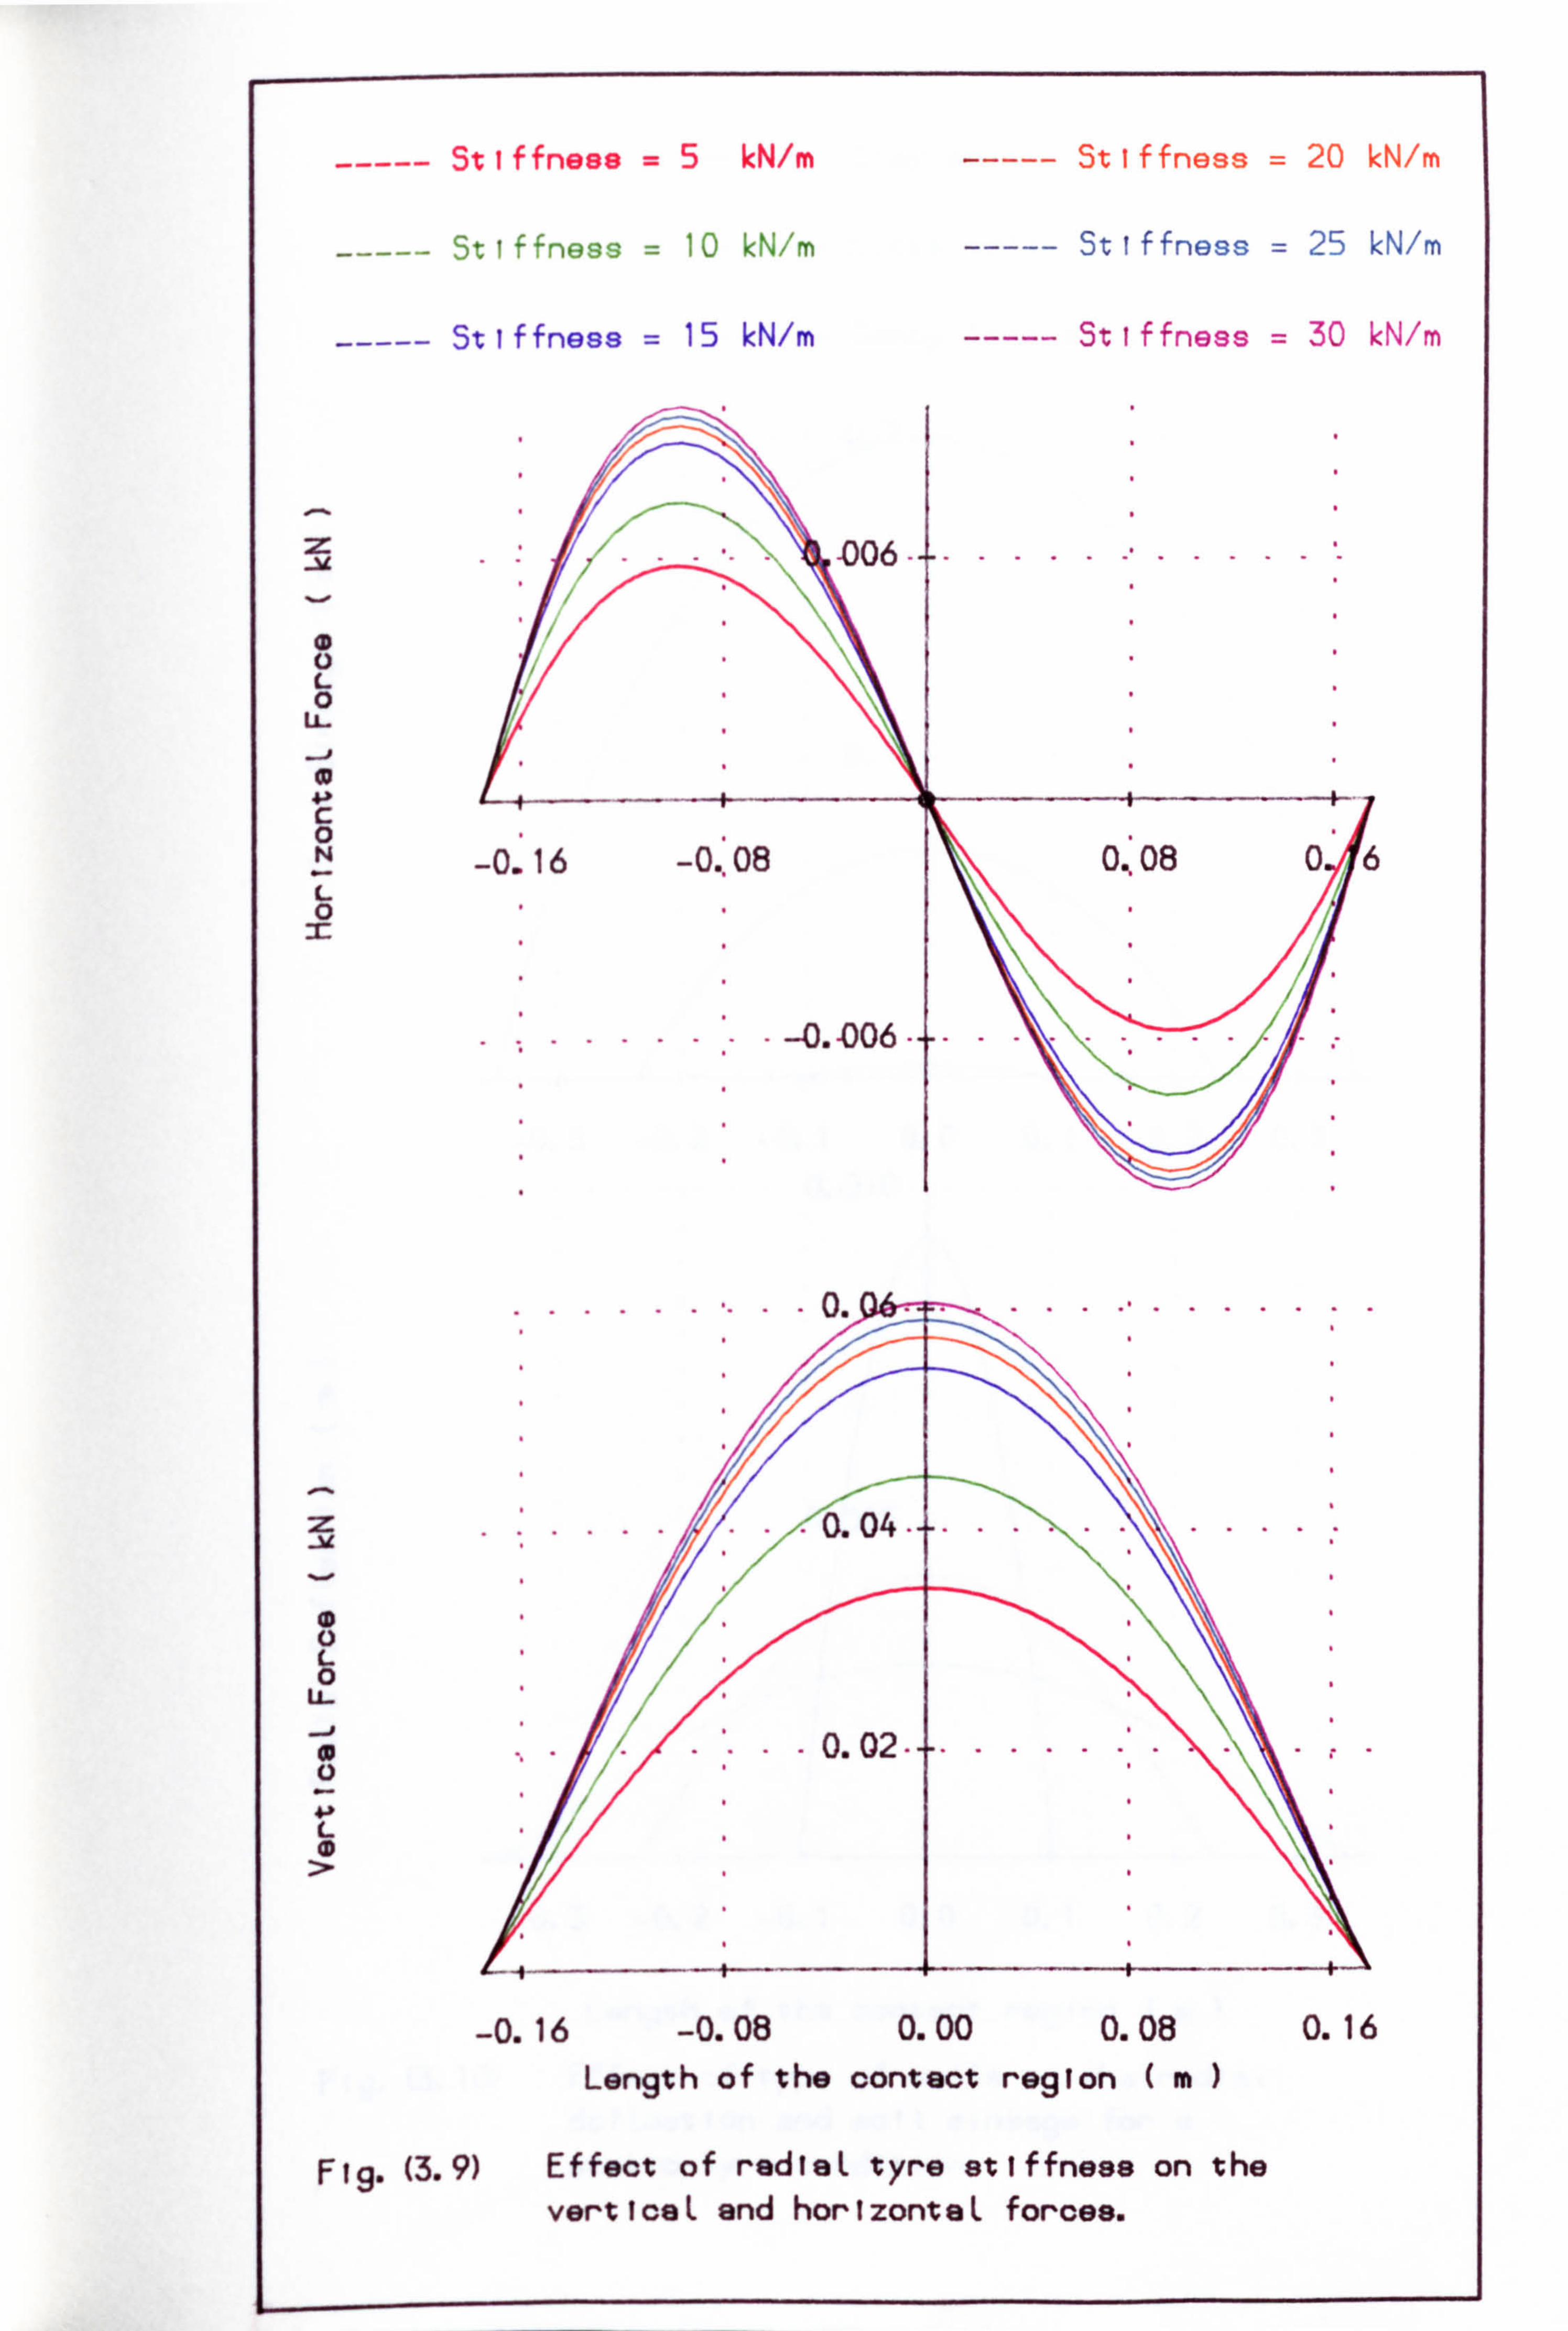
---
---
L 0
4-l'
-- Stiffness =5 kN/m
St If ý'ness = 10 kN/'rn -
-- St I ffness = 15 kN/M -
-006
Stiffness = 20
---- St I ffness = 25
---- St I ffness = 30
kN/m
kN/m
kN/m
C 0 N
-0.16 -0.. 08 0,08 0 6
0
......... -0. ý006 .... . ..........
........ .. 0... ..... ...... .
z
.-A. 04 ... .........
L 0
U-
0.02 .... . .... 2 . L
-0.16 -0.08 0.00 0.08 0.1 6 Length of the contect region (m
Fig. (3.9) Effect of rediaL tyre stiffness on the verticaL and horizontaL forces.
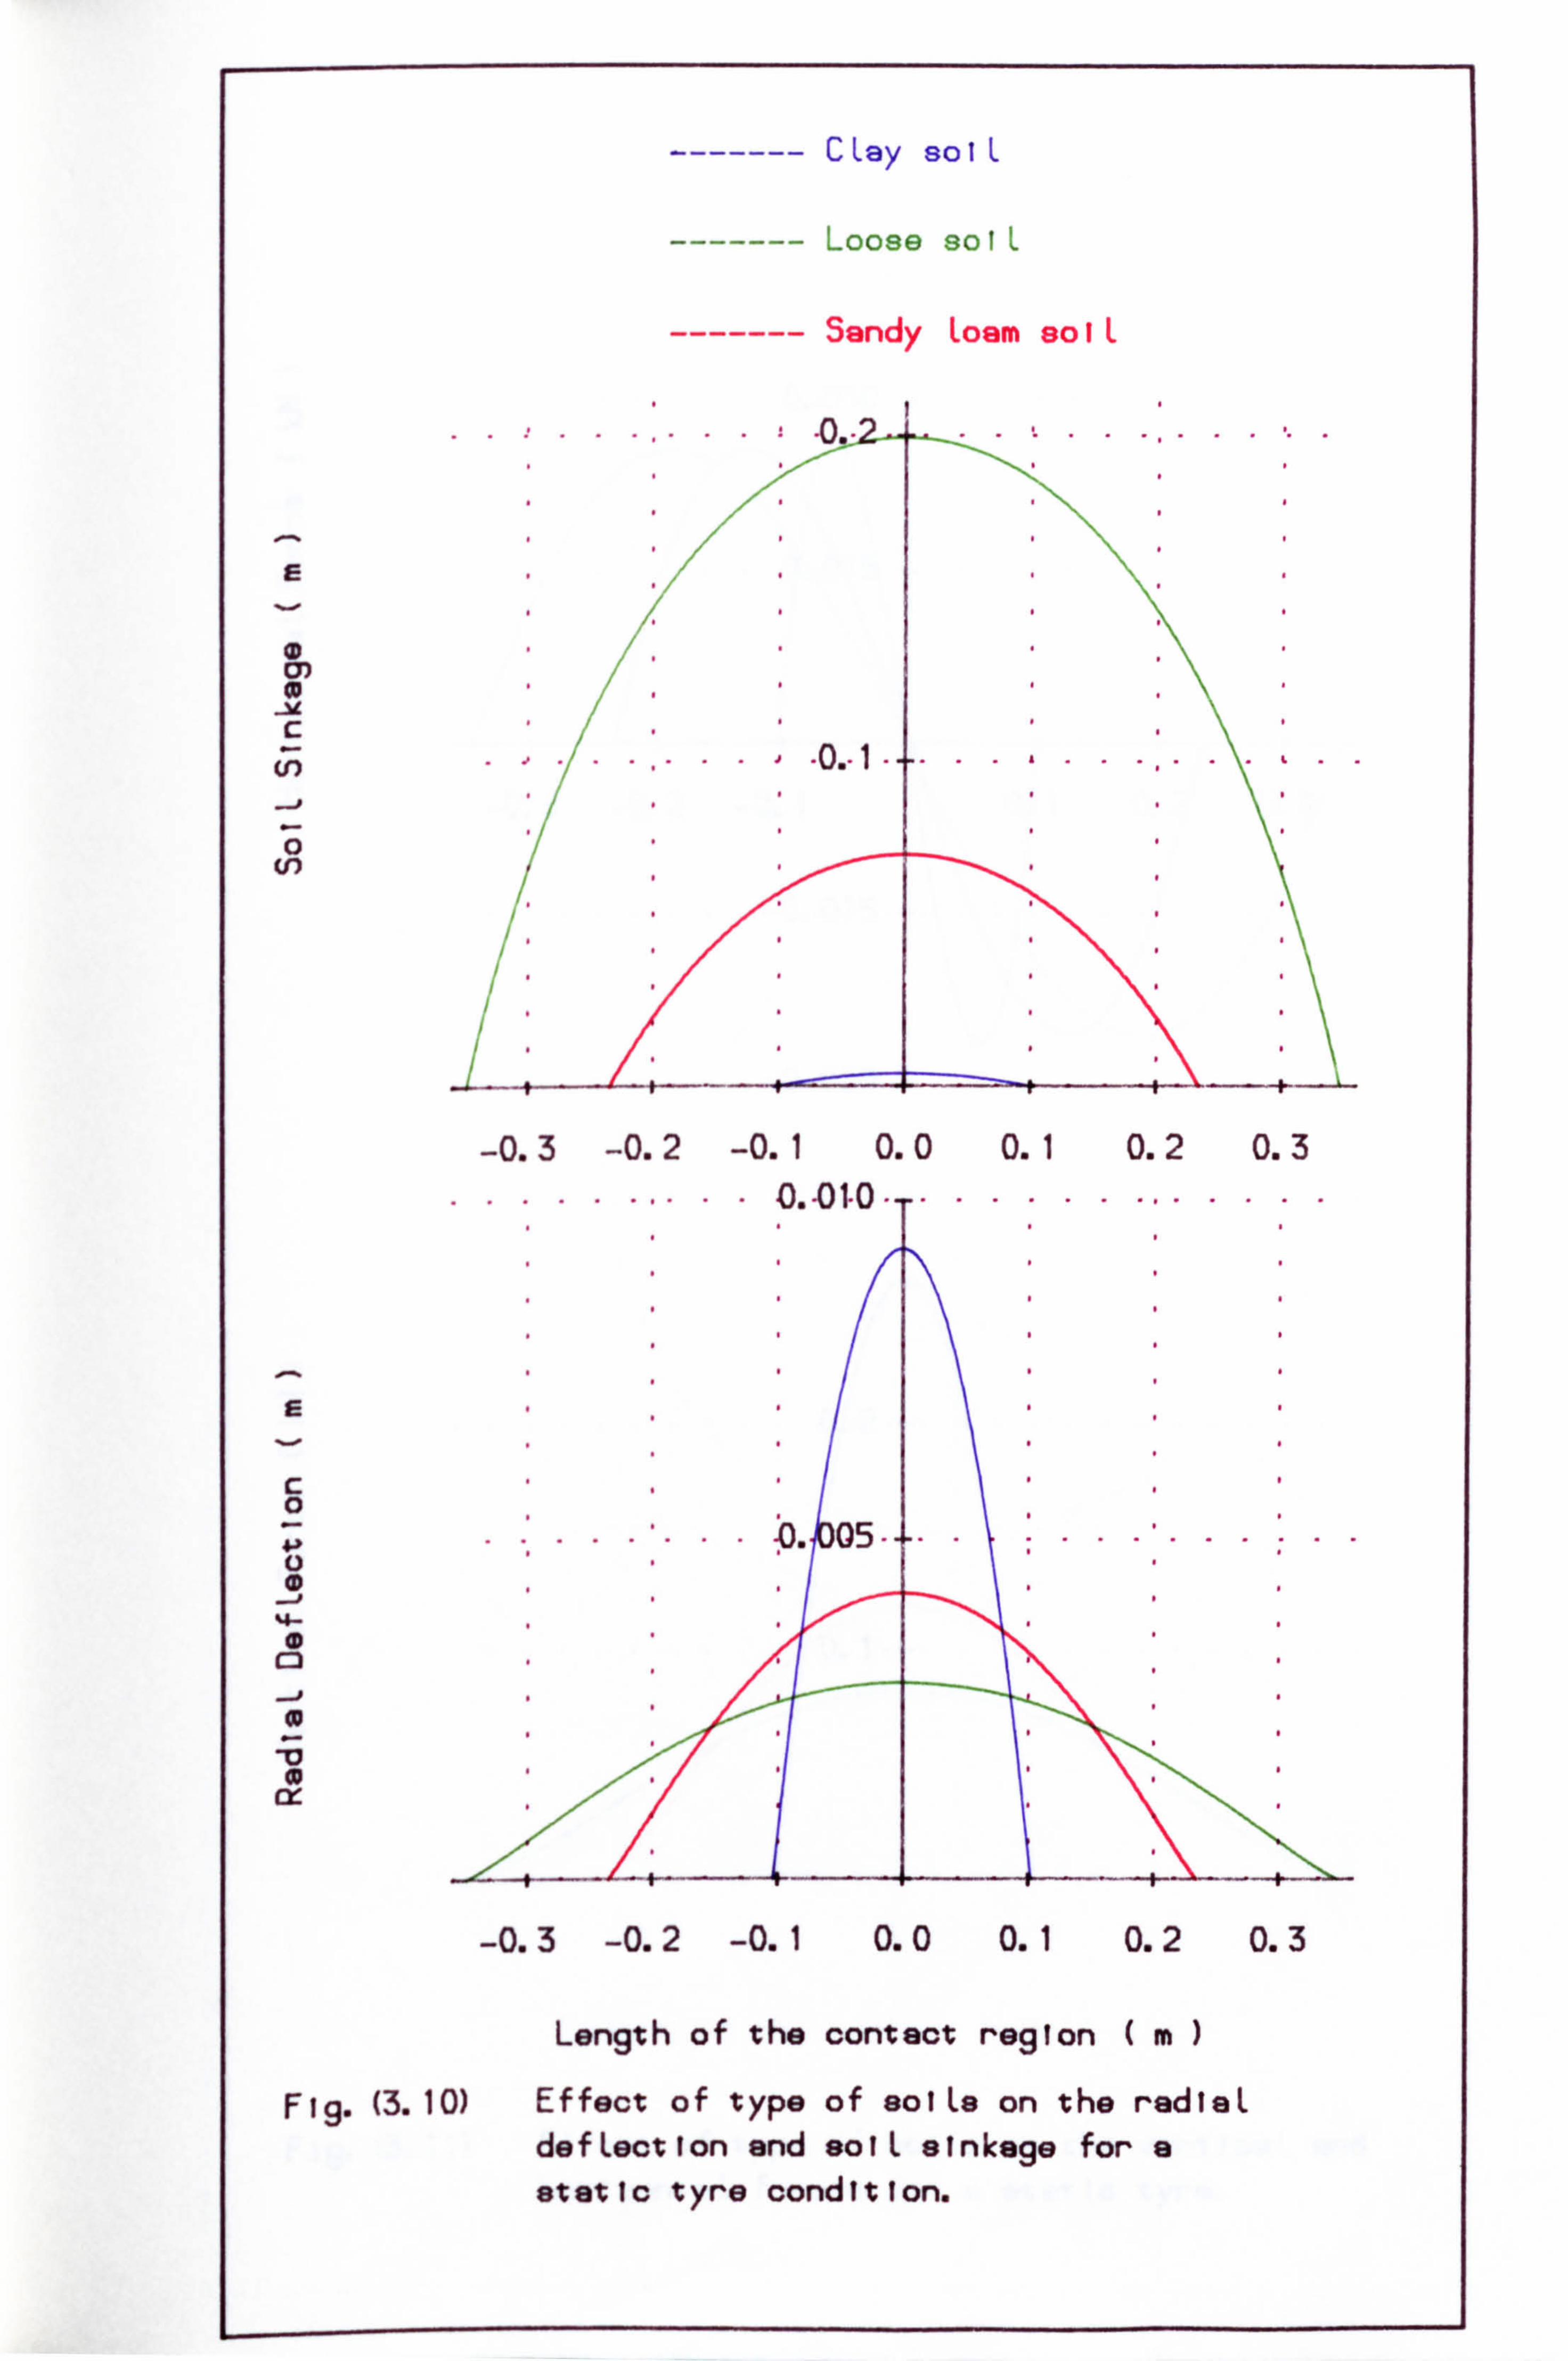
------- CLay solL
------- Loose solL
------- Sandy Loam solL
........ ..
M
C n. 1 ... ........ ..... cn .I '/ ,, '' * . 0.
z
cn
-0.3 -0.2 -0.1 0.0 0.1 0.2 0.3
........ .. 0,01-0 .... ........ ....
C 0
0.05----
C3
-0.3 -0.2 -0.1 0.0 0.1 0.2 0.3
Length of the contact region (m)
Fig. (3.10) Effect of type of solLe on the redleL defLection and solL sinkage for a static tyro condition.
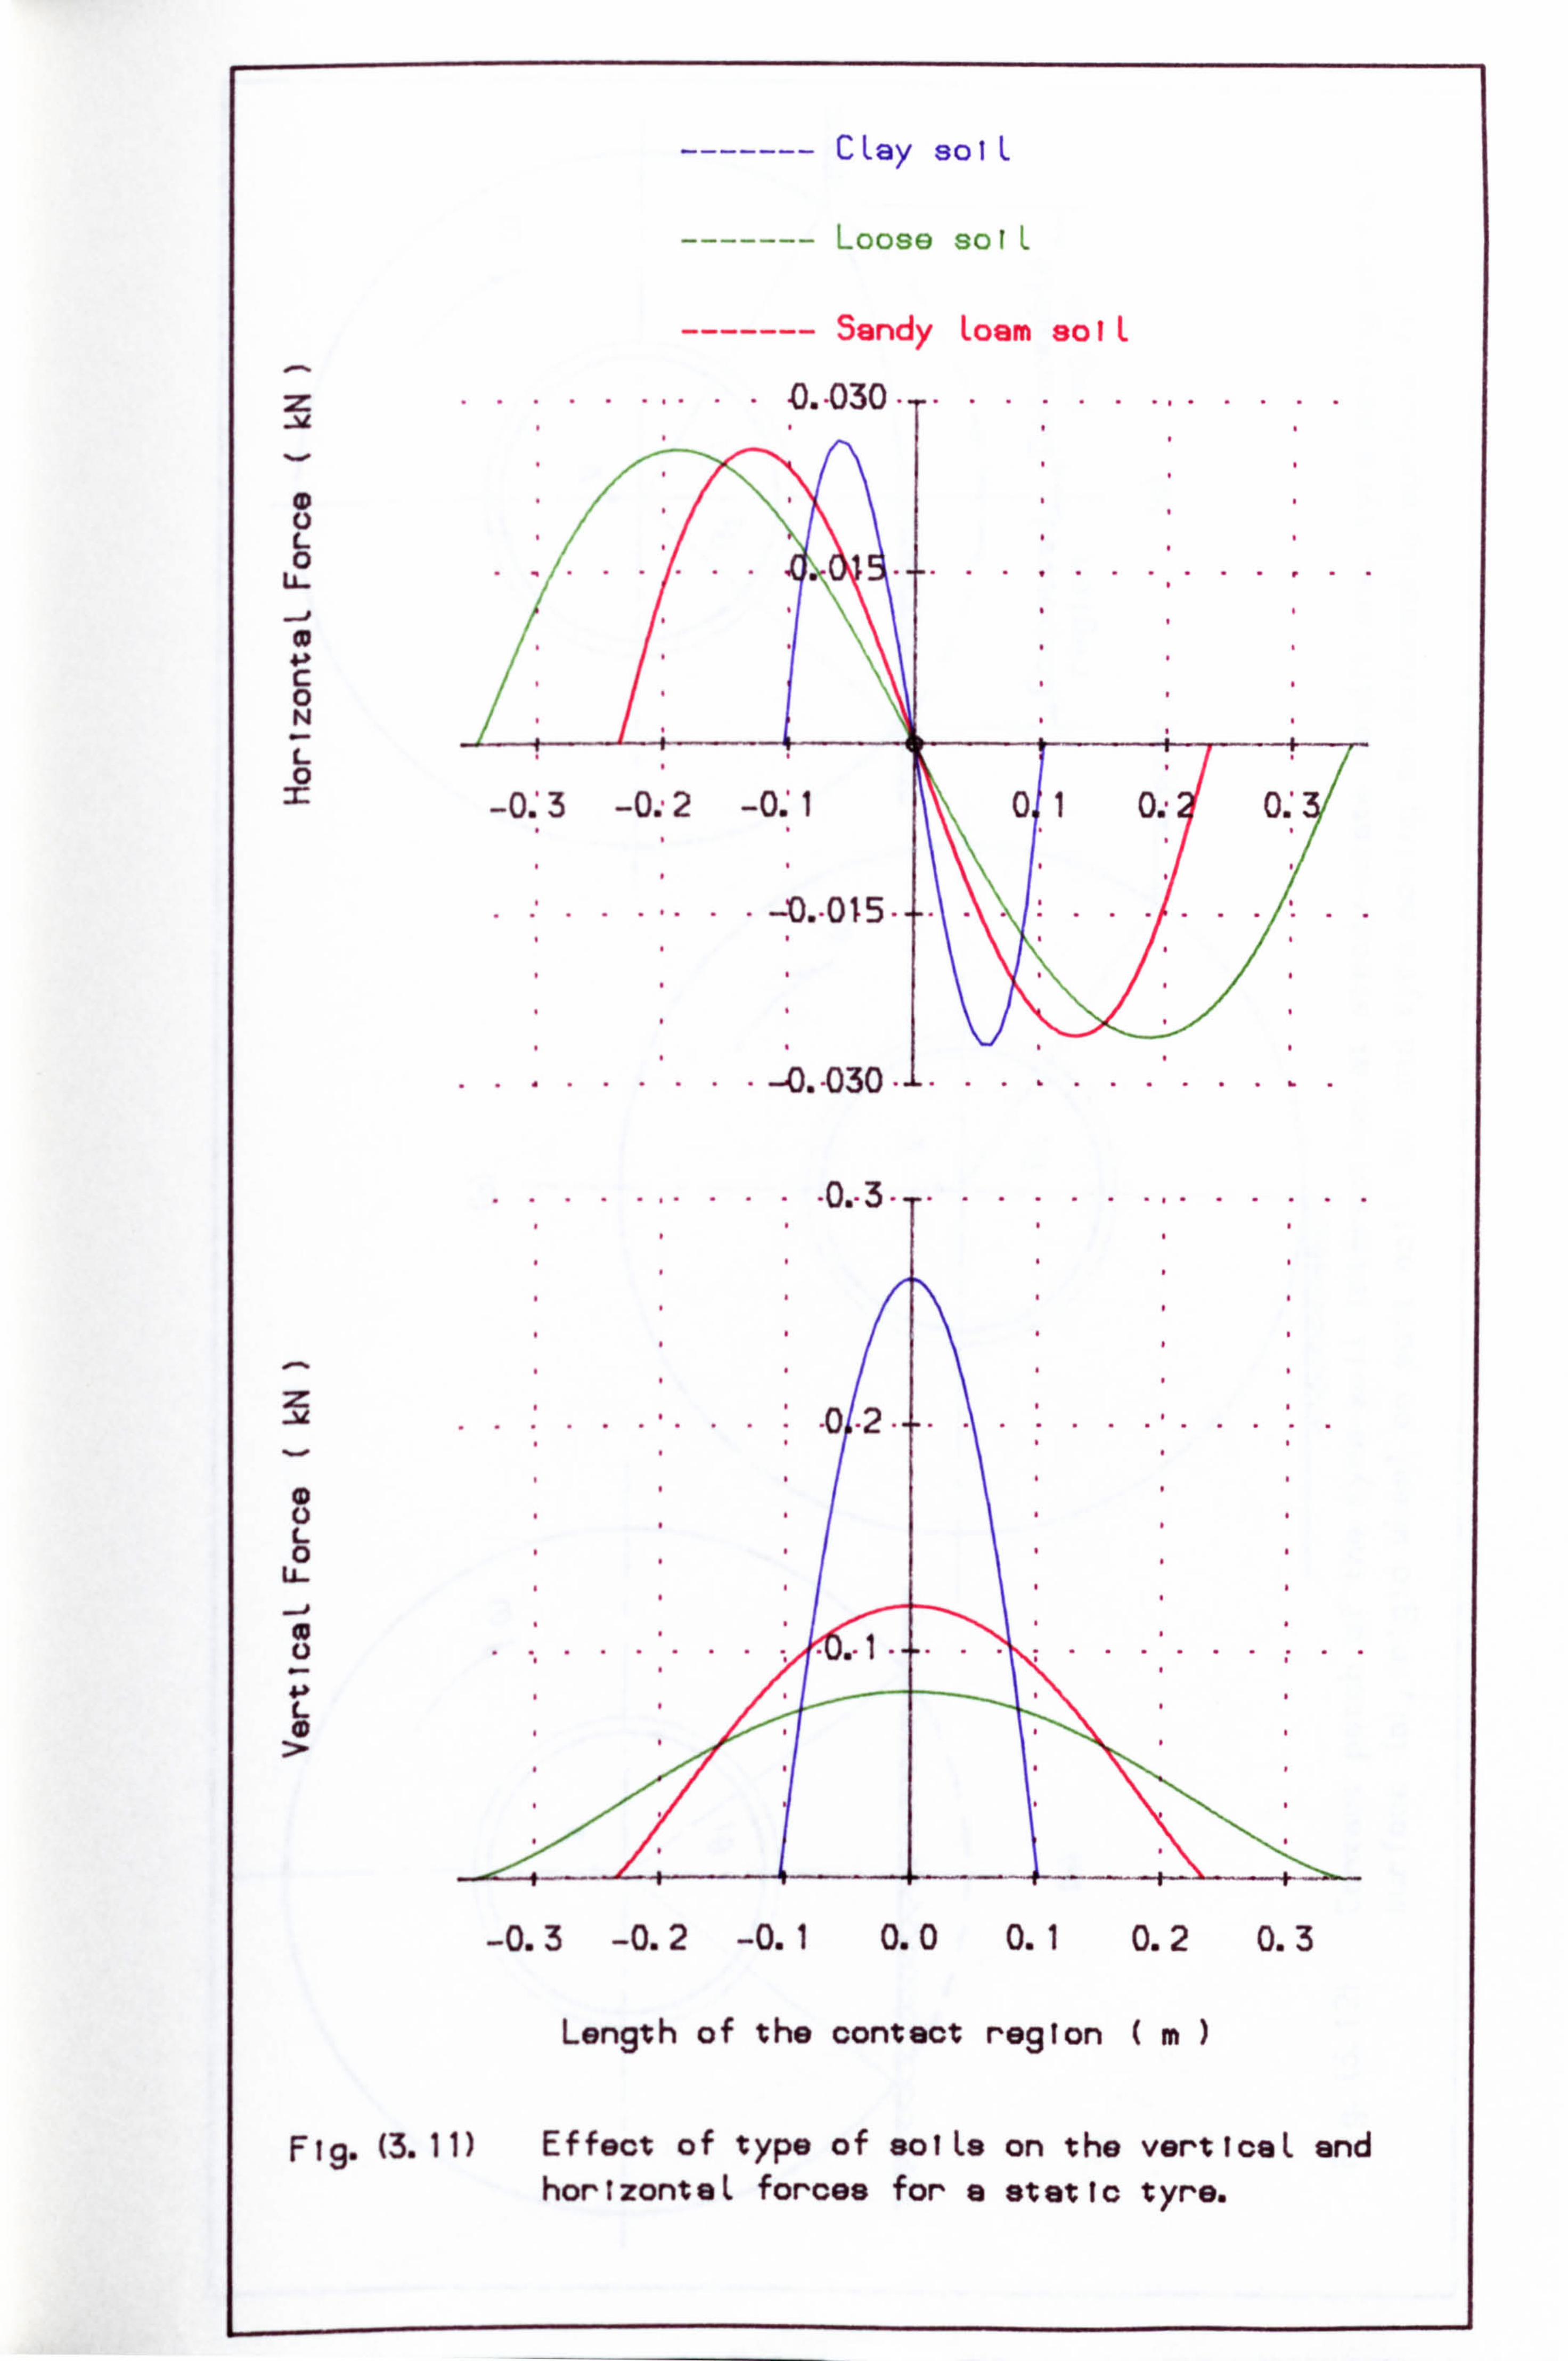
L 0 U-
C 0 N
---
---
---
........ .
.....
---- CLay solL
---- Loose sot'.
---- Sandy Loam soiL
. 0,030 ... .....
...
... ....
... ..
0 M
-0.3 -0ý 2 -0.1 01 0. - 0., 0. 0. 0" 0,
, . 4,015 ......... ........
........ . -4D. -030 -1 ...... ....
.. ... 0. -3 ........ ........
z
L 0 U-
. ....... ...... ......... . .... * L
-0.3 -0.2 -0.1 0.0 0.1 0.2 0.3
Length of the contact region (m)
Fig. (3.11) Effect of type of solLs on the verticaL and horizontaL forces for a static tyre.
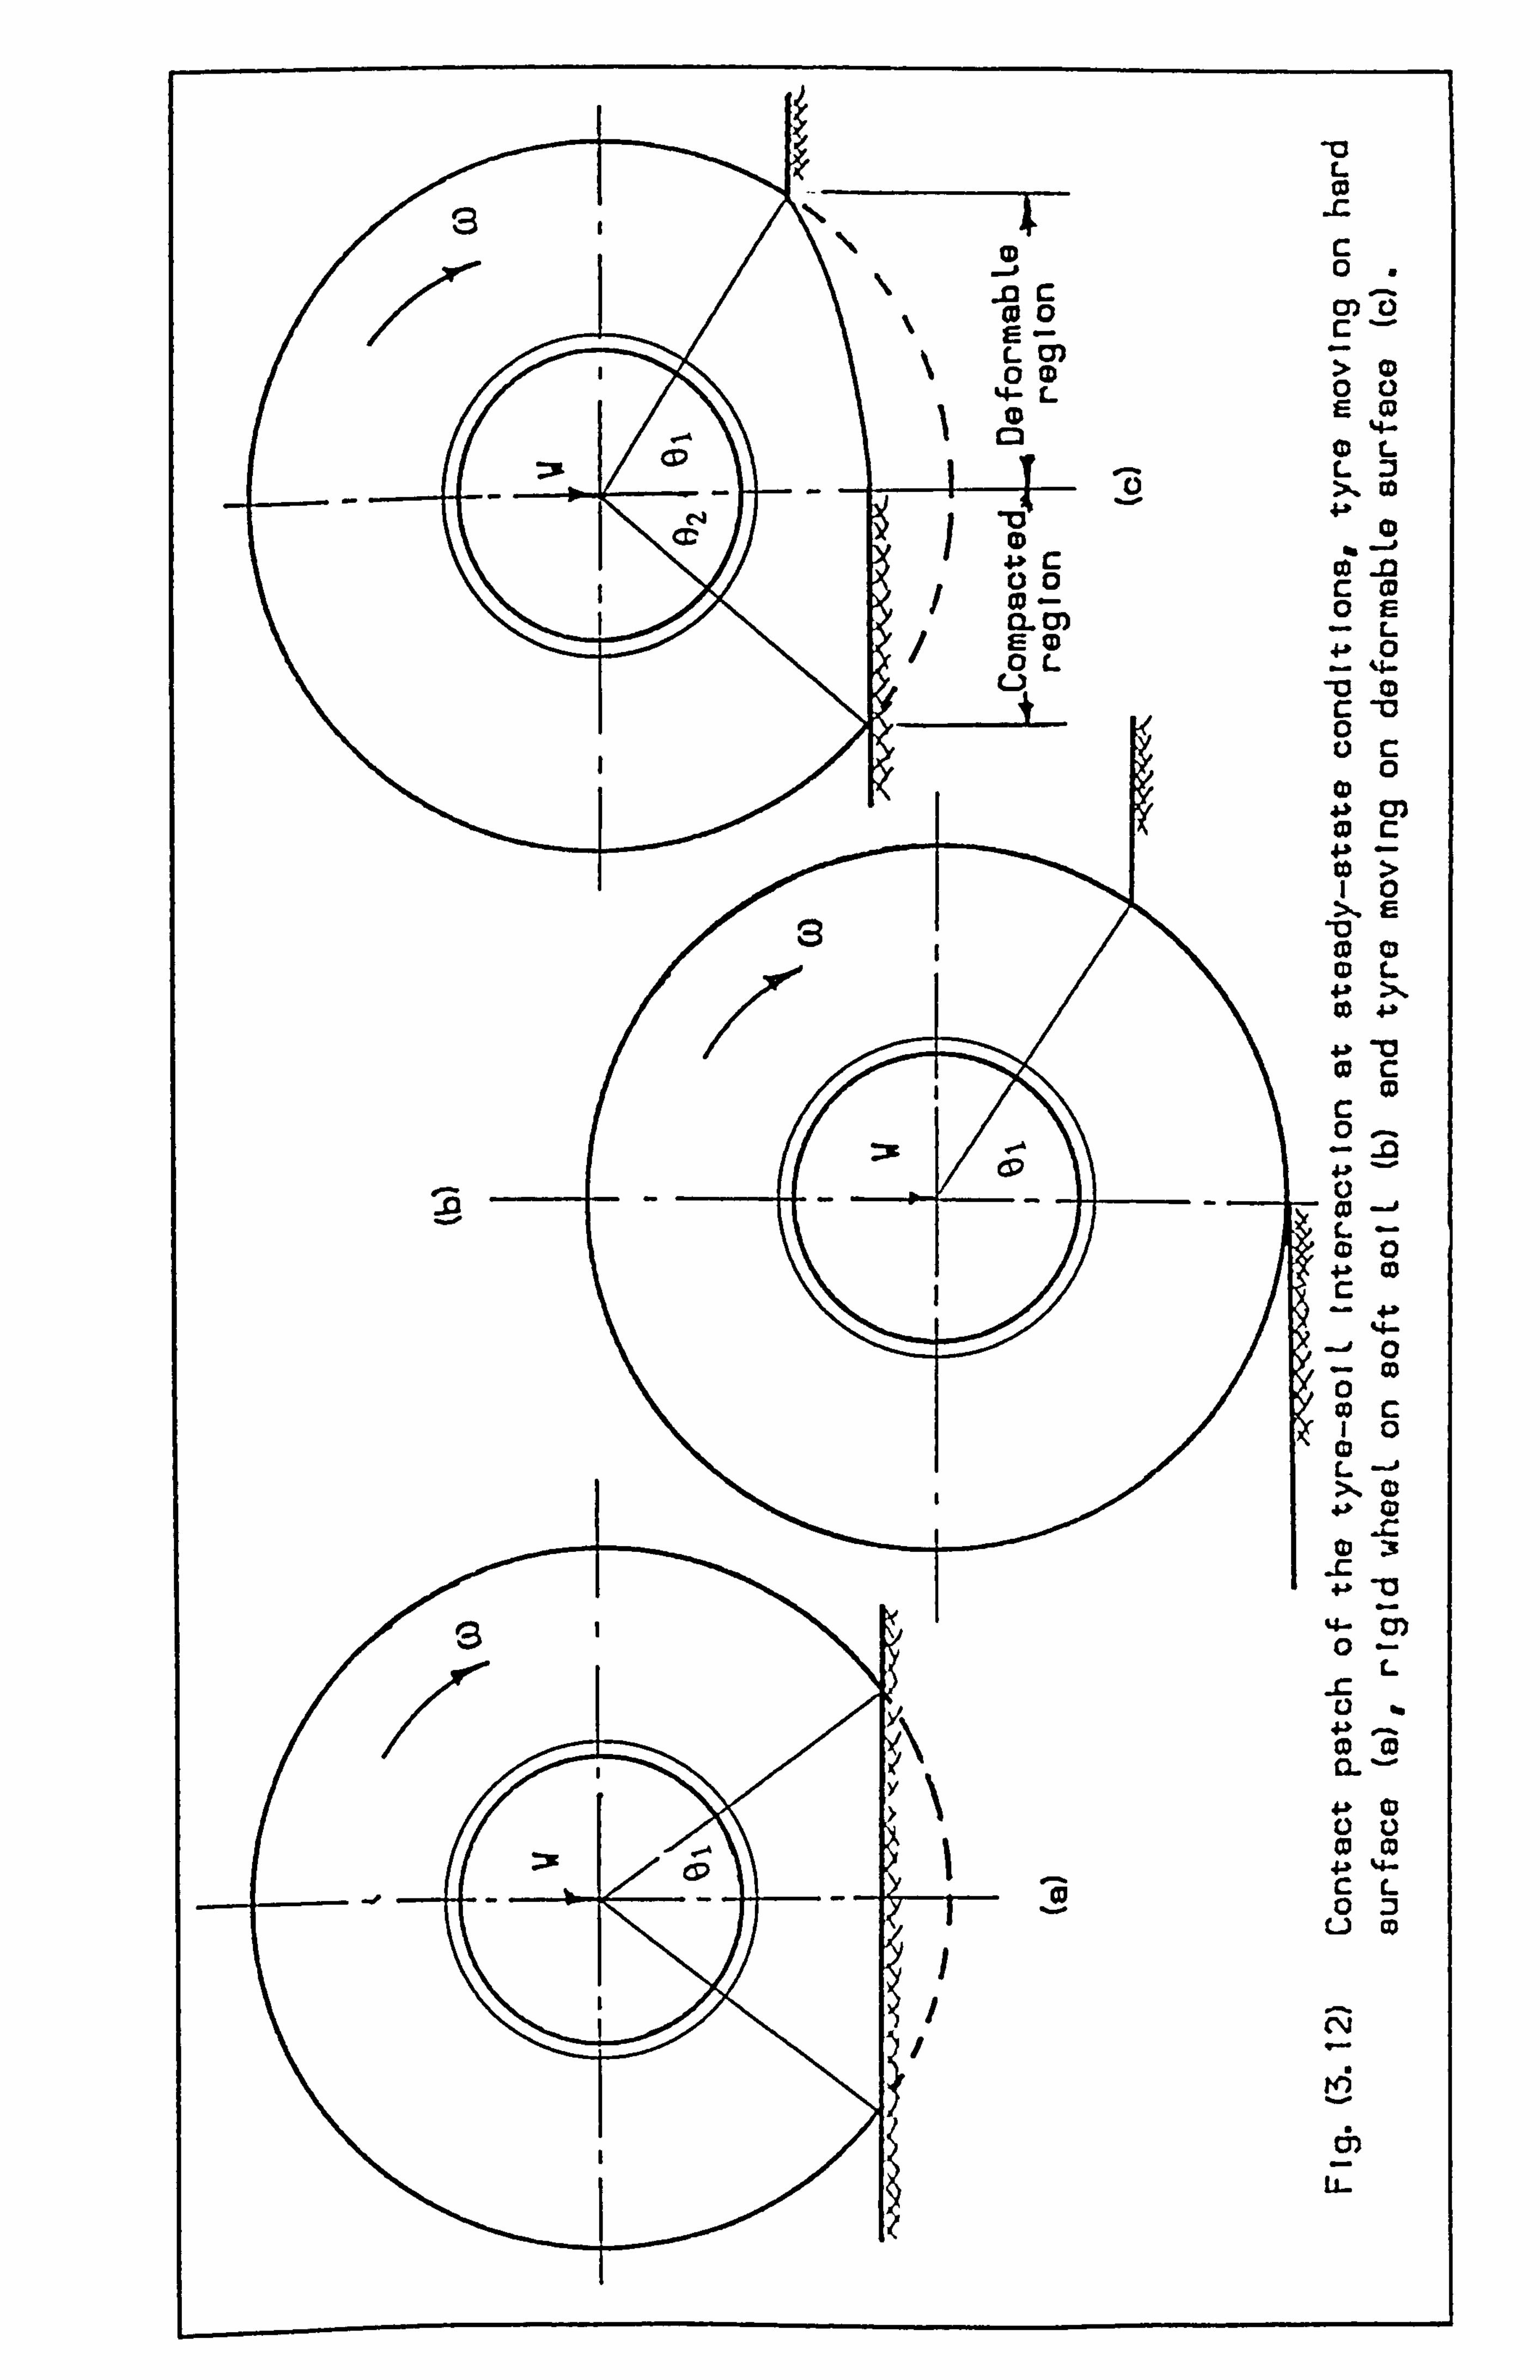
L
c wo cy) ri
E- r
LM
00 ; L 0 ID
c2 0L =x (P LZ
x Co 1
4> r- 0 _i2 00 0- c: (9
0 r= IL 0) -L EID 0 0L L)
+ c: -cl
0
10 >ý E
KD L 4.9 >.
0c
0 =x eý - -92
_c 13
Um L
03
cu 0 4-» %4- cL 0 Z)
Ch
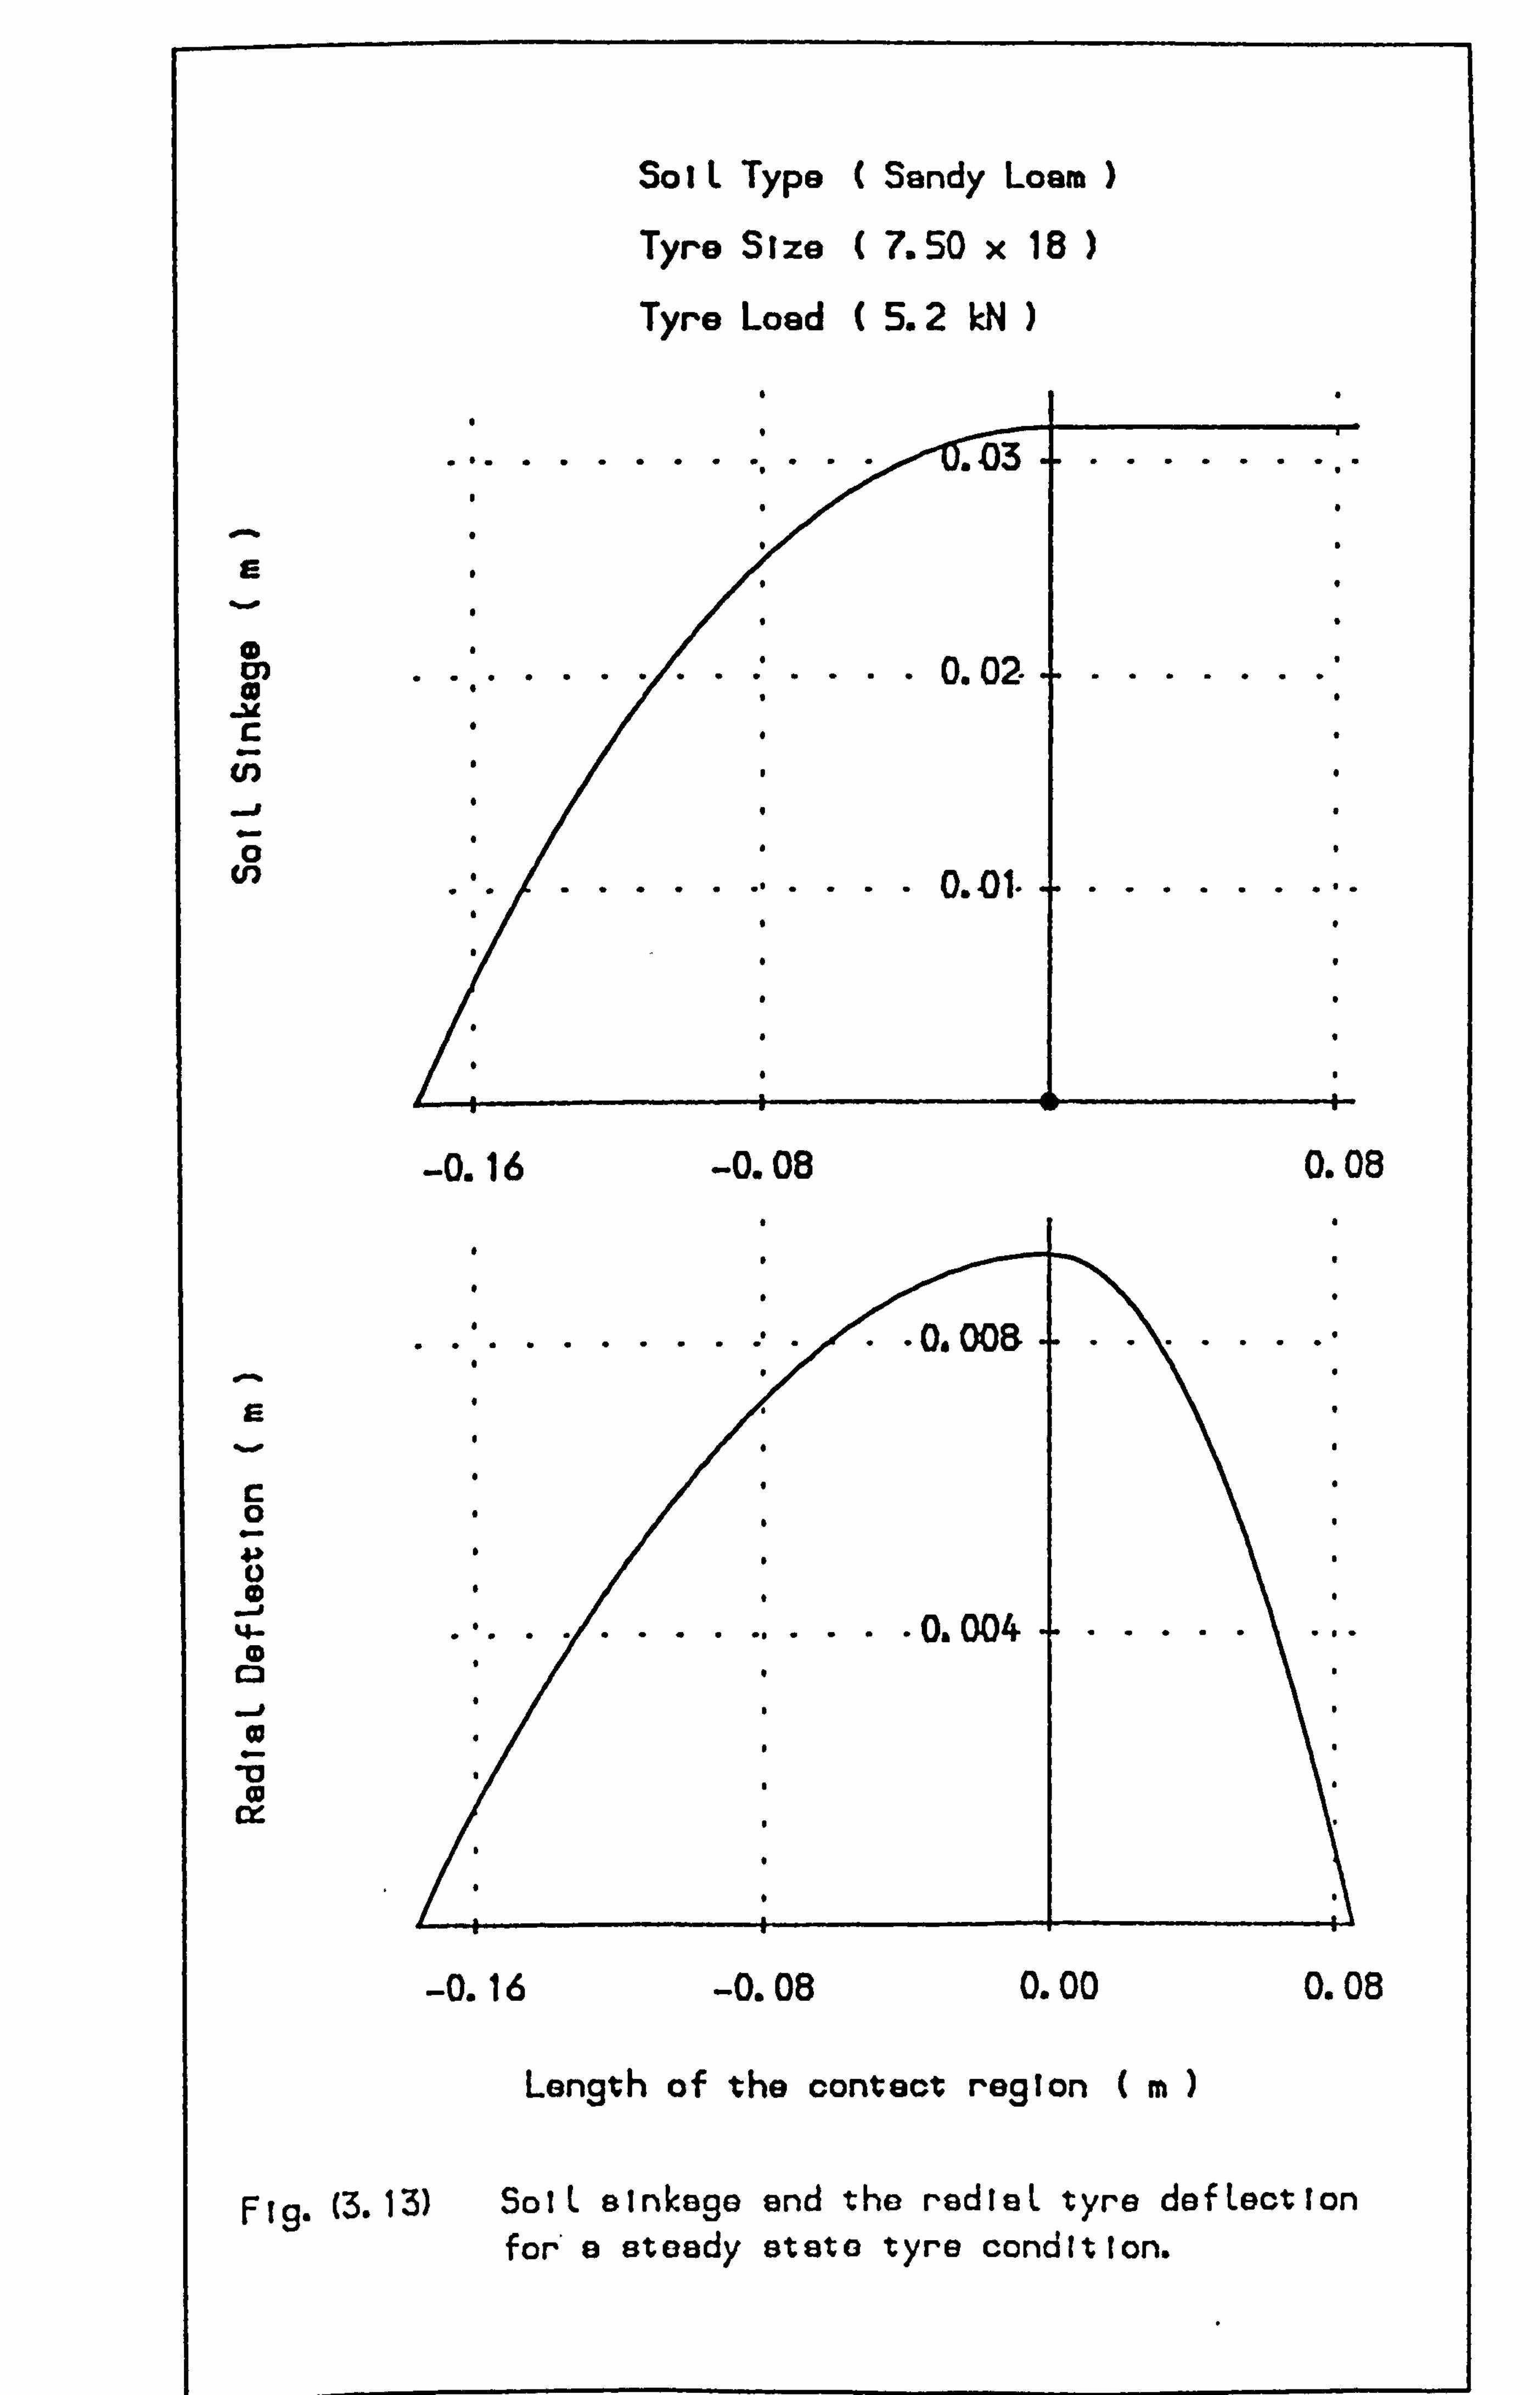
SoIL Type ( Sandy Loam
Tyre Size ( 7.50 x 18
Tyre Load ( 5.2 M
......... ... . 03
E
01 . ... .......... 0.02 .......... a
0. -01- --
-0.16 -0.08 0.08
.......... O's 00a .......... E
C 0
0
-0 %4- .:............ 0.004
CY-
-0.16 -0.08 0.00 0.08
Length of the contact region (m
F 19. (3.13) SoIL sinkage and the rediaL tyre defLection for' a steady state tyre condition.
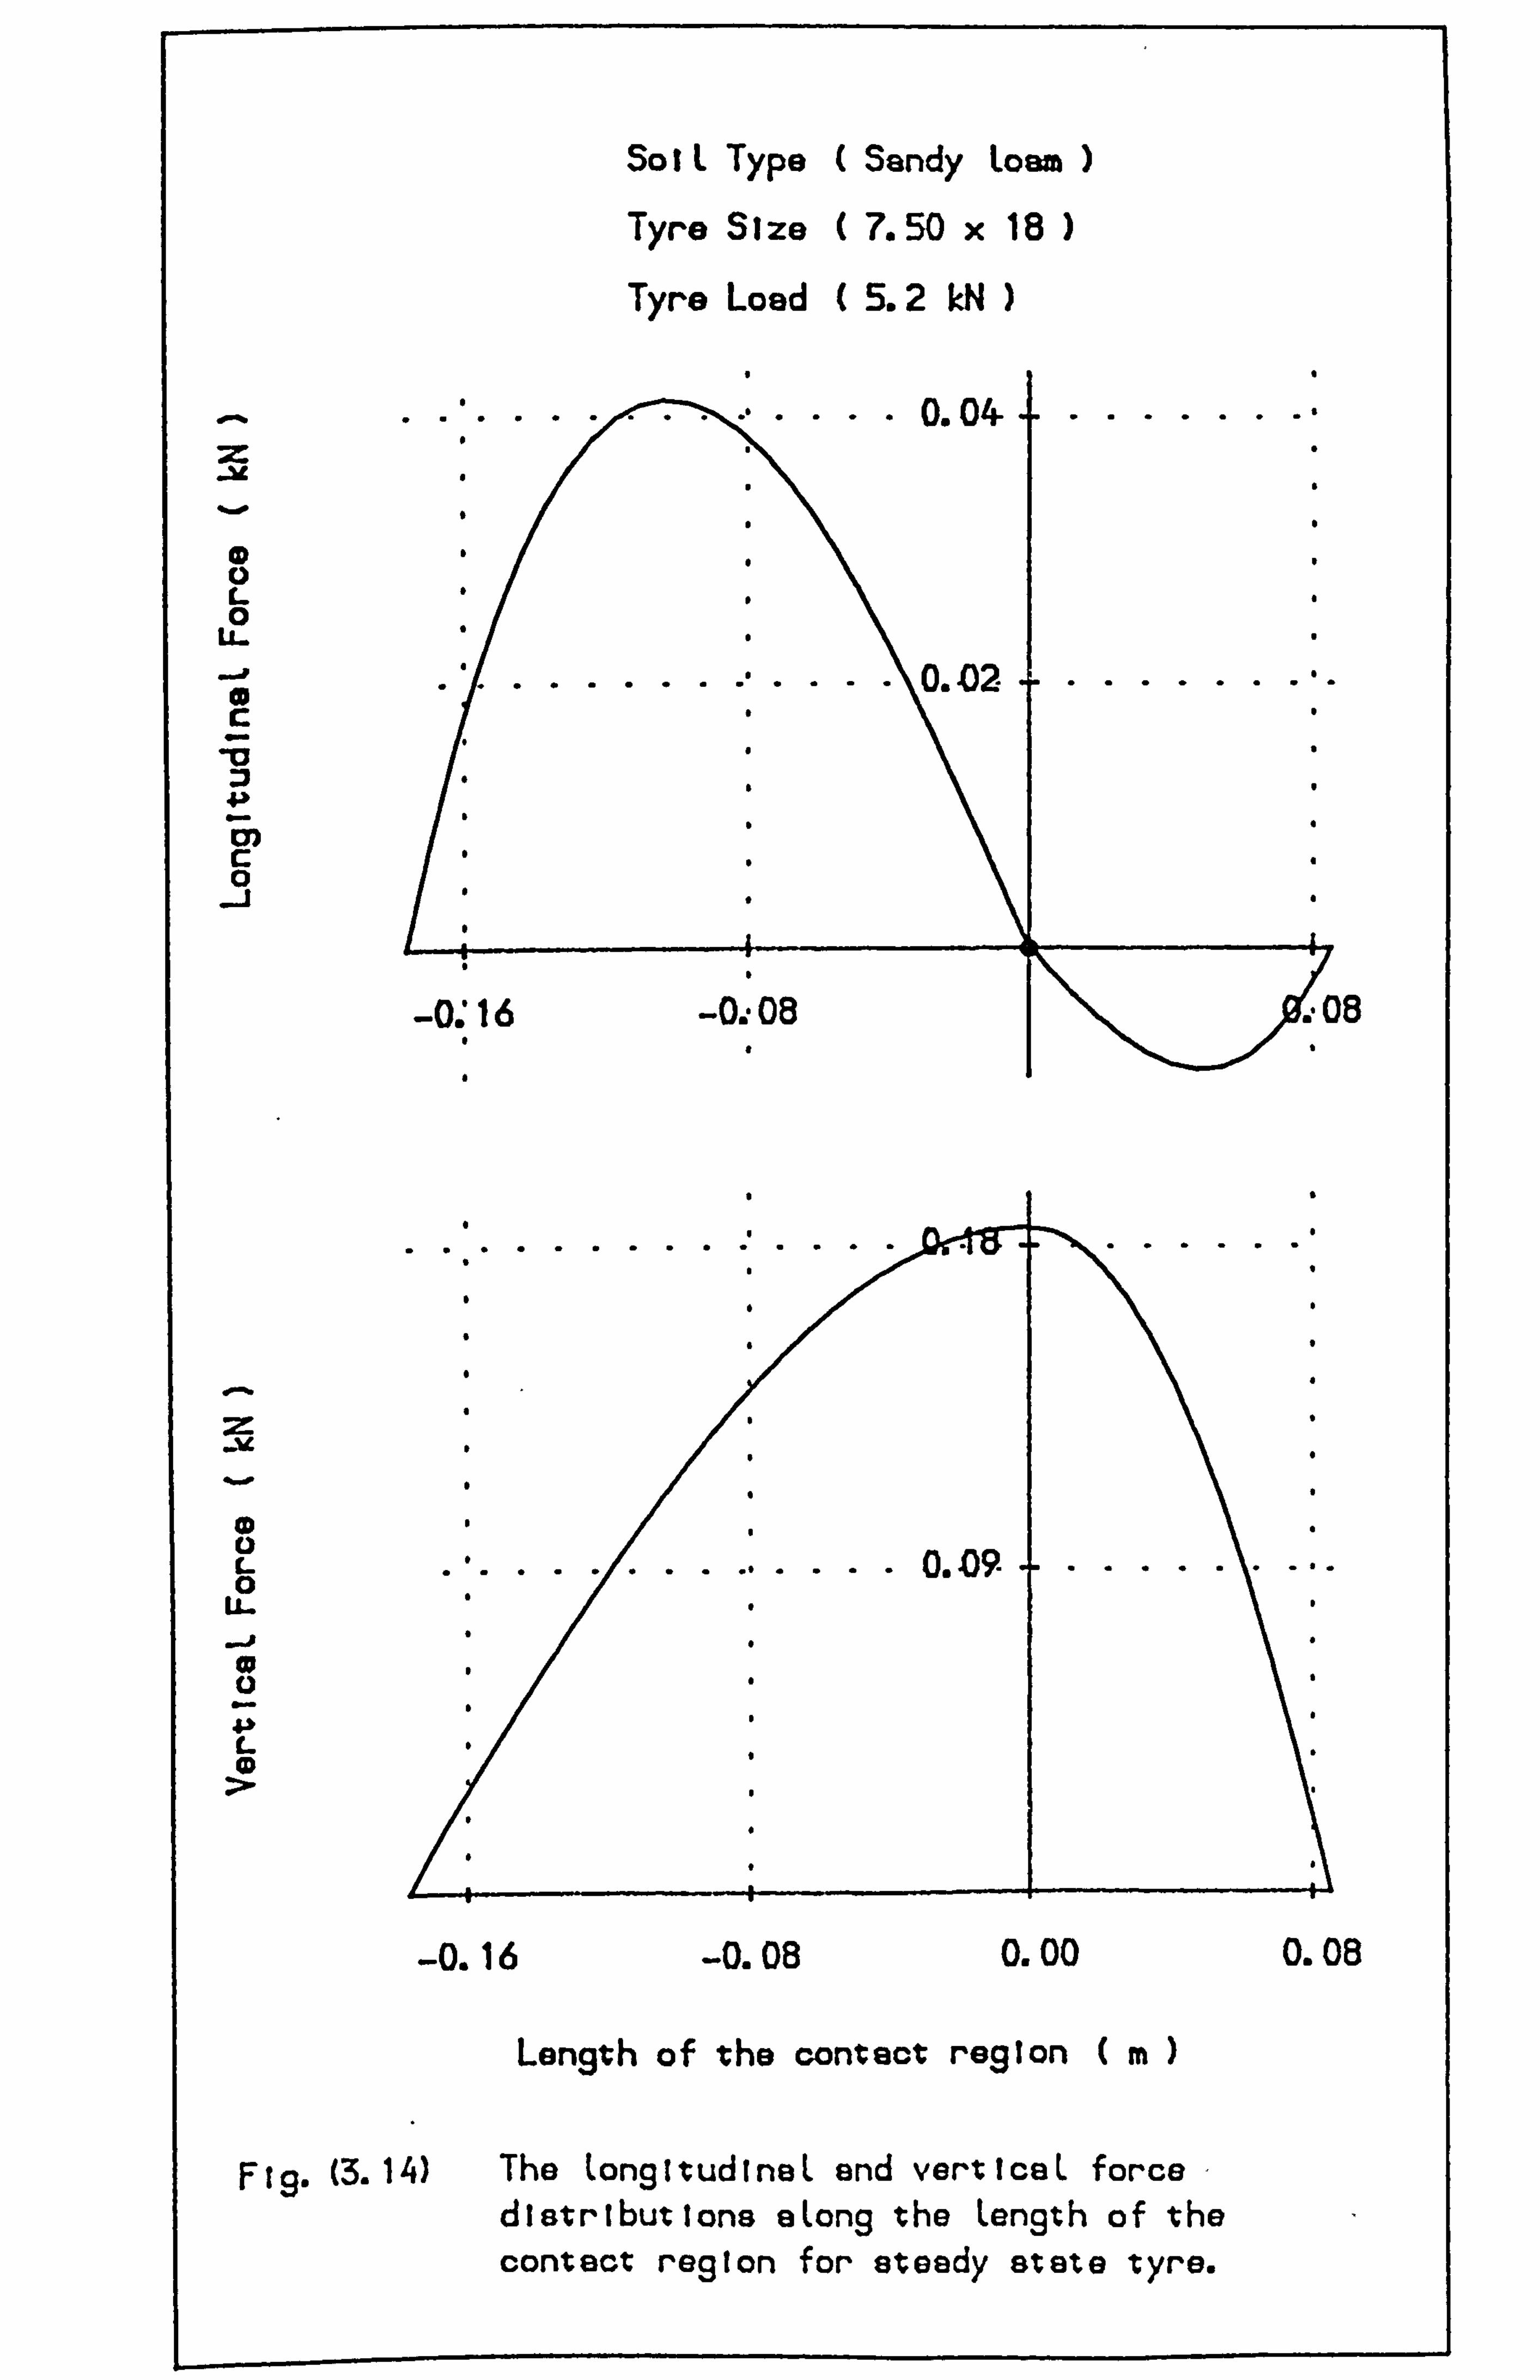
SoIL Type ( Sandy Loam
Tyre Size ( 7.50 x 18
Tyre Load ( 5.2 M)
........... .... 0.04 .........
L U-
... ........ .... 0.02-
CY) C 0 -j
-0. ' 16 -0.08 AS
.............. . ........
L ... ........ .... 0.09- 0 U-
L
-0.16 -0.08 0.00 0.08
Length of the contact region m
Fig. (3.14) The LongitudinaL and verticaL force distributions sLong the Length of the contact region for steady state tyre.
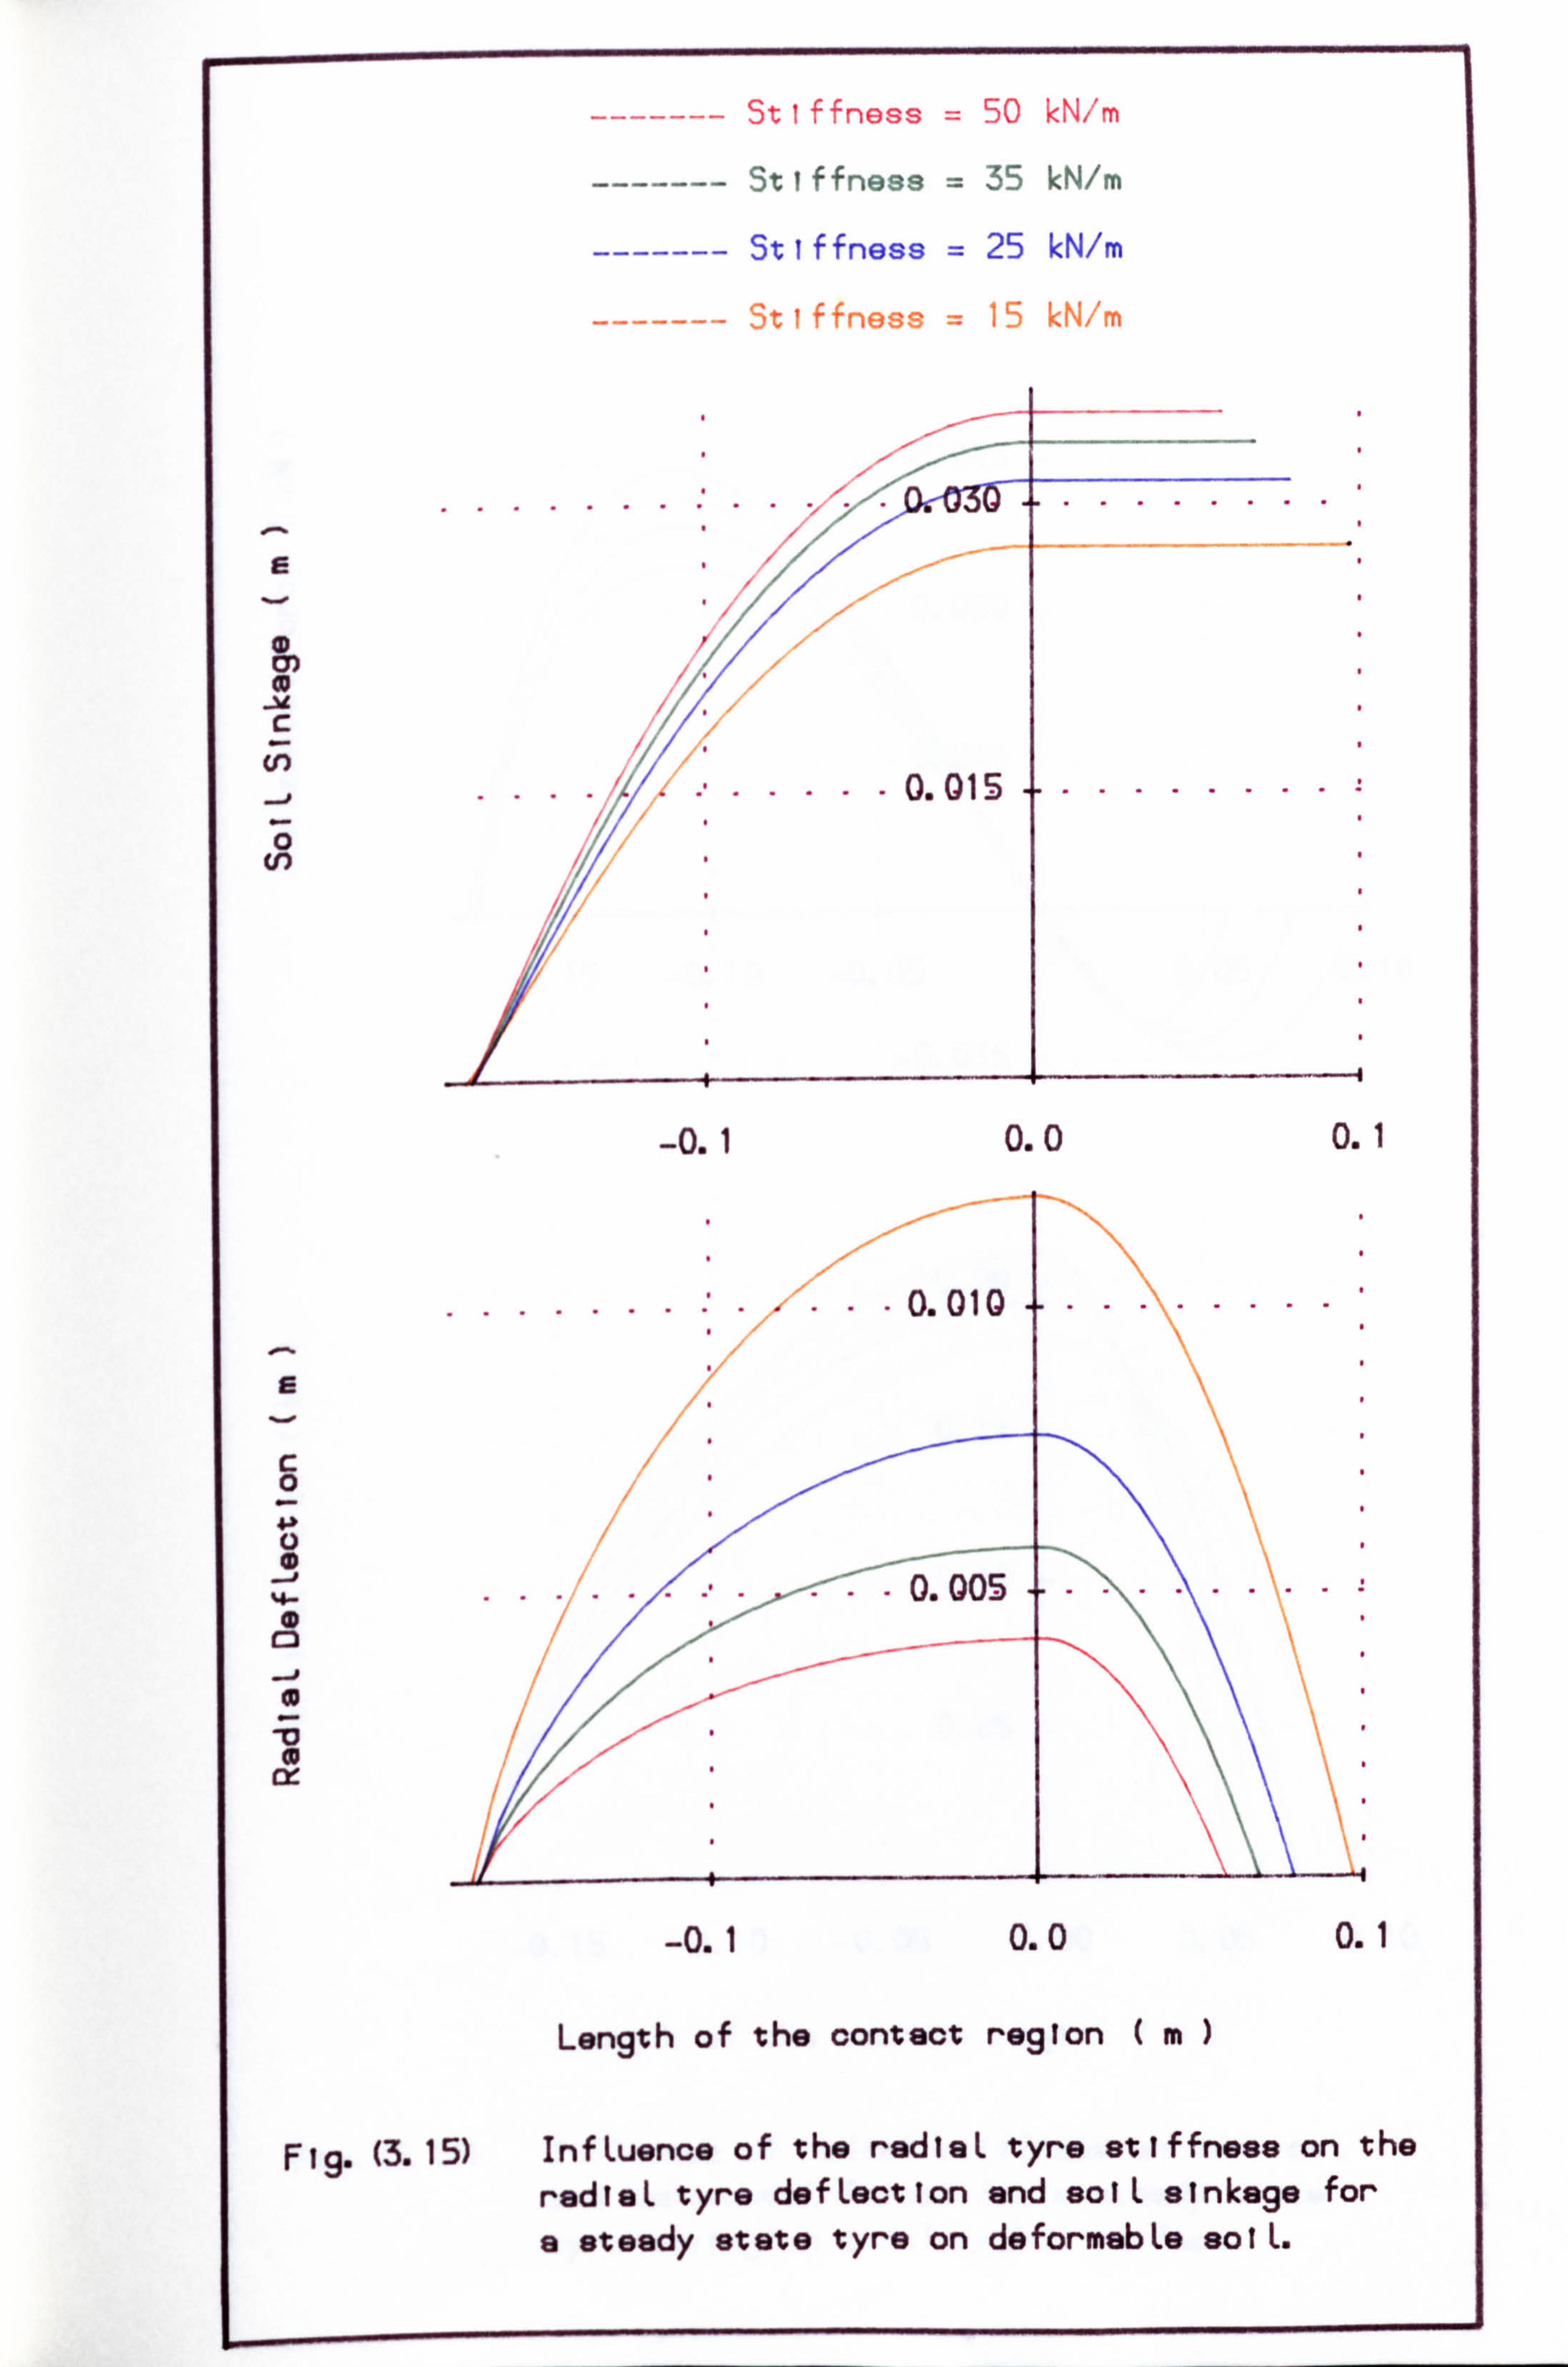
St If fness = 50 kNi'm
Stiffness = 35 kN/m
------- Stiffness = 25 kN/m 71
t (7, '-7 k N', 'm
Ca C
Cl) 0.015
-0.1 0.0 0.1
.. ....... ..... 0.010 ......
C 0
. .......... 0.005
..........
---0.005
-0.1 0.0 0.1
Length of the contact region m
Fig. (3.15) InfLuence of the rediaL tyre stiffness on the radiaL tyre deftection and solL sinkage for
a steady state tyre on deformabLe solL.
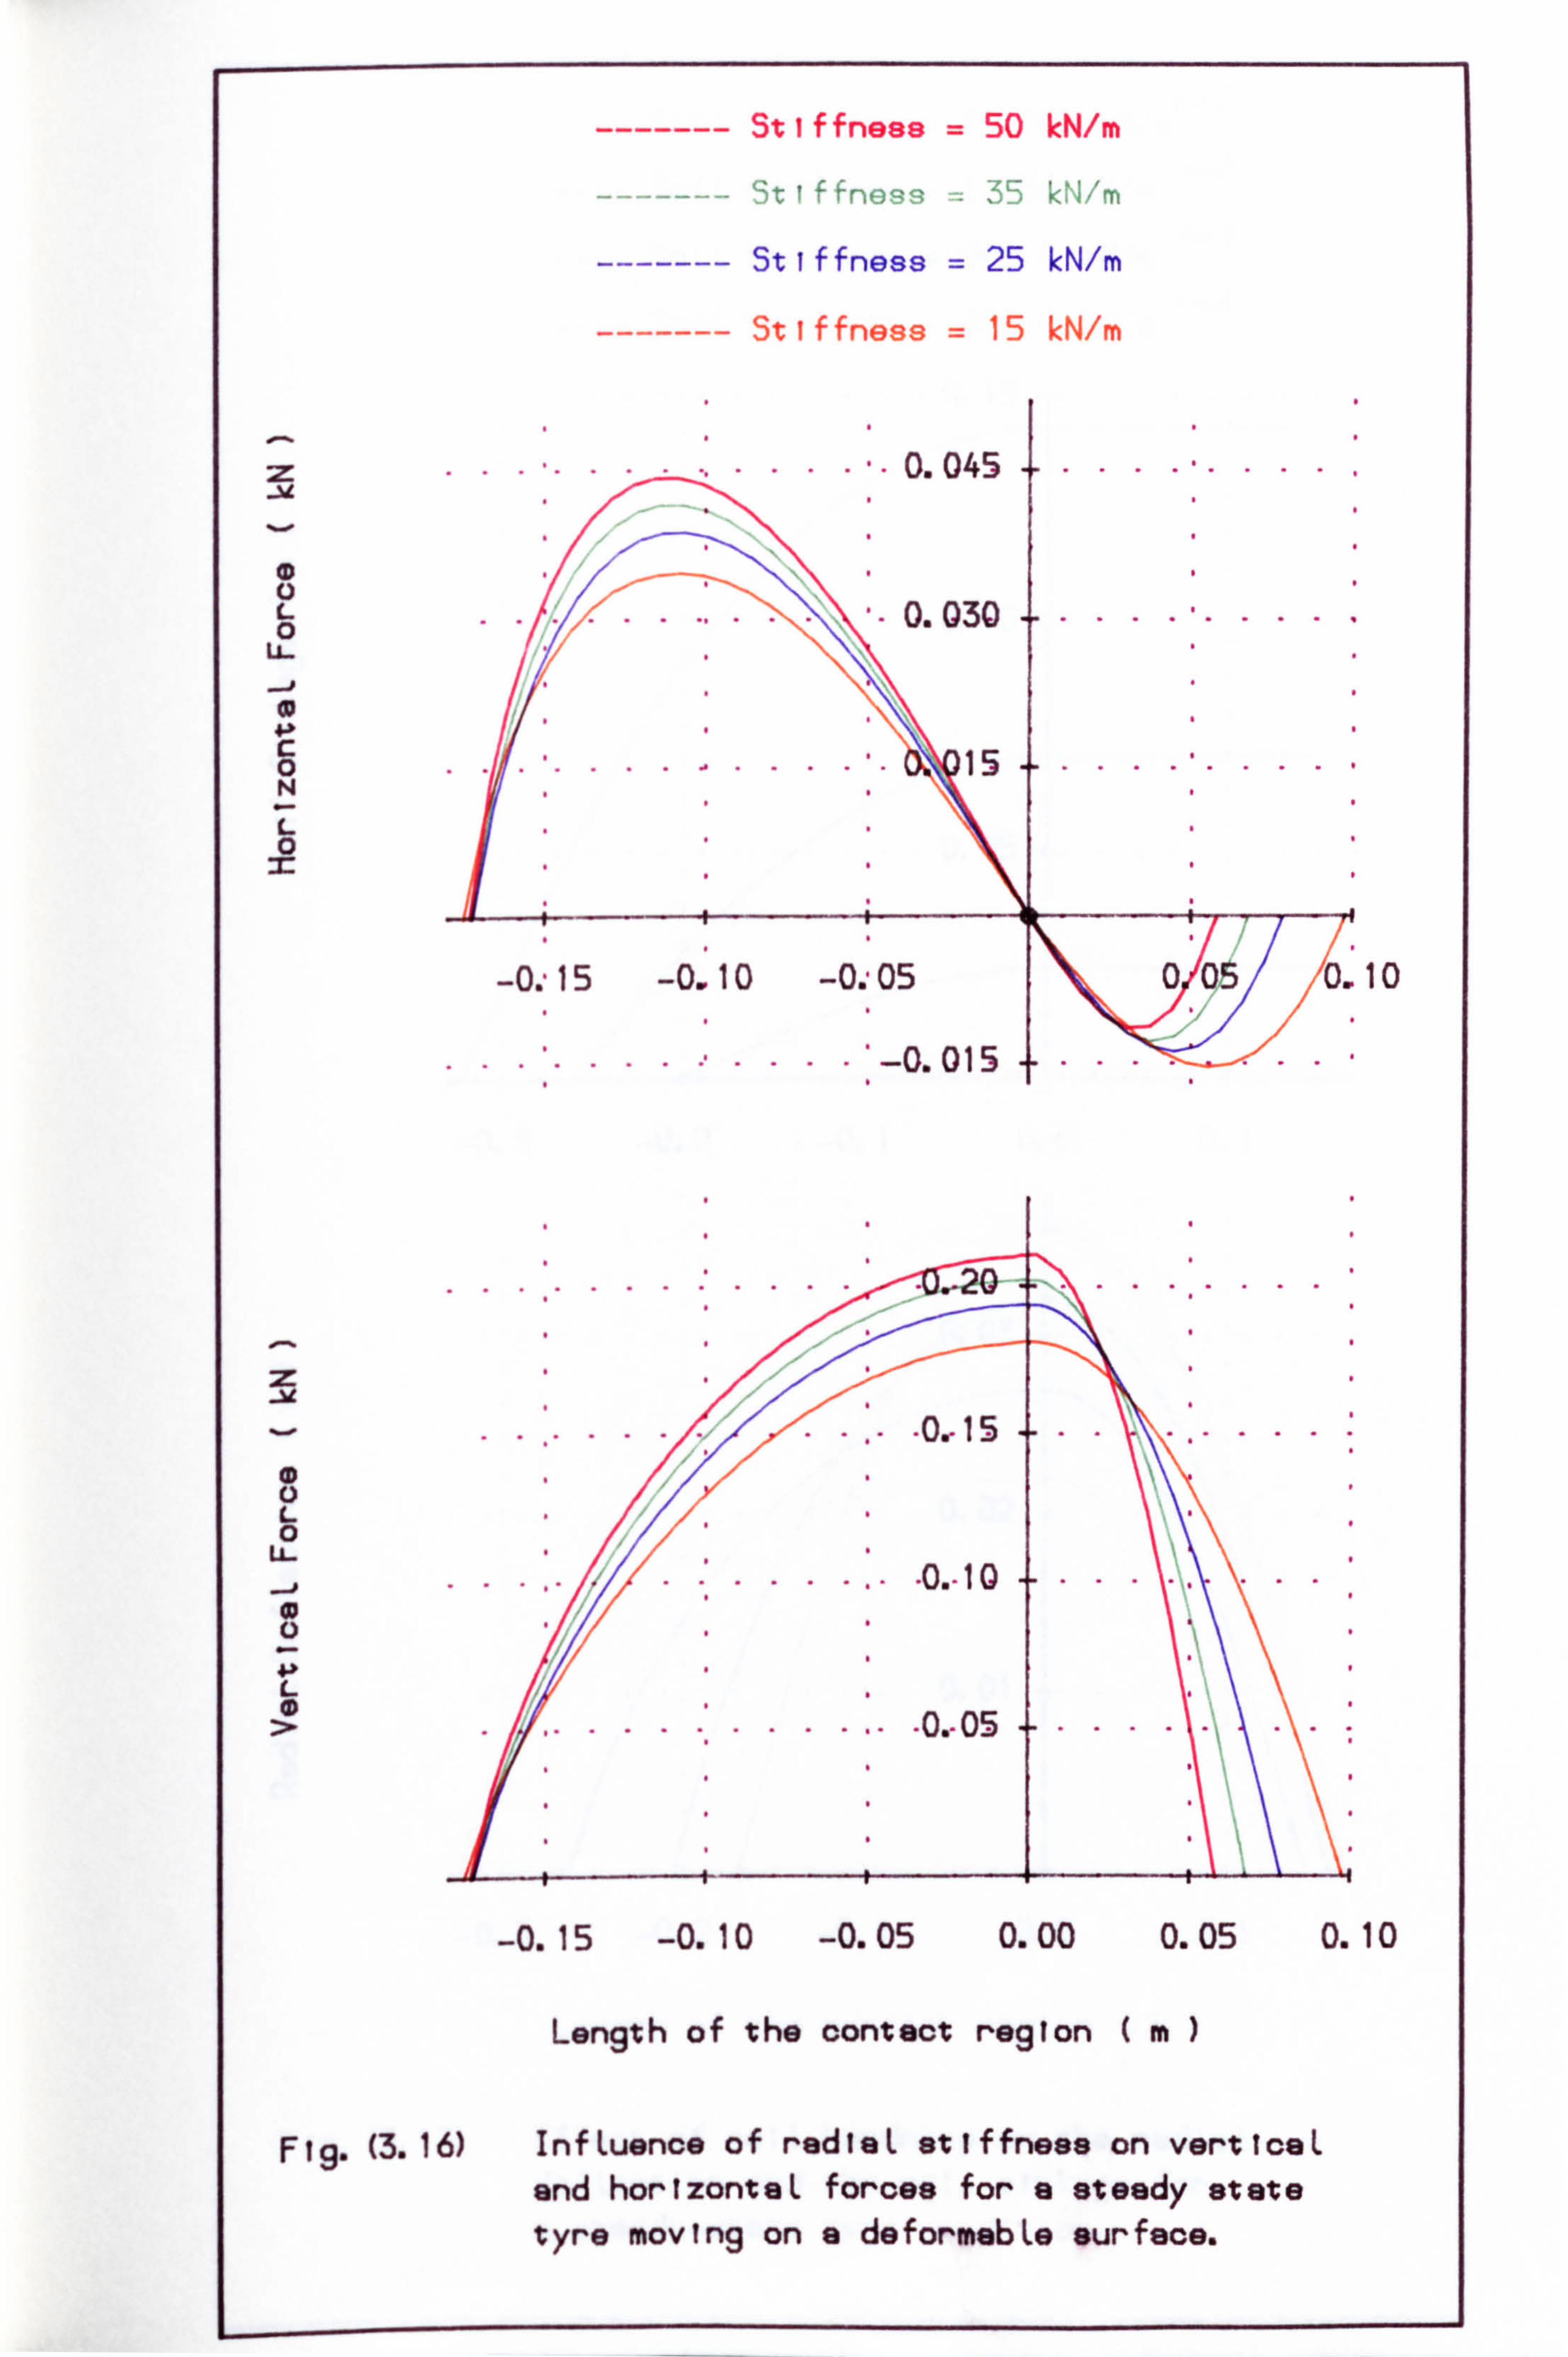
Stiffness 50 kN/m
9tiffness 35 kN/m
Stiffness 25 kN/m
Stiffness 15 kN/m
0 0 L 0
LL -J 0 4. ) C 0 N
C- 0
z
0 0
0
0 0
C- 0
-0. -15 -0.10 -M5
...... -0.015 o/os, "/ 7o., o
-0.15 -0.10 -0.05 0.00 0.05 0.10
Length of the contact region (m)
Fig. (3.16) InfLuence of rediaL stiffness on verticaL and hortzontaL forces for a steady state tyre moving on a deformabLe surface.
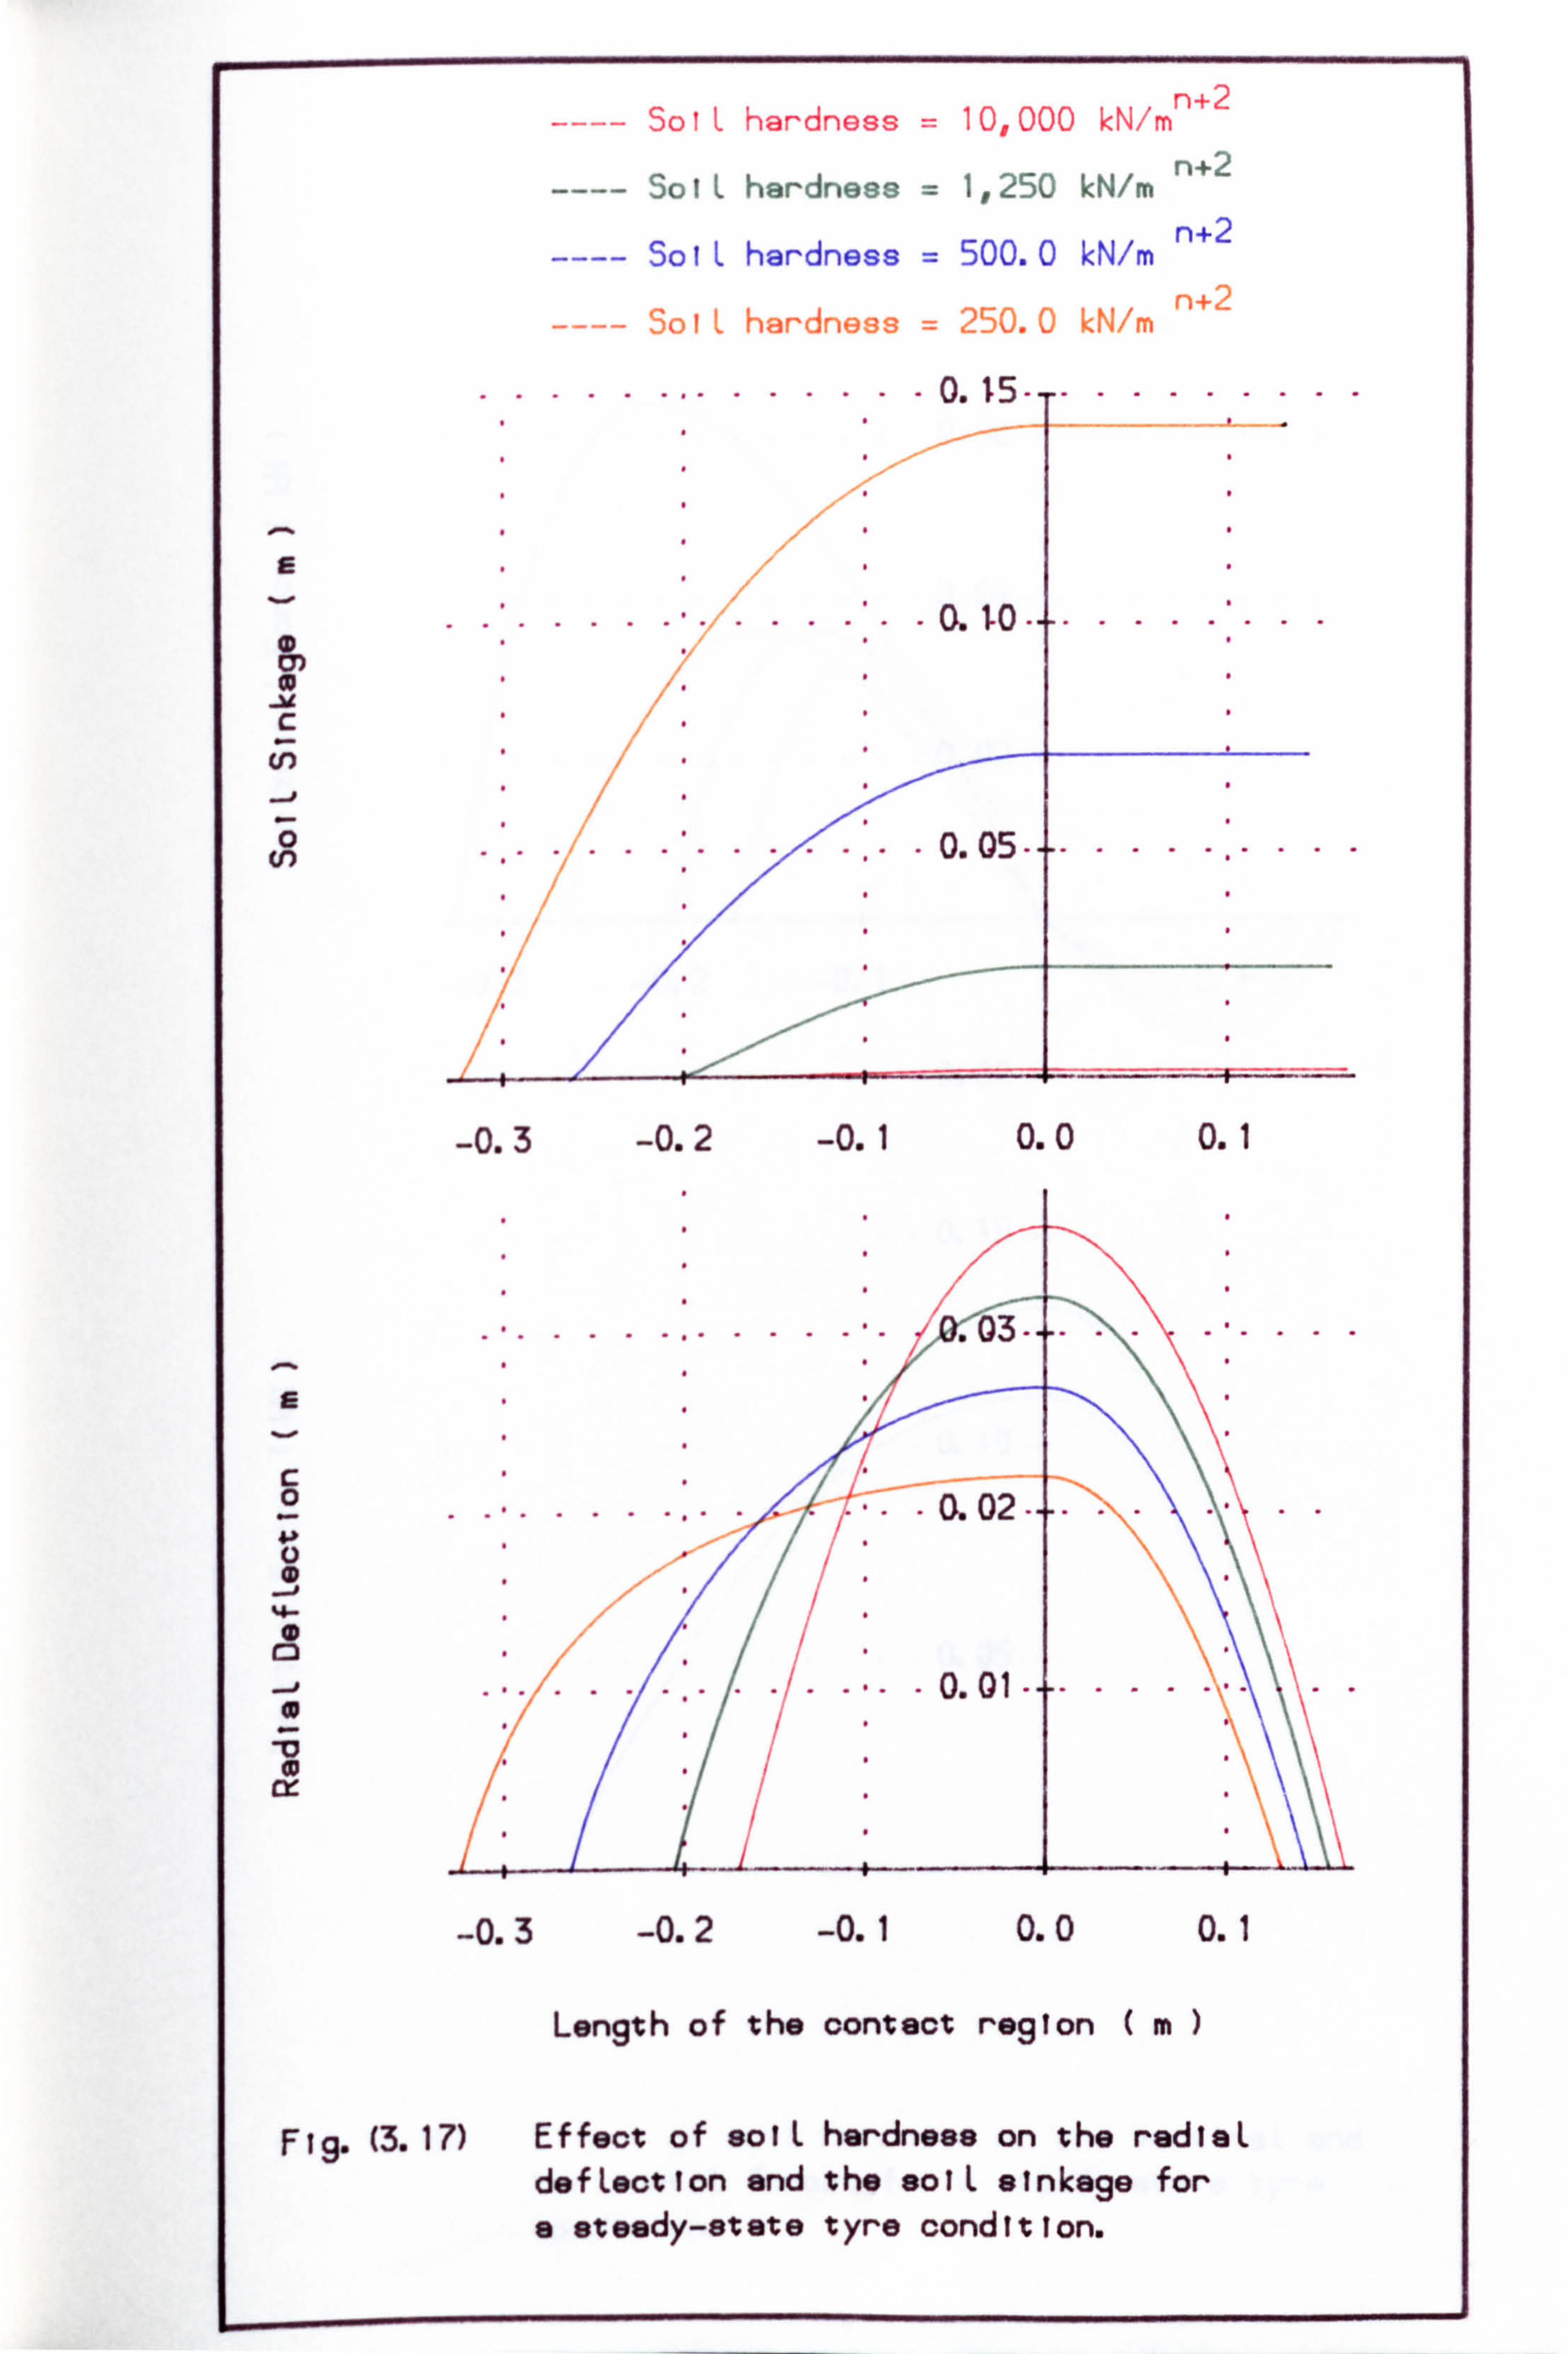
n+2 SoiL hardness = 10,000 kN,, 'm
n+2 ---- 3otL hardness = 1,250 kN/m
n+2 ---- SoIL hardness = 500.0 kN/m
oIL hardness = 2`111j. 0 kNIr-,,
........ ..... . 0.15 .... ........
........ ..... . 0. W .... .......
Cn 0 C (n
..... ... ...... . 0.05 .... ...... ...
-0.3 -0.2 -0.1 0.0 0.1
-v . 03-1- ... ...
C 0
. ... ...... . . 0.02-
..... ...... . 0.01-1-
-0.3 -0.2 -0.1 0.0 0.1
Length of the contact region (m)
Fig. (3.17) Effect of solL hardness on the rediaL defLection and the solL sinkage for
I
a steady-state tyre condition.
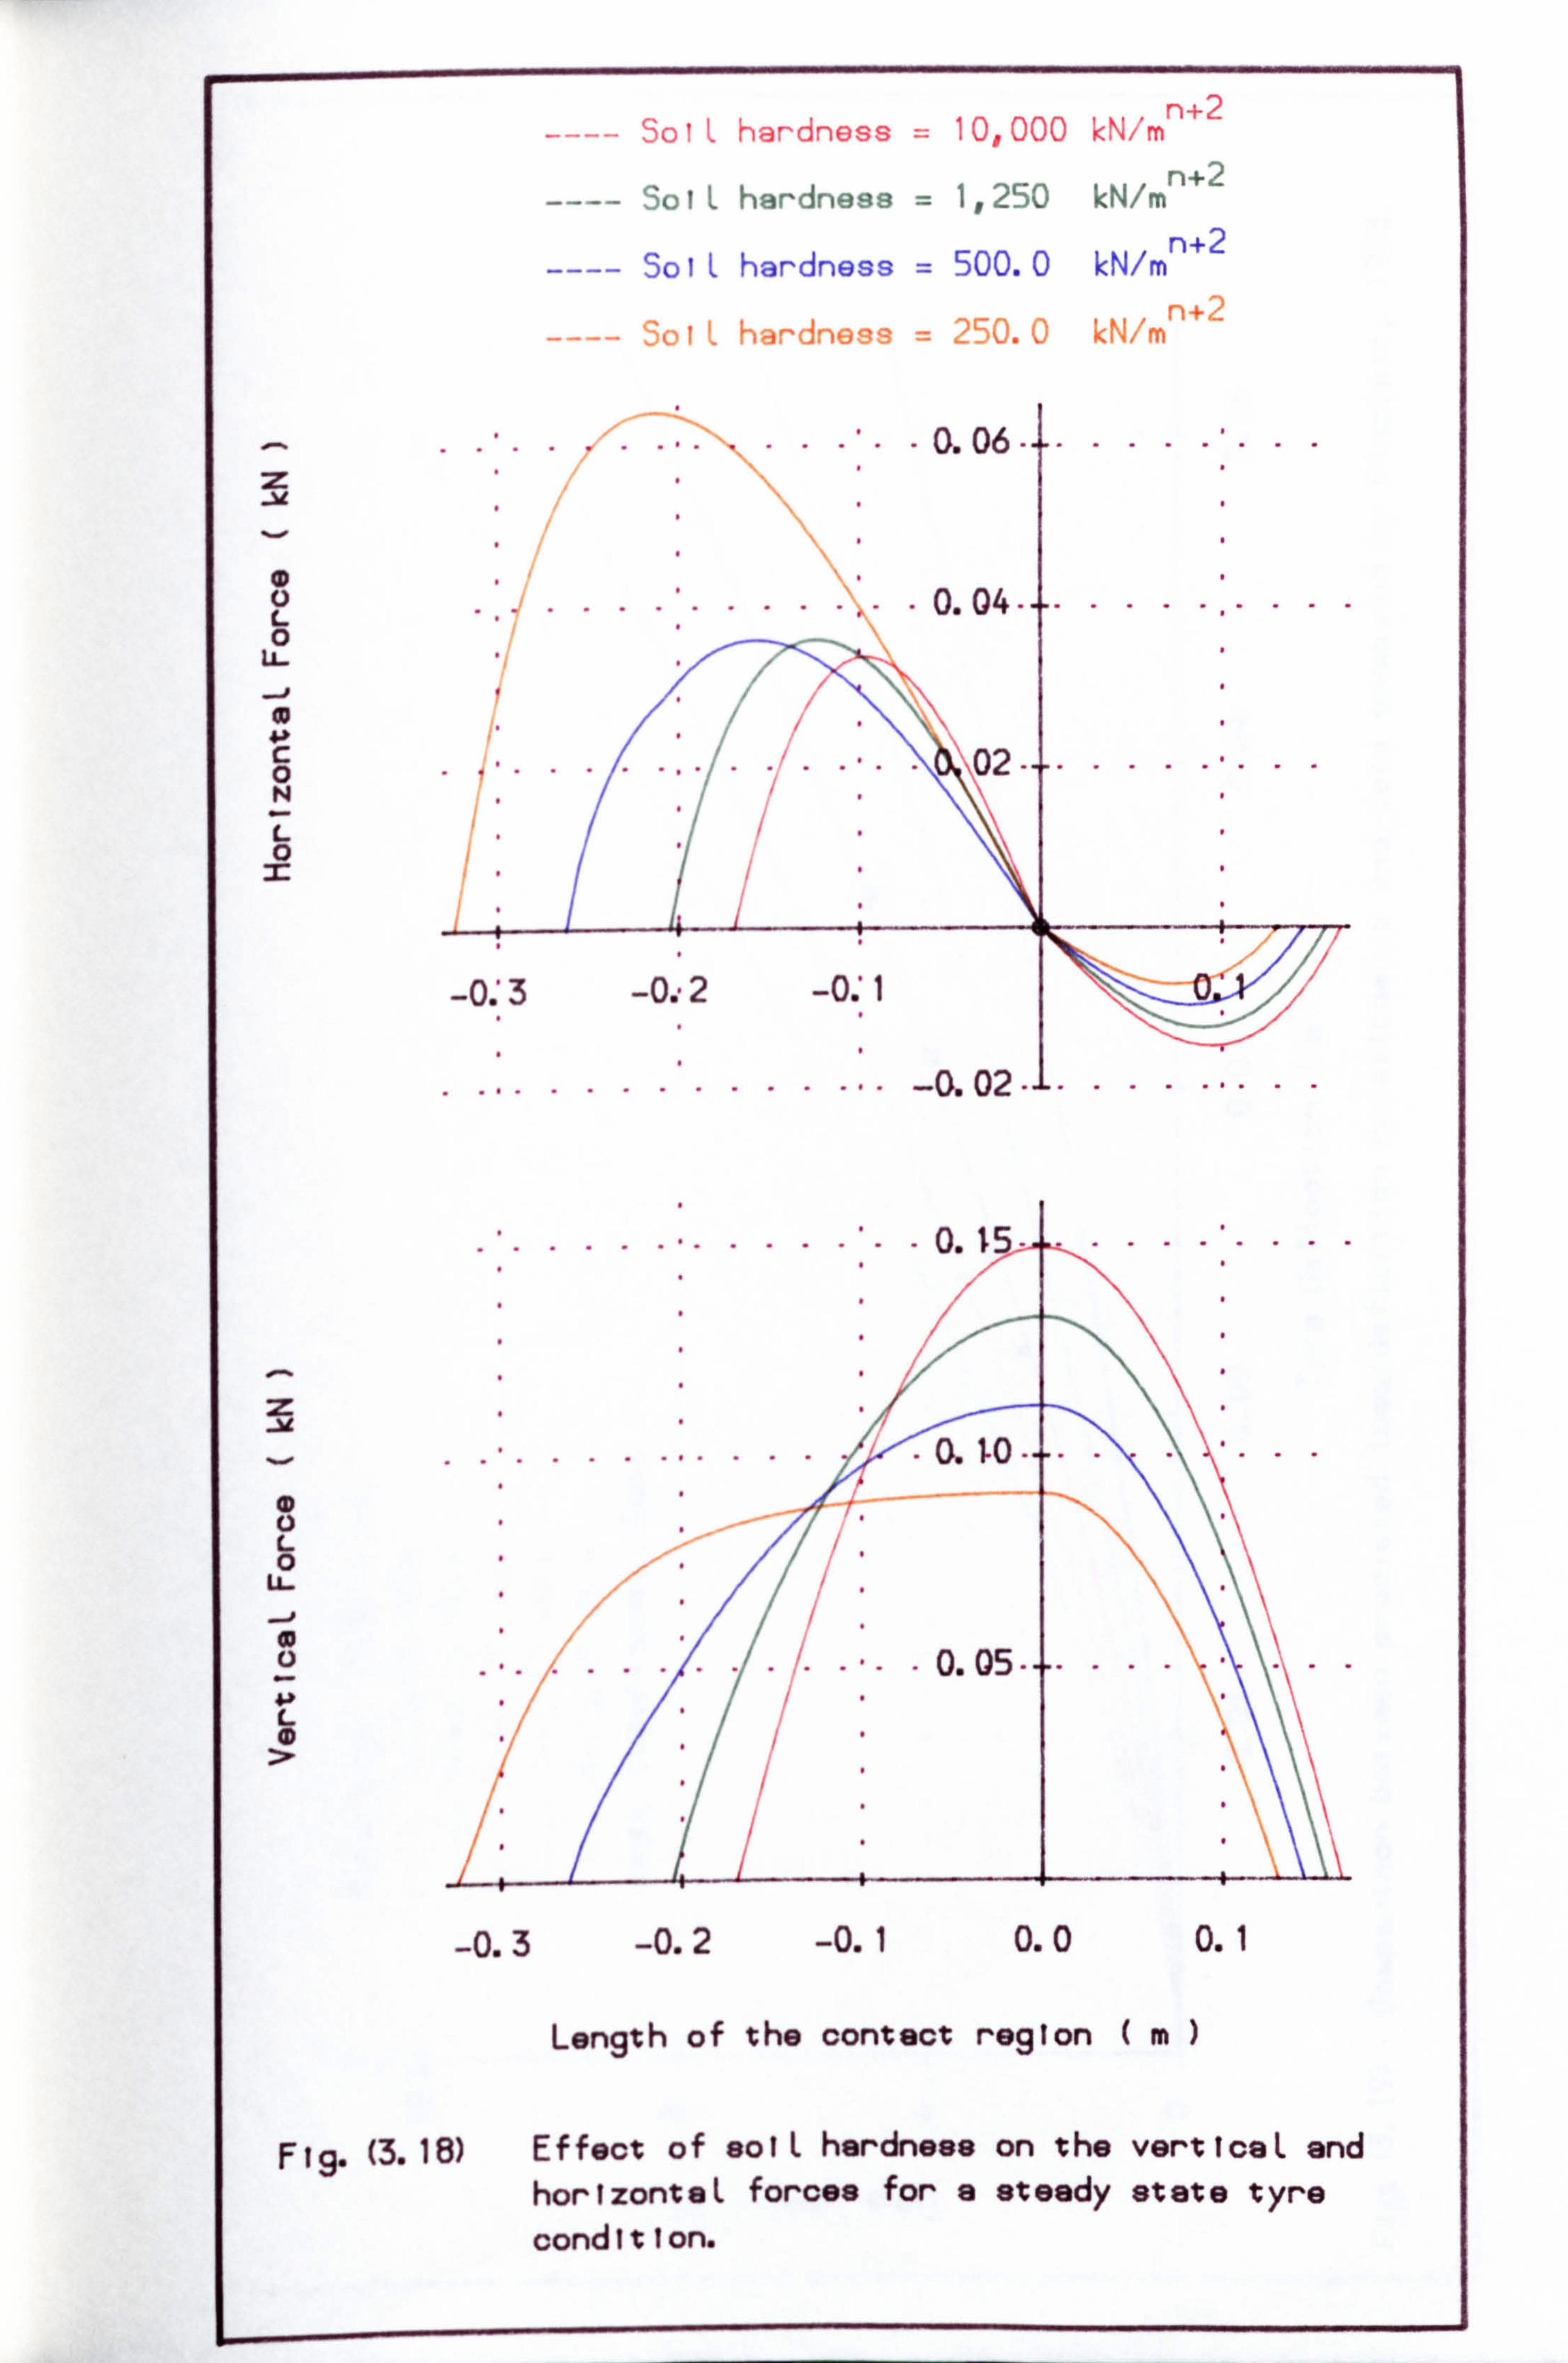
n+2 SoIL hardness = 10,000 kN/'m
SoIL hardness = 1,250 kN/m n+2
n+2 ---- SoIL hardness = 500.0 kN/m
. .... .. 0.04-1. L 0 . U- -j
0 ......... .. 02
N
0
-0. *3 -0., 2 -0. *l
. ... ..... ...... -0.02 -1 ....... ..
........ ...... 0.15 ..........
z
. ... ...... ... 0. to
L 0
U- .
... . .. 0.05
L
-0.3 -0.2 -0.1 0.0 0.1
Length of the contact region (m)
Fig. (3.18) Effect of solL hardness on the verticeL and hortzontaL forces for a steady state tyre condition.
I
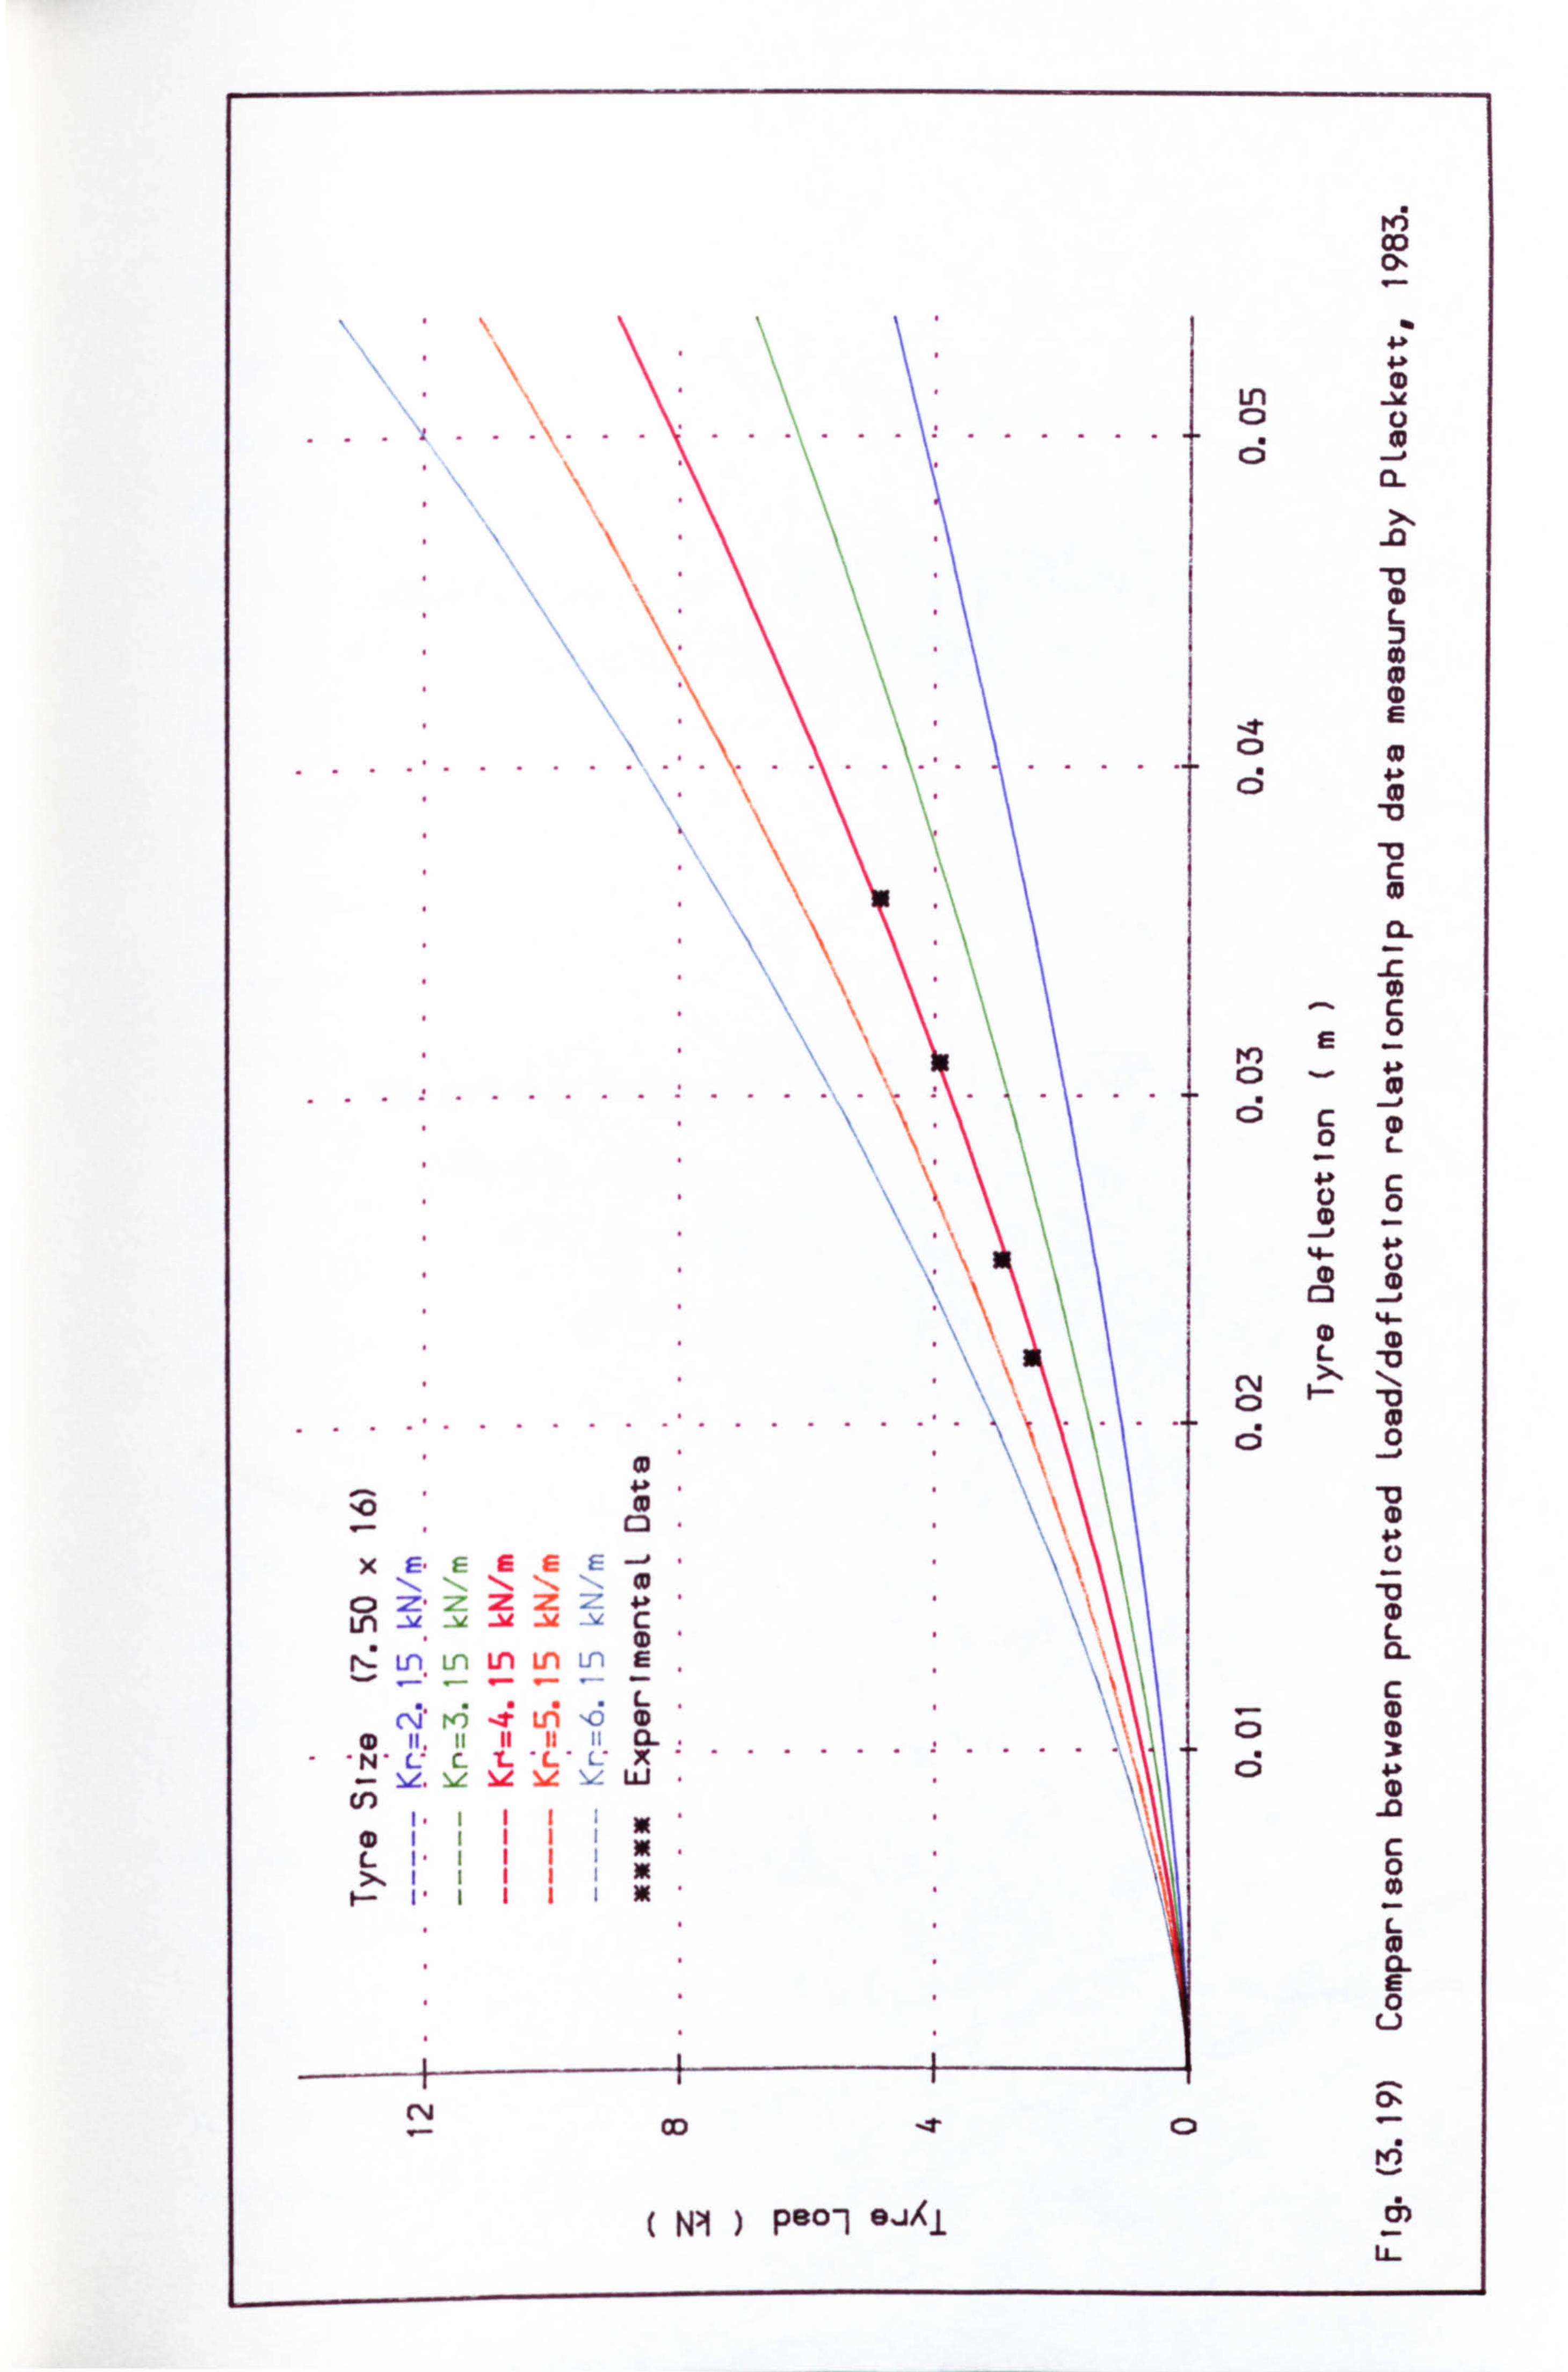
r4i co Dl
CD Ln
.. .... I ........ C)
.
L m (D E
c
CL
c 2 ...
..
. ... .... . .. .-.... 6 c -
Im
0 L c 0
C3
(D L -0 CV C)
... .. .. . ... . ....... ... 0
10 C3
x E. F E C= E - go , -0
C, ; Z, Z- M Z ac- 4-b (D Ln C L
- 0 CL
r,: Ln. Ln Ln )m U E c
C\5, K; i Ln 'o L e CD
' ' E: C- t. L: L X 0 Nz. lz lie v uj
cr) - -0
(D II I ; 0 L II I c 0
0 u
9-1 co -T Cl t4i
NI ) P80-1 GJXJ. 6) E
CHAPTER 4
AN EXTENDED MODEL FOR COMBINED LATERAL
AND LONGITUDINAL TYRE FORCES
The extended model for combined lateral and longitudinal
off-road tyre forces is presented. A fulIer treatment
of tyre/soil behaviour in the contact region
than existed previously is outlined.
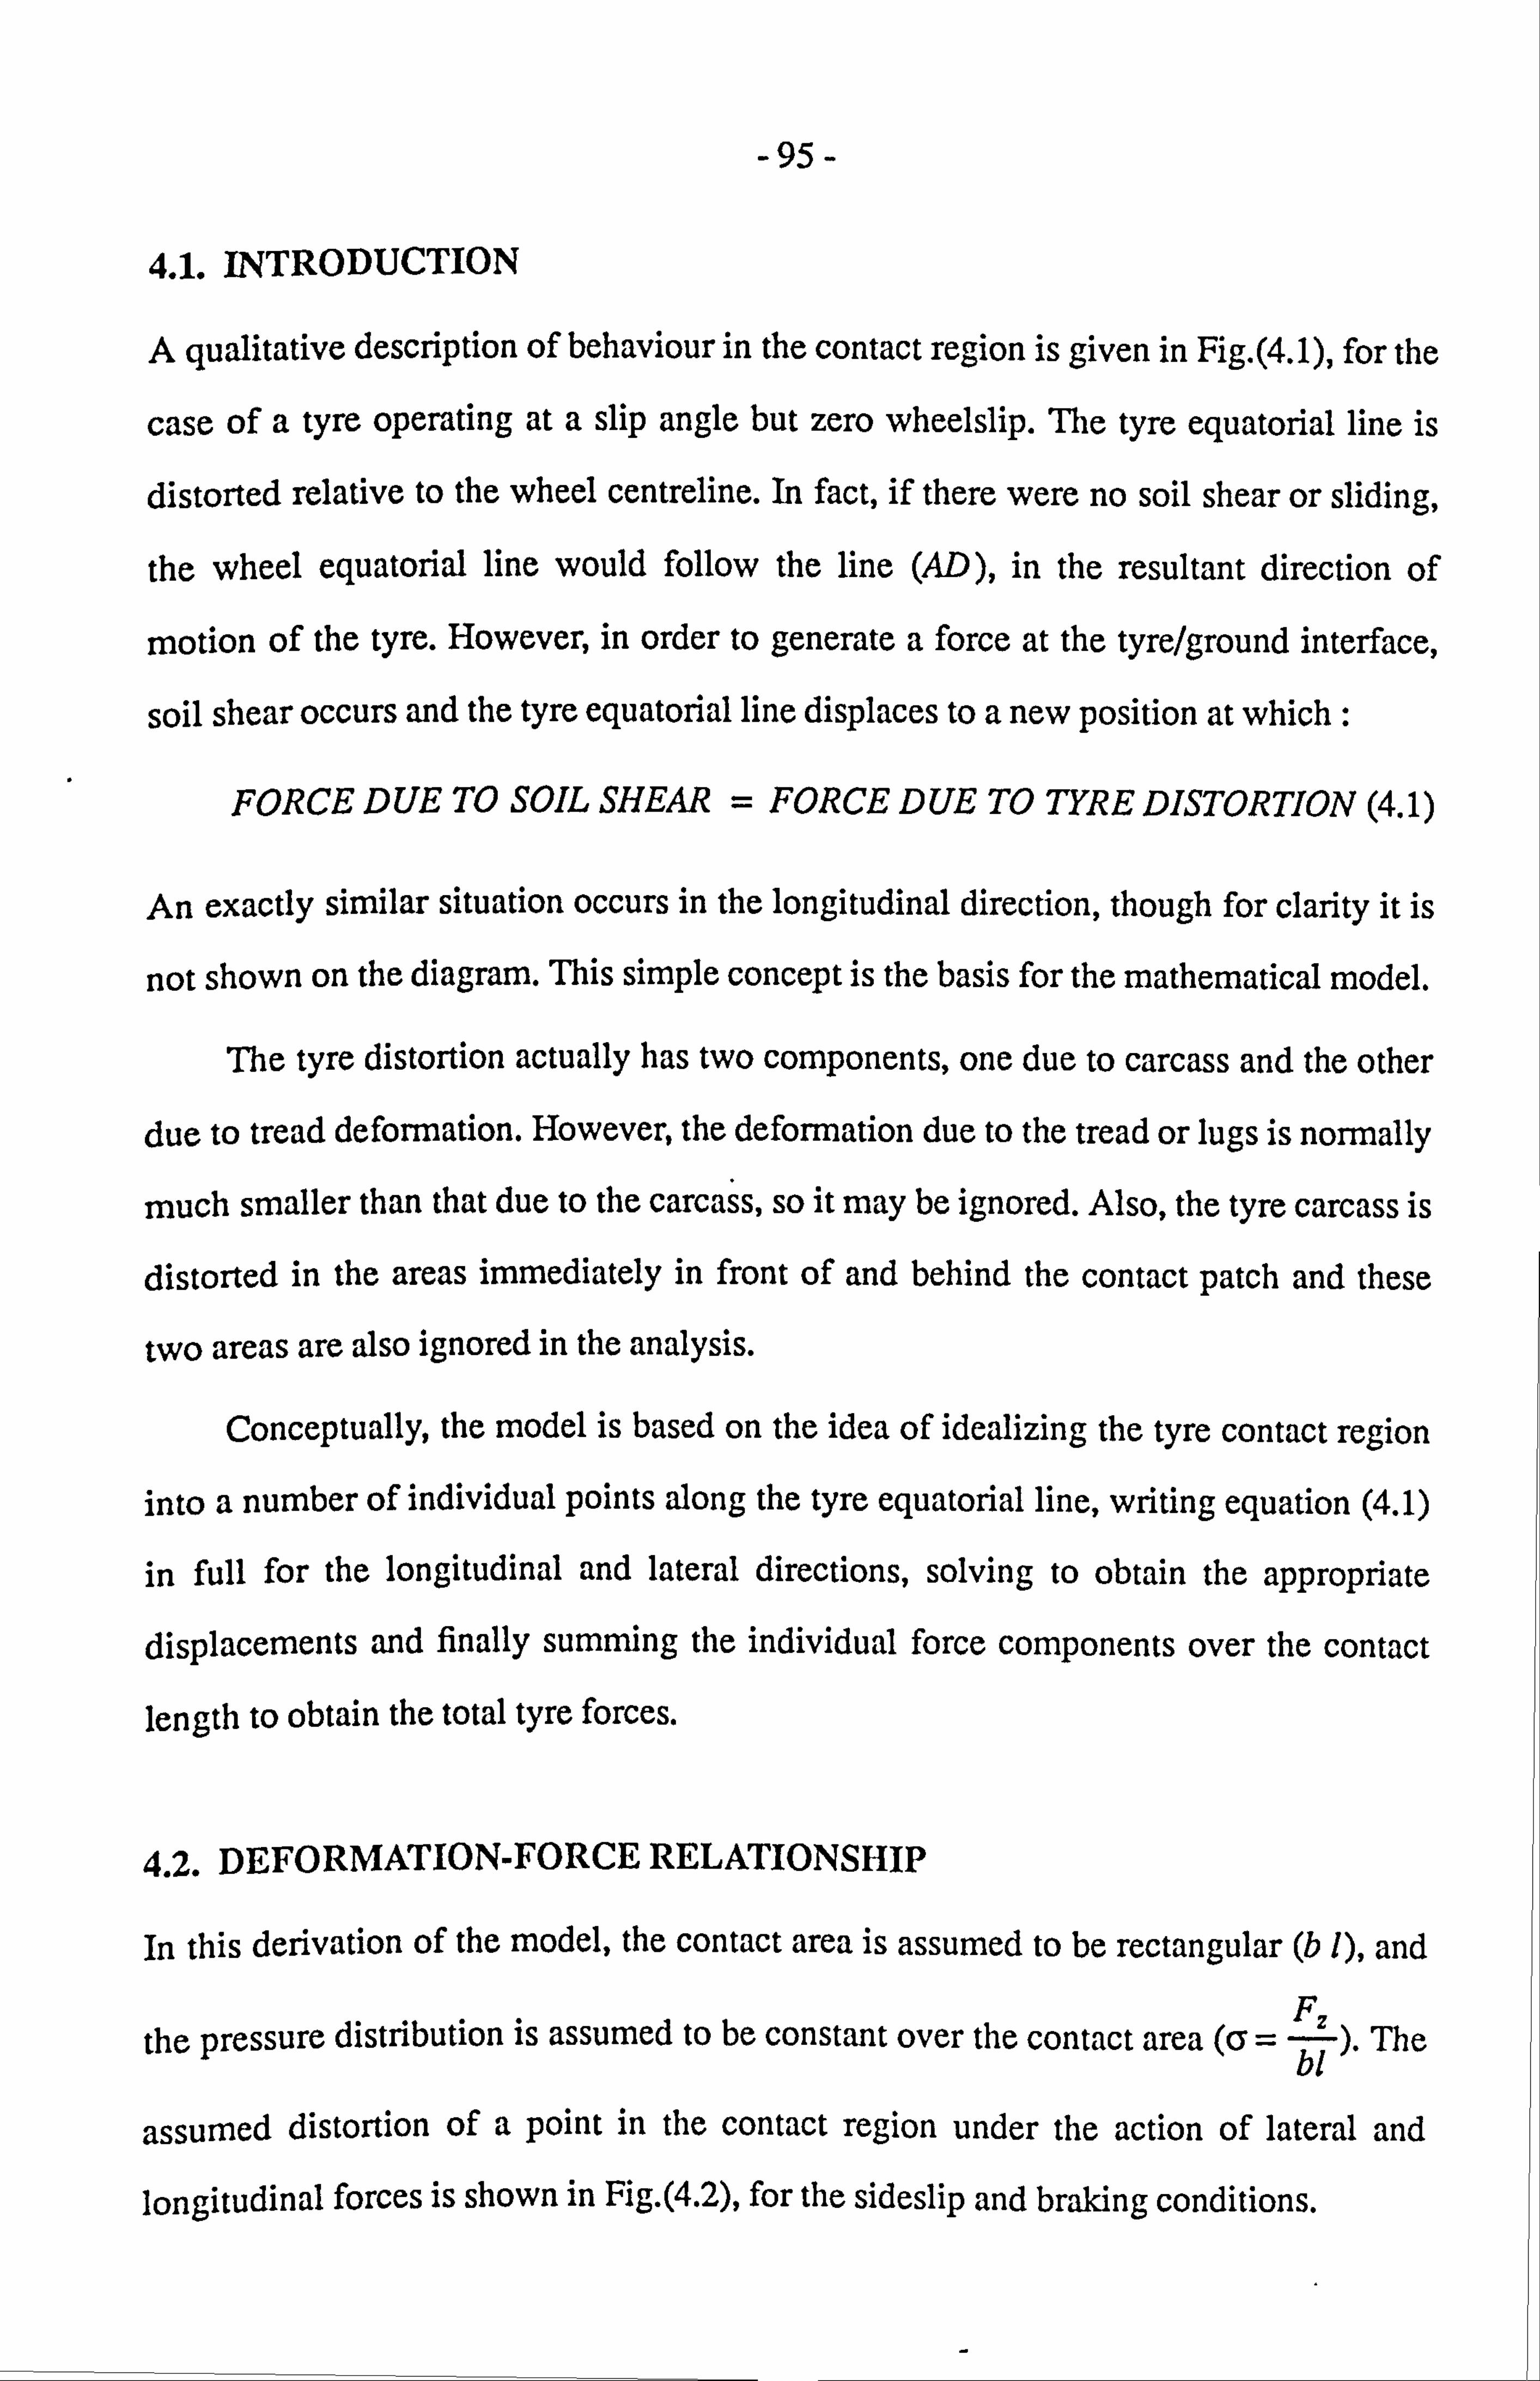
-95-
4.1. INTRODUCTION
A qualitative description of behaviour in the contact region is given in Fig. (4.1), for the
case of a tyre operating at a slip angle but zero wheelslip. The tyre equatorial line is
distorted relative to the wheel centreline. In fact, if there were no soil shear or sliding,
the wheel equatorial line would follow the line (AD), in the resultant direction of
motion of the tyre. However, in order to generate a force at the tyre/ground interface,
soil shear occurs and the tyre equatorial line displaces to a new position at which :
FORCE DUE TO SOIL SHEAR = FORCE DUE TO TYRE DISTORTION (4.1)
An exactly similar situation occurs in the longitudinal direction, though for clarity it is
not shown on the diagram. This simple concept is the basis for the mathematical model.
The tyre distortion actually has two components, one due to carcass and the other
due to tread deformation. However, the deformation due to the tread or lugs is normally
much smaller than that due to the carcass, so it may be ignored. Also, the tyre carcass is
distorted in the areas immediately in front of and behind the contact patch and these
two areas are also ignored in the analysis.
Conceptually, the model is based on the idea of idealizing the tyre contact region into a number of individual points along the tyre equatorial line, writing equation (4.1)
in full for the longitudinal and lateral directions, solving to obtain the appropriate
displacements and finally summing the individual force components over the contact
length to obtain the total tyre forces.
4.2. DEFORMATION-FORCE RELATIONSHIP
In this derivation of the model, the contact area is assumed to be rectangular (b 1), and f-
the pressure distribution is assumed to be constant over the contact area (Cr z ). The bl
assumed distortion of a point in the contact region under the action of lateral and
longitudinal forces is shown in Fig. (4.2), for the sideslip and braking conditions.
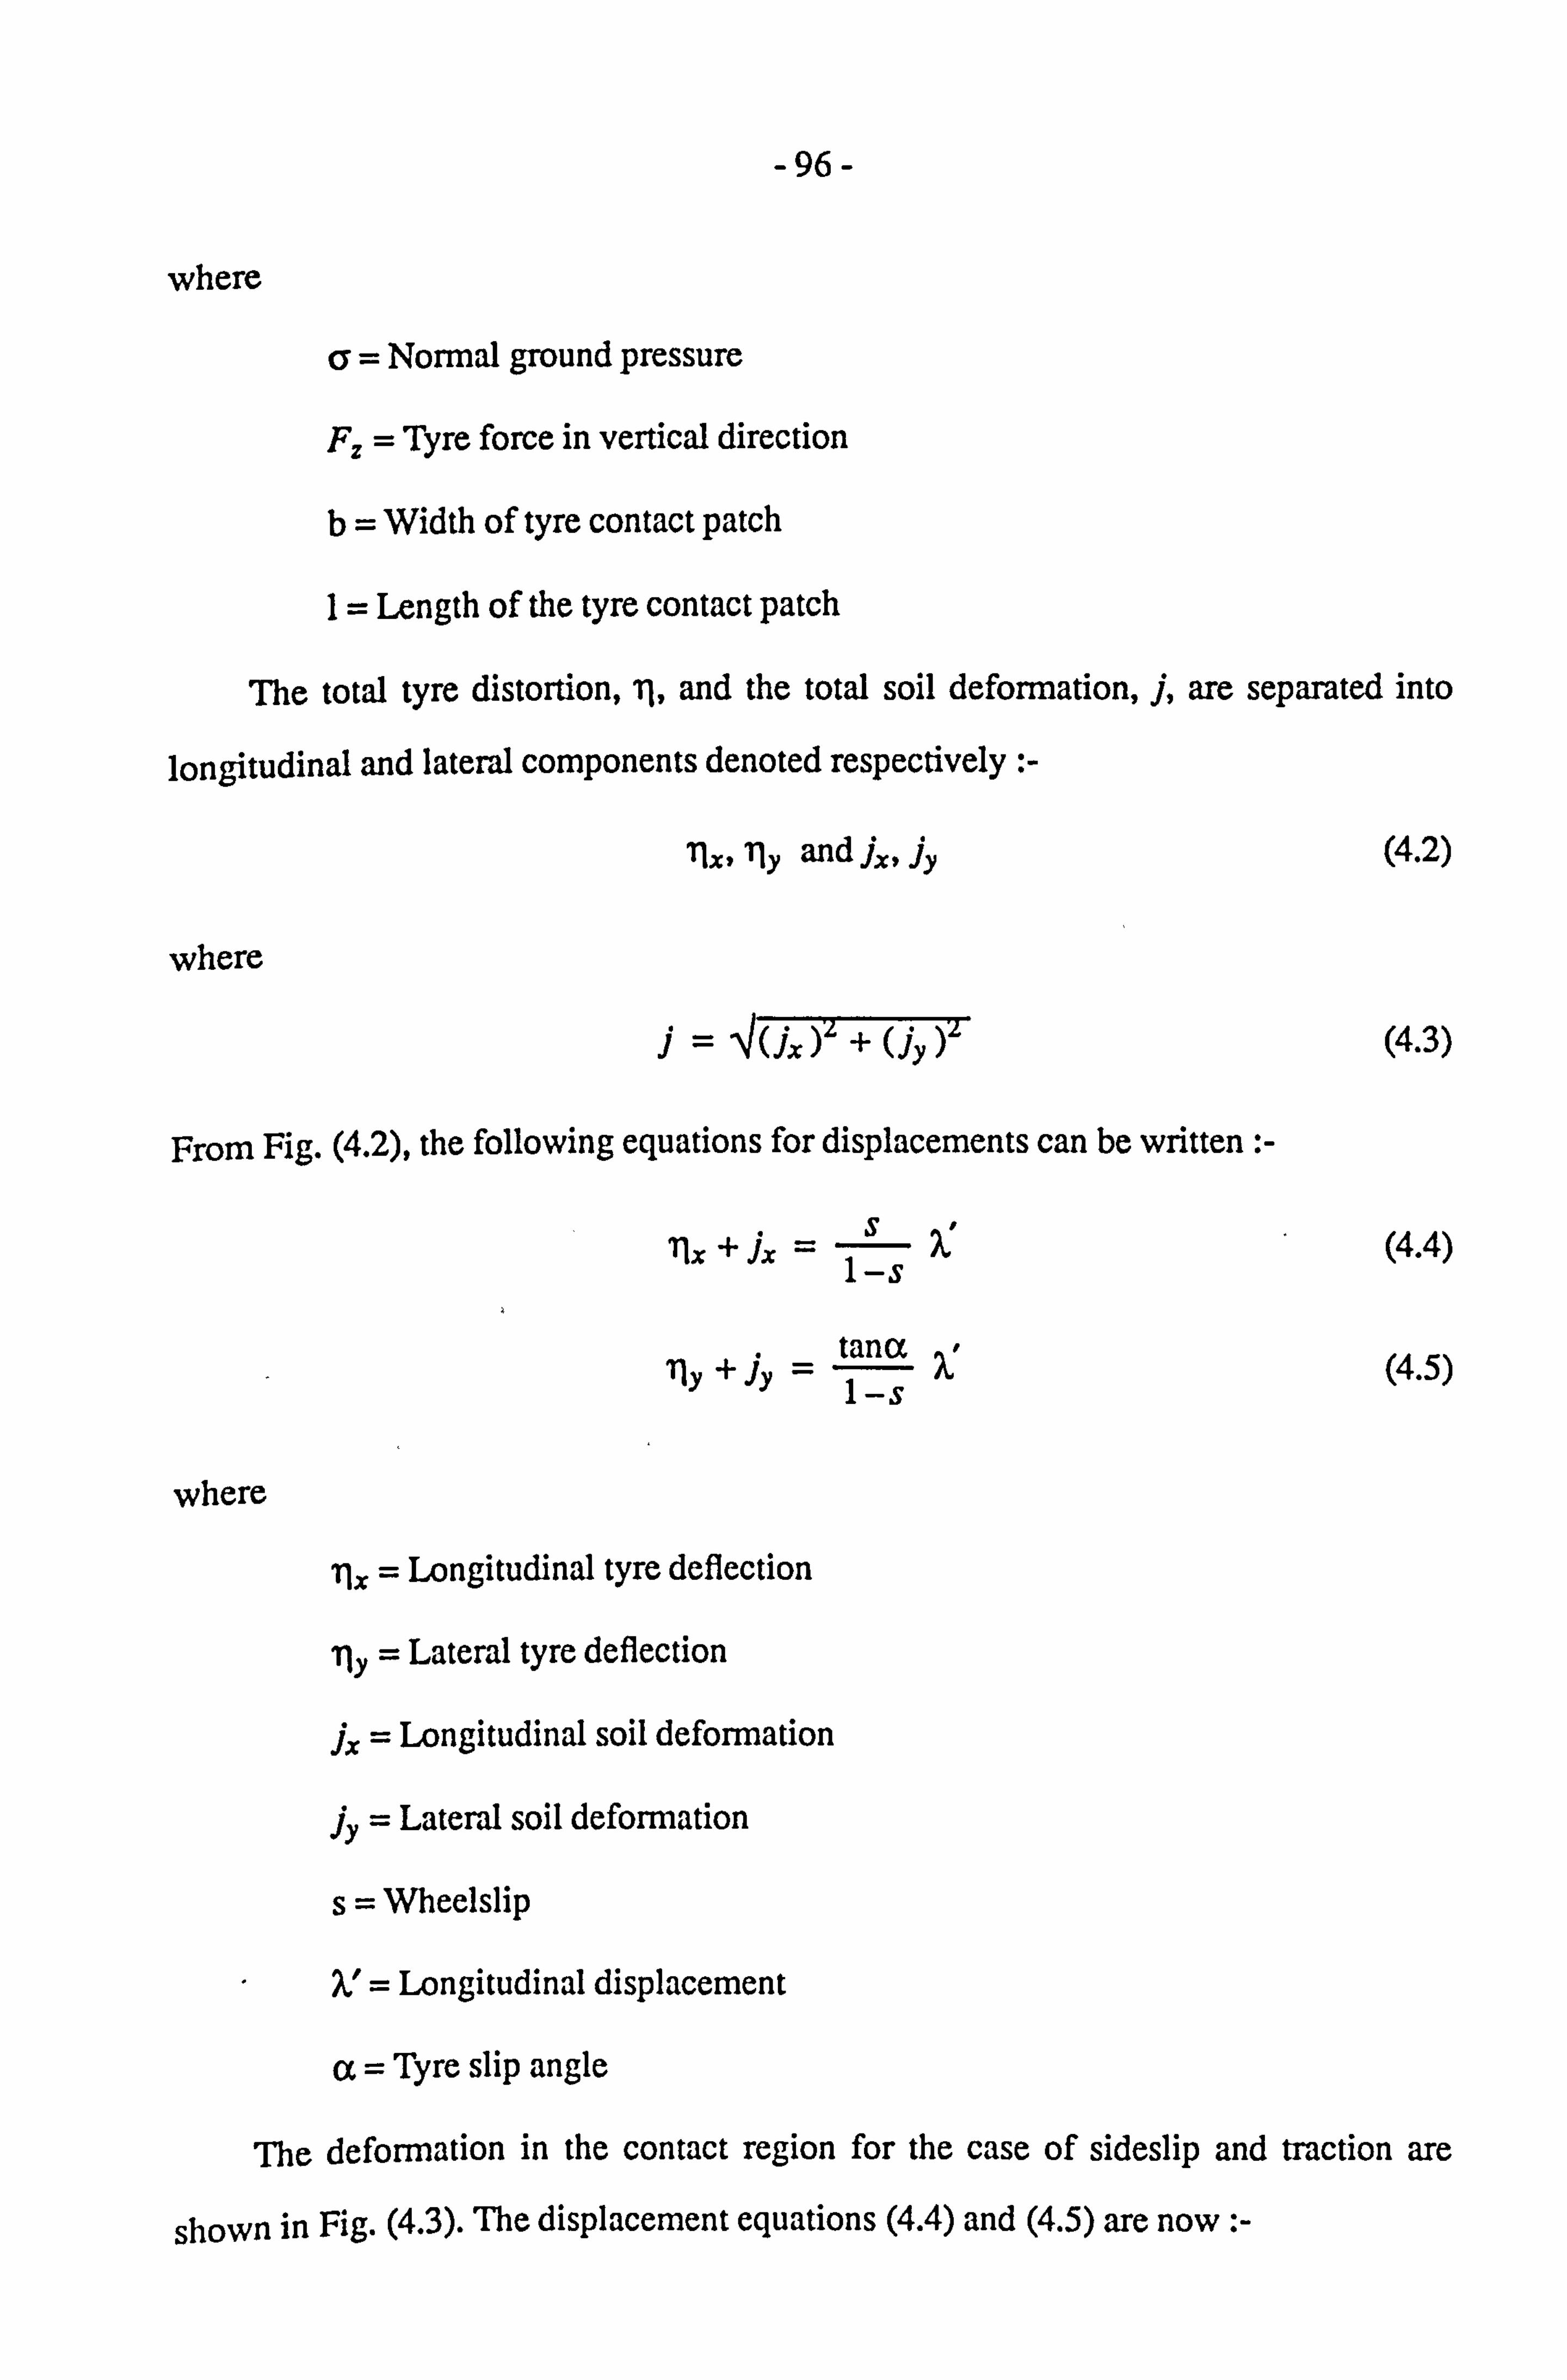
-96-
where
a= Normal ground pressure
Fý = Tyre force in vertical direction
b= Width of tyre contact patch
I= Length of the tyre contact patch
The total tyre distortion, il, and the total soil deformation, j, are separated into
longitudinal and lateral components denoted respectively :-
TI, ily and J,, jy
where
(4.2)
AT )", T (j, 7 (4.3)
From Fig. (4.2), the following equations for displacements can be written :-
llx + Jx s (4.4)
tana (4.5) Ily + jy = f- s
where
7jx = Longitudinal tyre deflection
ily Lateral tyre deflection
jx Longitudinal soil defonnation
jy = Lateral soil deformation
Wheelslip
V= Longitudinal displacement
a= Tyre slip angle
The deformation in the contact region for the case of sideslip and traction are
shown in Fig. (4.3). 'llie displacement equations (4.4) and (4-5) are now :-
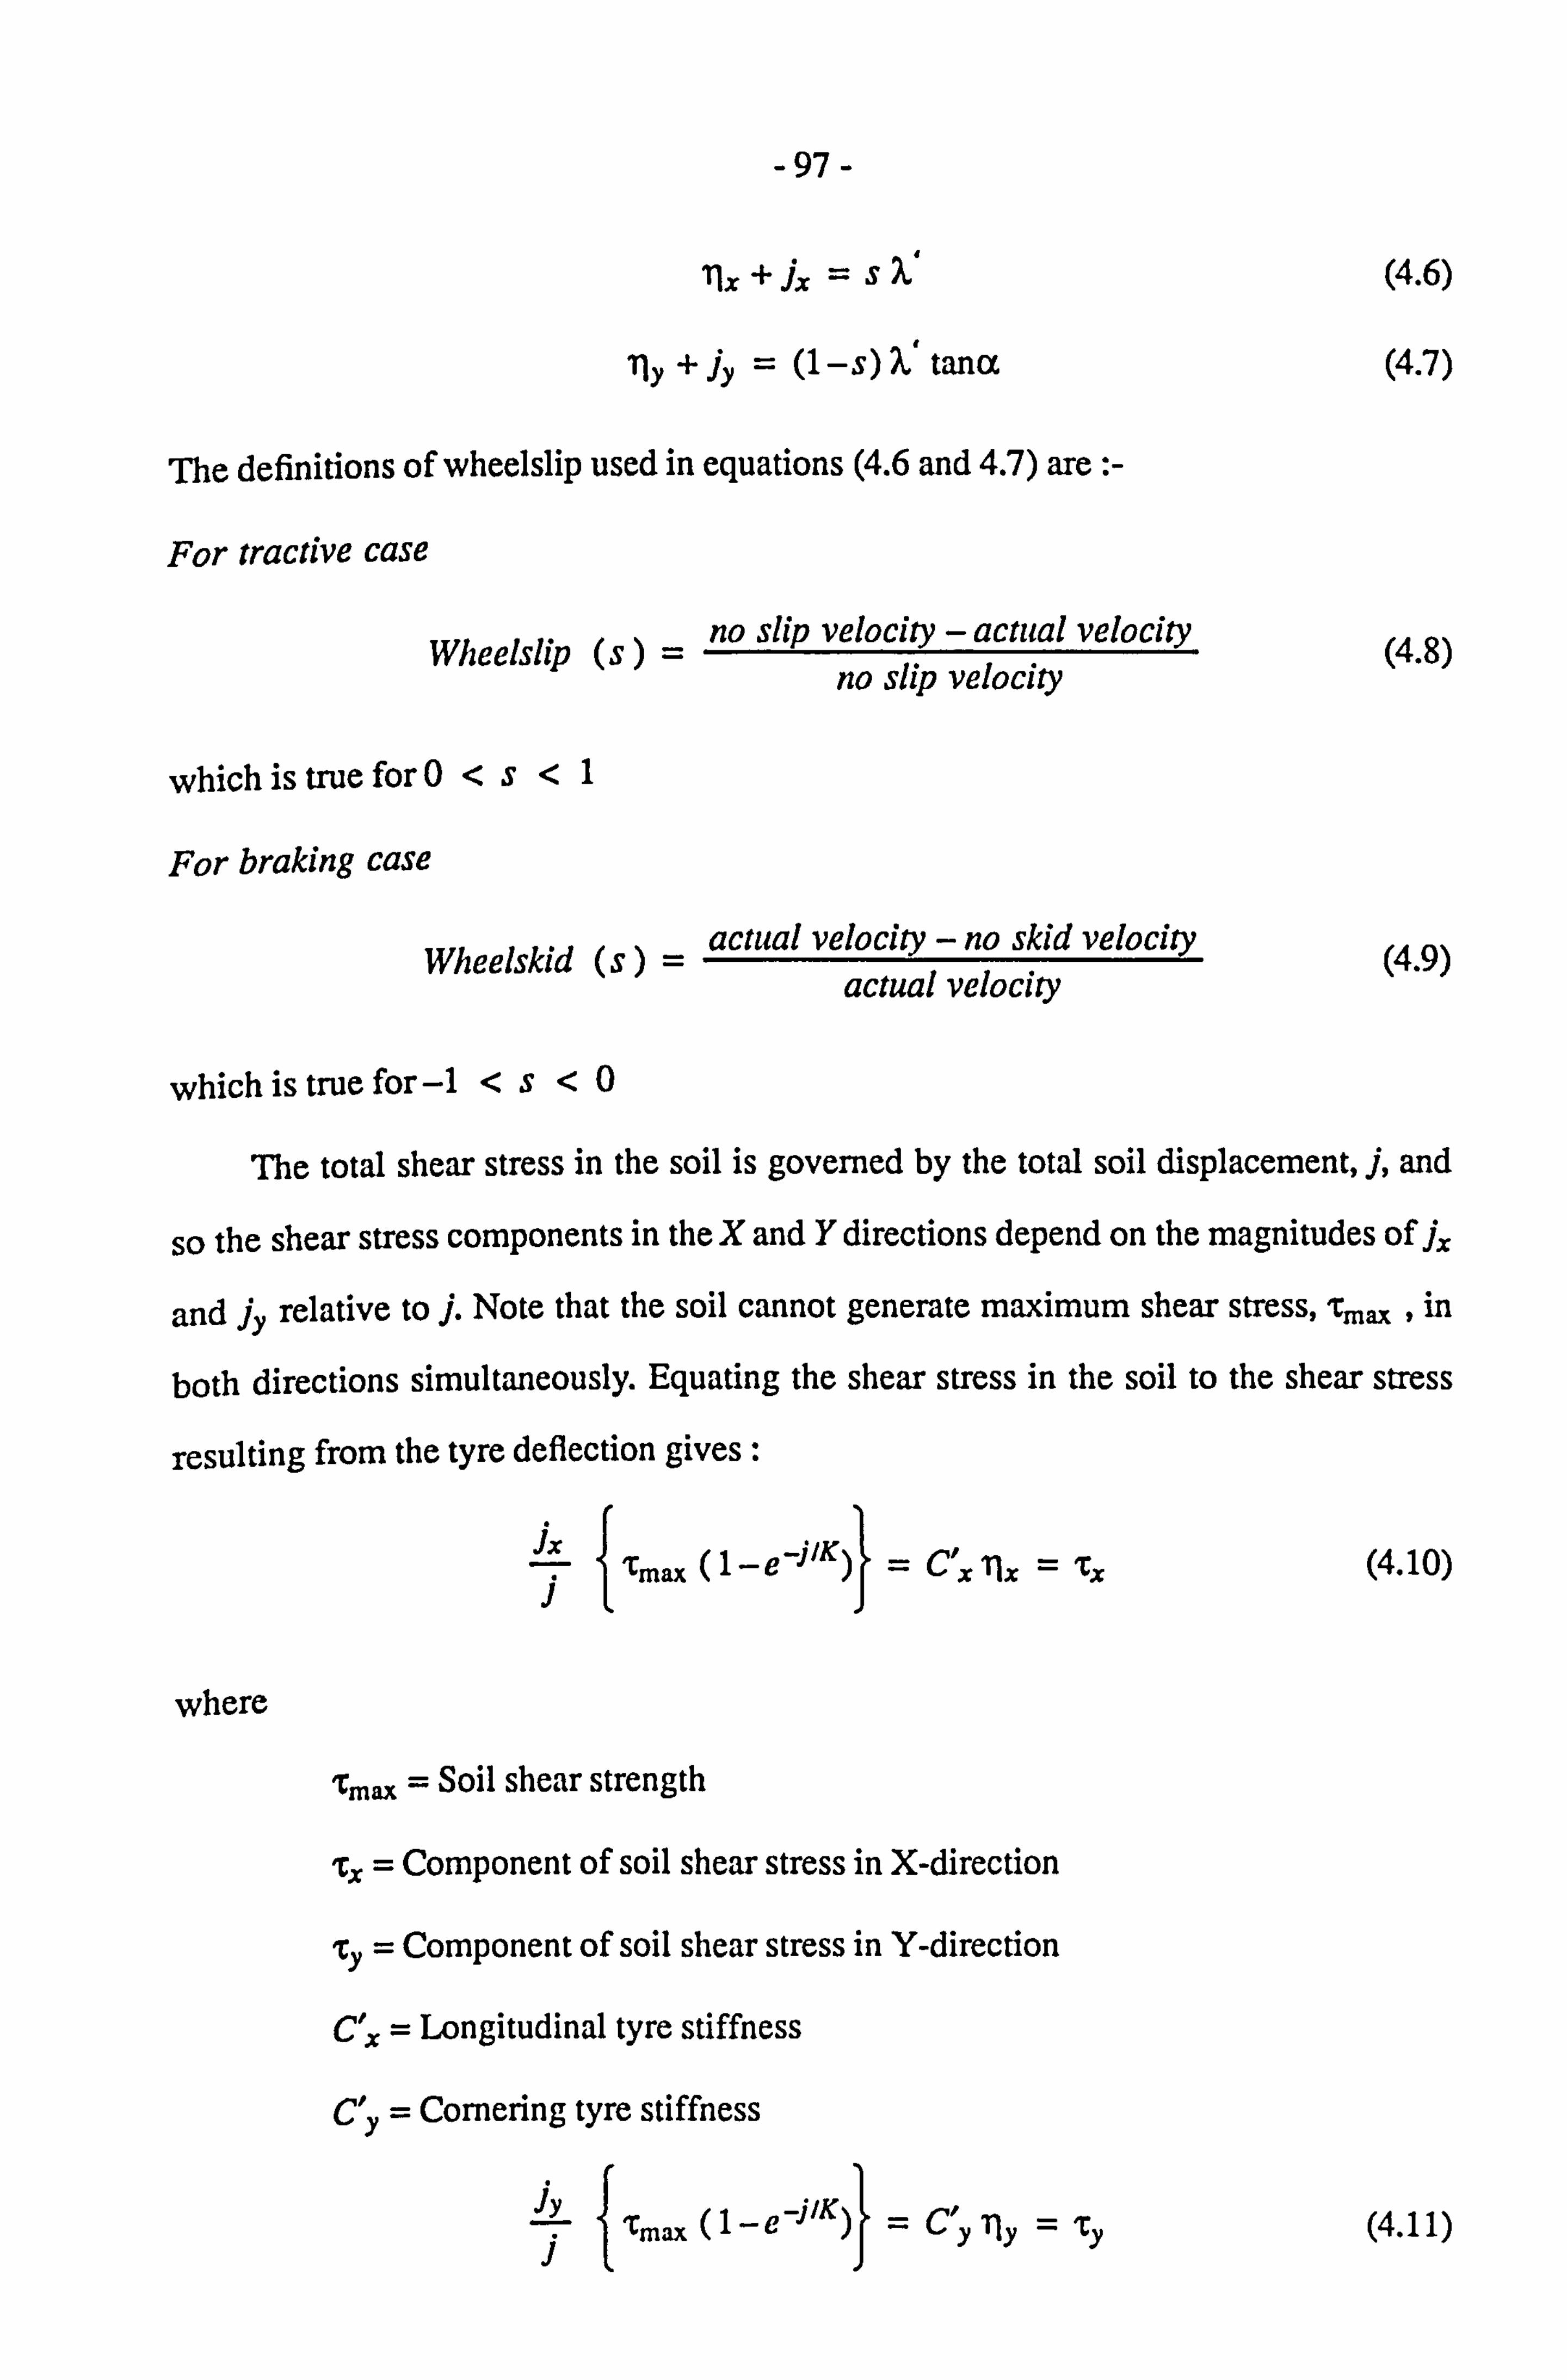
-97-
il', +A=s2, ' (4.6)
ly + jy = (1 - s) X' tanct (4.7)
The definitions of wheelslip used in equations (4.6 and 4.7) are :-
For tractive case
Wheelslip (s no slip velocity - actual velocity (4.8) no slip velocity
which is true for 0<s
For braking case
Wheelskid (s) = actual velocity - no skid velocity (4.9)
actual velocity
which is true for -1 <s
The total shear stress in the soil is governed by the total soil displacement, j, and
so the shear stress components in the X and Y directions depend on the magnitudes of j.,
and jy relative to j. Note that the soil cannot generate maximum shear stress, "Cmax , in
both directions simultaneously. Equating the shear stress in the soil to the shear stress
resulting from the tyre deflection gives:
ix
i, (1_e-jlK)i =c, x lIx = Tx (4.10)
where
= Soil shear strength
, rx = Component of soil shear stress in X-direction
, cy = Component of soil shear stress in Y-direction
C'.,, = Longitudinal tyre stiffness
C'y = Cornering tyre stiffness
jy e -j'K) , 71Y = Icy
iI= cy (4.11)
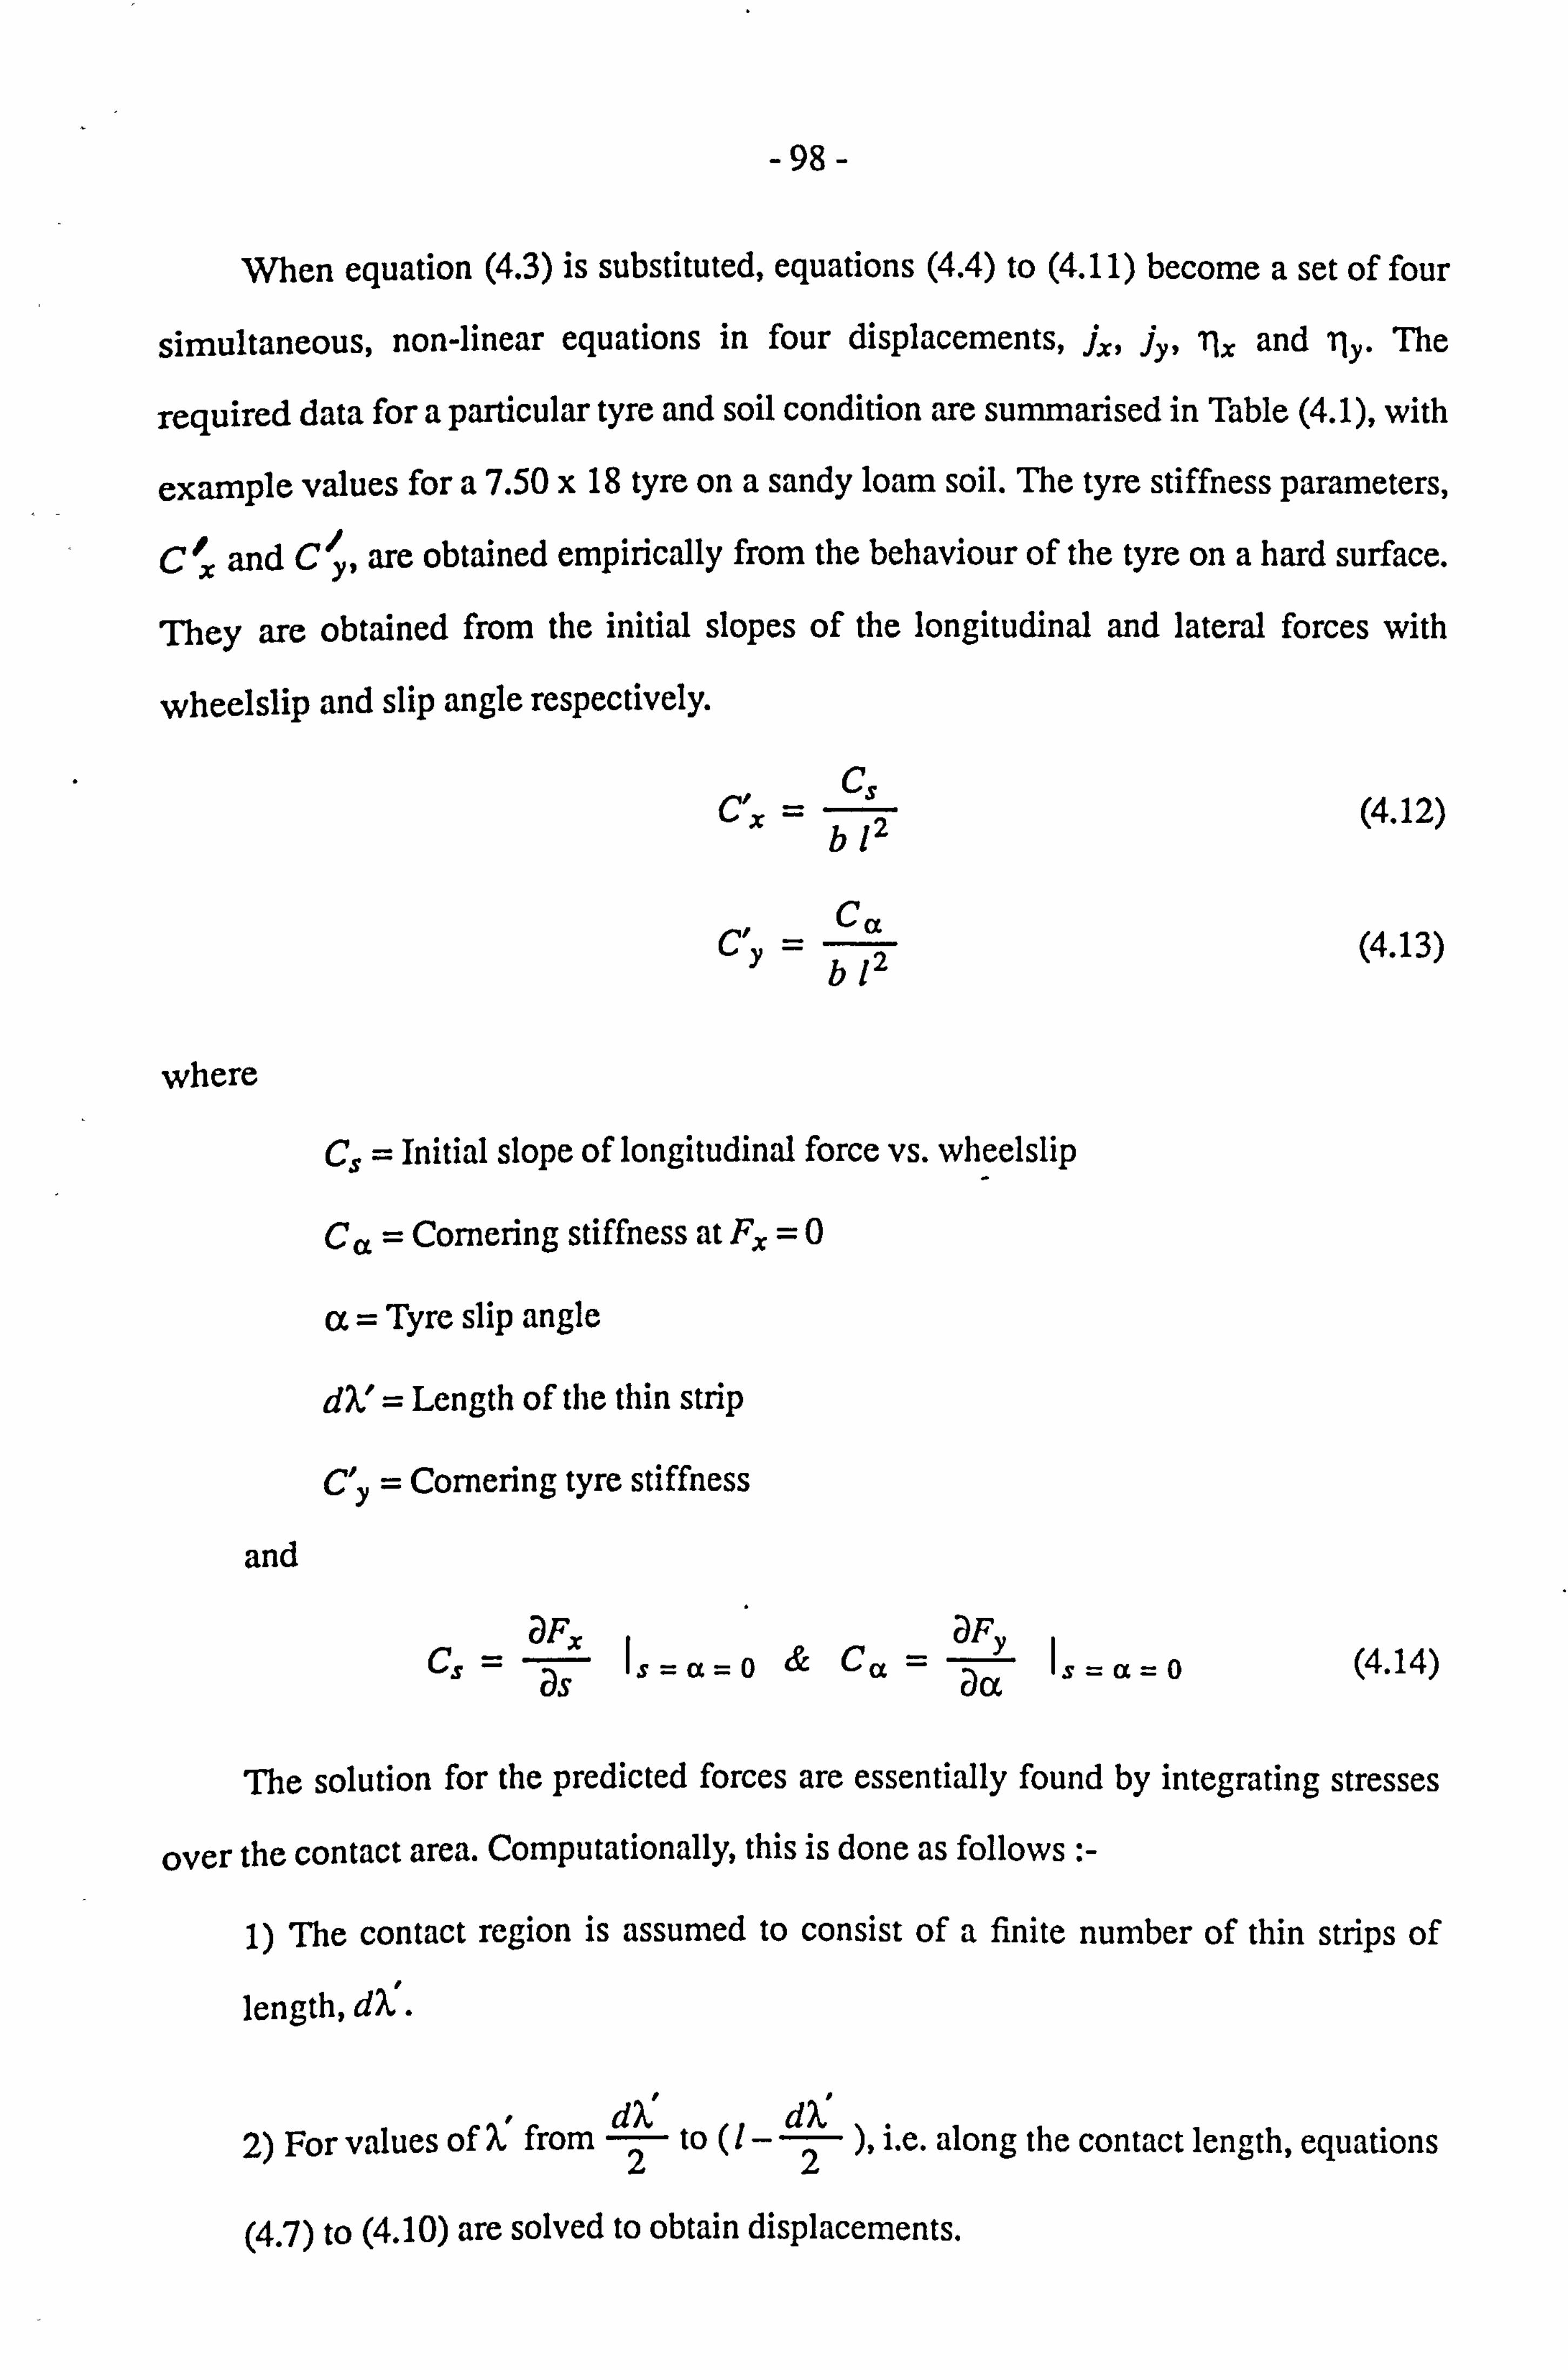
-98-
When equation (4.3) is substituted, equations (4.4) to (4.11) become a set of four
simultaneous, non-linear equations in four displacements, j.,,, jy, 71., and ily. The
required data for a particular tyre and soil condition are surnmarised in Table (4.1), with
example values for a 7.50 x 18 tyre on a sandy loam soil. The tyre stiffness parameters,
C ** and C/, are obtained empirically from the behaviour of the tyre on a hard surface. XY
They are obtained from the initial slopes of the longitudinal and lateral forces with
wheelslip and slip angle respectively.
clfx cs
b 12
Ca (4.13)
b 12
where
C., = Initial slope of longitudinal force vs. wheelslip
Cc, = Cornering stiffness at F, =0
(x = Tyre slip angle
dV = Length of the thin strip
C' Y= Cornering tyre stiffness
and
cs = DFx is
= cc 0&C,,, = DFy
s=a0 (4.14) Ds Da
The solution for the predicted forces are essentially found by integrating stresses
over the contact area. Computationally, this is done as follows --
1) The contact region is assumed to consist of a finite number of thin strips of
length, d
1 2) ForvaluesoO: from -!
ýX- to )j. e. along the contact length, equations 22
(4.7) to (4.10) are solved to obtain displacements.
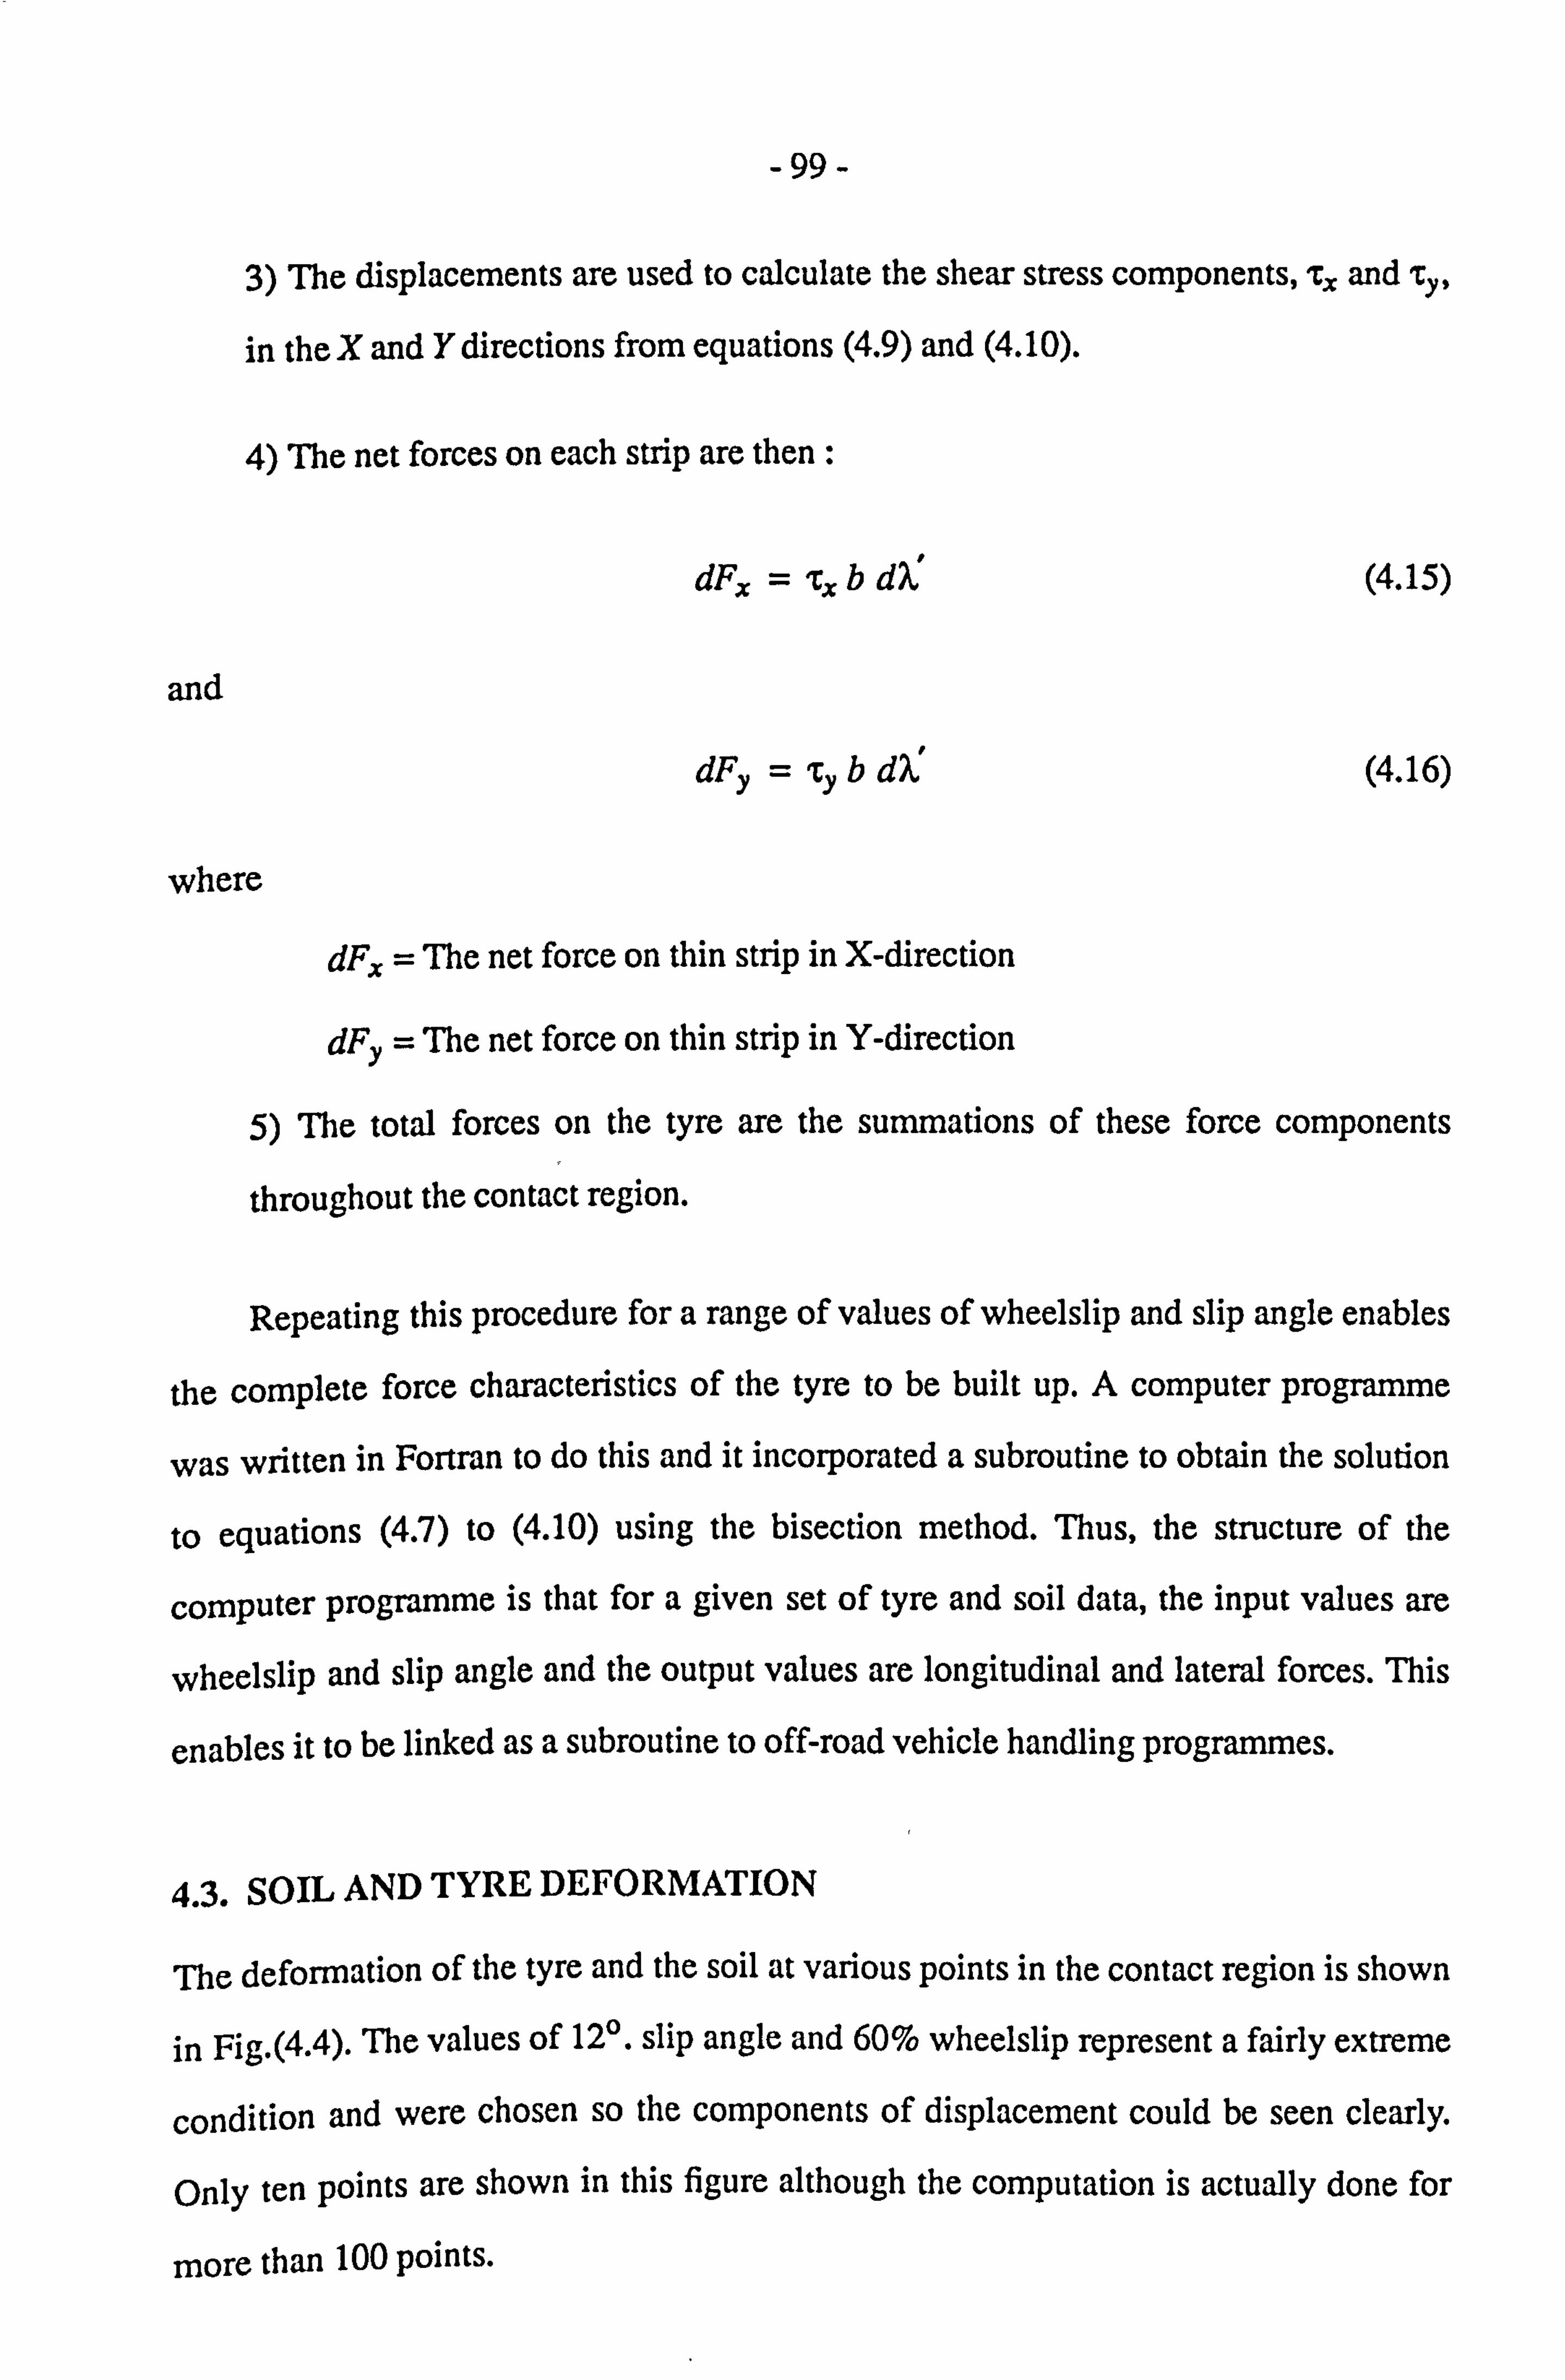
-99-
3) The displacements are used to calculate the shear stress components, r., and ry,
in the X and Y directions from equations (4.9) and (4.10).
4) The net forces on each strip are then :
dFx = -rx b
and
dFy = cy b
where
dF., = The net force on thin strip in X-direction
dFy = The net force on thin strip in Y-direction
(4.15)
(4.16)
5) The total forces on the tyre are the summations of these force components
throughout the contact region.
Repeating this procedure for a range of values of wheelslip and slip angle enables
the complete force characteristics of the tyre to be built up. A computer programme
was written in Fortran to do this and it incorporated a subroutine to obtain the solution
to equations (4-7) to (4.10) using the bisection method. Thus, the structure of the
computer programme is that for a given set of tyre and soil data, the input values are
wheelslip and slip angle and the output values are longitudinal and lateral forces. This
enables it to be linked as a subroutine to off-road vehicle handling programmes.
4.3. SOIL AND TYRE DEFORMATION
The deformation of the tyre and the soil at various points in the contact region is shown
in Fig. (4.4). The values of 12'. slip angle and 60% wheelslip represent a fairly extreme
condition and were chosen so the components of displacement could be seen clearly.
only ten points are shown in this figure although the computation is actually done for
more than 100 points.
-100-
4.4. EFFECT OF TYRE STIFFNESS PARAMETERS
The effect of the tyre stiffness parameters, C'x and C' Y, are shown in Fig-(4.5) and
Fig. (4.6). The lateral force coefficient is plotted against slip angle for the condition of
zero wheelslip with different values of C'x and C'y. In Fig. (4.6), the longitudinal force
coefficient is plotted against wheelslip for the condition of zero slip angle and the same
variation of C'x and C'y.
As the tyre stiffness parameters increase, the predicted tyre forces at a particular
wheelslip or slip angle also increase. In the limit as C'X and C'Y approach infinity, the
predicted forces approach those calculated in Grecenko's model [1975] which assumes
that the tyre is rigid compared to the soil.
4.5. EFFECT OF SOIL DEFORMATION MODULUS
The sensitivity of the model predictions to one of the important soil parameters, i. e. the
deformation modulus, K, is shown in Figs. (4.7) and (4.8). As the value of this modulus
parameter increases, the predicted forces decrease because the soil becomes very stiff at
lower values of soil deformation modulus.
It is interesting to note that as the soil parameters approach those of an "infinitely
stiff' soil, i. e. a non-deformable, road surface, the model becomes the same as that
originally proposed at the University of NEchigan Transportation Research Institute
[19701 and used by them for some vehicle handling studies.
As a general presentation of the results, Fig. (4.9) illustrates the influence of lateral
force coefficient as a function of slip angle and wheelslip. It also shows the relationship
between the longitudinal force coefficient and wheelslip with different slip angles. The
slip angle ranged between 0 to 45' and wheelslip ranged between 0 and 100%.
- 101 -
4.6. CONCLUDING REMARKS
(1) A model for the combined lateral and longitudinal force generation of an off-road
tyre has been presented. It is based on the idea that in the tyre/ground contact region the
forces due to soil shear must equal those due to tyre deflection at any point.
(2) Predicted force relationships with slip angle and wheelslip agrees qualitatively
with those obtained from measured data.
(3) The model is in a form which is suitable for inclusion in vehicle models to
predict handling and steering behaviour.
(4) The model agree quantitatively with the model predicted by Grecenko. The
comparison and the model accuracy are presented in Chapter 6 later.
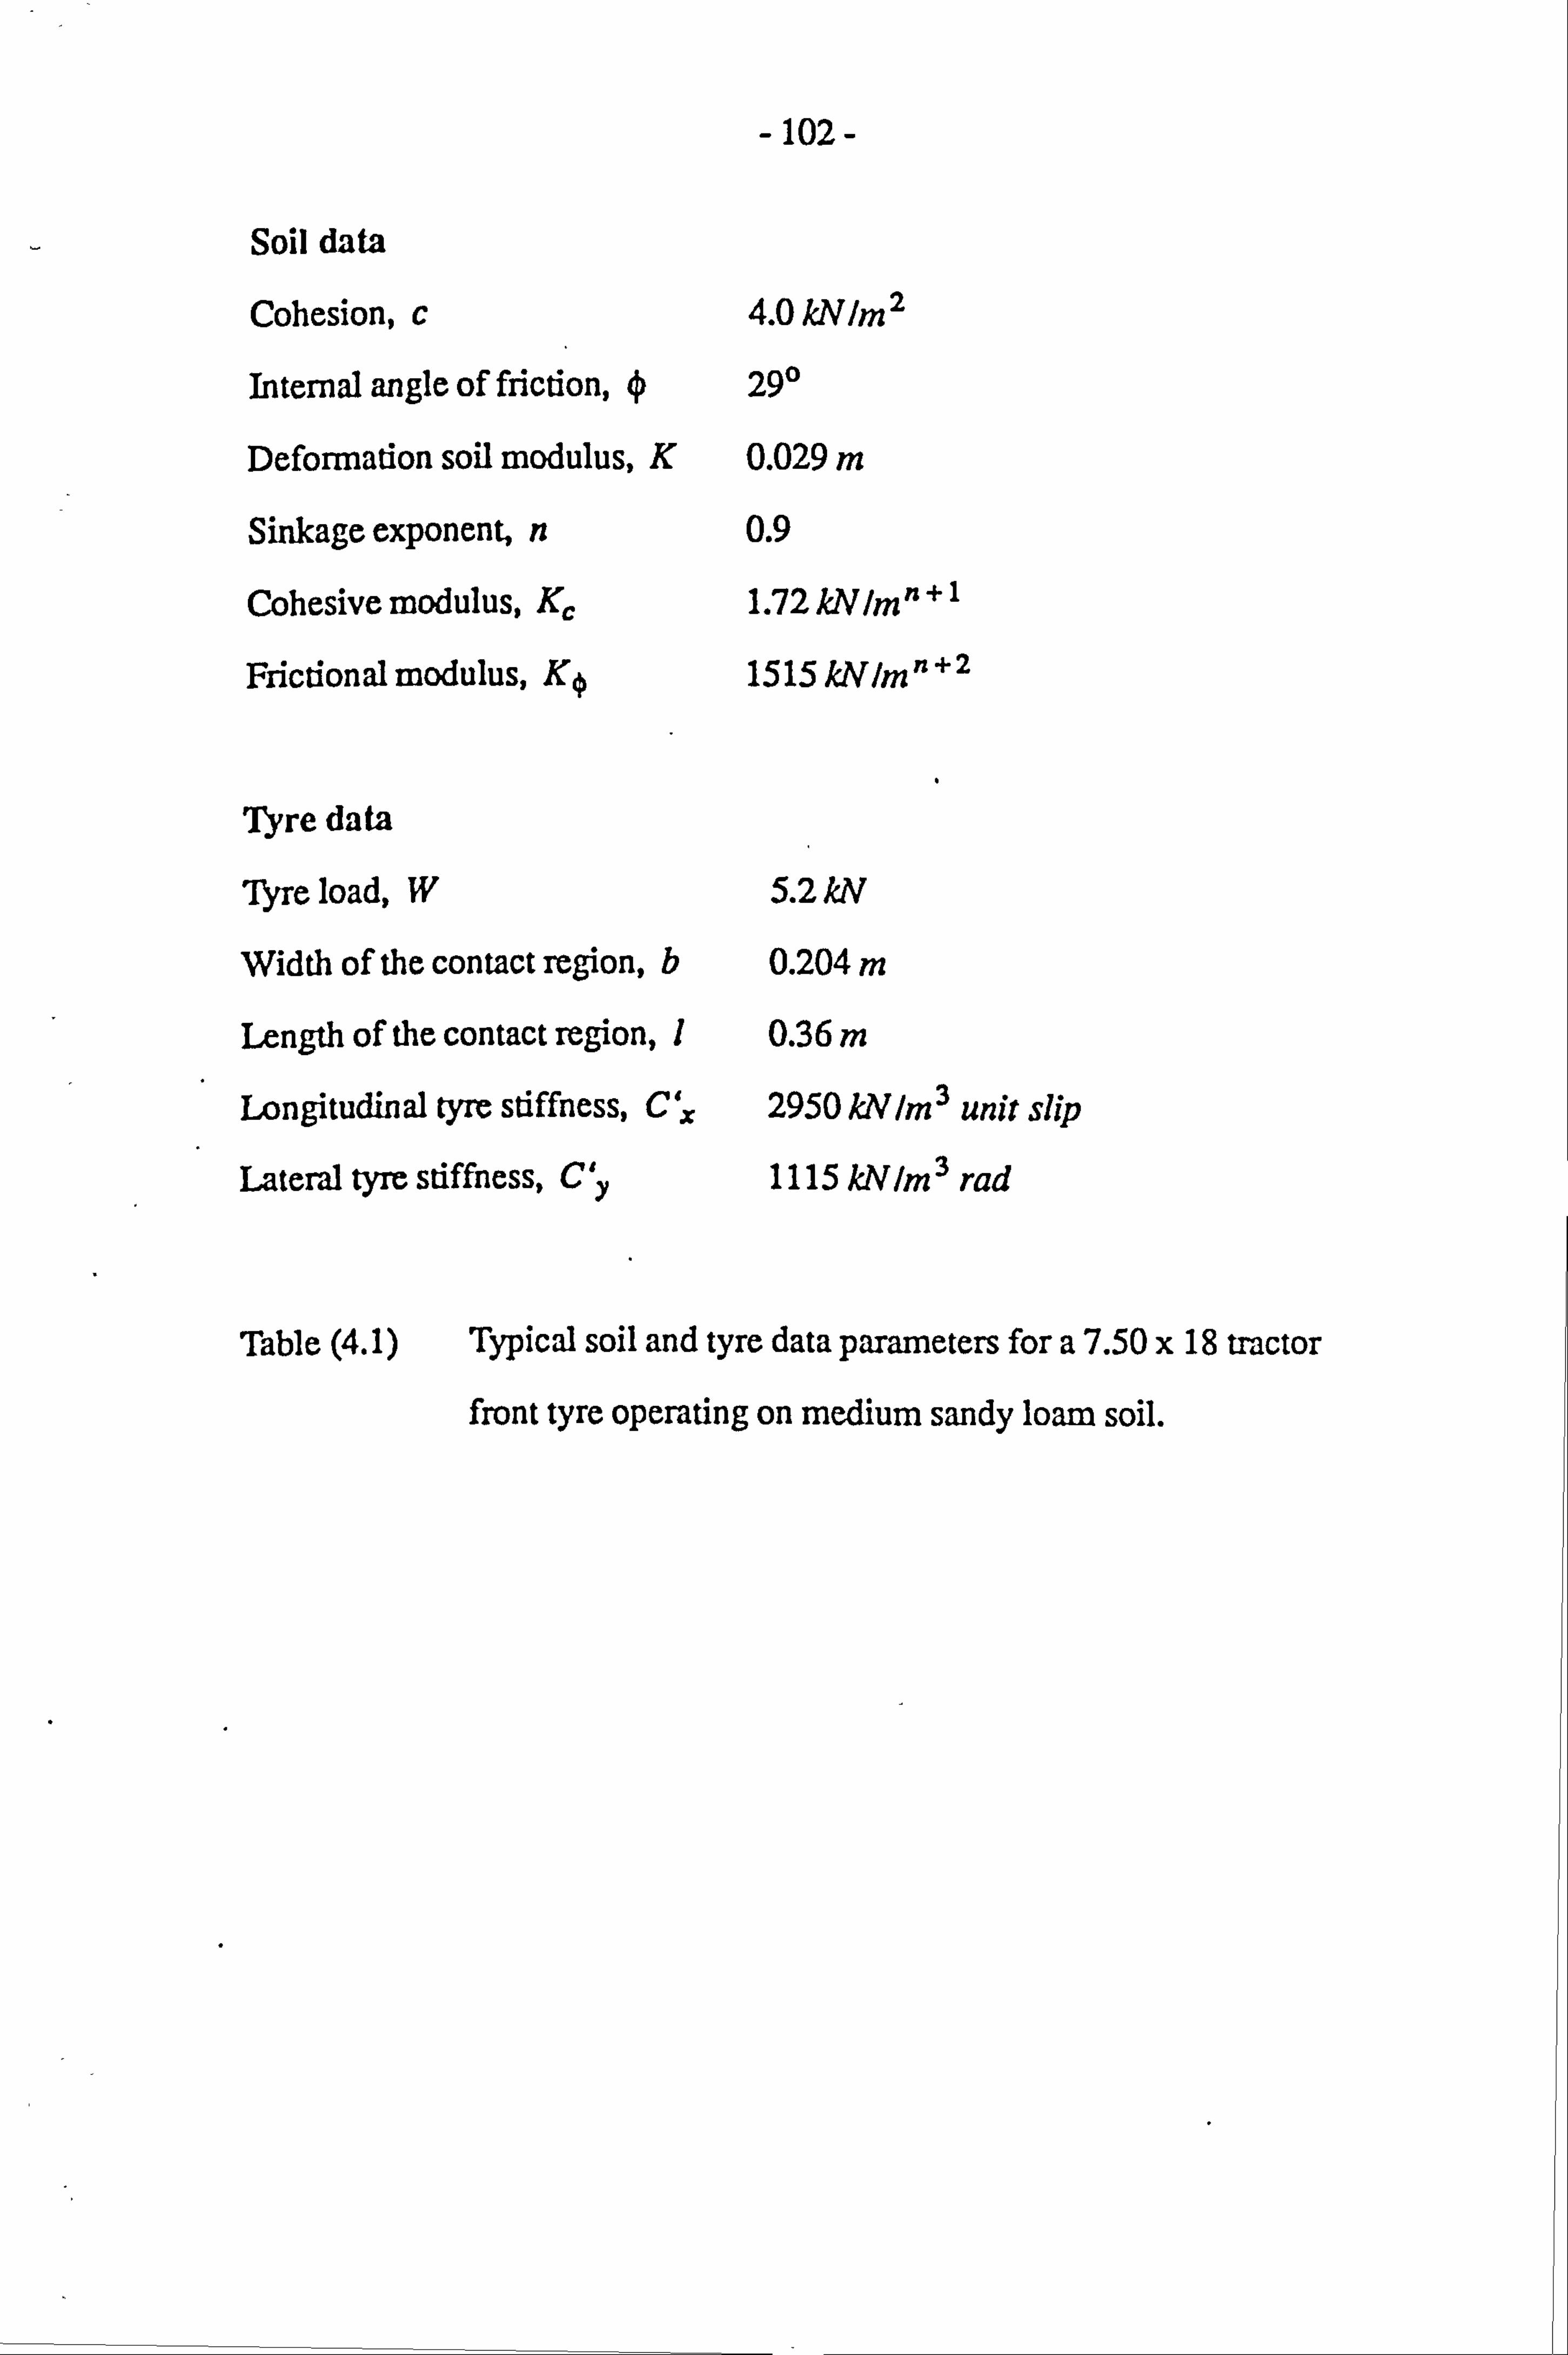
-102-
Soil data
Cohesion, c 4.0 kNIM 2
Internal angle of friction, 290
Deformation soil modulus, K 0.029 m
Sinkage exponent, n 0.9
Cohesive modulus, K, 1.72kNlmn+l
Frictional modulus, KO 1515 kNIM n+2
Tyre data
Tyre load, W 5.2 kiV
Width of the contact region, b 0.204 m
Length of the contact region, 1 0.36 m
Longitudinal tyre stiffness, C,, 2950 kN IM 3 unit slip
Lateral tyre stiffness, Cy 1115 kNIM 3 rad
Table (4.1) Typical soil and tyre data parameters for a 7.50 x 18 tractor
front tyre operating on medium sandy loam soil.
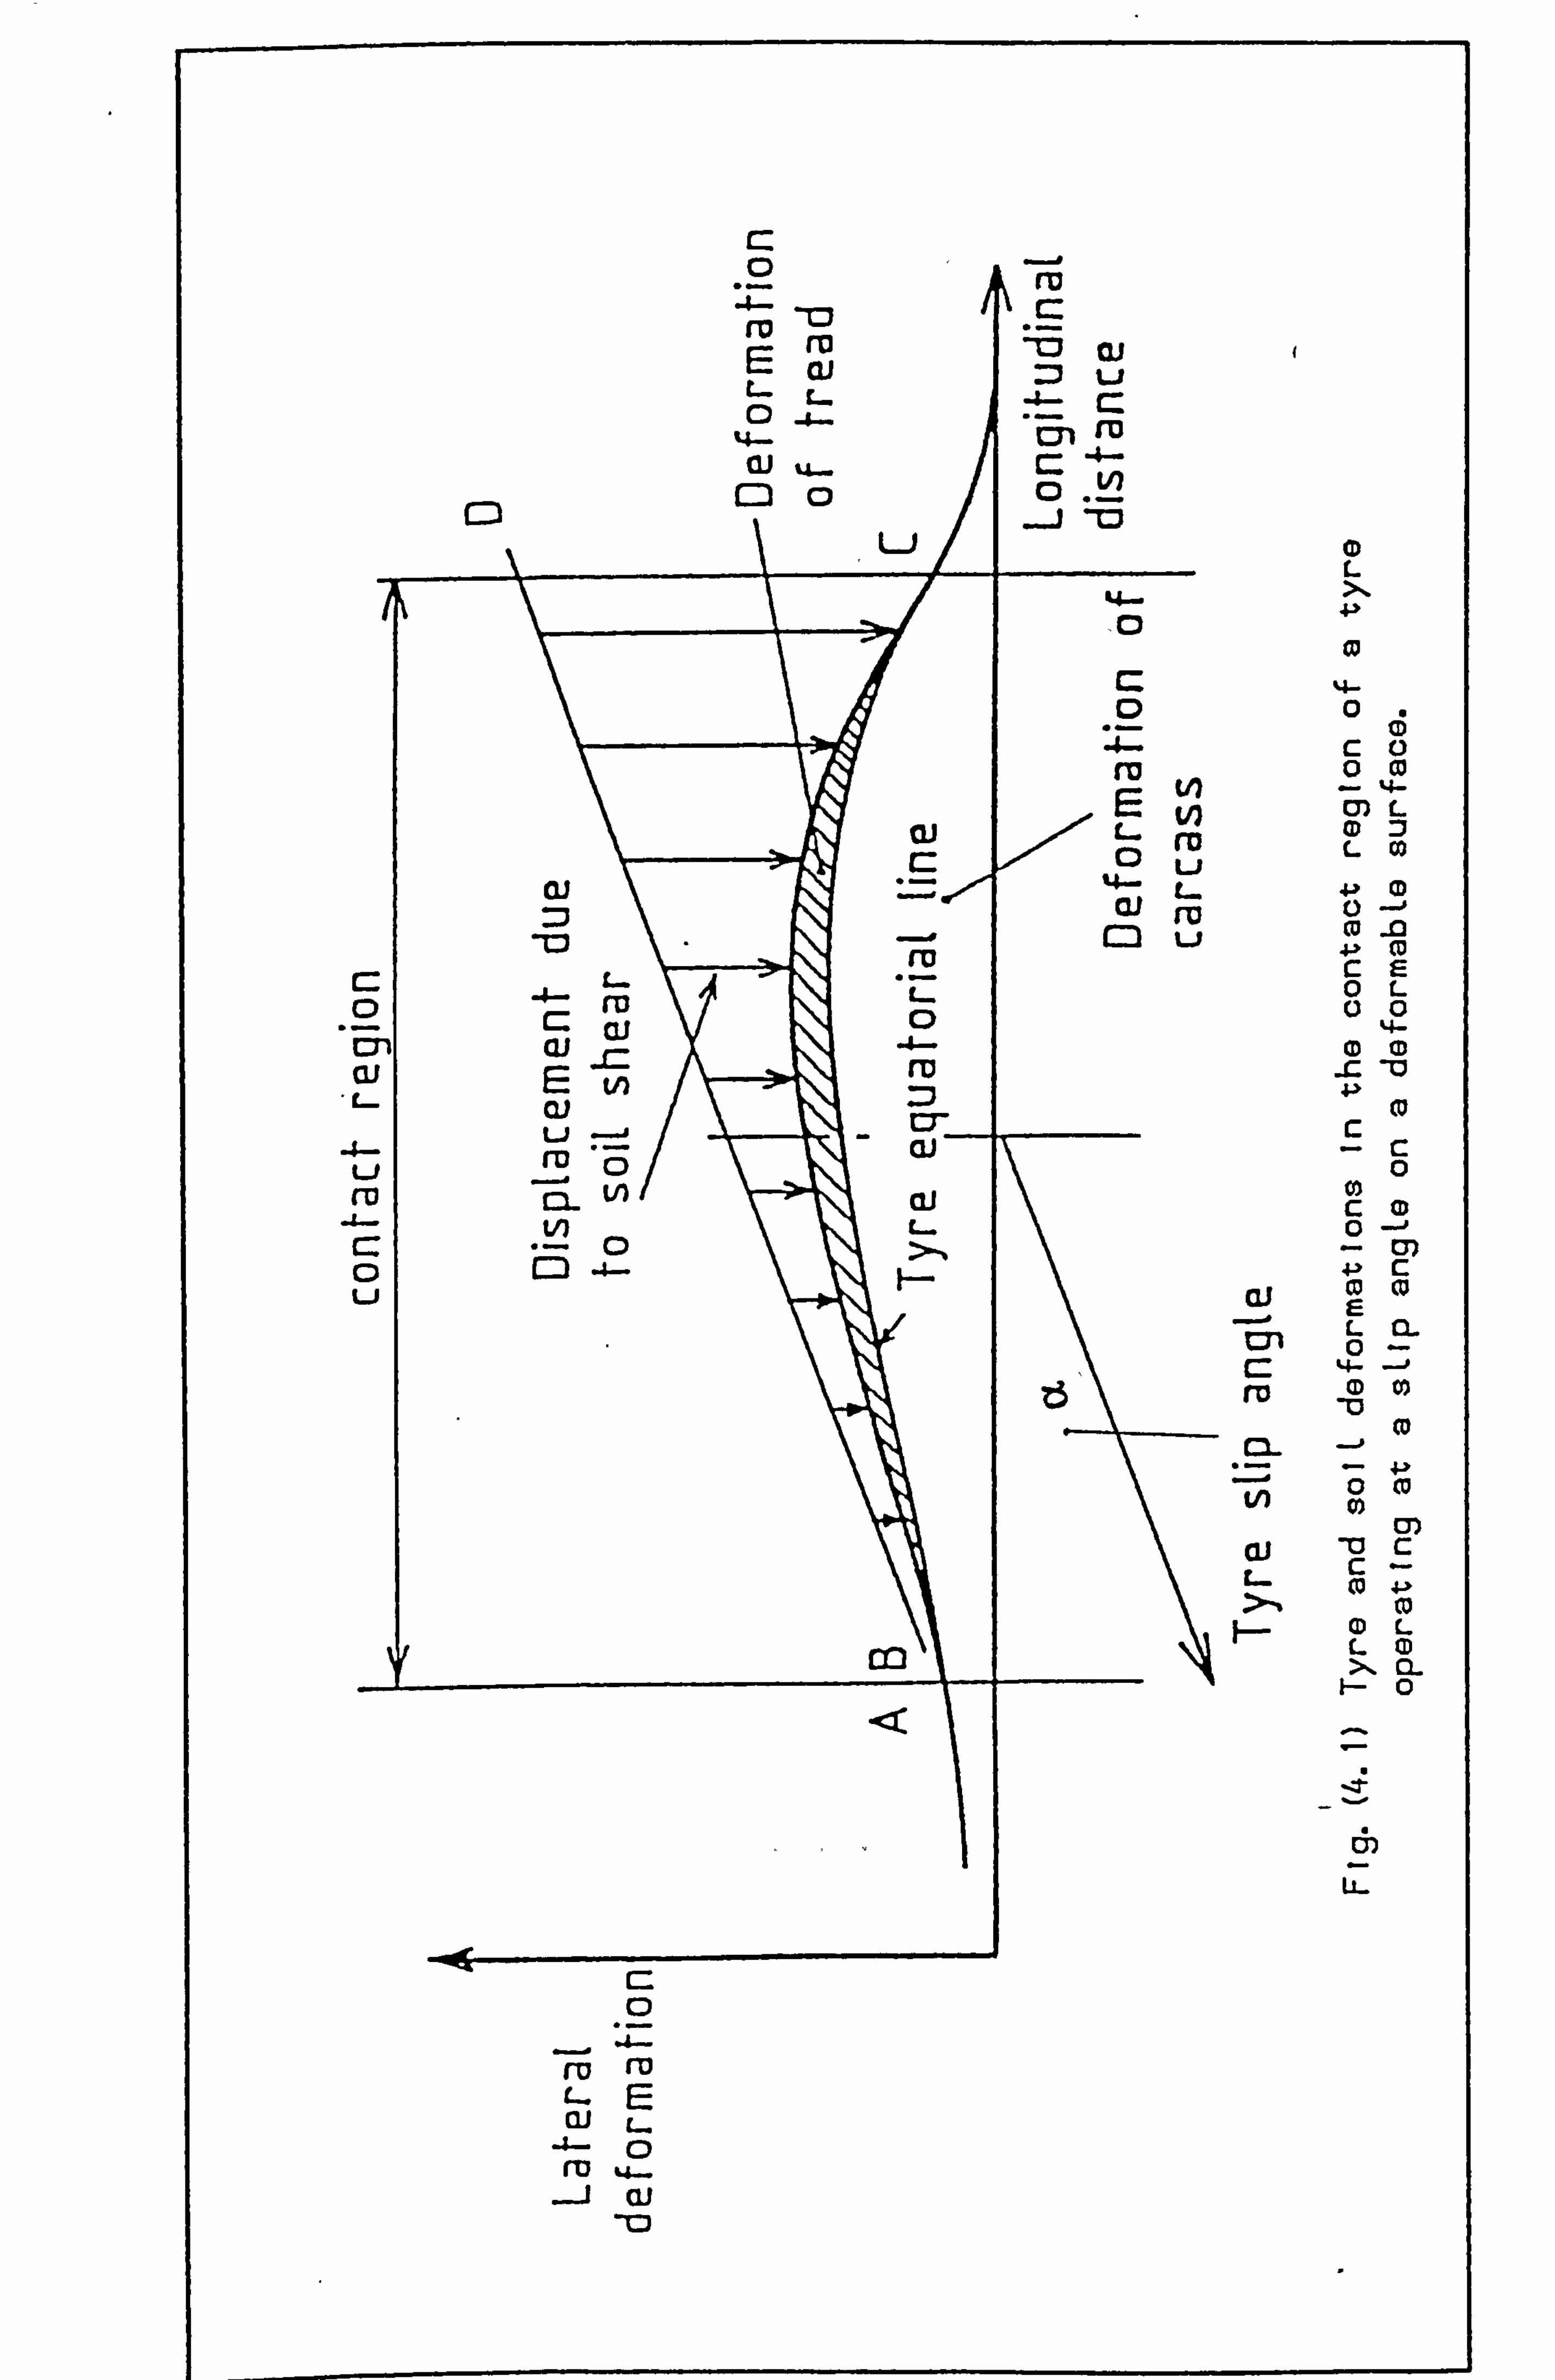
C: 0
.a cil
Li ro
. J. - C: 0 u
D
4- ru C CU cu r- E in cu U
C: ) LA
V) 0
ED
M 0
ru ru f-
13J -&. - 0 f'o Ls--
cli -0
c 0 , -0
-13 r_ ro rD -, 1: ) (1)
ai C: )
%4-- 01 M CIJ r -4-- V) c2 -
--. 1 -13
44--
,0
(1) L. rc) LJ
Li
cii
cii L-
Z5
co
a] cn C ra CL
V) cli
0 L
(0
%4- 0
L0
(D
0L
c 0
0 c0 0
C (0 0 E L OL
M 0) -13
0) m
-io c C- (0 4->
0 (D L L CD X ci.
1-- 0
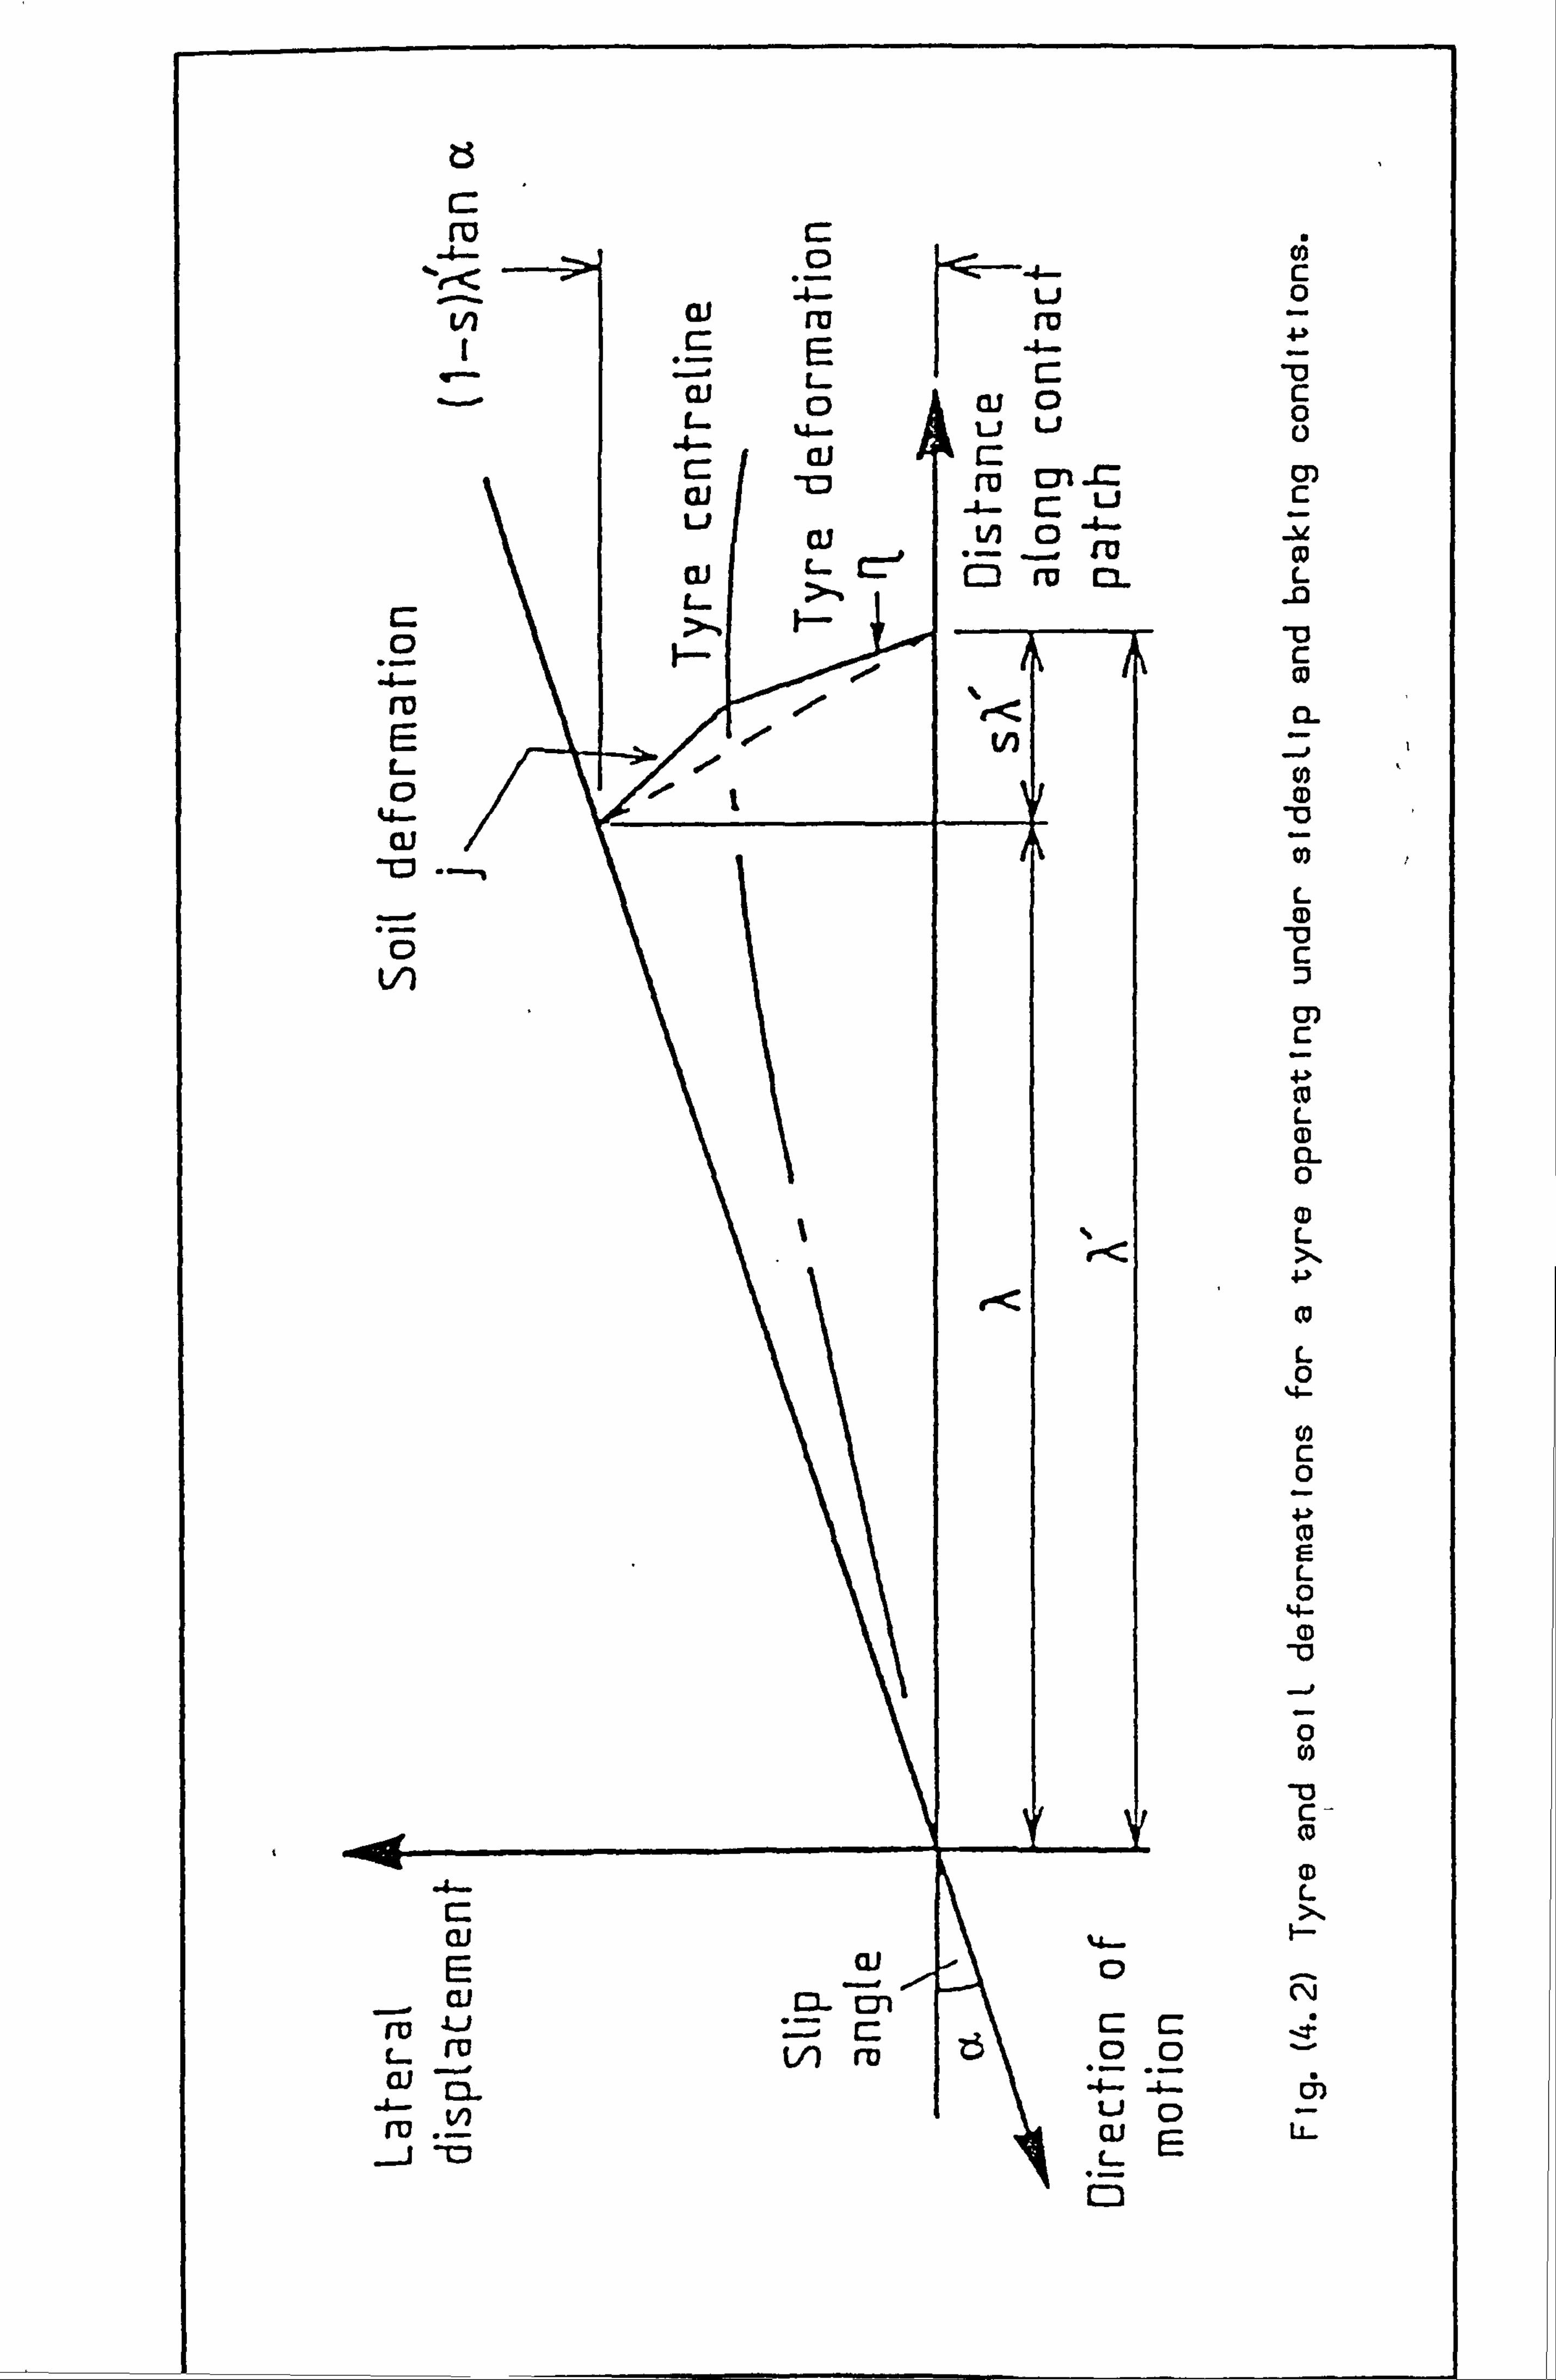
F-'ý C ru
v)
C: 0
ru E L. 0
tj - cu
L4
ci E= cu
ru J-J E- ru UJ r . A. - . 3- ru
r- 0
ai iý_-
ru C: E ai 0
cli C: a) Li cu CLJ
. b
CU
C: ru
-<-. 4- Li ro
-4- C:
al 0 U
ru cn C: U 1: 1 -&-- ru
CD m 0-
4<
(I)
Z5
0
C: 0
U cu c
D
0; c 0
cu -12
CL Z
(0
0)
M
M c
L (D Ci- 0
CD L X 4->
(0
L 0
14-
(0 r_ 0
(U E L
c (D
(D L X
F-
C\j
--: r
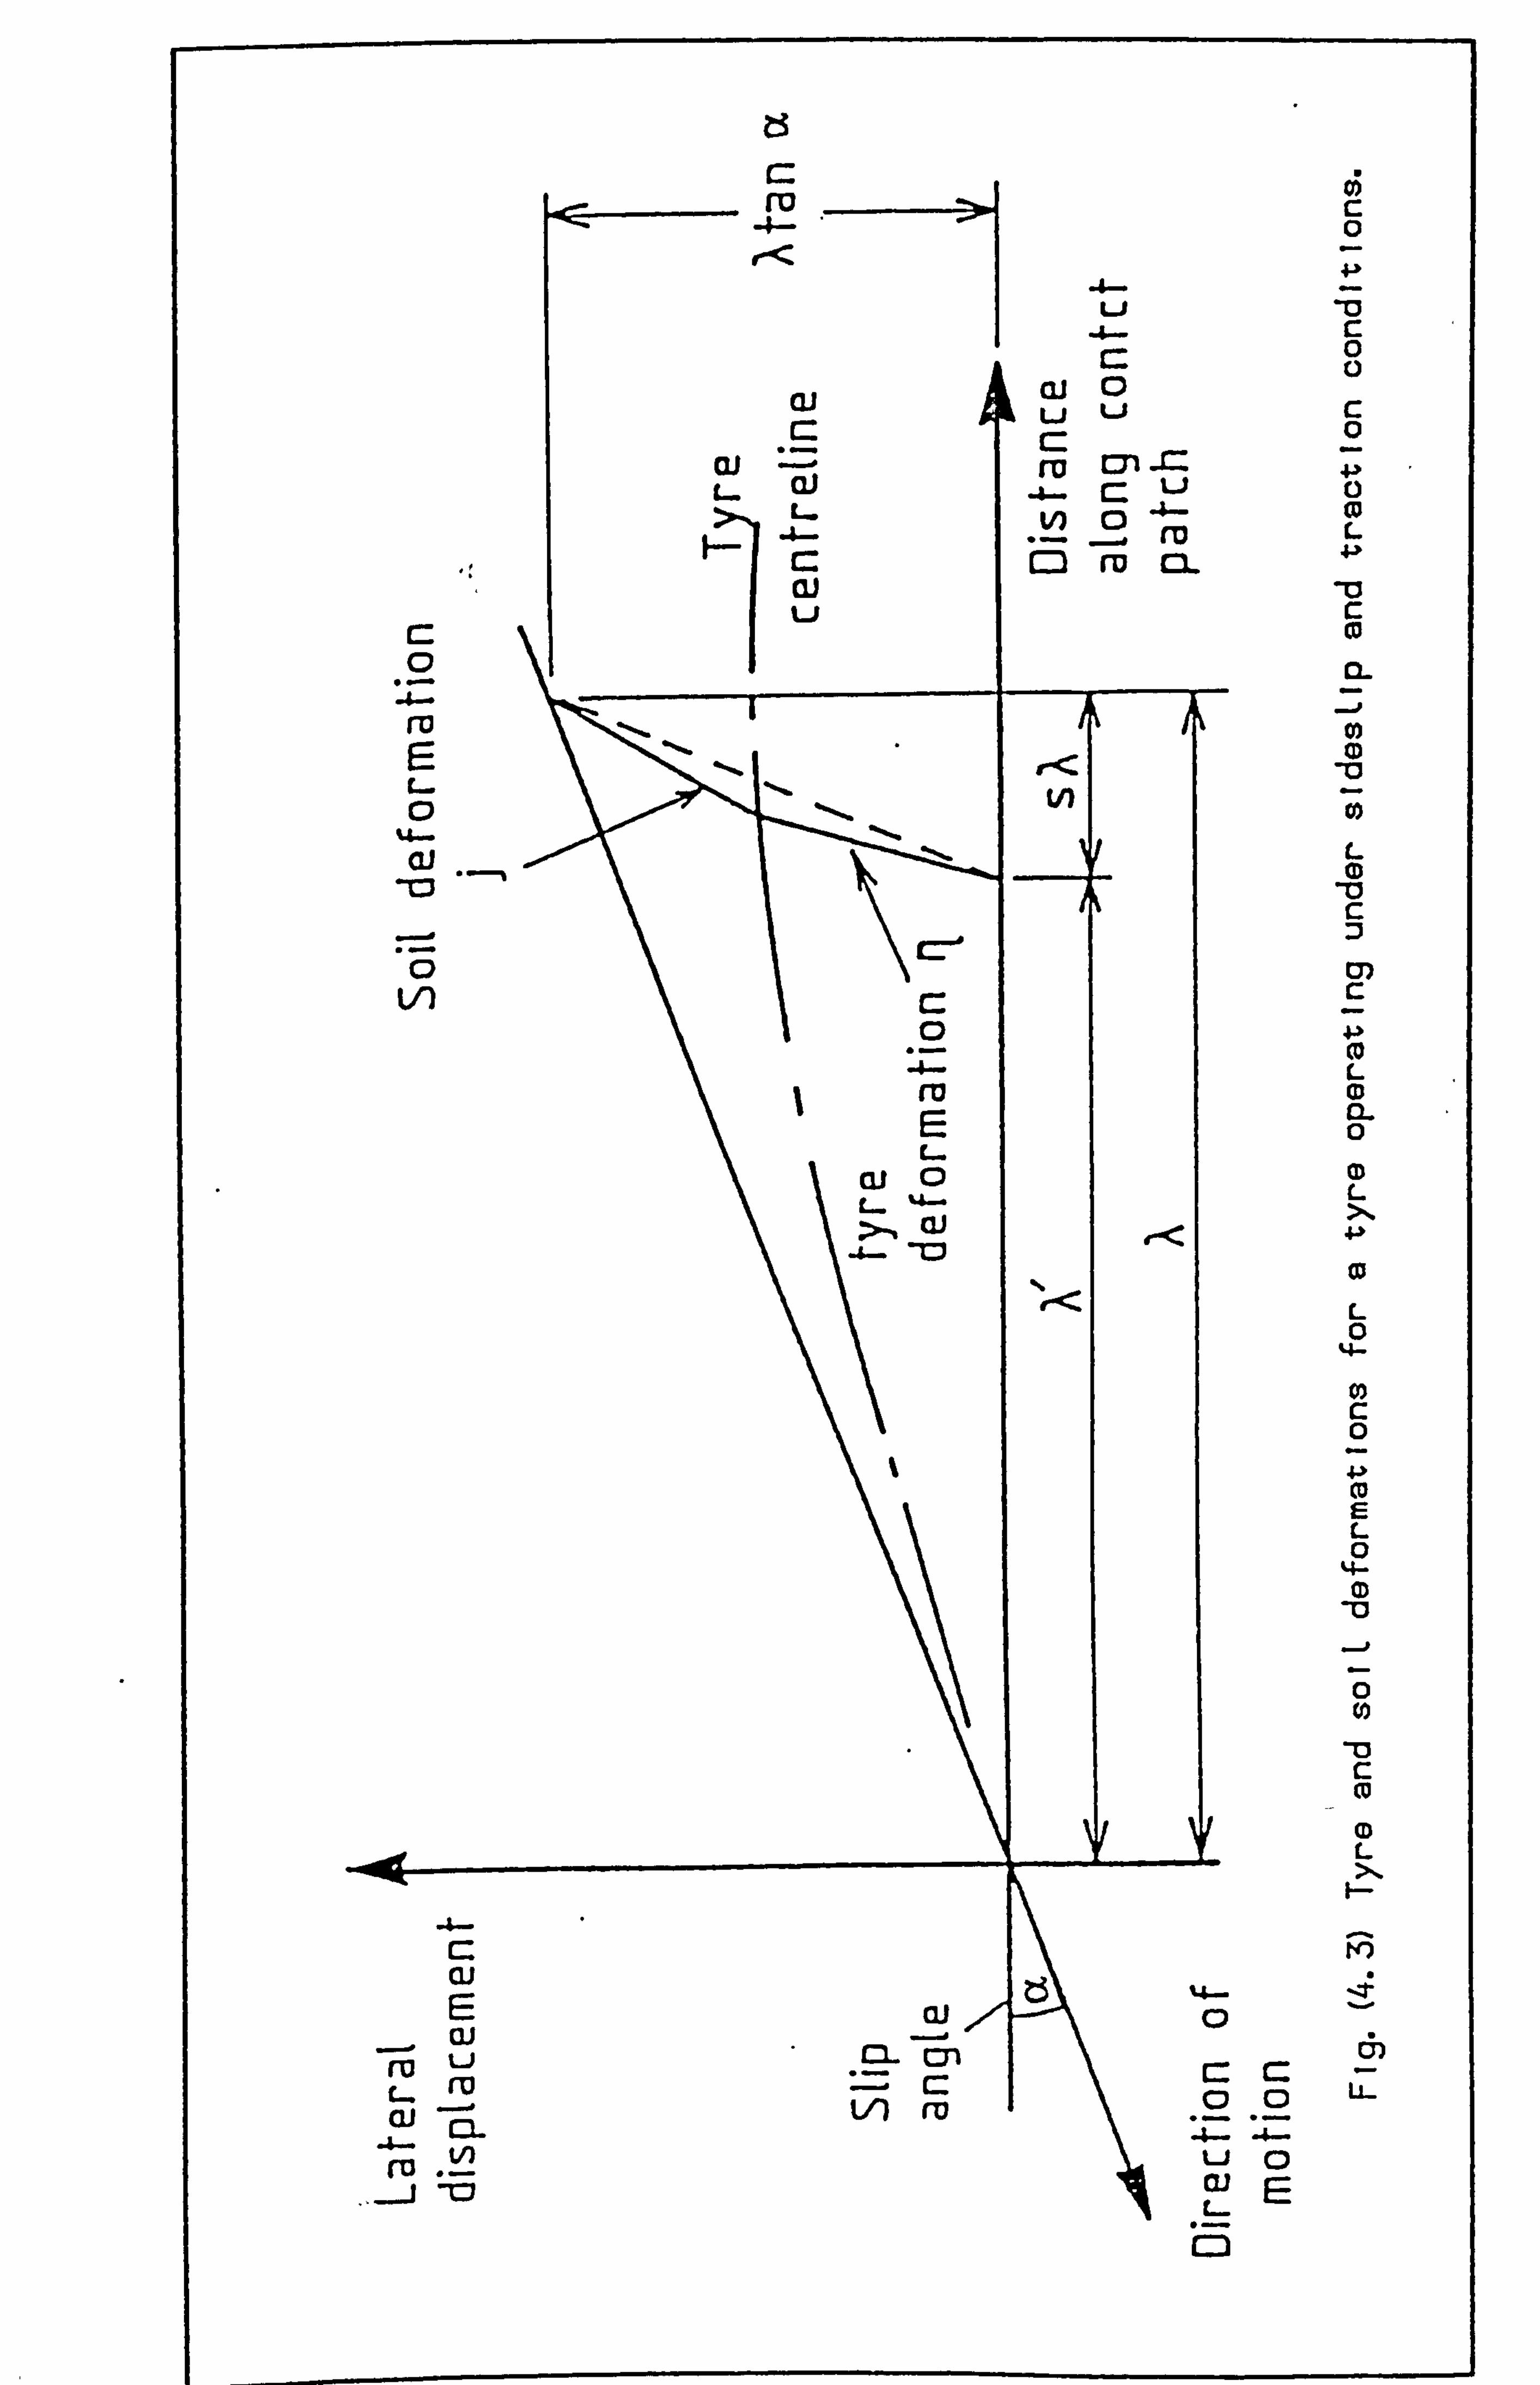
0; 4- , ýf
Li c 0 C:
aj cli LJ
0 U c
C= 0 CIJ ru Cn 4> L- CIJ
. 4- C: U 0 V) 0 -&-
ru CD L
C: ru CL 1 ai
u c
CD
.0 1 M
ru 0 E r< C- V) 0
L c
CT)
Ly') co L
ru
E 0 L- ai 0 CD L %A -
cli x 4-ý
. 4- cc
L 0
%4. -
0) c 2 . CD E L 0
U. CD
0
c (a
(D L
R3
ai E cli 0 ai
ru U C= C: C- ru
-- C= ru 0 0 ai
-I.. - ca.
ru . V) u 0
-0 E
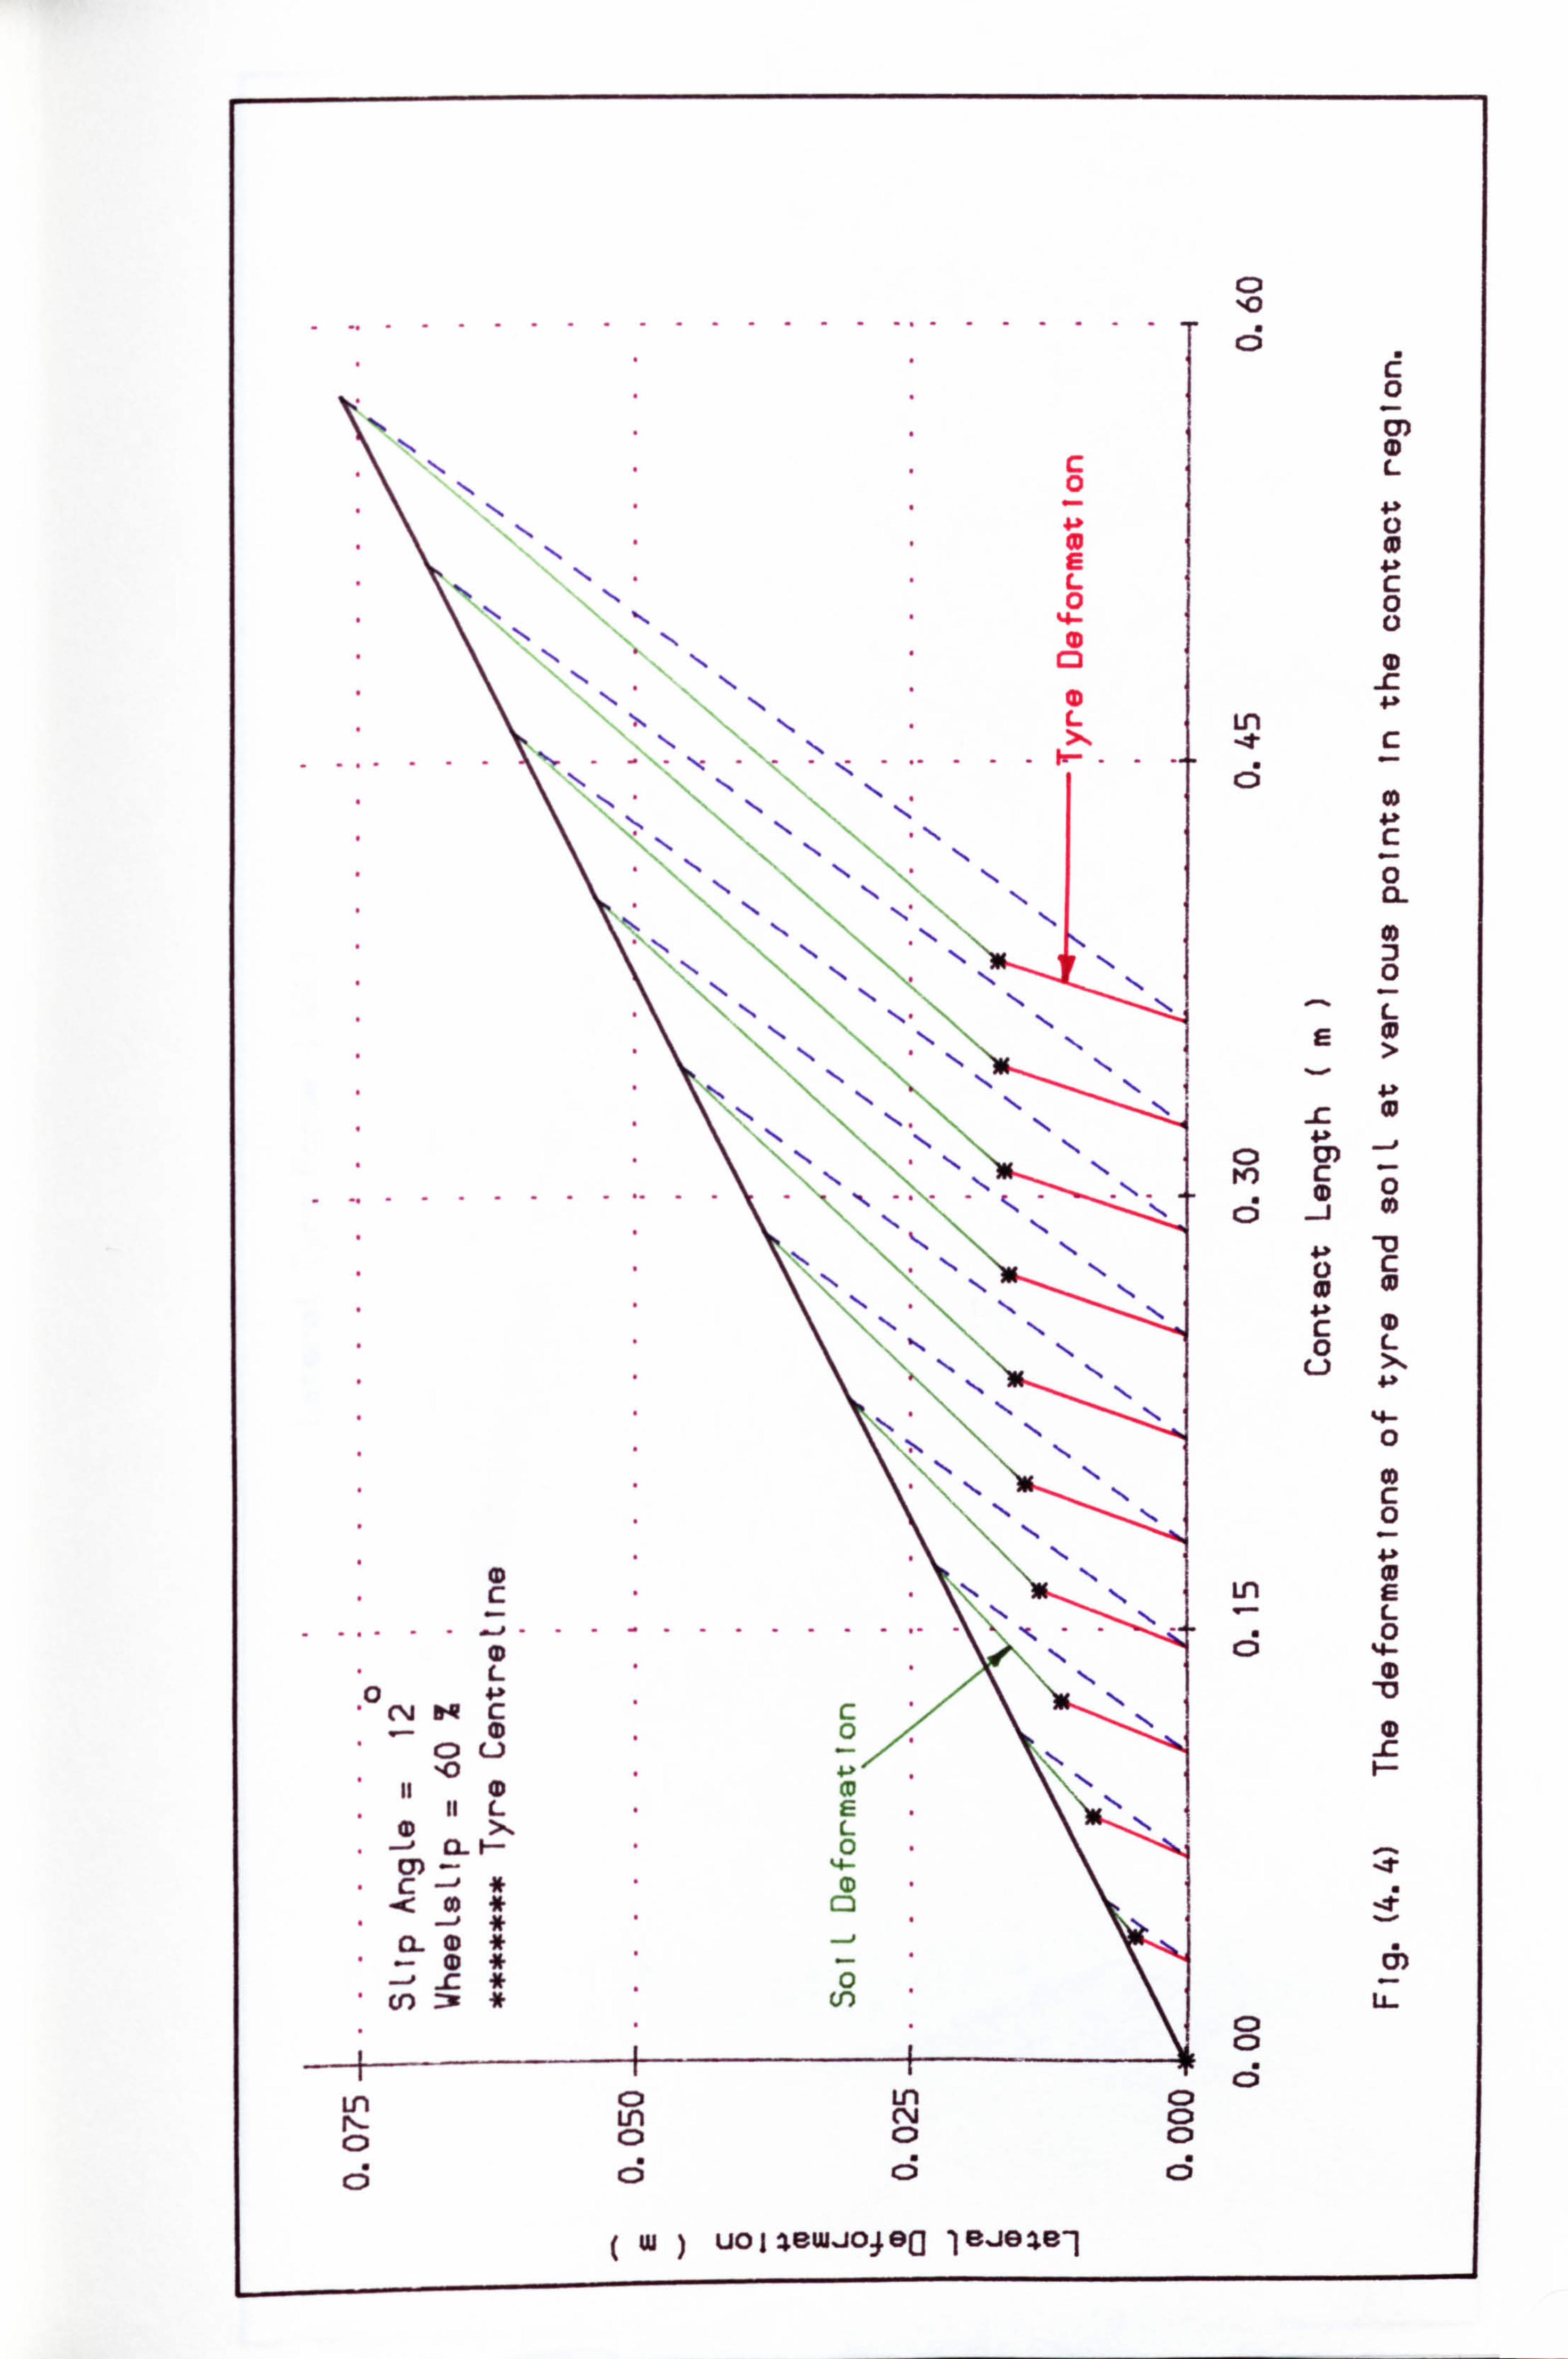
c 0
CD 0
0
. ........... ..
(D c
----------- L
0 4.91 cc (D 0
C) u 10 4ý
It 0 CD 11 LE%,
(D >1 L CL F- 0
C)) -4 C: ID
-< C3
(D -C
0 . (f) -=W
* V)
Ln C) Ln I%. - Ln C%j
Cl C) ci C5
w) UOIZBwJO48(1 18JO281
%0
0 Z) L
c 0 0
(D X 4J
Ln -t c
0 4-1
0
0
N)
C5 0
4-P M c
4-P C 0L
U
4- 0
CD c 0 4-P
Ln L 0
4-
C,
U- 0 0 0
0 0 0 CD
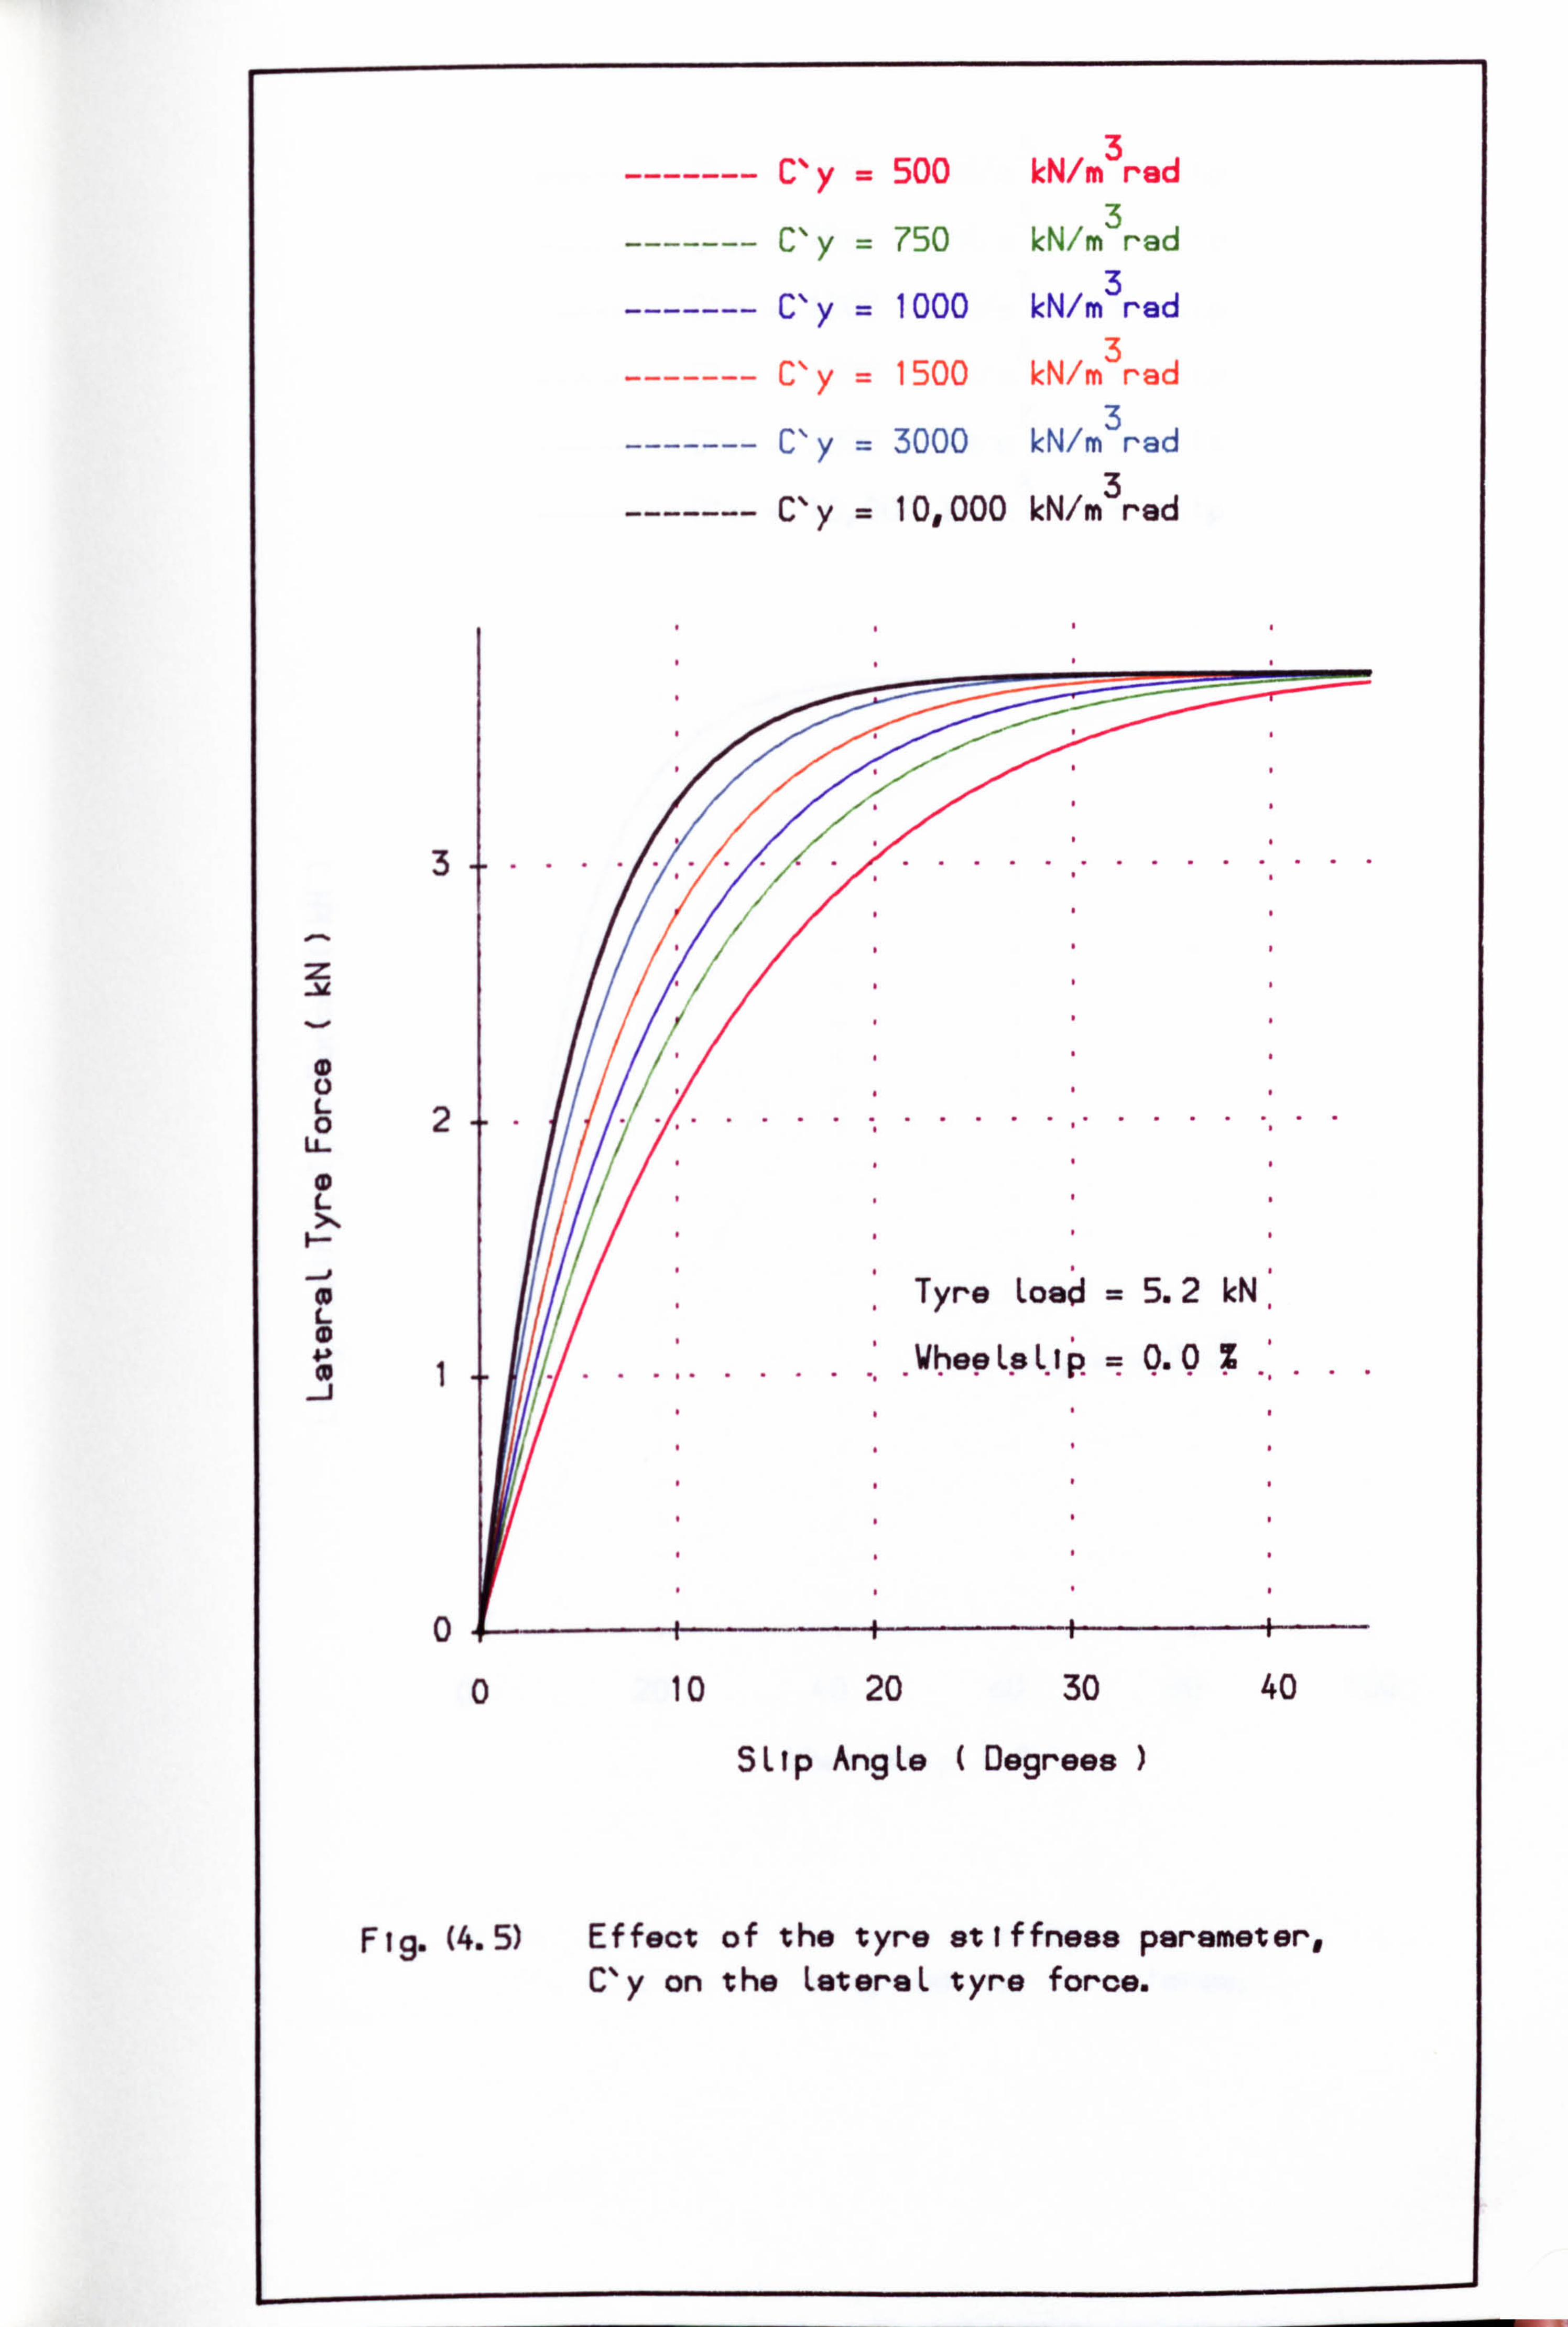
------- C'y = 500 kN/m 3
red
------- C'y = 750 kN/m 3
red
------- C'y = 1000 kN/m 3
red
------- C'y = 1500 kN/m 3
rad
------- C'y = 3000 kN/m 3
rad
------- C'y = 10,000 kN/m 3
red
31....... ...............
z
L 02.... ...... U-
L
0 Tyre Load = 5.2 kN. L
WheeLsLip = 0.0 Z .......... ...
0
0 10 20 30 40
SLIp AngLe Degrees
Fig. (4.5) Effect of the tyre stiffness parameter, C'y on the LeteraL tyre force.
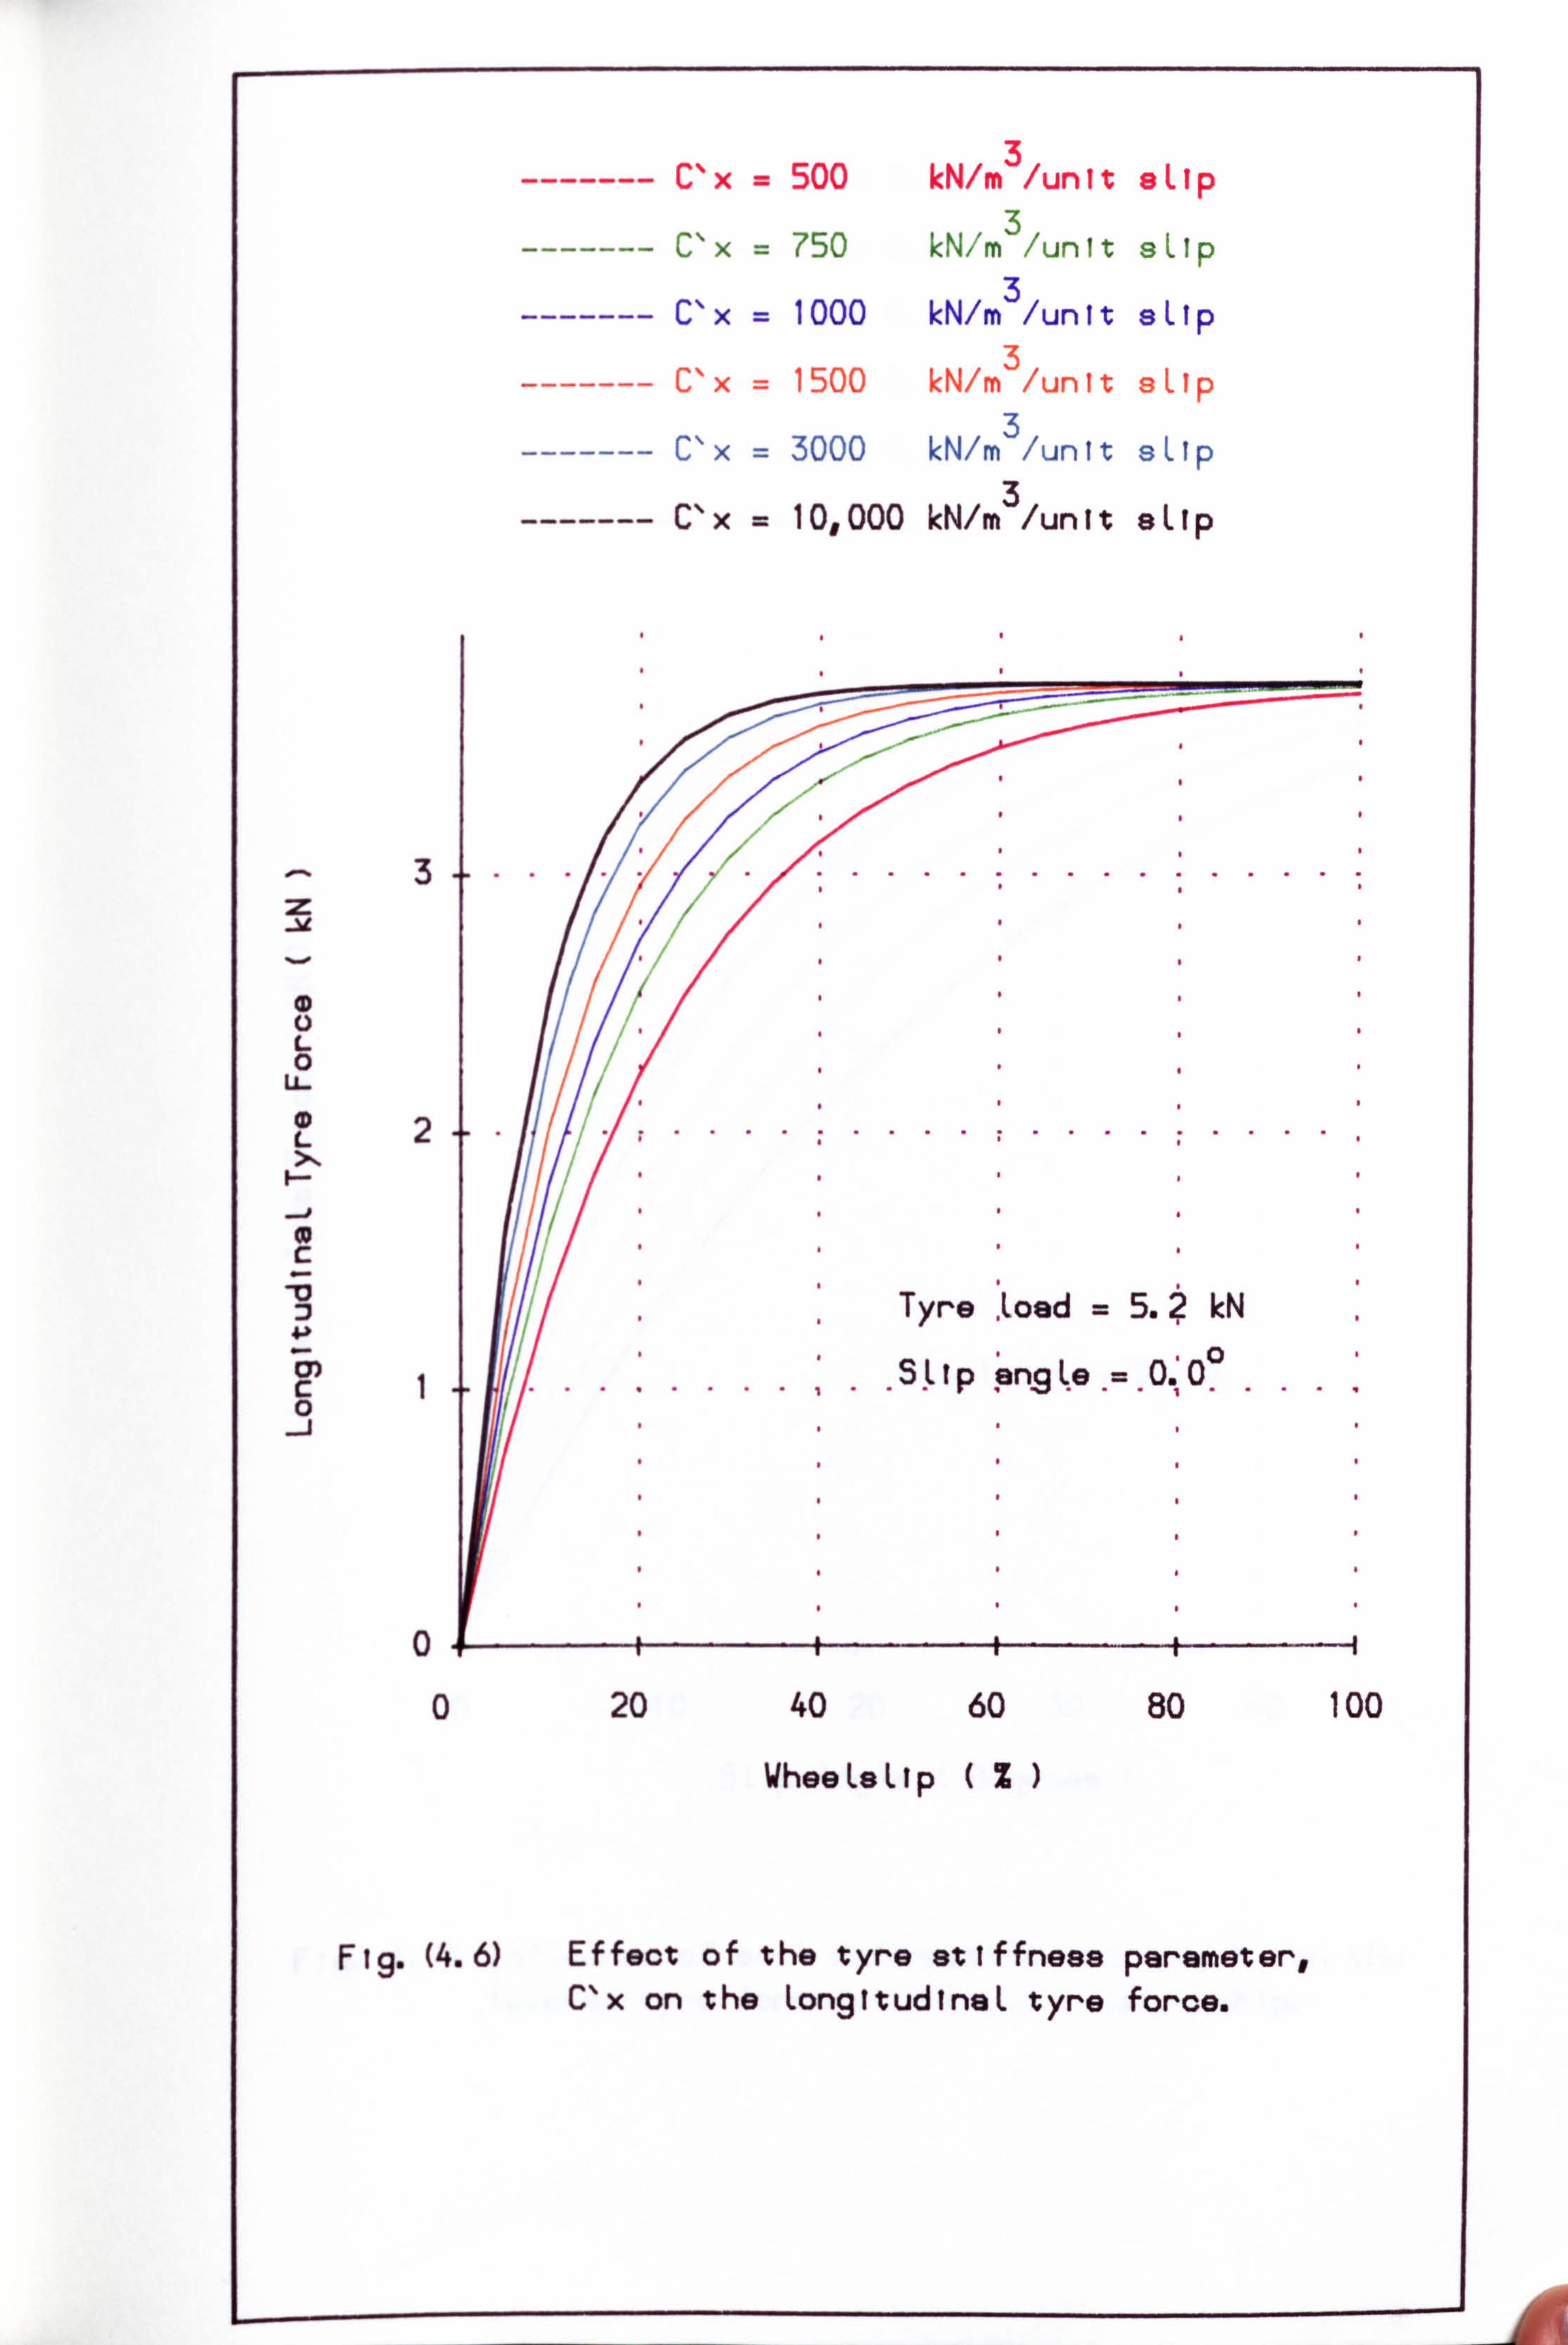
------- Cx = 500 kN/m 3
/unit eLlp
------- Cx = 750 kN/m 3
/unit aLlp
------- C'x = 1000 kN/m 3
/unit sLlp
------- C'x = 1500 kN/m 3
/unit eLlp
------- C'x = 3000 kN/m 3
/unit sLip
------- C'x 10,000 kN/m 3
/unit aLlp
..... ..... .... ............. .....
31..... I...............
CD
L 0
U- 0 L2
C Tyre Load 5.? M
S. L p 6ng ke 0'00 C........ 0
0
0 20 40 60 80 100
WheeLeLlp (Z)
Flg. (4.6) Effect of the tyre stiffness parameter, C'x on the LongitudtneL tyre force.
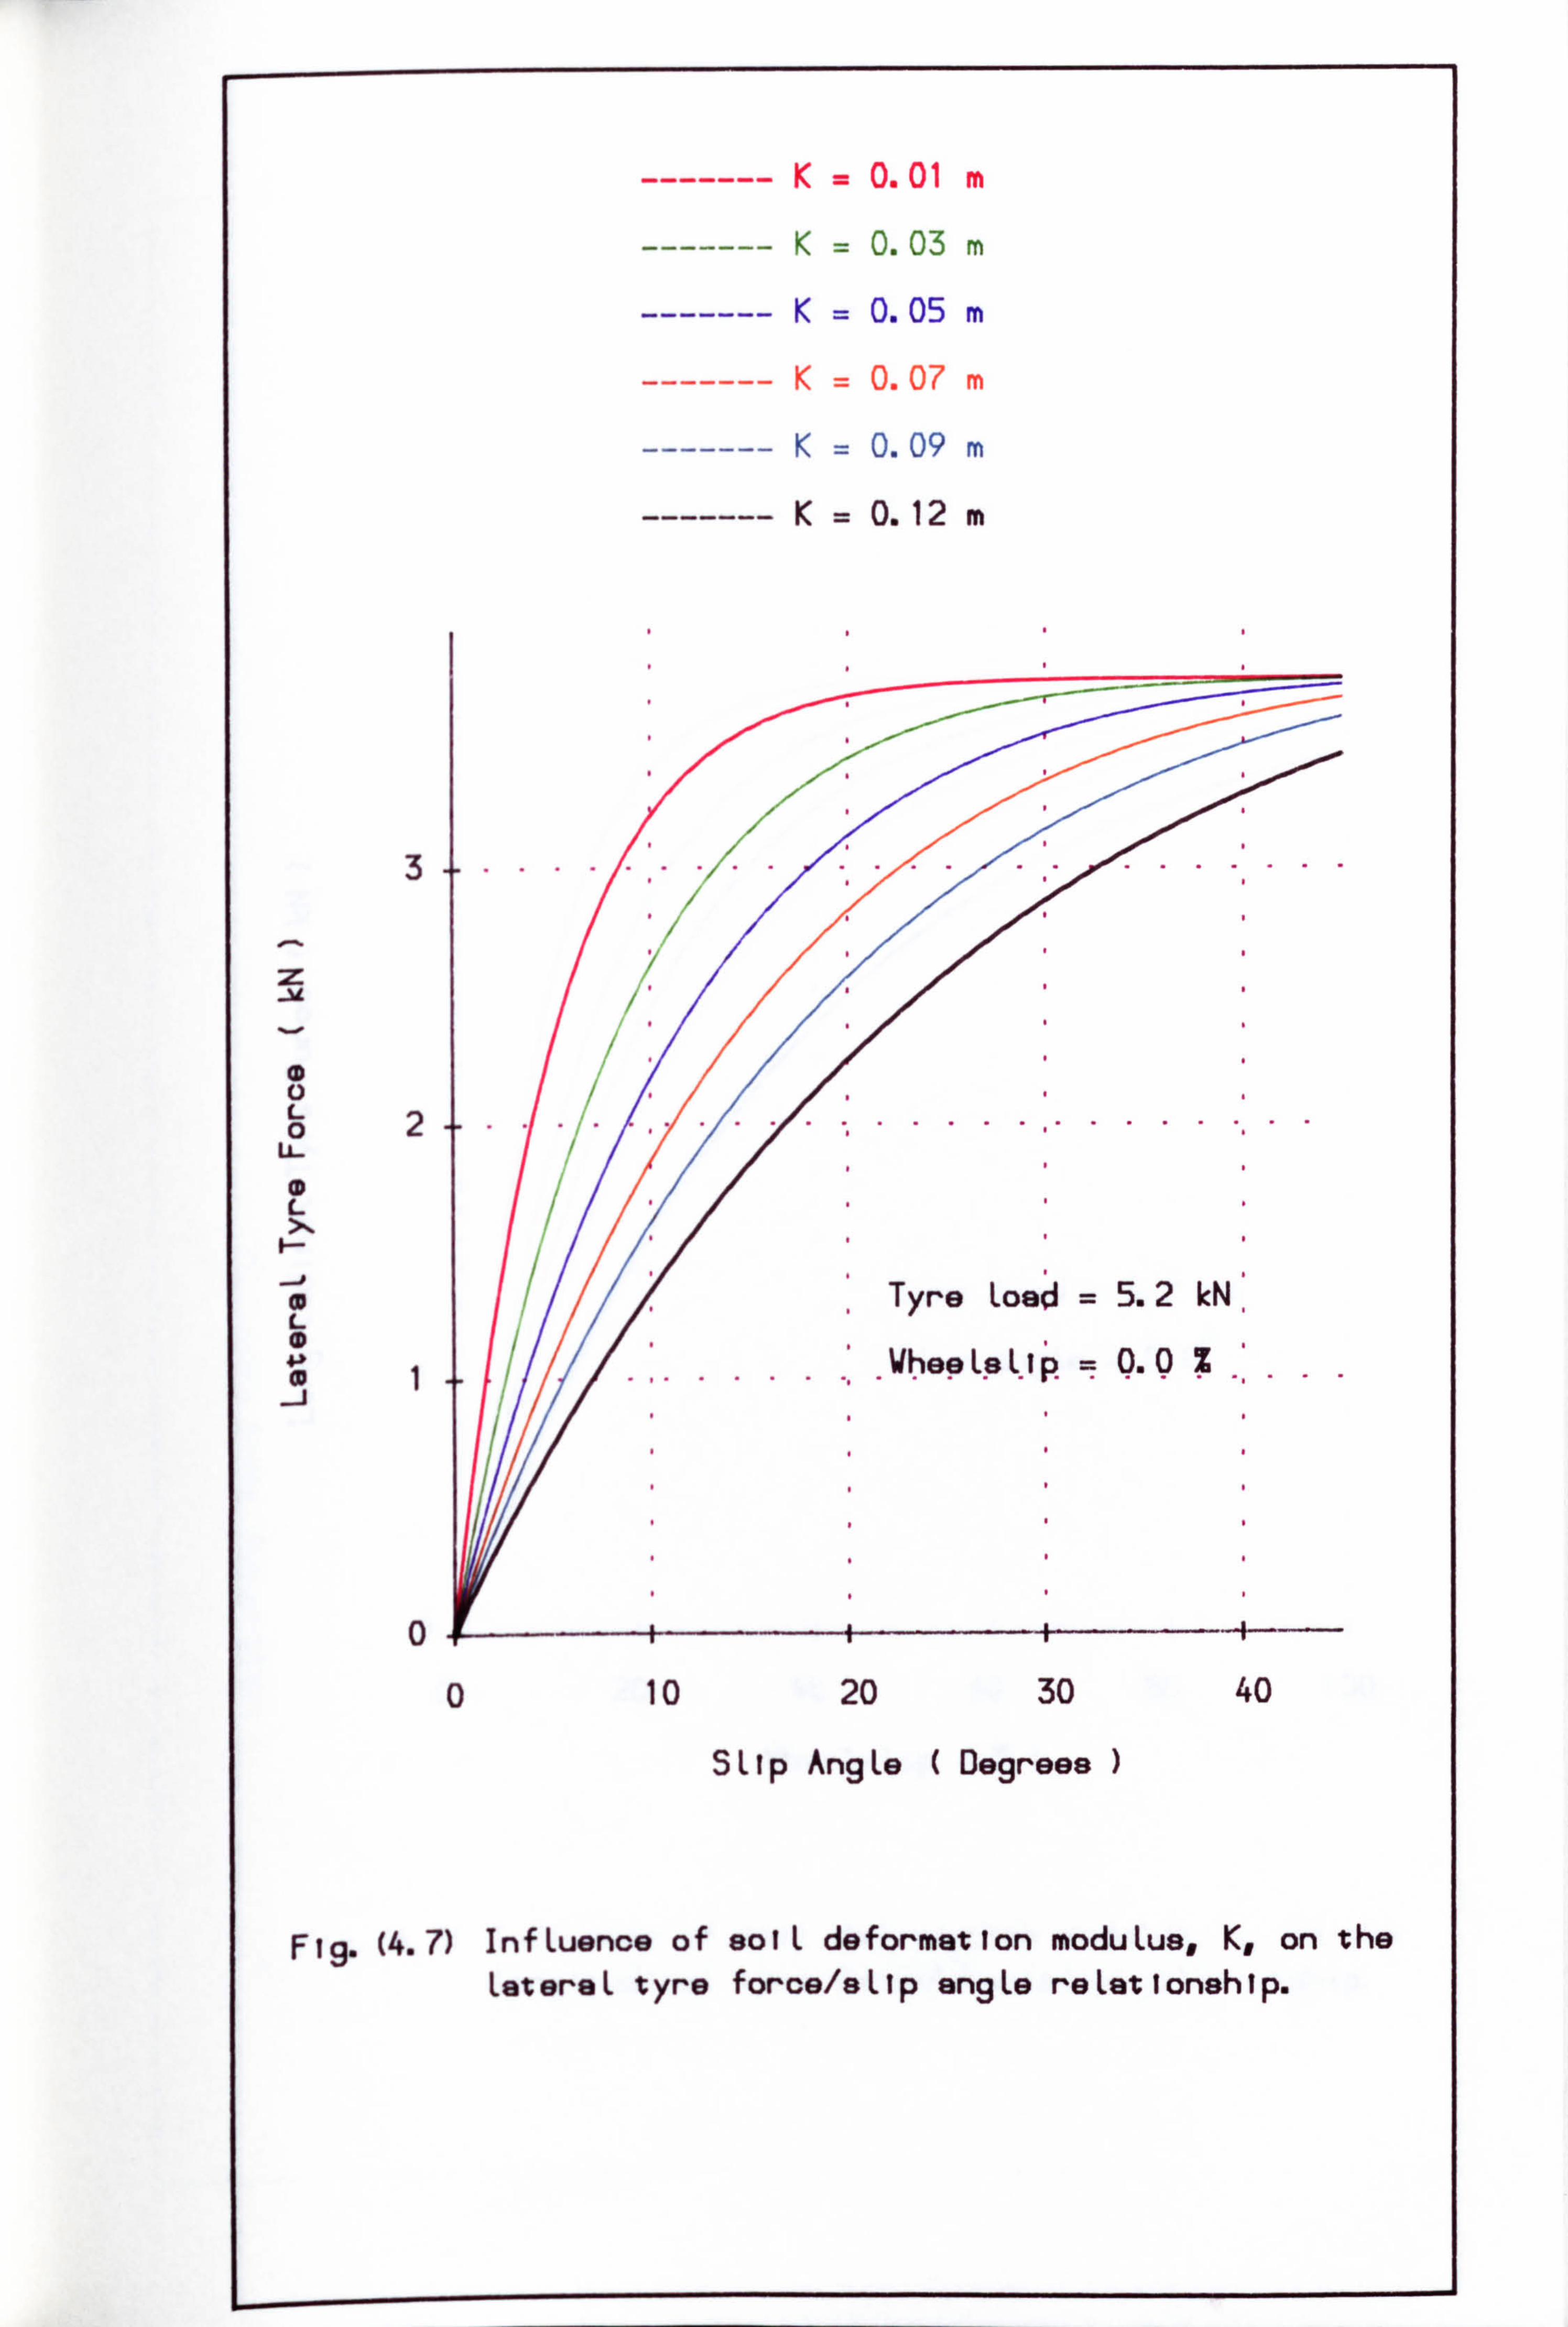
---- --- K=0.01 m
K=0.03 m
---- --- K=0.05 m
---- --- K=0.07 m
---- --- K=0.09 m
---- --- K=0.12 m
3 .. ....... . ....... ...
0 L 0 2 . ... .... U- L
0
, Tyre Load = 5.2 M,
L a 43, 1p=0.0 Z Whee Le L .
0 0 10 20 30 40
SLIp AngLe Degrees
Fig. (4.7) InfLuence of solL deformation moduLus, K, on the LatereL tyre force/aLlp angLe reLationship.
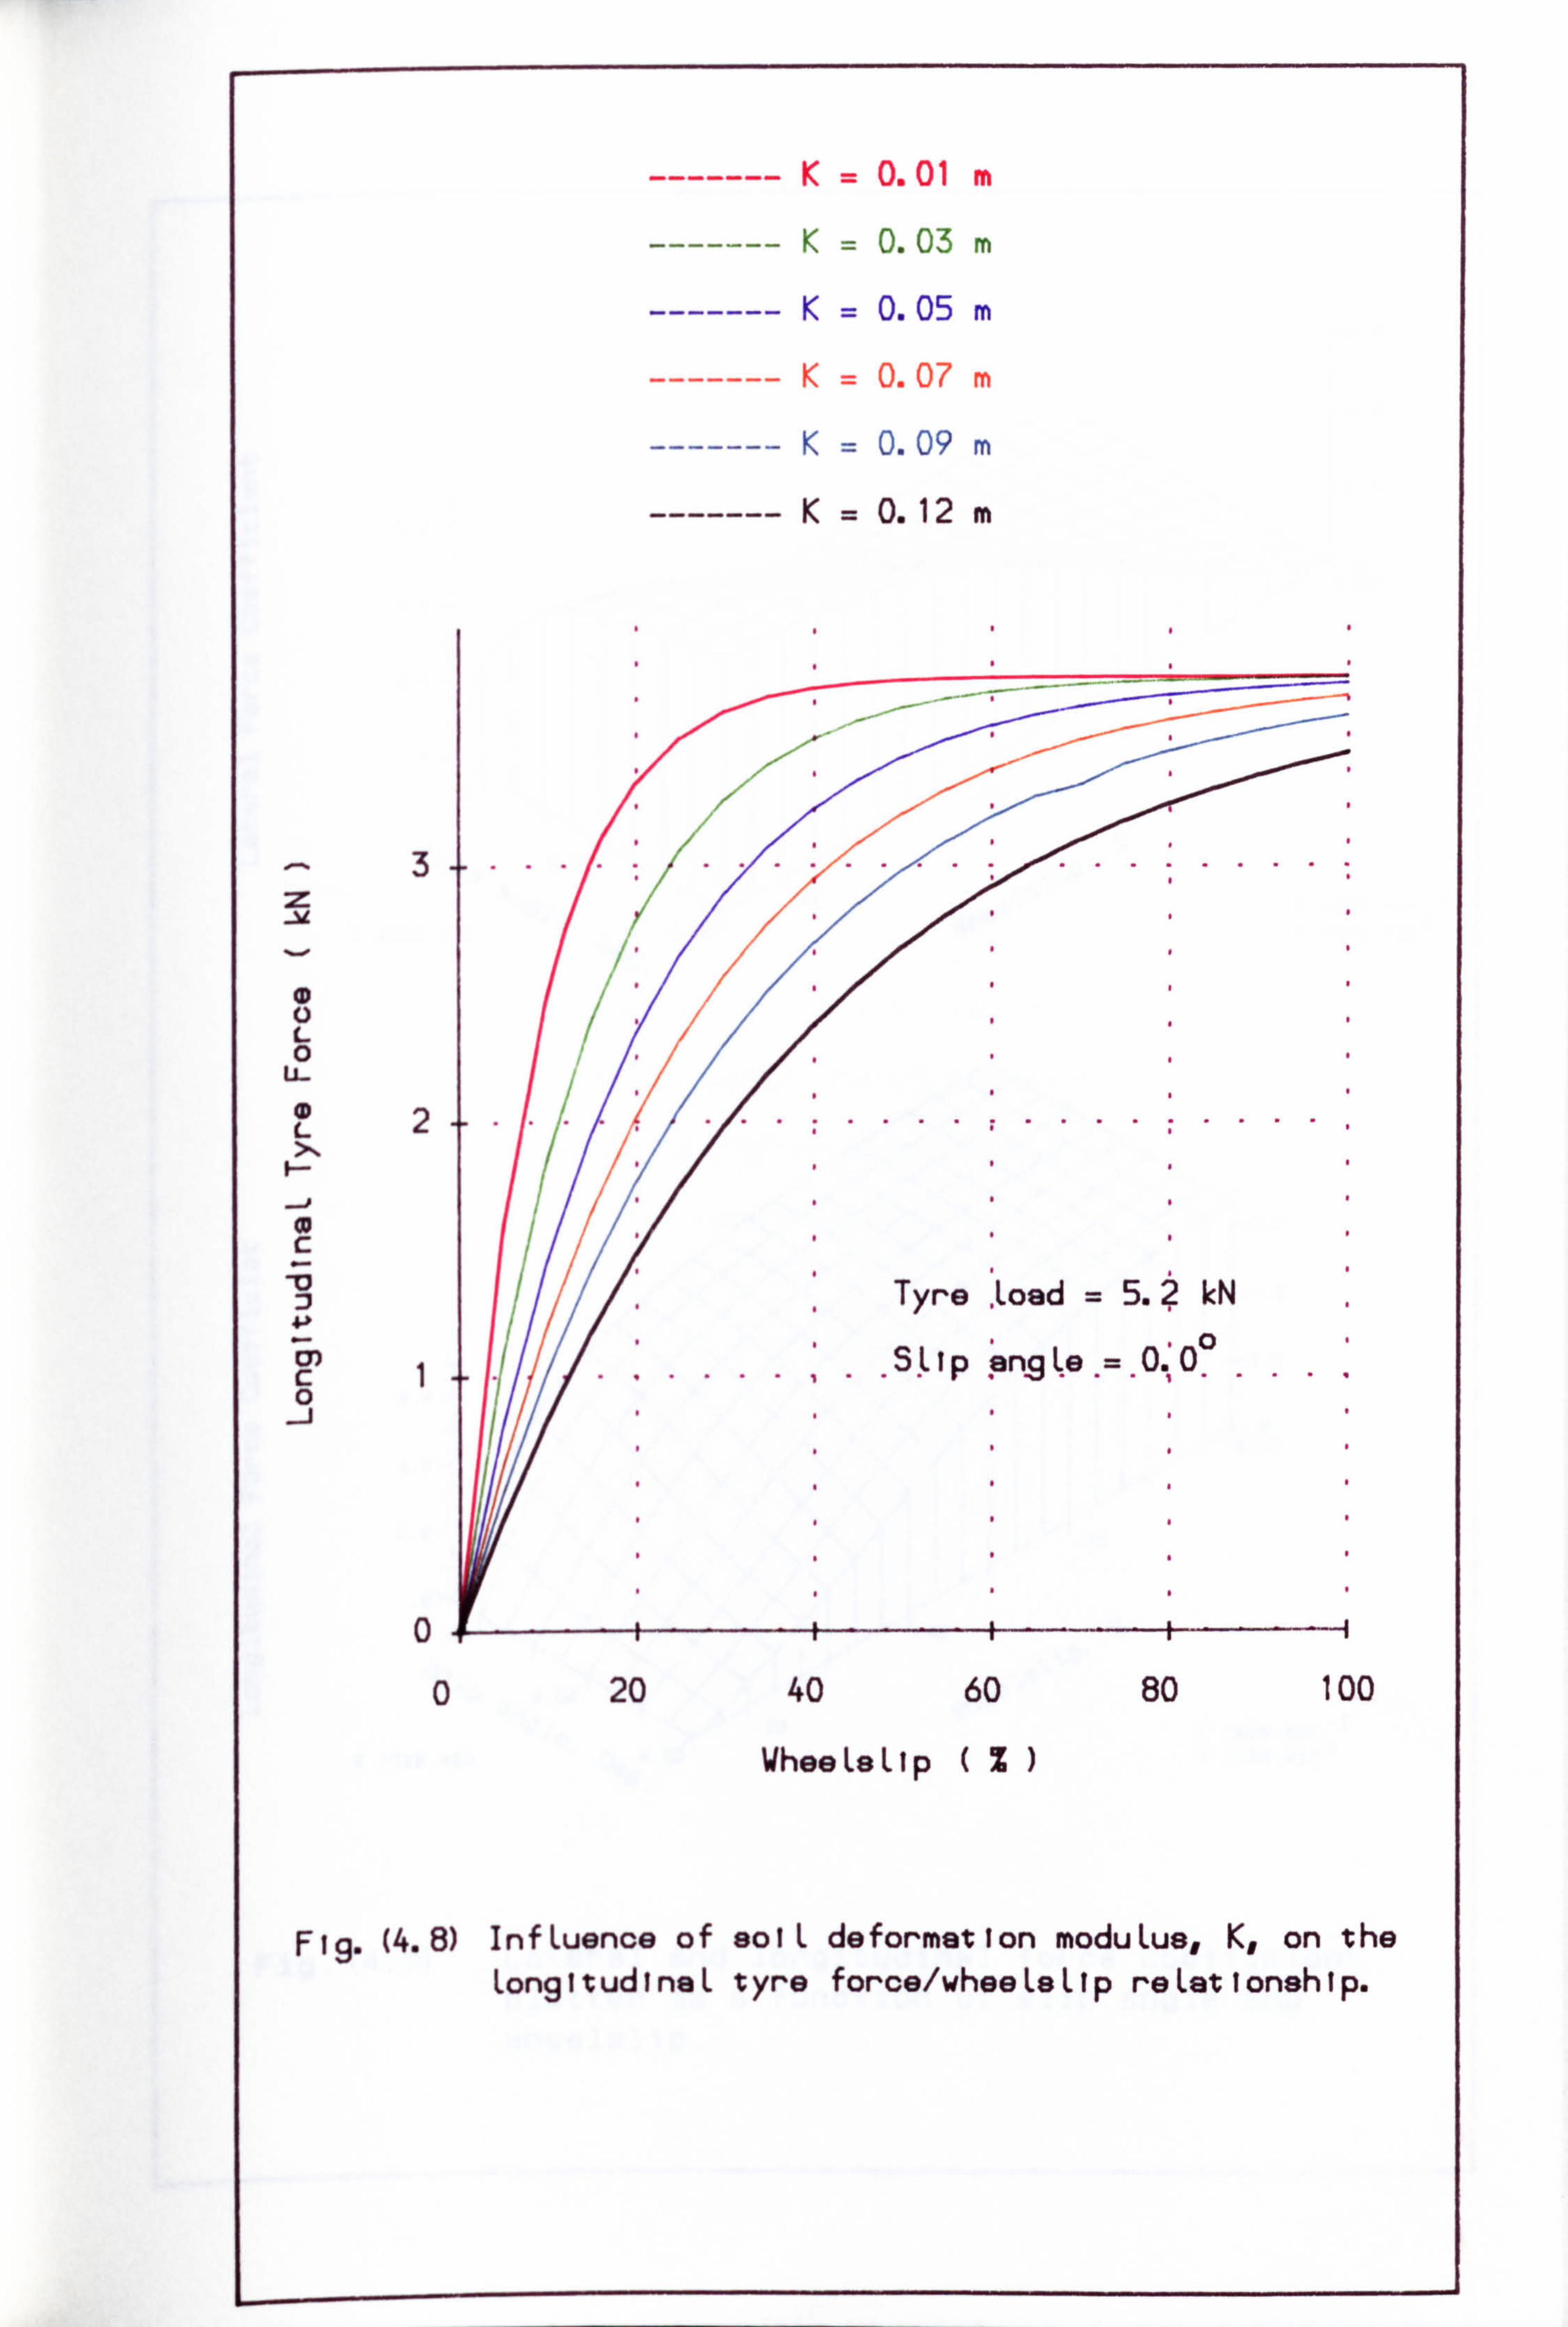
------- K=0.01 m
------- K=0.03 m
------- K=0.05 m
------- K=0.07 M
------- K=0.09 m
------- K=0.12
3
L 0 U-
L2 ................
c Tyre Load = 5. ? kN
M SLIp pnske. = 0.00 c...... 0
0
0 20 40 60 80 100
WheeLeLlp (%
Fig. (4.8) InfLuence of solL deformation moduLus, K, on the LongitudinaL tyro force/wheeLeLip reLationship.
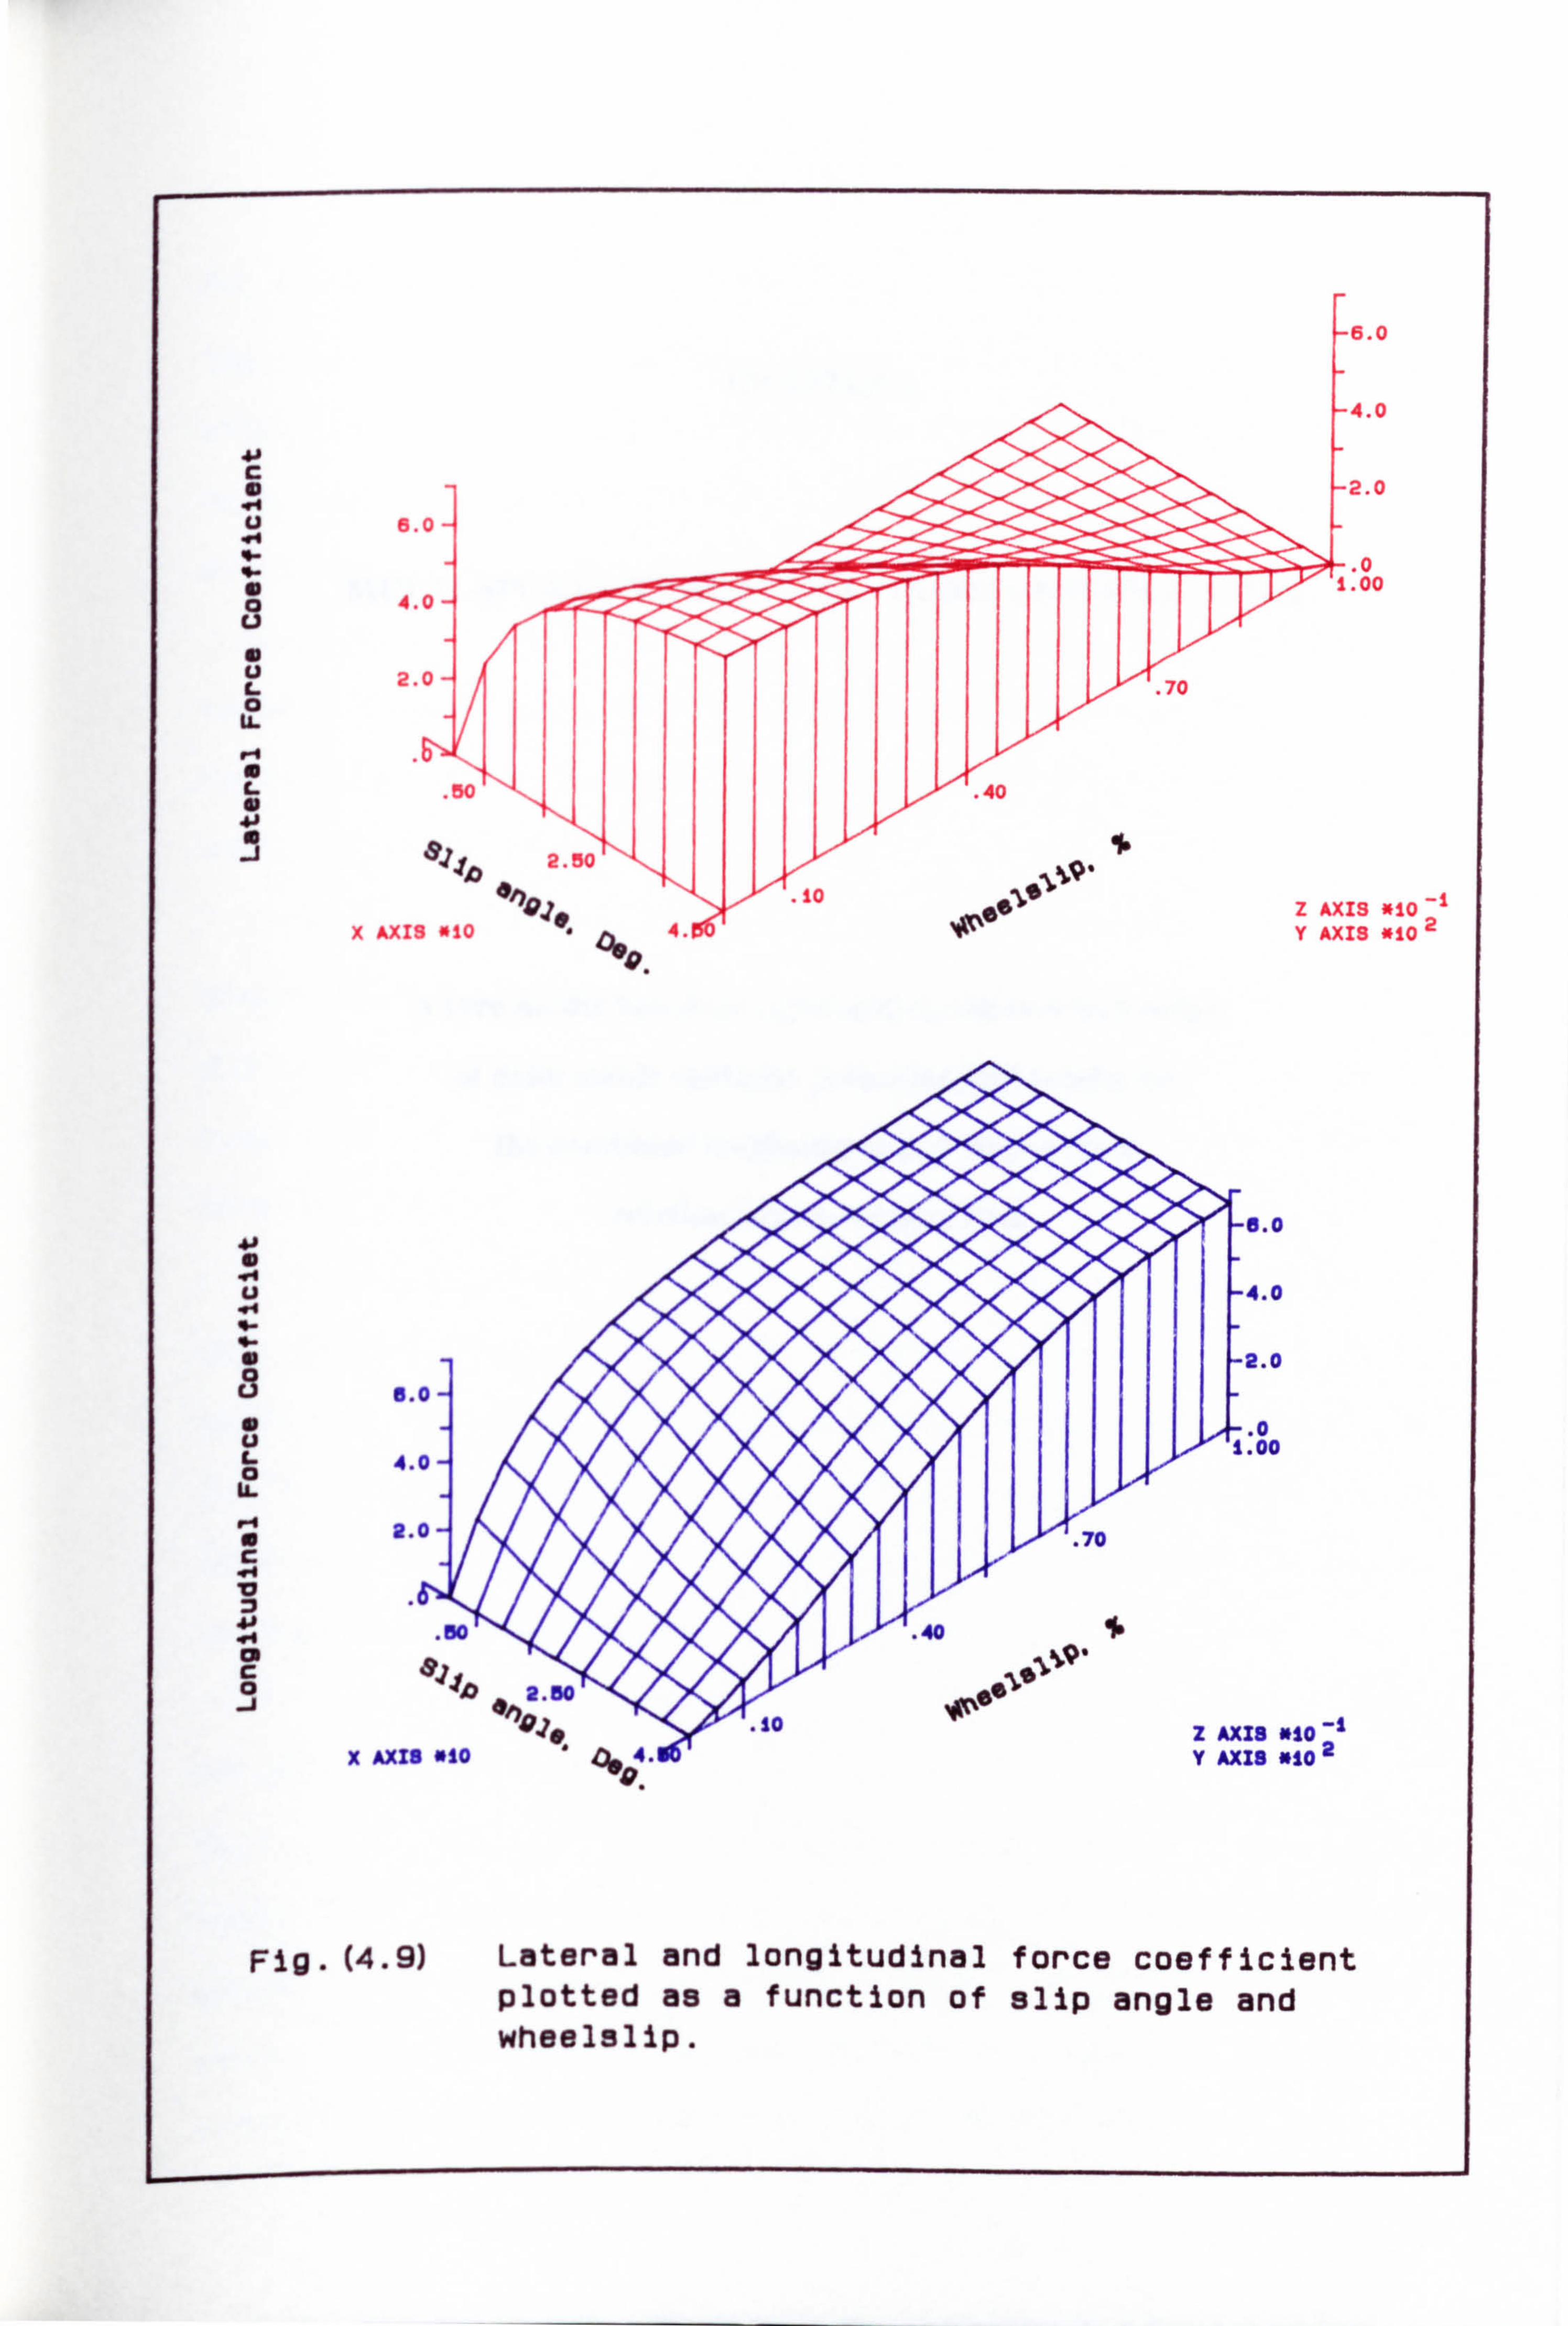
-6.0
-4.0
-2.0 U
1- a
.0 1.00 0 U
4.0
U L 2.0 70
U.
L a . 50 . 40
10 2.50
'ýý3ý9 ; ý . 10 es
Ns
Ir z AXIS *10
2 x AXIS *10 4.1 5 Y AXIS *10
-6.0
U -4.0
2.0
6.0
0 U -
4.0- .0 . 00
2.0- . 70
Cm . 50 . 40
: 019, C 0 04 "
-0 2.50 %! b
. 10 Z AXI 10 -1 X AX18 010 4)0 4.
:: Y AXI to 2
V.
Fig. (4.9) Lateral and longitudinal force coefficient platted as a function Of slip a ngle and wheelalip.
CHAPTER5
MULTI-SPOYX- D TYRE MODEL ON DEFORMABLE SOILS
A tyre model based on representing the tyre as a series
of cleforinable spokes is presented and results for
the combined longitudinal and lateral force
relationships are calculated.
-113-
5.1. INTRODUCTION
The accurate prediction of the forces generated between 'the deformable soil and the
rolling tyre is one of the most important and difficult problems in developing a
mathematical tyre model simulation. In any study to predict the dynamic performance
of off-road vehicles, it is vital to be able to model the off-road tyre accurately.
Accordingly, predictions of tyre performance over a range of soil conditions are
important. Also, the tyre model may be helpful in gaining a better understanding of the
force distributions throughout the contact region and in establishing the detailed way in
which tyre and soil parameters affect behaviour.
The model is represented by a series of individual spokes whose only connection
to each other is through the hub of the wheel. The spokes have both radial and bending
stiffness and solving the force equations at the tips of the spoke in the lateral,
longitudinal and vertical directions is the basis of the mathematical tyre model
simulation.
The modelling results are verified by comparisons with measured data and it is
then argued that the model is sufficiently accurate and economical in computing
requirements to be used in vehicle simulation studies. Accurate predictions of off-road
tyre forces are essential when studying off-road vehicle handling and stability
behaviour because these are the external forces which are responsible for guiding,
braking and propelling the vehicle.
5.2. DEVELOPMENT OF MODEL
The key to developing a comprehensive model of an off-road tyre i's the ability to
predict accurately the force system at the tyre-soil interface. The behaviour of off-road
tyres at the tyre-soil interface is governed by forces originating from external sources
above the soil surface and reaction forces from the soil against them. This'reaction
comes through the tyres via the spoke contacts of the wheel on the soil surface.
-114-
The model can be described as a simple and stmightforward approach utilising the
idea of the tyre being formed by a series of radial spokes, each spoke having three
degrees of freedom, laterally, longitudinally and radially. Fig. (5.1) illustrates the
behaviour of the spoke tip under conditions of static tyre deformation on a deformable
surface.
In the case of steady-state rolling conditions, Fig. (5.2) shows the spoke tip
behaviour in the contact region, the spoke tips will deflect in three directions (if there is
any lateral wheel movements) circumferentially, radially and laterally, though for
clarity the lateral deflection is not shown in the diagram. The soil will also be deformed
under these spoke tip movements. These spoke tip deflections will imply forces in
longitudinal, radial and lateral directions respectively with the soil surface generating
forces against them as shown in Fig. (5.3).
5.3. MATHEMATICAL ANALYSIS
As described in Fig. (5.3), the spoked tyre model is moving at a constant forward speed,
U, with constant spin velocity, co, and tyre load, W, under operating condition of
wheelslip, s, and slip angle, (x, on a deformable soil. Suppose the entry contact angle
(angle between centreline of the tyre and forward position) is, 01, and the rear contact
angle( angle between the centreline of the tyre and the rear contact position) is, 02-
Calculations start from the point when the first spoke enters into the soil surface at
the front of the contact region. The tyre is moving forwards and rotates a small amount,
the rotation being sufficient to make the particular spoke of interest become the second
in the contact region. At this point, the next proceeding spoke has just touched the
contact region.
Because the tyre movement in the time increment described are completely
specified, the radial, lateral and longitudinal deflections can be related directly to
instantaneous tYre forces and soil shear forces in the contact region. Referring to
Fig. (3.12) in Chapter 3, the contact region is divided into two portions. The first portion
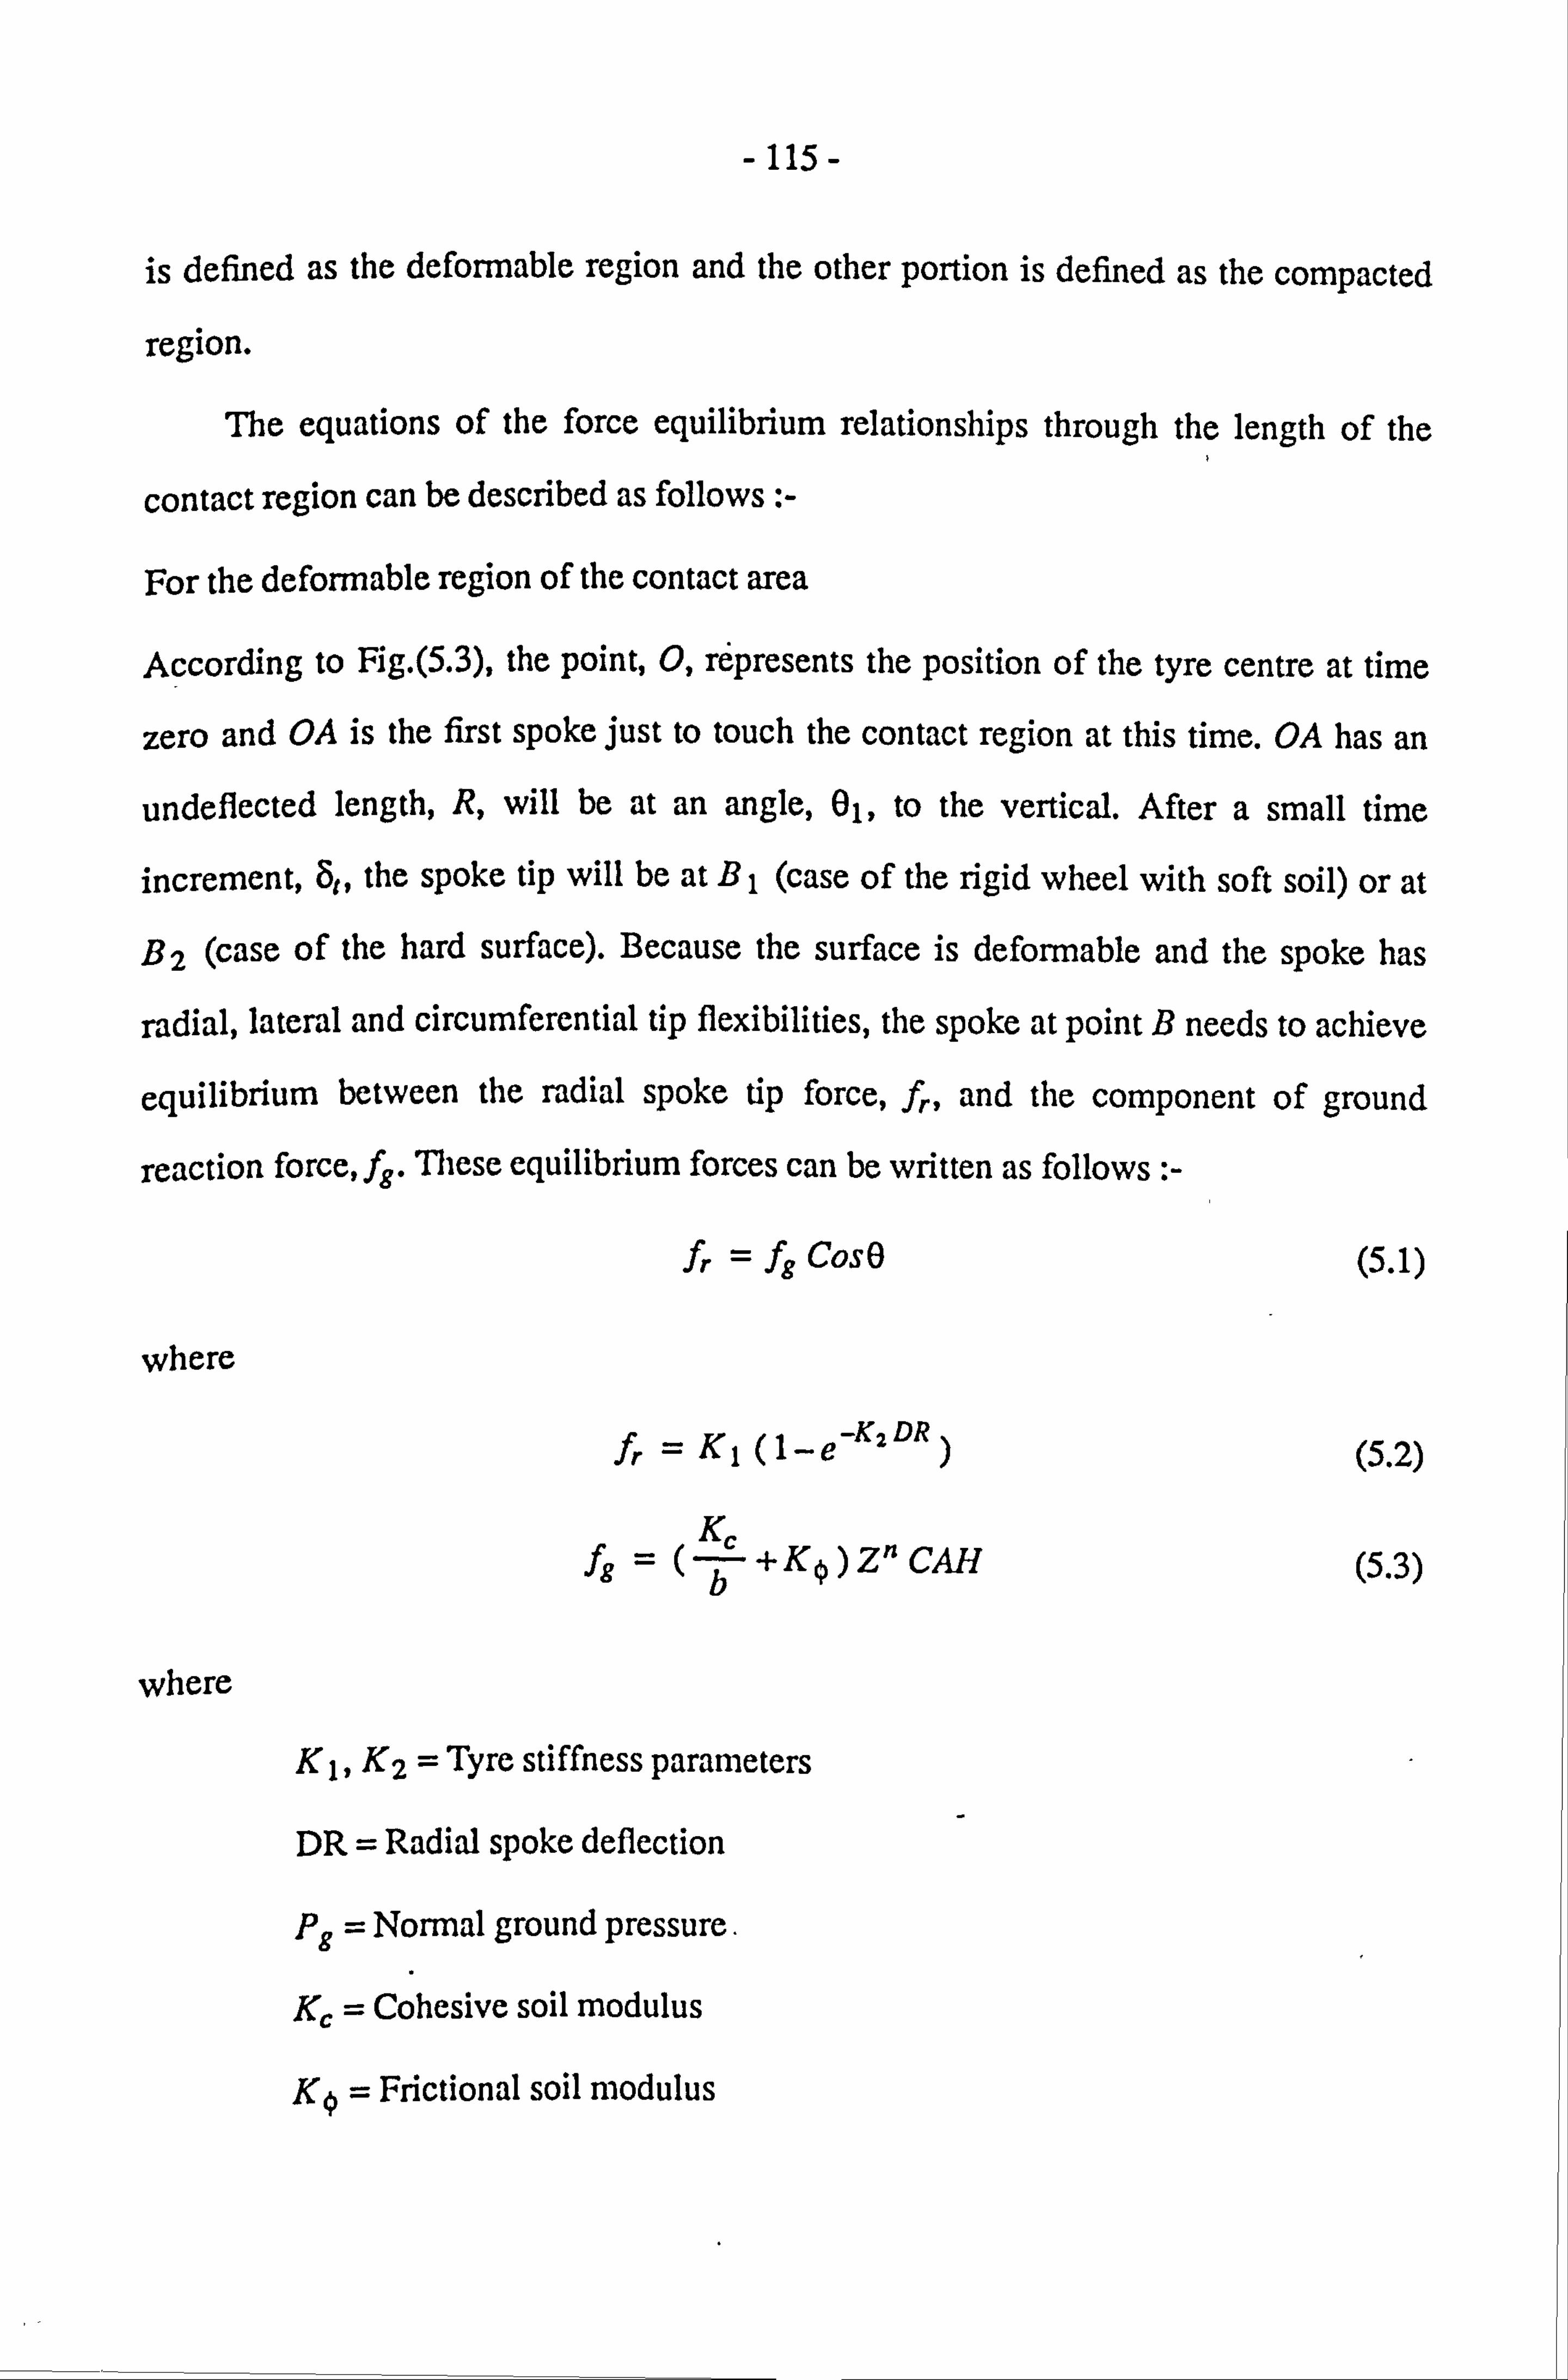
-115-
is defined as the deformable region and the other portion is defined as the compacted
region.
The equations of the force equilibrium relationships through the length of the
contact region can be described as follows :-
For the deformable region of the contact area
According to Fig. (5.3), the point, 0, represents the position of the tyre centre at time
zero and OA is the first spoke just to touch the contact region at this time. OA has an
undeflected length, R, will be at an angle, 01, to the vertical. After a small time
increment, 8t, the spoke tip will be at B1 (case of the rigid wheel with soft soil) or at
B2 (case of the hard surface). Because the surface is deformable and the spoke has
radial, lateral and circumferential tip flexibilities, the spoke at point B needs to achieve
equilibrium between the radial spoke tip force, f, and the component of ground
reaction force, fg. Iliese equilibrium forces can be written as follows :-
f, = fg COSO
where
(5.1)
f, = Ki (1-e-K2DR ) (5.2)
c )Zn fg = (L+K CAH (5.3) b
where
K 1, K2 = Tyre stiffness parameters
DR = Radial spoke deflection
Pg = Normal ground pressure .
Cohesive soil modulus
Frictional soil modulus
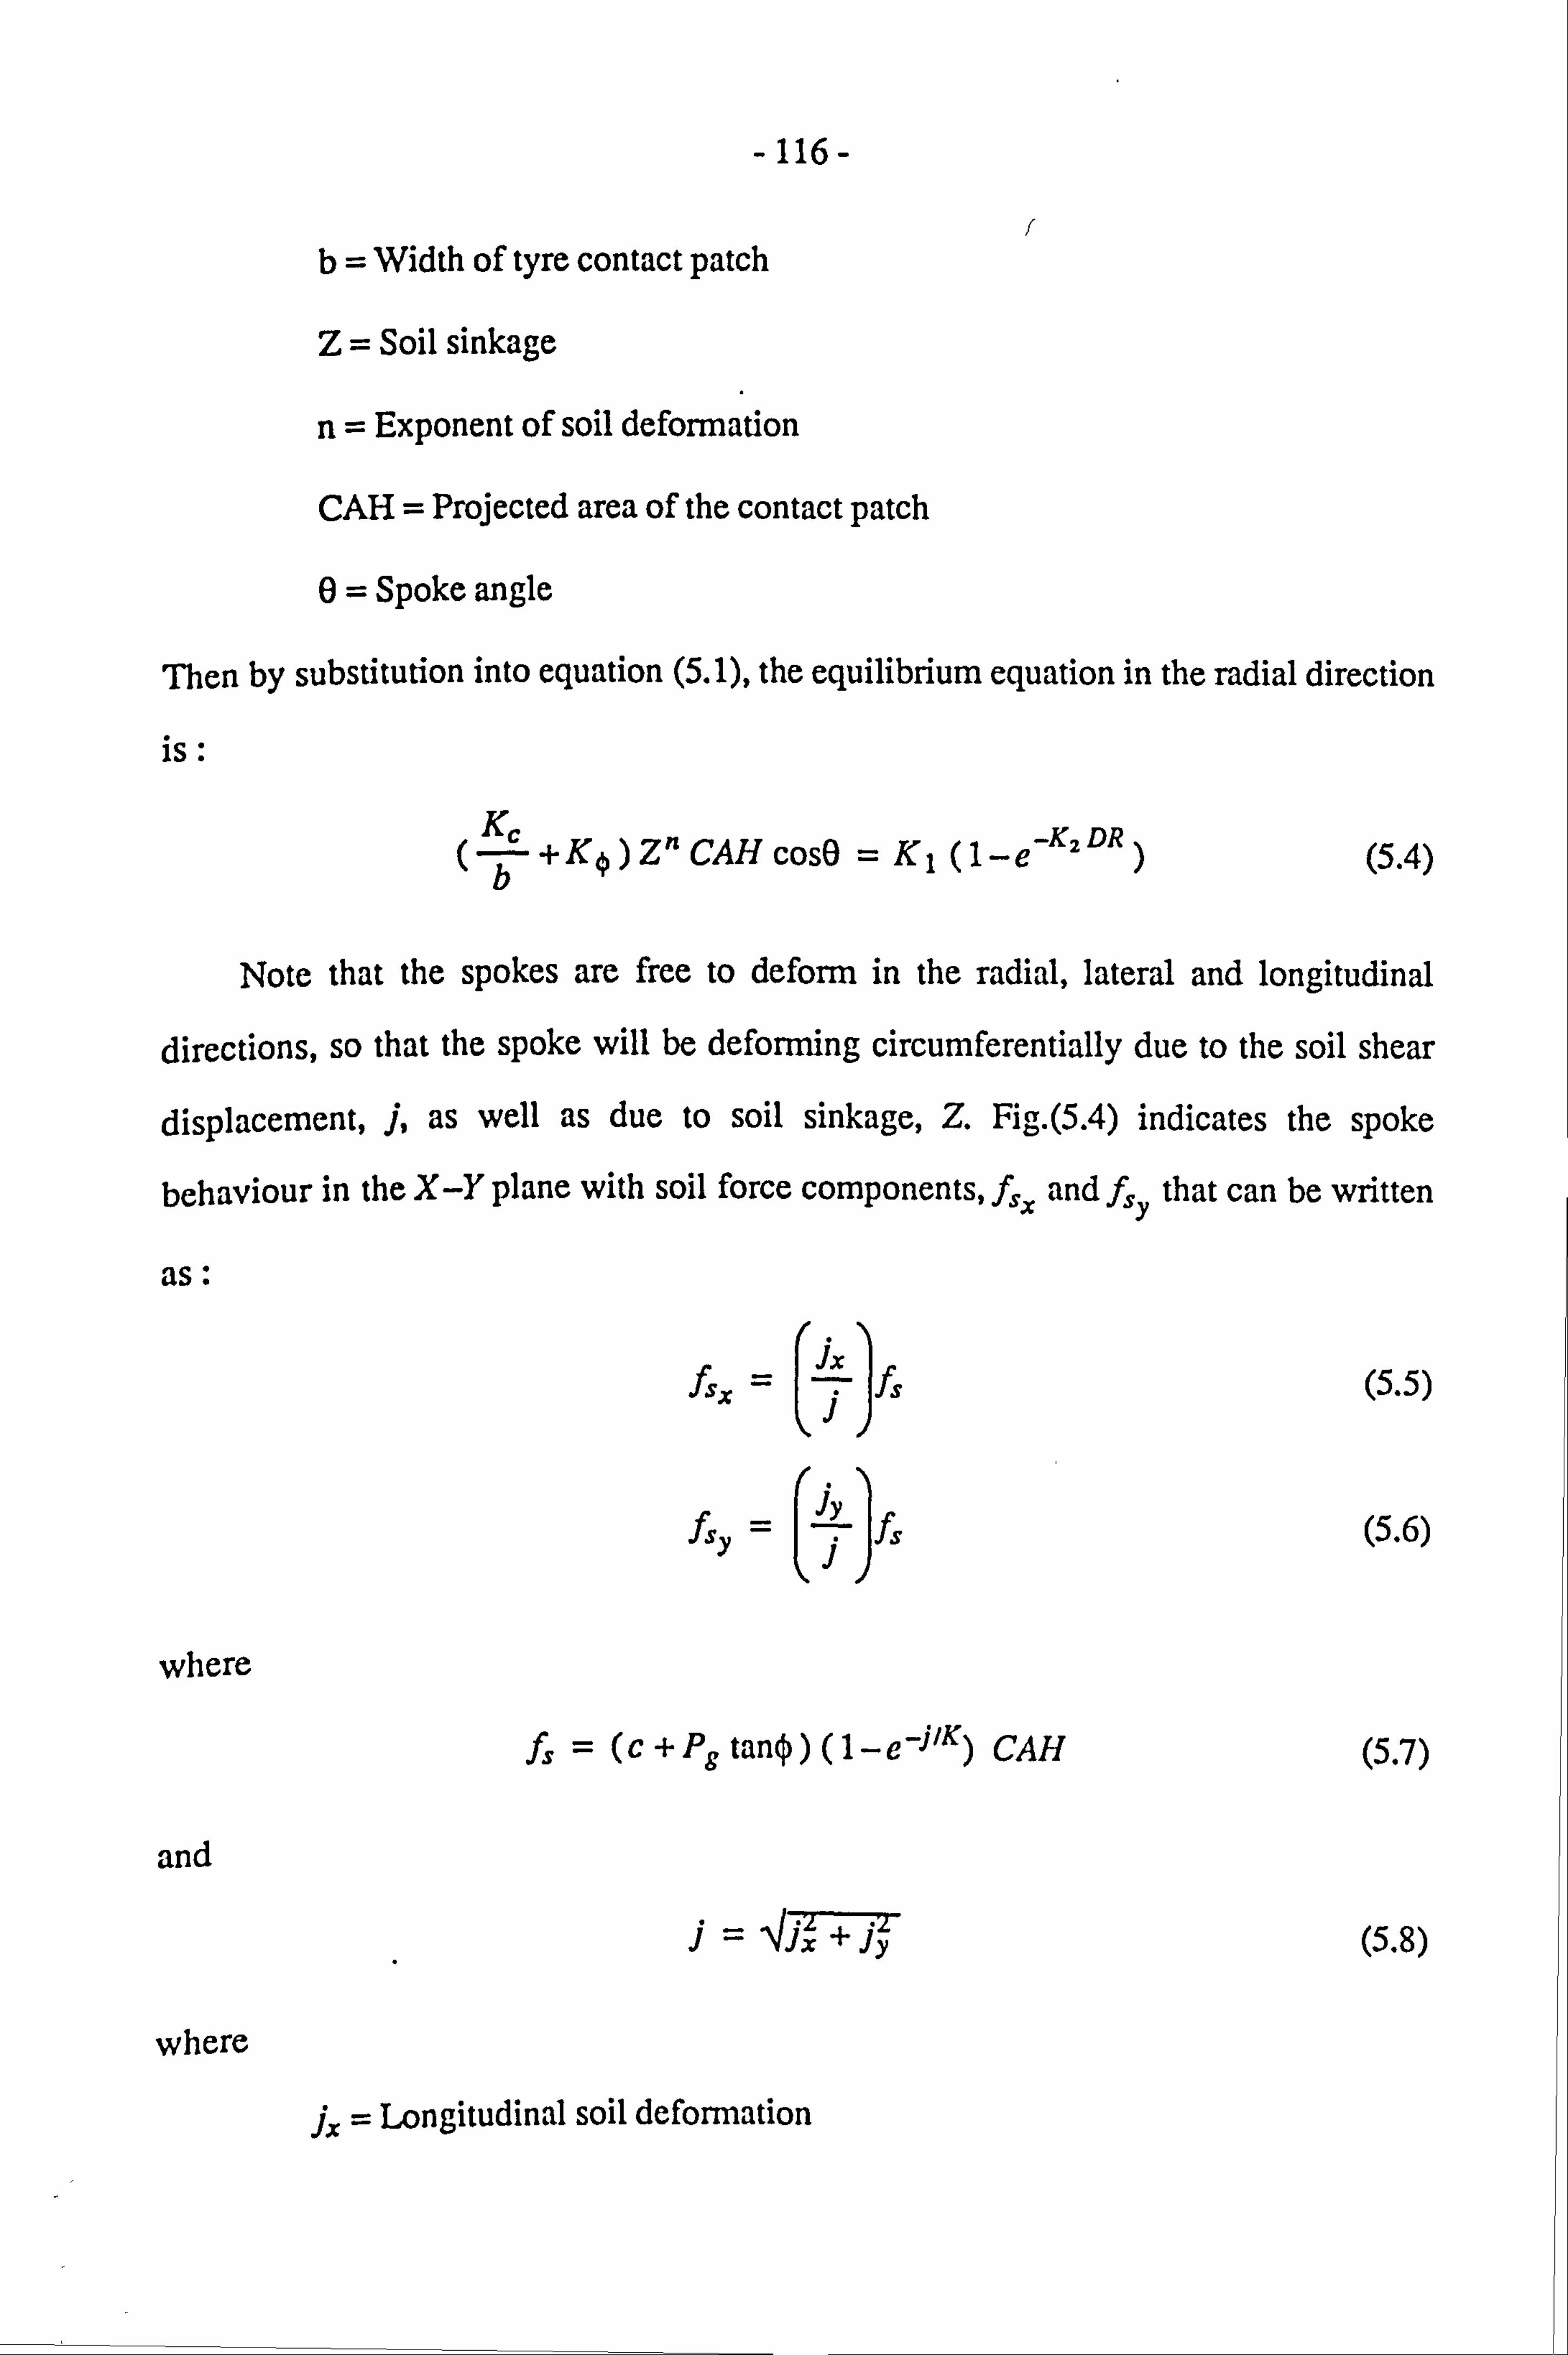
-116-
b= Width of tyre contact patch
Soil sinkage
n= Exponent of soil defonnation
CAH = Projected area of the contact patch
0= Spoke angle
f
Then by substitution into equation (5.1), the equilibrium equation in the radial direction
is :
Kc +Ko) Z'CAH cosO = K, (1-e-K2DR) (5.4) b
Note that the spokes are free to deform in the radial, lateral and longitudinal
directions, so that the spoke will be deforming circumferentially due to the soil shear
displacement, j, as well as due to soil sinkage, Z Fig. (5.4) indicates the spoke b
behaviour in the X-Y plane with soil force components, fsx and fs y that can be written
as:
fsx Xf
(5.5) s
fsy 4jy )
fv (5.6)
where
f, = (c + P,, taný )(1-e -j'K) CAH (5.7)
and
qTx T 7T (5.8)
where
Longitudinal soil defonnation
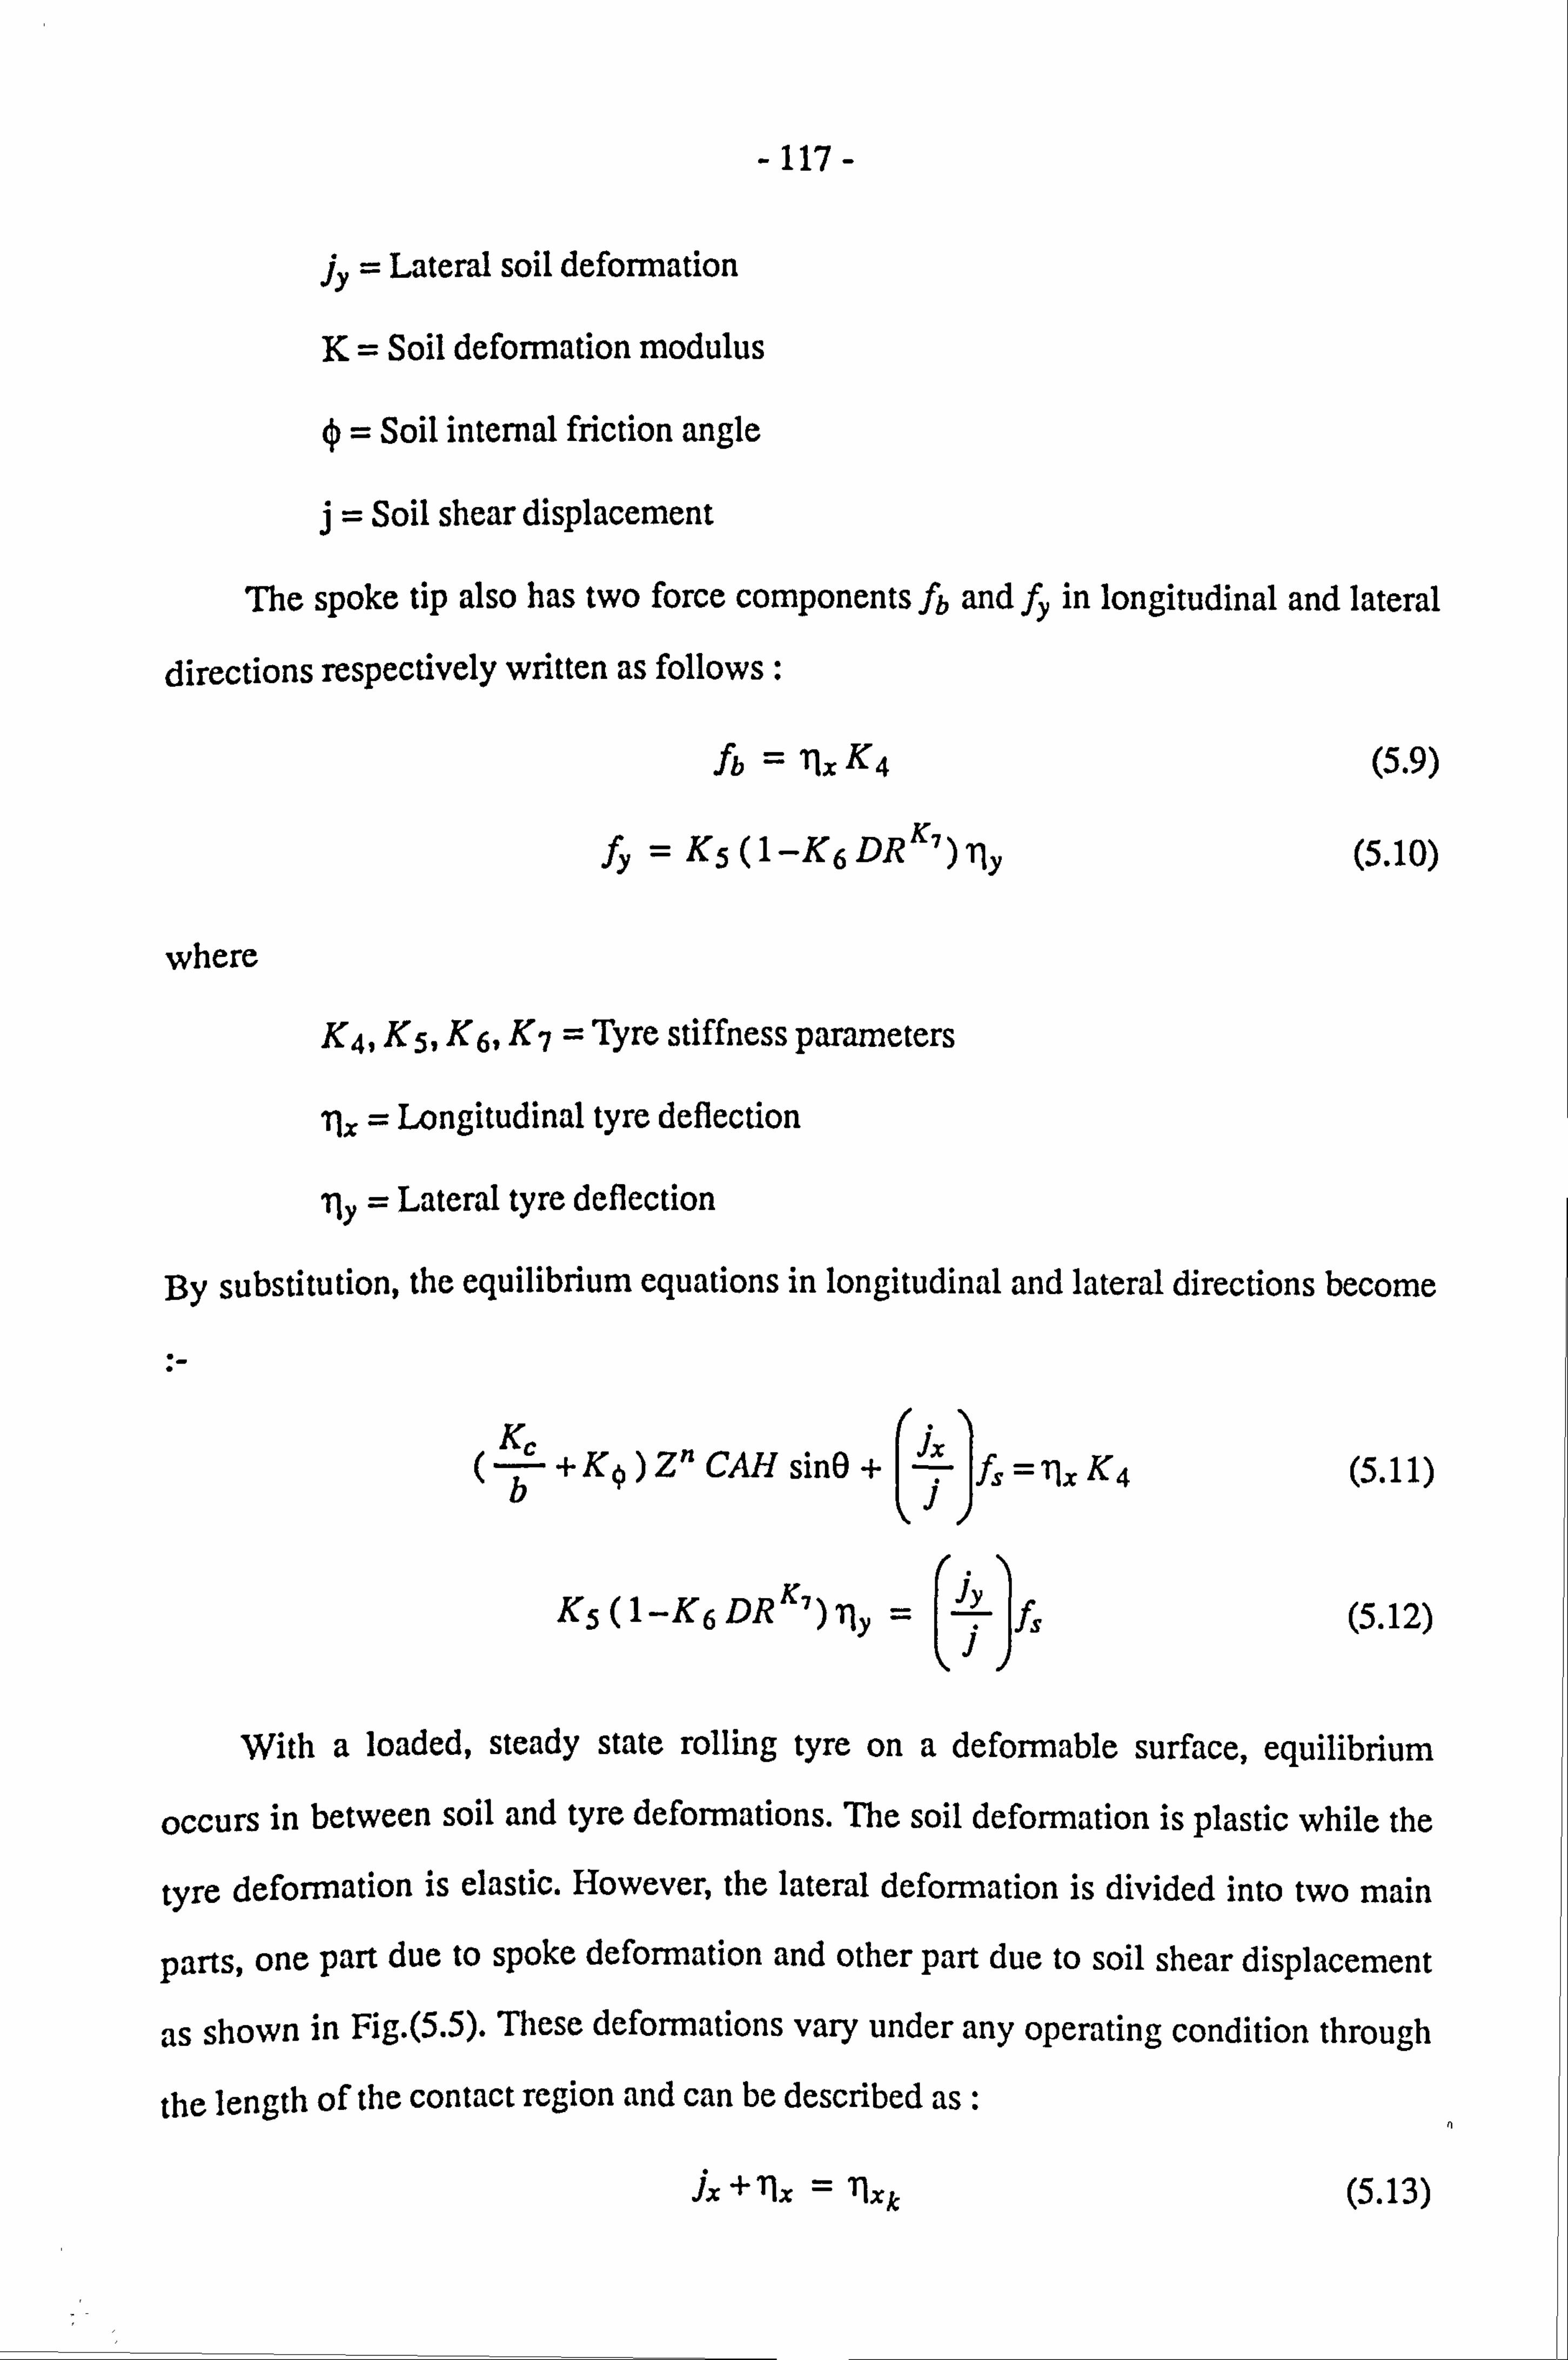
- 117-
jy = Lateral soil deformation
K= Soil deformation modulus
ý= Soil internal friction angle
Soil shear displacement
The spoke tip also has two force components fb and fy in longitudinal and lateral
directions respectively written as follows :
fb = Tjx K4
fy = K5 (1 -K6 DR K7
) ily
where
K4, K5, K6, K7 = Tyre stiffness parameters
T6 = Longitudinal tyre deflection
ily = Lateral tyre deflection
(5.9)
(5.10)
By substitution, the equilibrium equations in longitudinal and lateral directions become
Kc f, = llx K4 +Ký)Z"CAHsin0+ X
b
K5 (1-K6 DR K7 ) lly fs (5.12)
With a loaded, steady state rolling tyre on a deformable surface, equilibrium
occurs in between soil and tyre deformations. The soil deformation is plastic while the
tyre deformation is elastic. However, the lateral deformation is divided into two main
parts, one part due to spoke deformation and other part due to soil shear displacement
as shown in Fig. (5.5). These deformations vary under any operating condition through
the length of the contact region and can be described as :
jx +"x «2 llxk (5.13)
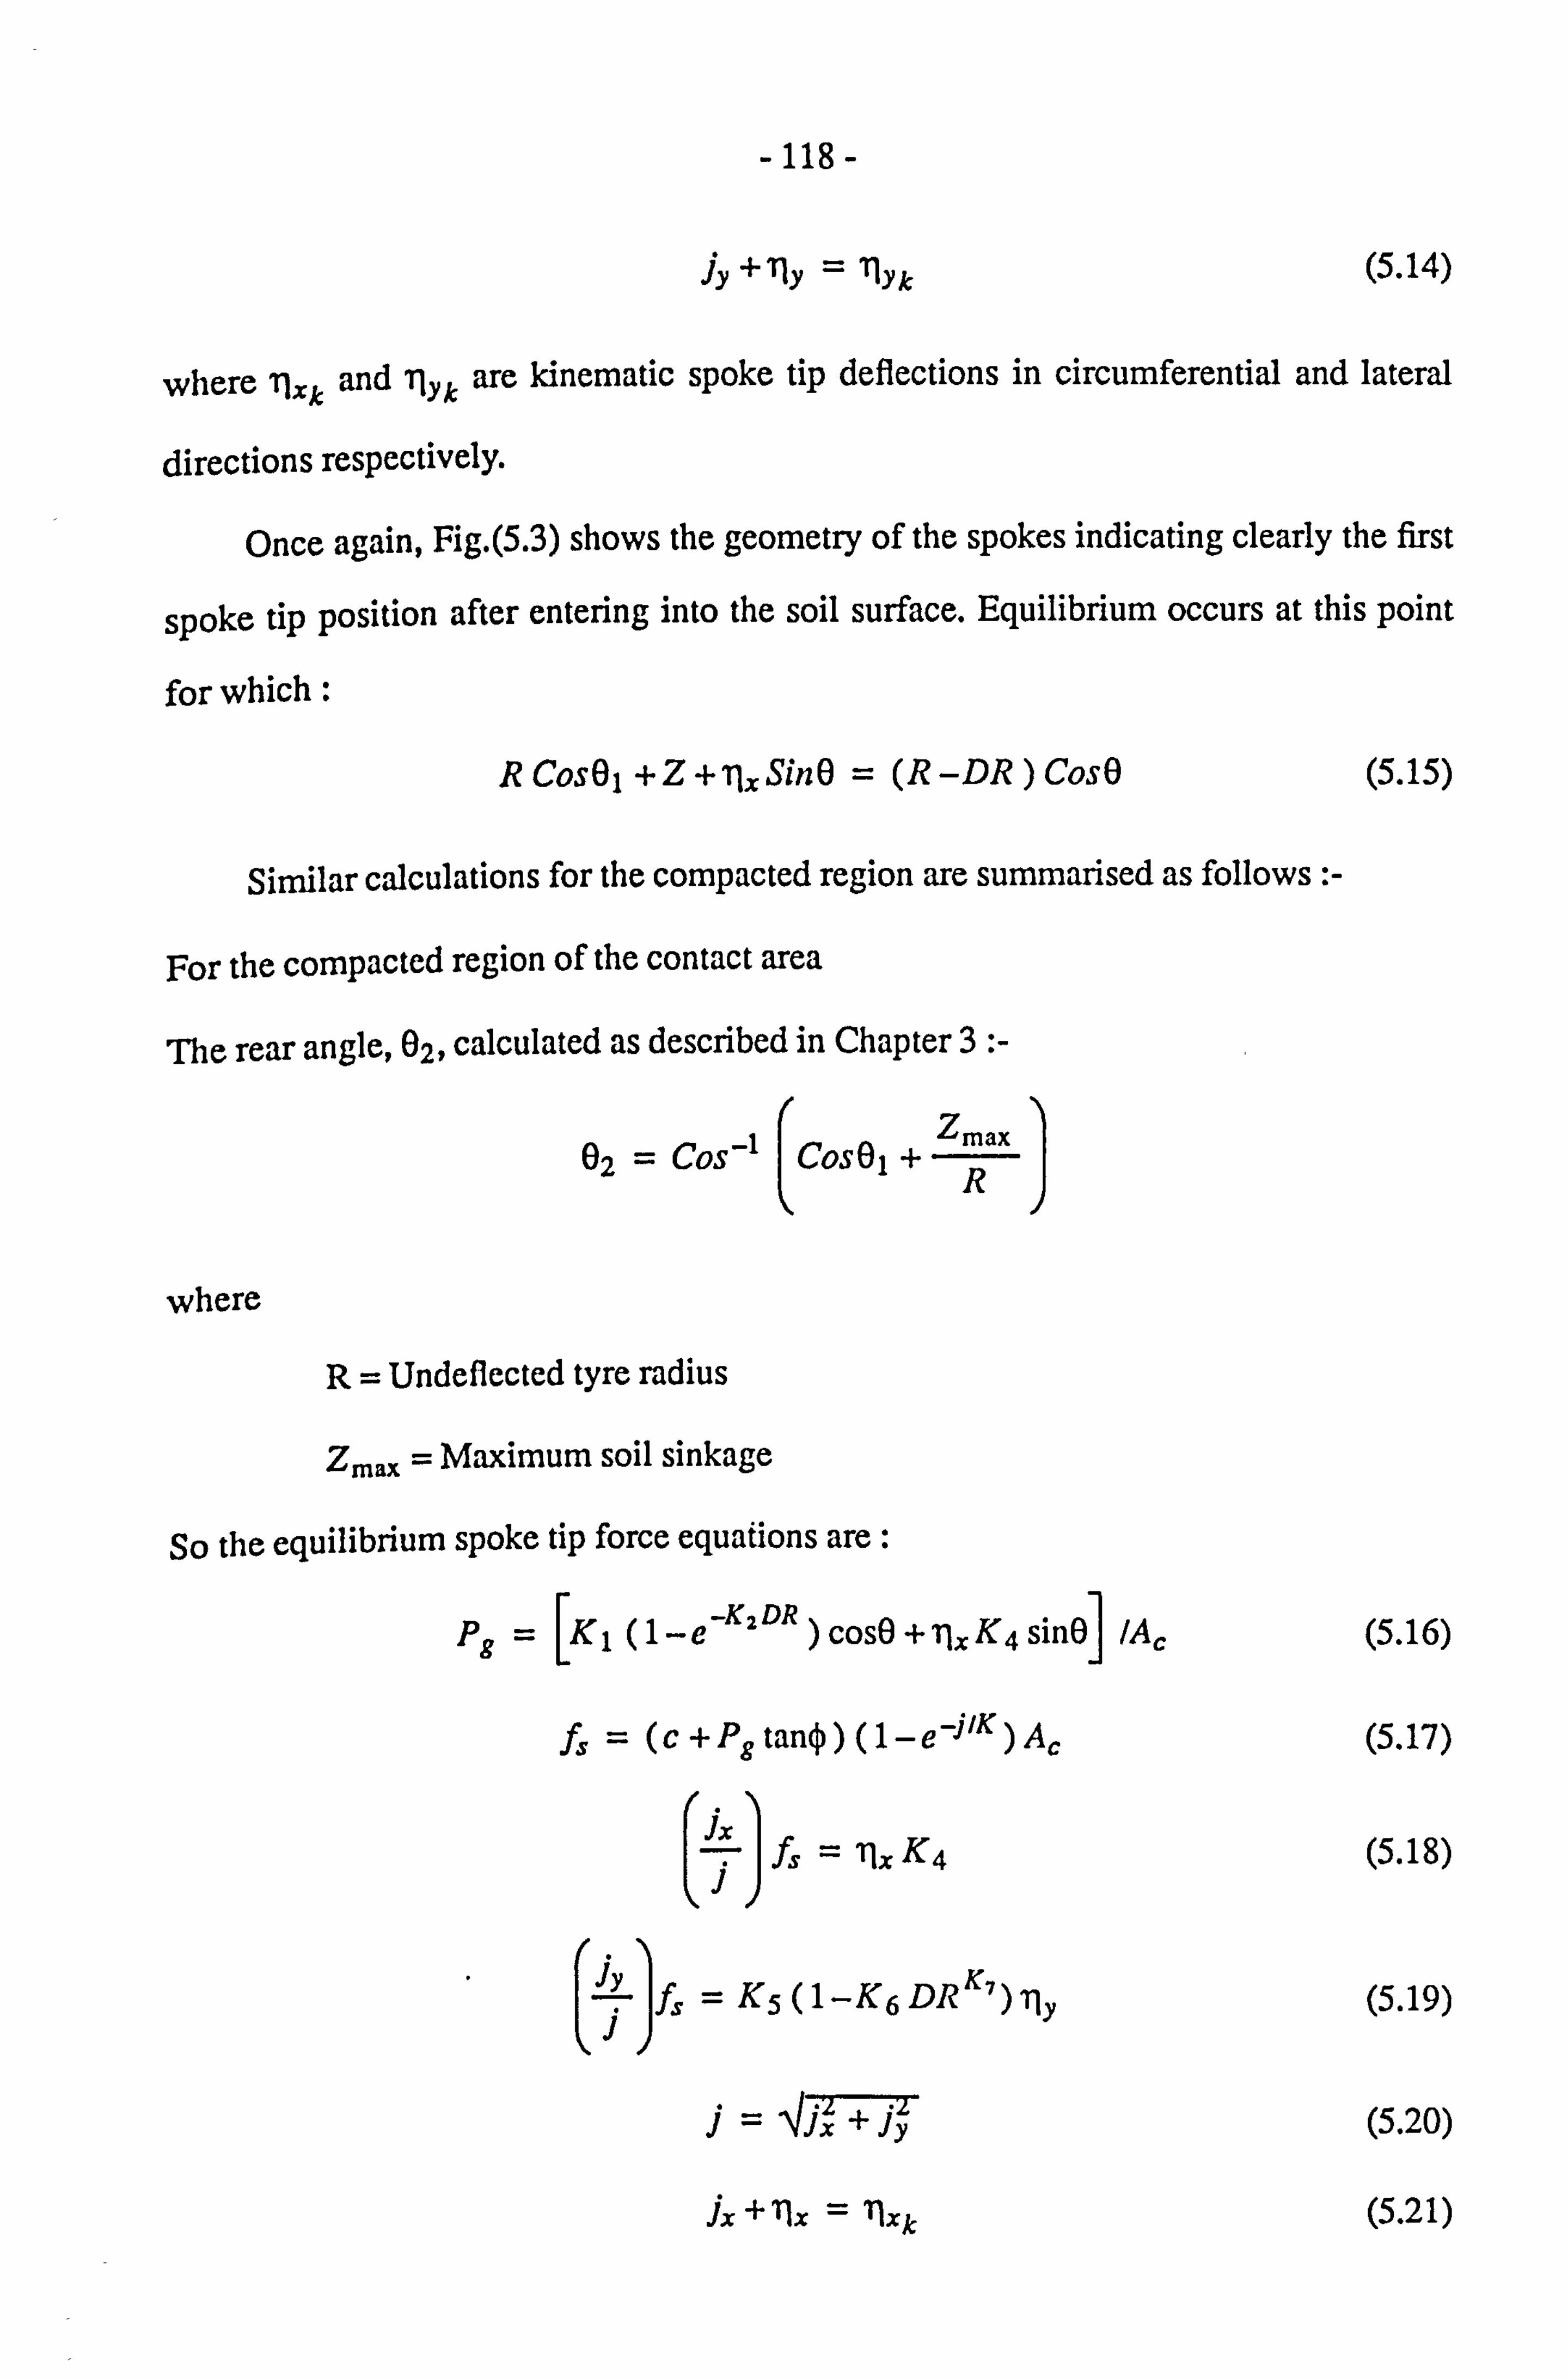
-118-
jY + 11Y *: " 'lYk (5.14)
where ilxk and 11y, are kinematic spoke tip deflections in circumferential and lateral
directions respectively.
Once again, Fig. (5.3) shows the geometry of the spokes indicating clearly the first
spoke tip position after entering into the soil surface. Equilibrium occurs at this point
for which :
R CosOl +Z+ T6 SinO = (R -DR ) CosO (5.15)
Similar calculations for the compacted region are summarised as follows :-
For the compacted region of the contact area
The rear angle, 02, calculated as described in Chapter 3 :-
02 : -- COS-1 COSO, + Zmax
R
where
R= Undeflected tyre mdius
Zmax ý Maximum soil sinkage
So the equilibrium spoke tip force equadons are:
Pg = [K
1 (1 _e-K, DR ) cosO + 71., K4 sinO] lAc (5.16)
f, (c+Pgtaný)(1-e-j'K)Ac (5.17)
ijx- ilx K4 (5.18)
4y K5 (1 -K6 DR K7 ) ily (5.19)
j= 437X T jyr (5.20)
ix + Tlx " '2 llxk (5.21)
-119-
jY + 11Y 11Y k (5.22)
R CosOl +Zm,,,, -ilx SinO = (R-DR) CosO (5.23)
where b, R, Kc, KO, ý, c and n are quoted in Chapter 4, Table(4.1).
These calculations in both the deformable. and compacted regions are then
repeated for each time increment as the spoke passes through the contact region, with
the forces being stored at each step. These steps continue until the spoke leaves the
contact region and the total wheel tyre force system is then computed over all the
length of the contact area.
The relationships between the tyre deflections and their corresponding forces, are
modelled by rolling a tyre on hard ground and are described by a set of parameters
called "spoke stiffness parameters" which are chosen and compared with experimental
data obtained by Schwanghart [198 1) for a 7.50 x 18 front tractor tyre rolling on a hard
surface as shown in Figs. (5.6).
lbe objective in choosing the spoke stiffness parameters KI, K21 K4, K5, K6 and
K7 is to match the shape of the relationships between the gross tyre forces and the tyre
deflection and sideslip angle on hard ground. Parameters K, and K5 govern the
magnitudes of the maximum values of the radial and lateral spoke forces respectively.
Other parameters are chosen to control the shape of the spoke tip force relationships
with various deflections in order to get a good pressure distribution throughout length
of the contact region. The remaining parameters concern the shear force and the soil
shear displacement relationships between the spoke tips and the ground.
The spoke stiffness parameters used are :-
KI=4.8kN .
K2 = 64 m-1
-120-
14 kIV Im
K5 = 15.4 k? Vlm I
K6 ý-- 100
K7 ý-- 1.95 (with DR in metres)
Equations (5.4), (5.7), (5.8) and (5.11 to 5.15) become eight simultaneous
equations in eight unknowns, j, jy, j, Z, %, 71y, DR and fs. To obtain a solution, a
numerical analysis must be used and a computer programme is therefore required.
Finally, the spoke tip deflections and soil deformations are used to calculate tyre
forces in the lateral, longitudinal and vertical directions via the stiffness parameters
mentioned above. However, the total vertical force components must be equal to the
input tyre load. This condition can thus be stated as :-
i=N i=N F, due bending + f; due radial (5.24)
As a result, the total vertical force is then expressed as :
i=N i=N K2DR Fz T6 K4 sinO + KI (1-e- COSO (5.25)
where
i= Spoke number
N= Number of spokes in the contact region
Note that for a rolling tyre on a hard surface the spoke tip may remain stationary
at the first point of contact with the ground or it may slide to an equilibrium position at
which the carcass forces and friction forces are equal. In fact, the main difference
between the spoke behaviour on hard and soft surfaces is that in case of off-road
surfaces, the spoke tip is never in the kinematic (no sliding) condition. The spoke tips
must always slide due to the soil shear displacement until an equilibrium position is
- 121 -
established.
With regard to the behaviour of the tyre on a hard surface, Fig. (5.7a) illustrates
the small element for the tyre under braking conditions which describes the
longitudinal deformation, 5x, as follows : -
Suppose that A moves small a distance, x, and B moves distance, X', at the same time,
8,, where;
R co 8t (5.26)
uöt (5.27)
The difference between these two distances is called "the longitudinal deformation",
can be expressed as:
Bx = X, -x (OR
X, (5.28) u
where
Tyre forward velocity
co = Spin velocity of the tyre
51 = Small time increment
X, X'= Distance in longitudinal direction
5x = Longitudinal tyre deflection
and as described in Chapter 4, the wheelslip, s, is equal to (1- co R ), then U
5x =sX,
or G-S) x
s 9x- This gives the longitudinal deformation as:
(5.29)
(5.30)
s 8X = (5.31) (1-S)
-122-
Therefore, the lateral deformation, 5y, can then be calculated as :
tancc 5y 1-S )x (5.32)
Similarly, Fig. (5.7b) indicates the small element for a rolling tyre under tractive
operating conditions which leads to the longitudinal and lateral deformations as follows
k= sx (5.33)
8y =(1 -s ) tanoc x_ (5.34)
Note also that the longitudinal and lateral deformations described in equations
(5.13), (5.14), (5.21) and (5.22) in the case of the traction condition, can be now
expressed as :-
lix + ix = sx (5.35)
Ily + jy = tancc (1 -s )x (5.36)
and in the case of the braking tyre, these become:
s Jx = -( -, , lx +*
-S) x (5.37)
tana -S)
x (5.38) Ily + jy T -,
where x is longitudinal displacement.
5.4. SPOKE TYRE COMPUTER PROGRAMME
The method of solution is summarised by the flow chart in Fig-(5.8). The flow chart
shows the programme structure including seven subroutines called; Soft, Hard, Sharp,
Adjust, Angle, Sinkage and Plot. The main programme is used to specify the running
conditions and to call all these subroutines.
This programme is capable of showing graphically, the tyre and soil forces and
their deformation distributions L, fy, f,, fg, f,, ilx, ily, DR, jx, jy, j and Z. In order to
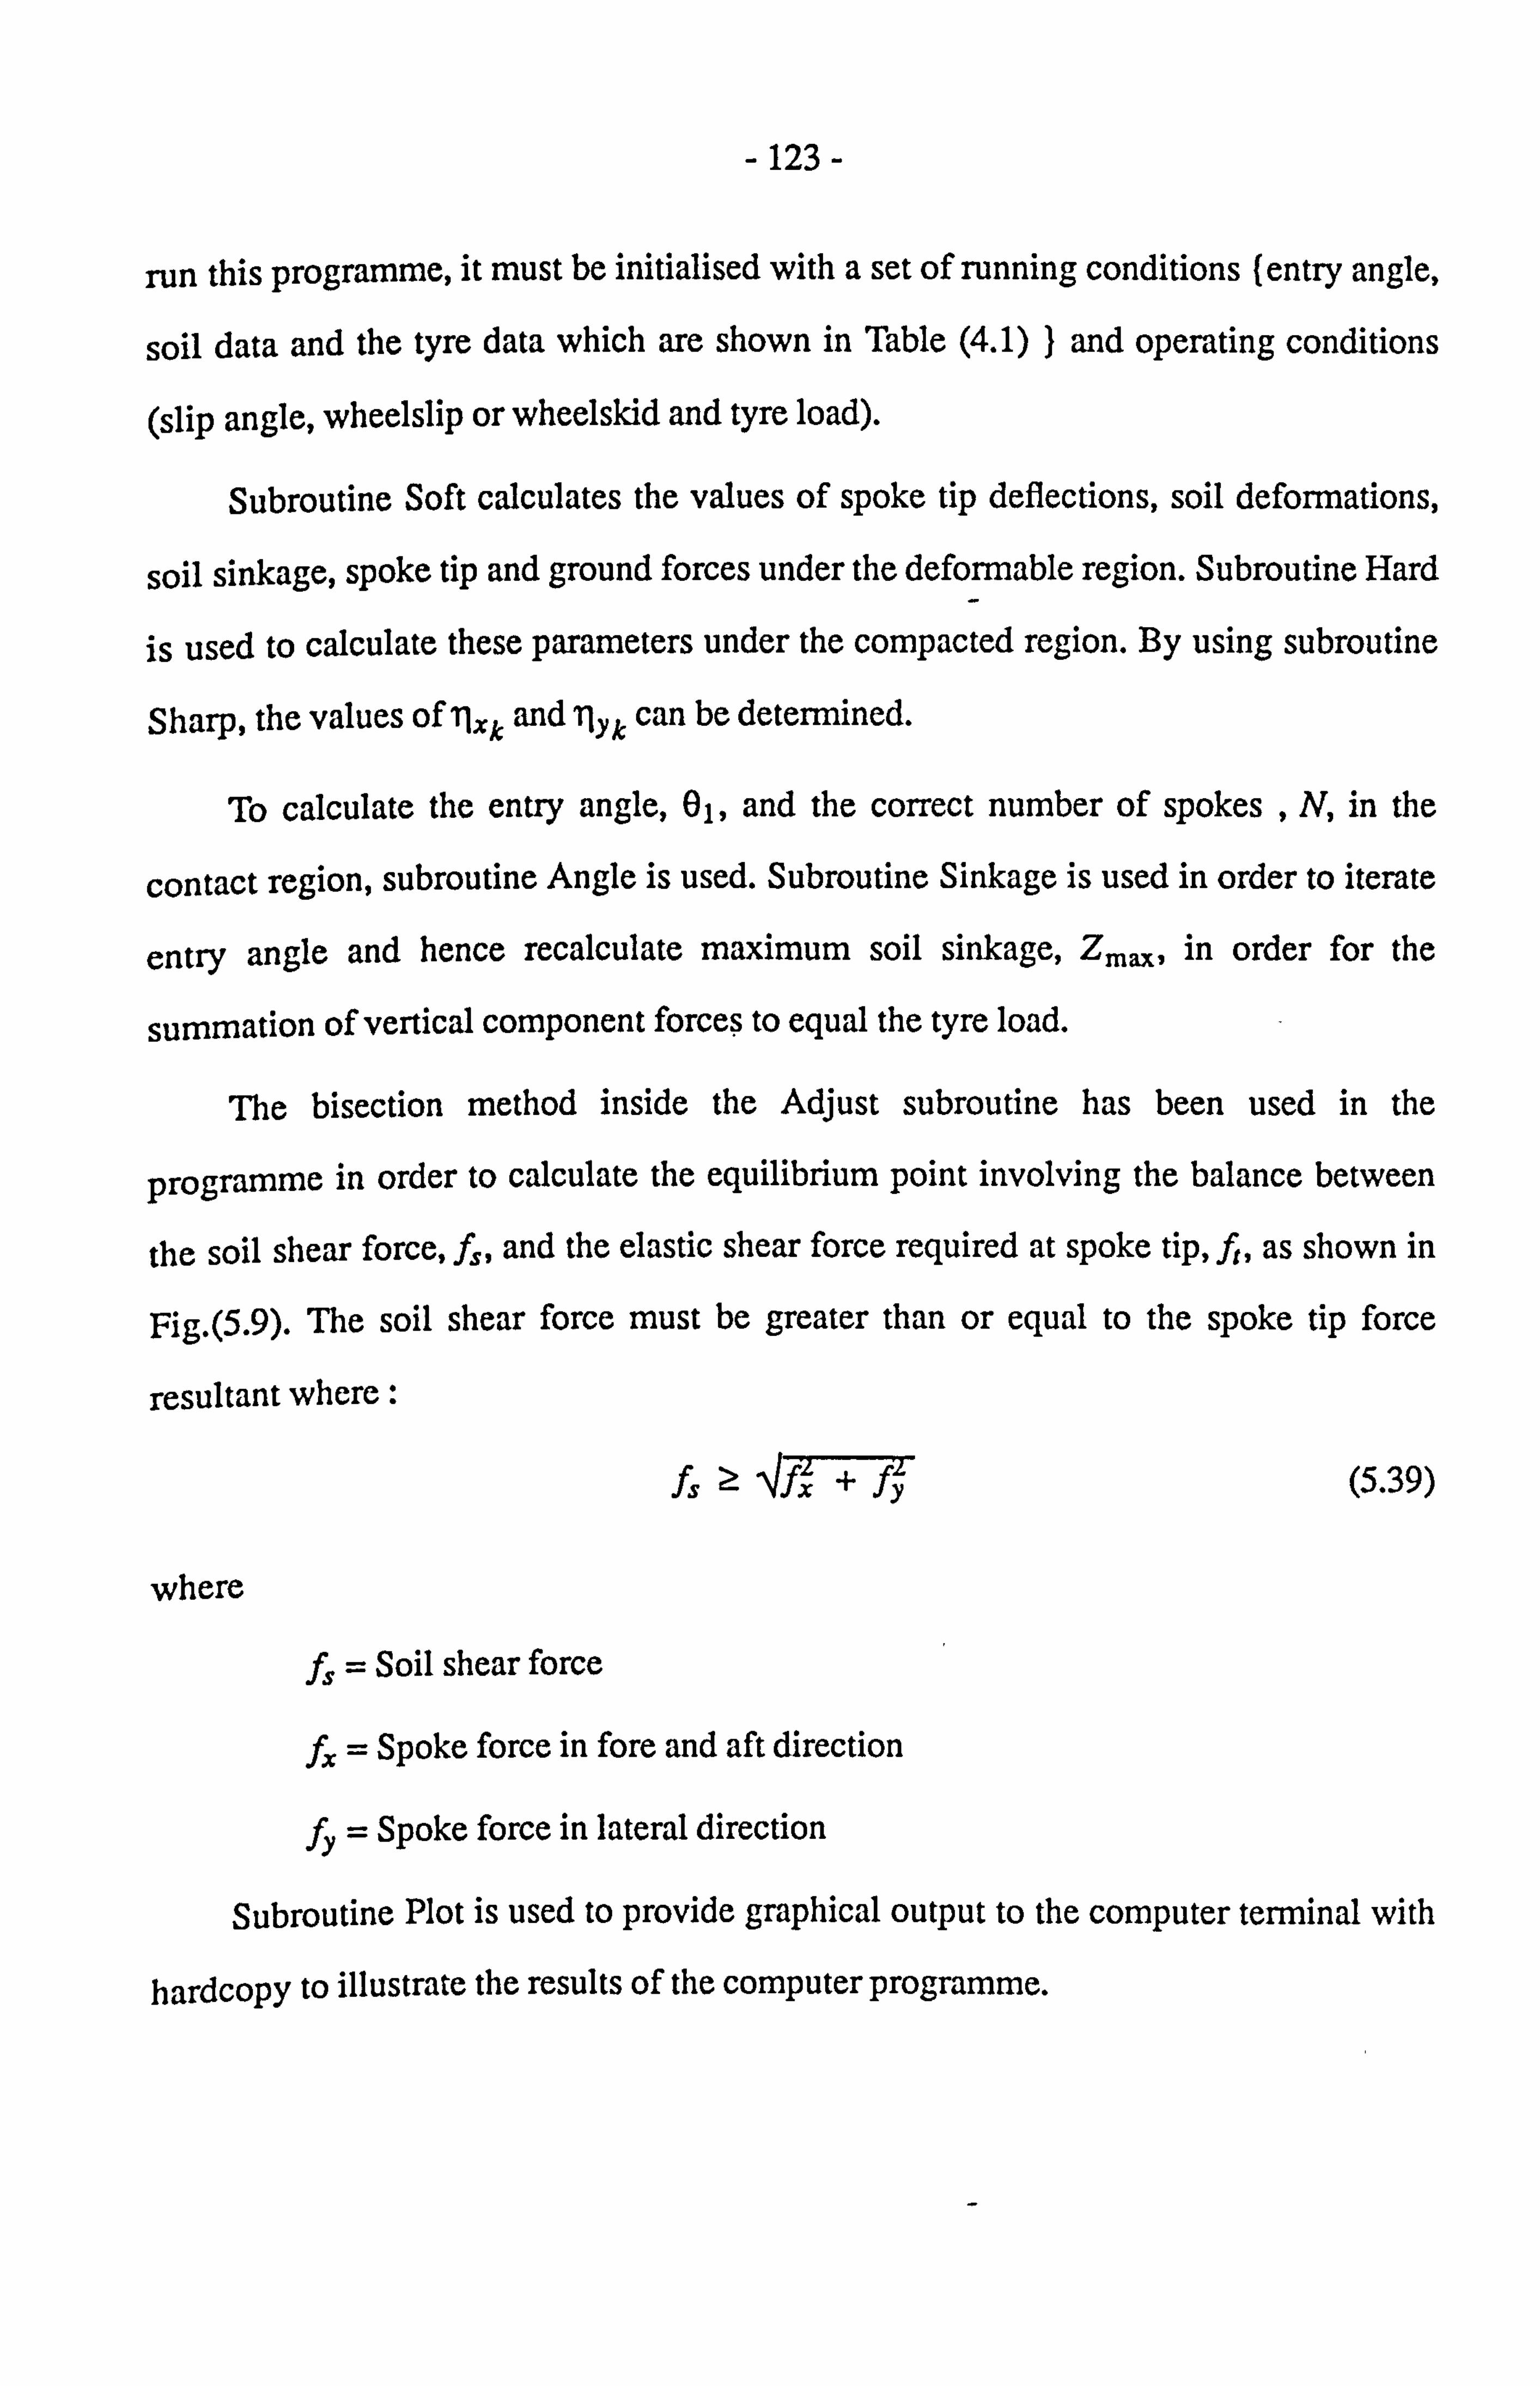
-123-
run this programme, it must be initialised with a set of running conditions (entry angle,
soil data and the tyre data which are shown in Table (4.1) 1 and operating conditions
(slip angle, wheelslip or wheelskid and tyre load).
Subroutine Soft calculates the values of spoke tip deflections, soil defonnations,
soil sinkage, spoke tip and ground forces under the deformable region. Subroutine Hard
is used to calculate these parameters under the compacted region. By using subroutine
Sharp, the values of Ijxk and ily, can be determined.
To calculate the entry angle, 01, and the correct number of spokes , N, in the
contact region, subroutine Angle is used. Subroutine Sinkage is used in order to iterate
,, in order for the entry angle and hence recalculate maximum soil sinkage, Z,,,,,,
summation of vertical component forces to equal the tyre load.
The bisection method inside the Adjust subroutine has been used in the
programme in order to calculate the equilibrium point involving the balance between
the soil shear force, f,,, and the elastic shear force required at spoke tip, ft, as shown in
Fig. (5.9). The soil shear force must be greater than or equal to the spoke tip force
resultant where :
fs ; -> 47X -+-f"YX' (5.39)
where
f, = Soil shear force
L= Spoke force in fore and aft direction
fy = Spoke force in lateral direction
Subroutine Plot is used to provide graphical output to the computer terminal with
hardcopy to illustrate the results of the computer programme.
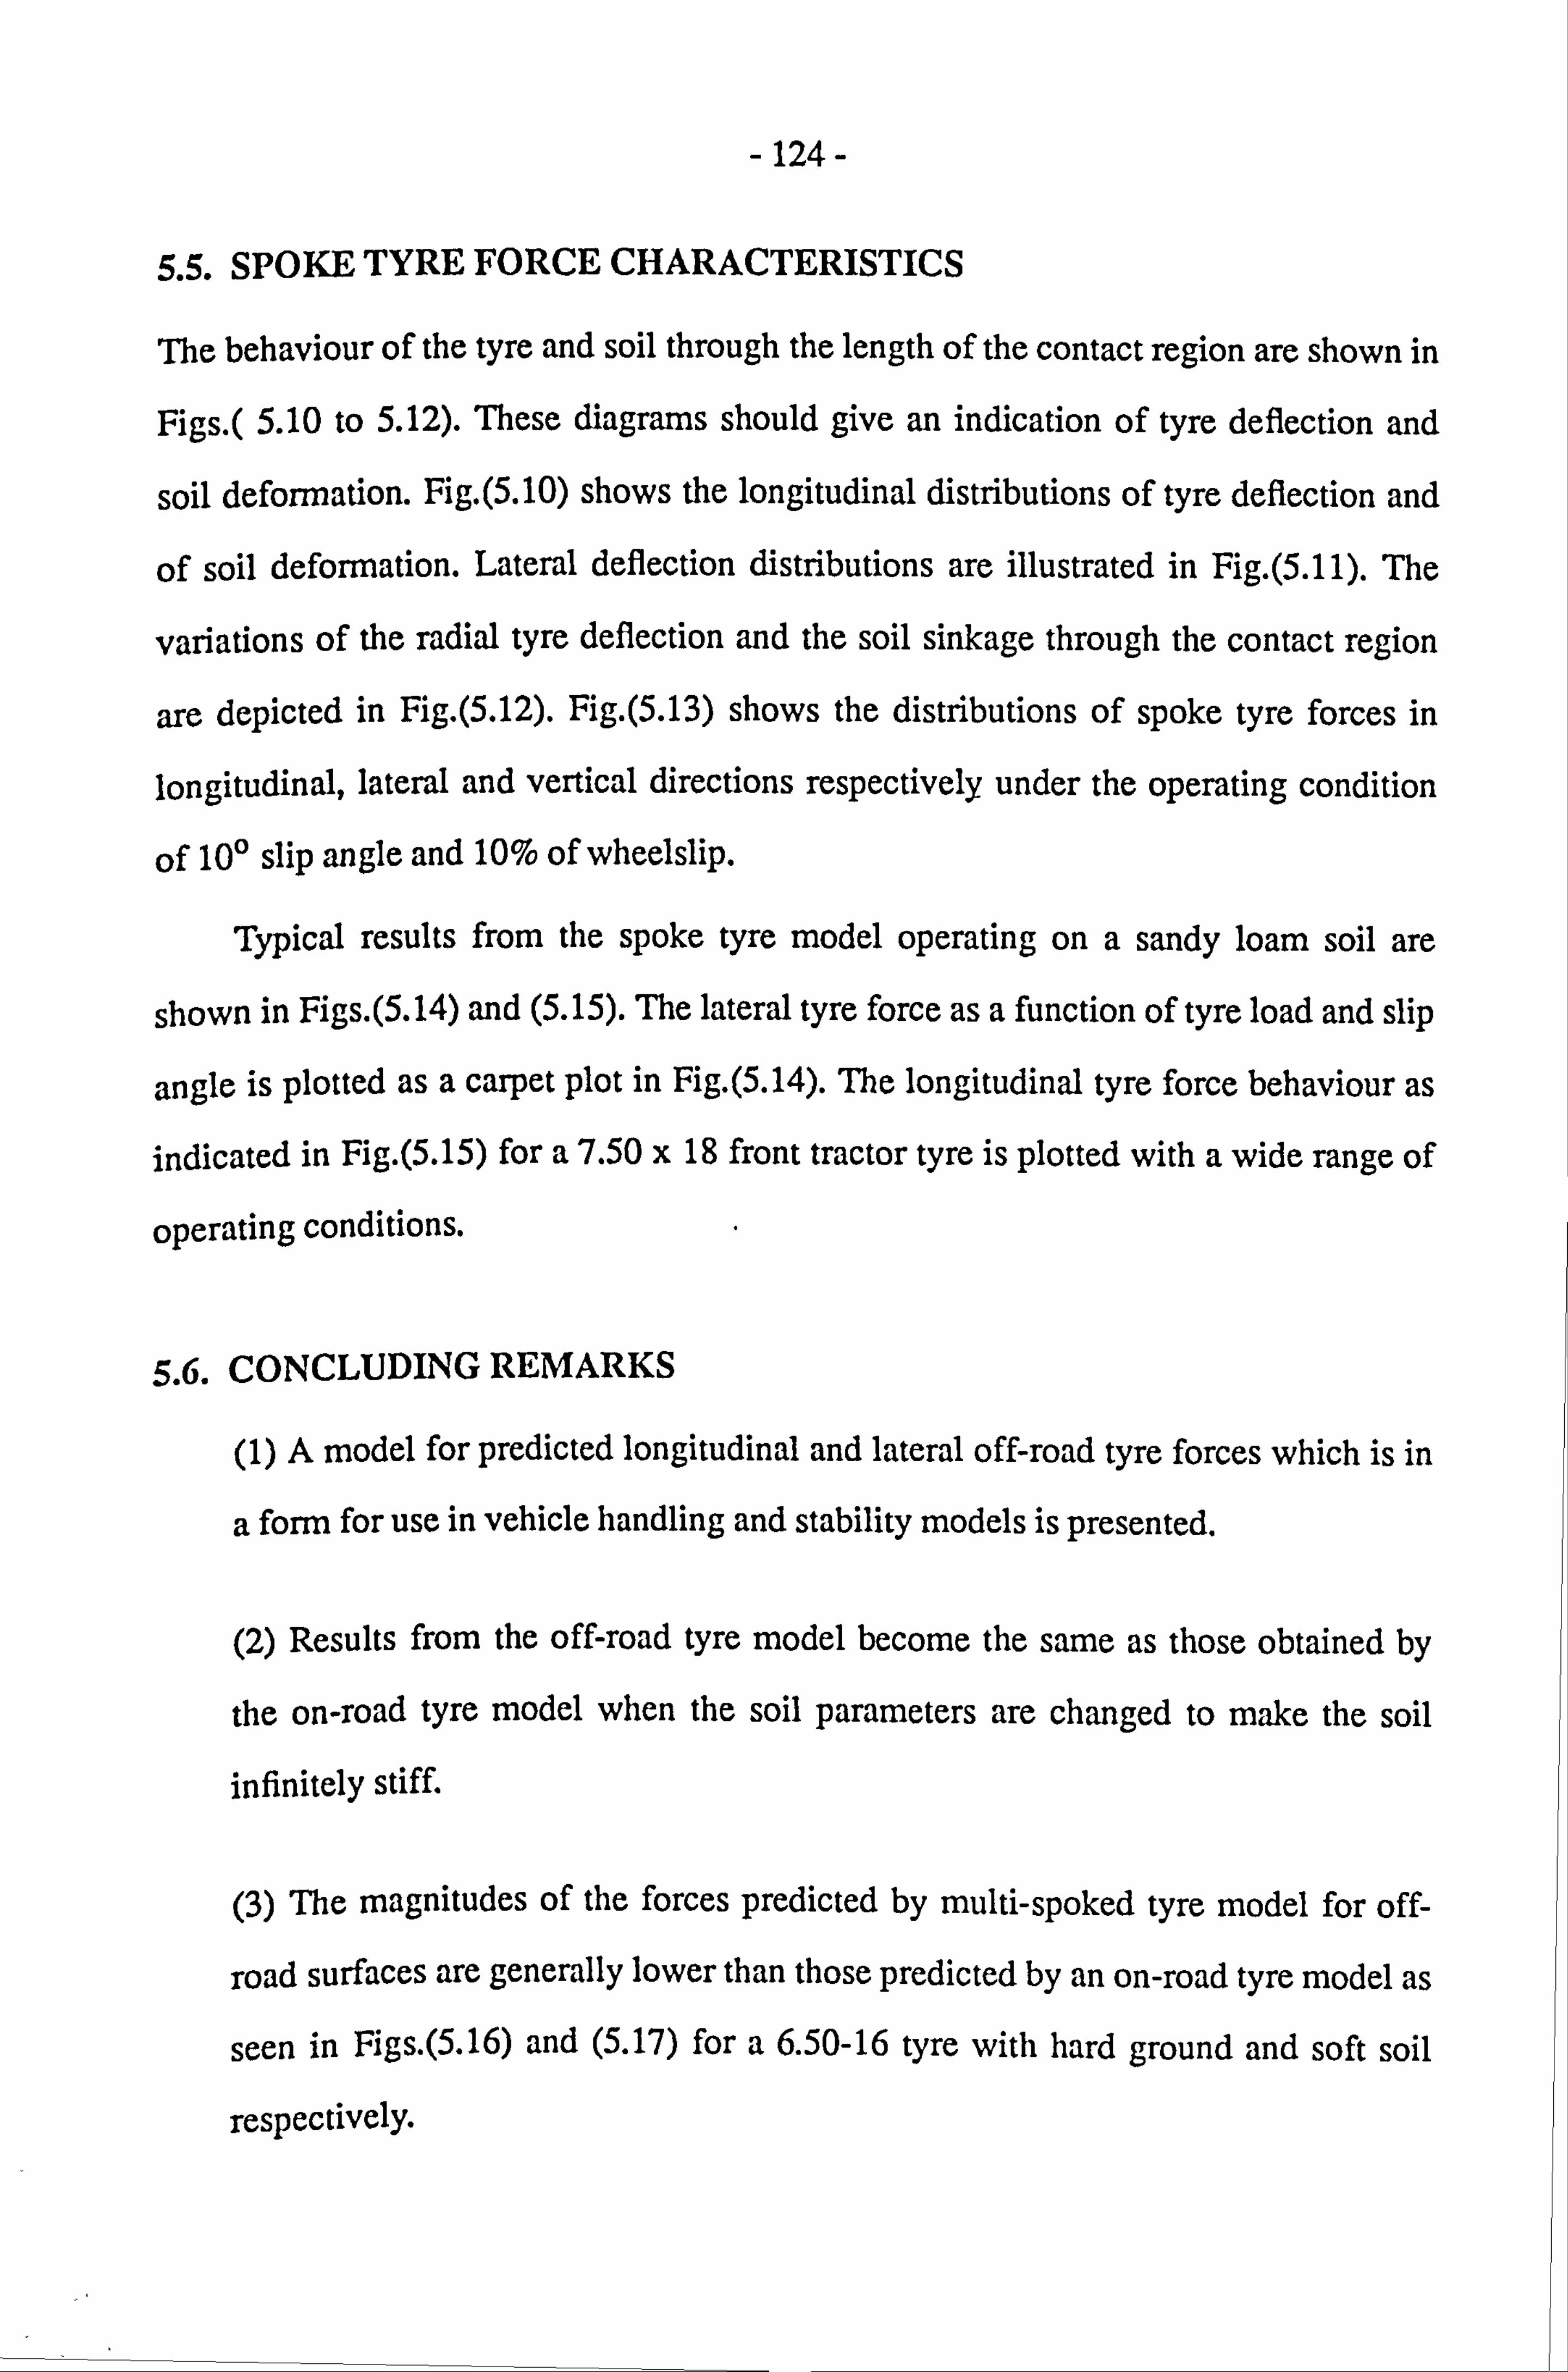
-124-
5.5. SPOKE TYRE FORCE CHARACTERISTICS
The behaviour of the tyre and soil through the length of the contact region are shown in
Figs. ( 5.10 to 5.12). These diagrams should give an indication of tyre deflection and
soil deformation. Fig. (5.10) shows the longitudinal distributions of tyre deflection and
of soil deformation. Lateral deflection distributions are illustrated in Fig. (5.11). The
variations of the radial tyre deflection and the soil sinkage through the contact region
are depicted in Fig. (5-12). Fig. (5.13) shows the distributions of spoke tyre forces in
longitudinal, lateral and vertical directions respectively under the operating condition
of 100 slip angle and 10% of wheelslip.
Typical results from the spoke tyre model operating on a sandy loam soil are
shown in Figs. (5.14) and (5.15). The lateral tyre force as a function Of tyre load and slip
angle is plotted as a carpet plot in Fig. (5.14). ne longitudinal tyre force behaviour as
indicated in Fig. (5.15) for a 7.50 x 18 front tractor tyre is plotted with a wide range of
operating conditions.
5.6. CONCLUDING REMARKS
(1) A model for predicted longitudinal and lateral off-road tyre forces which is in
a form for use in vehicle handling and stability models is presented.
(2) Results from the off-road tyre model become the same as those obtained by
the on-road tyre model when the soil parameters are changed to make the soil
infinitely stiff
(3) The magnitudes of the forces predicted by multi-spoked tyre model for off-
road surfaces are generally lower than those predicted by an on-road tyre model as
seen in Figs. (5.16) and (5.17) for a 6.50-16 tyre with hard ground and soft soil
respectively.
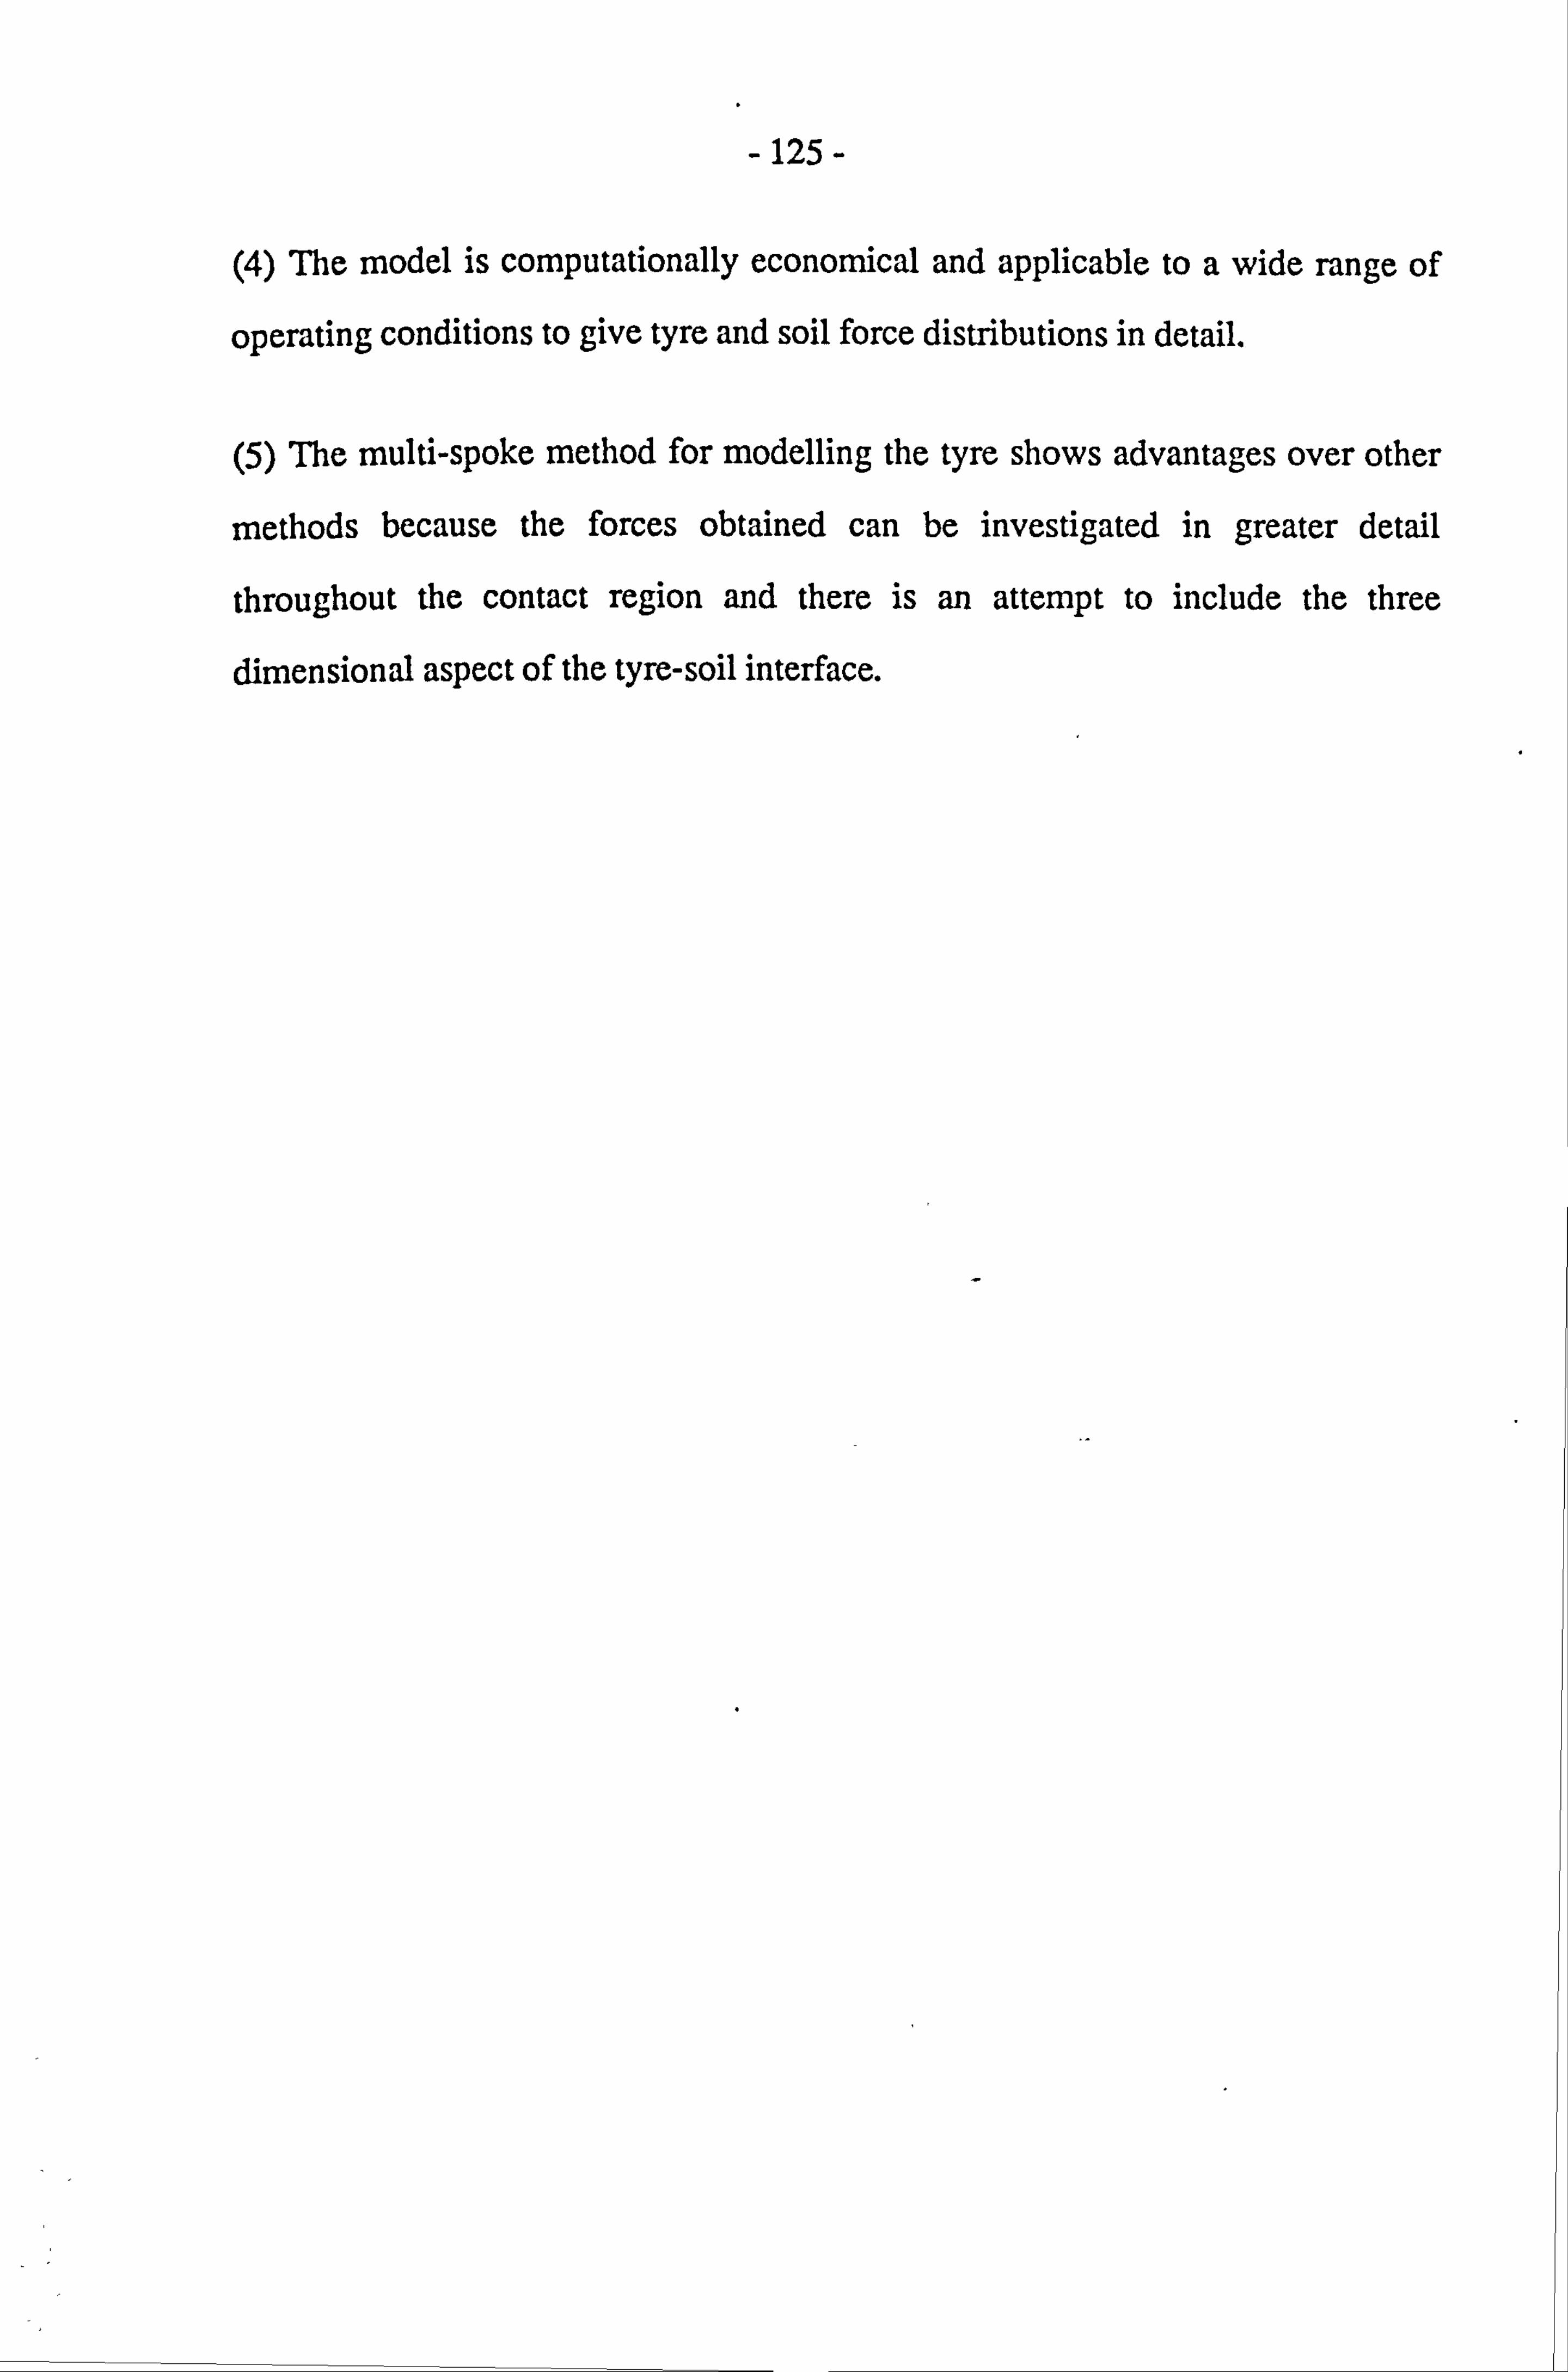
-125-
(4) The model is computationally economical and applicable to a wide range of
operating conditions to give tyre and soil force distributions in detail.
(5) The multi-spoke method for modelling the tyre shows advantages over other
methods because the forces obtained can be investigated in greater detail
throughout the contact region and there is an attempt to include the three
dimensional aspect of the tyre-soil interface.
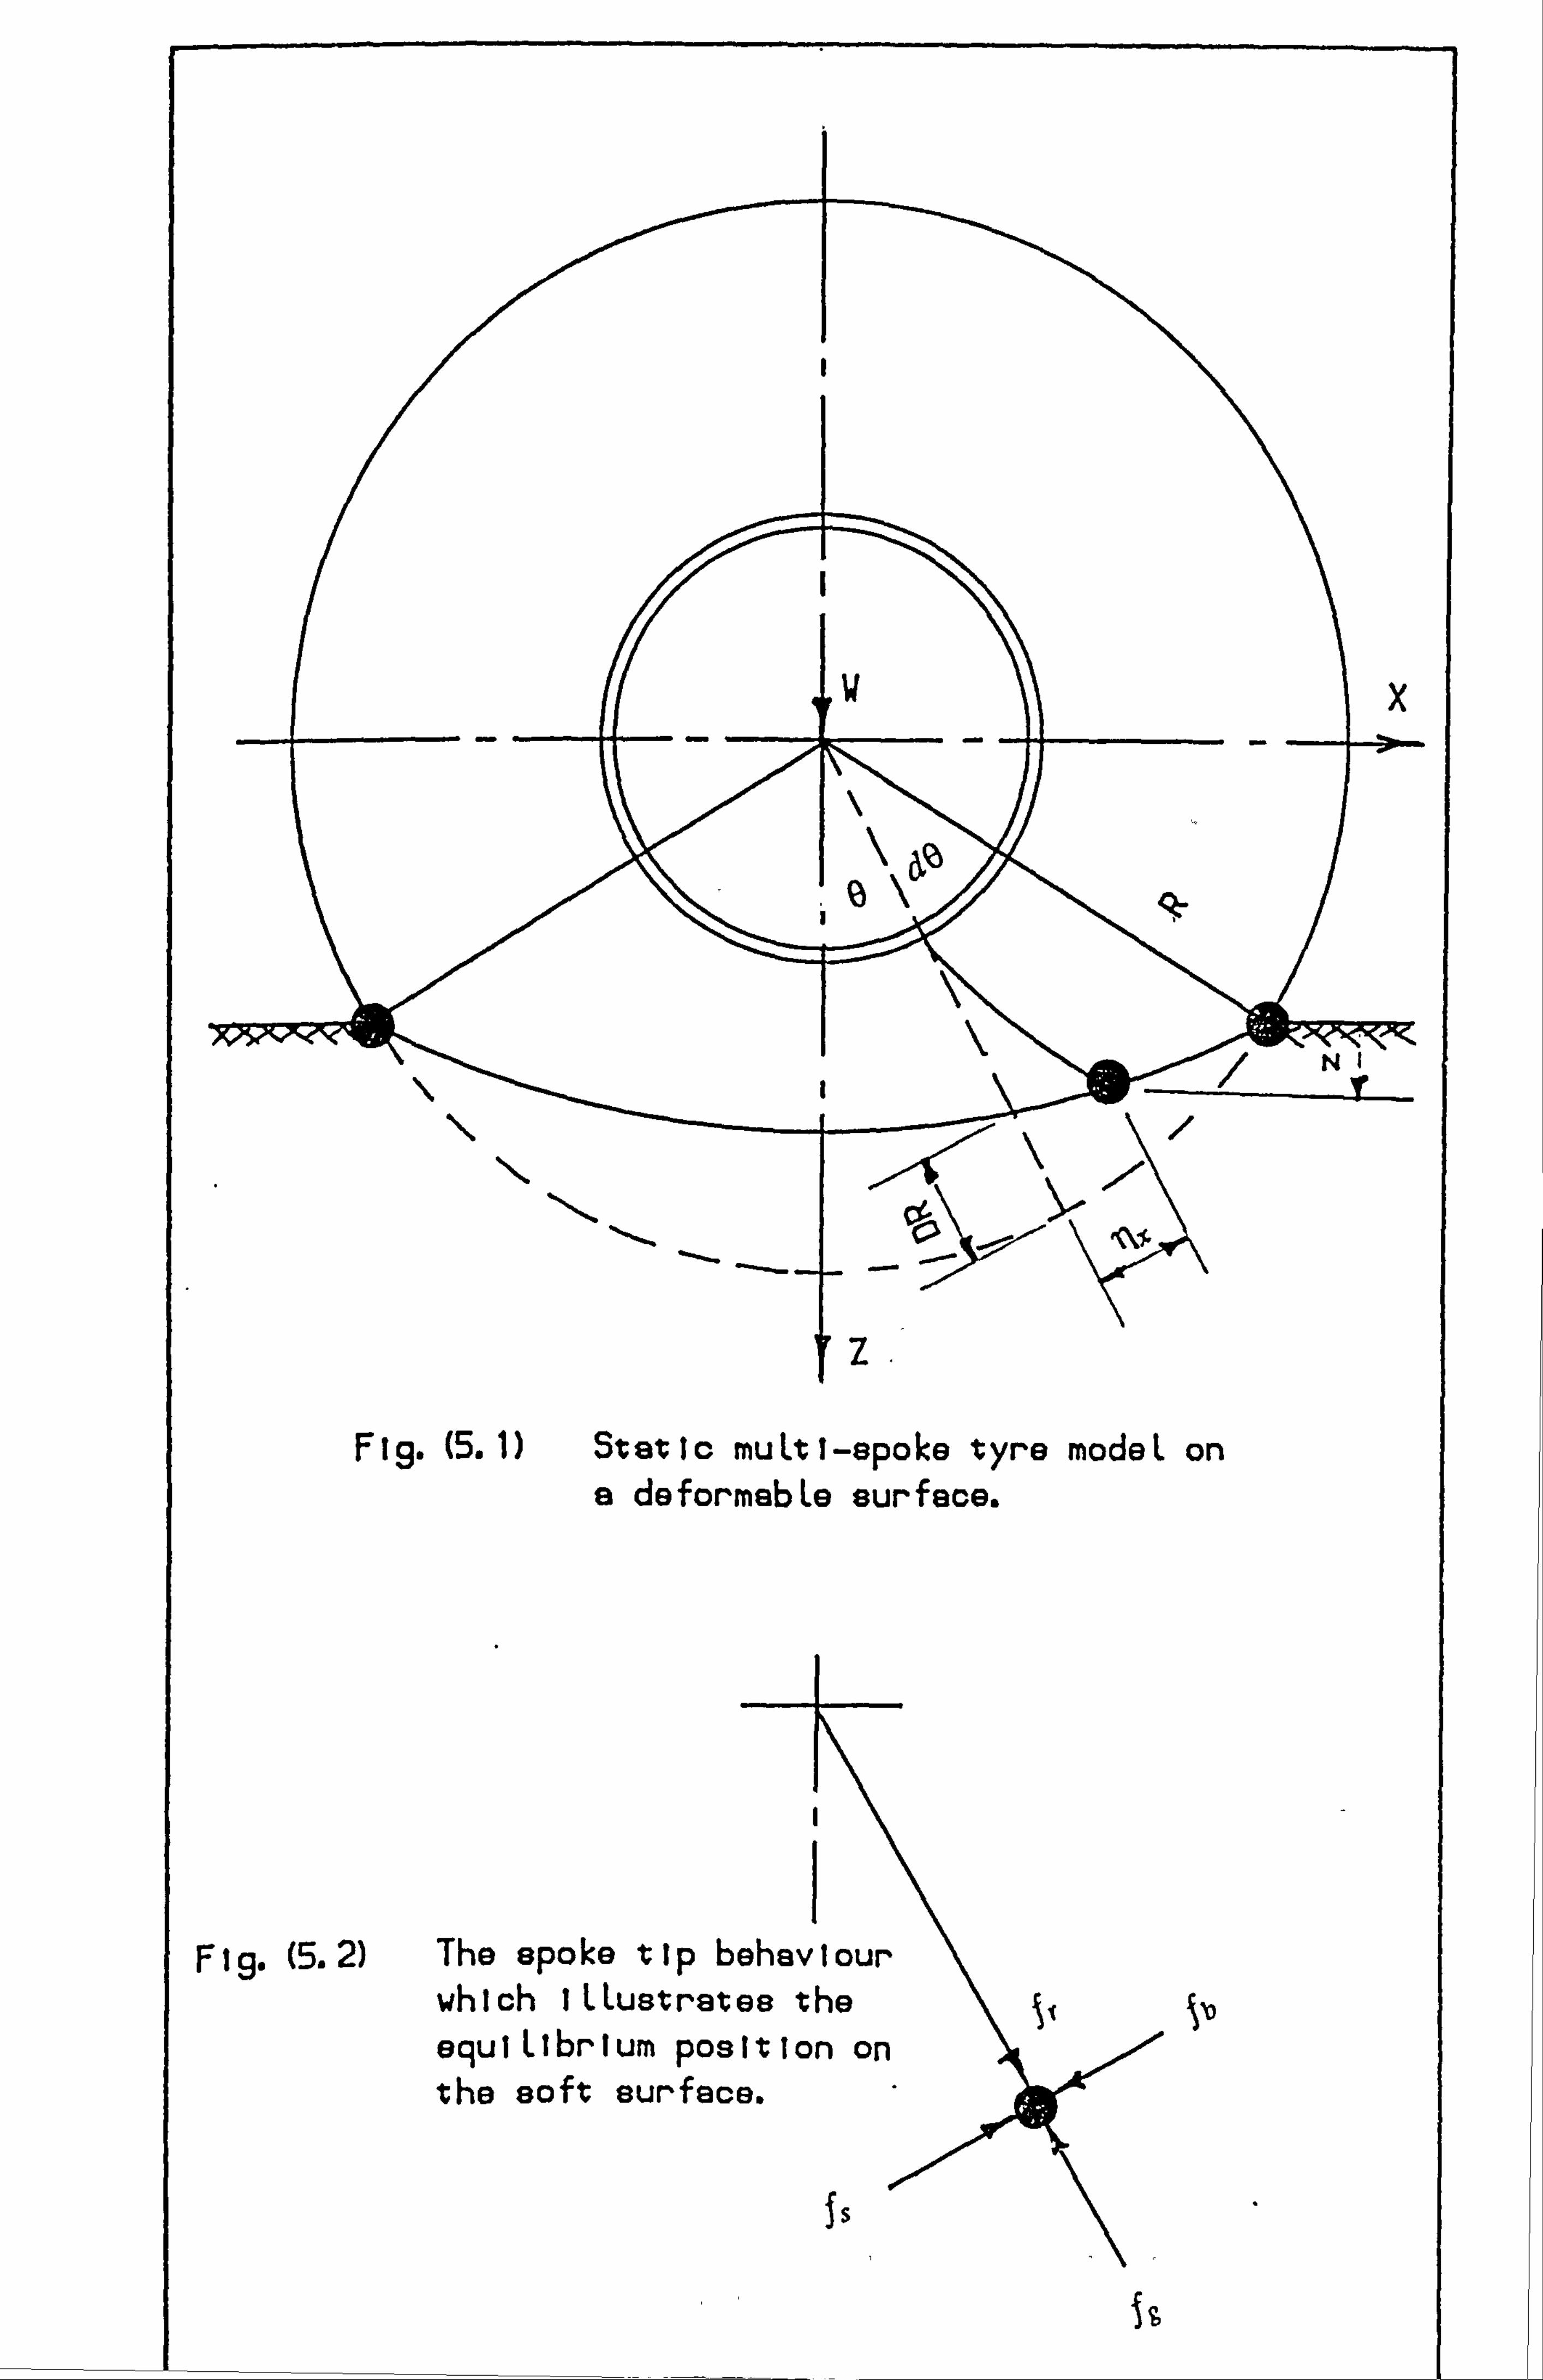
F ig. (5.1) Static muLti-spoke tyre modeL on a deformabLe surface.
Fig. (5.2) The spoke tip behaviour which I LLustrate8 the equiLibrium position on the soft surface.
is
1%
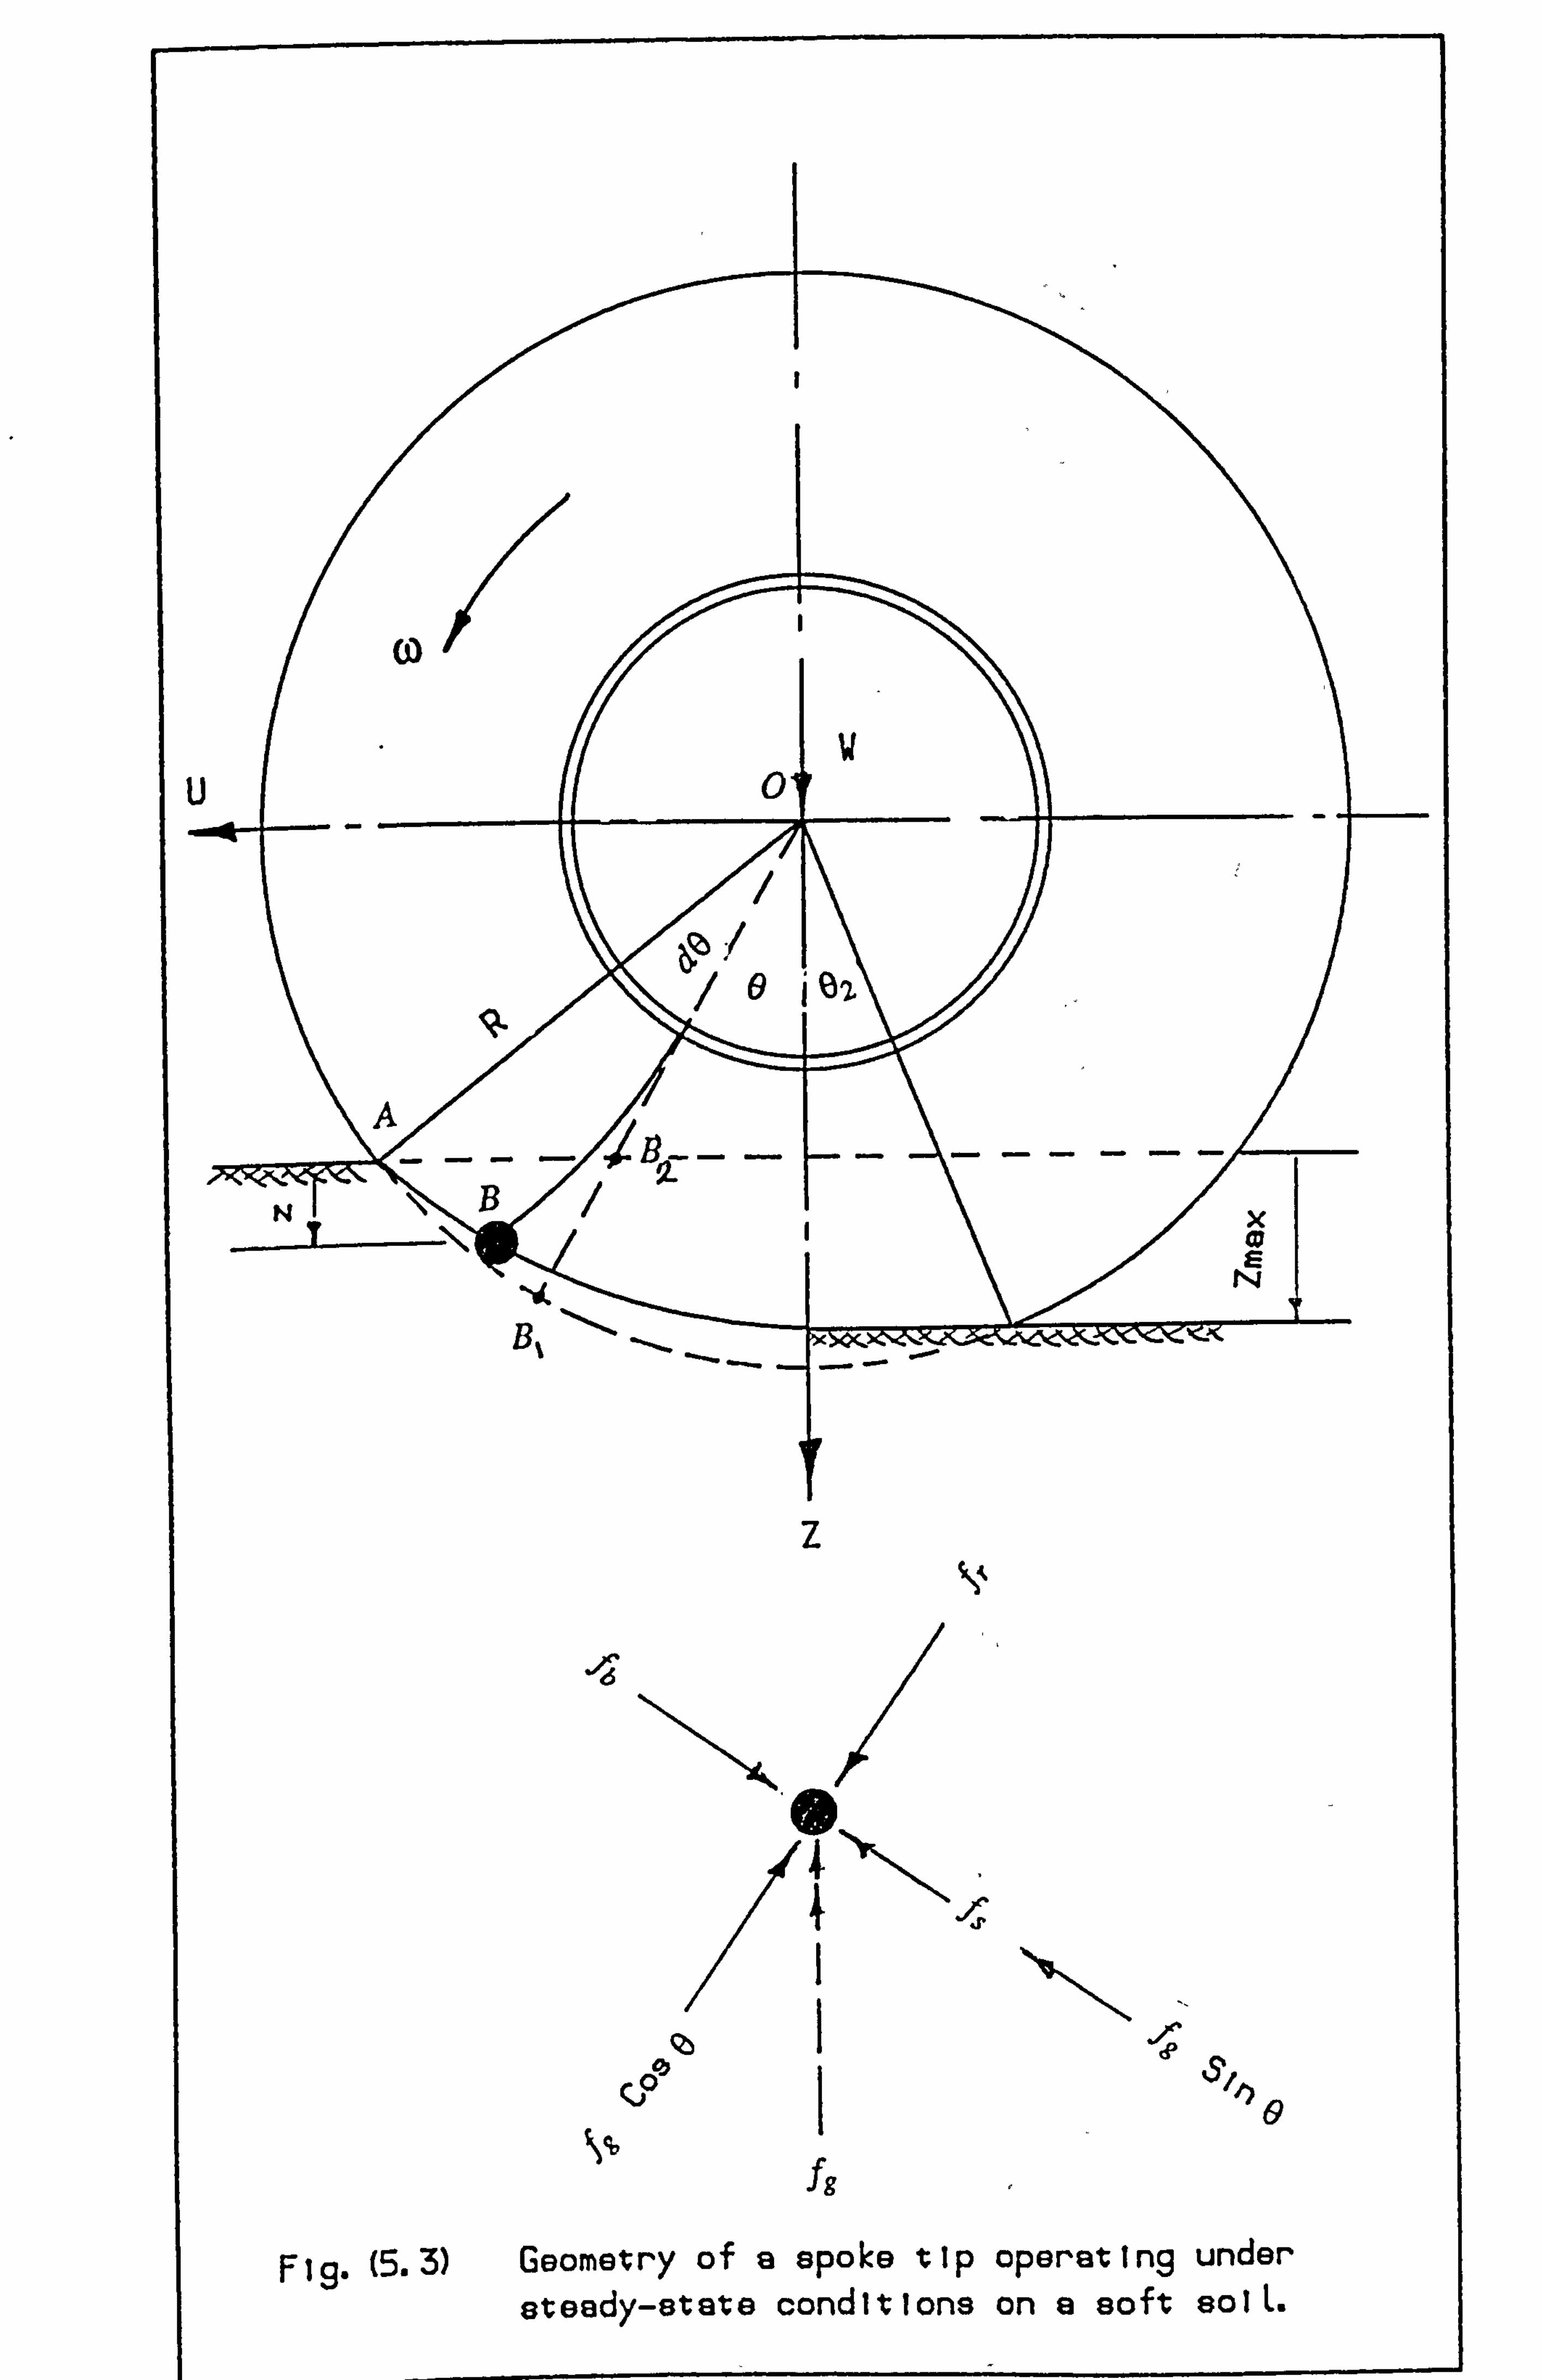
Jg
Fig. (5.3) Geometry of a spoke tip operating under steady-state conditions on a soft solL.
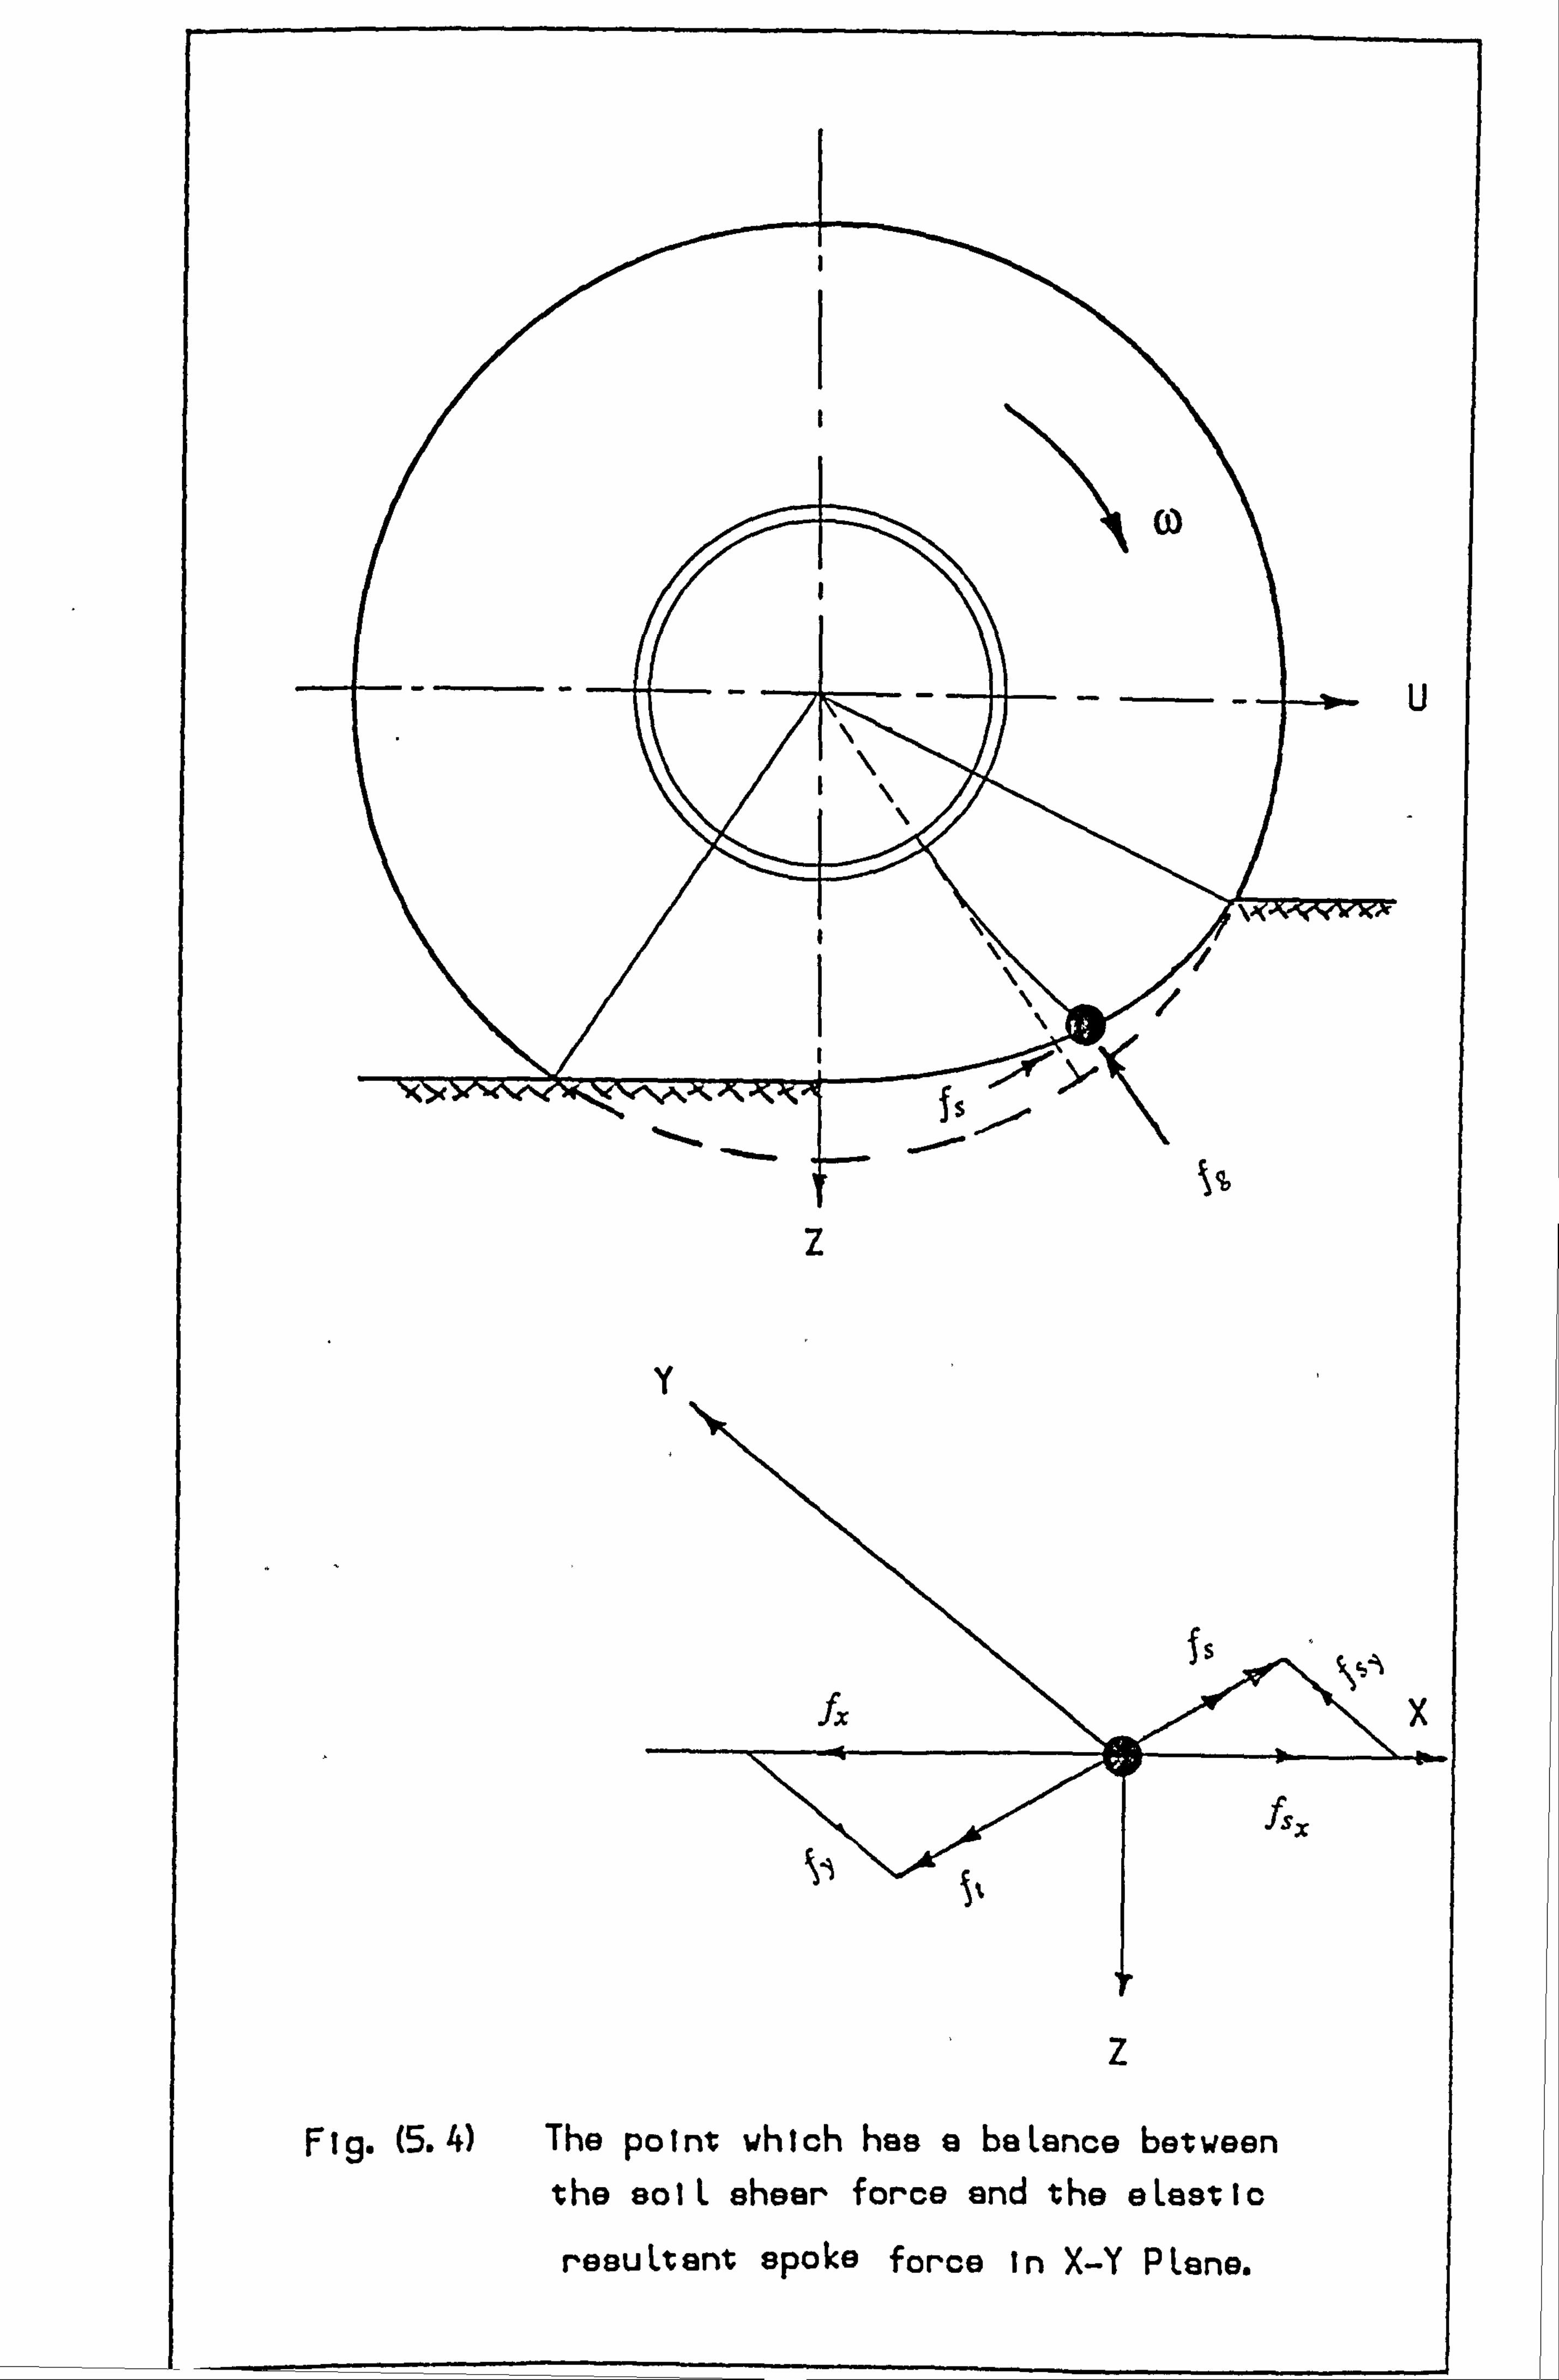
z
Y
z Fig. (5.4) The point which has a beLance between
the solL shear force and the eLes-tic
U
resuLtent spoke force in X-Y PLene.
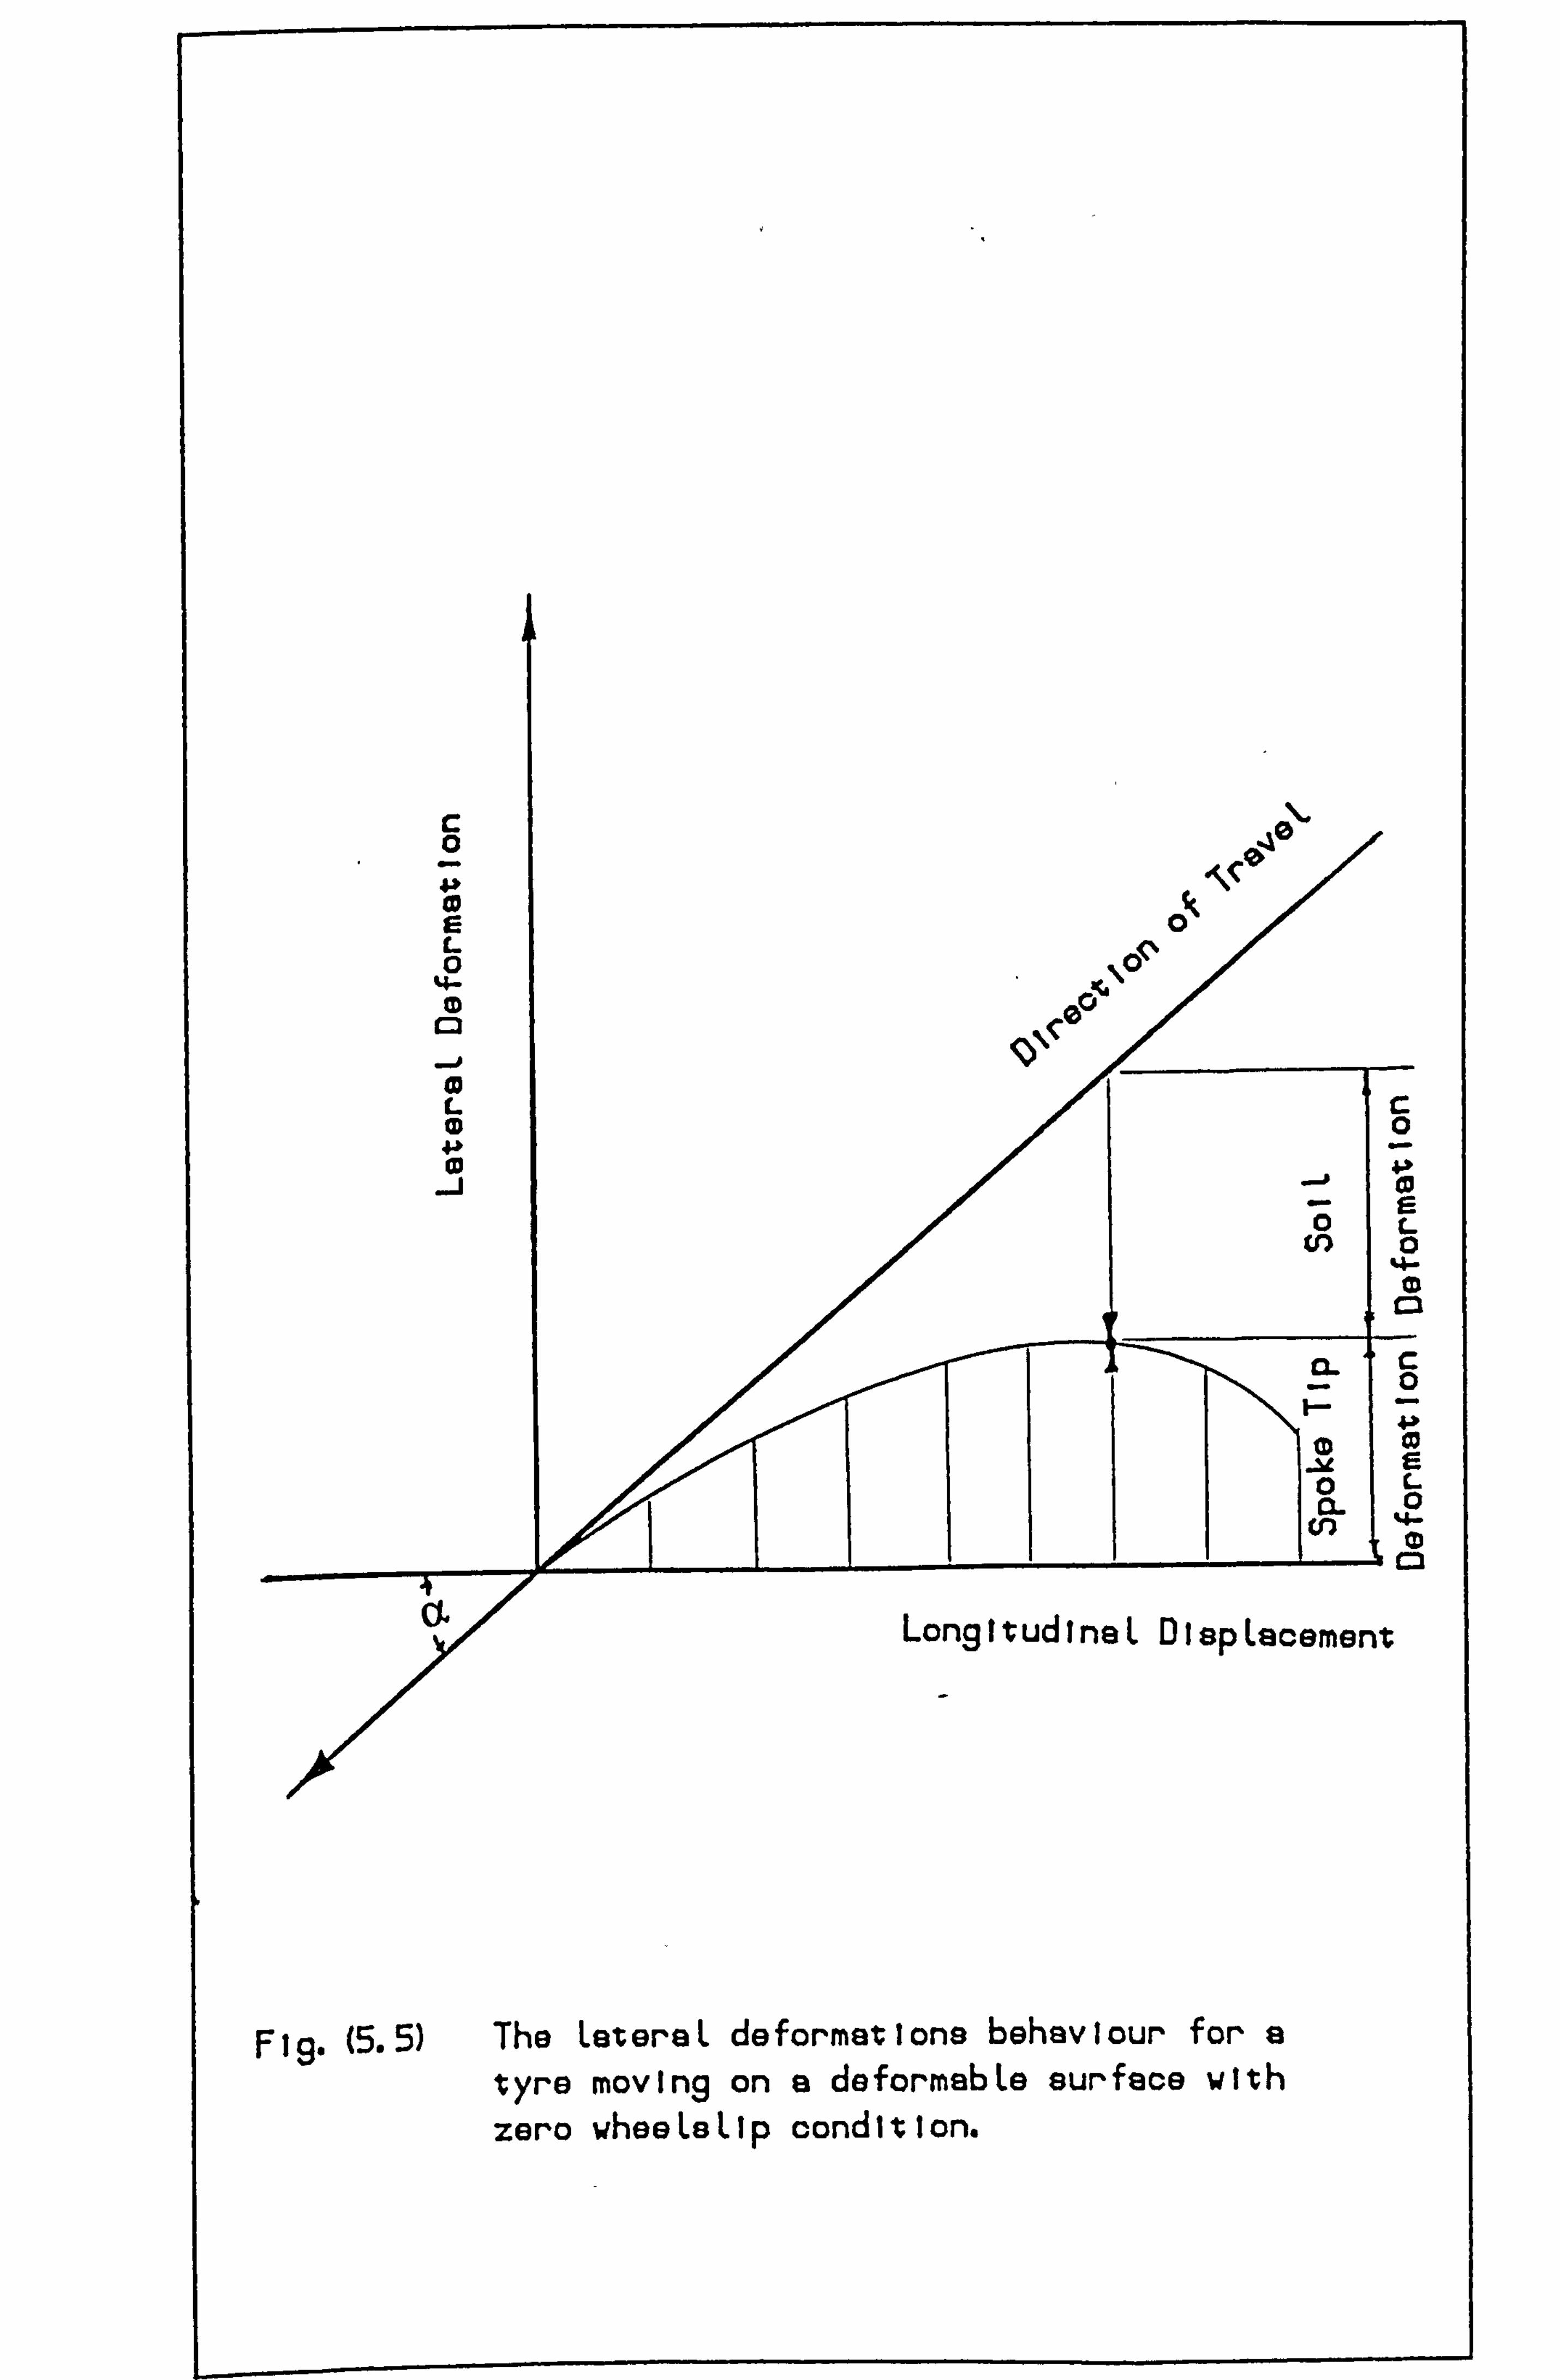
Fig. (5.5) The LateraL deformations behaviour for a tyro moving on a deformabLe surface with zero wheeLoLlp condition.
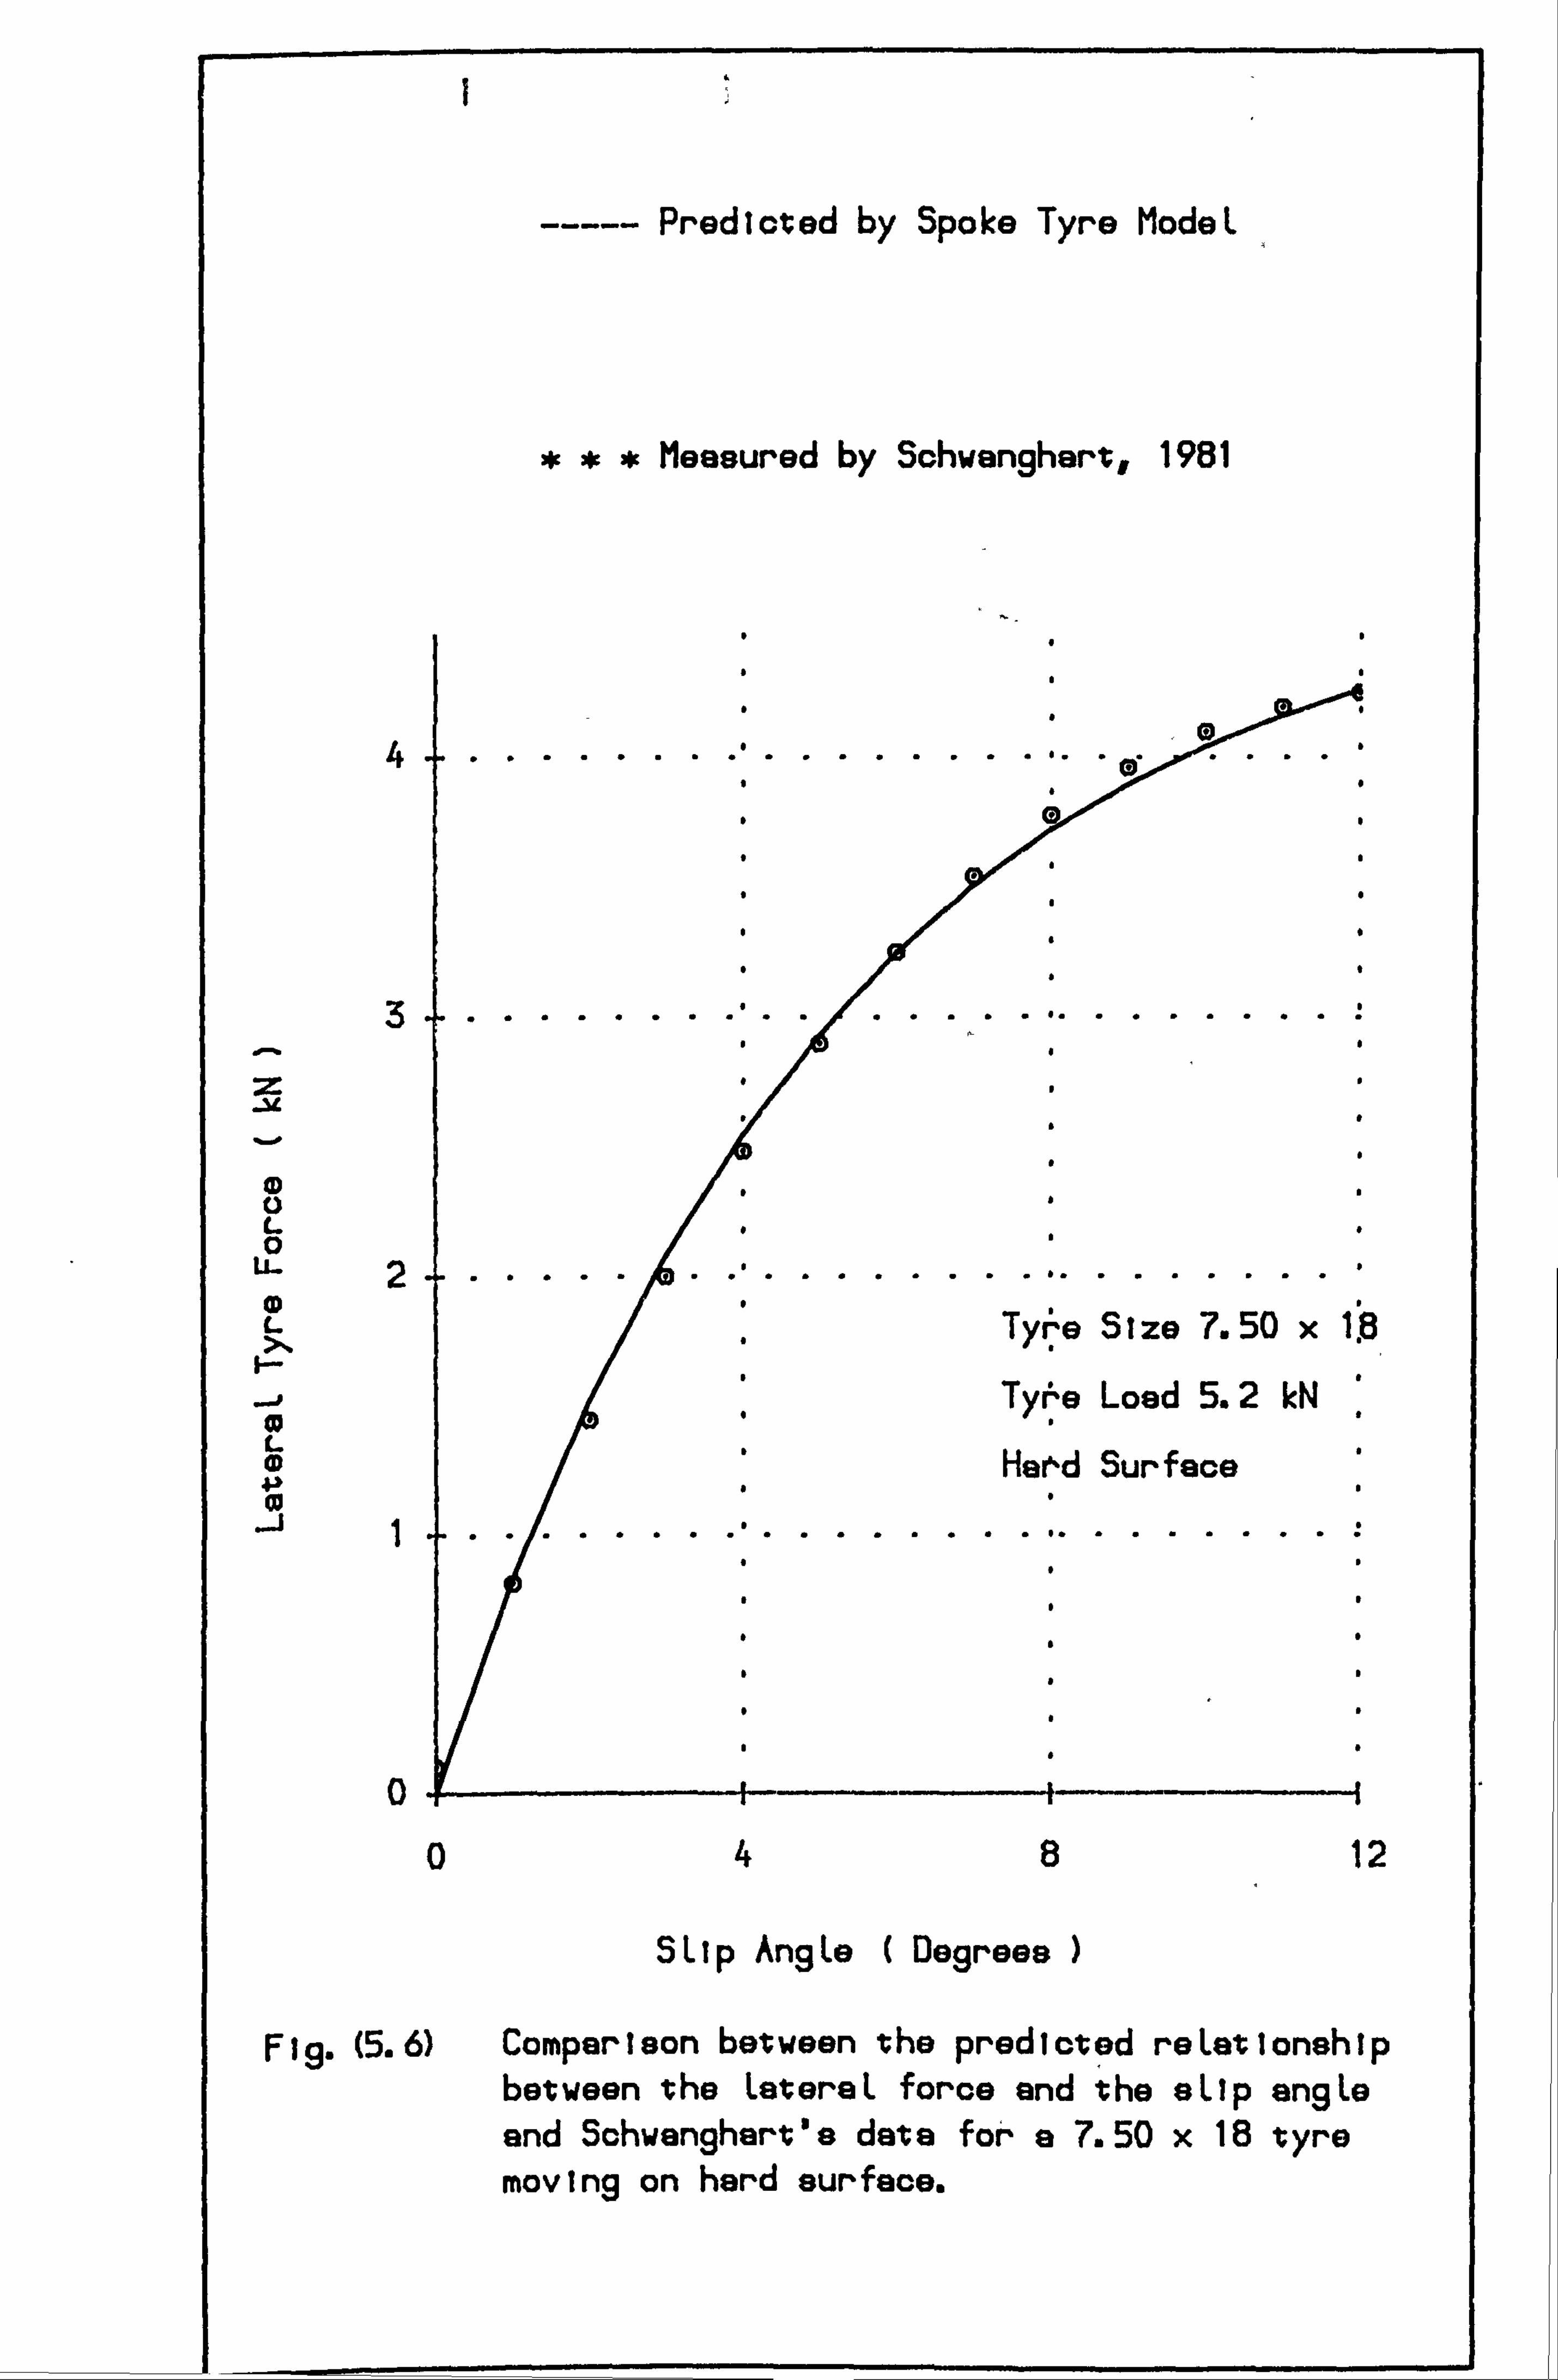
Predicted by Spoke Tyre ModeL
*** Measured by Schwenghert, 1981
z
CD 0 L 0
U-
CD L
--p 0 L 0)
4
3
2
0
SLIp AngLe ( Degrees )
B
Fig-(5.6) Comparison between the predicted reLationship between the LeteraL force and the aLlp angLe and Schwanghert's date for a 7.50 x 18 tyre moving an hard surface.
12
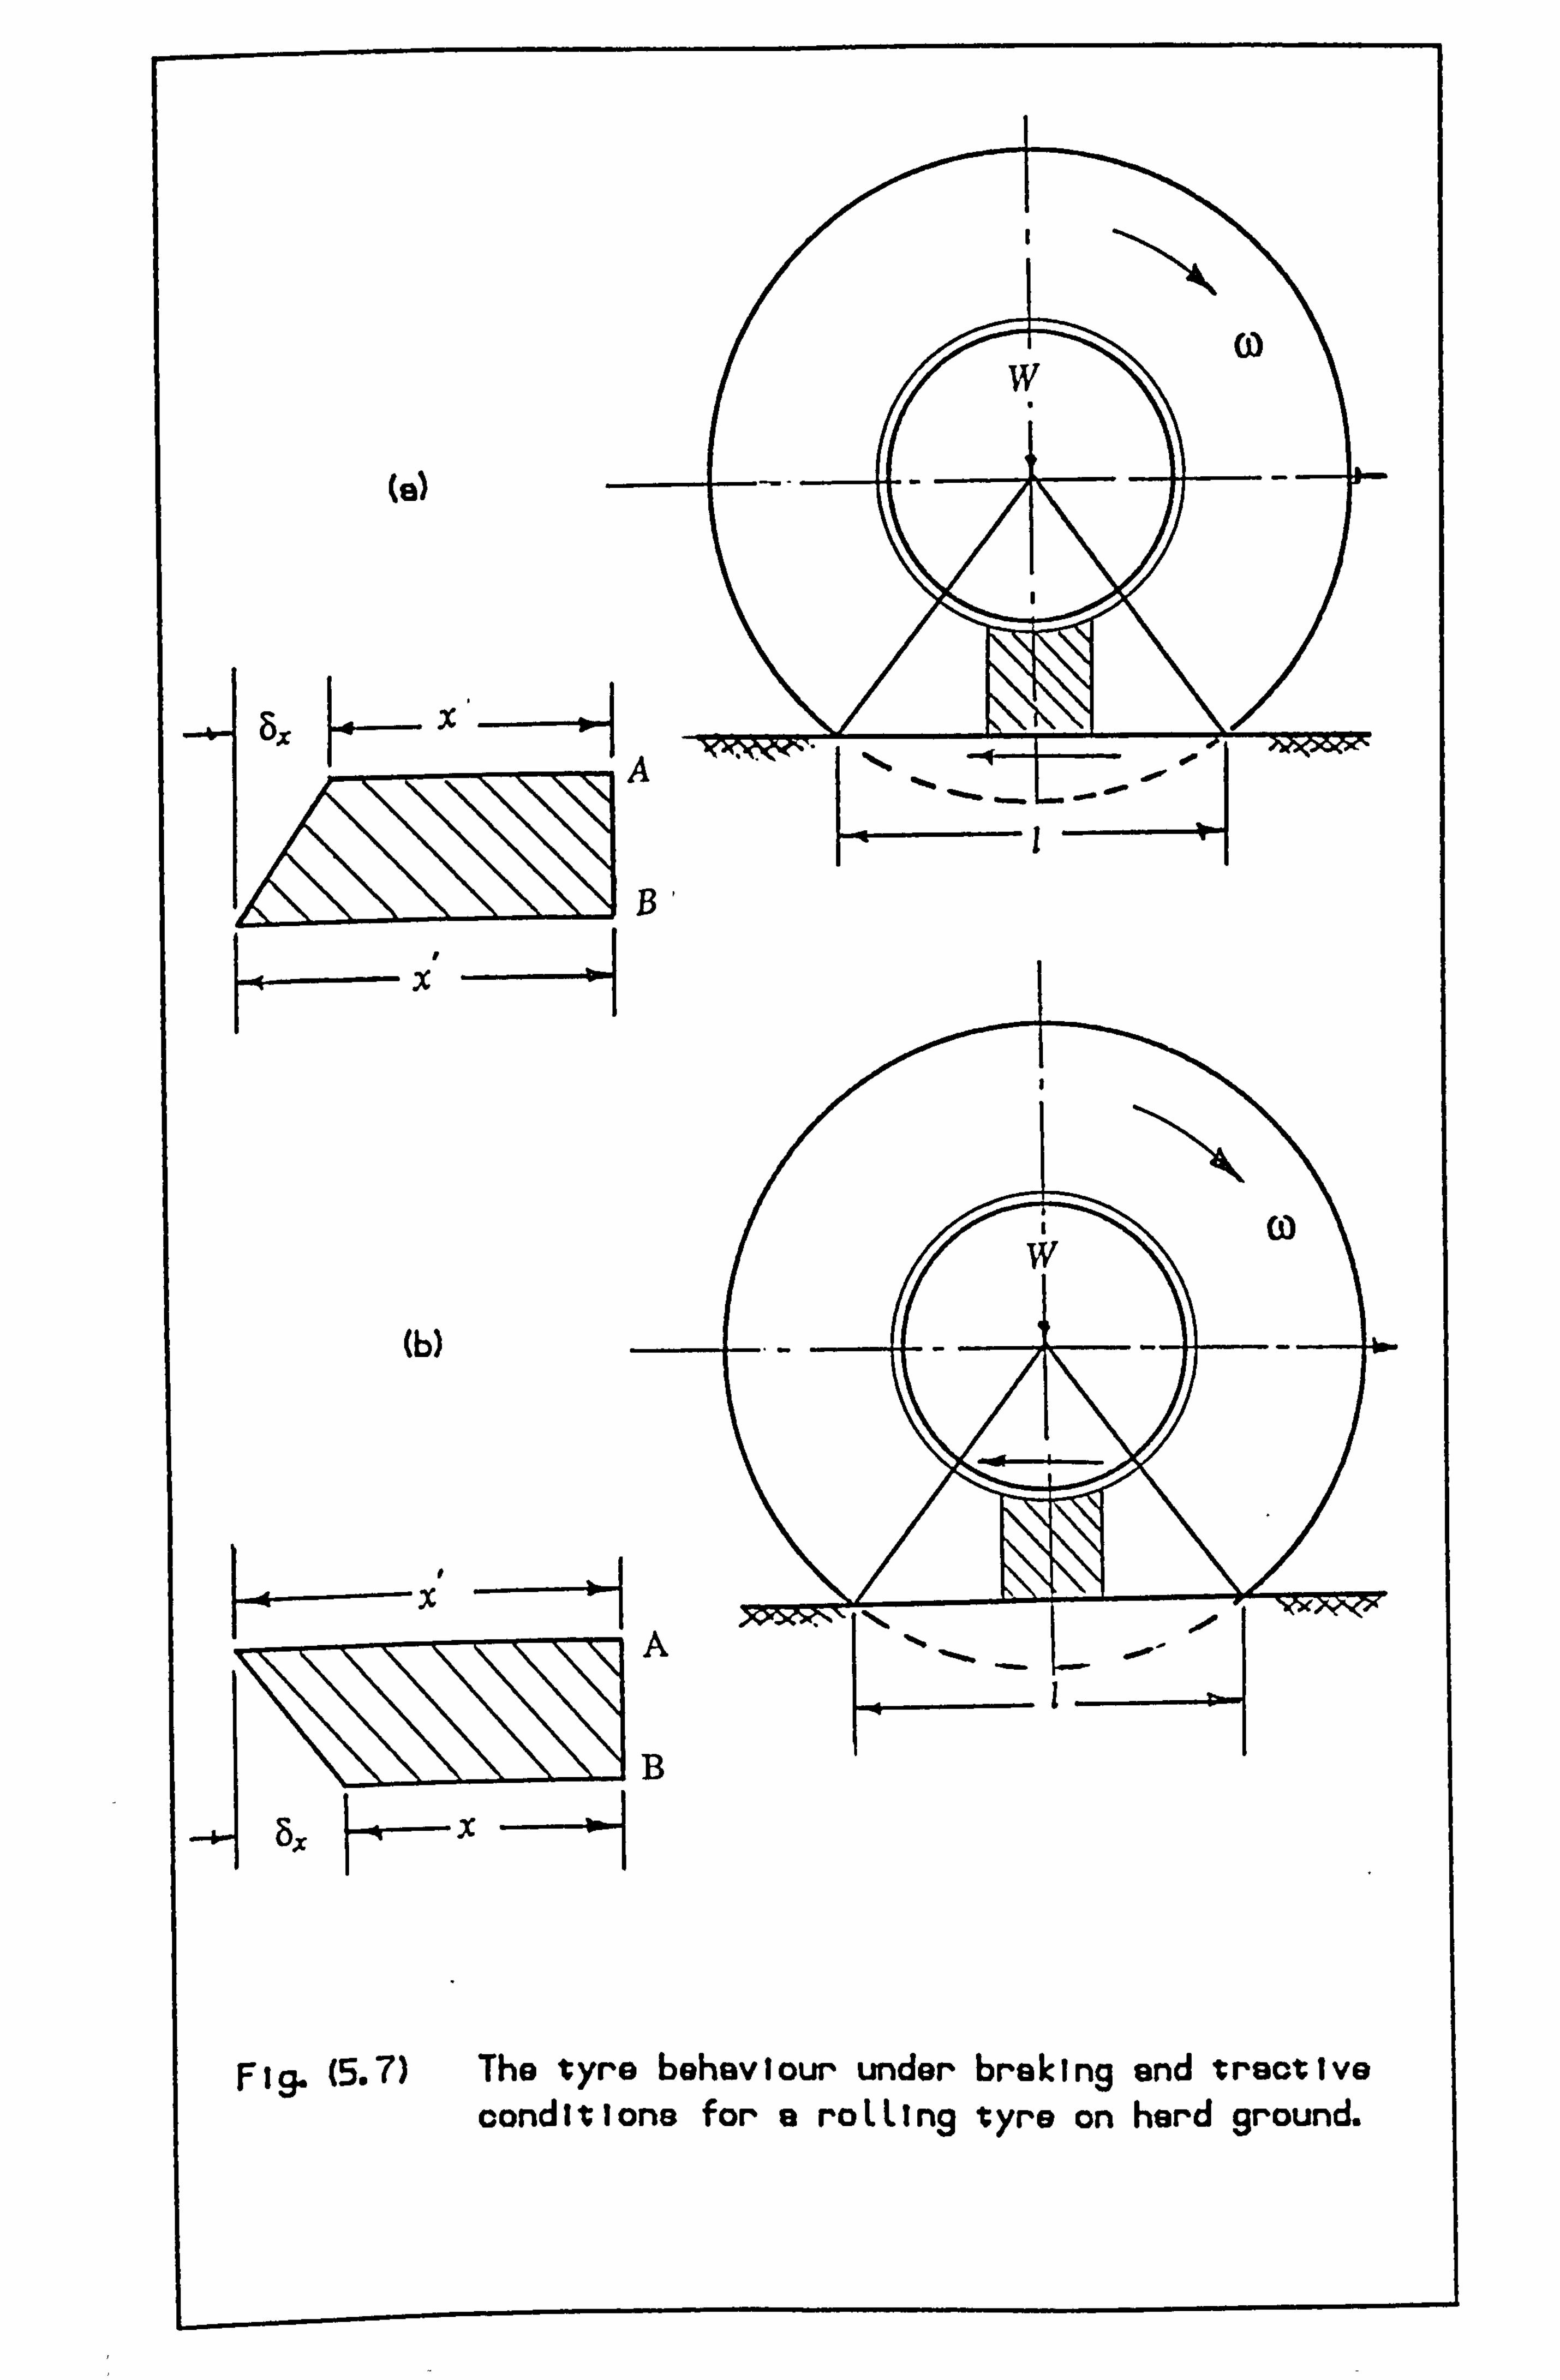
w
5x x A
--x
CO w
(b)
-X' >pe_s, seZ,, K
B
8x x
F 9. (5.7) The tyro behaviour under braking and tractive conditions for a roLLIng vyre on hard ground.
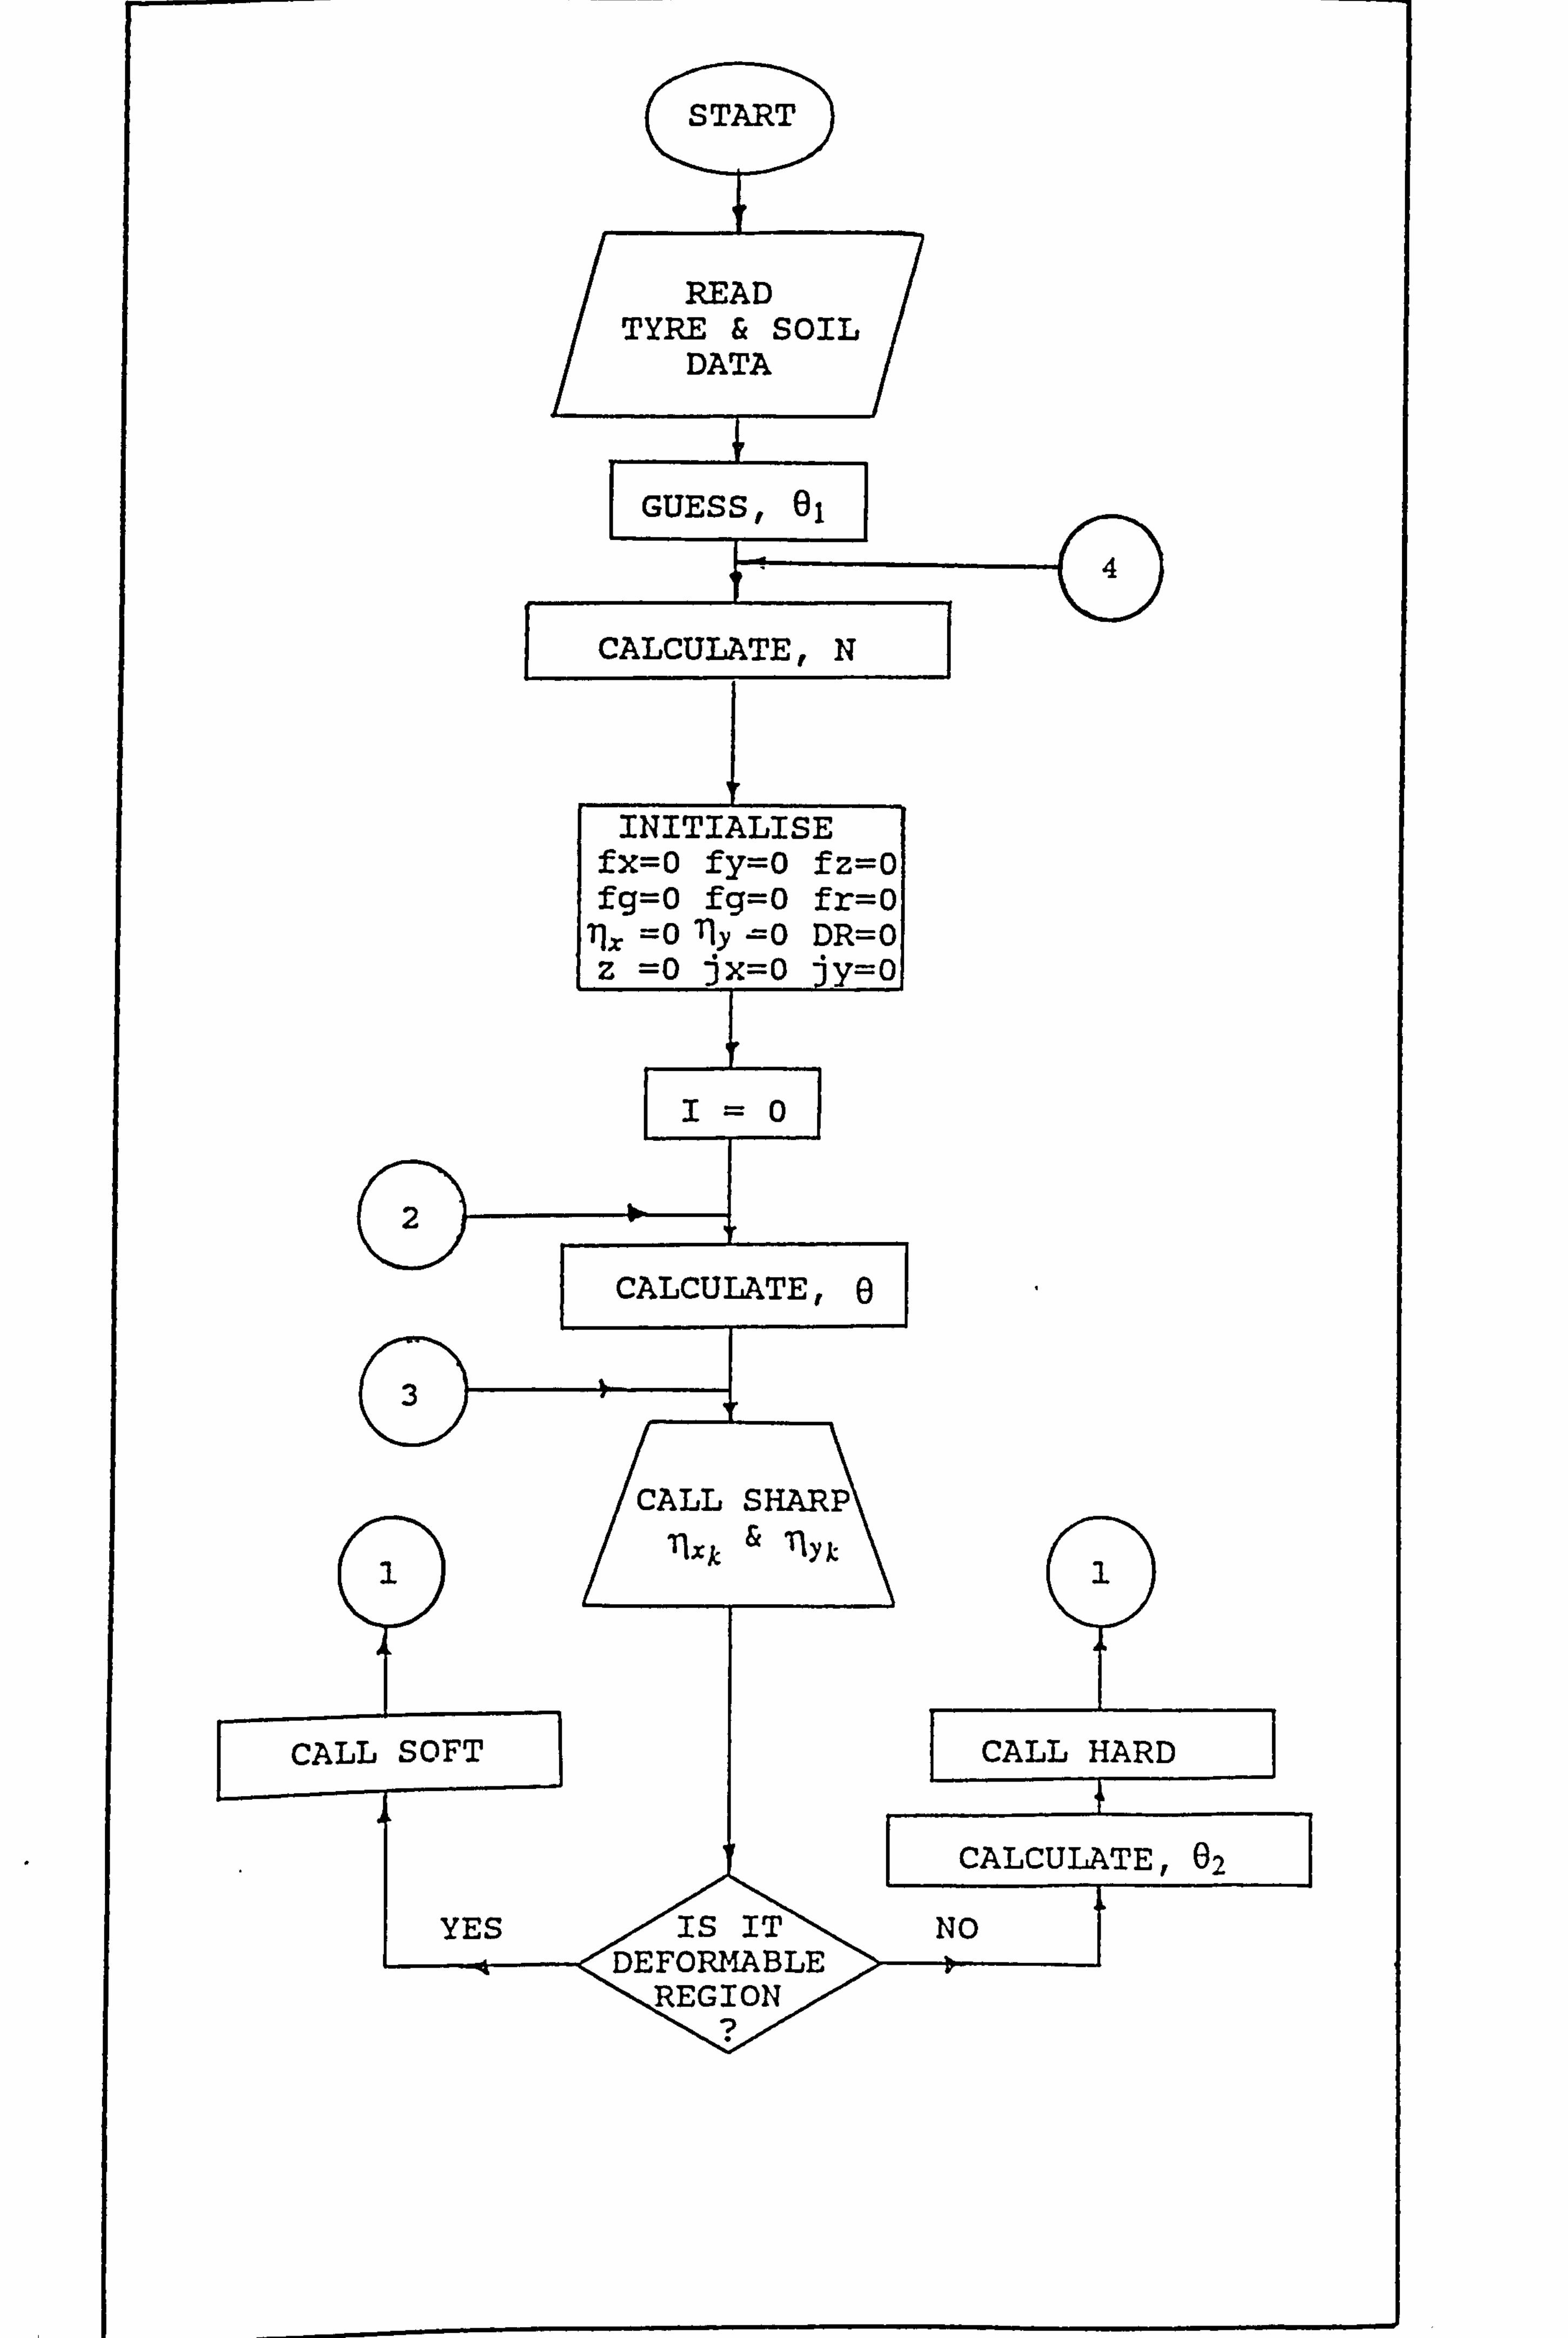
START
READ TYRE & SOIL
DATA
GUESS, 01
4
CALCULATE, N
INITIALISE fx=o fy=o fz=o fg=O fg=O fr=o
llx =O Ily =O DR=0 Z =O ix=o iv=o
I=
2
CALCULATE, 0
3
CALL SHARP llxk , Ilyk-
CALL SOFT CALL HARD
CALCULATE, 02
YES IS IT NO DEFO E
ON REGION 0
I 7ýý
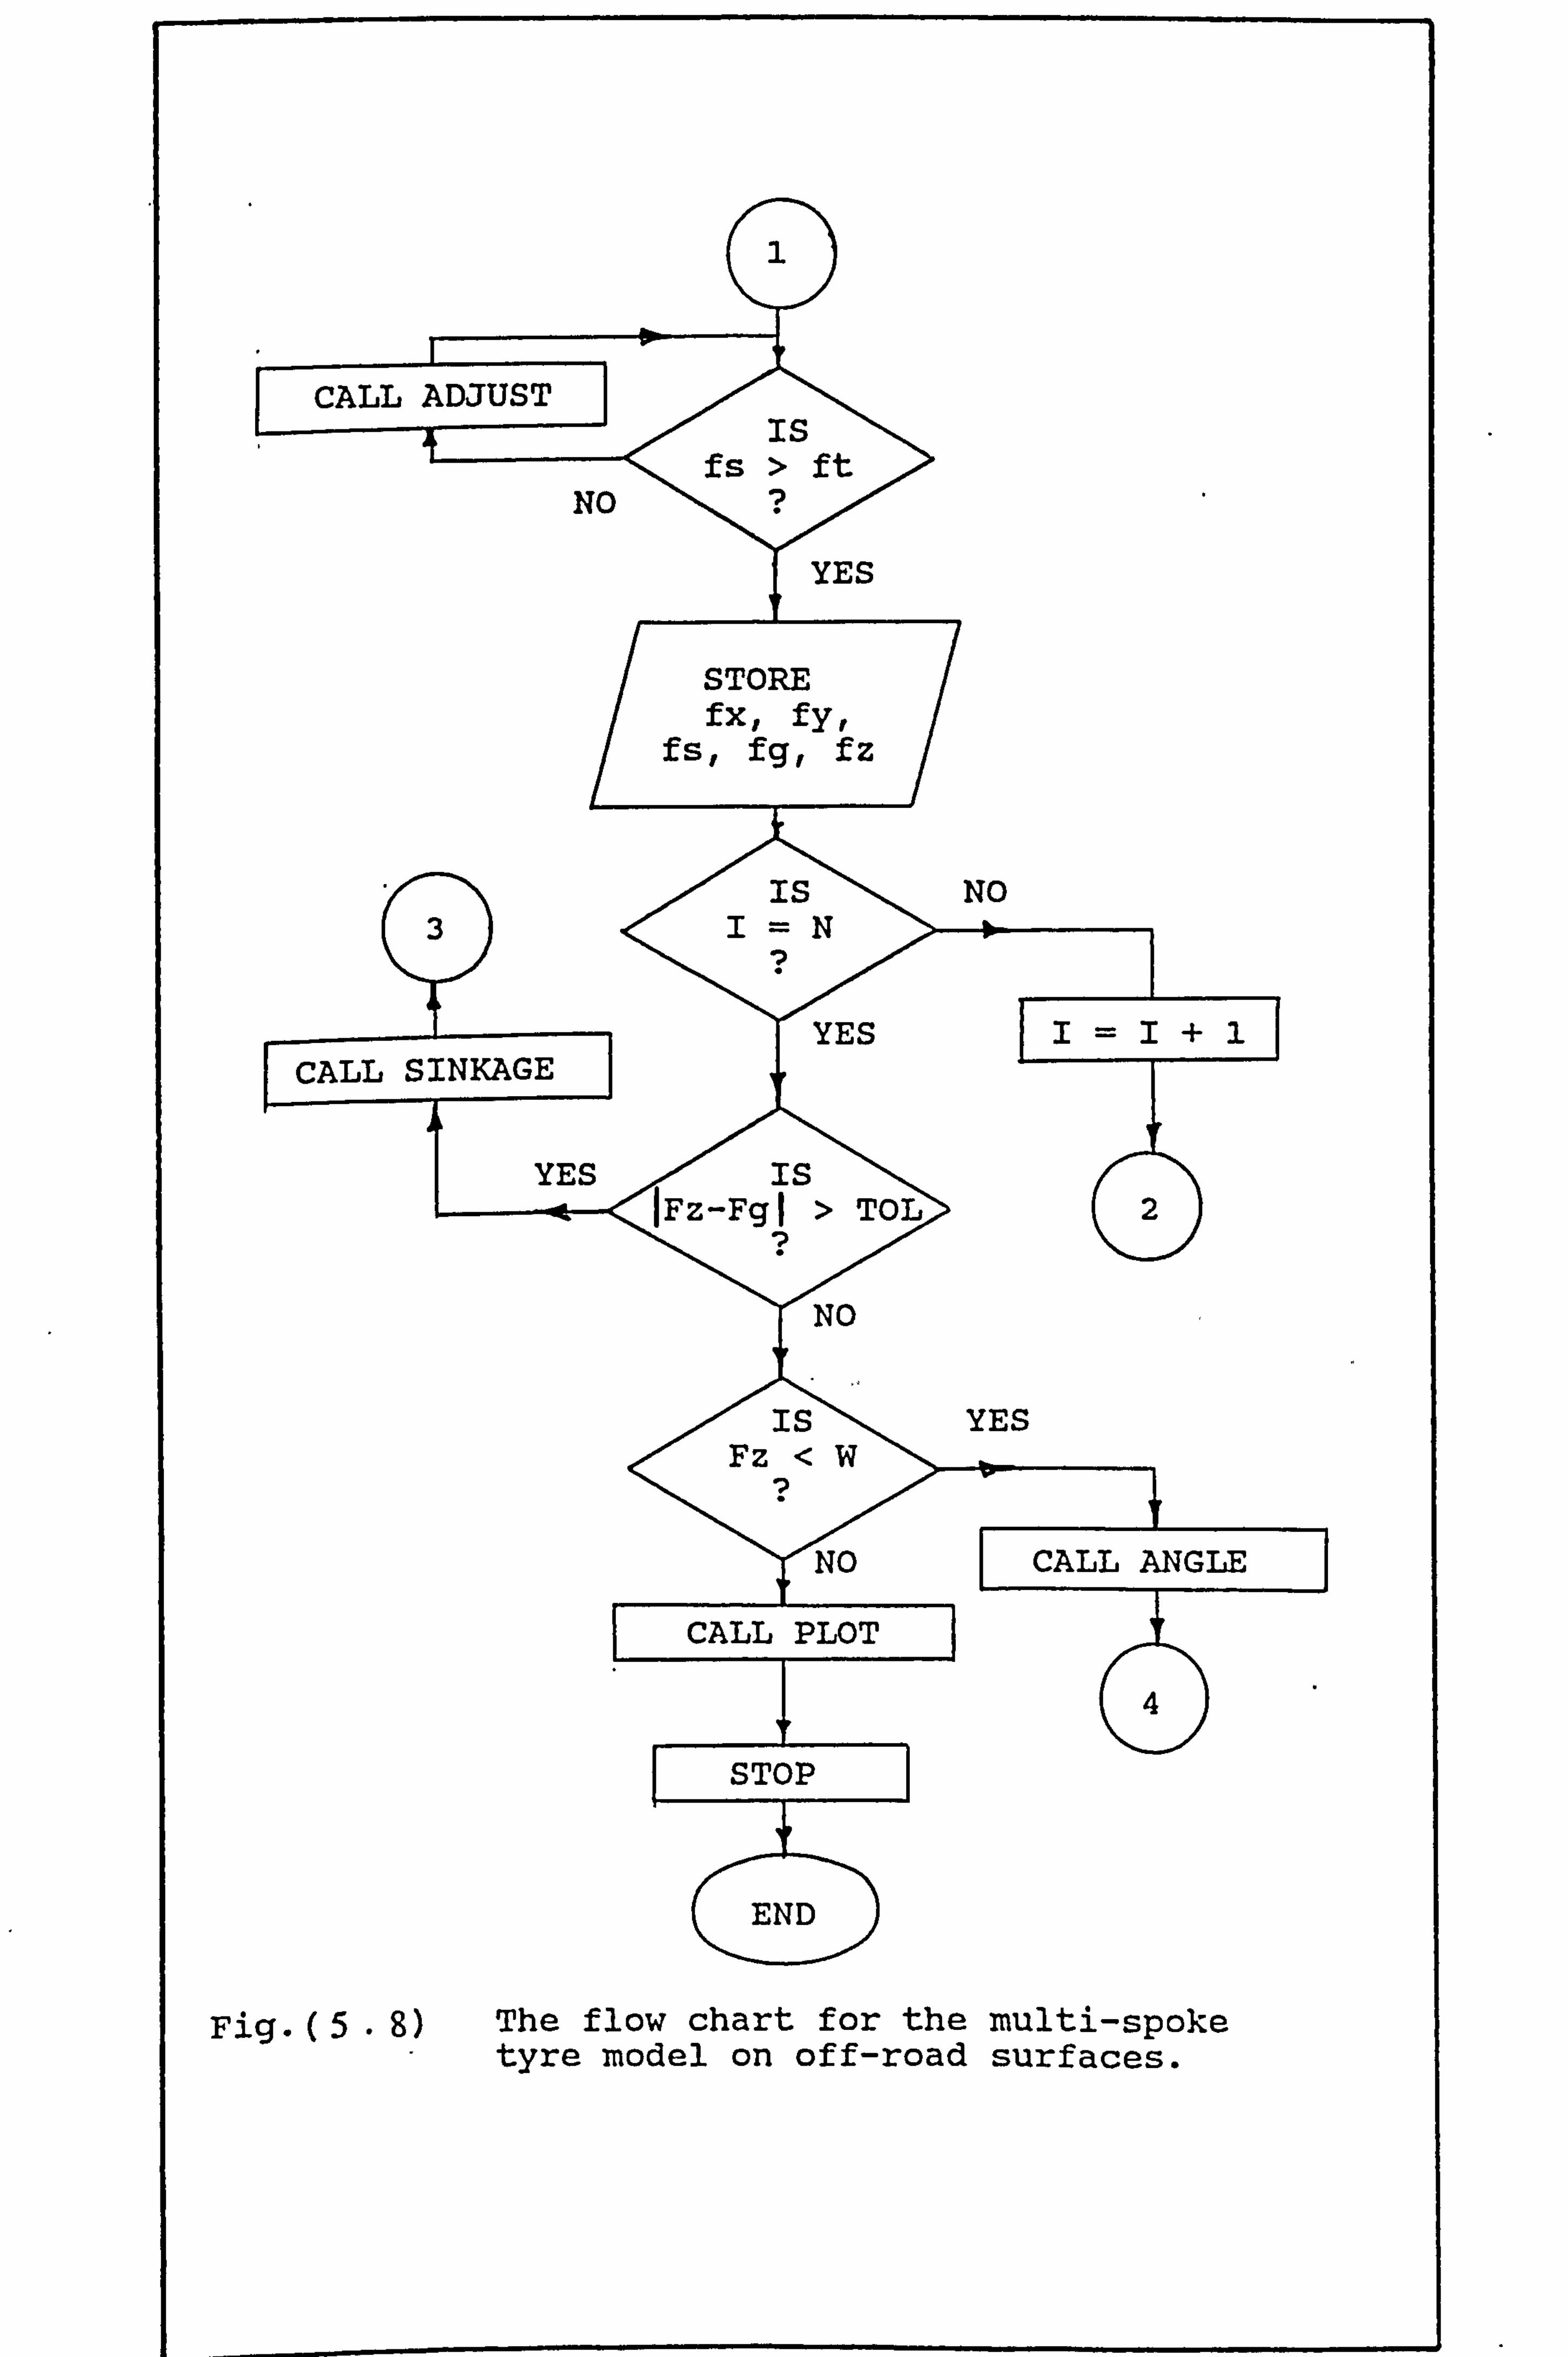
Fig. (5- 8) The flow chart for the multi-spoke tyre model on off-road surfaces.
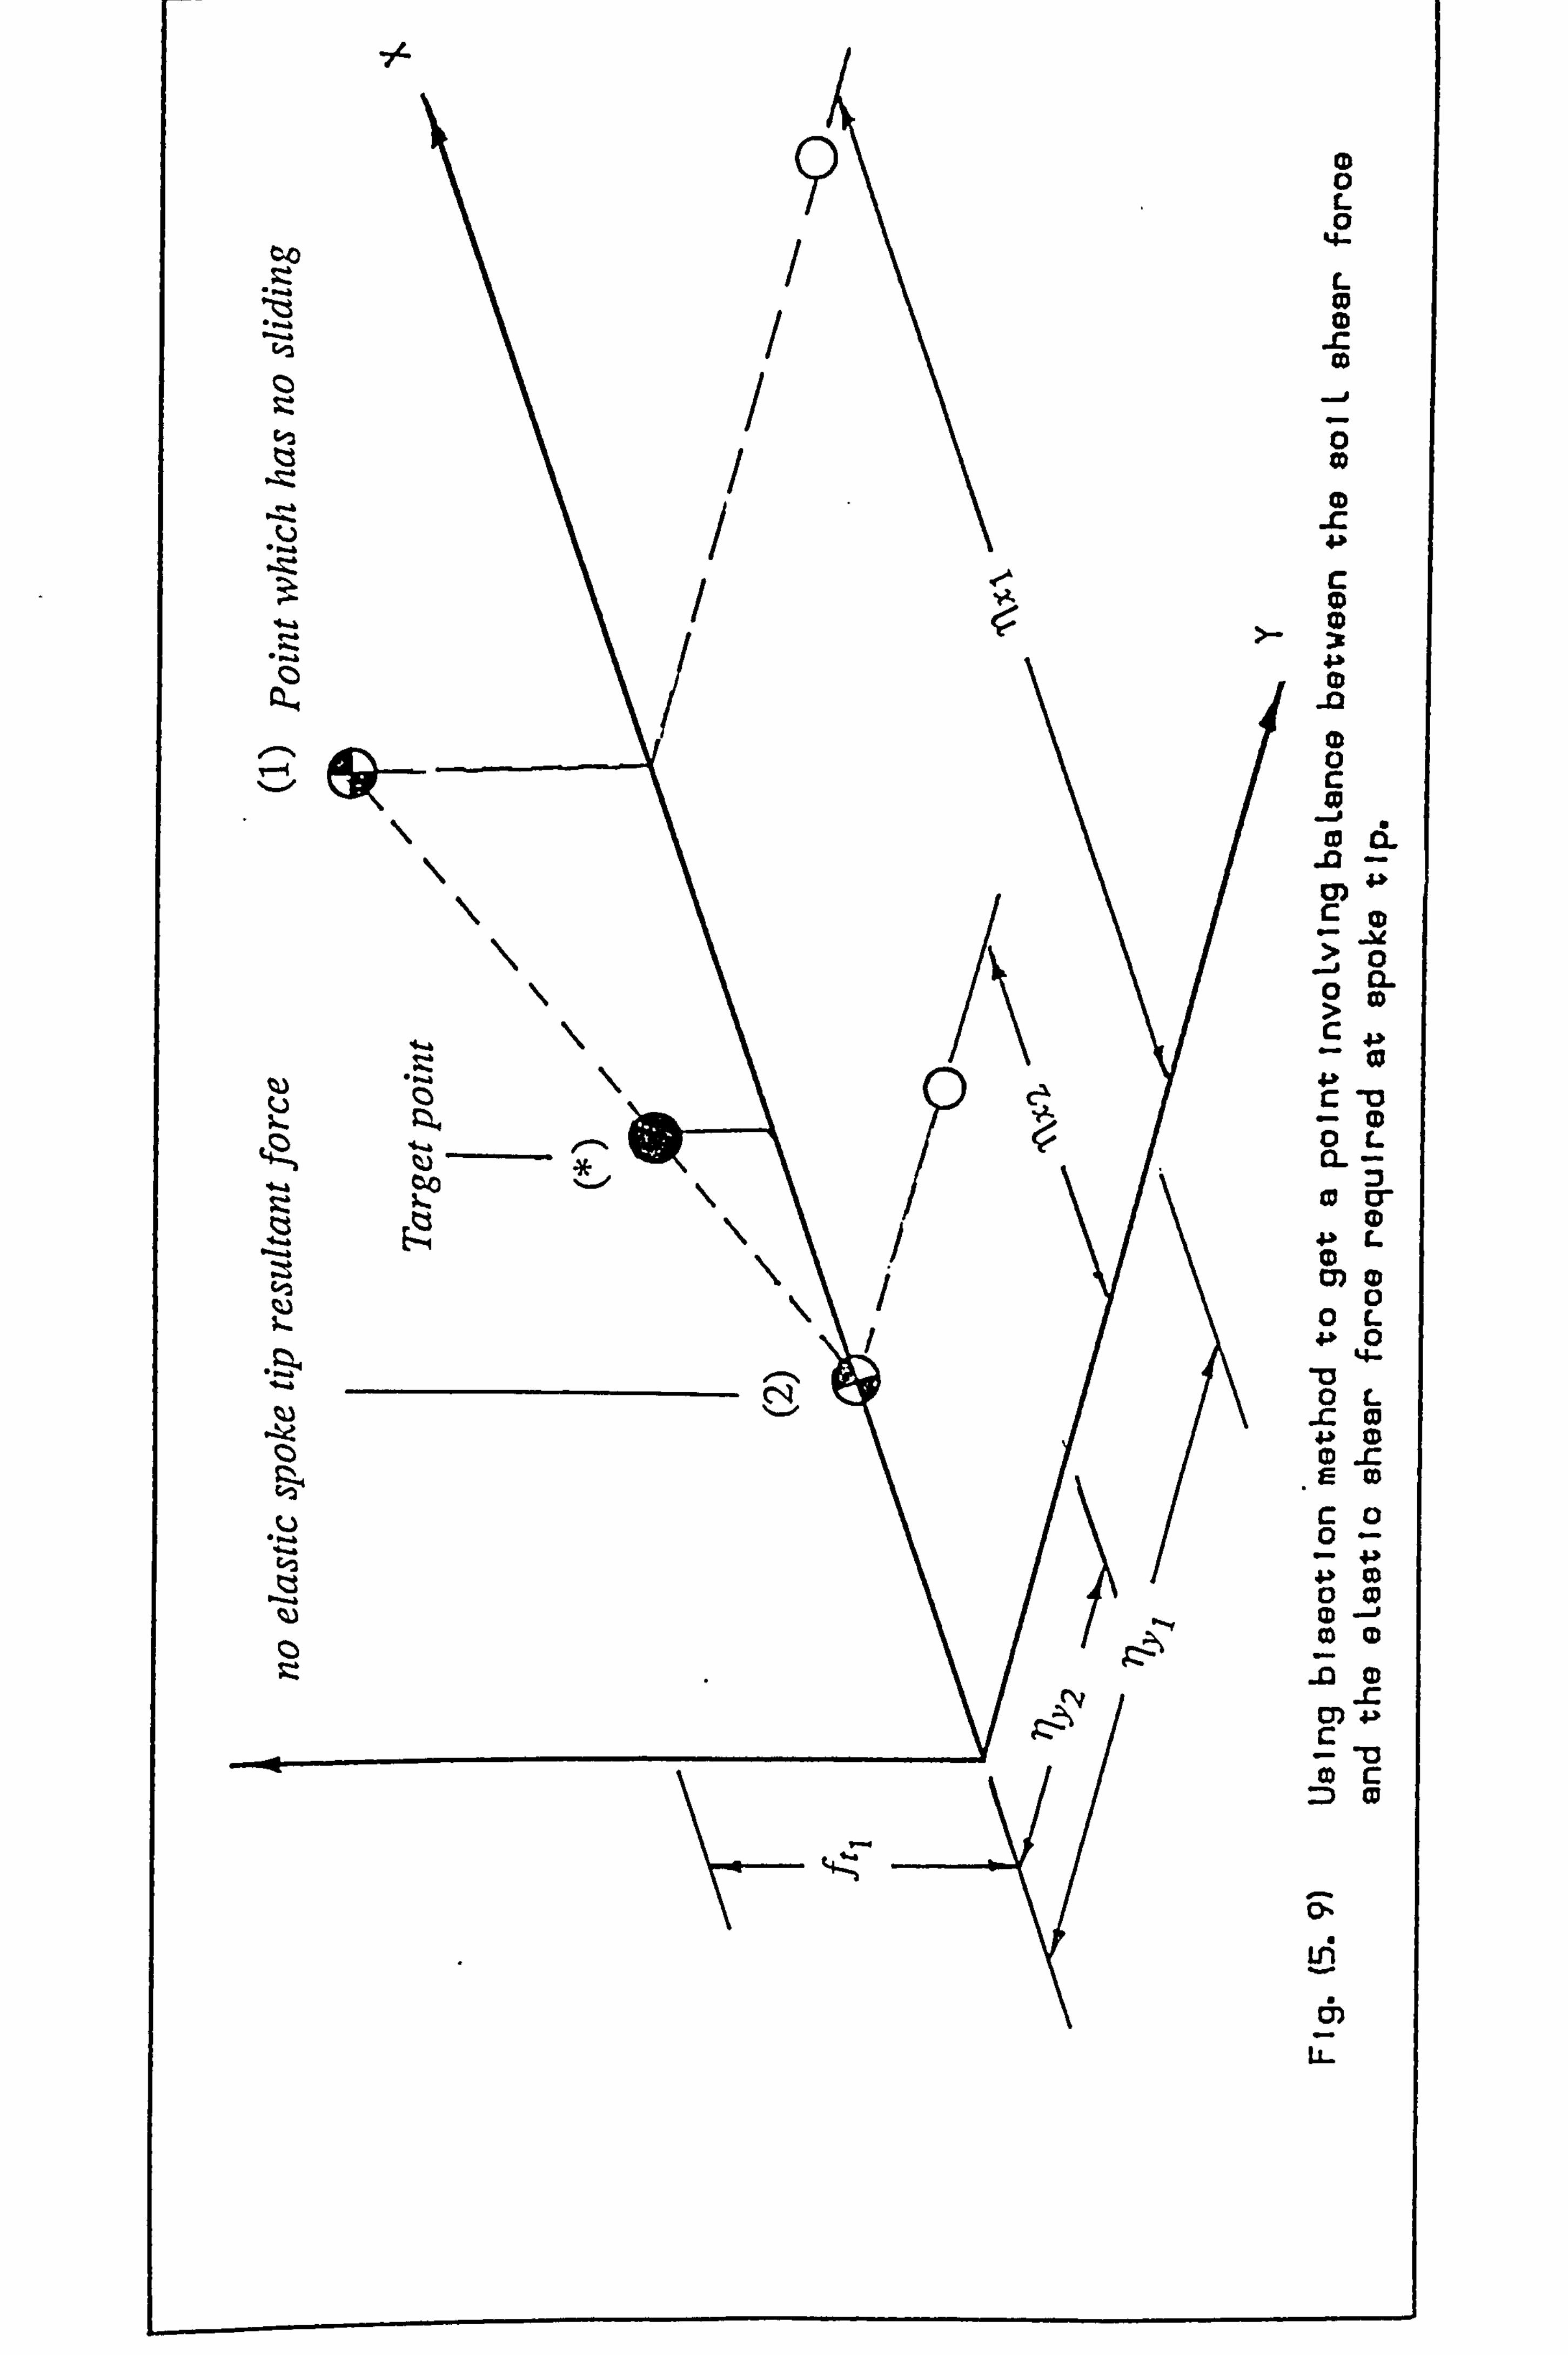
7t-
to
toll u
42,
L 0
94-
L Co 0
X CD
Z CD
0 X
XD
c -0 XD
0L CL
0 cr 0 L
C» 0 0
0L 43,0
0L X0 .p0 0 _c E CD c0
0 cg
r_ -0
0 c: ZD 0
o. Lfl
C,
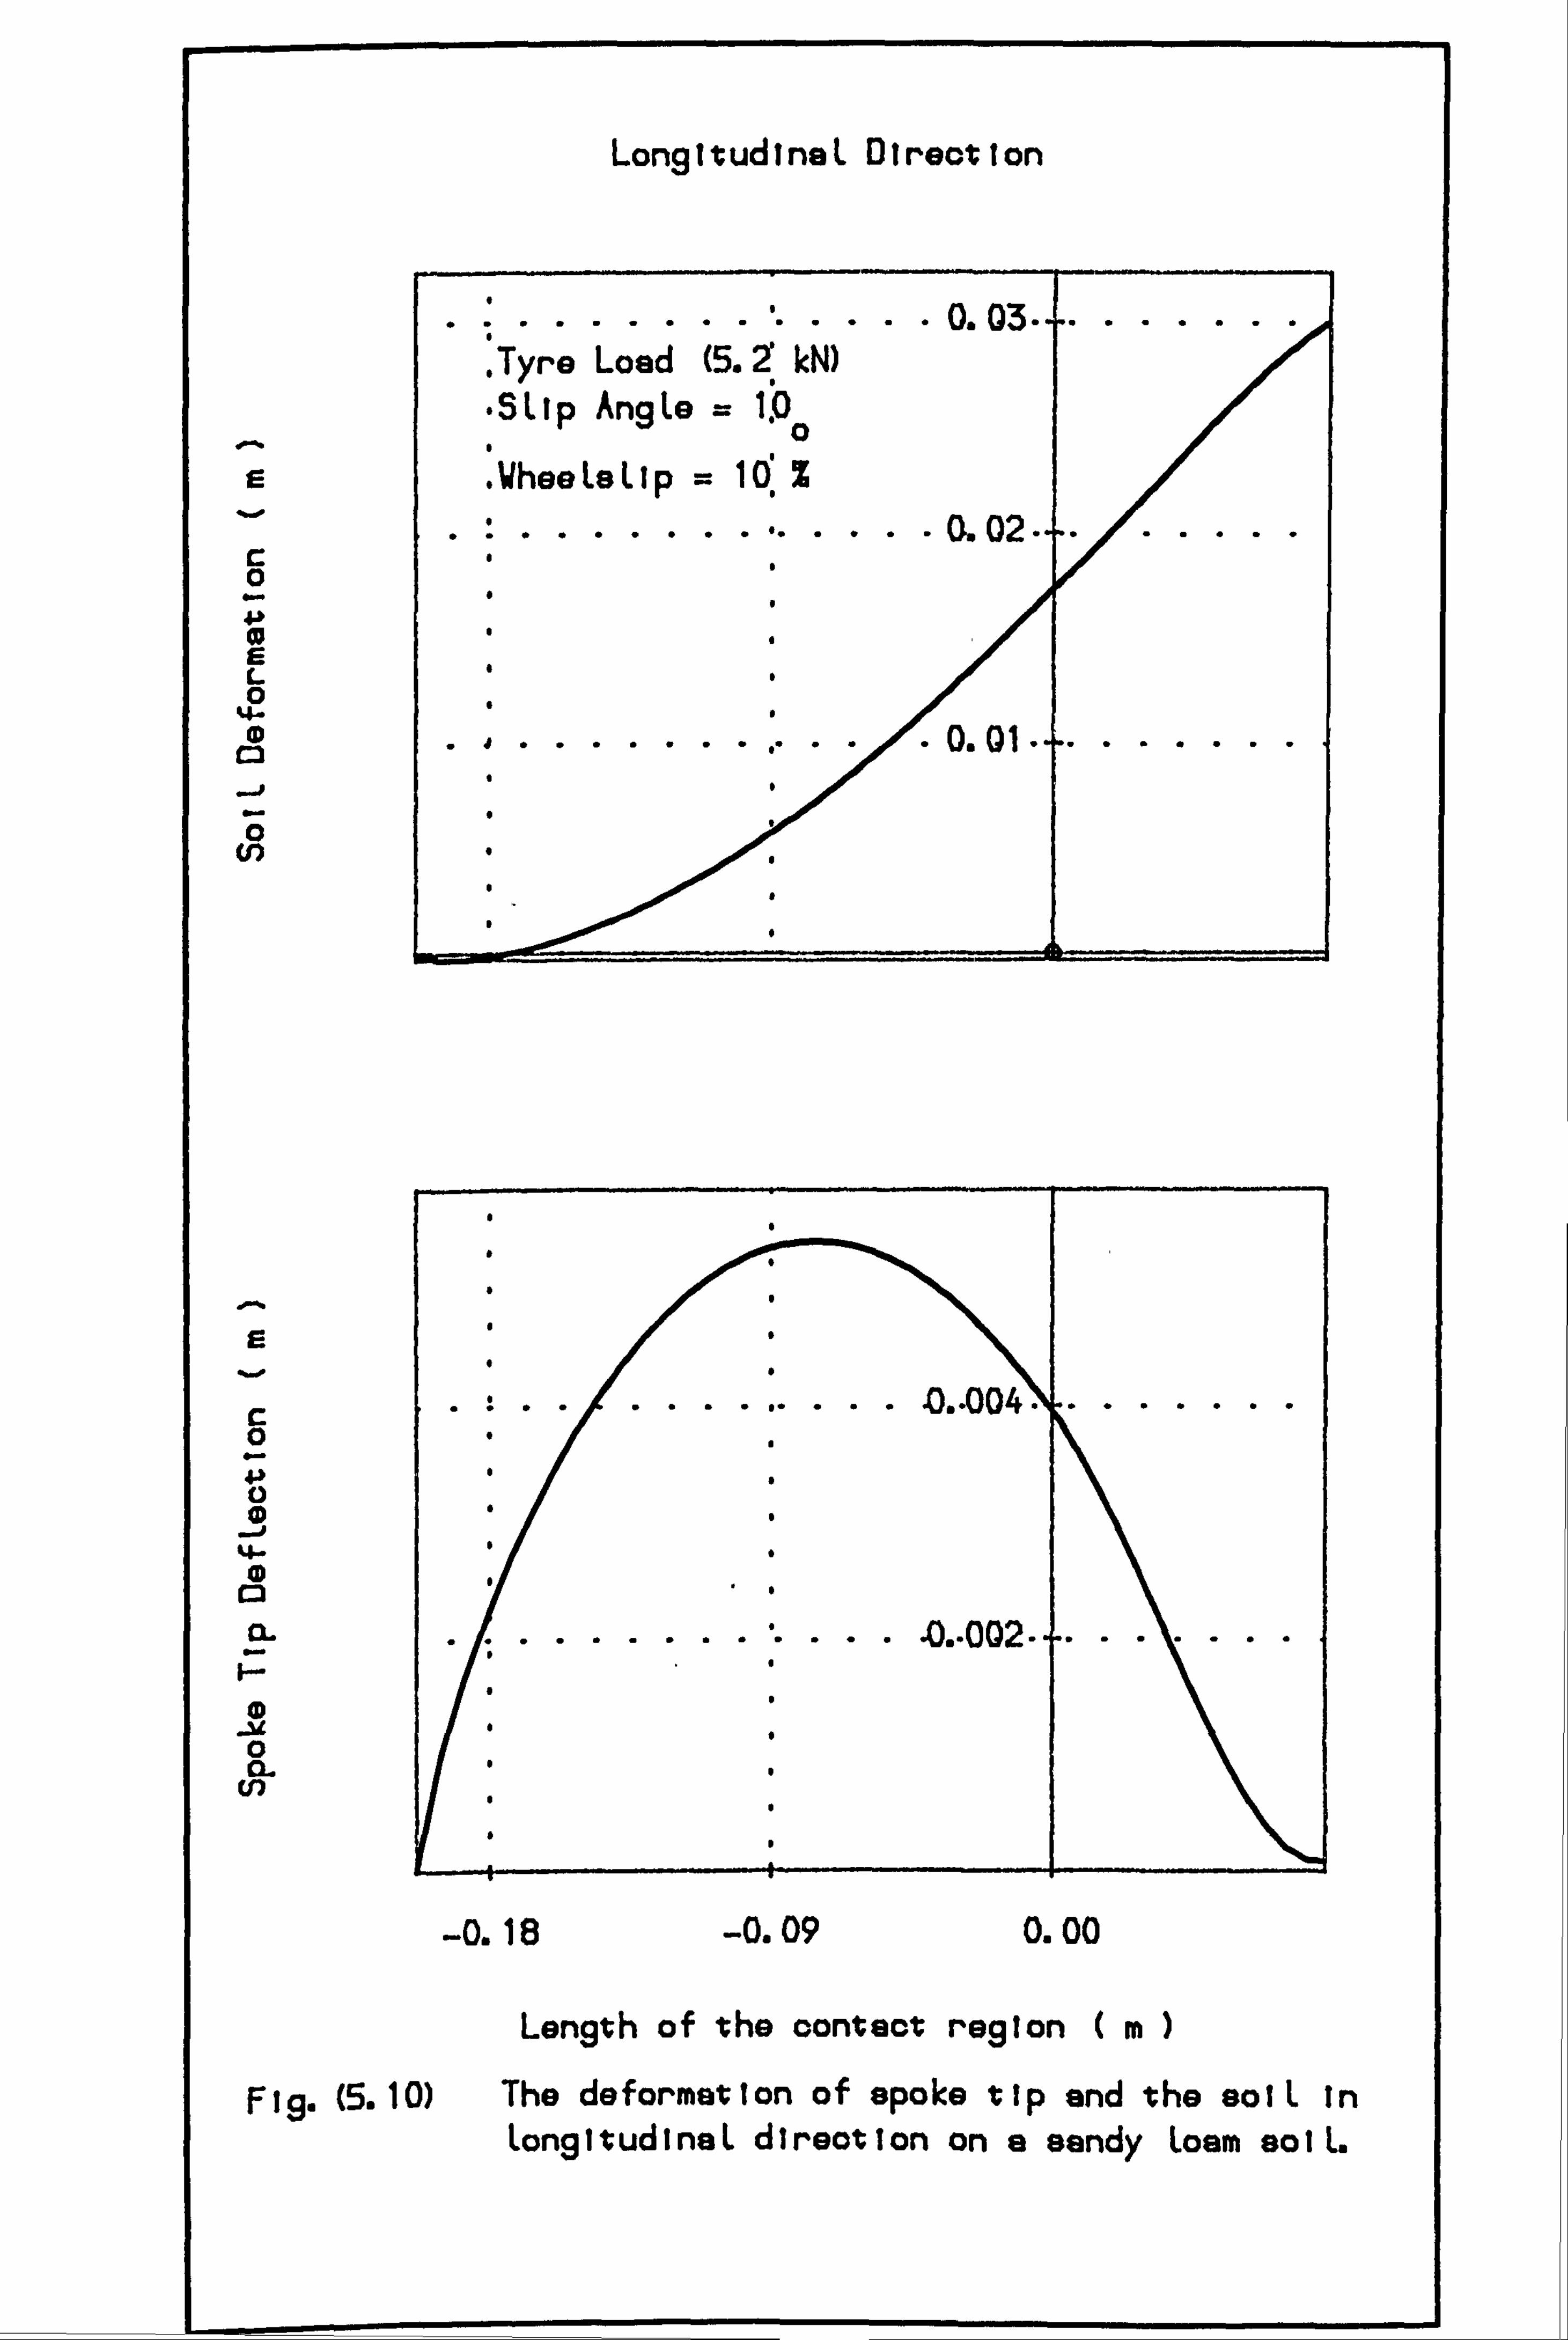
LongitudinaL Direotion
0
L 0
C2
--0
E
c 0
P
C3
CL
4) _u 0 CL
U)
...... 0.03 .... ...... . TyrG Load (5. ý kN)
-SLIp AngLe 1.00 : WheeLeLlp ld %
.............. 0.02. -
........... ... 0,01 .... ......
. 0.. 004
4).. 002 .... ......
-0.18 -0.09 0.00
Length of -the oonteot region (m)
Fig. (5.10) The deformation of spoke tip and the solL in LongitudinaL direotion on a sandy Loam solL.
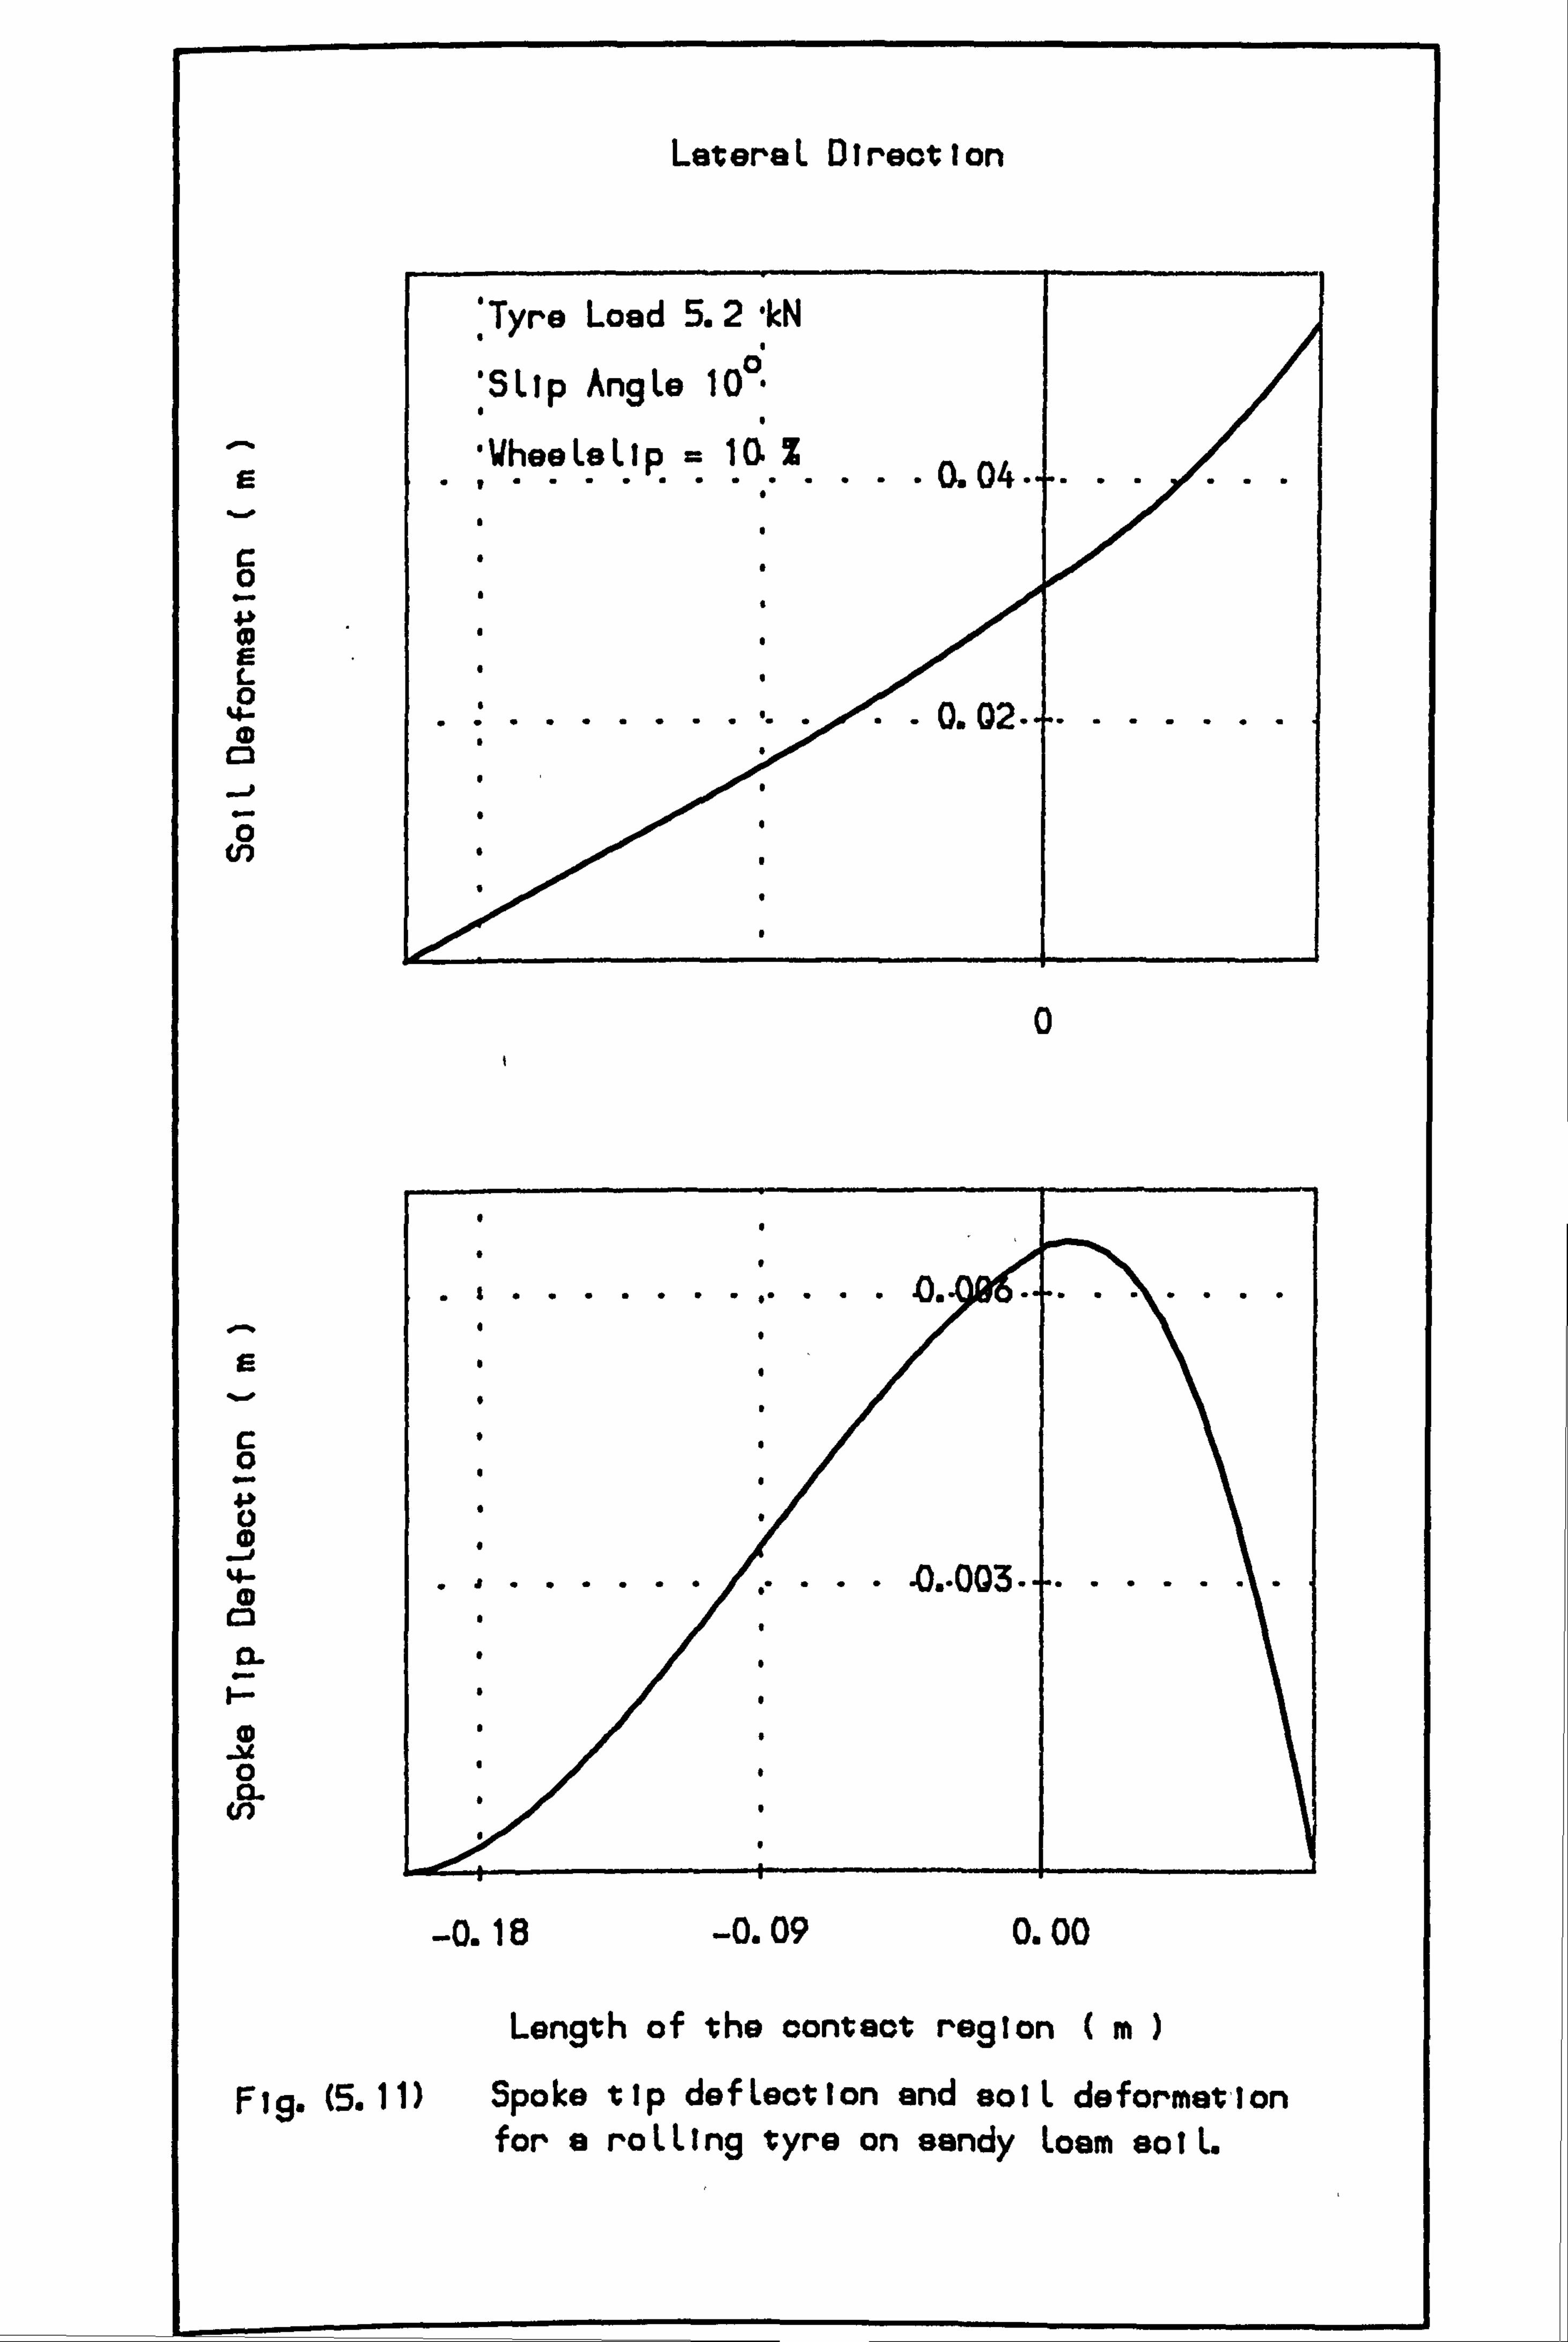
LeveraL Direction
E
C 0
4) 0 E C.. 0
0
-J 0
(1,
E
c 0
CL
CD _u 0 M
W
: Tyre Load 5.2-kN 0. 'SLIp AngLe 10 -
: WheeLeLip - la Z
I............ 0.04.. -.
0.02. --. 0.02.
0
........ .... 0.. 003.
-0.18 -0.09 0.00
LGngth of the contsot region (m)
Fig. (5-11) Spoke tip dGfLeotIon and solL deformevion for a ro LL Ing tyro on sandy Loam so I L.
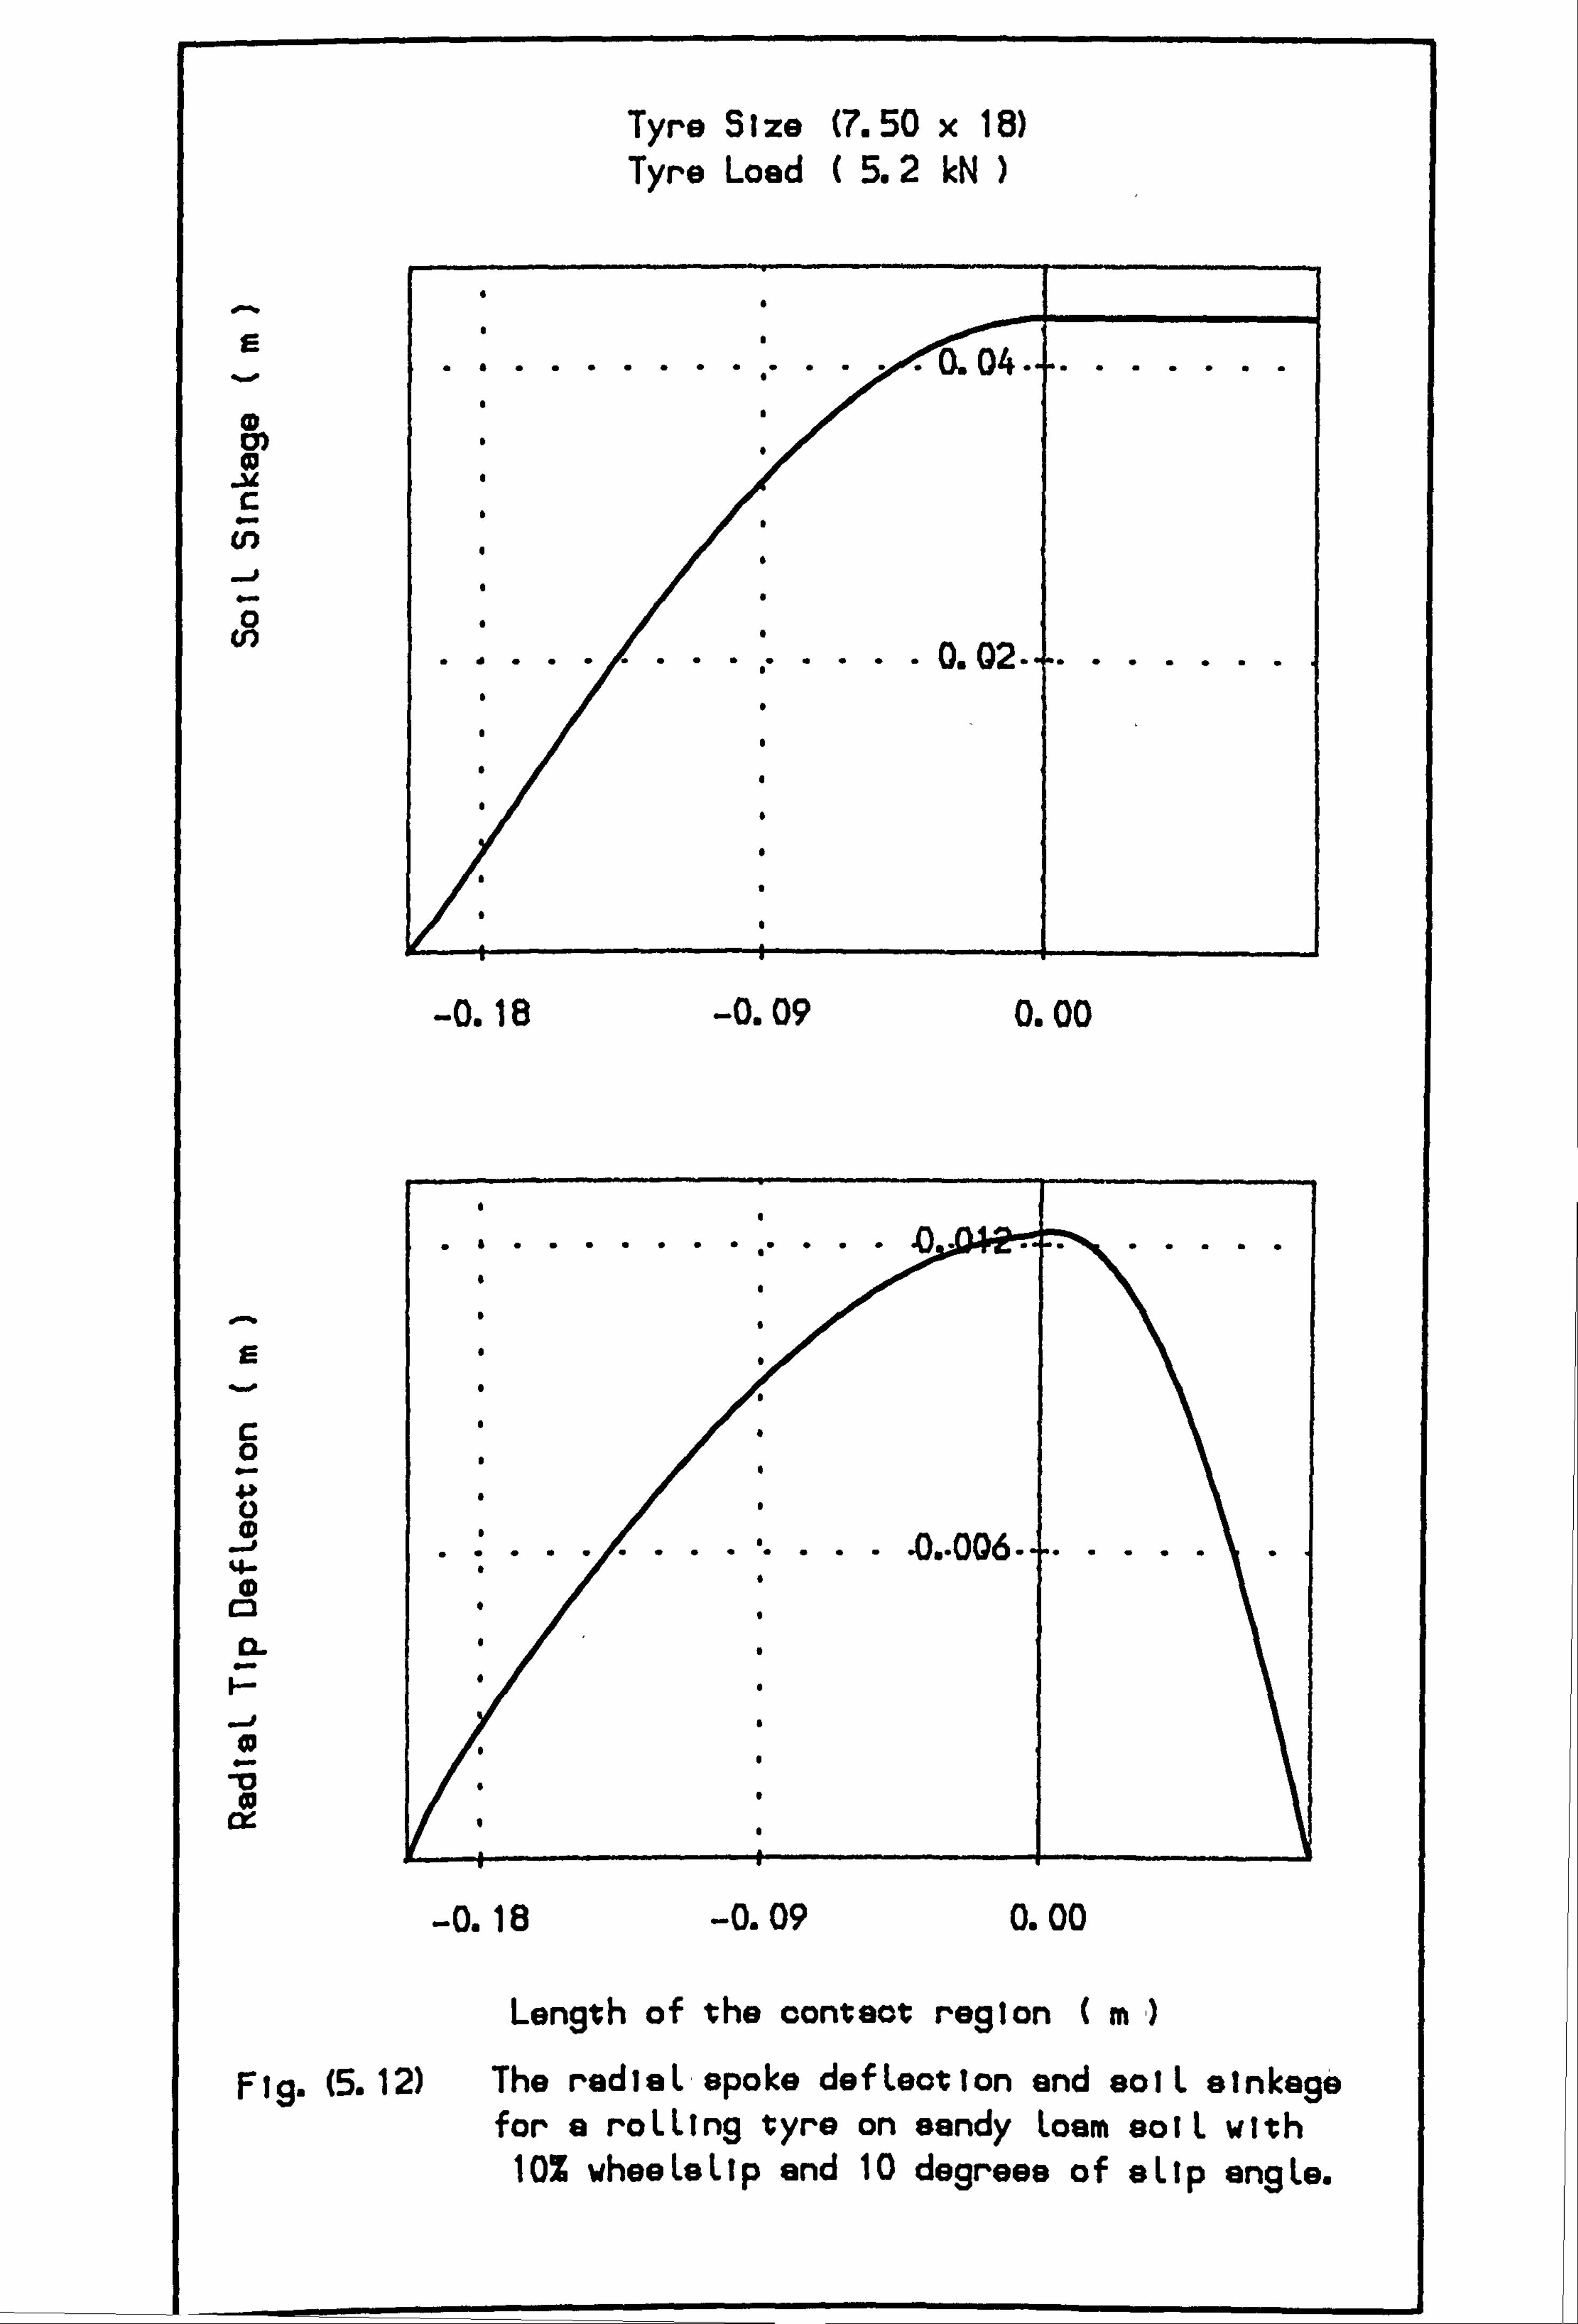
Tyre Size (7.50 x 18) Tyre Load ( 5.2 M)
E
0 0)
E
c 0
C3
CL
M tv
ix
(104 .... ......
........... .... 0.02. --.
-0.18 -0.09 0.00
.: :-.. -0.
0. -006.
.-
-0.18 -0.09 0.00
Length of the conteot region ( m)
Fig. (5.12) The rediaL spoke def Loot ton and sol L sinkage for a roLLIng tyro on sendy Loam soiL with 10% wheeLeLlp and 10 degrees of eLlp engLe.
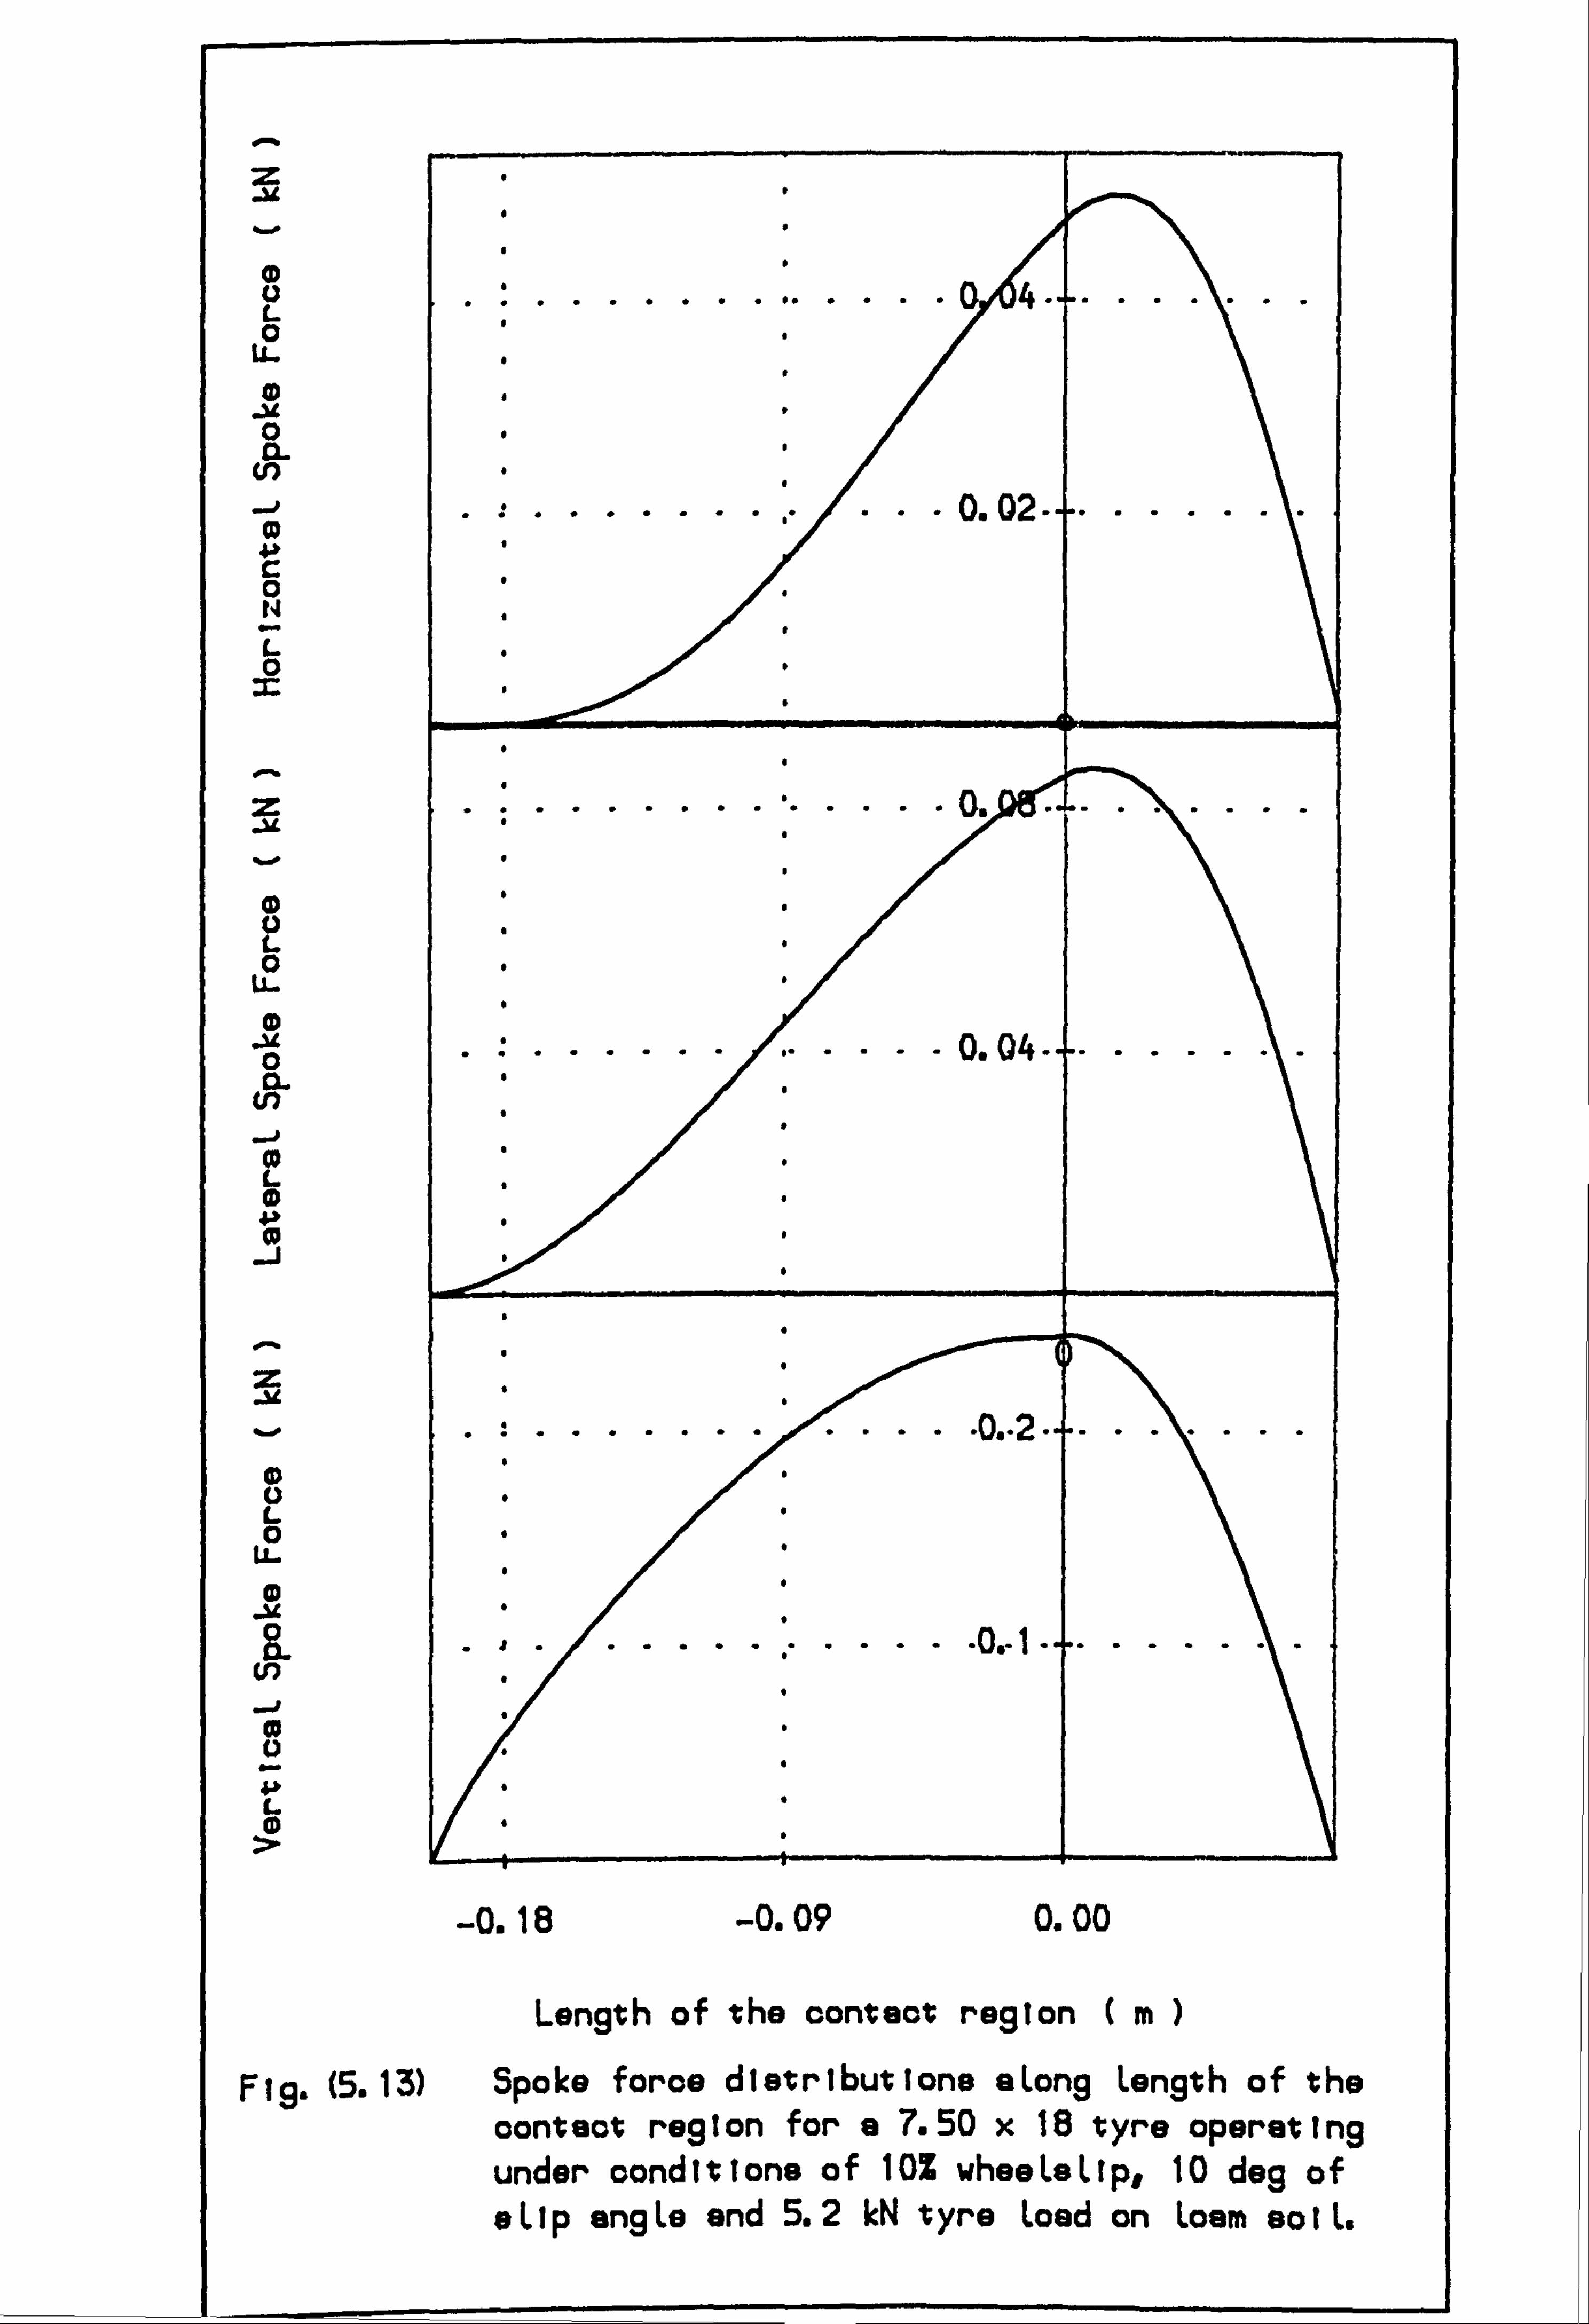
0ý
z
Ju
CD 0 L 0
U-
0 _u 0 a-
U)
-j co 4A C: 0
0
z
0 0
0 U-
0
0 0
U,
-J 0 C- 0 0
-J
N--
0 0 L. 0
U- 0
a U, -J 0 0
L. 0
04
0.02 .. ........
.:............ o. .. ..
........ ....
.............. 0. -2 .. ........
0,1
-0.18 -0.09 0.00
Length of the conteot region (m)
Fig. (5.13) Spoke foroe distributions sLong Length of the oontsot region for a 7.50 x 18 tyre operating under oonditions of IOZ wheeLeUp. 10 dog of aLip ang Le and 5.2 Mt yre Load on Loam so i L.
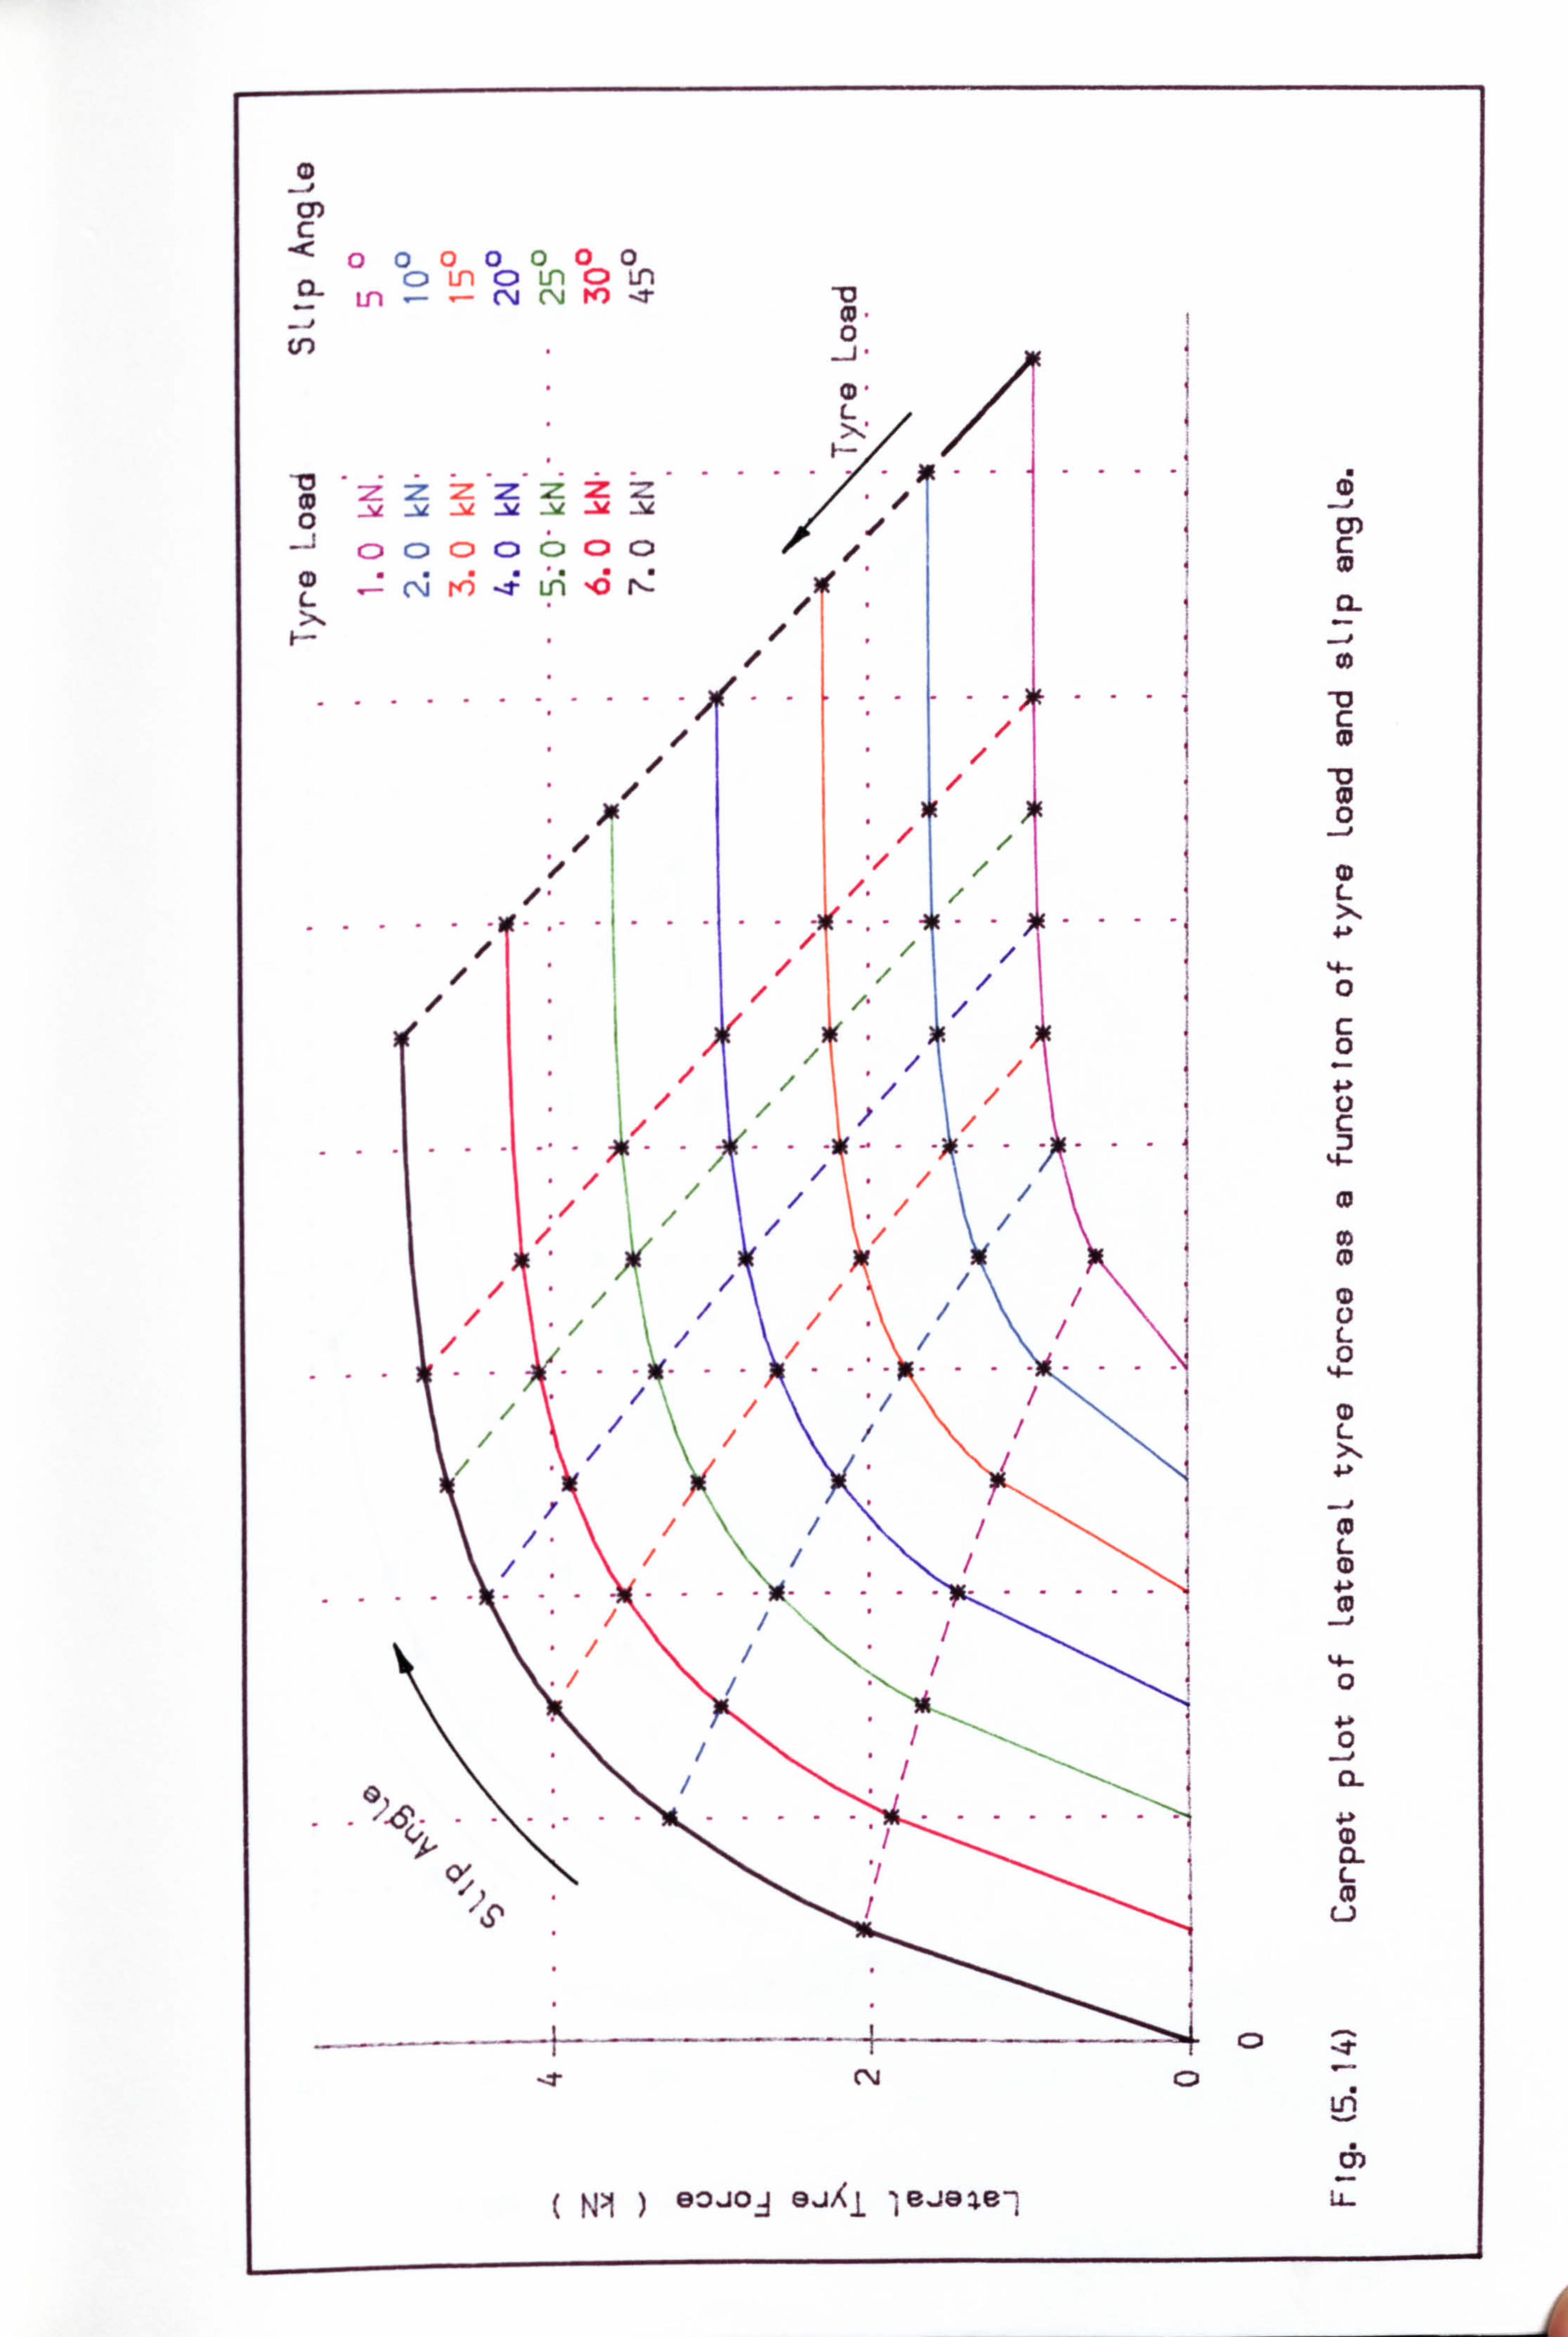
0 -i CI) c
0000000 (D Ln C: ) Ln (D Ln
(%j CIJ K) -Y
L
............. Z :ZZ : 7- ZZZ
CD CD c> a c> KD 0 L (\i fe) 't L. n 10 r- >,
--- -- --------
i
CL
c m
'D w 0
-j
Im L X
0
c 0
4-0 0 c
%4-
CD
L 0
L
L m 44 CD
0
4-0 0
/I LJL
D CL
C%j
Lri
NI ) GOJOA OJAi 18-JOI-8-11
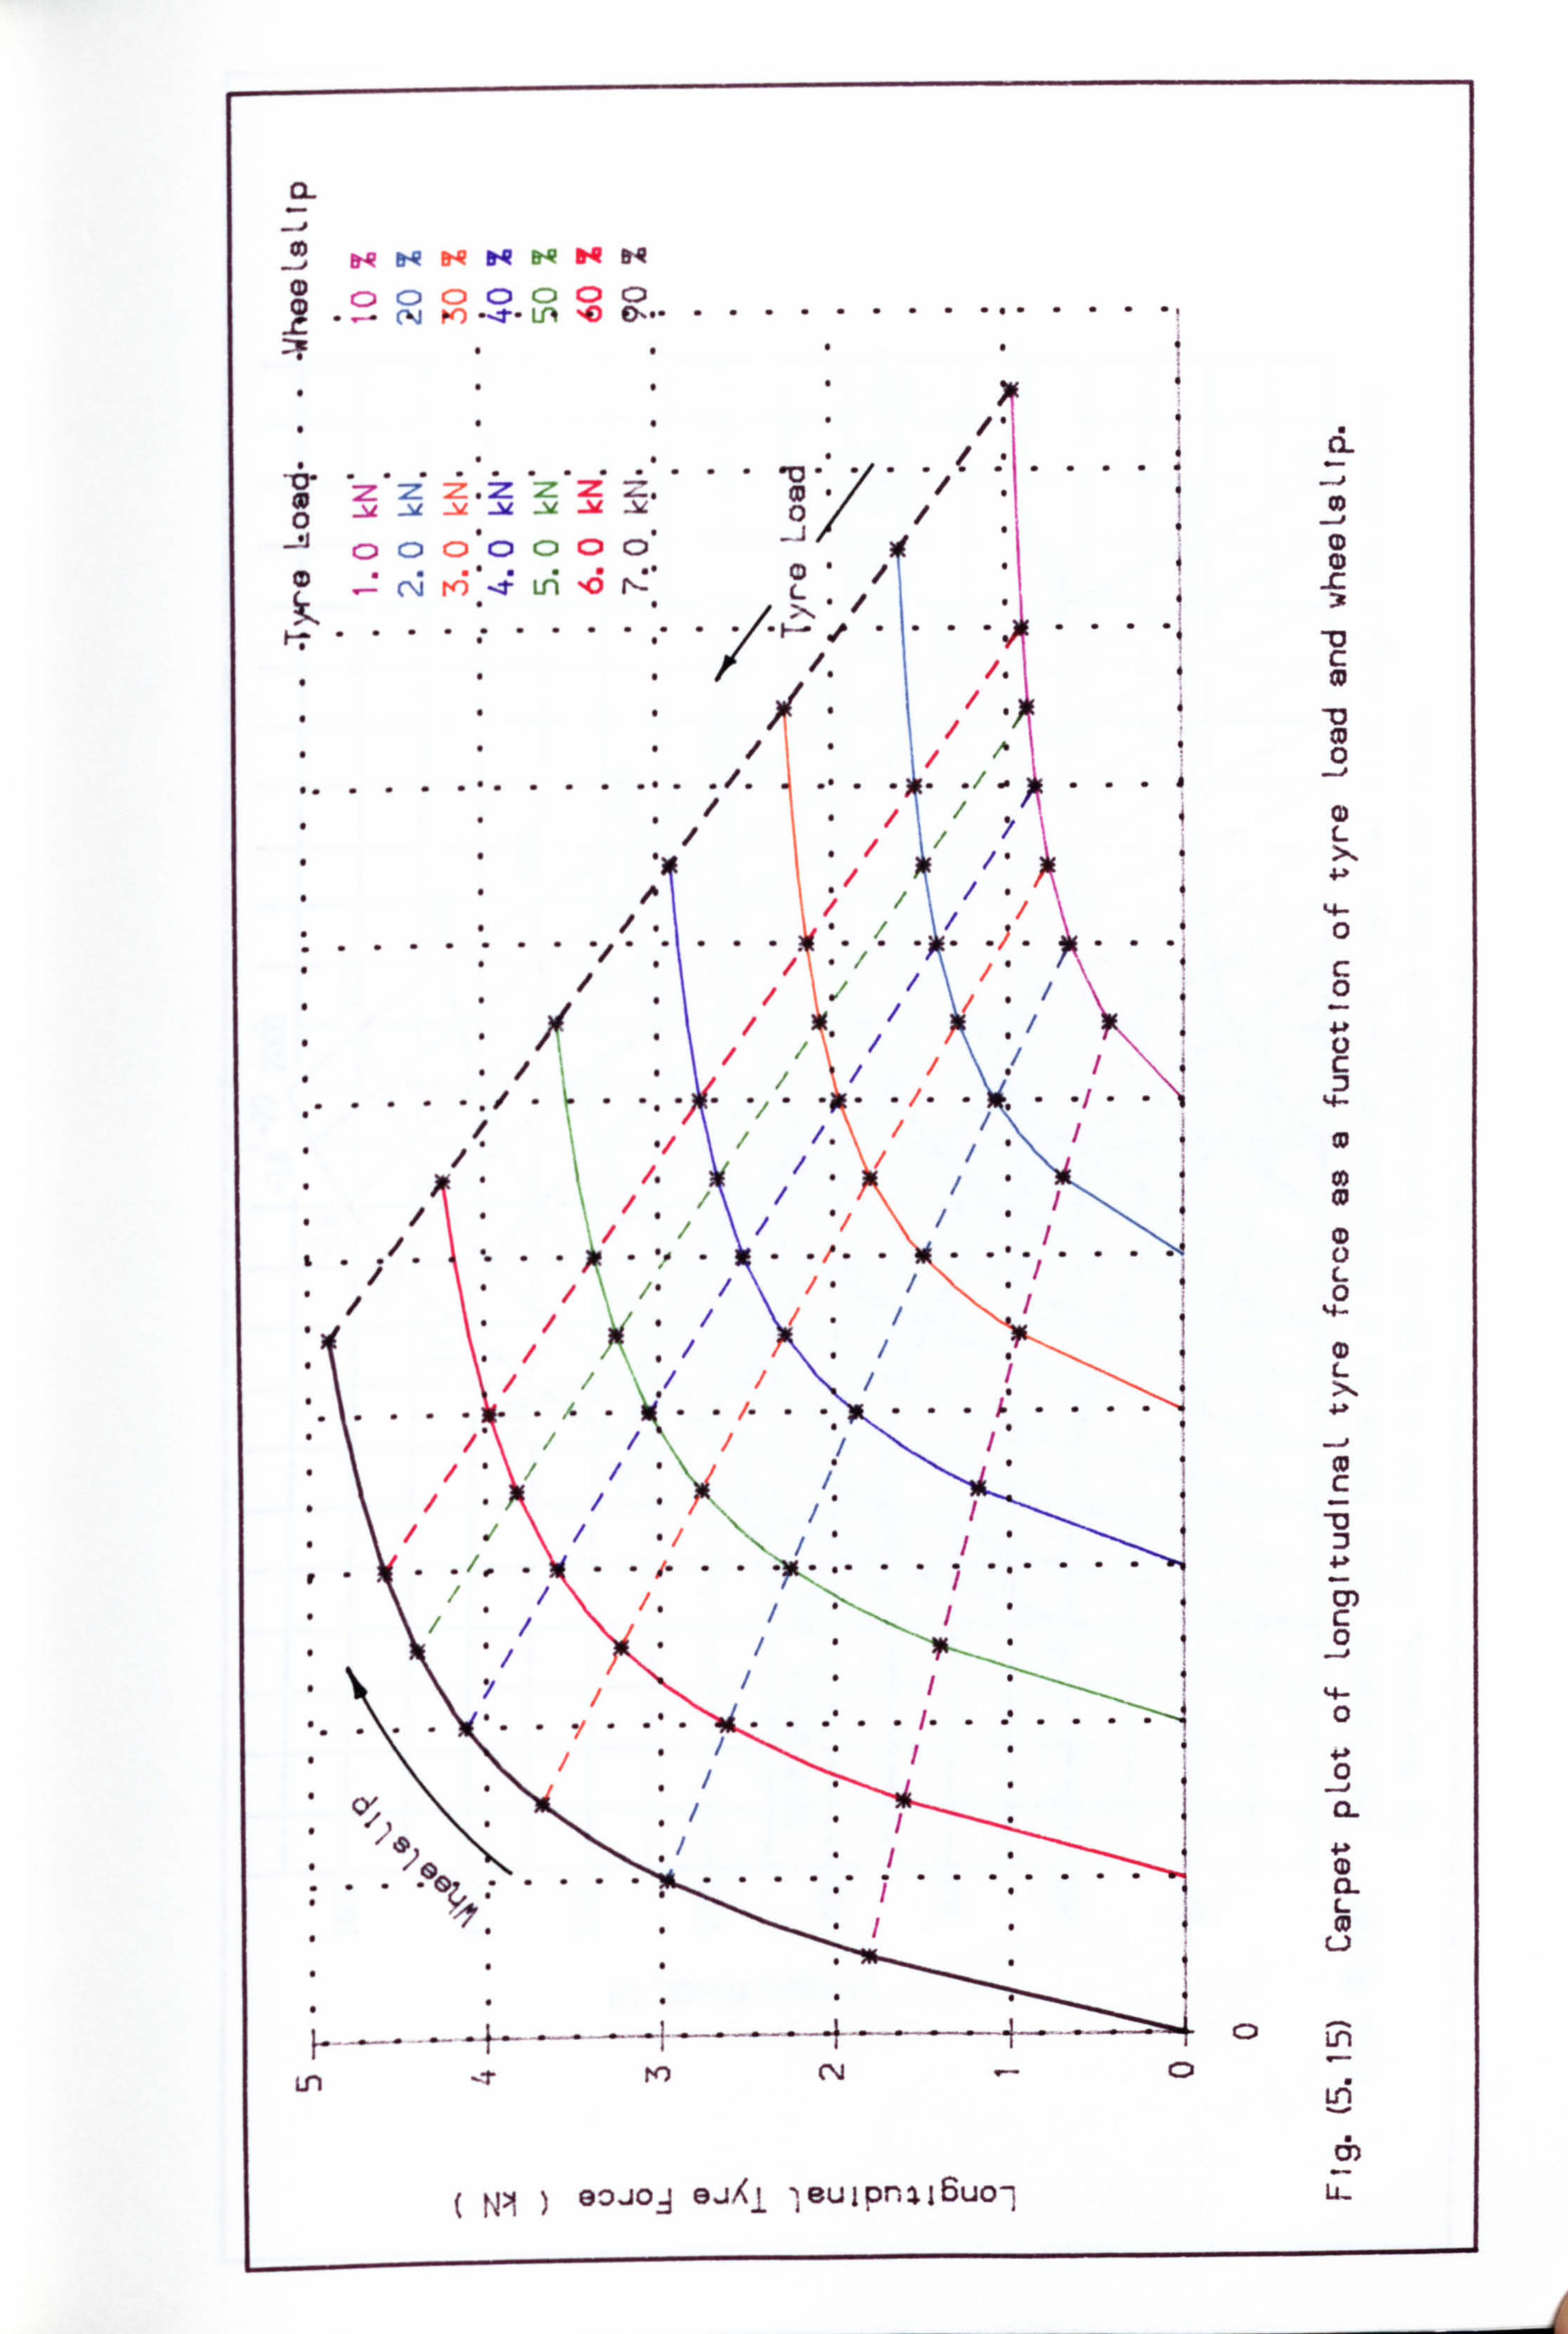
CD 2- C: )
, C: ) (-, j
C) 0 CD C) po LfN G
0 0'.. - ,*... ..... . ....
-
. . kv . ý- .. :z ..... z. zzz . . Z. ...
CD . q
-A C) C: ) CD c) CD a Cl
CD . -
. (N ... .. rr) -. t Ln 0 .. 1, -- 0
. .. . ..... ... ..
Ln -.! r
( tp ) aojoA 9jXj -ý, eujpr.: ij6uo7
CD
ci. -4 OD
-i CD
c w
_0 CD 0
0 L
0
c 0
c
0
L 0
L X 41
c
c 0
-j
14- 0
+-P 0
CL
4-11 a) Cl. L m
L)
rn
LA 6) E
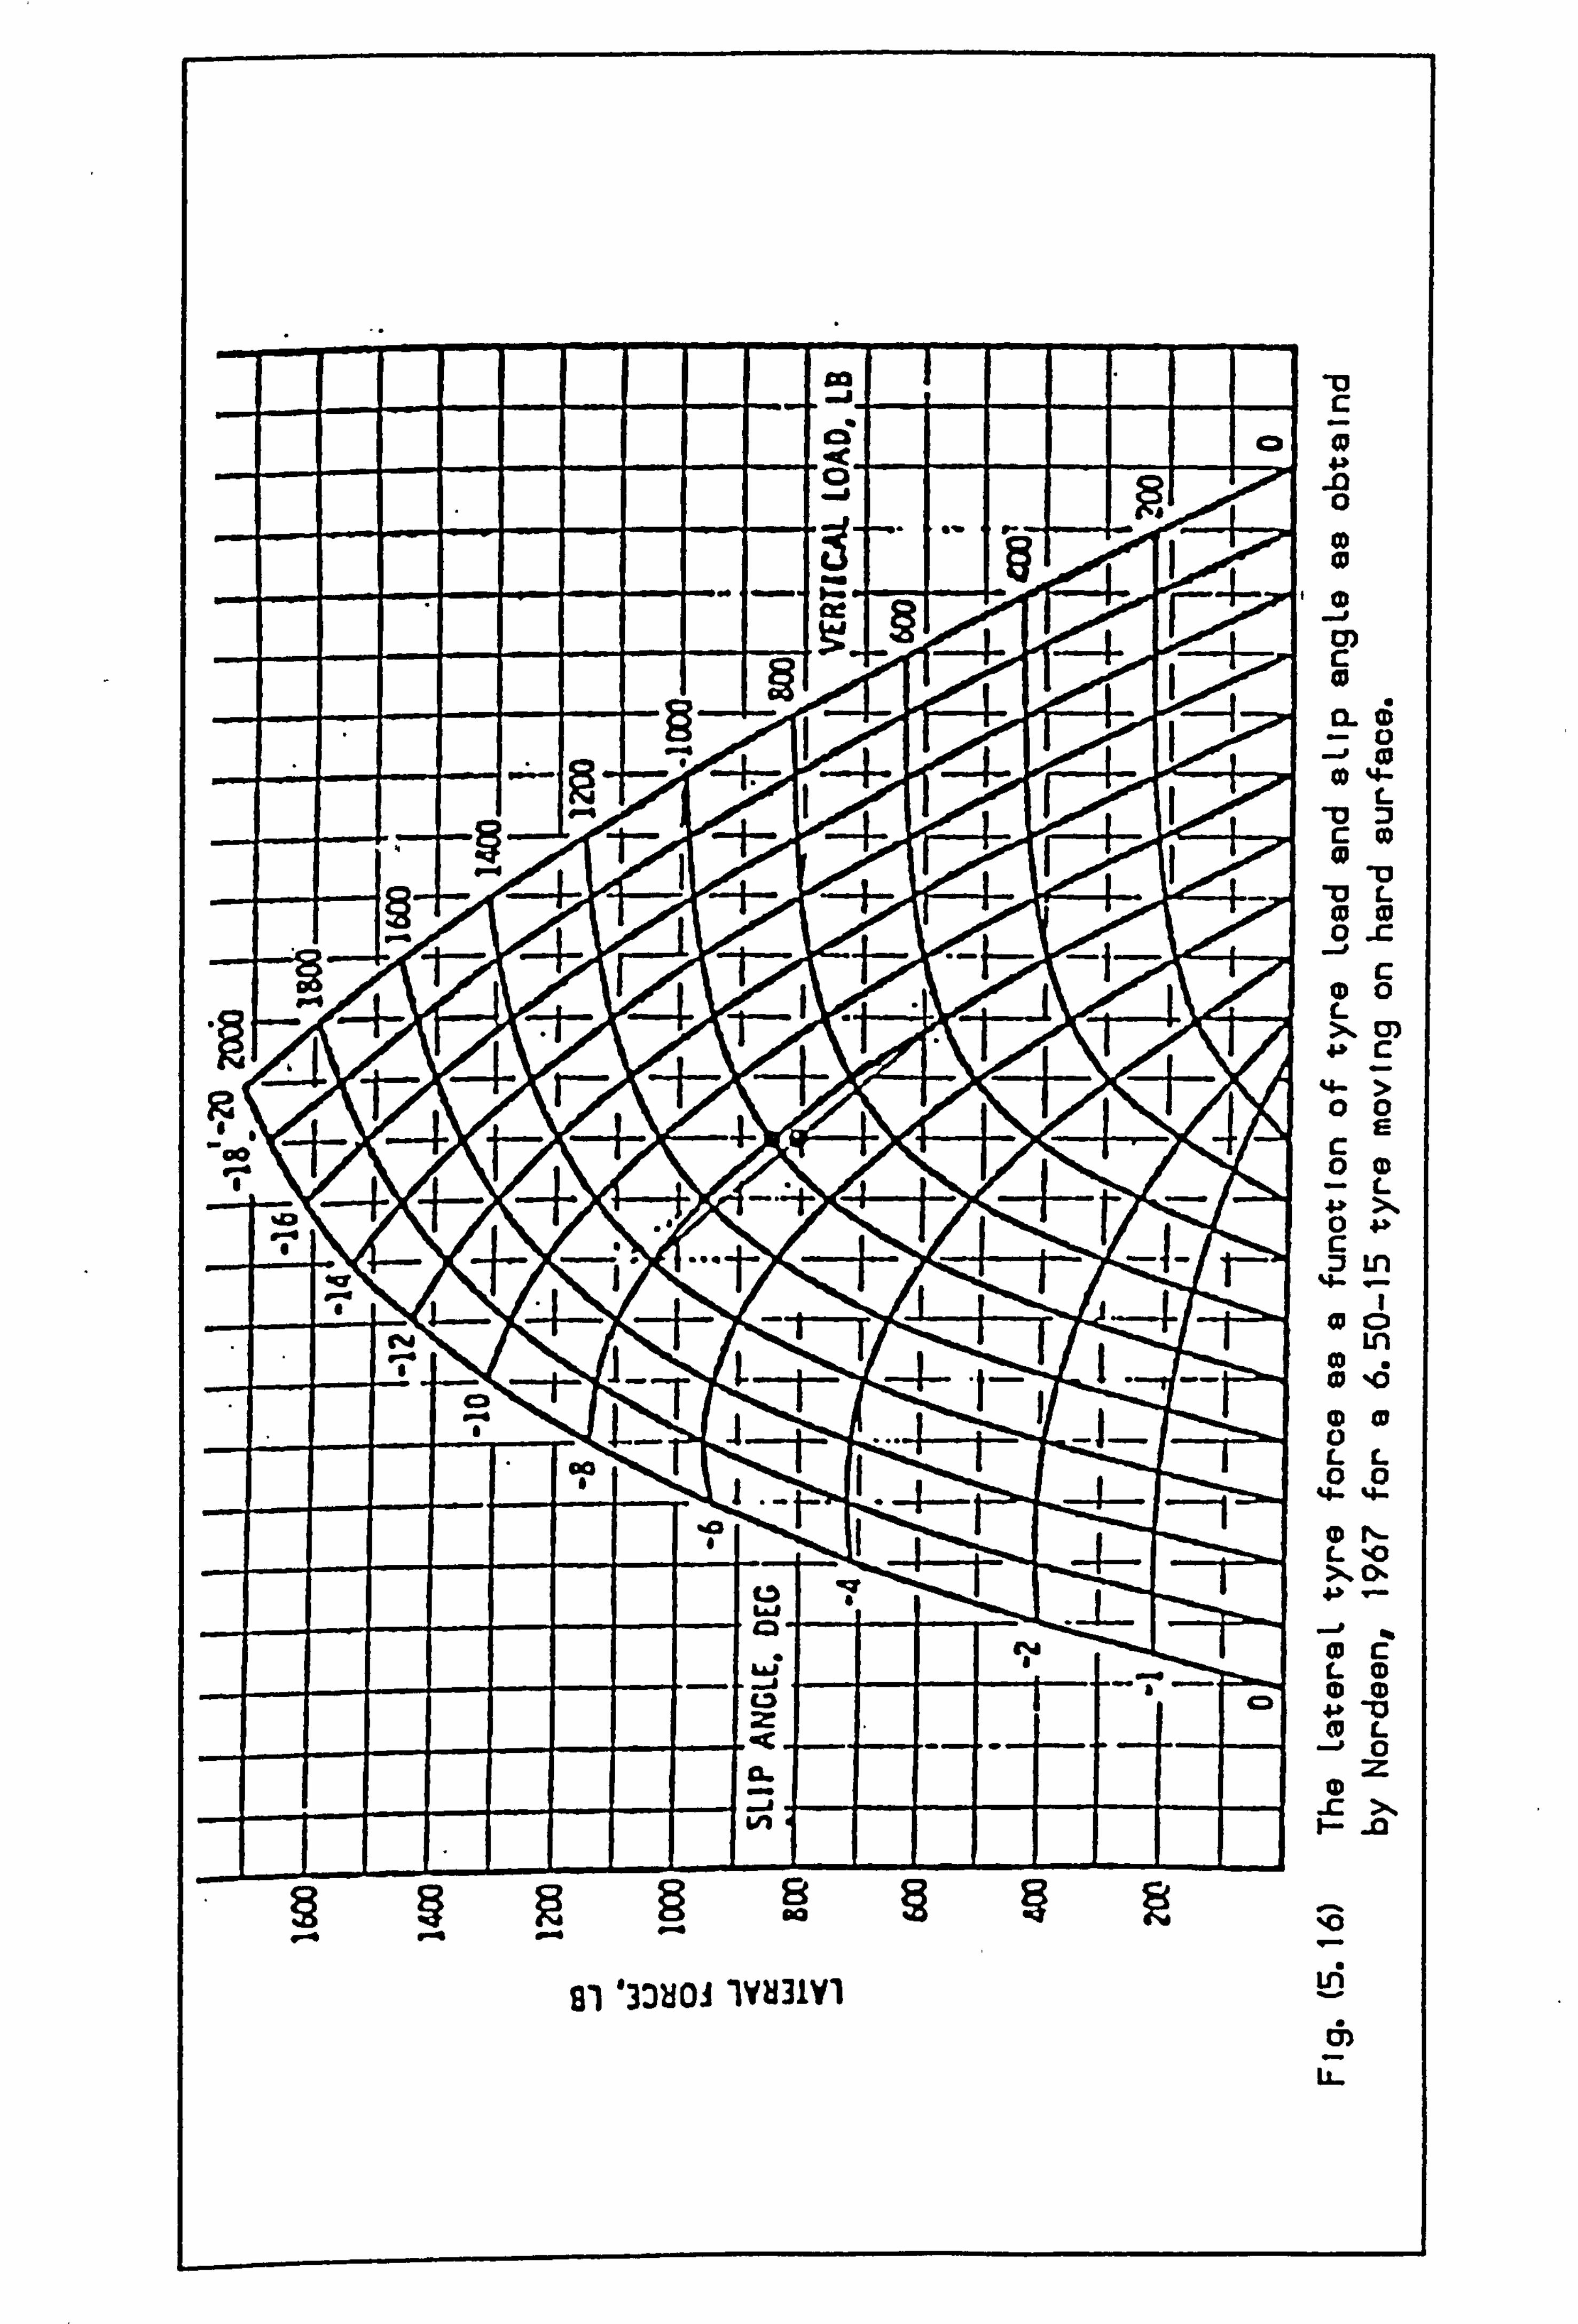
c
gas CD 0 mc
0
0. CD
II CD -L
ML 0
-C - .--1-. 0
c
-11 00 fw4 L X a) 4-P C
-4- ;
00 1 0*
,cE 0 CD
L 0 4.3-
5 Ln *4-
0 Cl
Ln co .
V-0 tI-10 . -0 CD CD
ca LL 00
44- 4-
(D Il- L 'o x 0ý
wc L CD (D CD C. D 1 4m 4.1, -0 0L
0 CD C
NO
81 '331101 lVH3lVl
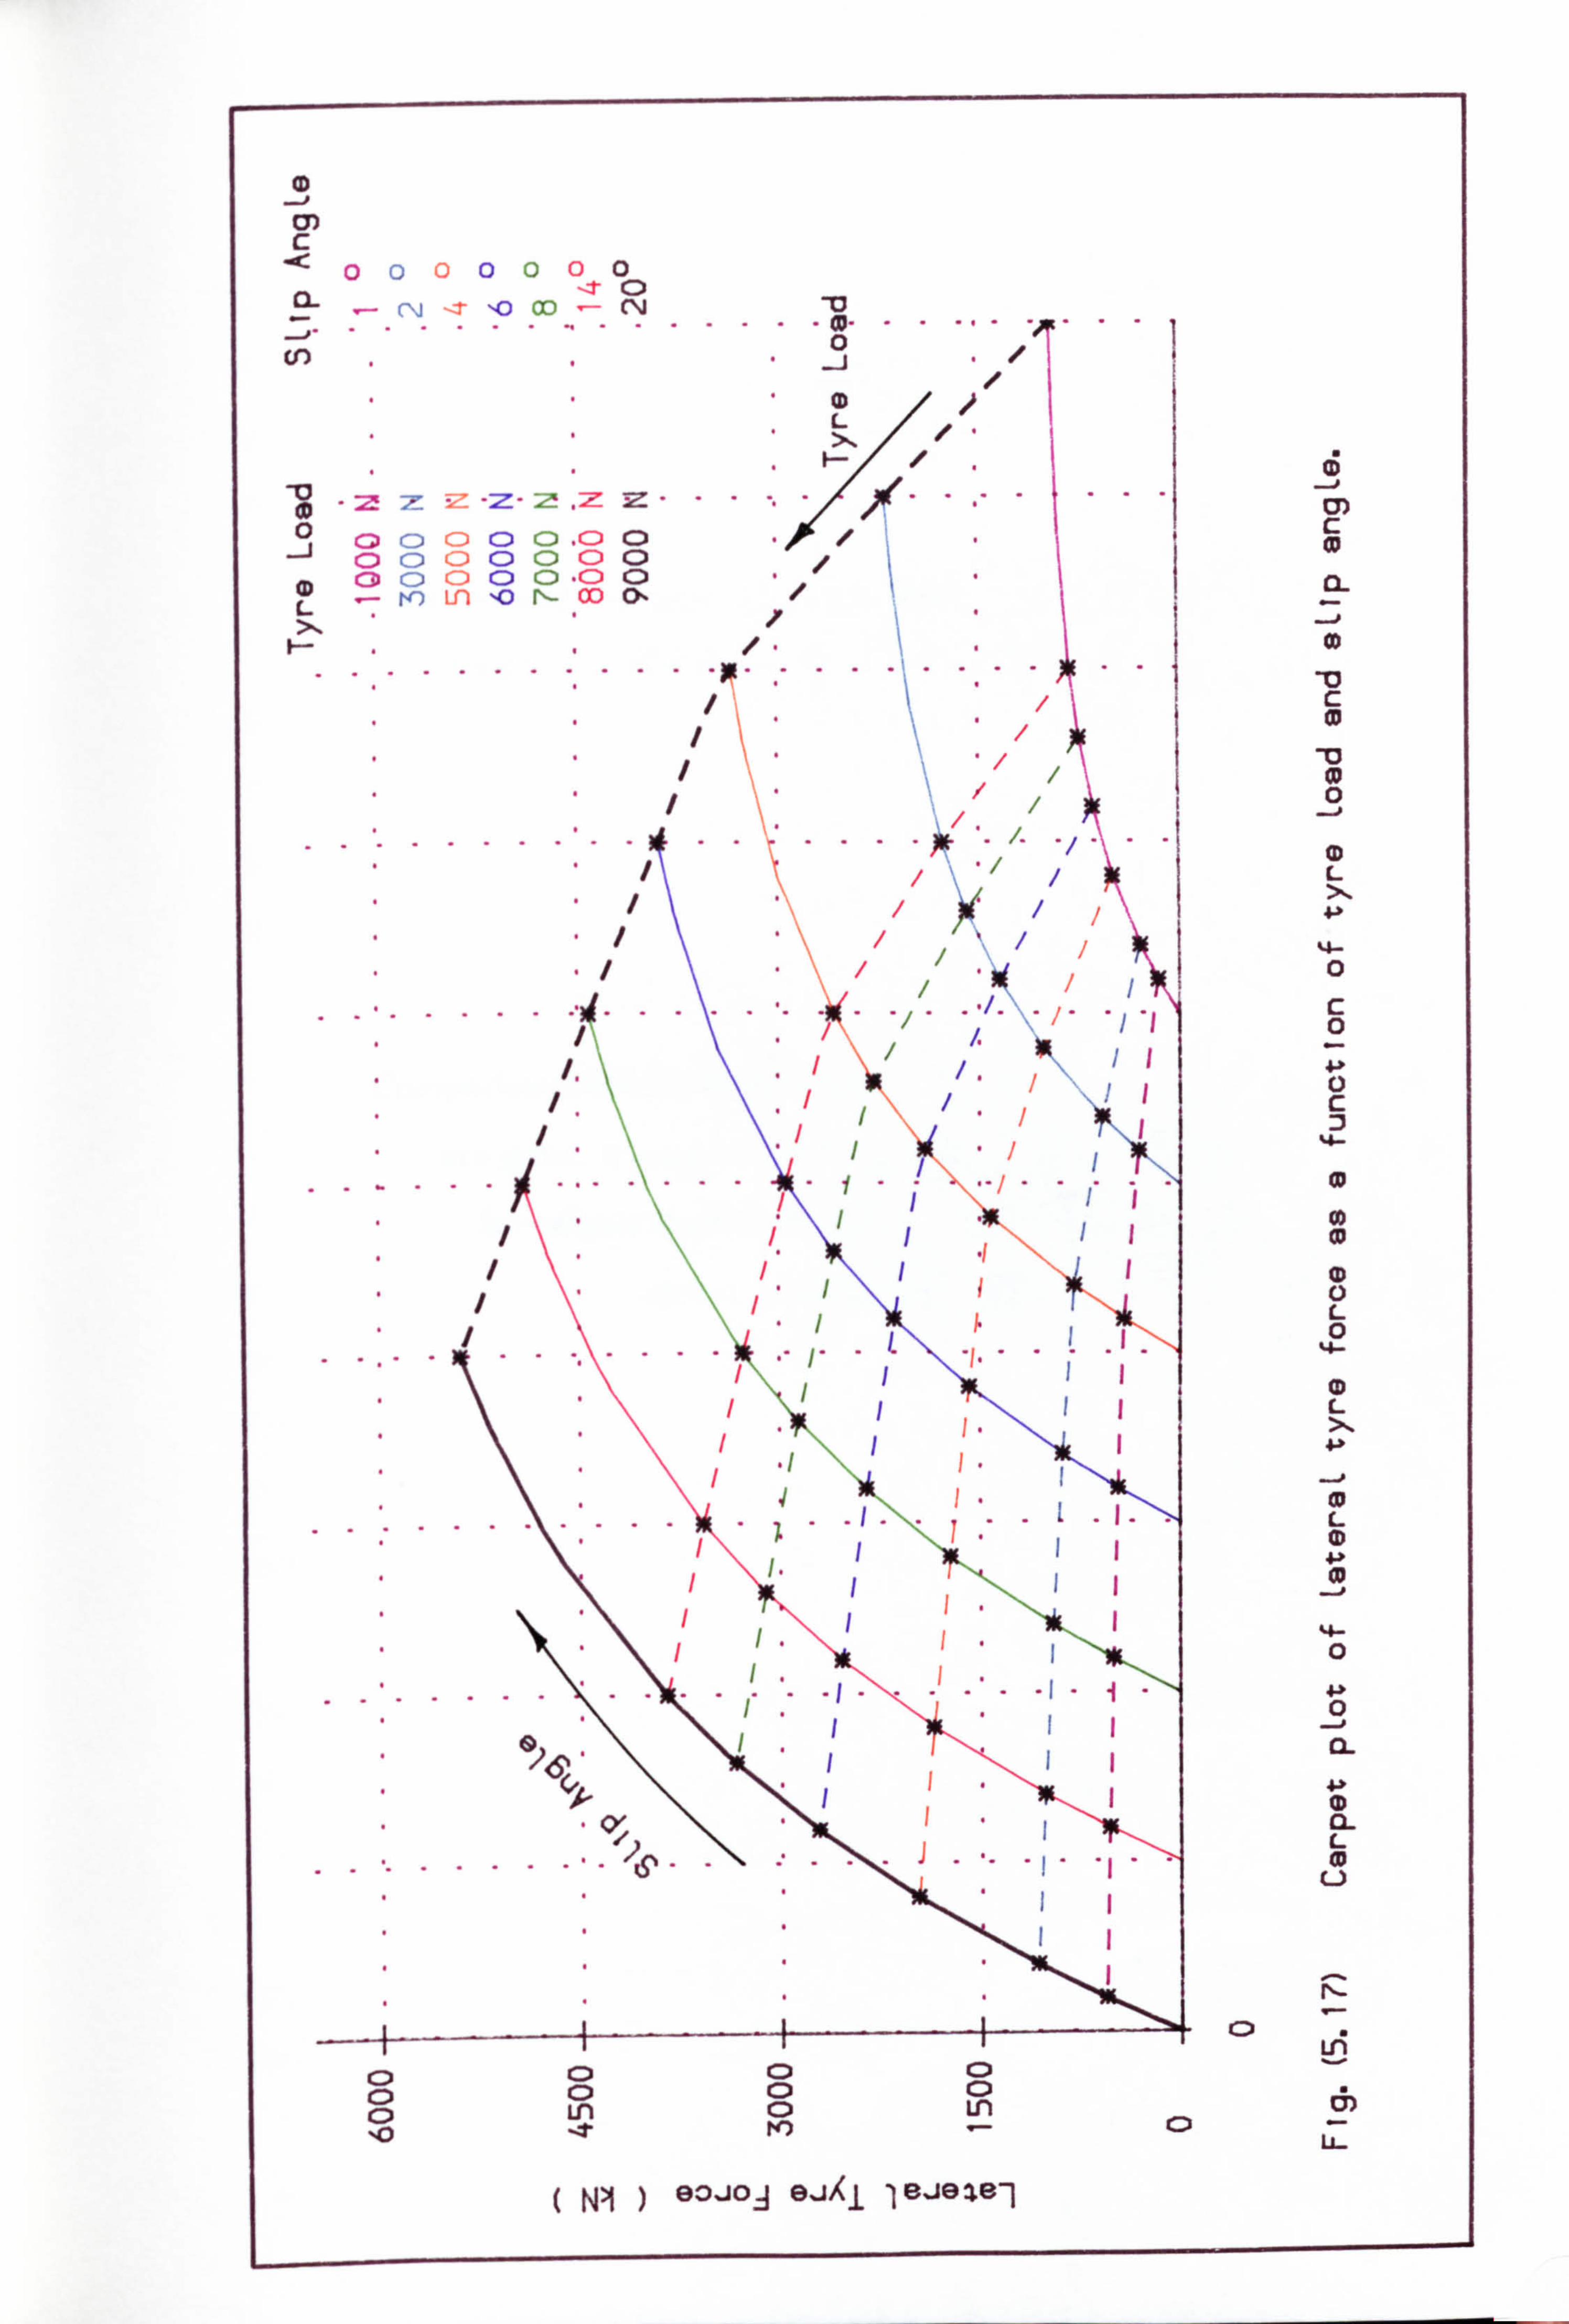
(D -. j a) c
0 0 0 0 00 0 -
:r OD C) . .. . . ... . ..... w. .....
.... 0
COD (D L x LL
0 G) C) CD Cl C) (D Cl 0 CD CD 0 0 CD 0 C31 C) CD C) C) (D C)
L to Ln Zo F- co 5ý X
. . .. . . ... . .. p...
. . . . . . . . . .. .
( NI ) 83JOA 9JXi IIBJW181
C)
c Im
0 __j
CD L >1 4-21
%4- 0
c 0
c
co
L 0
4-
(D L x
L
(D
0
4.31 0
L
(D u
iz LA
C) C) 9-1
C) C) Cl Cl Ln Cl Ln 10 't Pr) - tD
CHAPTER 6
COMPARISON BETWEEN RESULTS PREDICTED BY
VARIOUS MODELS AND MEASURED RESULTS
Comparison between the predicted results and measured data
are given. A large number of results are presented to
investigate thoroughly a wide range of off-road
tyre operating conditions.
-143-
6.1. INTRODUCTION
For a better understanding of off-road tyre behaviour on deformable surfaces sample
plots have been generated from the various models presented in this thesis, and are
compared with measured data recorded in the literature (Chapter 2) under a wide range
of operating conditions.
The results predicted from the various models for off-road tyre forces can be
categorised into three main sections. Firstly the simple tyre model, which only deals
with generating tyre forces in longitudinal and vertical directions for a stationary and
rolling tyre under steady state conditions. Second is the extended tyre model for com-
bined lateral and longitudinal forces on a deformable surface. Finally there is the
multi-spoked tyre model on deformable surfaces initiated in order to present a better
understanding of off-road vehicle handling behaviour.
6.2. SIMPLE TYRE MODEL
The predicted contact area/tyre load relationships for a 7.50 x 16 front tractor tyre with
three different soil types dry sand, artificial and sandy loam soils shown in Fig. (6.1) are
significantly in agreement in qualitative terms with the trends of those results obtained
experimentally by Yong et al [1978a] for a different tyre size on silty soil and by Pret-
tyman [ 19 81) for a static tyre on hard surface as shown in Figs. (6.2) and (6.3).
Fig. (6.4) presents a comparison between the theoretical and experimental relation-
ships between the soil sinkage and the tyre load for a 7.00 x 16 tyre on artificial soil
rnade by Bekker and Janosi [1960] compared with predicted results shown in Fig. (6.5).
The soil sinkage increases significantly with the increase in tYre load. It should be noted
however, that the slope of this relationship decreases with increasing tyre load. The
difference between the predicted results and measured data may be expected due to the
differences in soil parameters reported and used for tyre, model input data.
Variation of rolling resistance with tyre load for a 7.00 x 16 tyre on wet plastic
soil is shown in Fig. (6.6) as measured by Bekker and Semonin [1975). Ilis can be
-144-
compared with predictions by a simple off-road tyre, model as shown in Fig. (6.7). Ilie
predicted relationship between the rolling resistance and the tyre load is similar to that
obtained by Bekker and Semonin [19751, although again slight magnitude discrepan-
cies occur due to different soil parameters.
6.3. EXTENDED TYRE MODEL
The results for the extended model for combined lateral and longitudinal tyre force
become the same as those proposed by Grecenko [1975] as the tyre stiffness parame-
ters, C' , and C' are increased. Fig. (6.8) illustrates this comparison, with the Xy
coefficient of lateral force plotted against slip angle at zero wheelslip and 500,750,
1000,1500 and 20,000 WIM3 rad. tyre stiffness. Fig. (6.9) shows the comparison
between the coefficient of longitudinal force/wheelslip relationship and the results
predicted by Grecenko under the same range of operating conditions and zero slip
angle.
The measured results of the influence of slip angle on the relationship between
lateral force and tyre load and the influence of tyre load on the relationship between
lateral force and slip angle, obtained by Schwanghart [1981] for a 5.50-16 front tractor
tyre shown in Figs. (6.10) and (6.11) are very close to those predicted by the model for
the same operating conditions as seen in Fig. (6.12) and (6.13).
Figs. (6.14 to 6.21) present comparisons between results measured by different
authors and results predicted by the extended off-road tyre models presented in chapter
4. The comparisons show the qualitative agreement in the curves. It is interesting to
note that Fig. (6-21) does not show rolling resistance and therefore, looks significantly
different from the predicted results shown in Fig. (6.20). In general, the behaviour of the
tractive force for on and off-road tyre can be summarised as shown in Fig. (6.22). The
rolling resistance is shown to be significantly influenced by the tractive behaviour. As a
result, the rolling resistance of the tyre on hard surfaces is primarily caused by the hys-
teresis in the tyre material due to the deflection of the carcass while rolling. But in case
-145-
of a rigid wheel moving on a deformable surface, the rolling resistance occurs due to
the soil shear deformations.
Fig. (6.23) shows comparison between the computed and measured
lateral/longitudinal force relationship as obtained by Matejka [1977] for a 6.0 x 16
driven wheel on field (wheat stubble on soil). These results are in significant agreement
with the same relationship predicted by the off-road tyre model under varying operat-
ing conditions of 10,20,30,40 and 50% of wheelslip and 10,20,30 and 40' of slip
angle as seen in Fig. (6.24).
A better presentation of the tyre characteristics was achieved by Grecenko [1975],
presented in Fig. (6.25) compared with the extended tyre model results in Fig. (6.26) for
the same operating conditions. The results from two models become similar as the tyre
stiffness in the extended tyre model increases.
6.4. SPOKED TYRE MODEL
The load and shear force distributions along the length of the contact region are shown
in Fig. (6.27) obtained by Krick [1969] under soft soil operating conditions. Similar
relationships in Fig. (6.28) measured by Burt [1987] are compared with results
predicted by the off-road tyre model operating on a deformable surface as shown in
Fig. (6.29).
By increasing the soil parameter values the soil becomes effectively very stiff
compared to the tyre, the contact region between the tyre and the surface becomes
smaller, so the spoked tyre model results should be the same as those predicted by the
Sharp and EI-Nashar [1986] model on a hard surface. These results are shown in
Figs. (6.30) and Fig. (6.31) for the relationship between side force and longitudinal slip
and the relationship between side force and longitudinal force (braking or traction)
respectively. These results are compared under typical Ciperating conditions with results
predicted by the multi-spoked tyre model for off-road surfaces in Figs. (6.32) and
(6.33). However, the comparison shows the quantitative differences that can be
-146-
expected due to the dependence on the tyre input data.
Fig. (6.34) and Fig. (6.35) illustrate the relationship between the longitudinal
force/wheelslip and the lateral force/slip angle at two different soil hardness values,
4500 and 20,000klVlmn +2 , compared with predicted results obtained by Sharp and El-
Nashar [1986]. For an accurate comparison of off-road tyre model results with any
other model results, Figs. (6.36) and (6.37) show a comparison with the same tyre size
data and operating conditions (except different soil types). Not surprisingly, the forces
predicted for hard ground (stiff soil) conditions are generally higher than those
predicted for soft soil conditions.
The relationship between tyre load and the contact length predicted by Sharp and
EI-Nashar [1986] is shown in Fig. (6.38), compared with results from the spoked tyre
model on hard surface conditions as shown in Fig. (6.39).
To demonstrate the multi-spoked tyre model, Fig. (6.40) shows the relationship
between side force and longitudinal force with different slip angles of -1,2,4,6 and 9'
obtained by Janosi [19811 compared with predicted results in Fig. (6.41) from the
spoked tyre model under the same operating conditions. This is the classic tyre force
ellipse curve and shows how readily the tyre model can emulate actual experimental
results.
6.5. CONCLUDING REMARKS
(1) The figures show that the forces generated by various off-road tyre models in
longitudinal, lateral and vertical directions under a wide range of operating condi-
tions, follow the same general trends as the measured results obtained by a wide
range of authors.
(2) The plots illustrate the capability of off-road tyre models in representing tyre
behaviour over a very wide range of operating conditions. The results obtained
from these models show a very good qualitative agreement with published
-147-
experimental results obtained and collected from a wide range of sources as seen
in "LIST OF REFERENCES".
(3) Comparisons of results of off-road tyre models and measured data are recog-
nised to be often difficult because of the lack of soil and tyre parameters quoted in
reports of measurements. However, despite these difficulties, qualitative agree-
ment between the predicted results and measured data is generally good.
(4) Since the comparisons between the results predicted from various tyre models
and those measured for a wide range of different operating conditions are in
agreement qualitatively it is suggested that this validation of models is sufficient
to justify their usefulness for vehicle handling and stability studies.
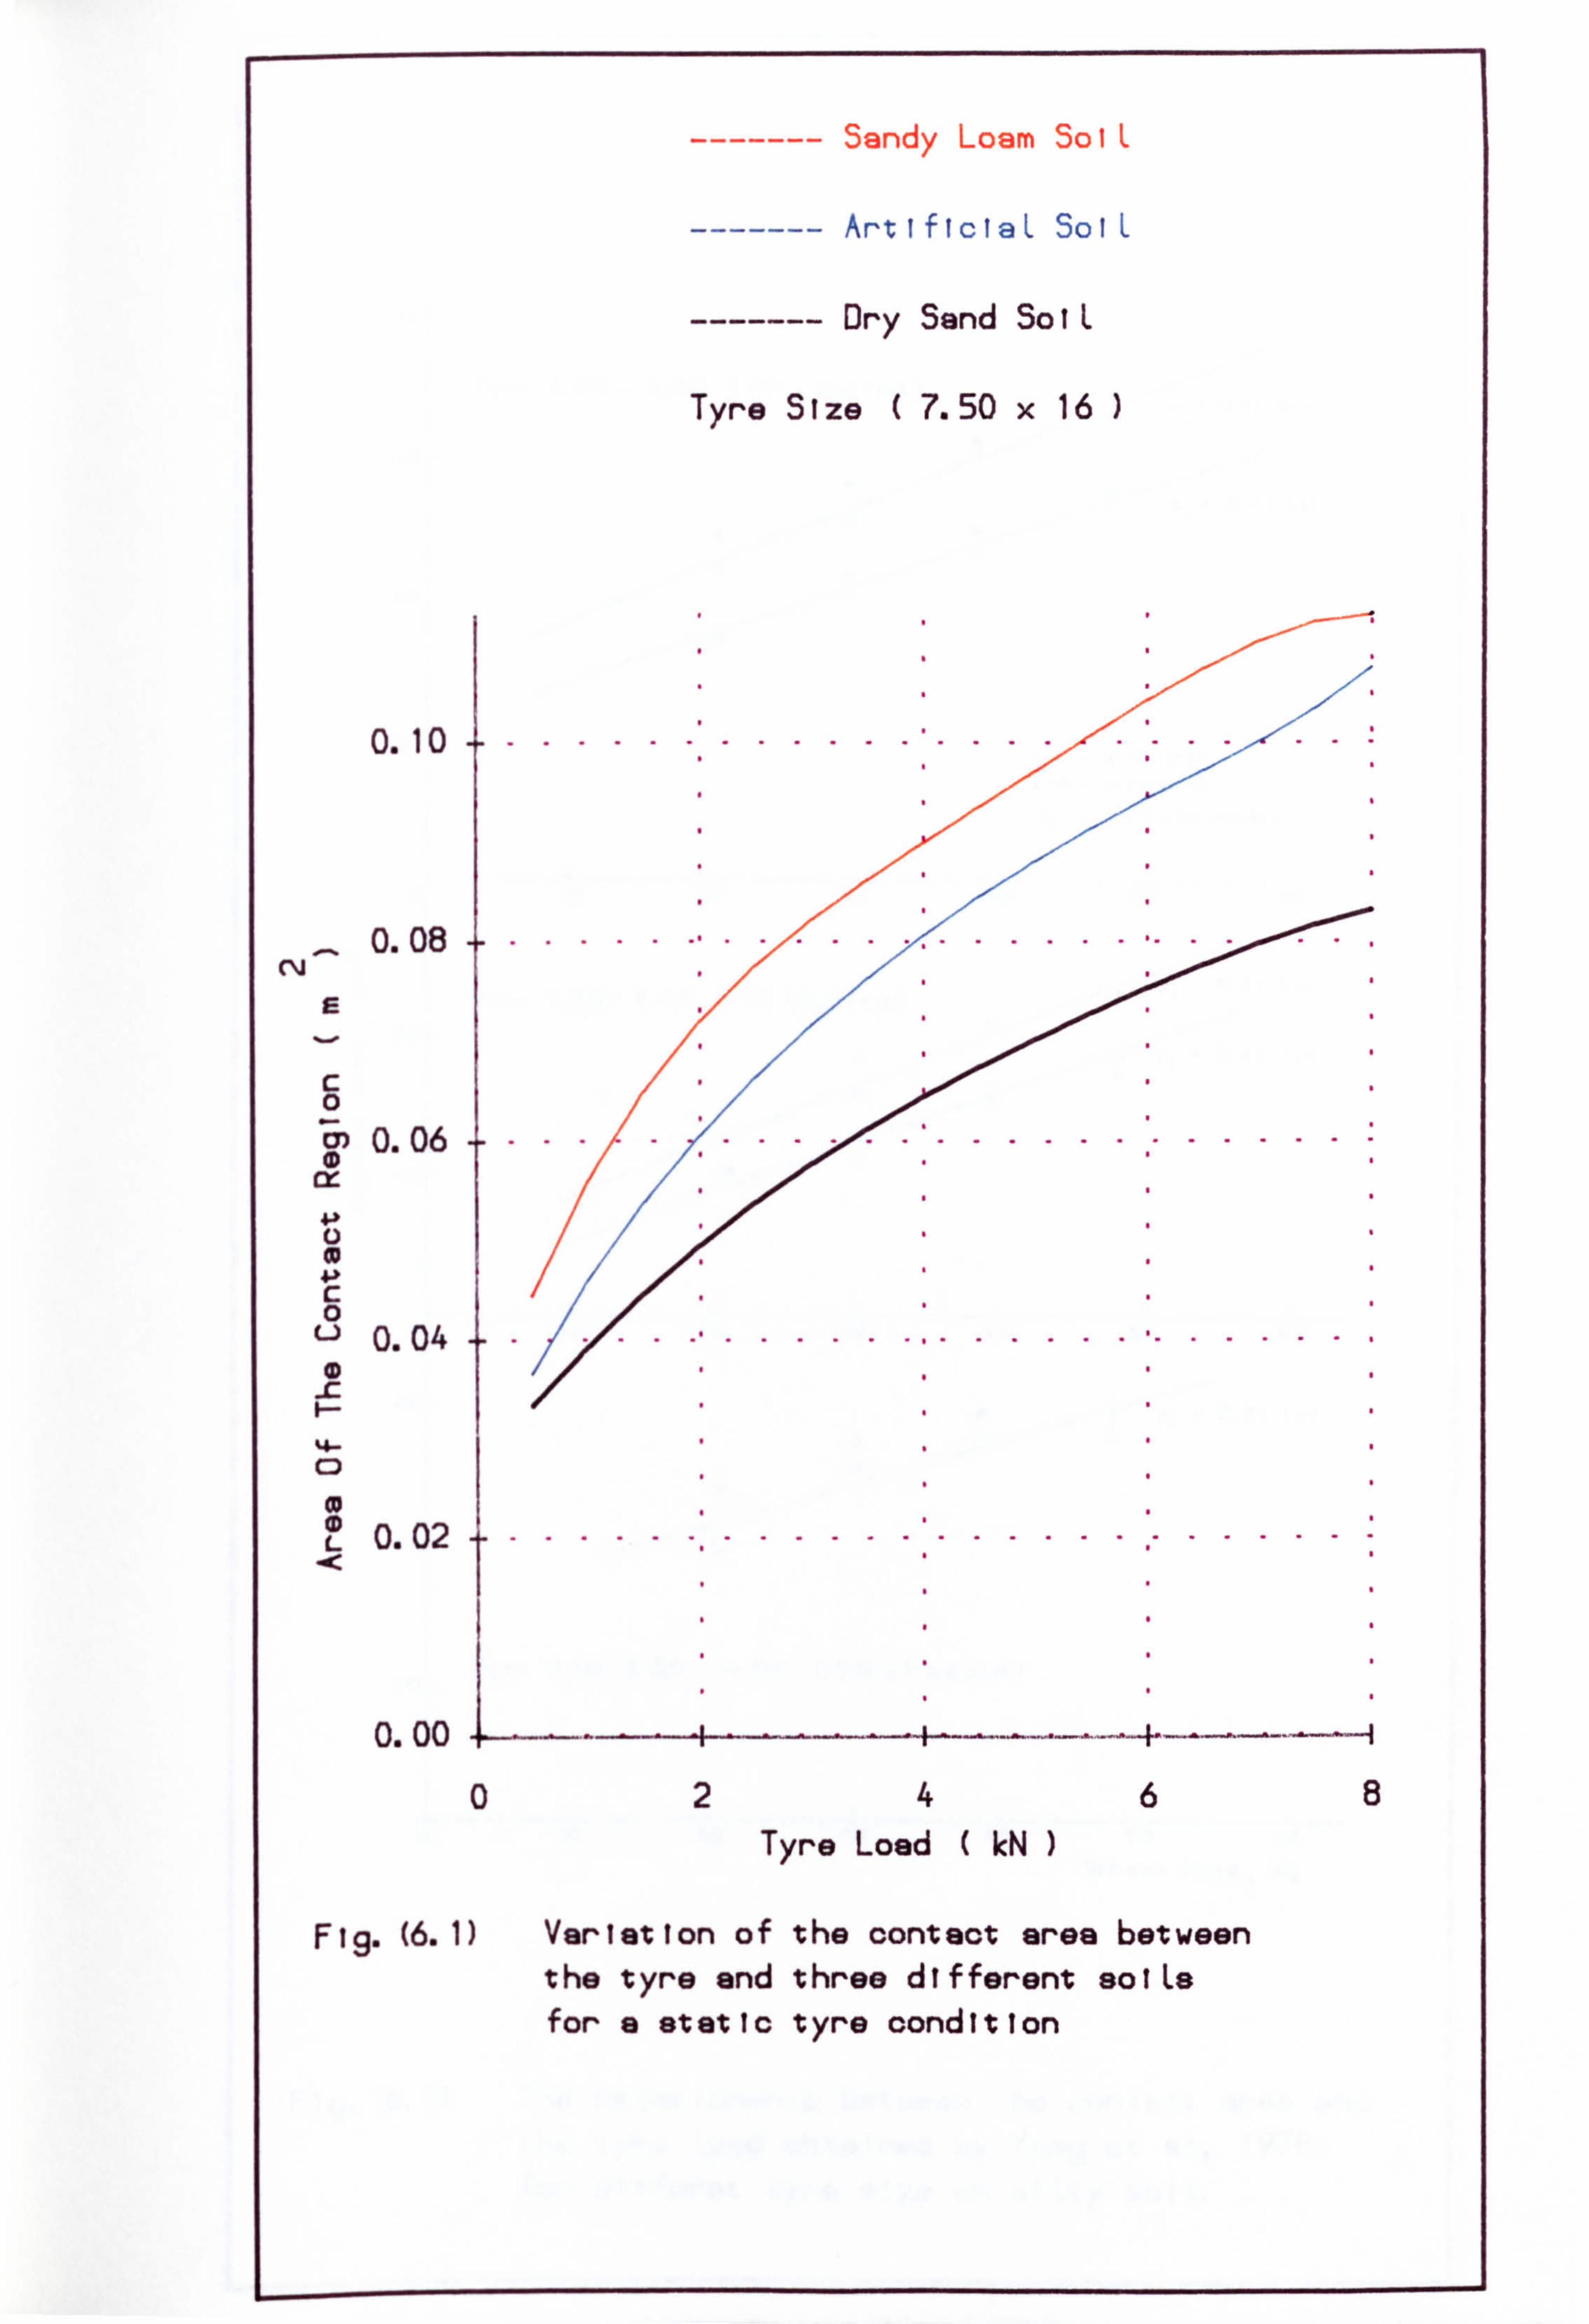
------- Sandy Loam SoIL
------- ArtifIcIaL SoIL
------- Dry Send SoIL
Tyre Size ( 7.50 x 16
0.10 .......... ....... ...
0.08 ......... ........ ....... .. E
C 0
0.06 .................. Cr_
C 0
X
U 0.04 ..... ....... ....
4- C)
L 0.02 ....... ..................
0.00
02468 Tyre Load ( kN
Fig. (6.1) Variation of the contact area between the tyre and three different solLs for a static tyre condition
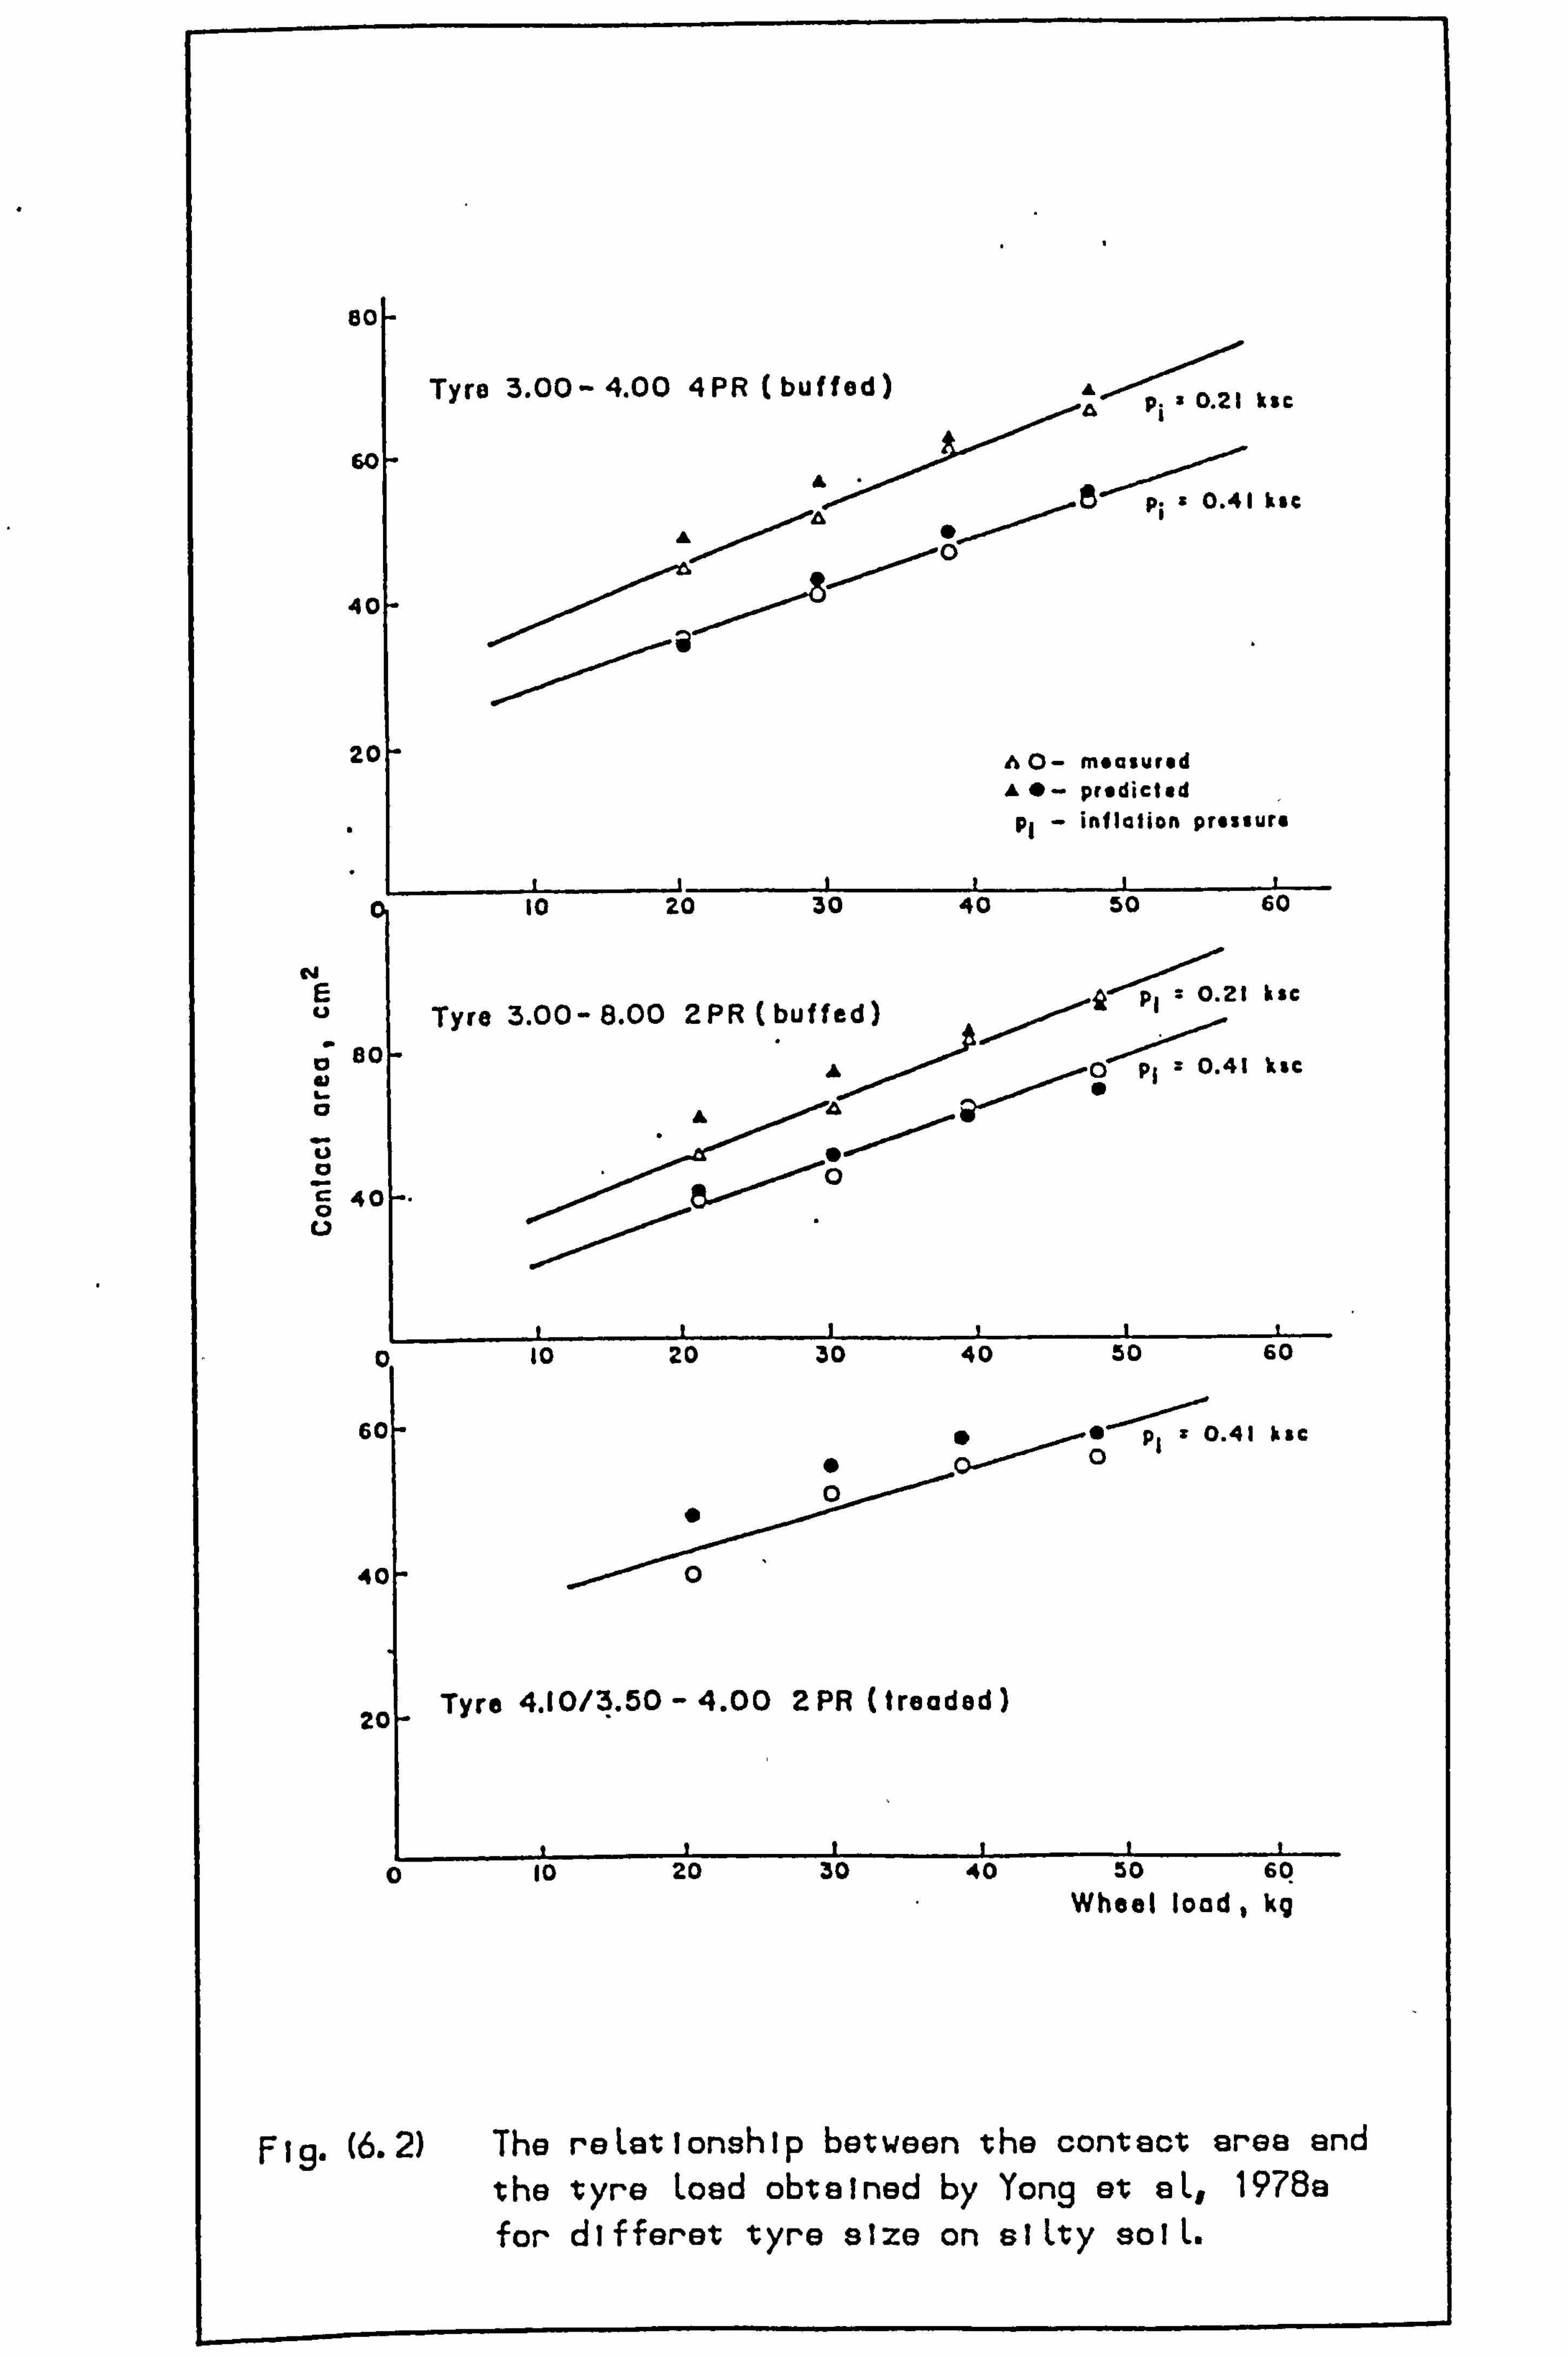
so
Tyre 3.00 - 4.00 4 PR bu f fed) AL 0.21 ksc
01 ILIC A
0
40-
20- A 0- measured A *- predicted
Pi - inflation pressure
10 z6 30 4LO 50 60
E i'ý'; - 0.21 ksc Tyre 3.00-8.00 2PR (buffed)
80- A0p, 0.41 ksc 0
0A
0
40
10 20 30 40 50 60
60- 0.41 kic 0
0
4or -,
ýo
24 Tyre 4.10/3.50 - 4.00 2 PR (treaded)
10 20 40 50 6p Wheal load , kg
Fig. (6.2) The reLationship between the contact area end the tyro Load obtained by Yong at eL, 1978a for differet tyre size on slLty solL.
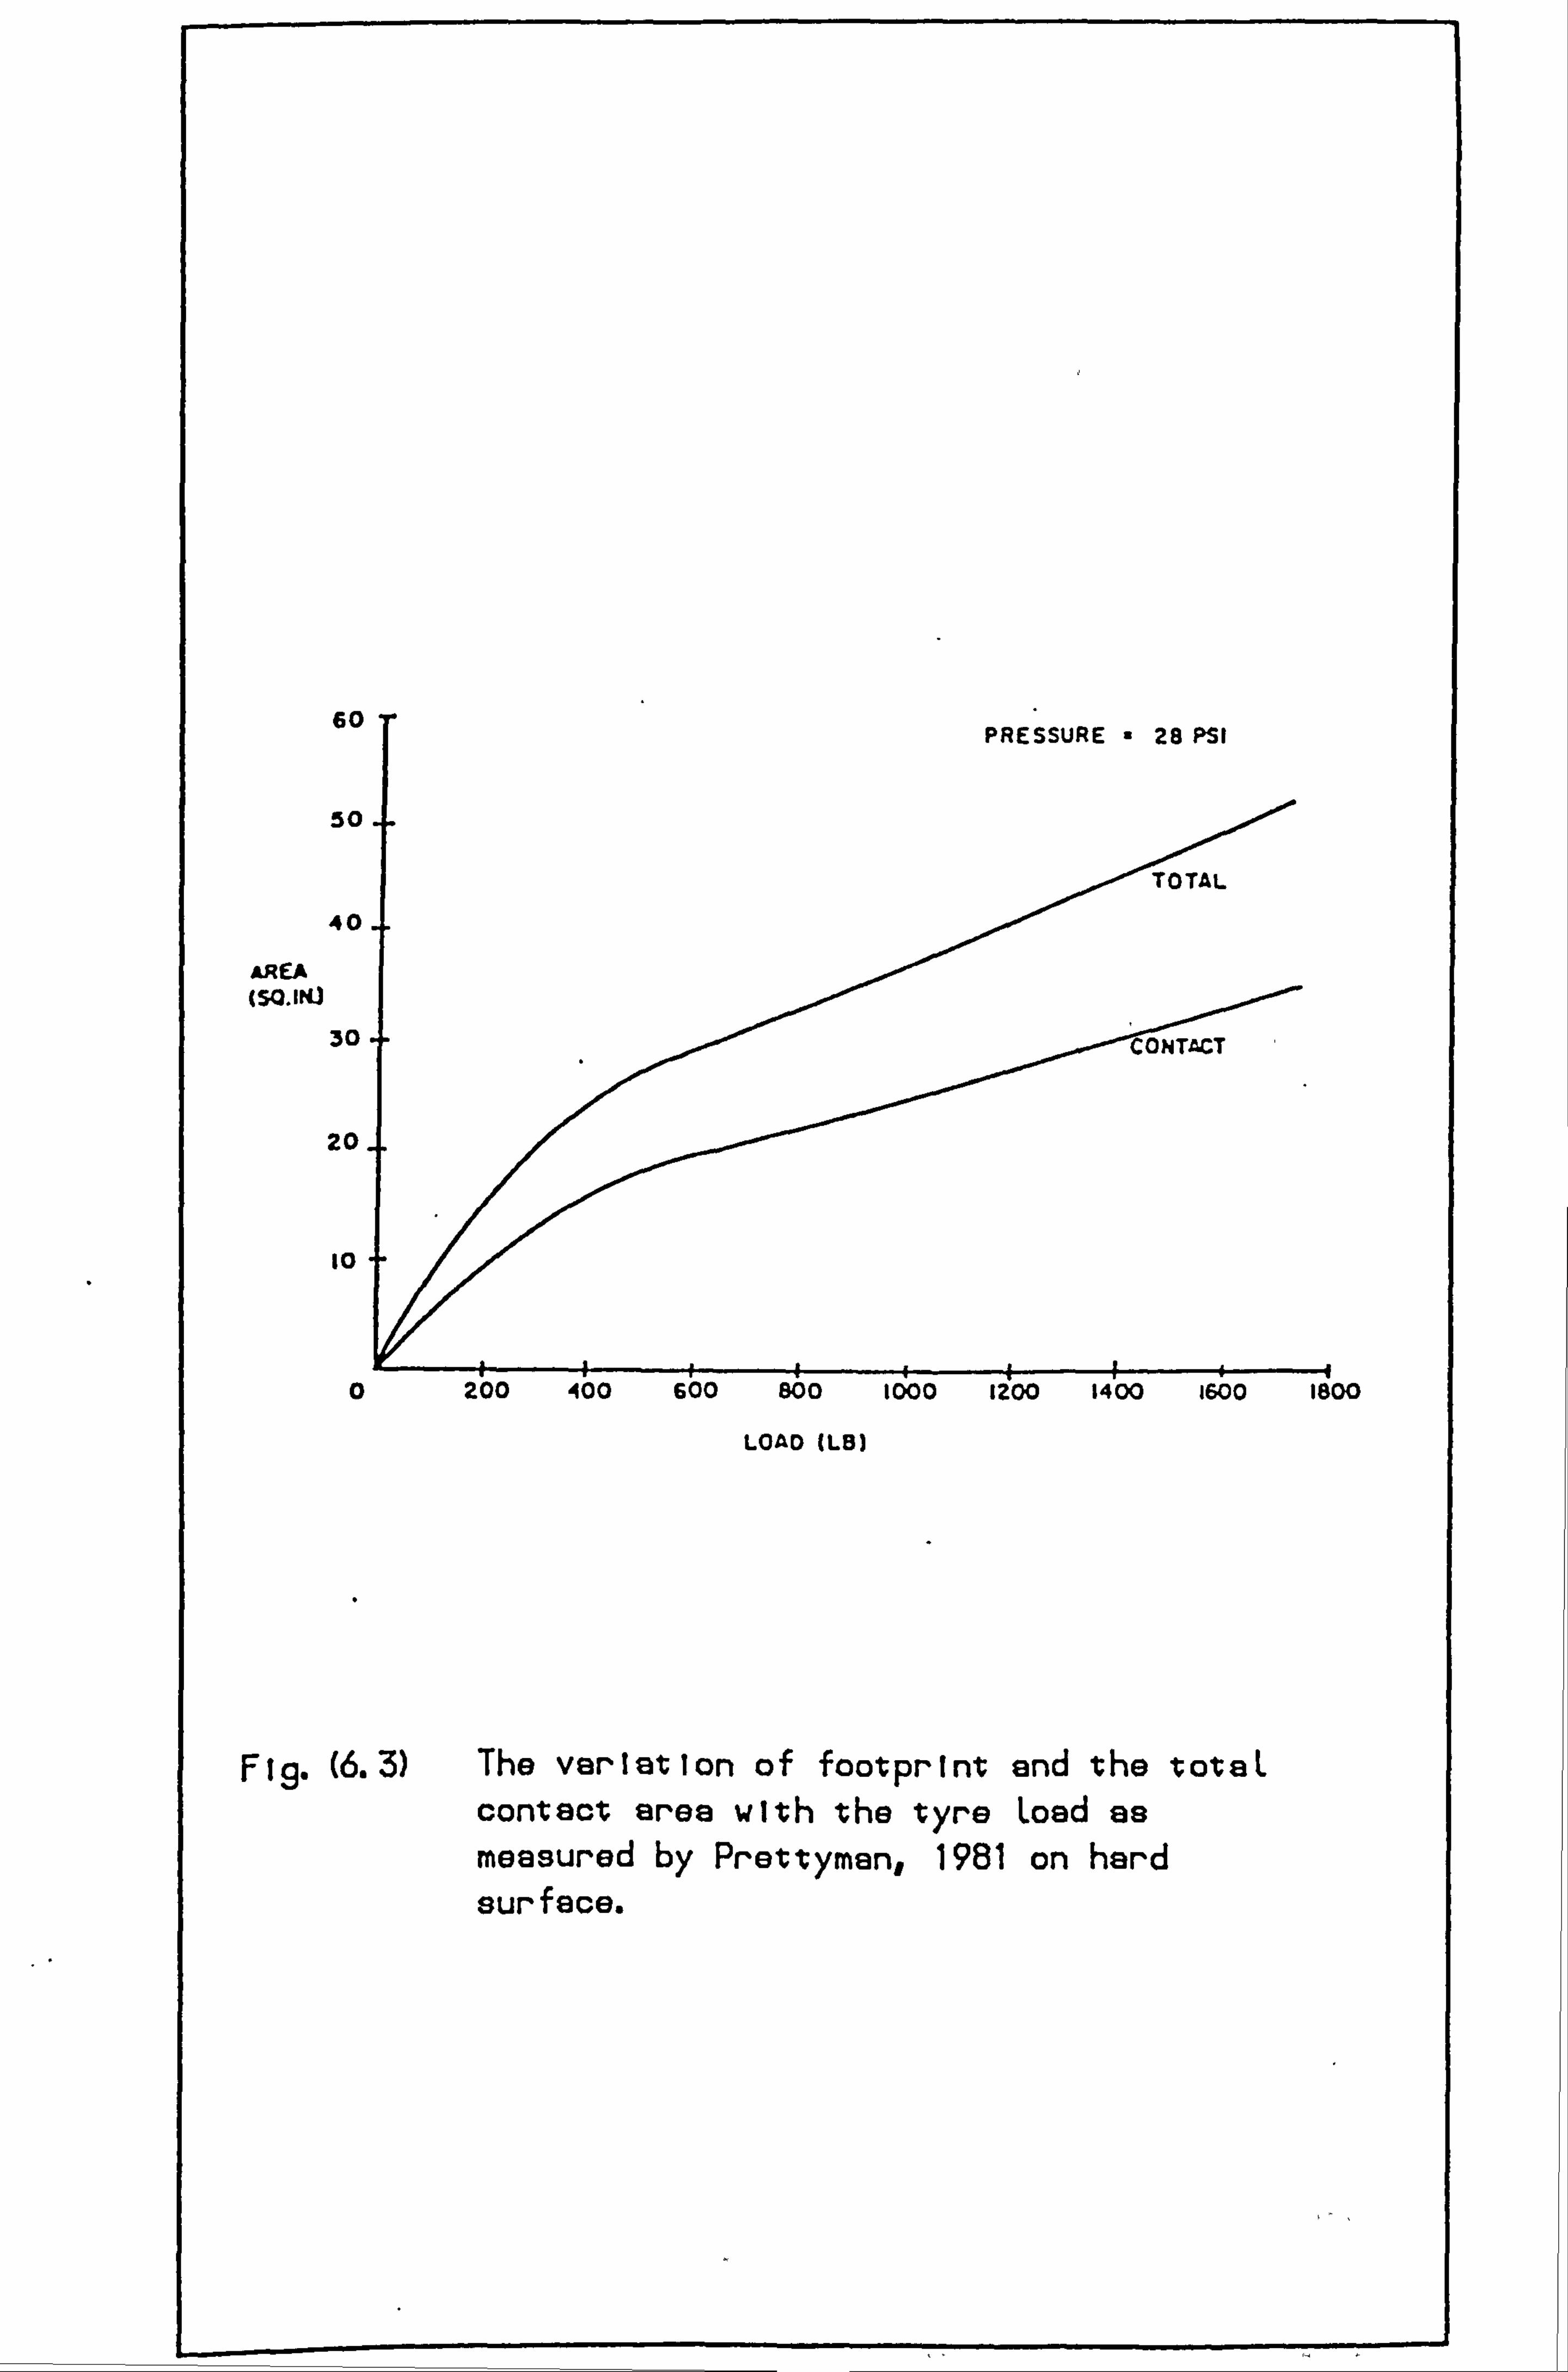
60
50
40
AREA (SQ. IK)
30
20
10
0
LOAD (LB)
Fig-(6.3) The variation of footprint and the votaL contact area with the tyre Load as measured by Prettyman, 1981 on hard surface.
W
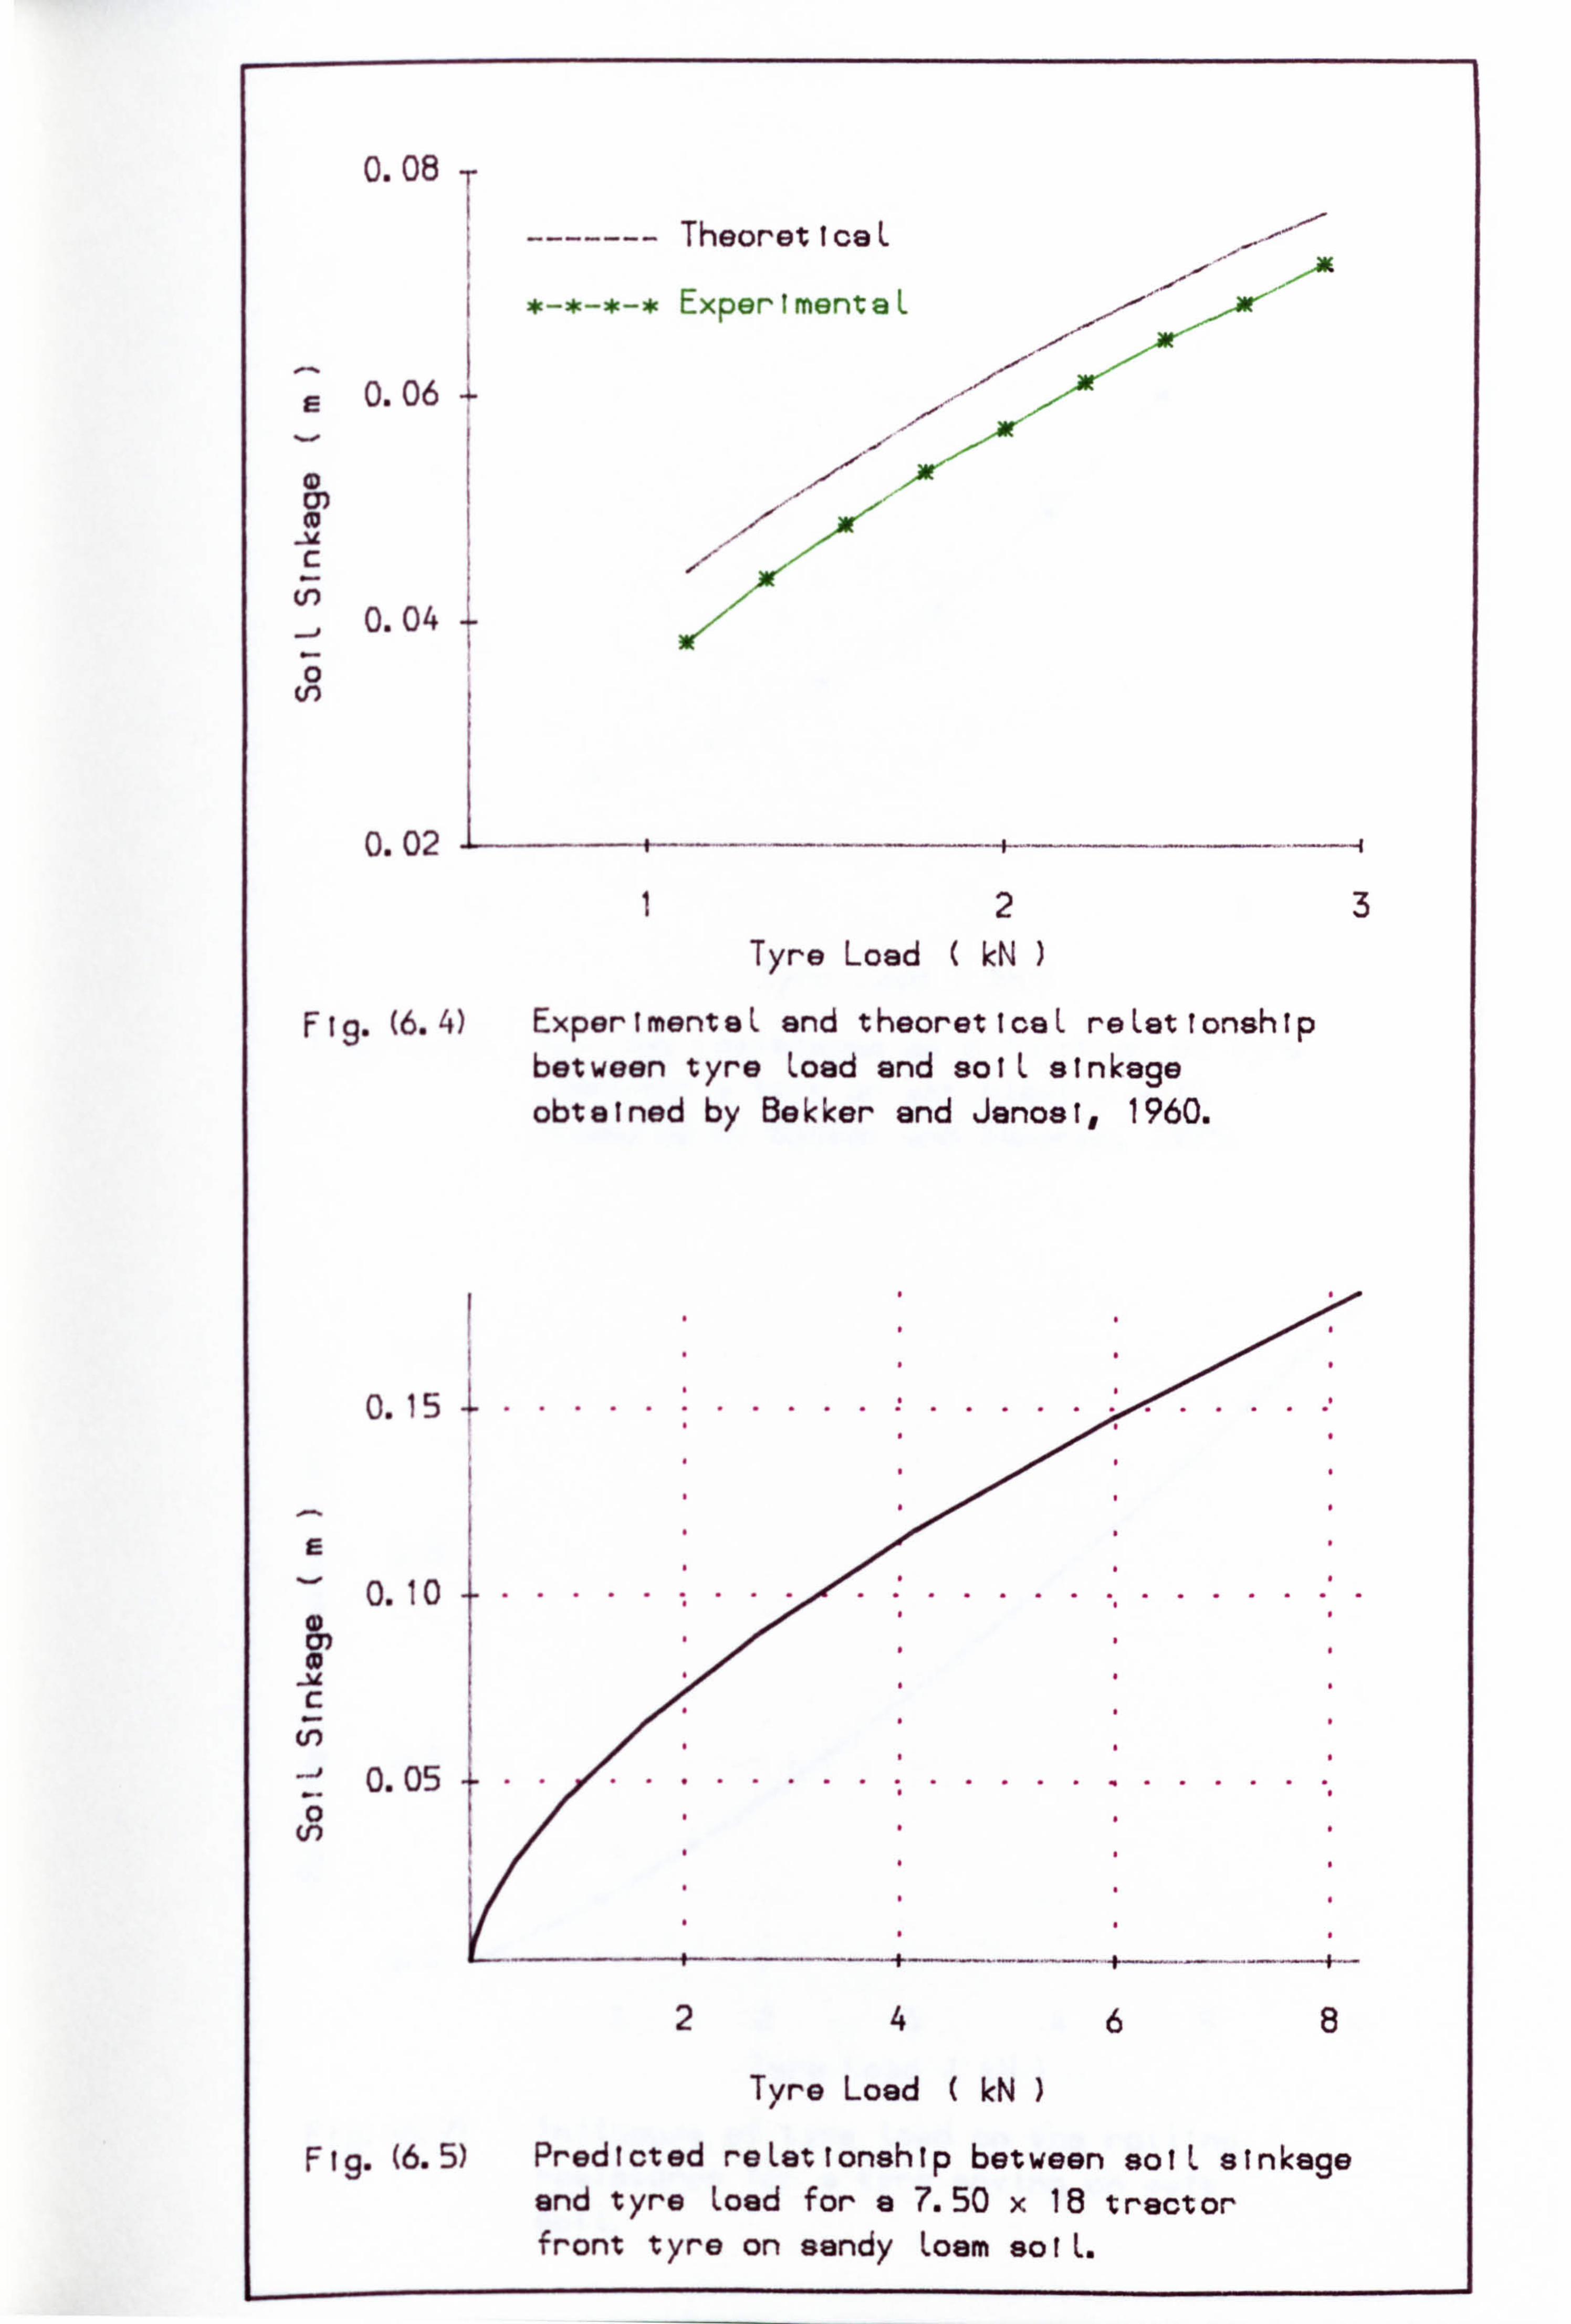
F
CD _u c
0.08 T
------- TheoreticaL
i Expertmenta
0.06
0.04
0.02
2 Tyre Load ( kN
Fig. (6.4) ExpertmenteL and theoreticaL reLatlonship between tyre Load and solL sinkage obtained by Bakker and Jenosi, 1960.
0.15 -
CD cr) 0
C
C! )
0 C! )
0.10 -
0.05 -
3
Tyre Load (M)
Fig. (6.5) Predicted reLationship between soiL sinkage and tyre Load for a 7.50 x IS tractor front tyre on sandy Losm solL.
2468
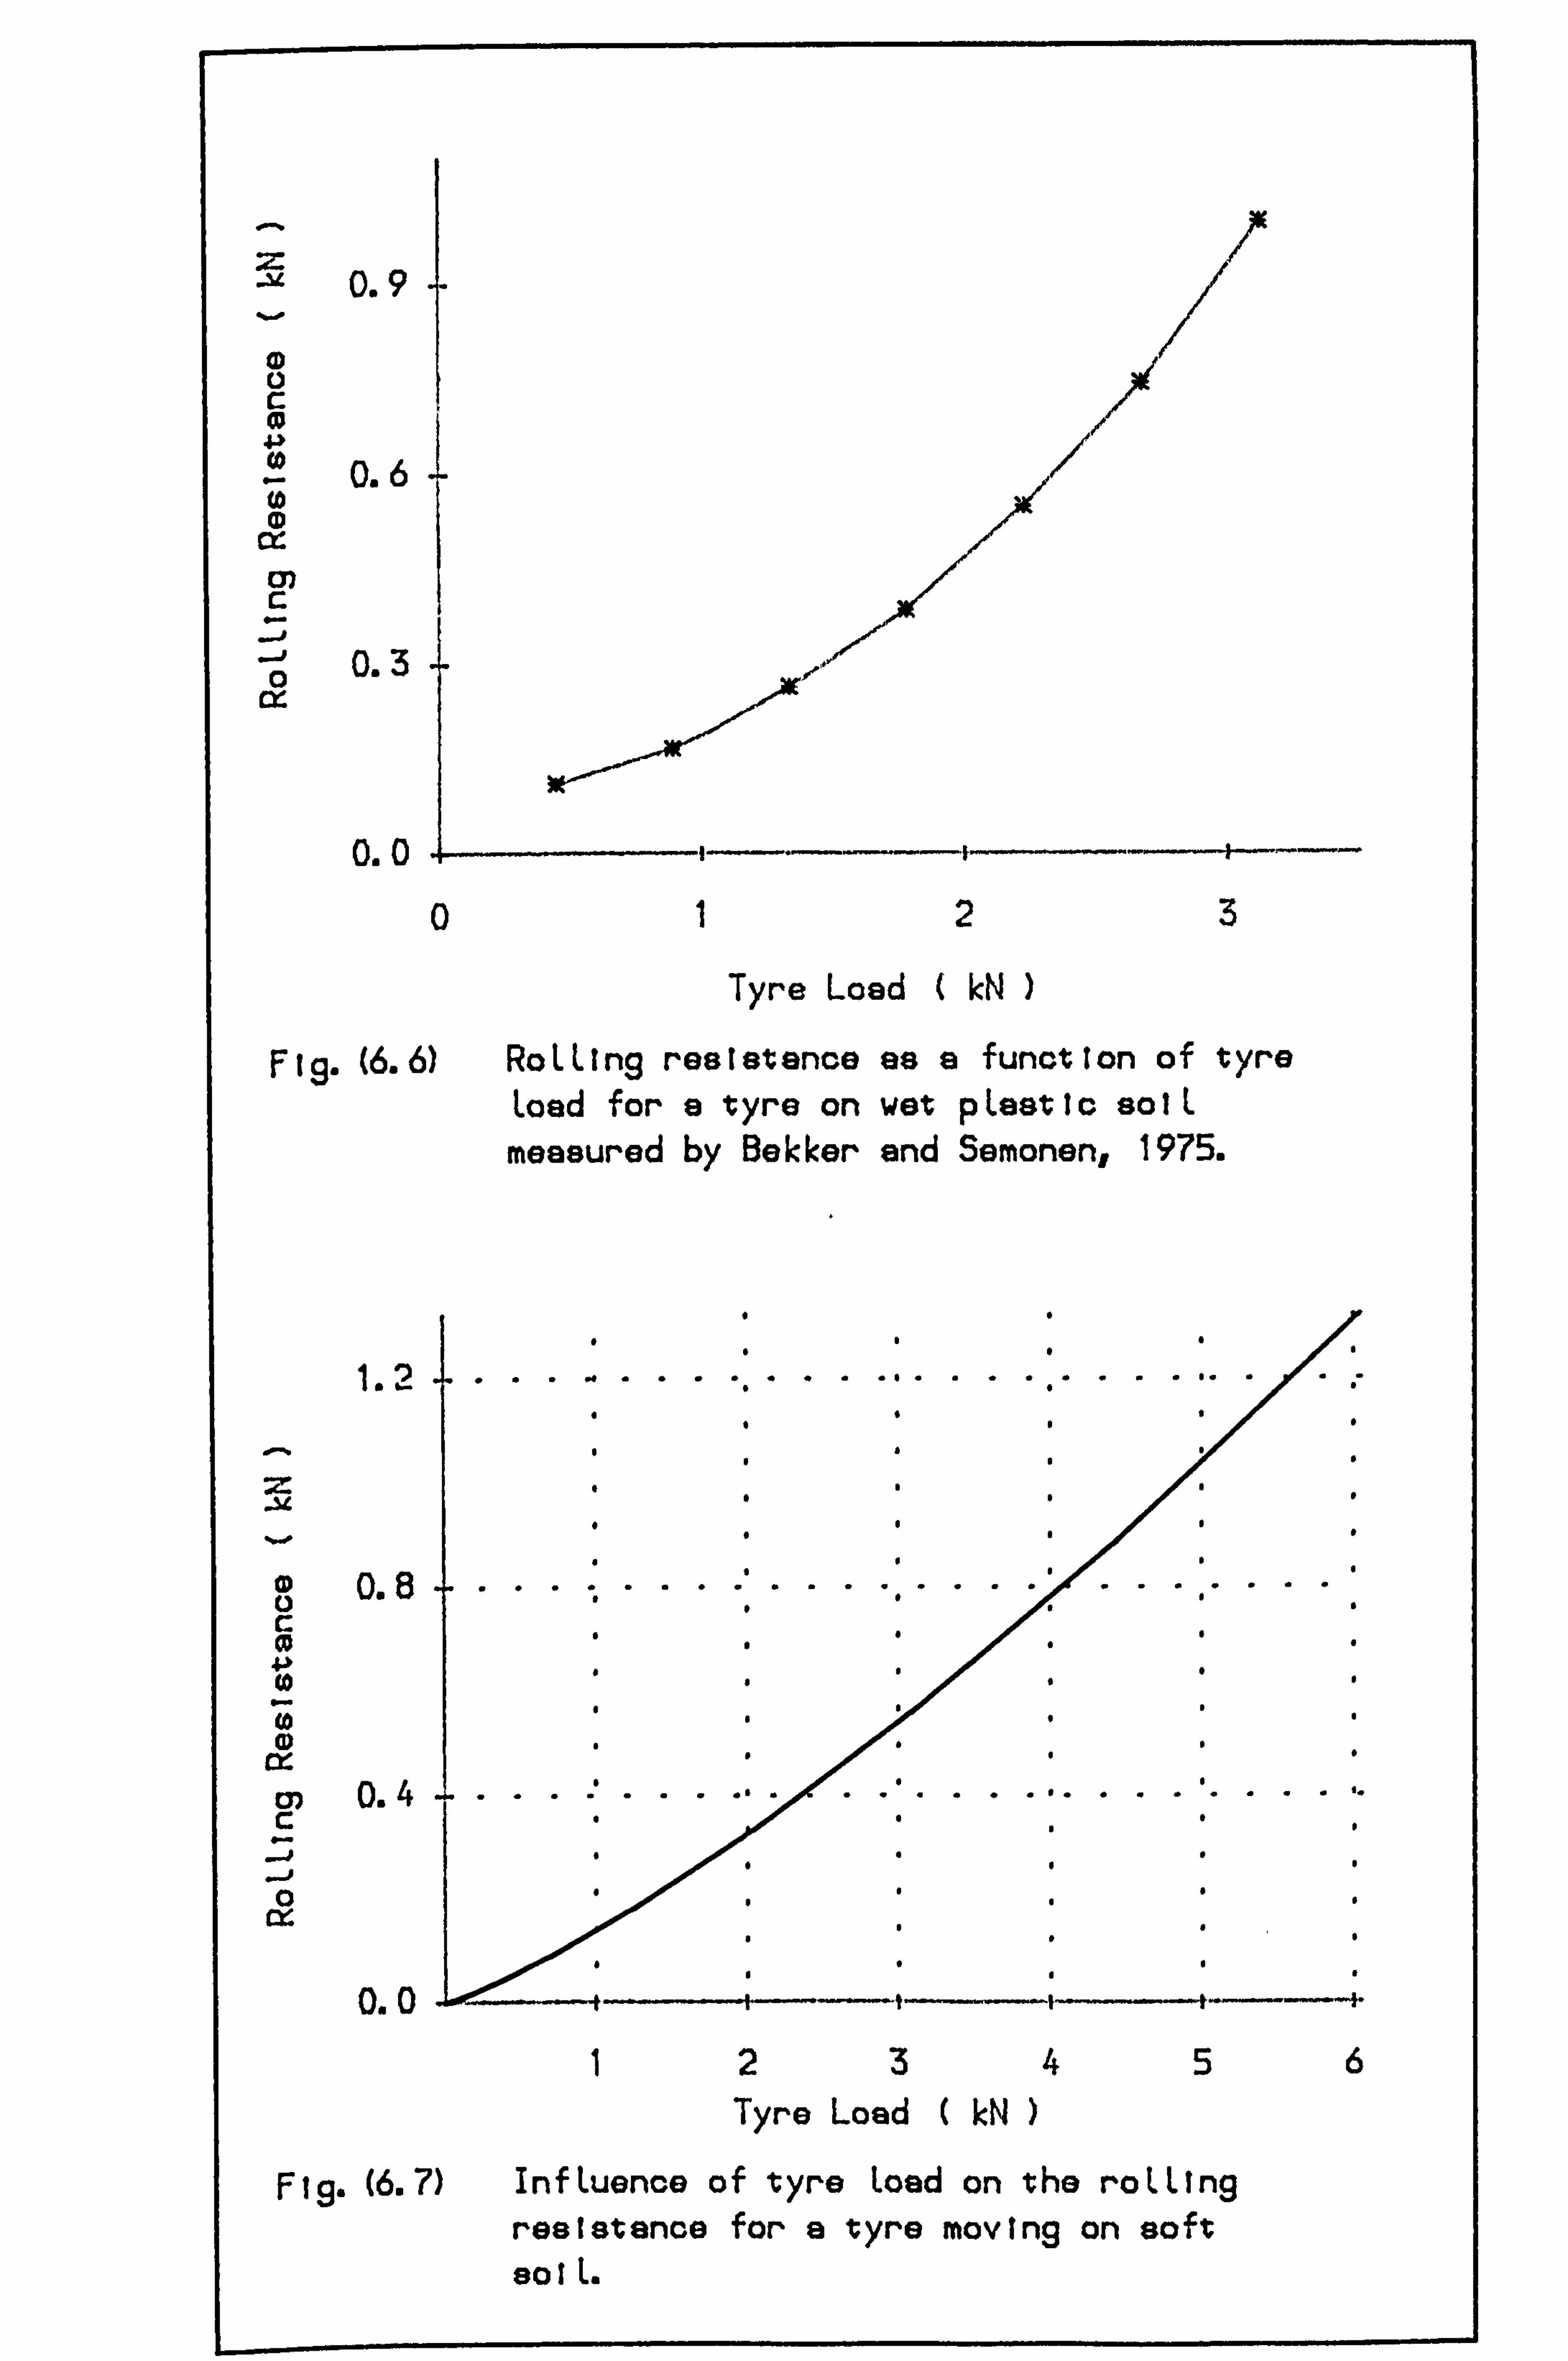
0.9
CD 0 C
0.6
CC
0.3 0
0.0 t. i
023
Tyre Load ( kN
Fl. g. (6.6) RoLLIng resistance as a function of tyre Load for a tyre on wet pLeatic solL measured by Bakker and Semonen, 1975.
1.2
CD 0.8 ................ .... ....... a C
4-31 to
(D
C" 0.4 ......, C
0 CY.
0.0 123456
Tyre Load kN )
Fig. (6.7) InfLuence of tyre Load on the roLLIng resistance for a tyre moving on soft sot L.
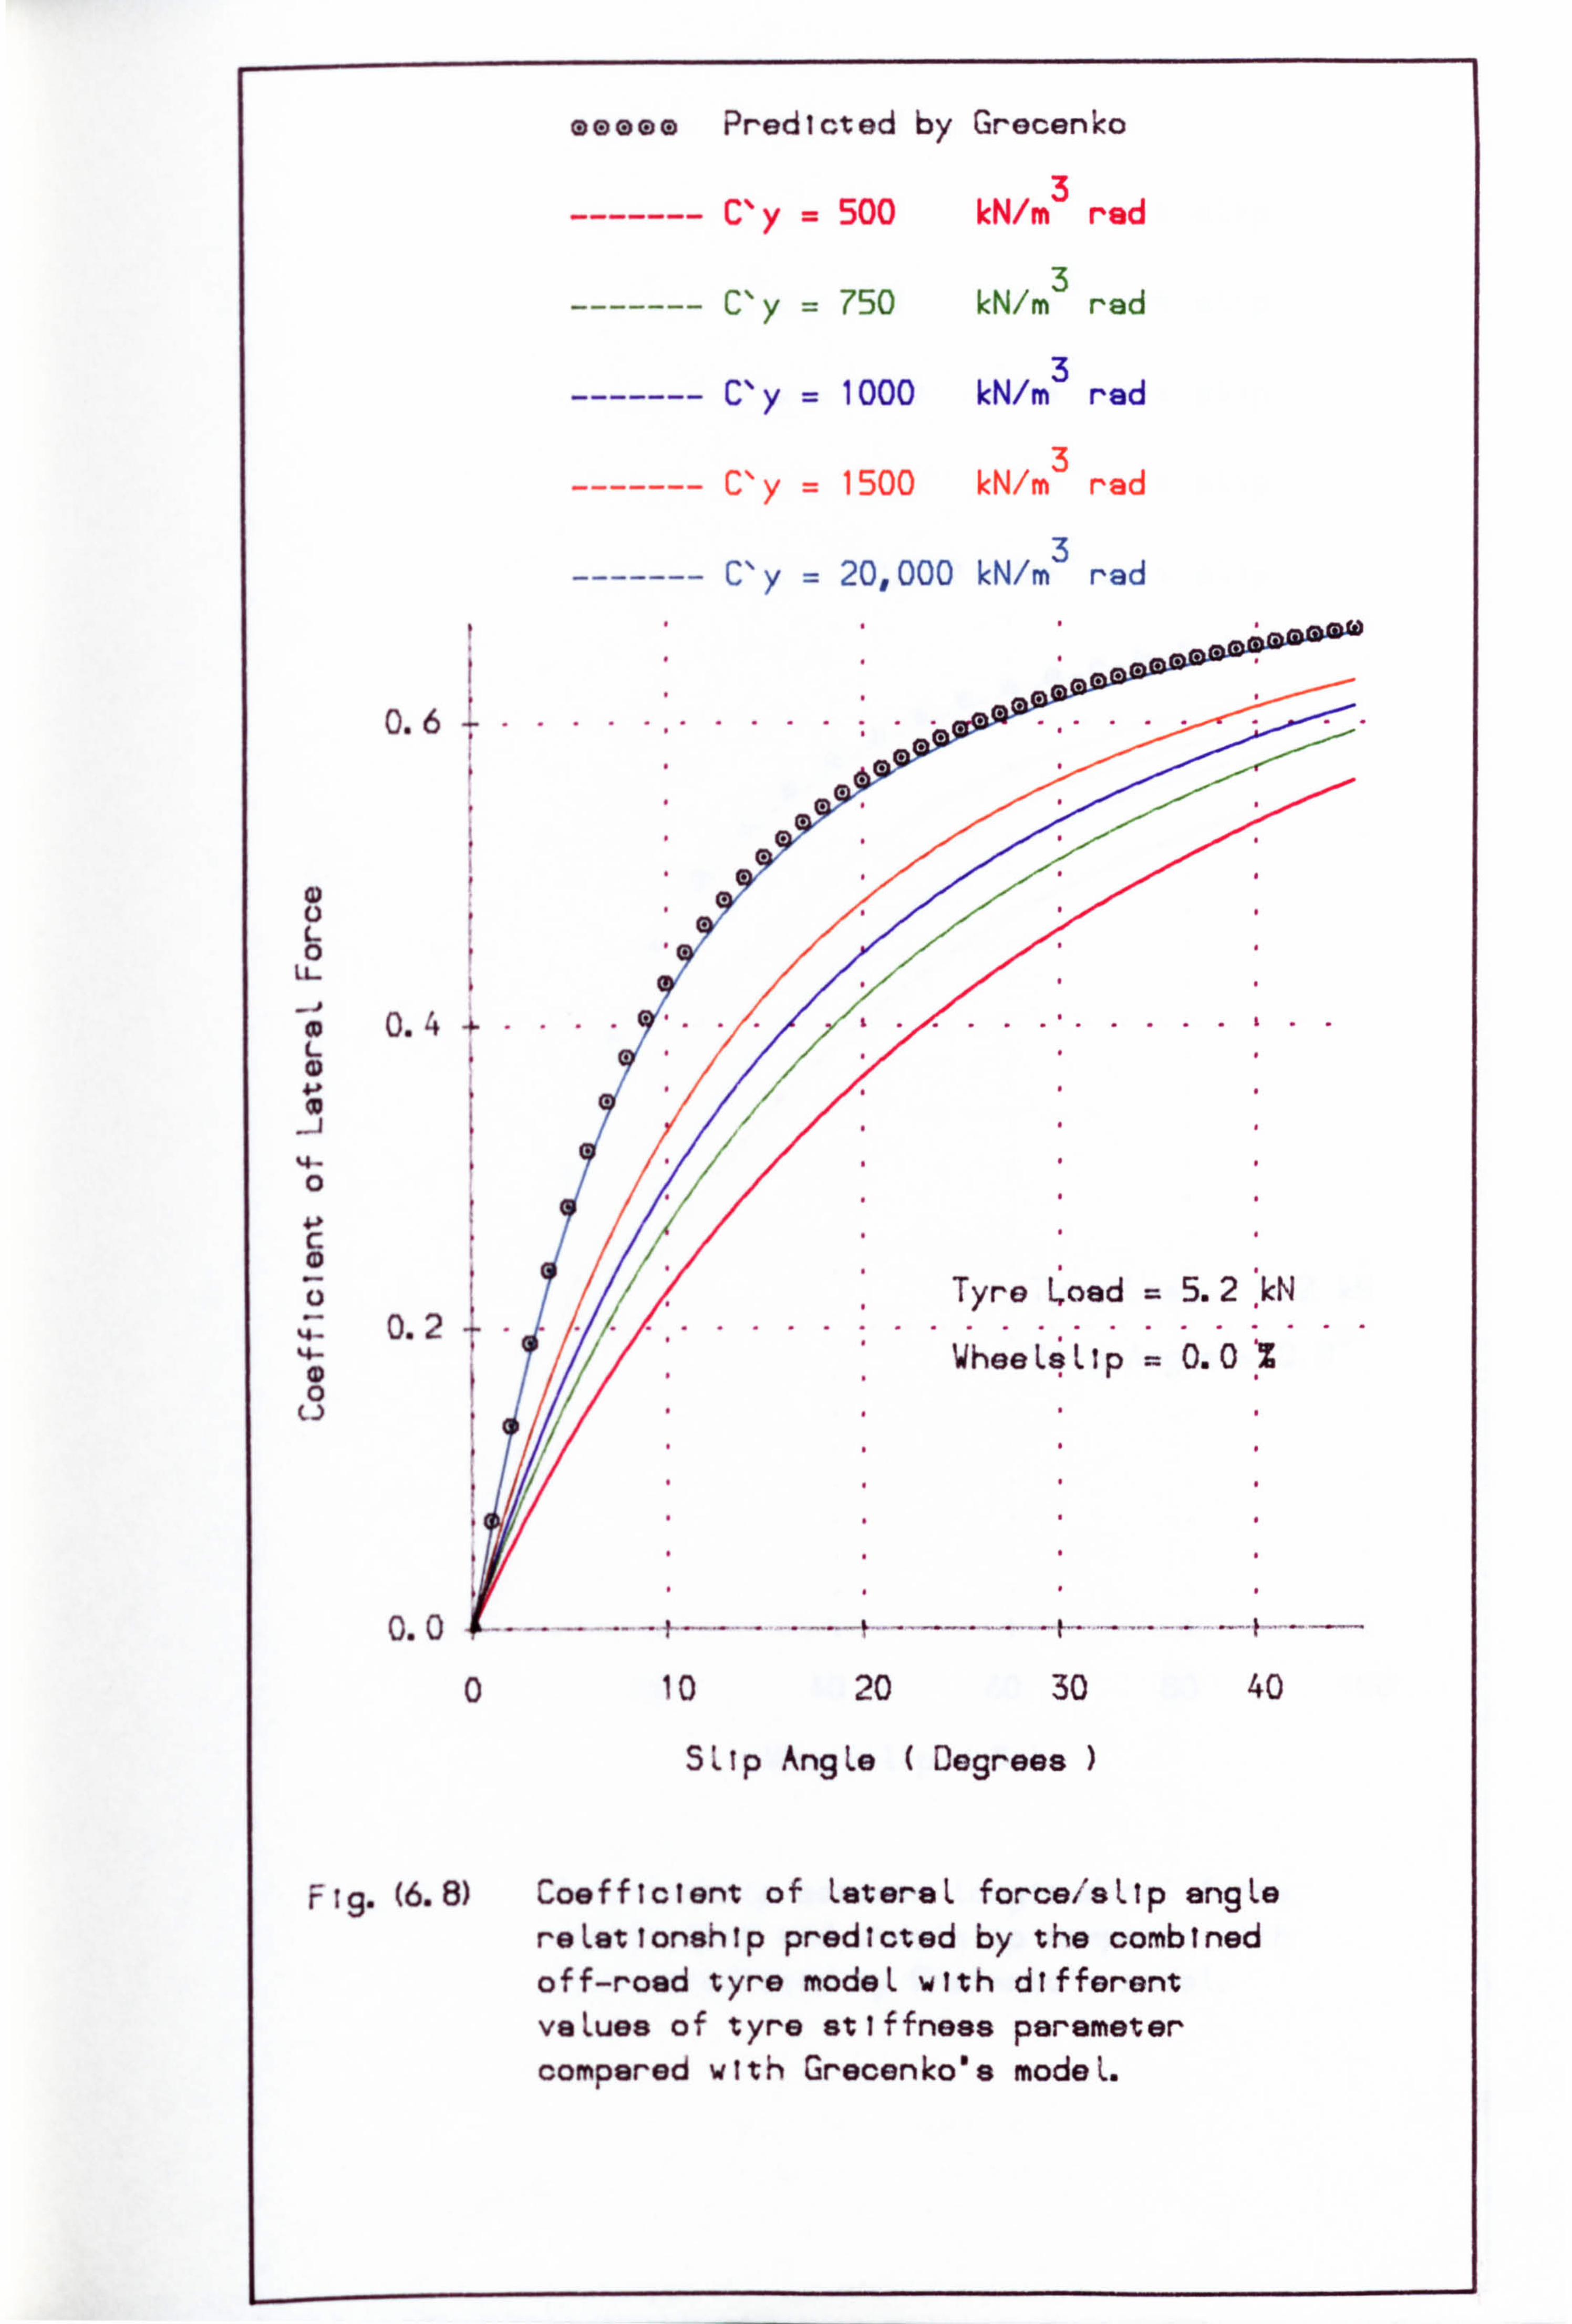
ooess Predicted by Grecenko
3 C' y= 500 kN/fn red
3 C' y= 750 kN/m rad
3 C, y = 1000 kN/m red
3 C' y = 1500 kN/m rad
3 C" Y = 20,000 kN/m rad
0.6 ,
0 0 L
0.4
4- 0
4-P
o. 2
0.0
S'ýTp AngLe ( Degrees )
F 19. (6.8) Coefficient of LatereL force/sLip angLe reLationship predicted by the combined off-road tyre modeL with different veLues of tyre stiffness parameter compared with Grecenko's modeL.
0 10 20 30 40
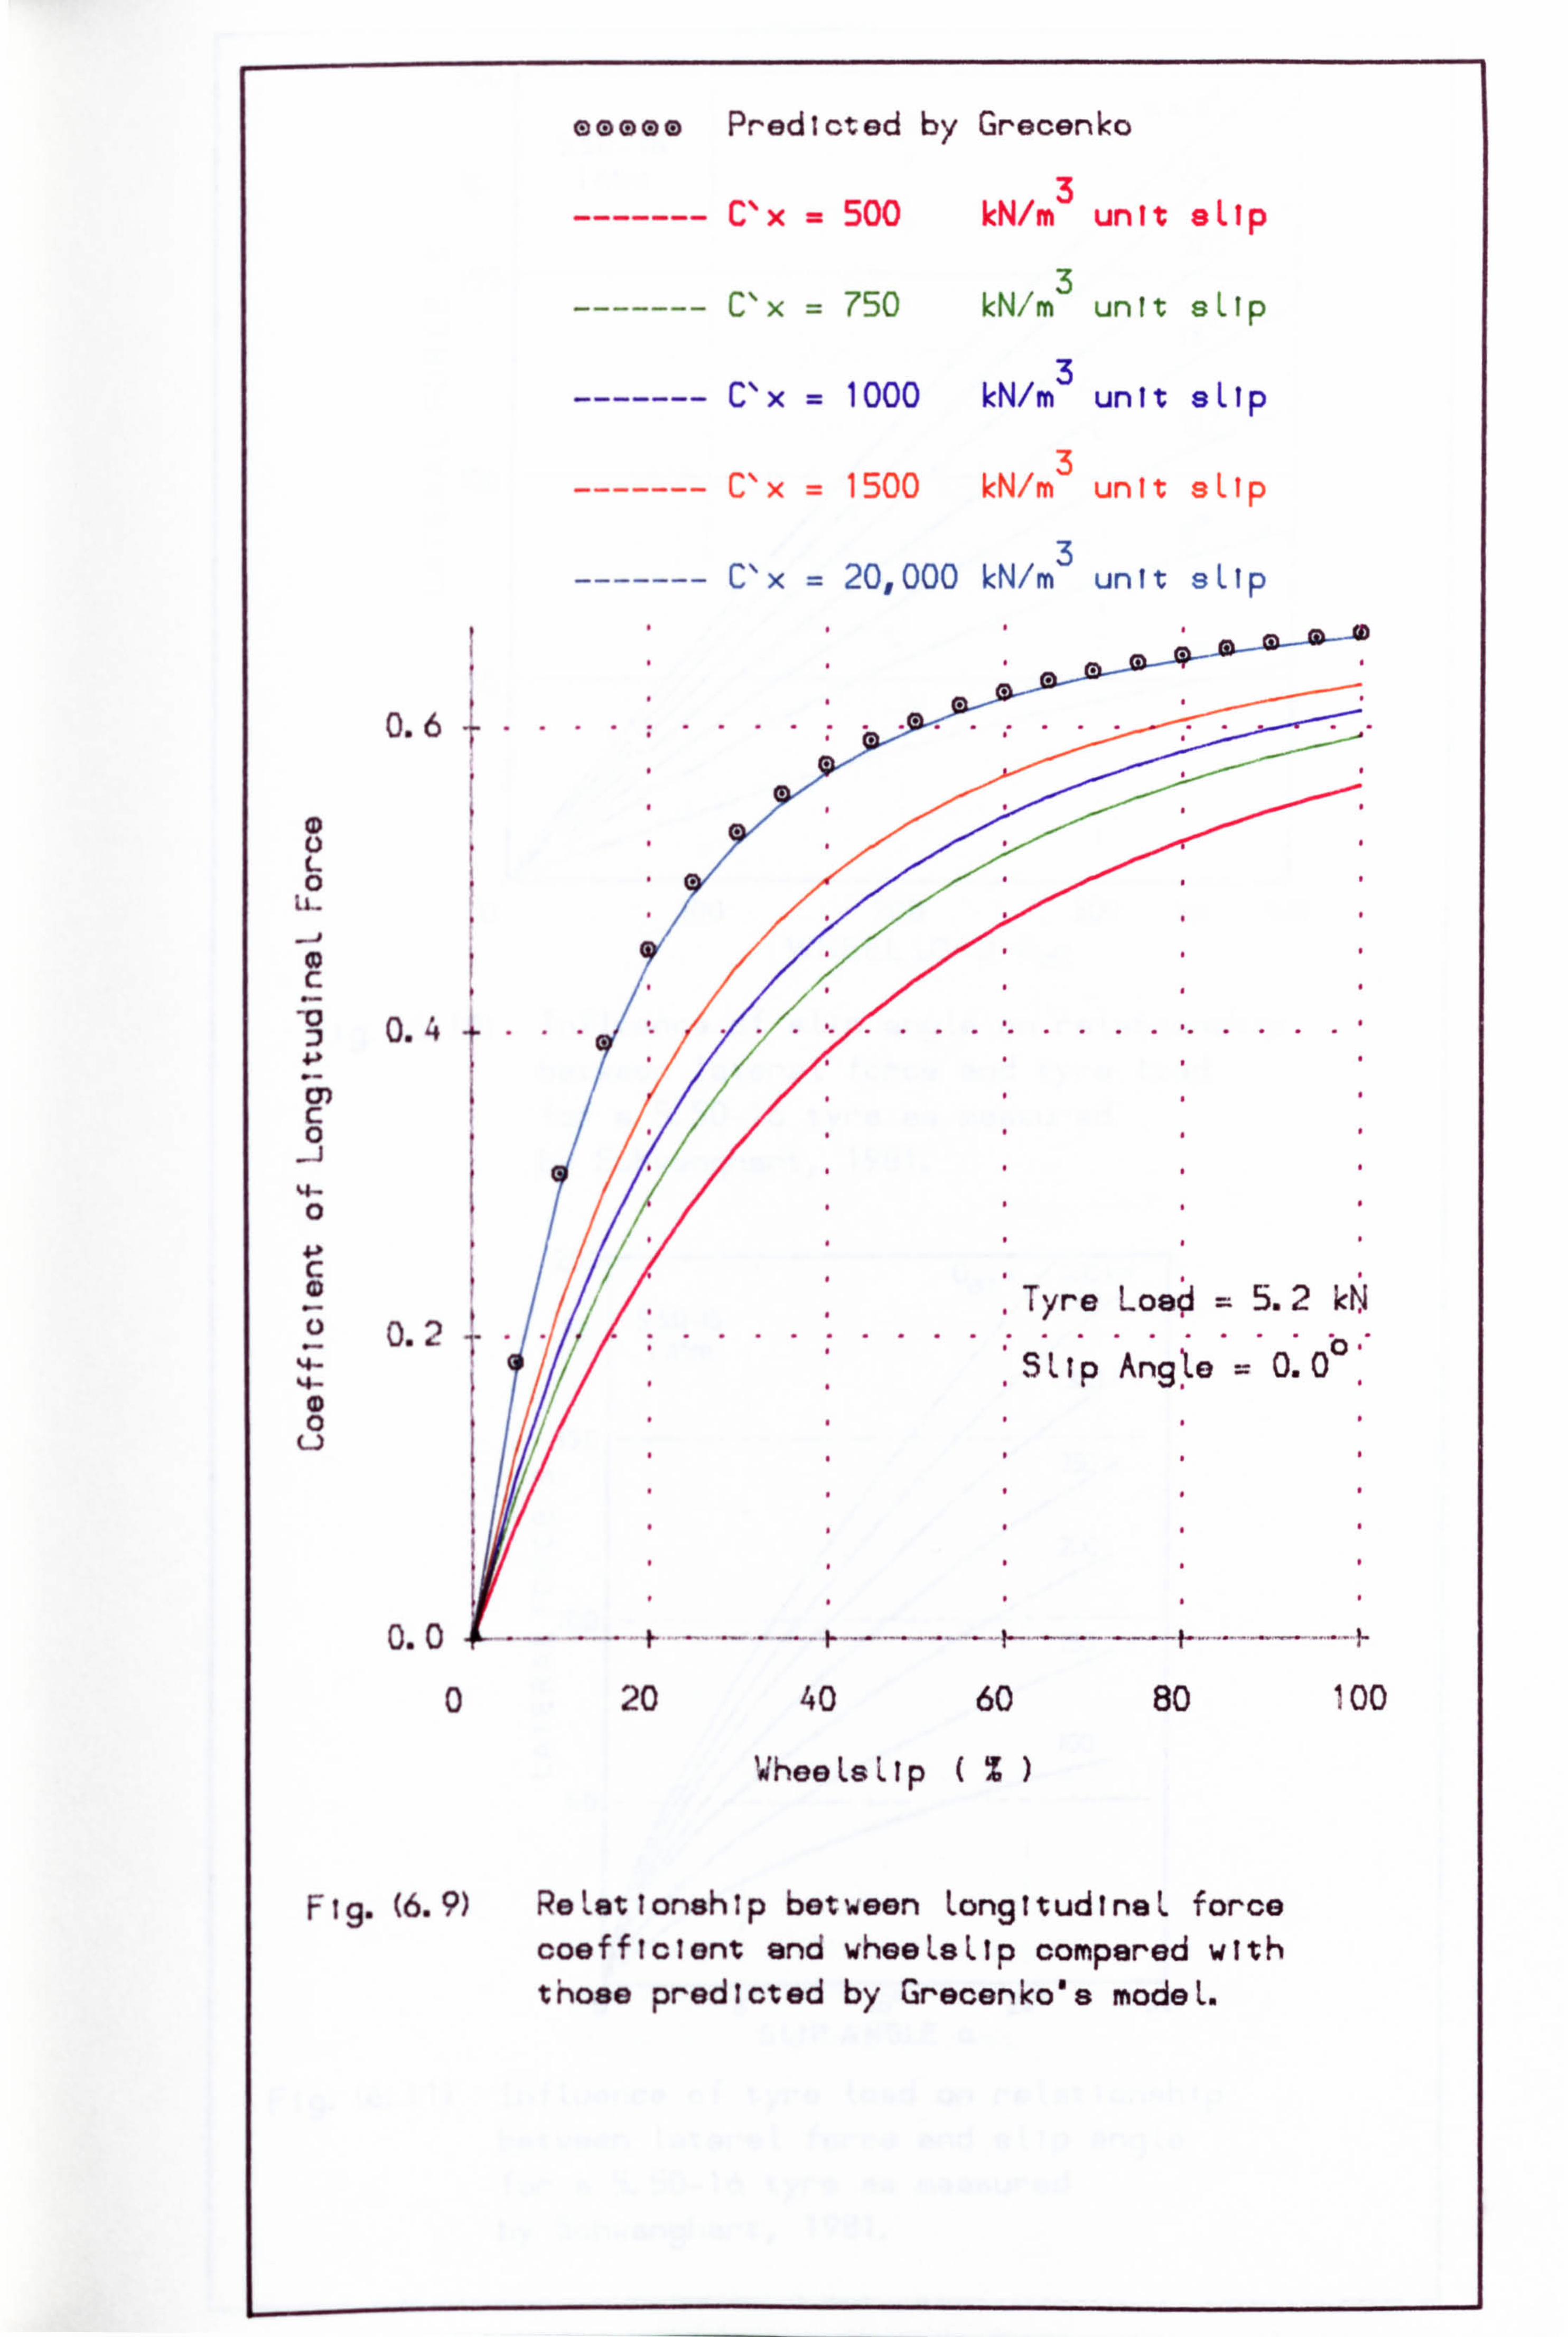
emoos Predicted by Grecenko
L 0
c
4A
Ci) c 0 0
4-P c
%4- 14-
4) 0
u
3 ------- Cx = 500 kN/m unit aLlp
3 ------- C'x = 750 kN/m unit sLip
3 ------- C'x = 1000 kN/m unit aLlp
3 ------- C'x = 1500 kN/m unit aLlp
3 ------- C'x = 20,000 kN/m unit sLip
0.6 ..............
0.4
0.2 i yre LoaýI = D. -' KN ,.............. SLp Ang 0. ýo = 0.0
.
0.0
0 20 40 60 80 i 00
WheeLsop (%
Fig. (6.9) ReLationship bet-ween LongttudineL force coefficient and wheeLsLip compared with those predicted by Grecenko's modeL.
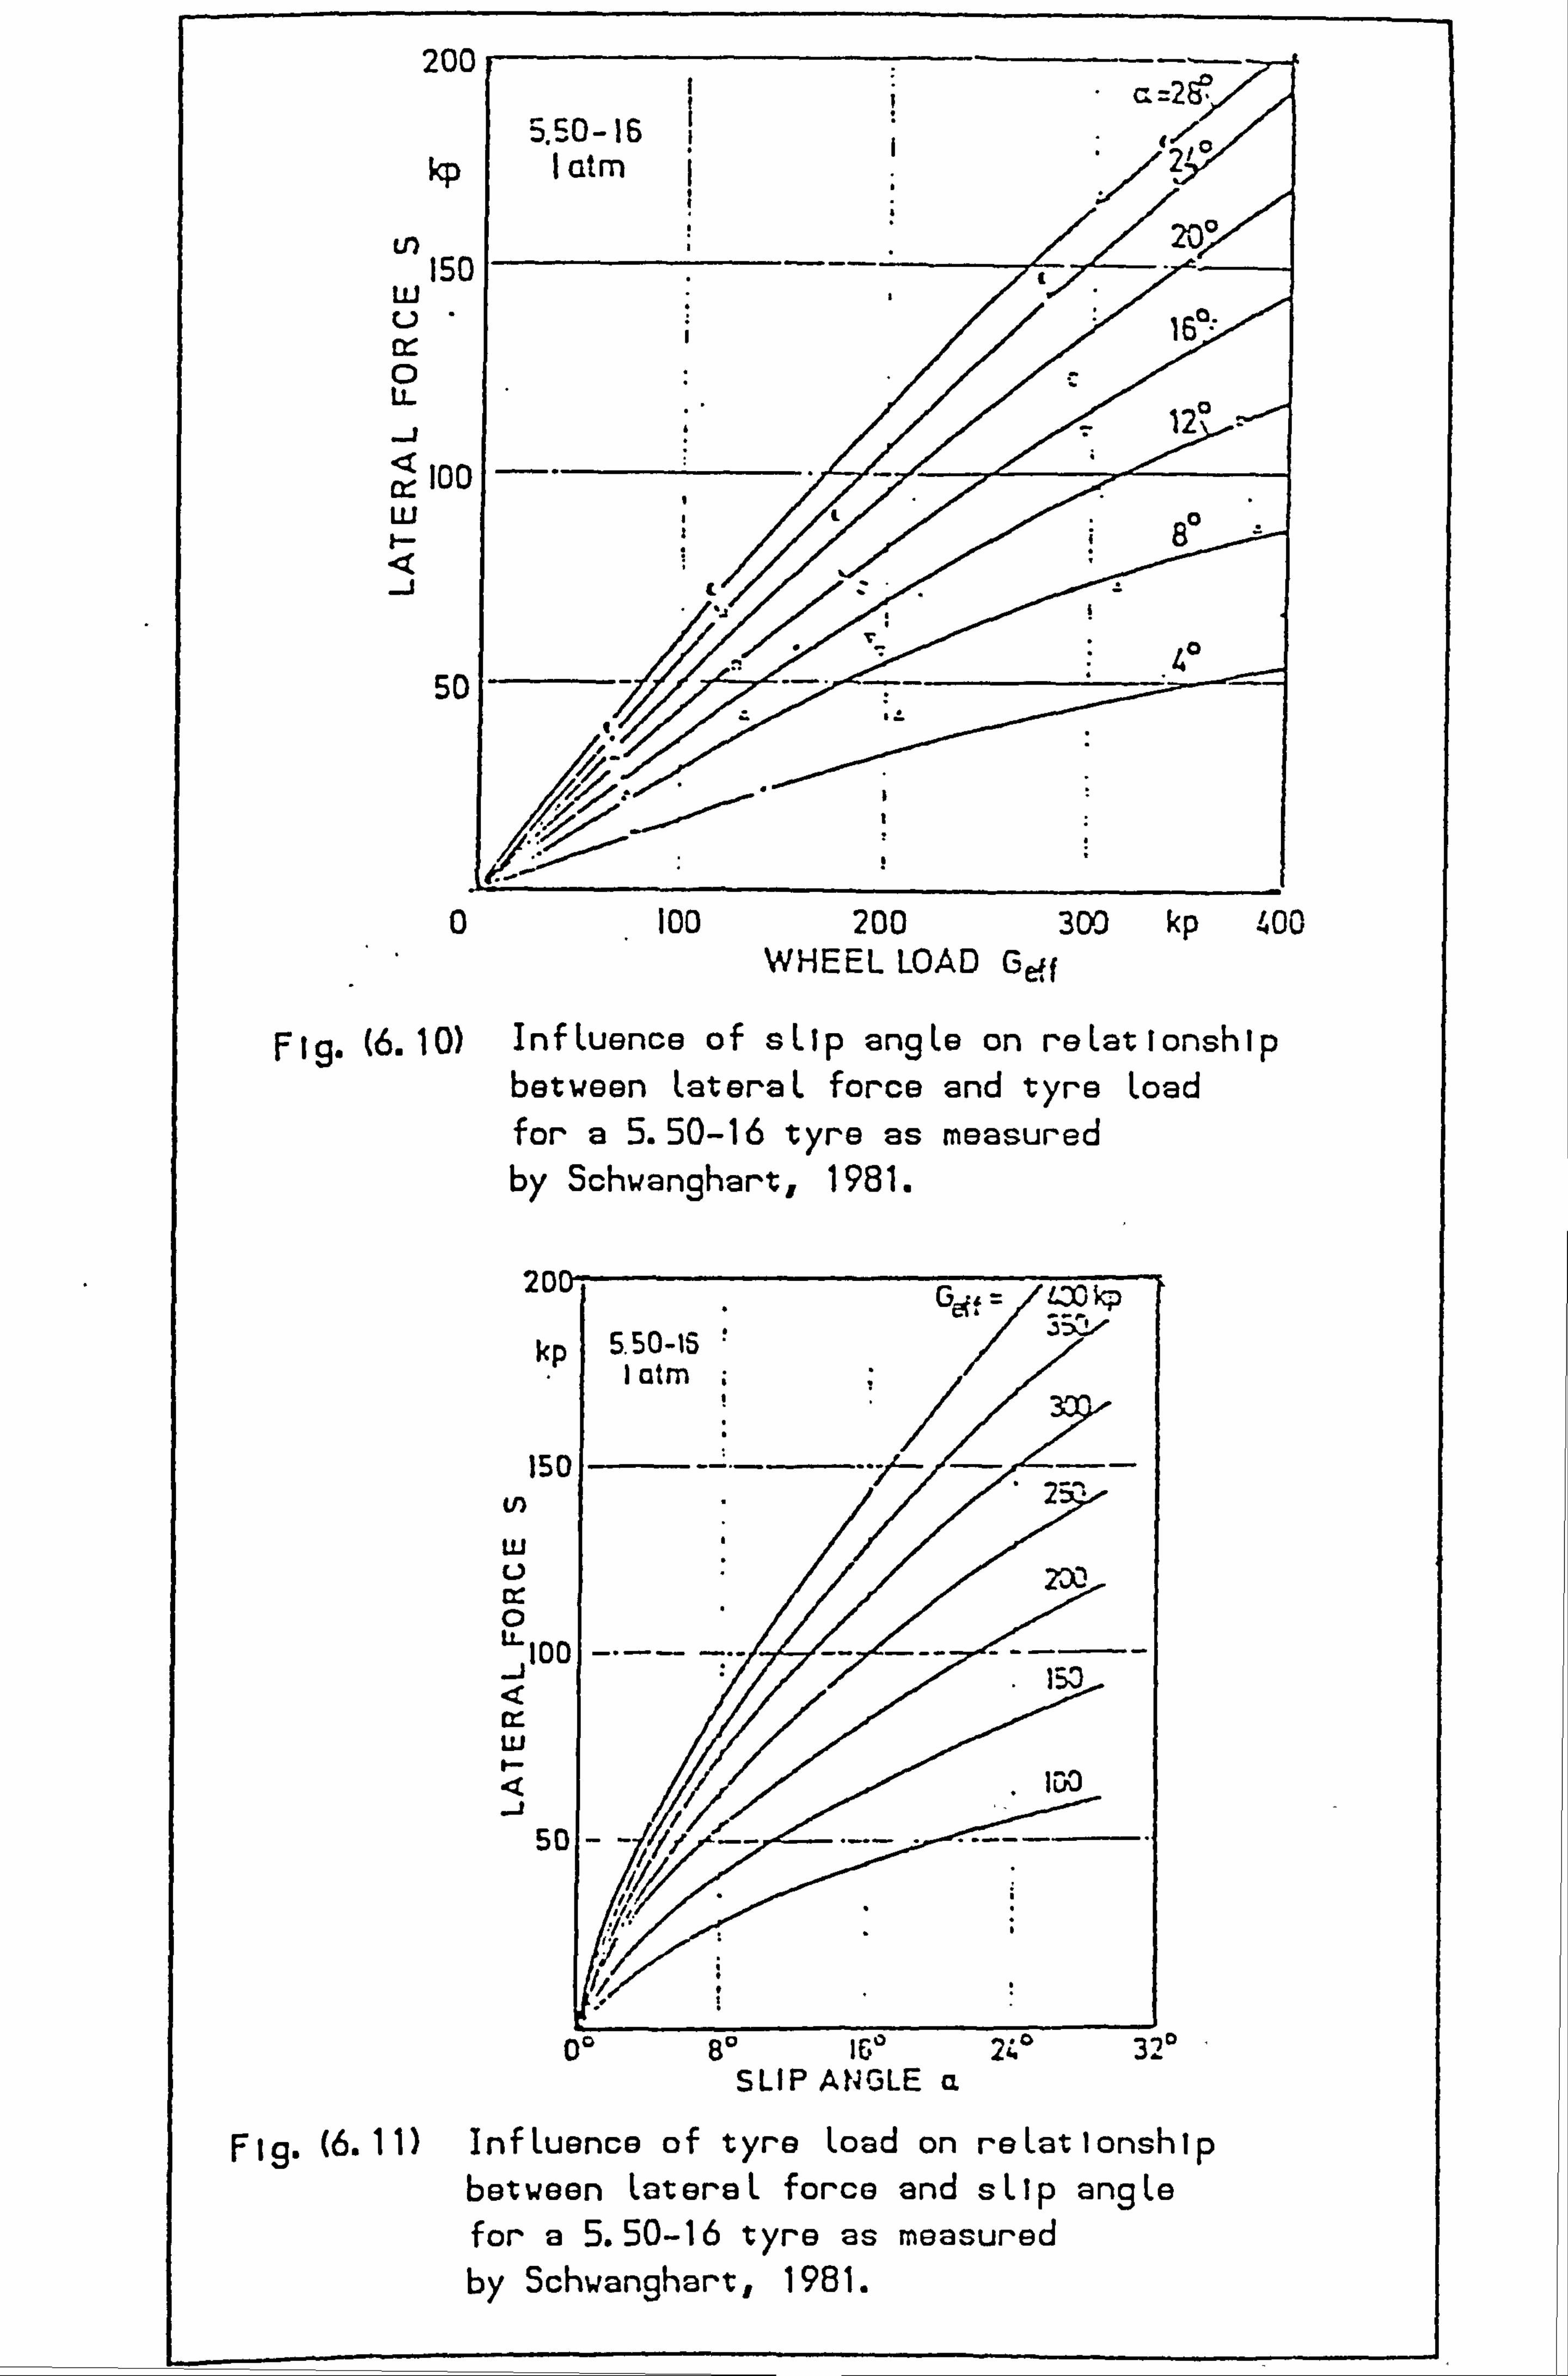
Lr)
LLJ u of 0
LLI t-
-j
5c
atm
20"
12
Al
0.100 200 3DO kp 400 WHEEL LOAD Gei
(6.10) InfLuence of sLlp angLe on reLationship between LateraL force and tyre Load for a 5.50-16 tyre as measured by Schwanghart, 1981.
20
k;
w
0 LL 101 -i
51
&, = Q0 kp , Gef, 5,50-15 I citm
2--
53
r%Q no Oro ". 0 1.,.
SLIP ANGLE a
Fig. (6.11) InfLuence of tyre Load on reLatlonship between LatereL force and sLIp angLe for a 5.50-16 tyre as measured by Schwanghart, 1981.
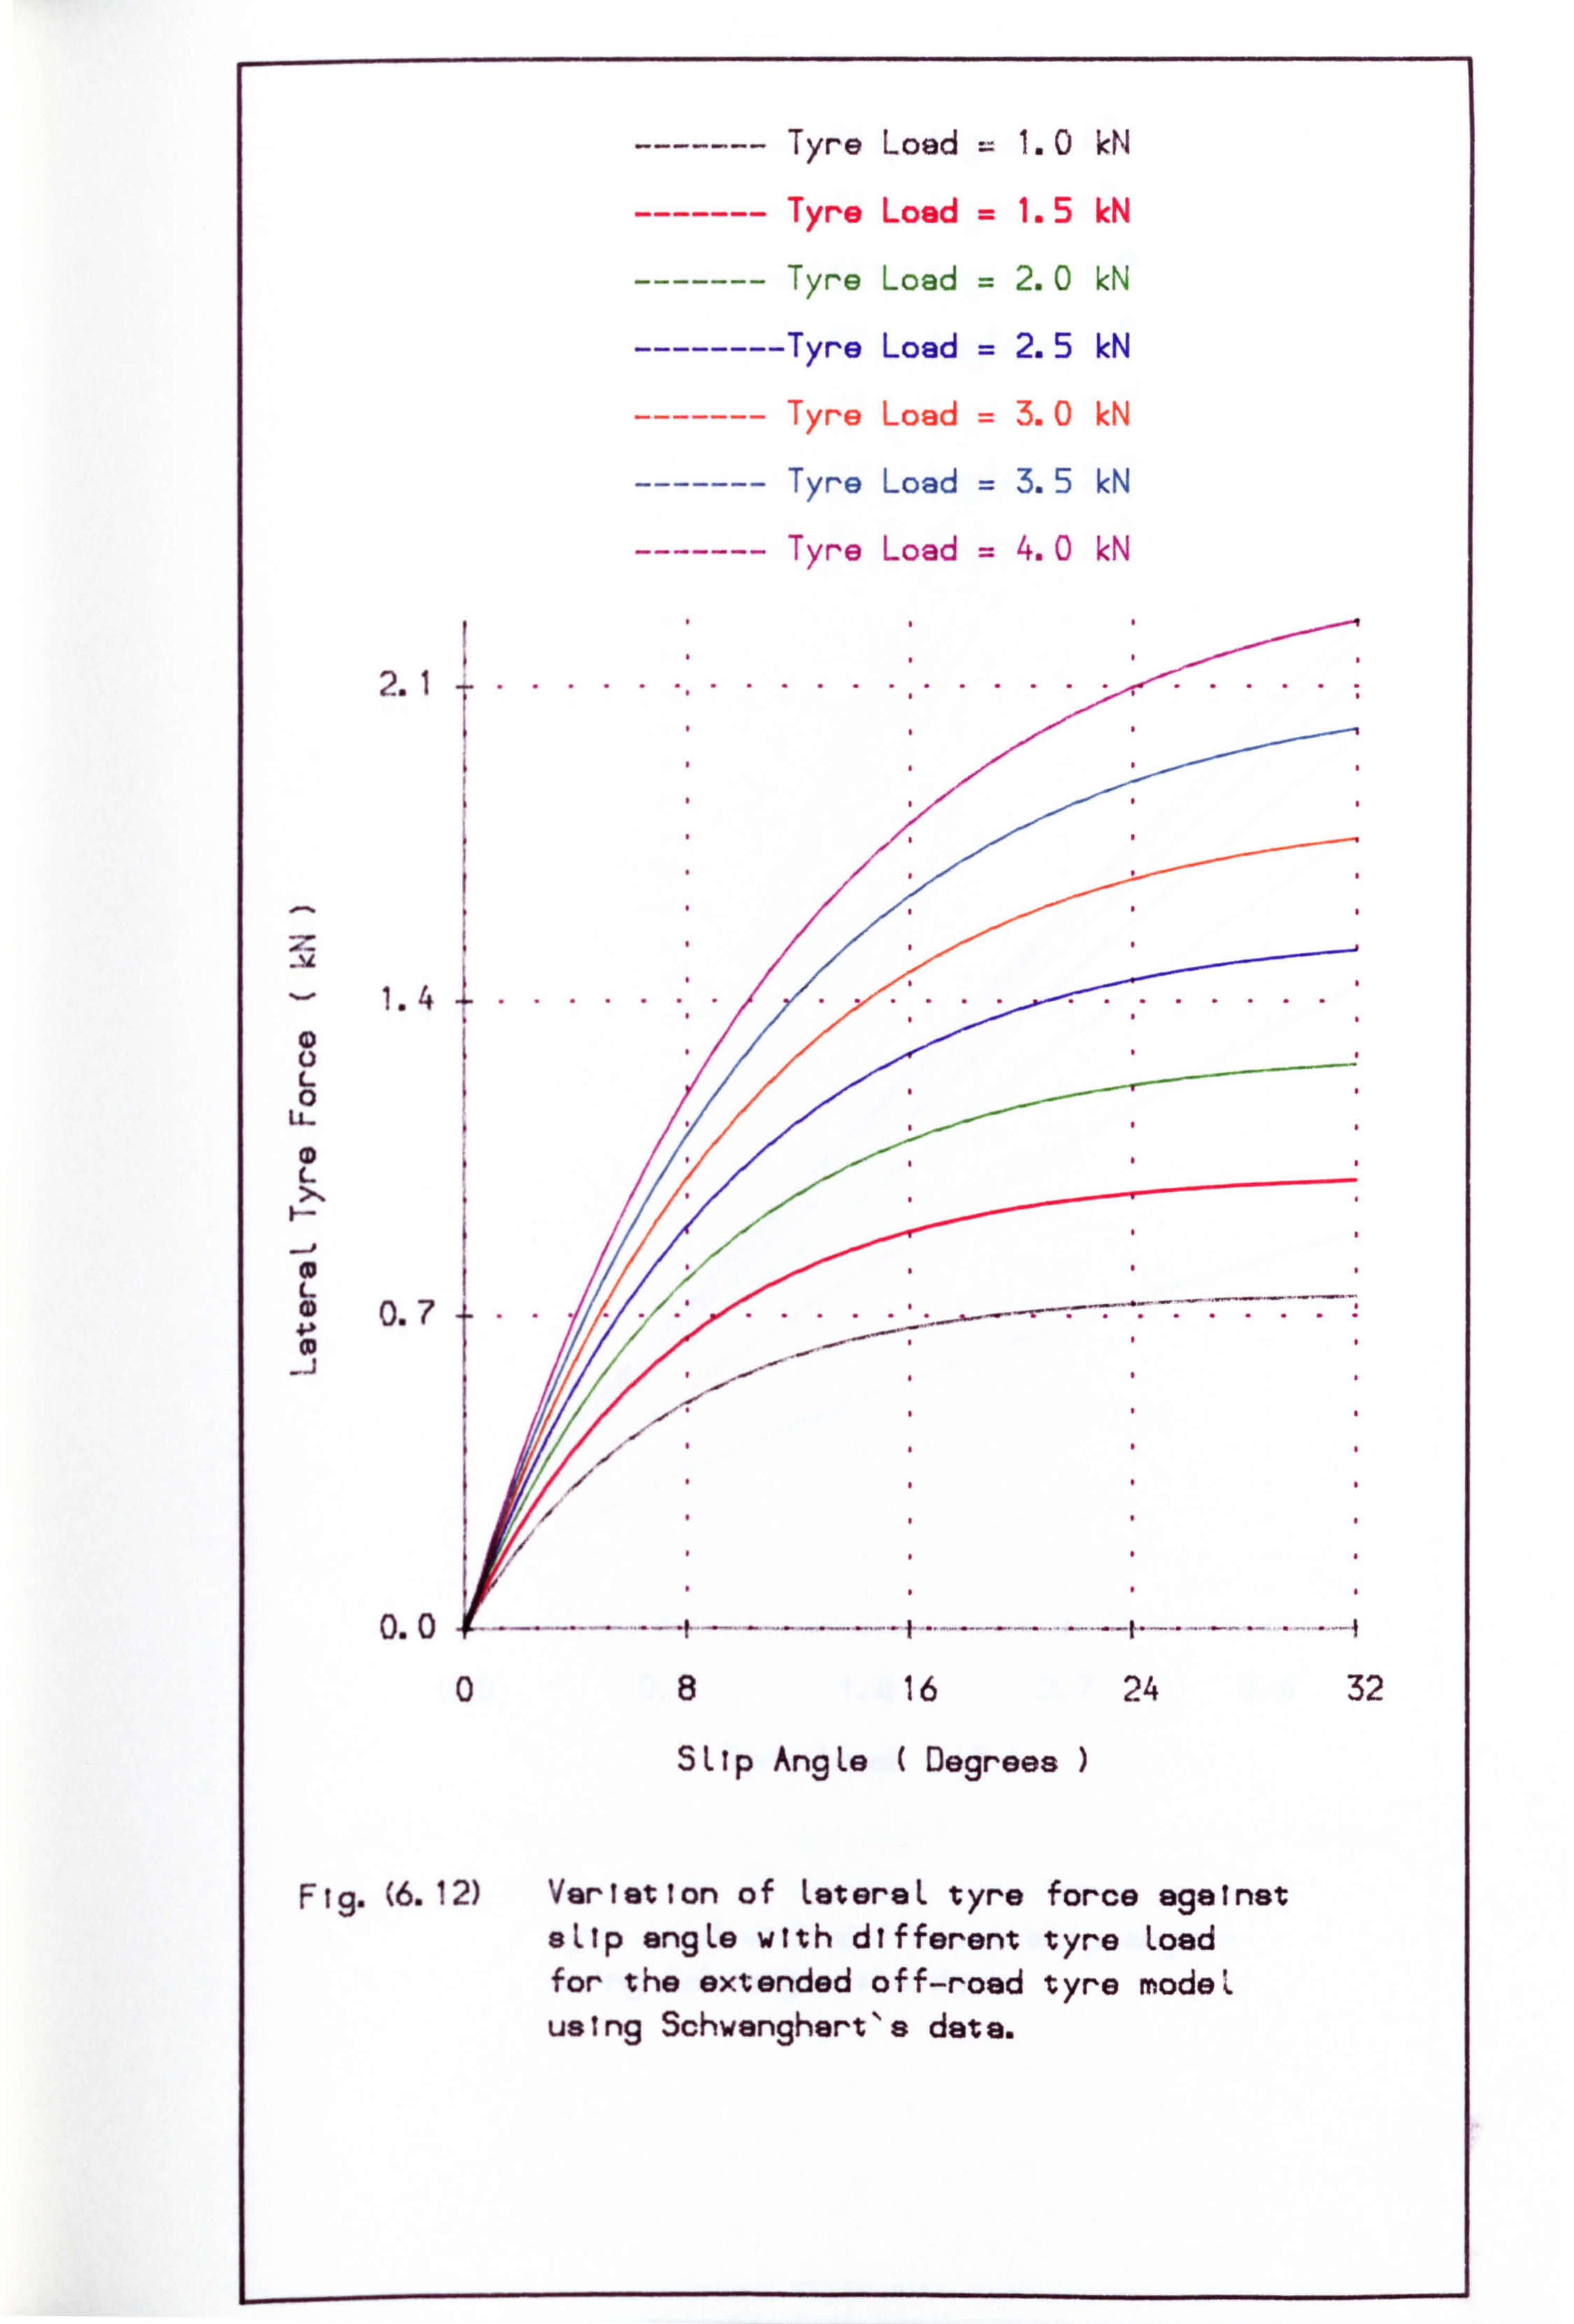
------- Tyre Load = 1.0 kN
------- Tyre Load = 1.5 kN
------- Tyre Load = 2.0 kN
-------- Tyre Load = 2.5 kN
------- Tyre Load = 3.0 kN
------- Tyre Load = 3.5 kN
------- Tyre Load = 4.0 kN
2.1 ........ .... ... .... .......
. ............. . 1.4 ...... ... .
0
L 0 0.7
_j
0.0 _4 0 8 16 24 32
SLIp AngLe Degrees
Flg. (6.1 2) Variation of Late raL tyre fo rce against sLip engLe with d ifferent ty re Load for the extended off-road ty ro model.
L
using Schwenghert's date.
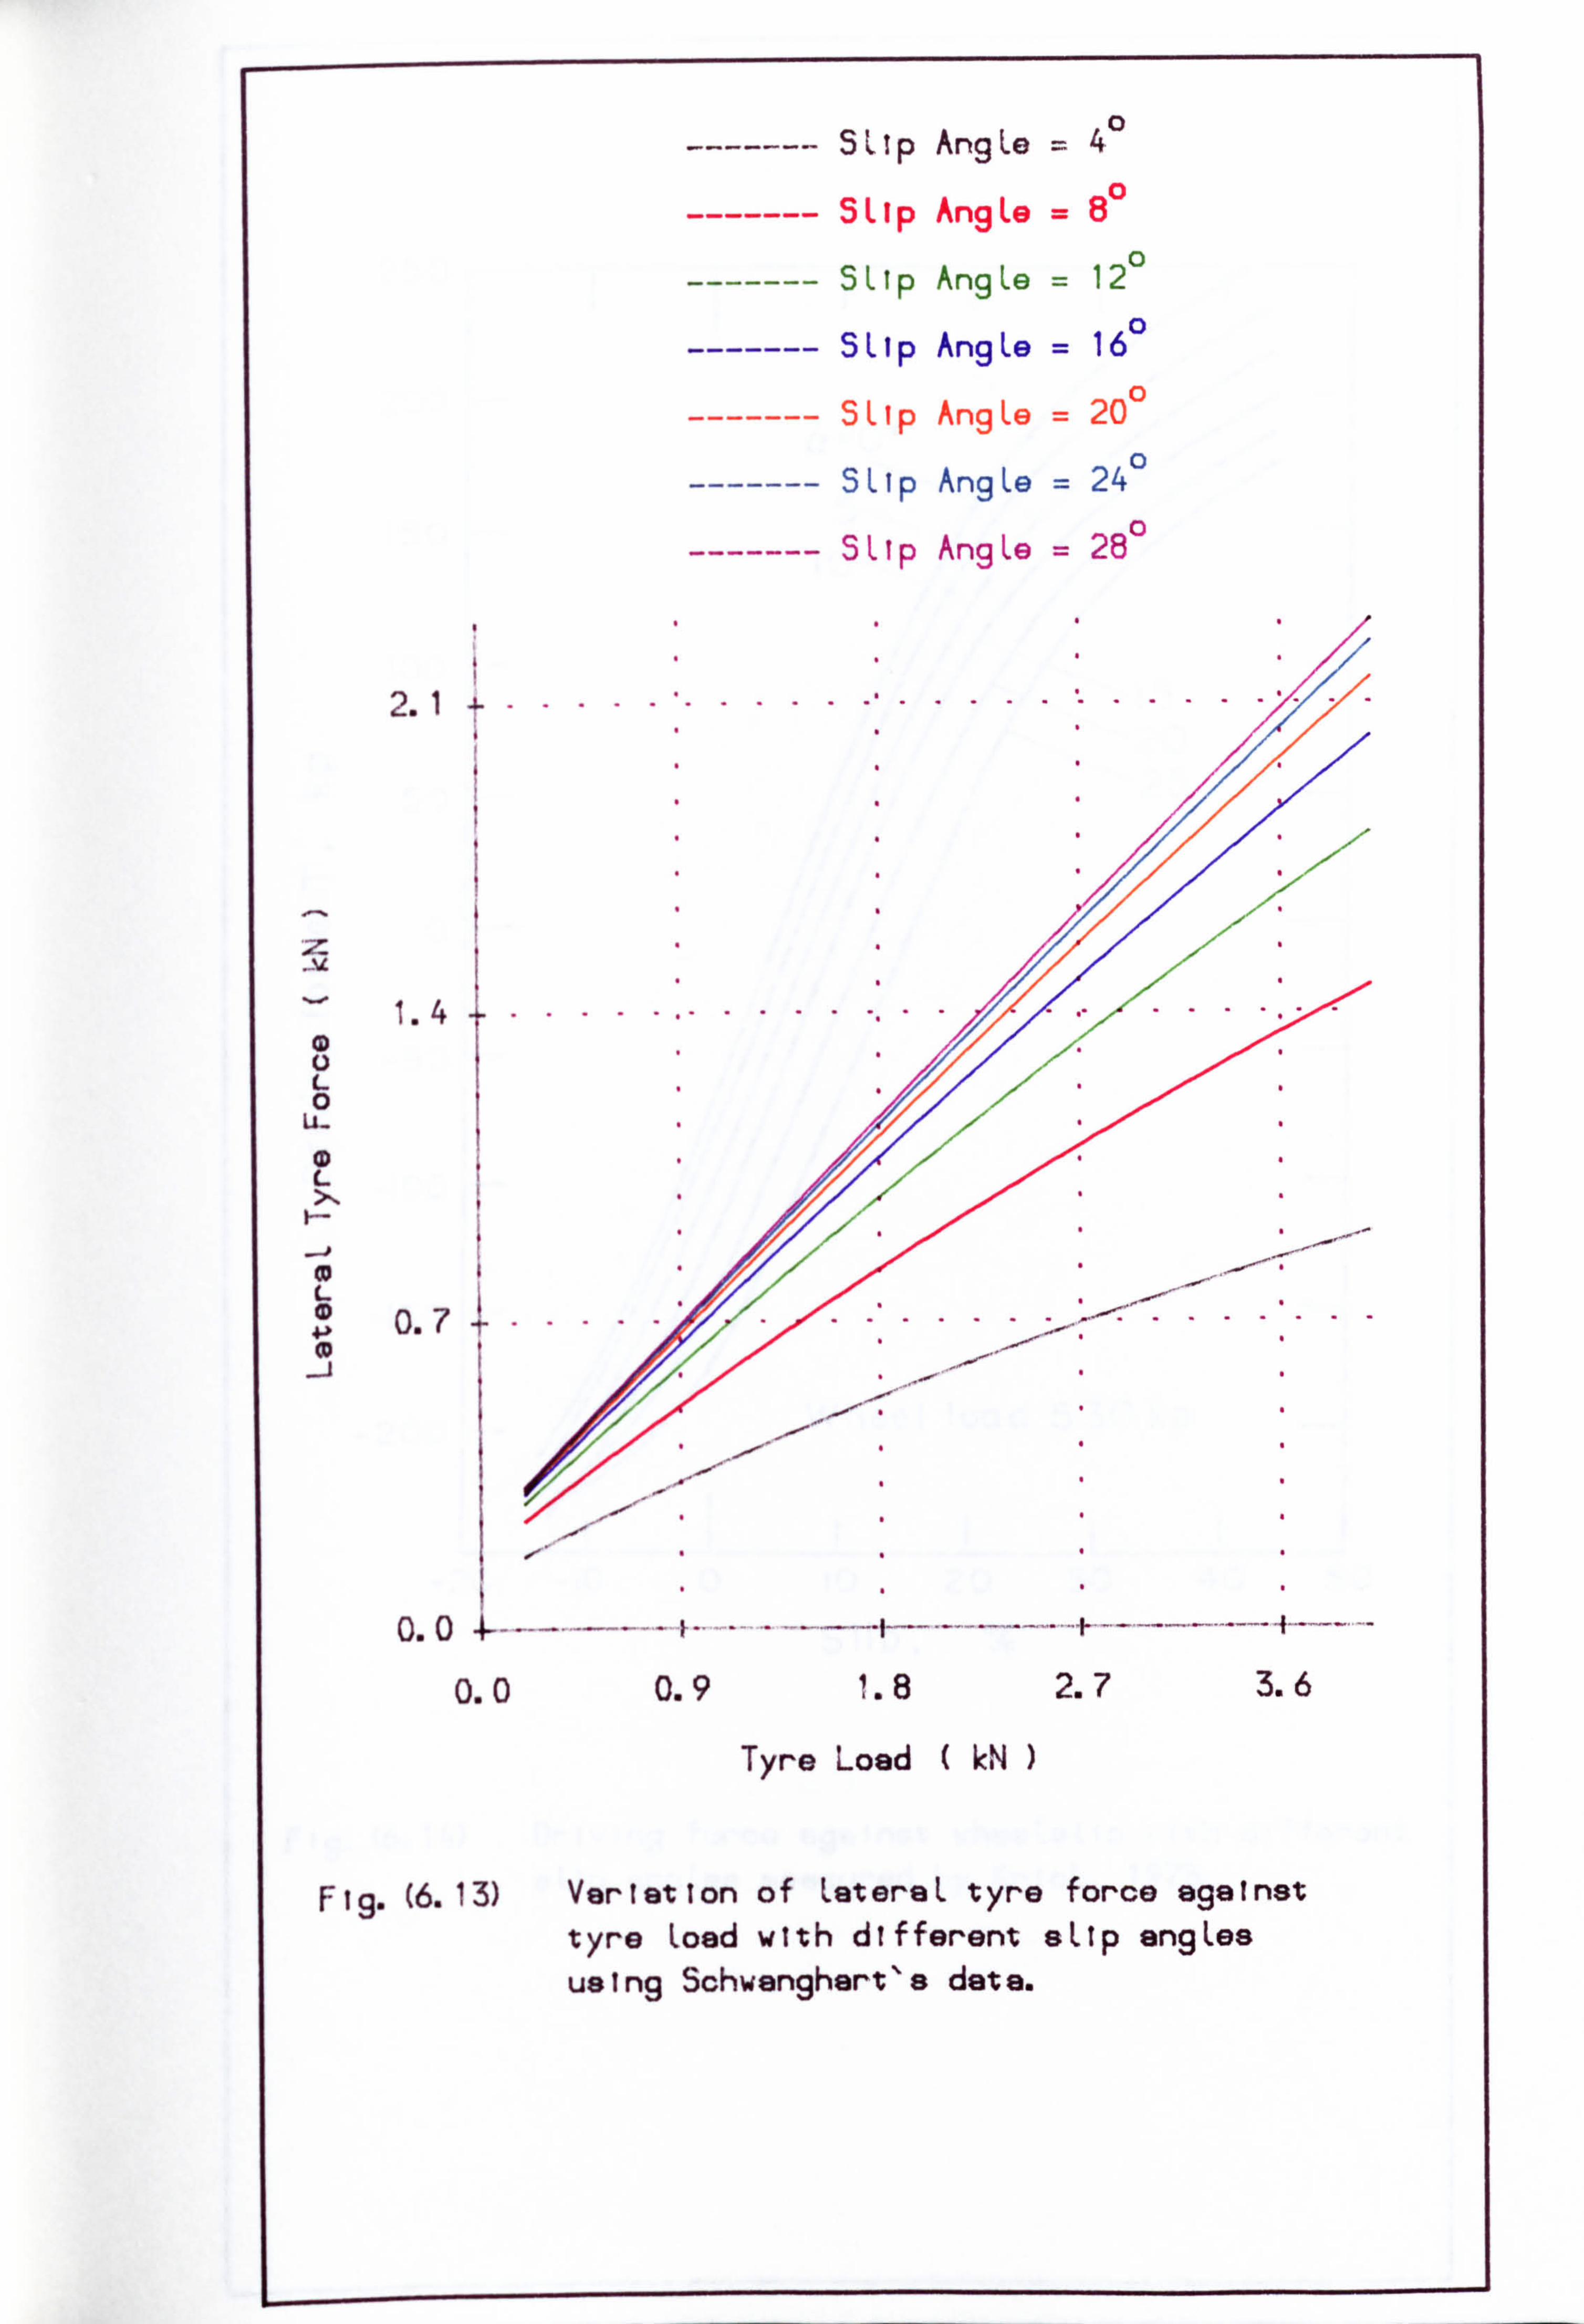
------- SLIp AngLe =40
------- SLIp AngLe =80
------- SLIp AngLe = 120
------- SLip AngLe = 160
------- SLIp AngLe = 20 0
------- SLIp AngLe = 24 0
------- SLIp AngLe = 28 0
2.1 t---- --- -..... ............
1.4 1....... ...... ........ .
L 0 U- CD
L 0.7
o. 0 +--
0.0 0.9 i. 8 2.7 3.6
Tyre Load kN
Fig. (6.13) Variation of LatereL tyre force against tyre Load with different eLlp engLes using Schwanghert's date.
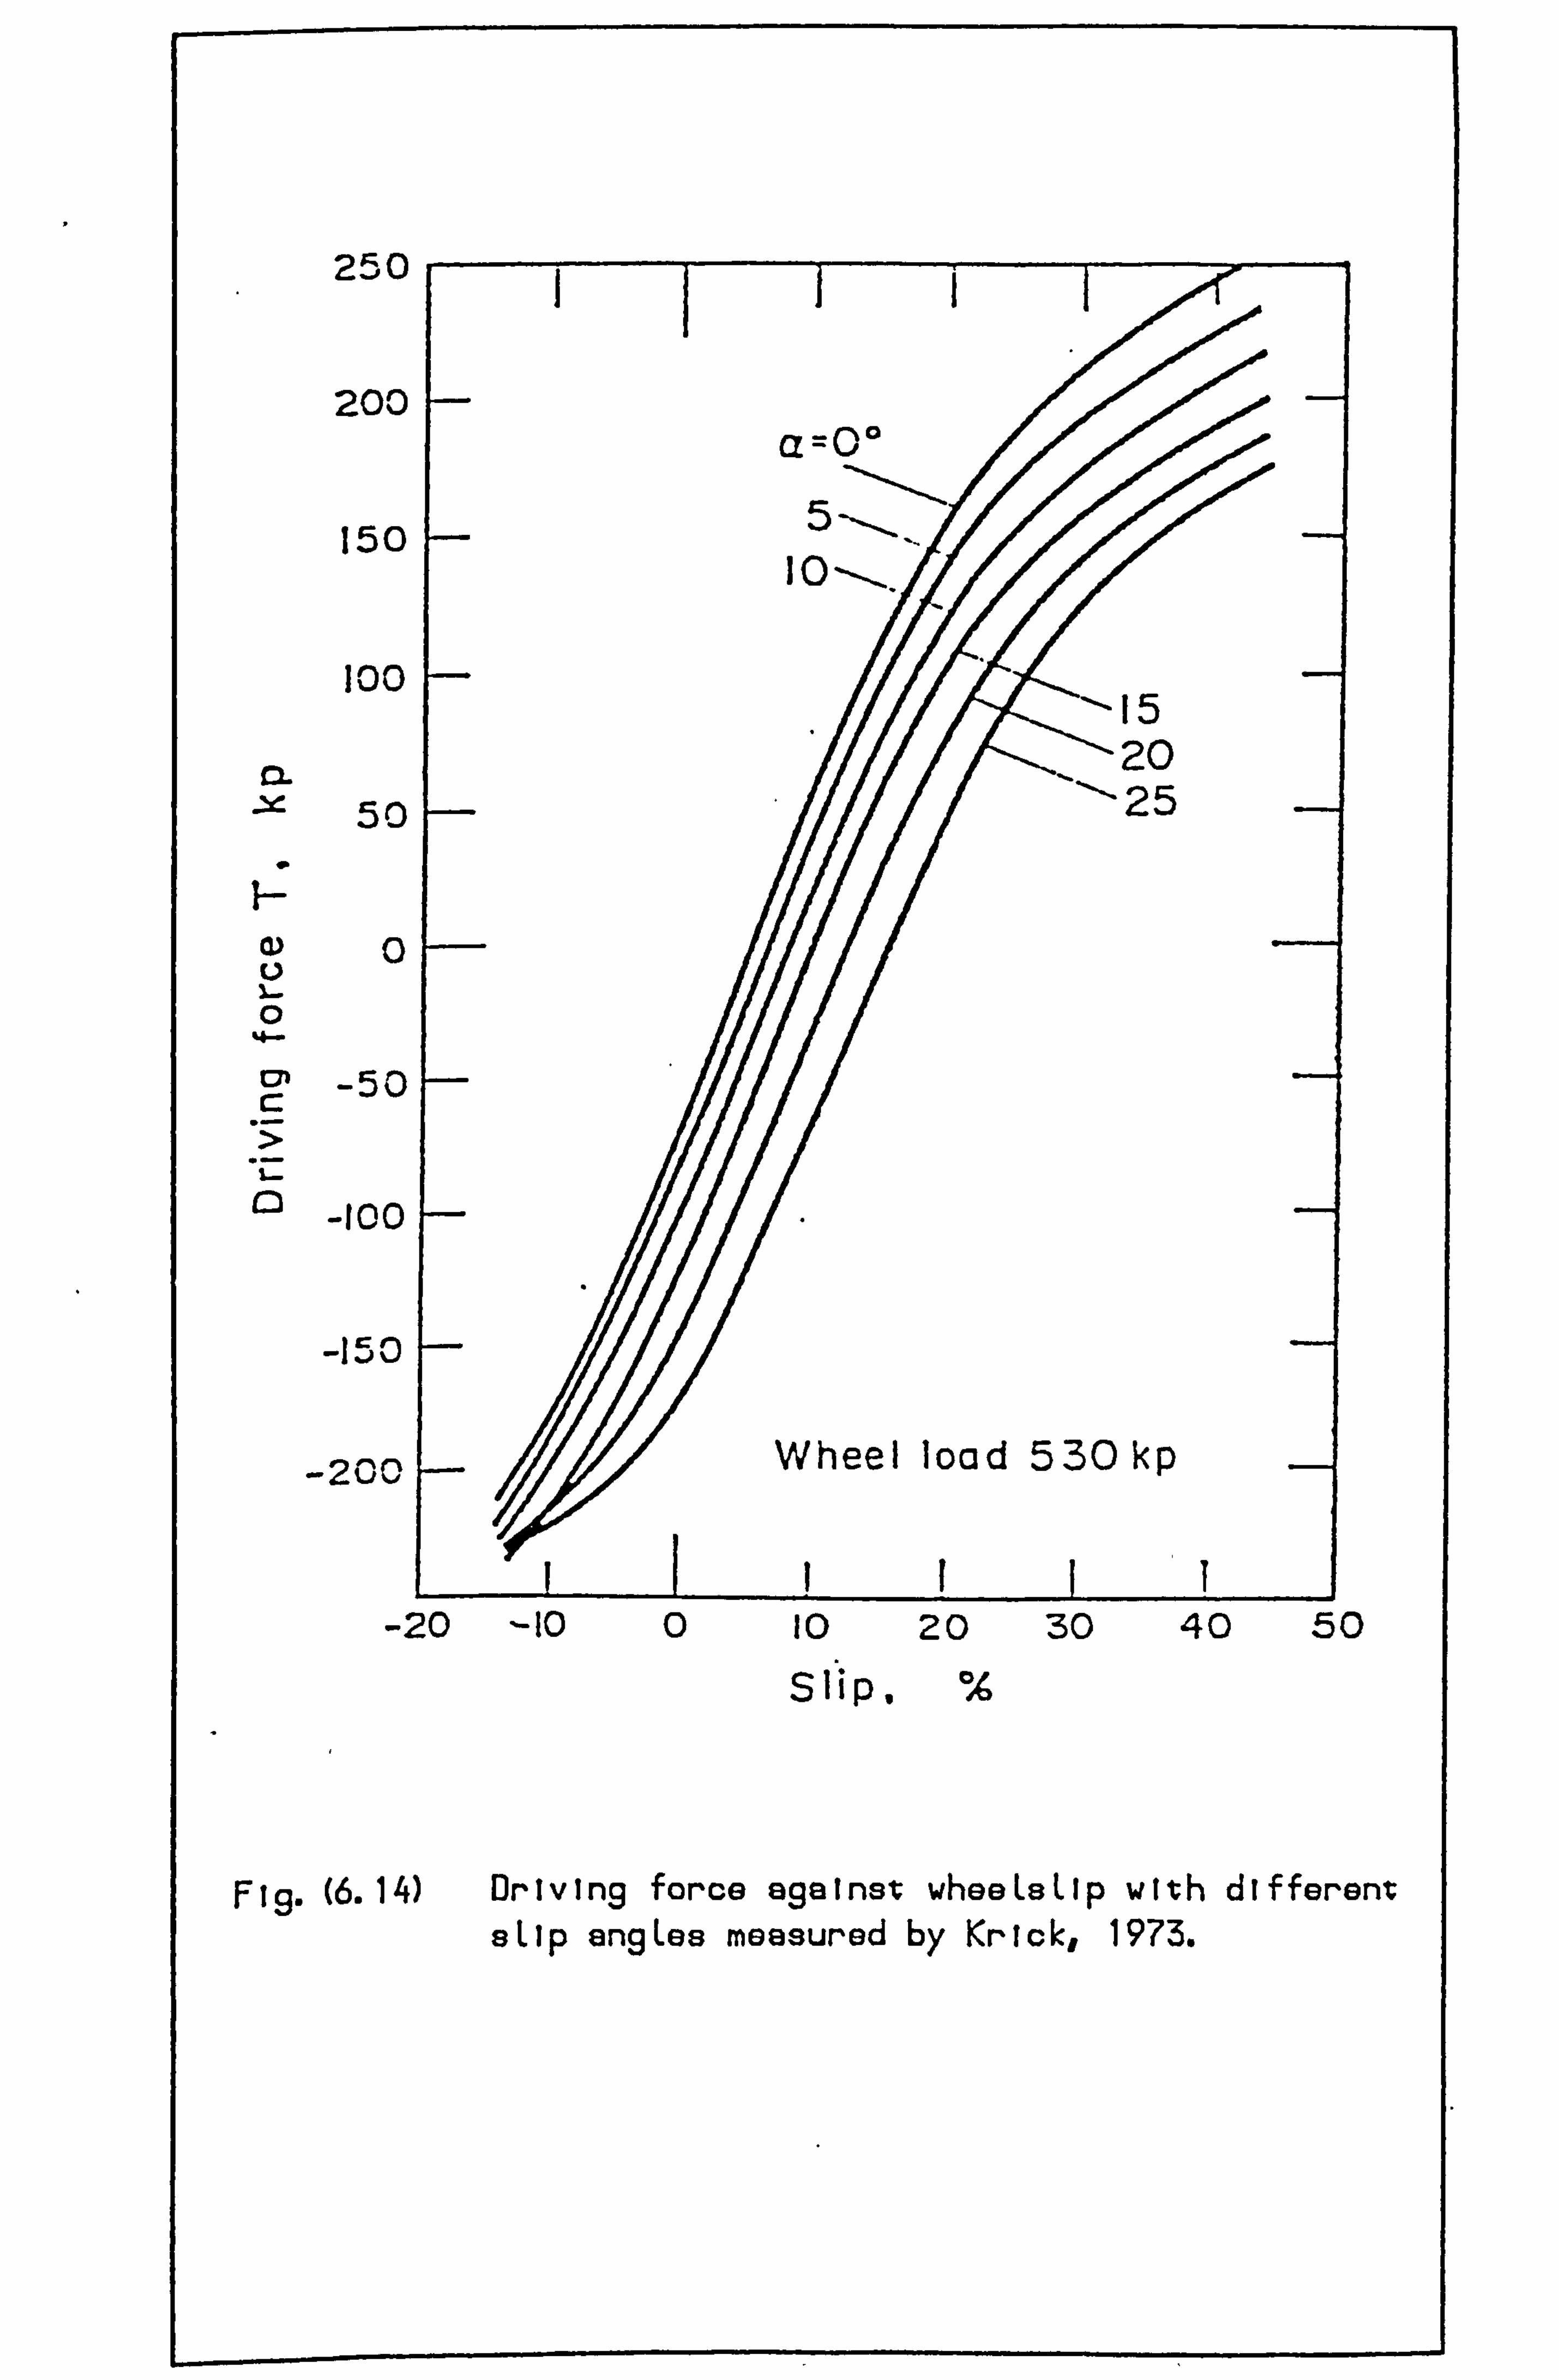
2 50 0
200 a=00
5 150 10-, -.
100 - 20 CL
50 - 25
0
0
-50 -
-100 -
-ICO -
-200- Wheel load 530kp
I -20
IIIII11 -10 0 10 20 30 40 50
Slip,
F (6.14) Driving force against wheeLaLip with different sLIp angLes measured by Krick, 1973.
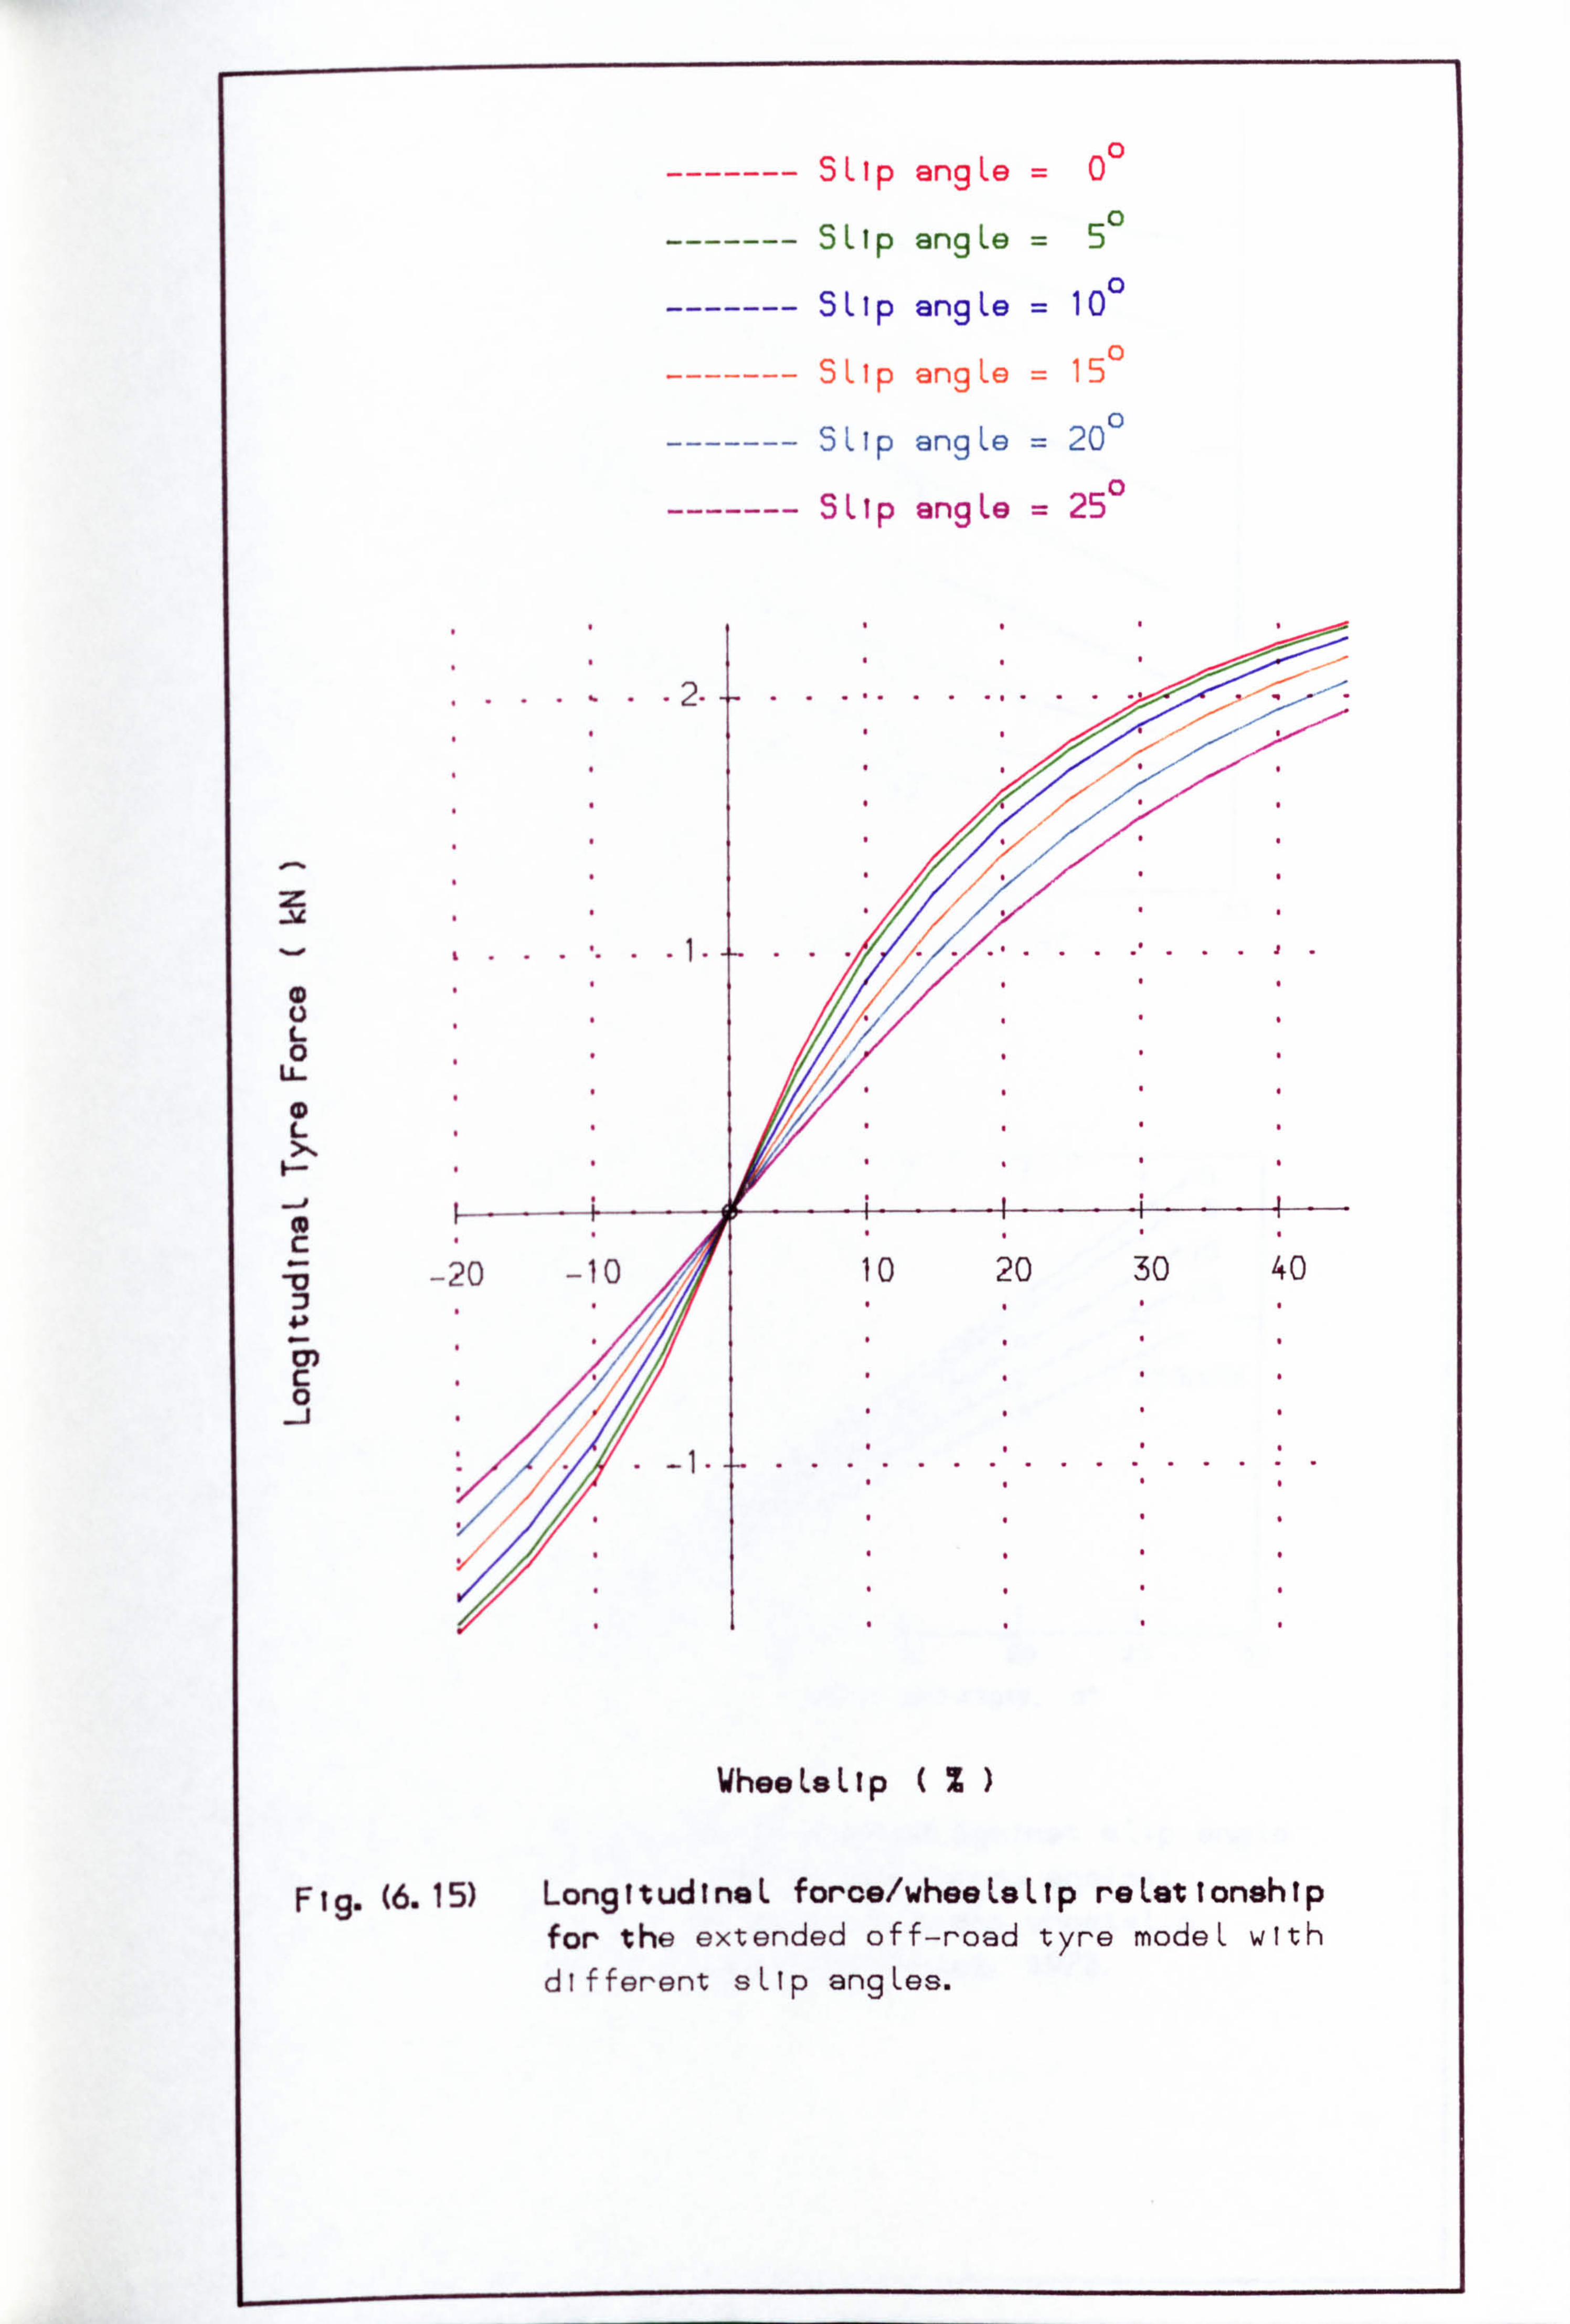
------- SLIp angLe =00
------- SLip angLe =50
------- SLip angLe = 10 0
SLIp angLe = 15 0
------- SLIp angLe = 20 0
------- SLIp angLe = 25 0
(D
L 0
U_
L
c
-10 10 20 30 40 0 0
c 0 _j
2? 0 `0
WheeLeLlp %
Fig. (6.15) LongitudineL force/wheeLeLip reLettonship for the extended off-road tyre modeL with different sLlp angLes.
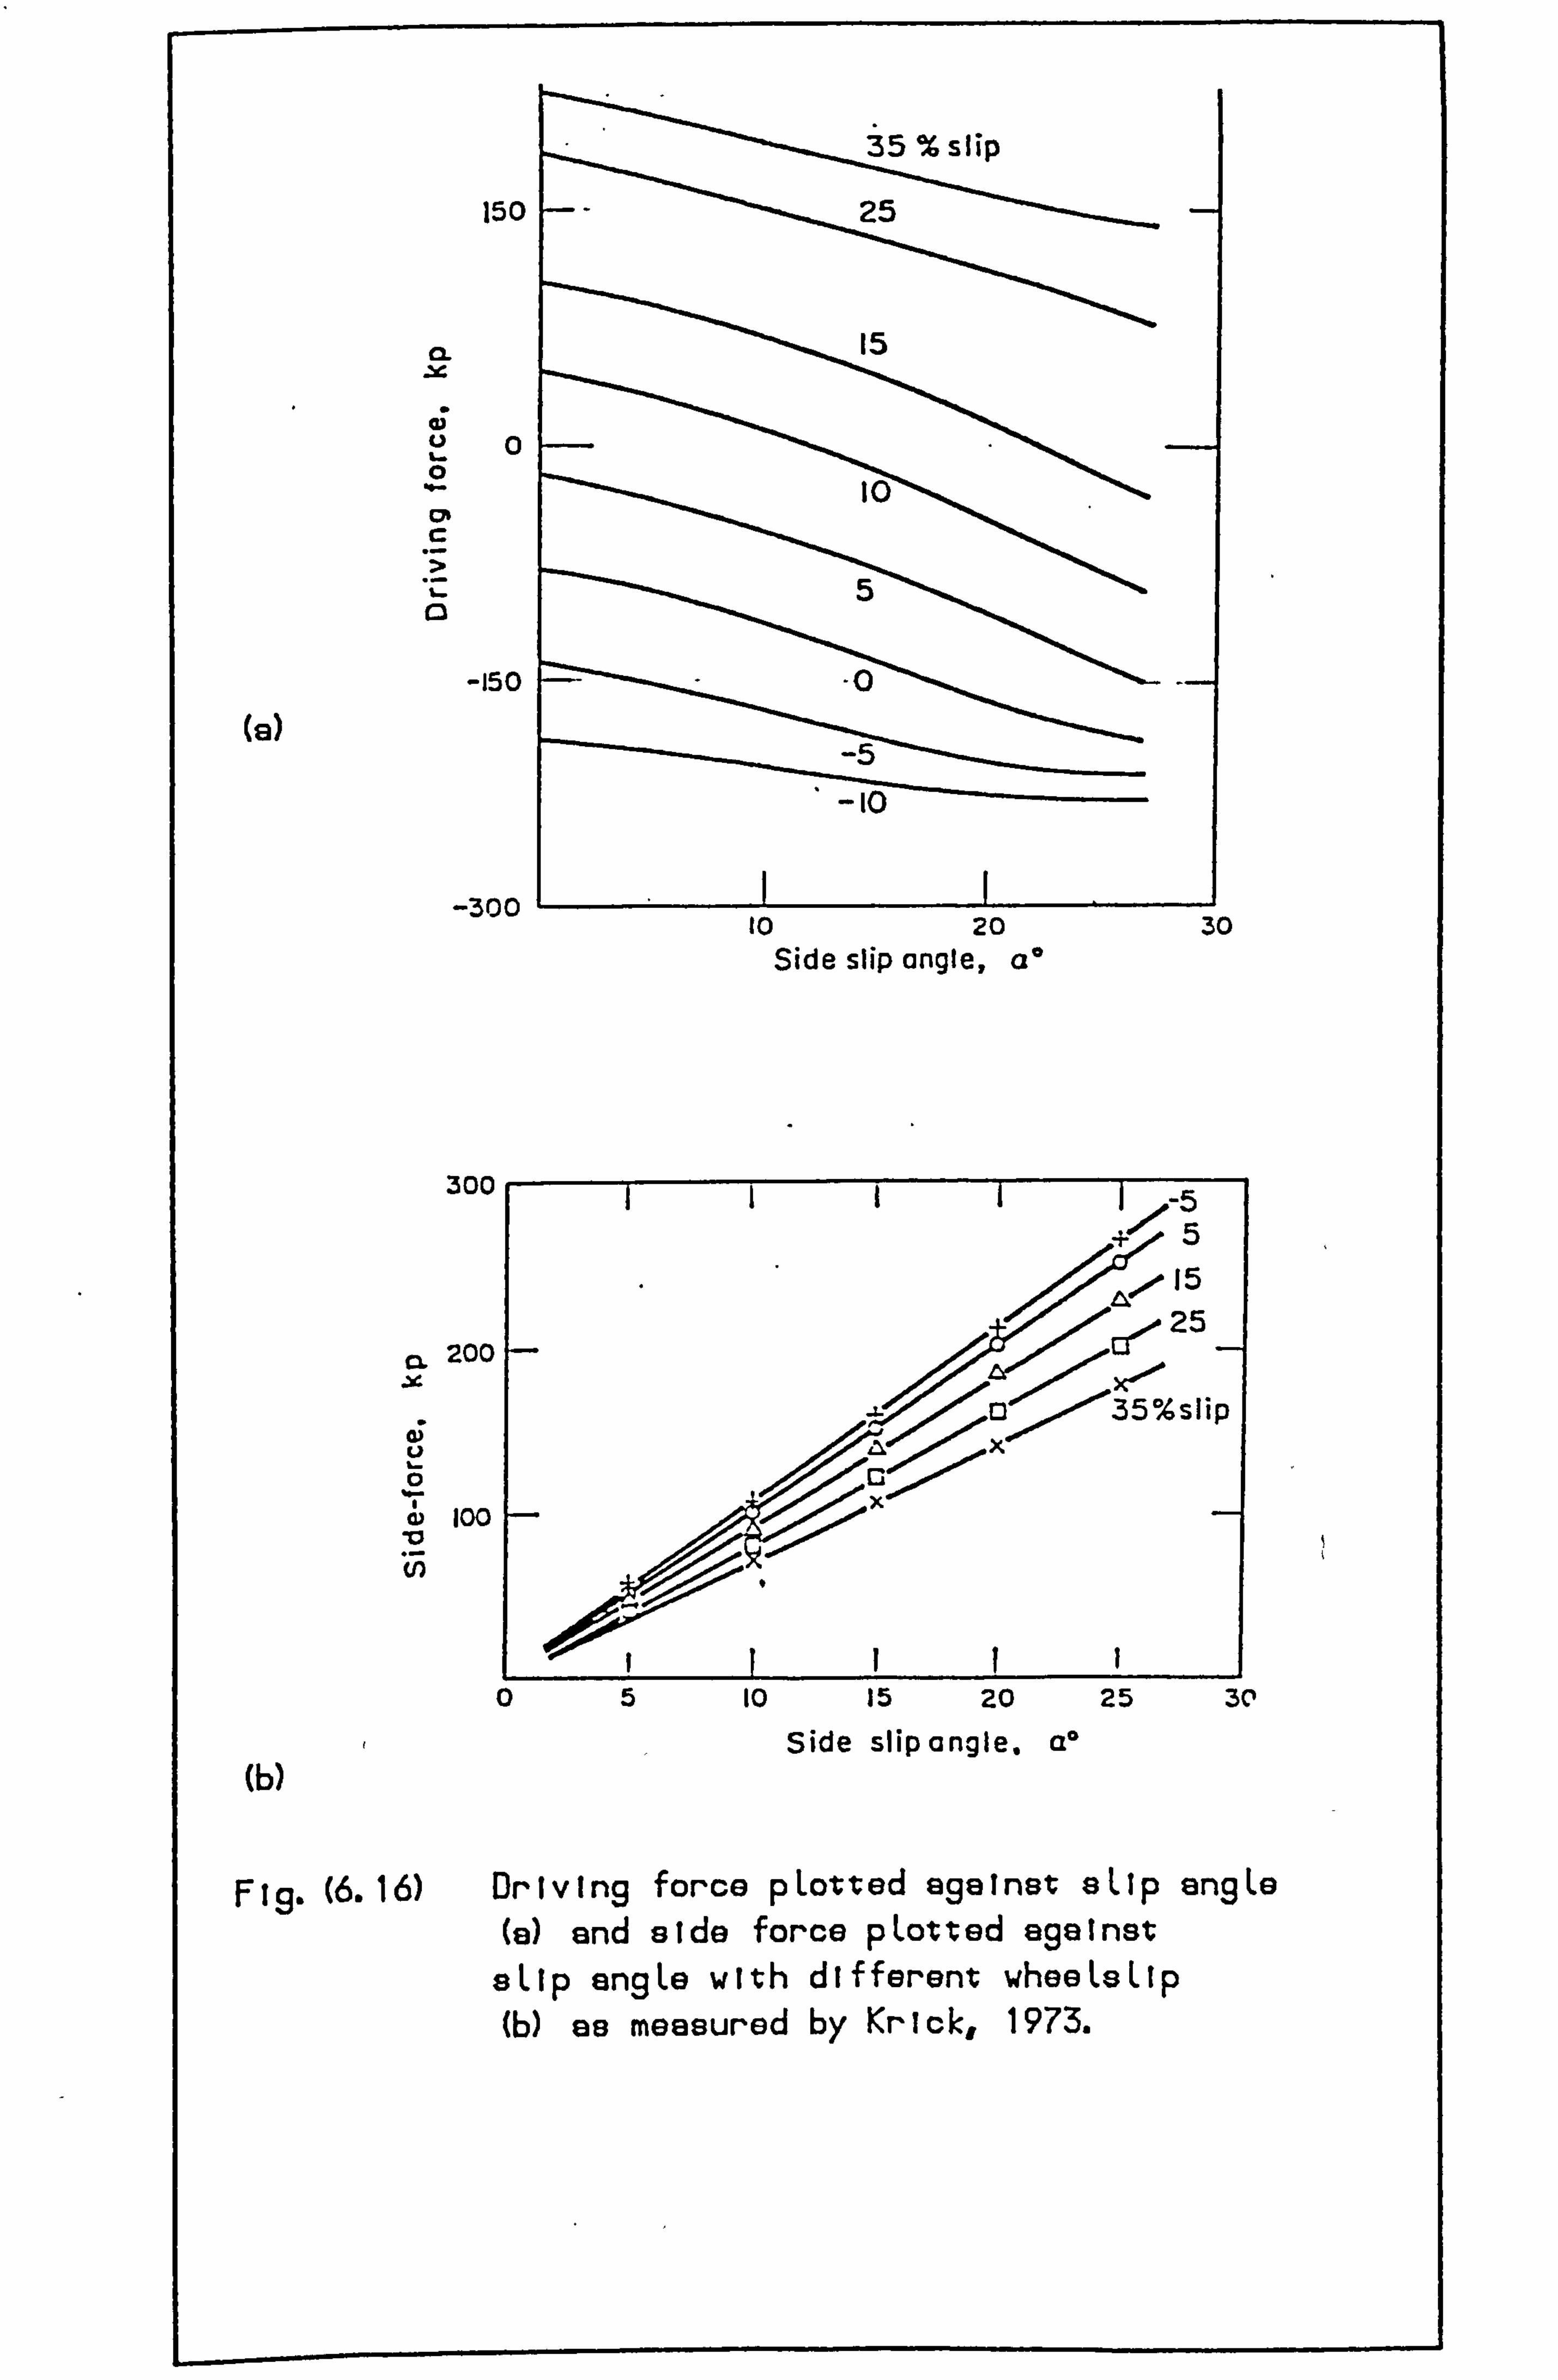
150 255
15 15
0 0 10
.C ý5
ISO .0
-10
-300 11.
--- -f 10 20 30 Side slip angle, a*
300 -5 5 15 25
C1.200 . Y. X--*** 13 35%slip
x
10 0
100 (n
05 10 15 20 25 30
Side slipangle. all (b)
F Ig. (6.16) Driving force pLotted against aLlp angLe (a) and side force pLotted against
sLip engLe with different wheeLaLlp (b) as measured by Krick, 1973.
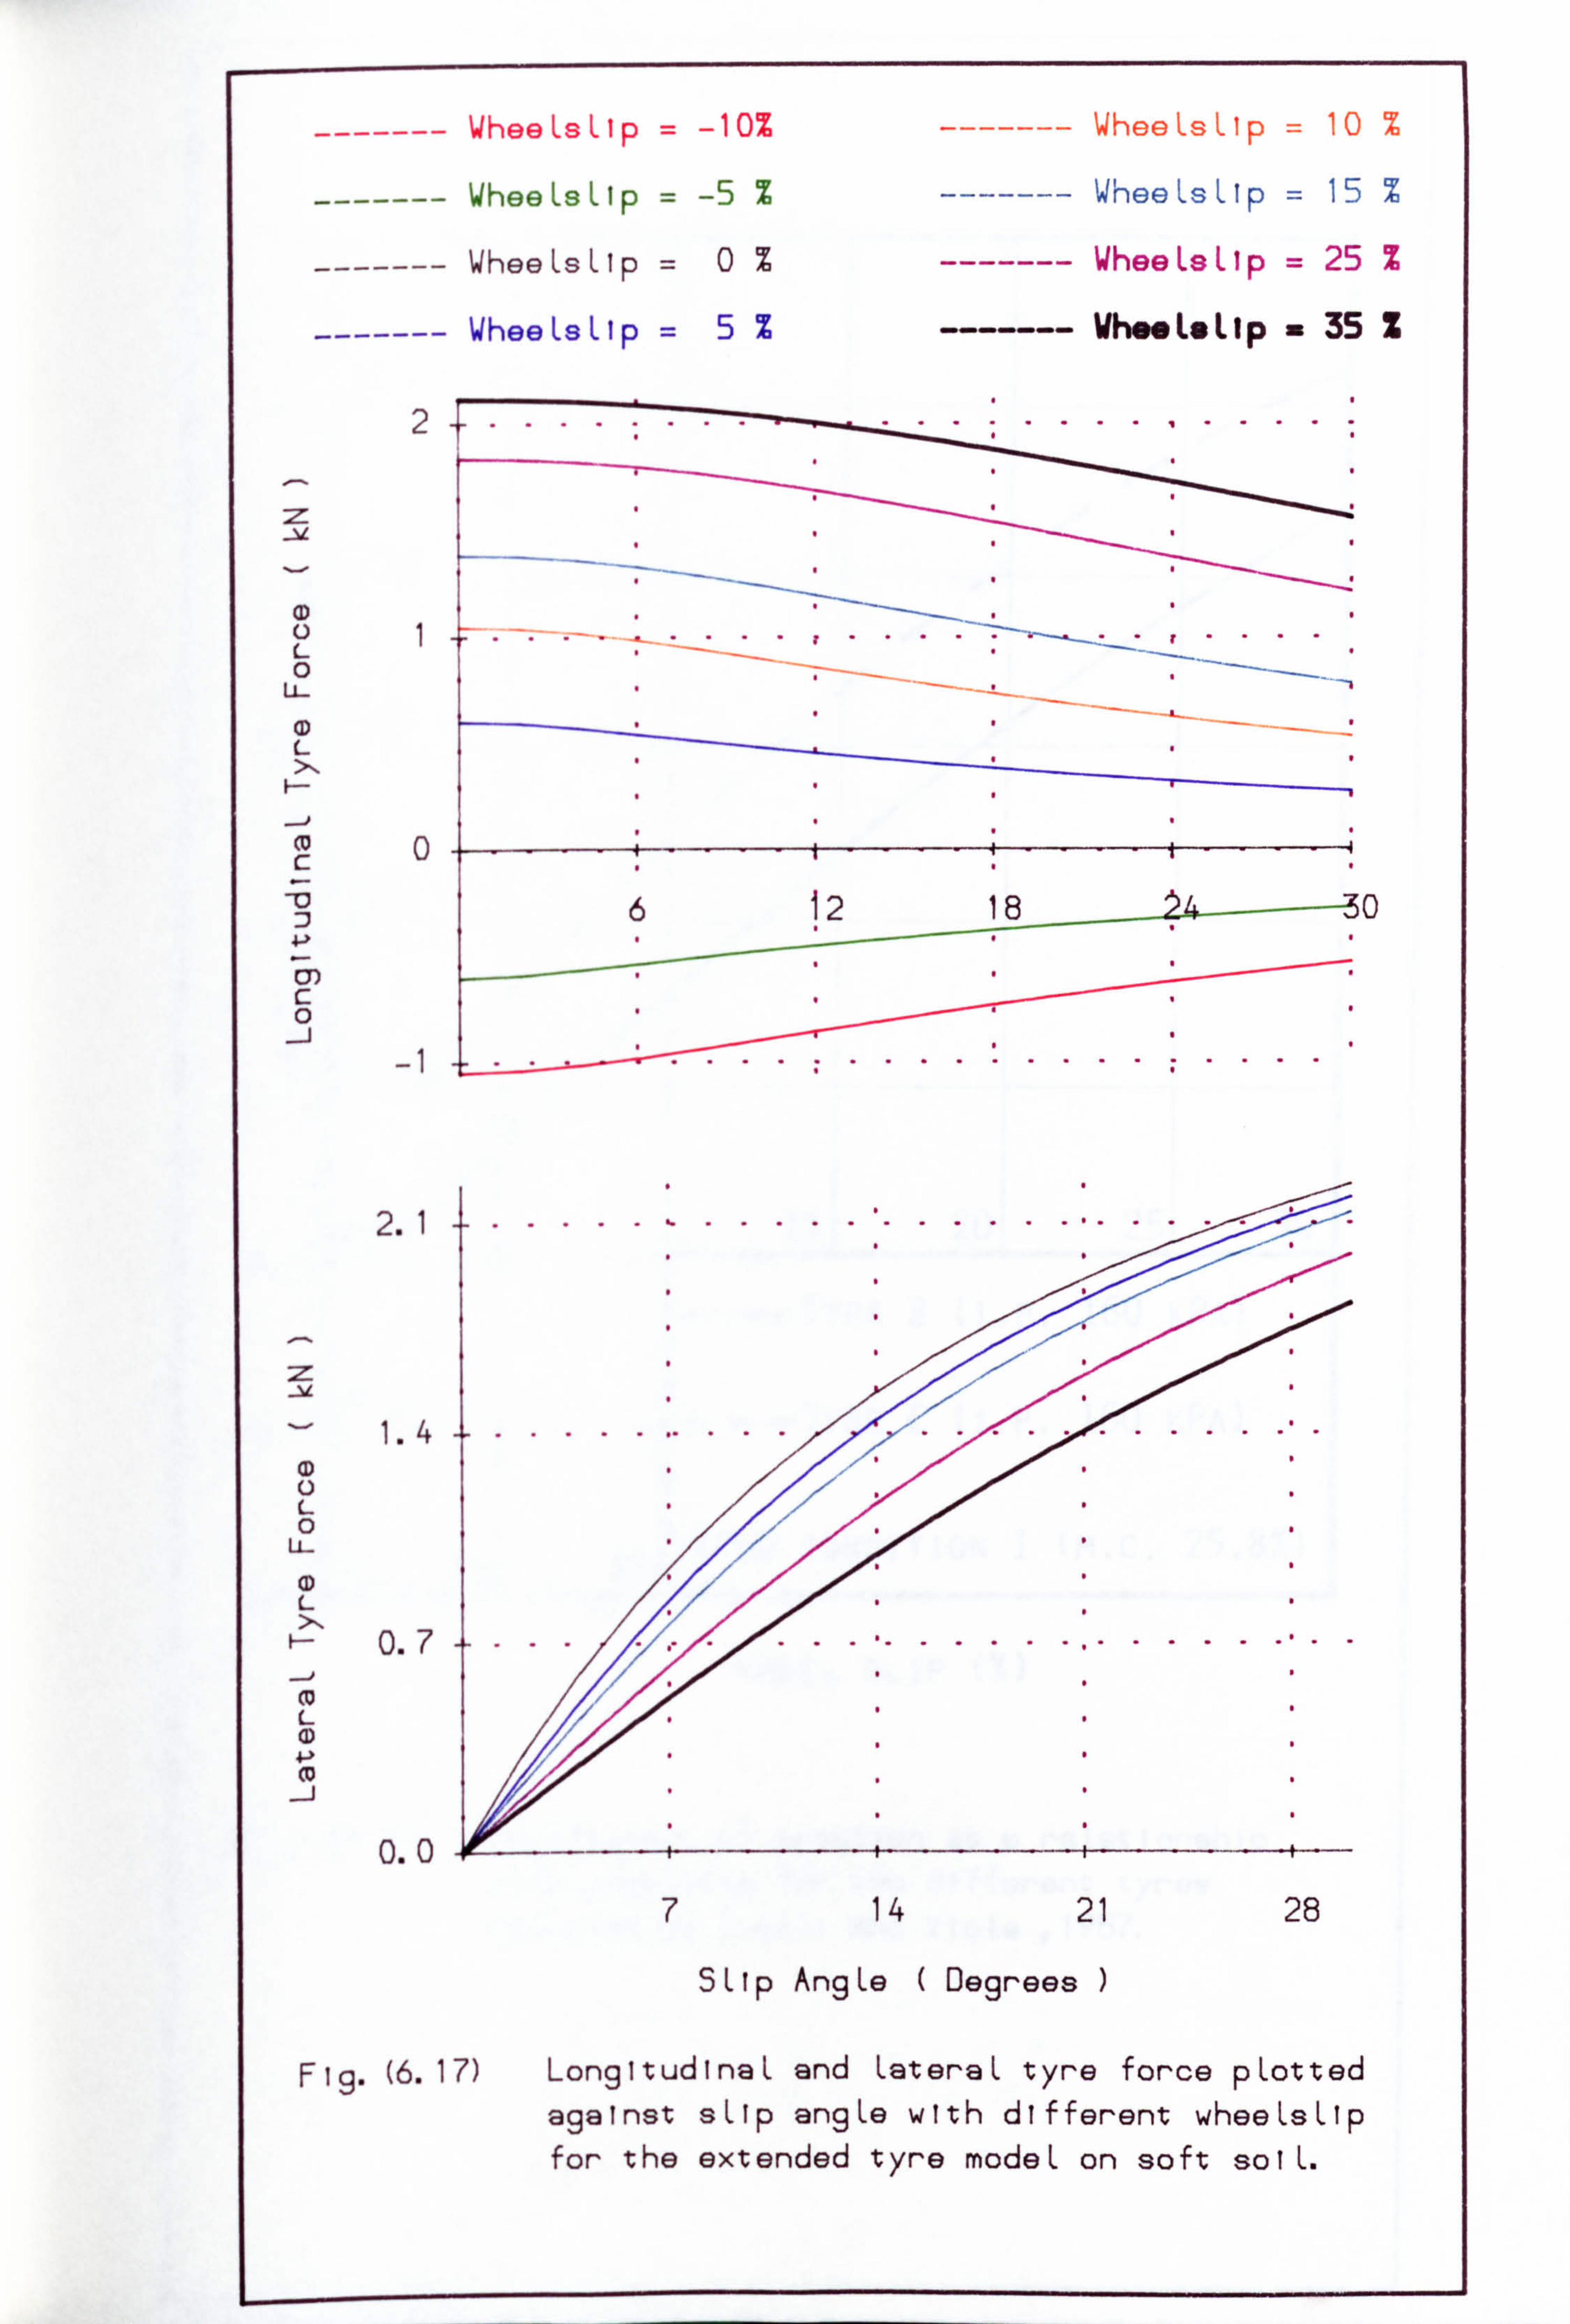
------- WheeLsLlp = -10% ------- ýhee Ls 1,1 p= 10 Tt
------- WheeLsLlp = -5 % ------- WheeLsLip = 15 %
------- WheeLsLlp =0% ------- WheeLsLlp = 25 %
------- WheeLsLlp =5% ------- WheeL*Llp - 35 Z
2........
CD
L 0
W L
0
62 18 )4 : 1; 0
CD 0
2.1 1-----............ .
1.4 ......... ...............
0
L 0.7 ..... ....... ....... .
L
0.0
7 14 21 28
SLIp AngLe Degrees )
F 19. (6.17) LongitudinaL and LateraL tyre force pLotted against sLlp angLe with different wheeLsLip for the extended tyre modeL on soft soiL.
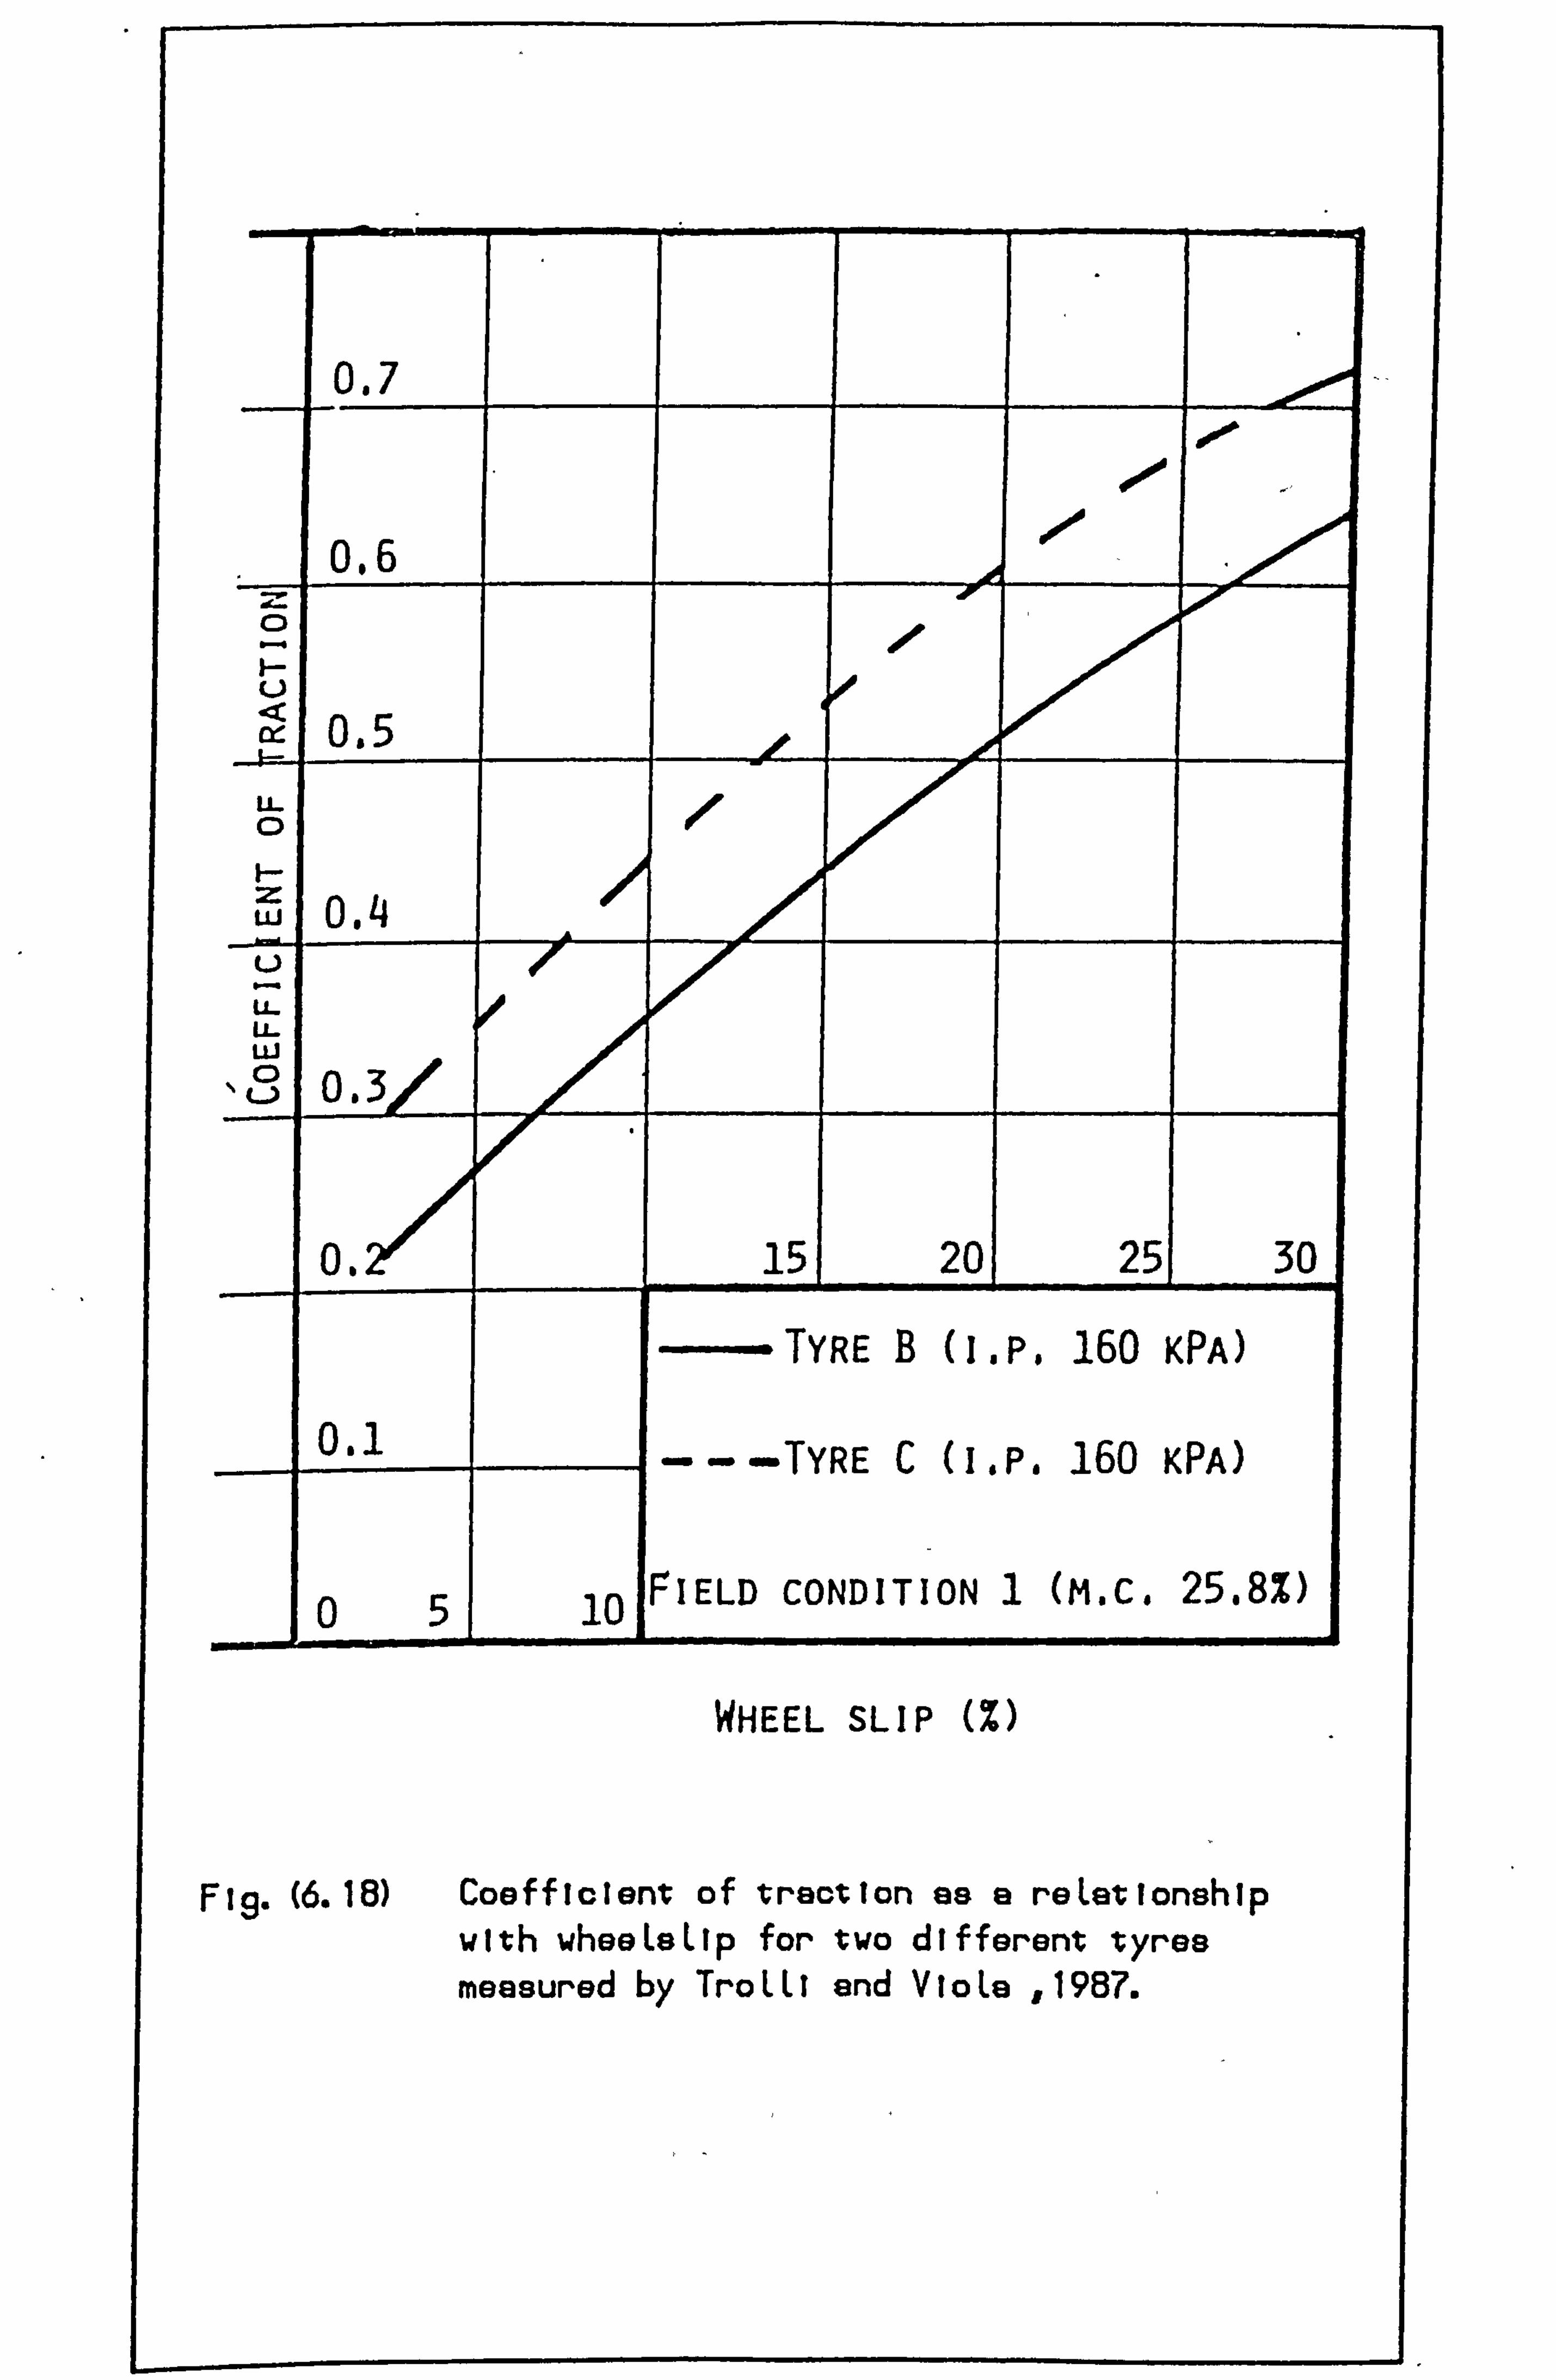
0.7
0000 0.6 -
0.5
U_ 0
Lý'U` 0.4 u ý U_ LL. oo w
N0 0.3/
0. /1
151 201 251 30
TYRE B (I. P. 160 KPA)
0.1 -TYRE C (I. P. 160 KPA)
05 10 FIELD CONDITION I (M. C. 25.8%)
WHEEL SLIP M
Fig. Coefficient of traction with wheeLeLlp for two measured by TroLLT end
as a reLationship different tyres VloLe 1987.
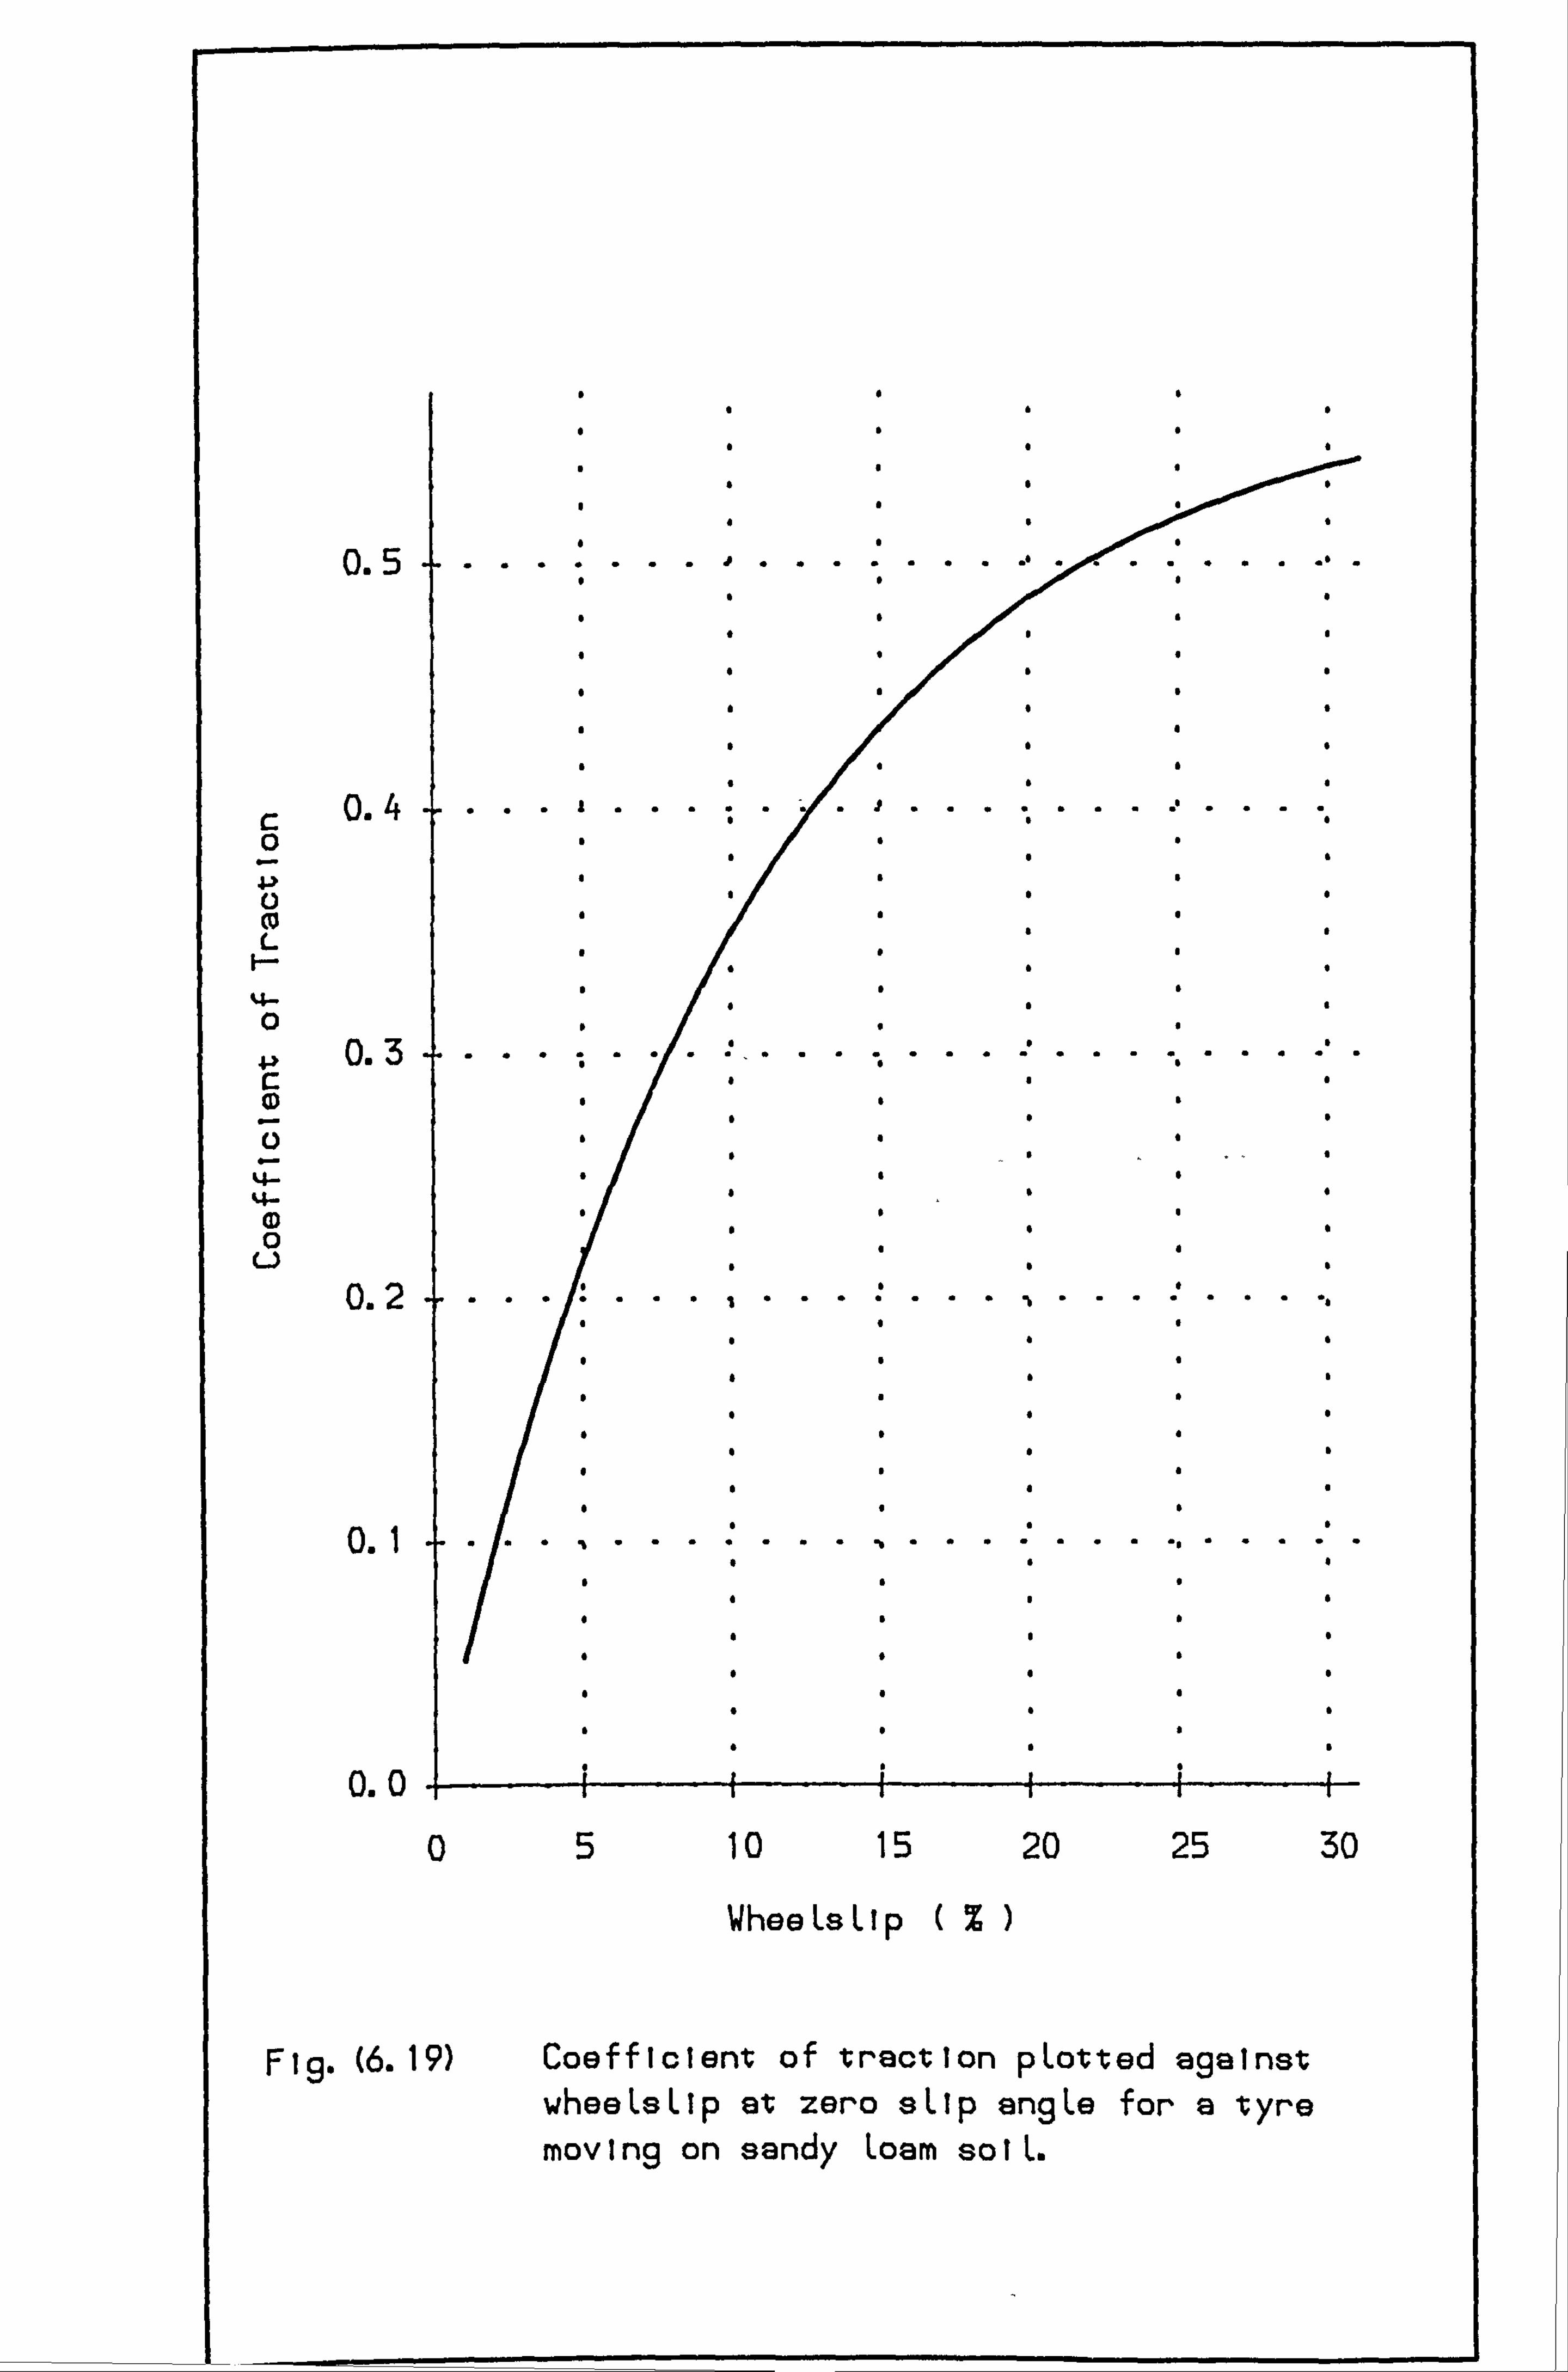
0.5
c 0.4 0 4J
L F-
q- 0 P 0.3
%4- 64- (D 0
u
0.2
0.1
05 10 15 20 25 30
Whee Ls L1p(%)
Fig. (6.19) Coefficient of traction pLotted against wheeLsLip at zero sLlp angLe for a tyre moving on sandy Loam solL.
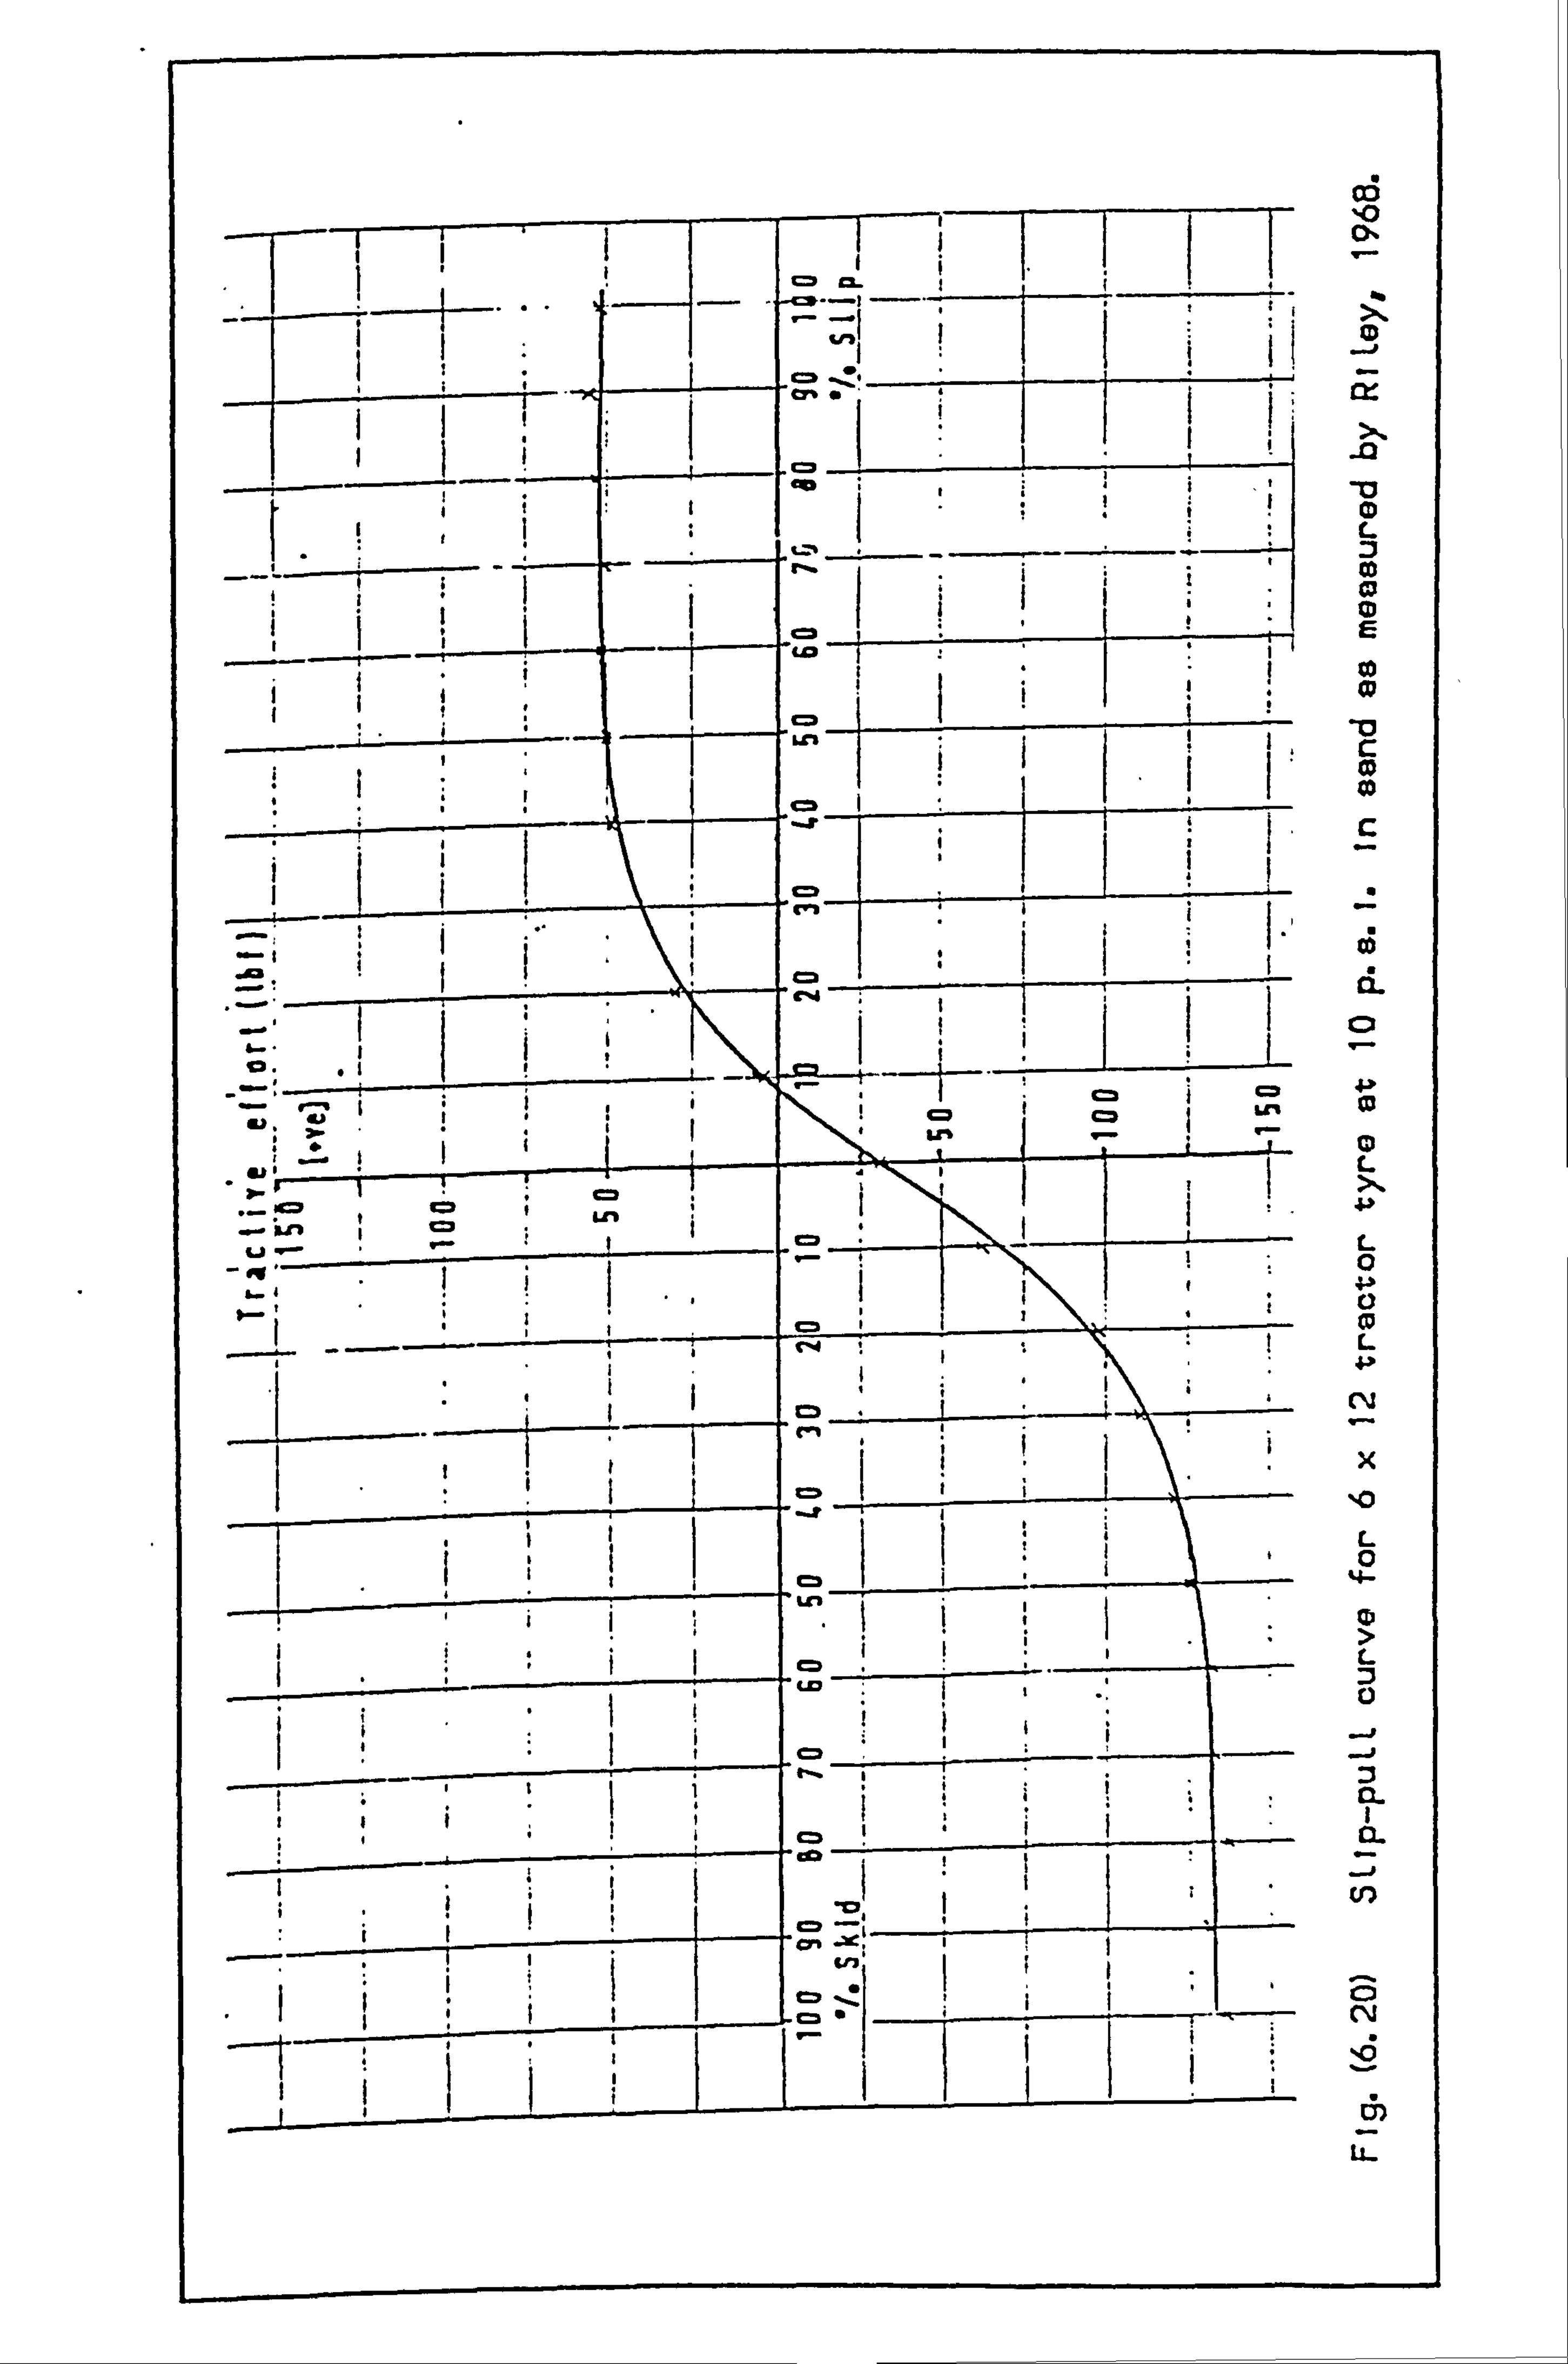
03 Ii --F ---1 10 ON
C= CL
CD
42% a ---i cr
i--- i Cc ;ti -0
L
--I t--
; Vý co C= call
Ii co IiI C=D
I
-- Lei c cm
C=p ------- C"
C=l dL Cl
cm LM Lr%
, 0.1 -I CD L
Ln C=p L
0
C=
C%j
cli x
iII C=l ii %0
ii C=3
11
(D > L
i cm :II.: 0
CL
IV) i C=
IiI C= 41 -,. C%j
1
0)
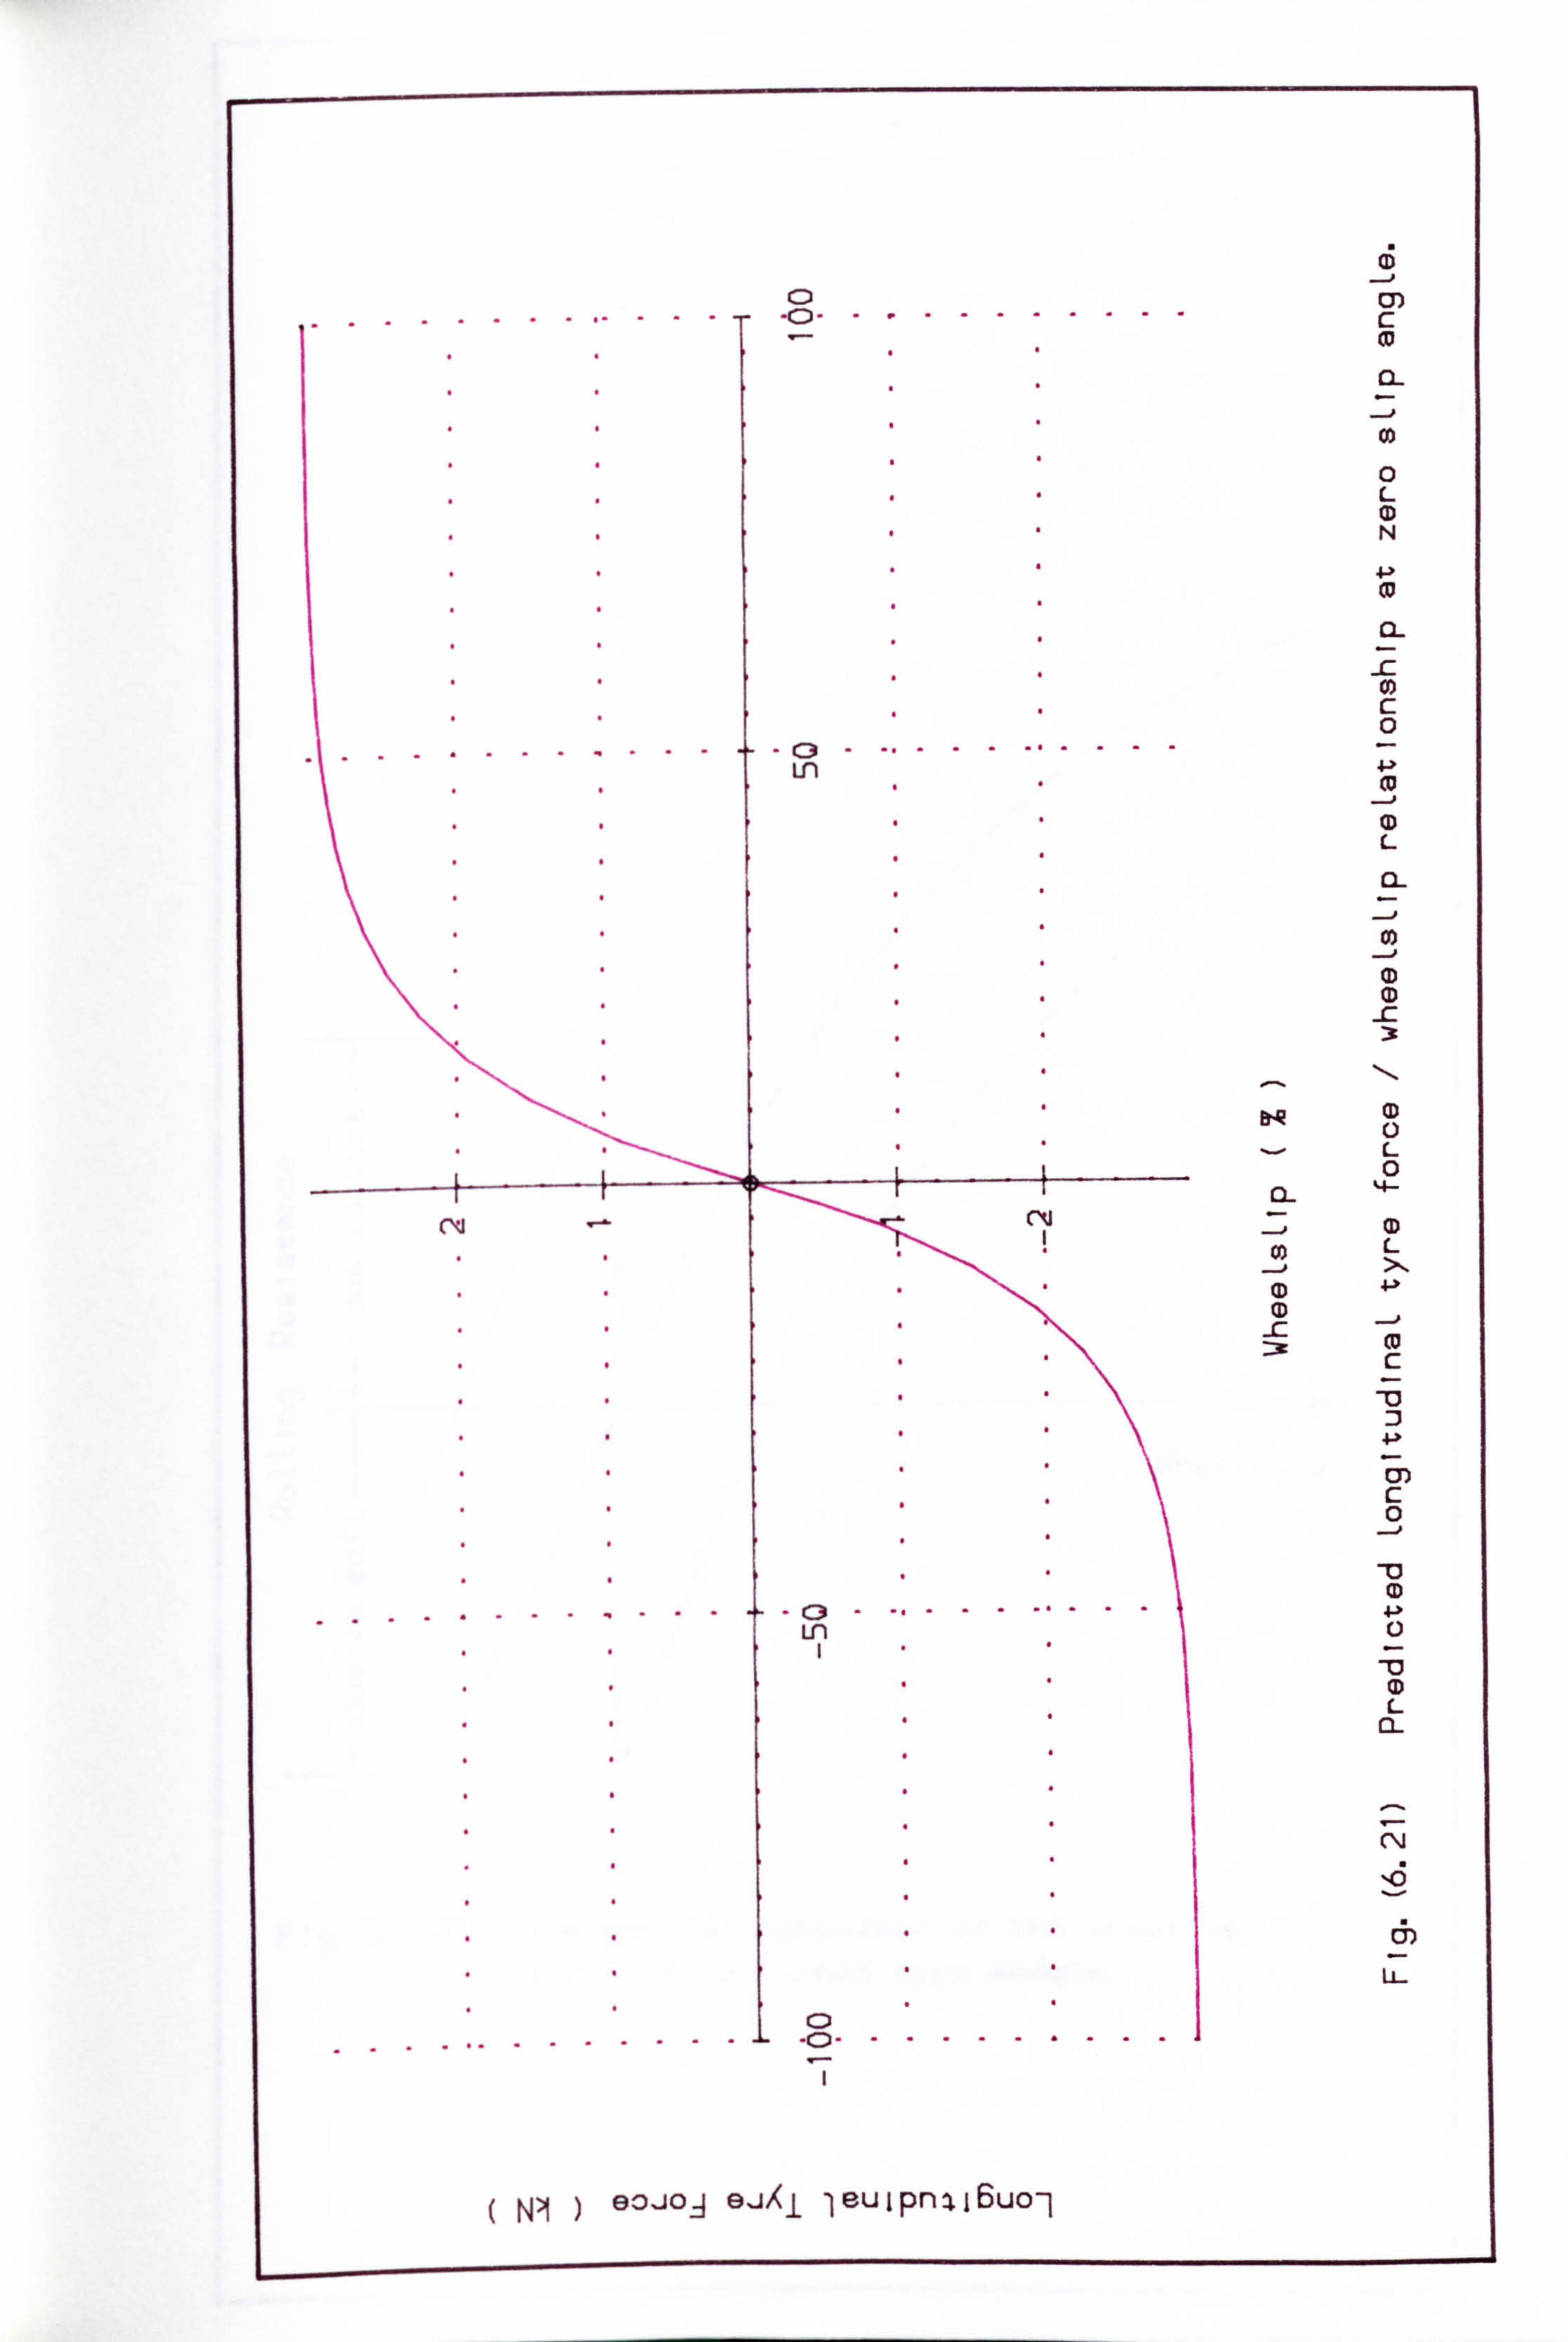
I
C5 j .......... ...
CD . (D .......... .
__ U) c CD
0 L CD N
4-ý CD
0)
0
............. .. Ln
__j
L
(D 0 L 0
Q- 4- cm (D I 0)
--. # L >1
(D CD
-C m c
4-),
m c 0
+... ...... ..
Ln I
L
CNJ
...... ....... 0
.L .0......... .
NI eojo-ý 9 -jXi lp-uipnil6uo-1
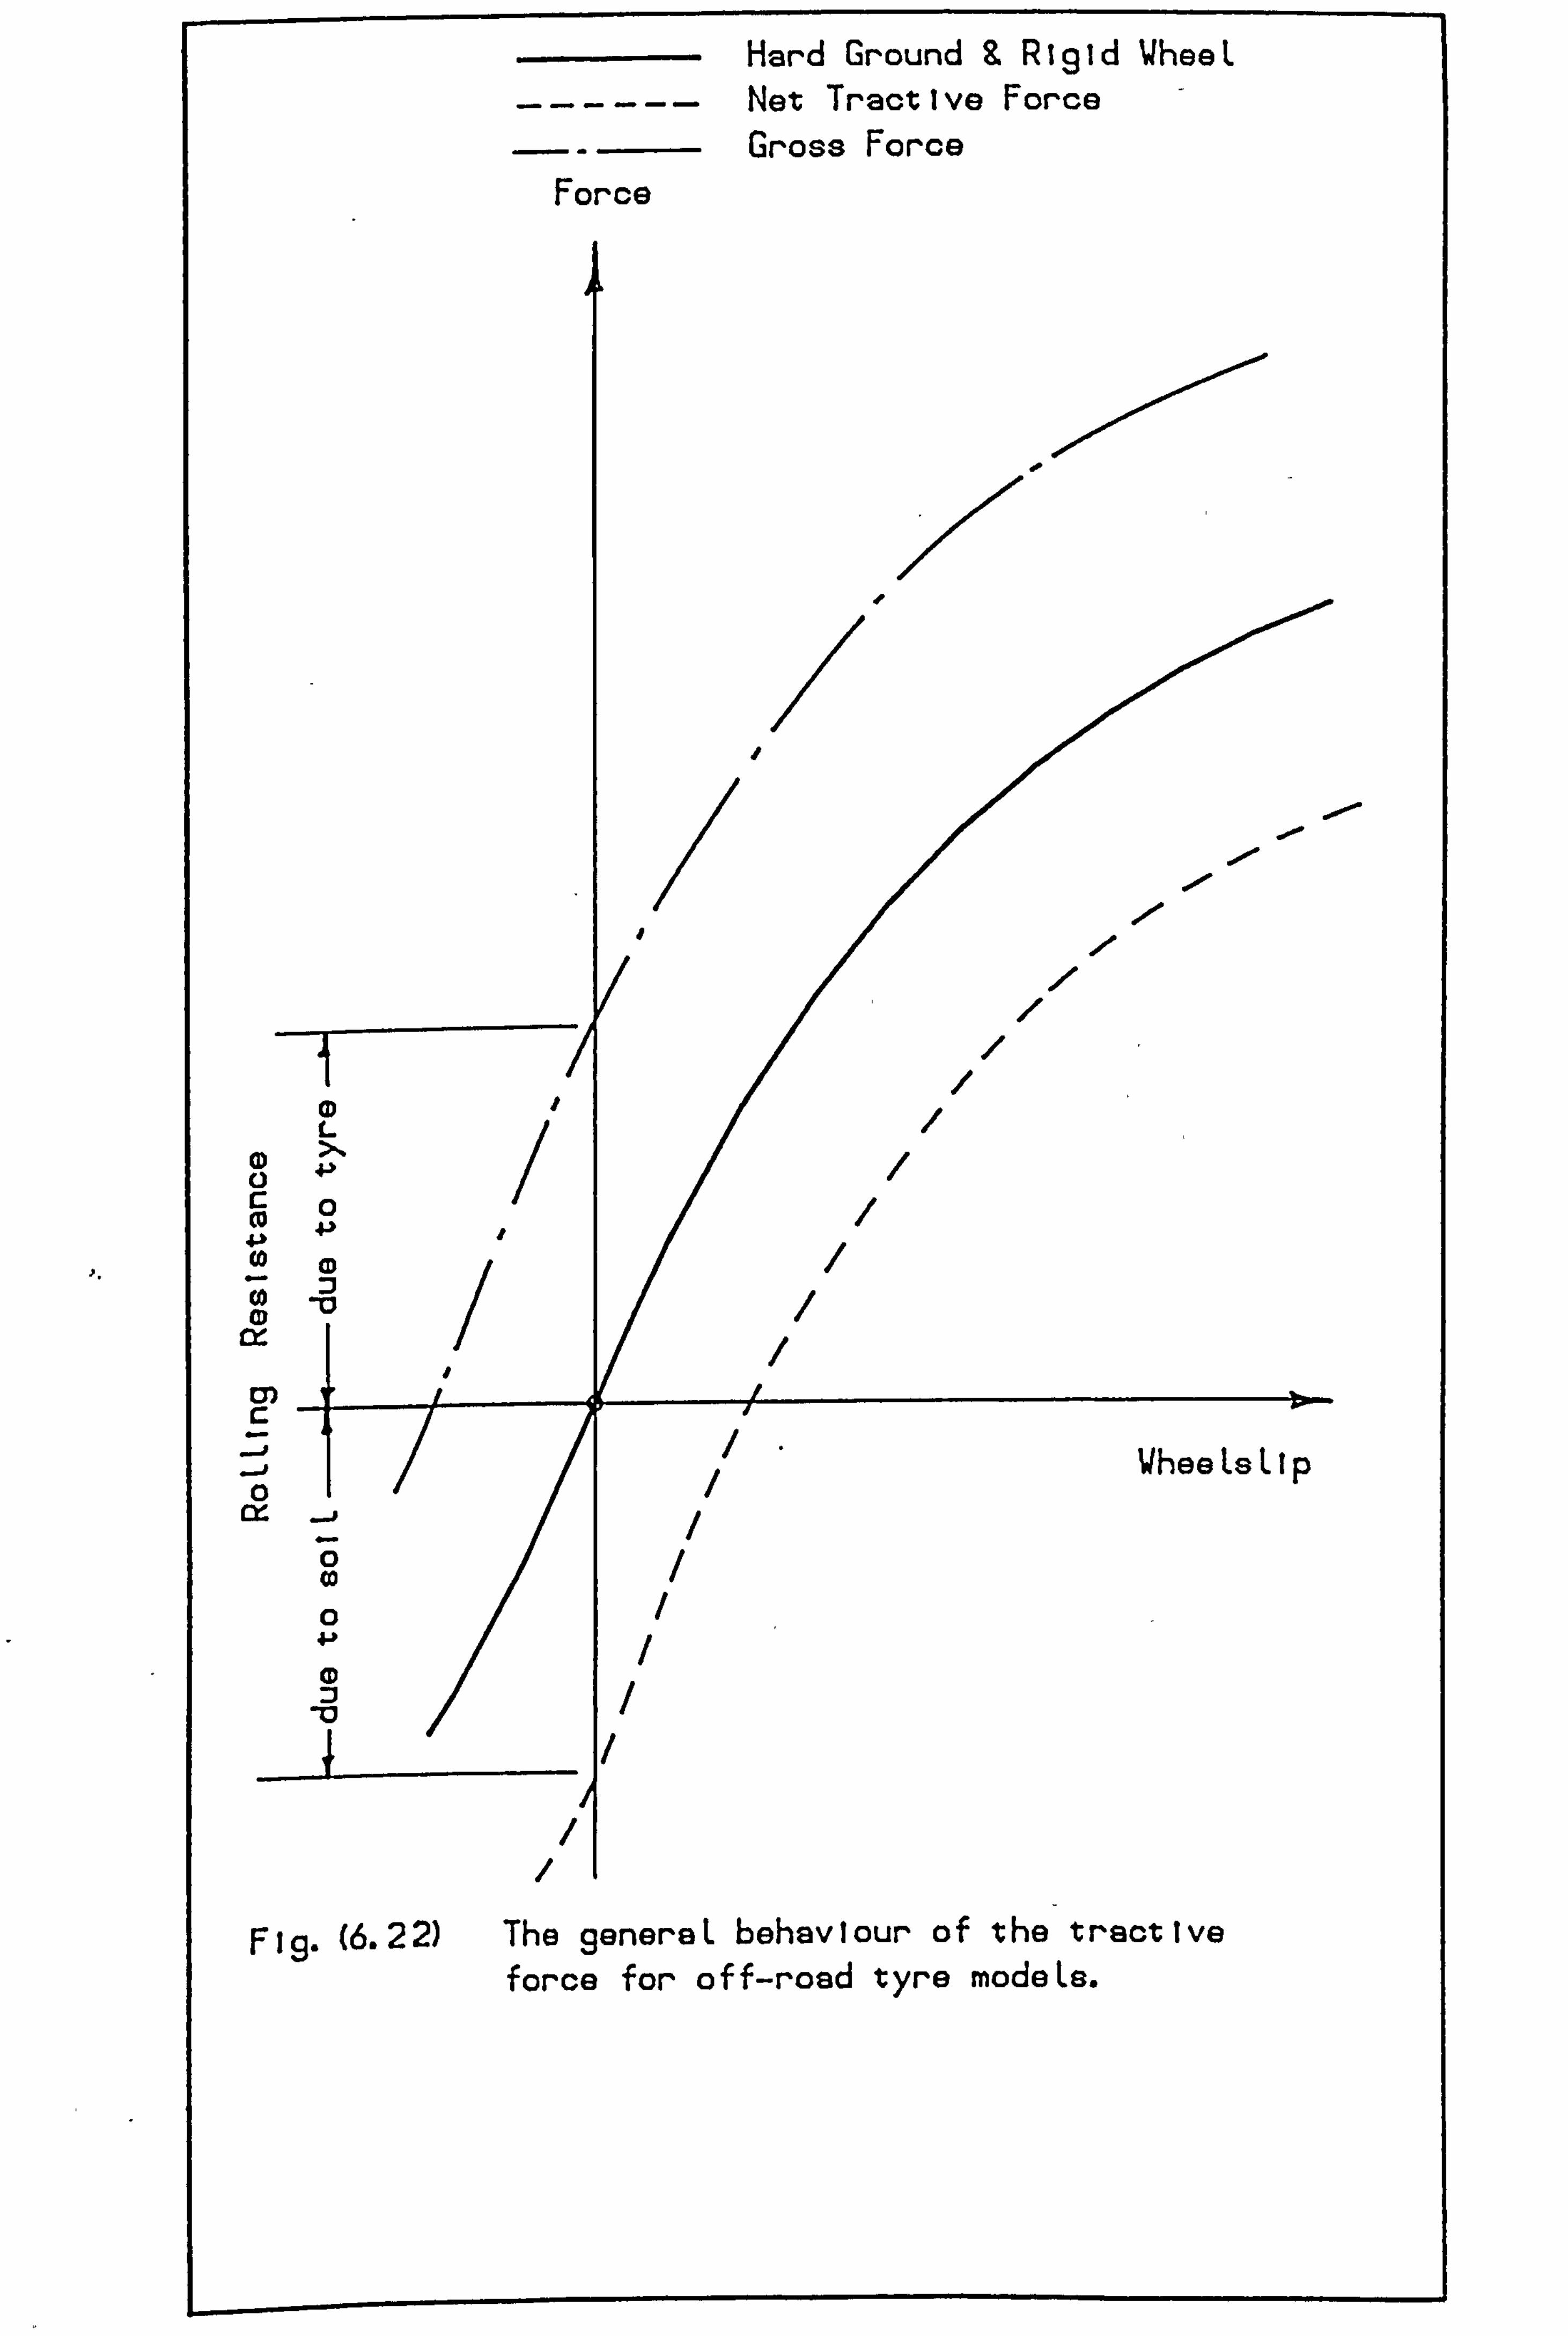
Hard Ground Rigid WheeL
------ Net Tractive Force Gross Force
Force
. 0,
L (D >1
0 Ca 4.,
4.3,1
(0 CD ;
-0 CD
m C
z
WheeLsLlp 0
CO 0 CD
Fig. (6.22) The generaL behaviour of the tractive force for off-road tyre modeLs.
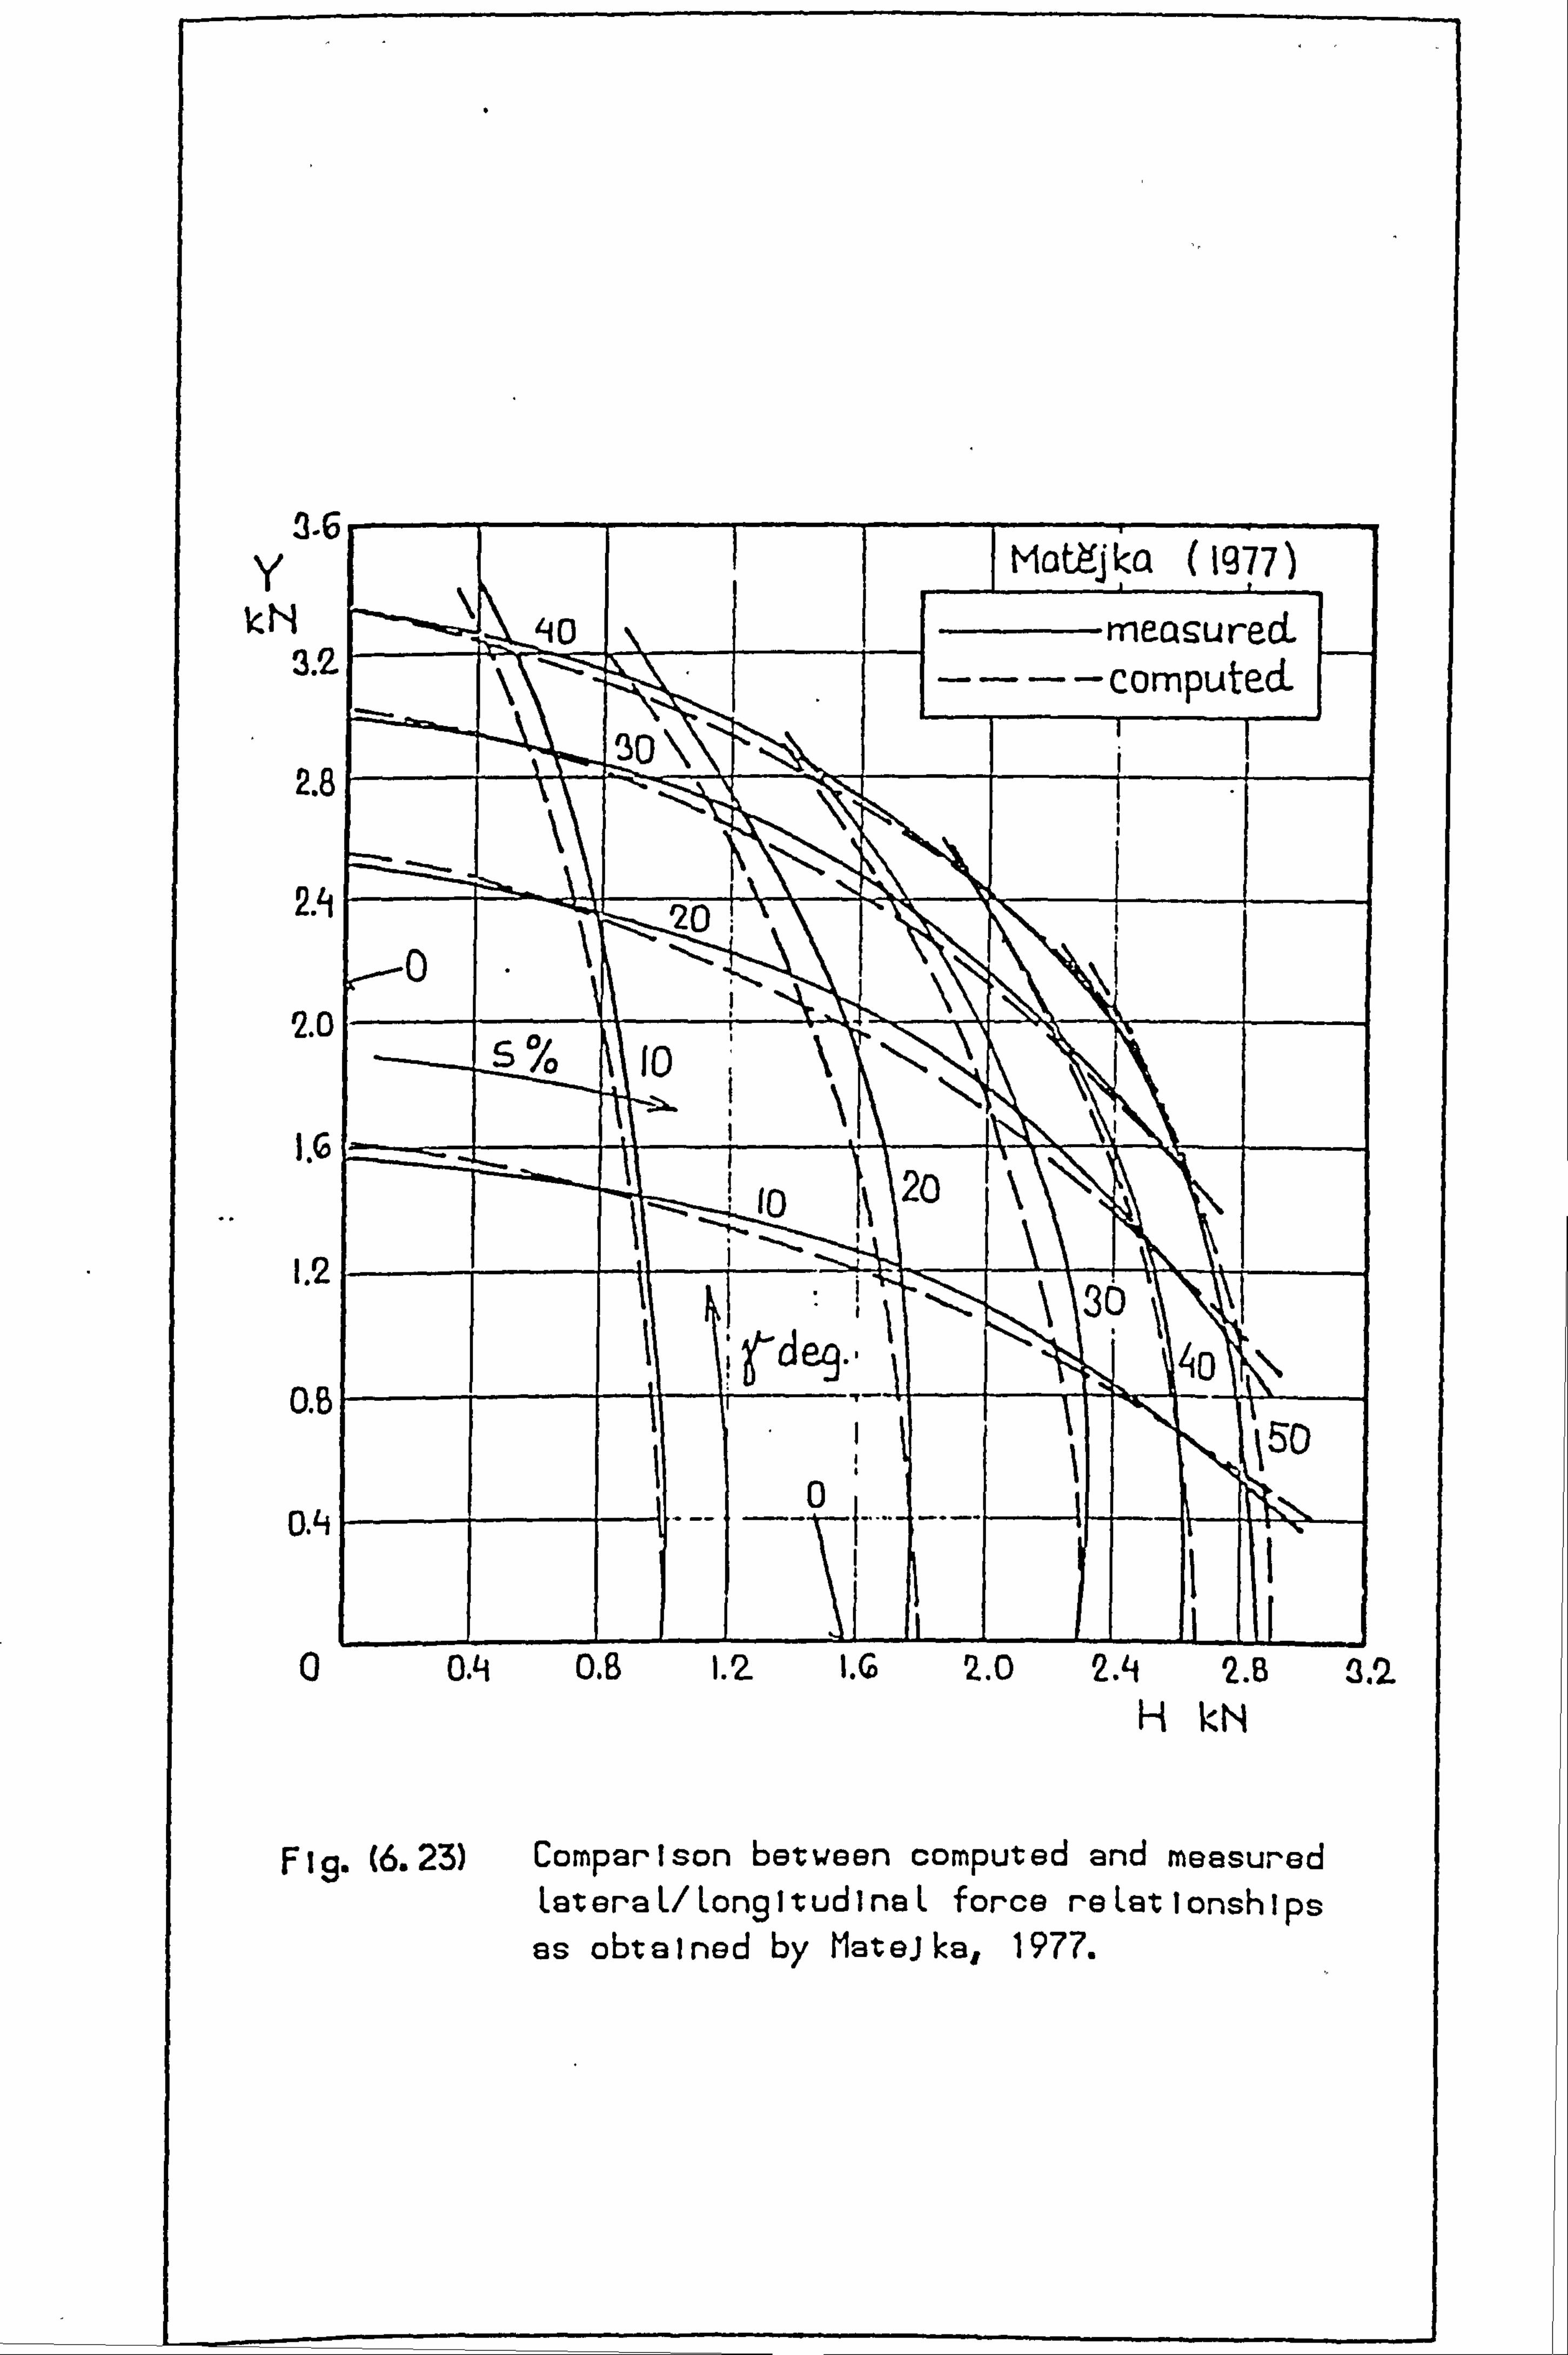
A rl
j-u y
ICN 3.2
2. E
2A
2. C
I. G
1.2
0.6
0. ii
0
1977)
-measured computed
20
20 10
\1 40 0
ýSD
O. B 1.2 W 2.0 2. B k, N
F 19. (6.23) Comparison between computed and measured LateraL/LongitudinaL force reLationships as obtained by Mateika, 1977.
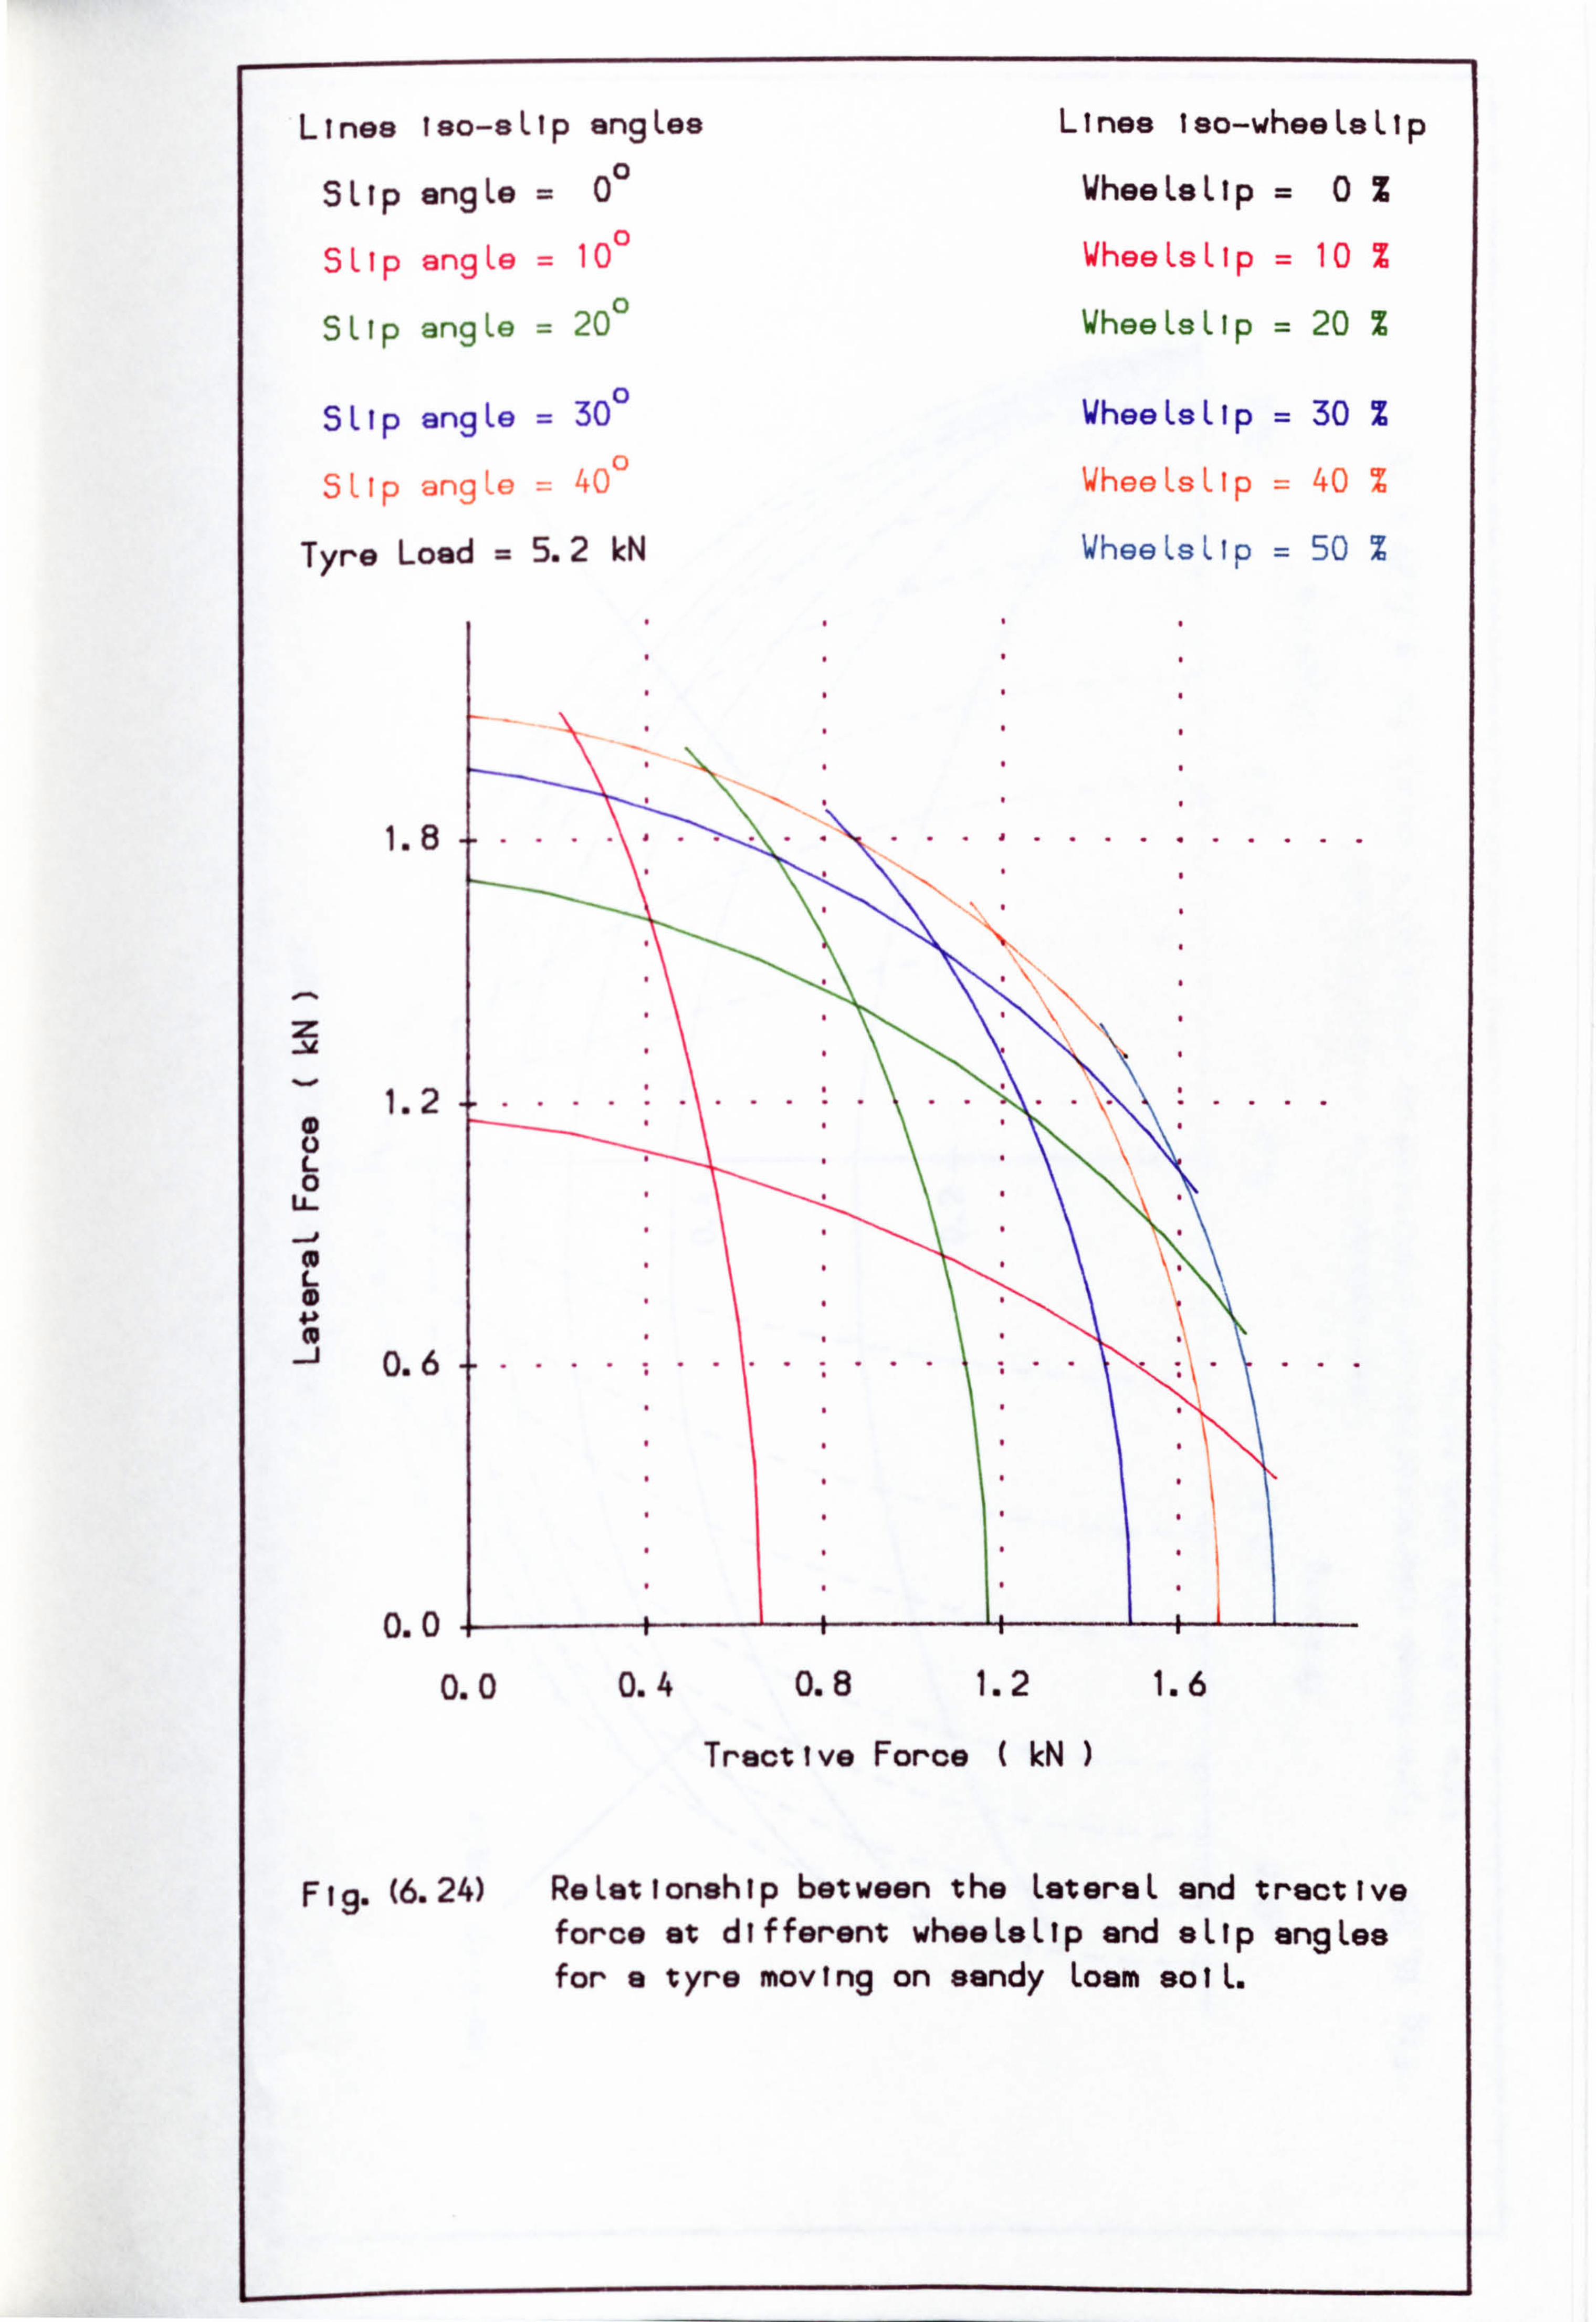
Lines Iso-sLip angLes
SLIp angLe 00
SLIp angLe 10 0
SLIp angLe 20 0
SUp angLe 300 C) 40
Tyre Load = 5.2 M
1.8
0 0 L 0
LL-
L 0 4-P 0
-i
1.2
0.6
0.0
Lines iso-wheeLeLip
Whee Le LIp0Z
WheeLsLip 10 %
WheeLaLlp 20 %
WheeLsLip = 30 %
Wheel, sLlp = 40 %
Whee L-9 LIp= 50 %
Tractive Force ( kN )
Fig. (6.24) ReLationship between the LetereL and tractive force at different wheeLeLlp and eLlp angLes for a tyre moving on sandy Loam soiL.
0.0 0.4 0.8 1.2 1.6
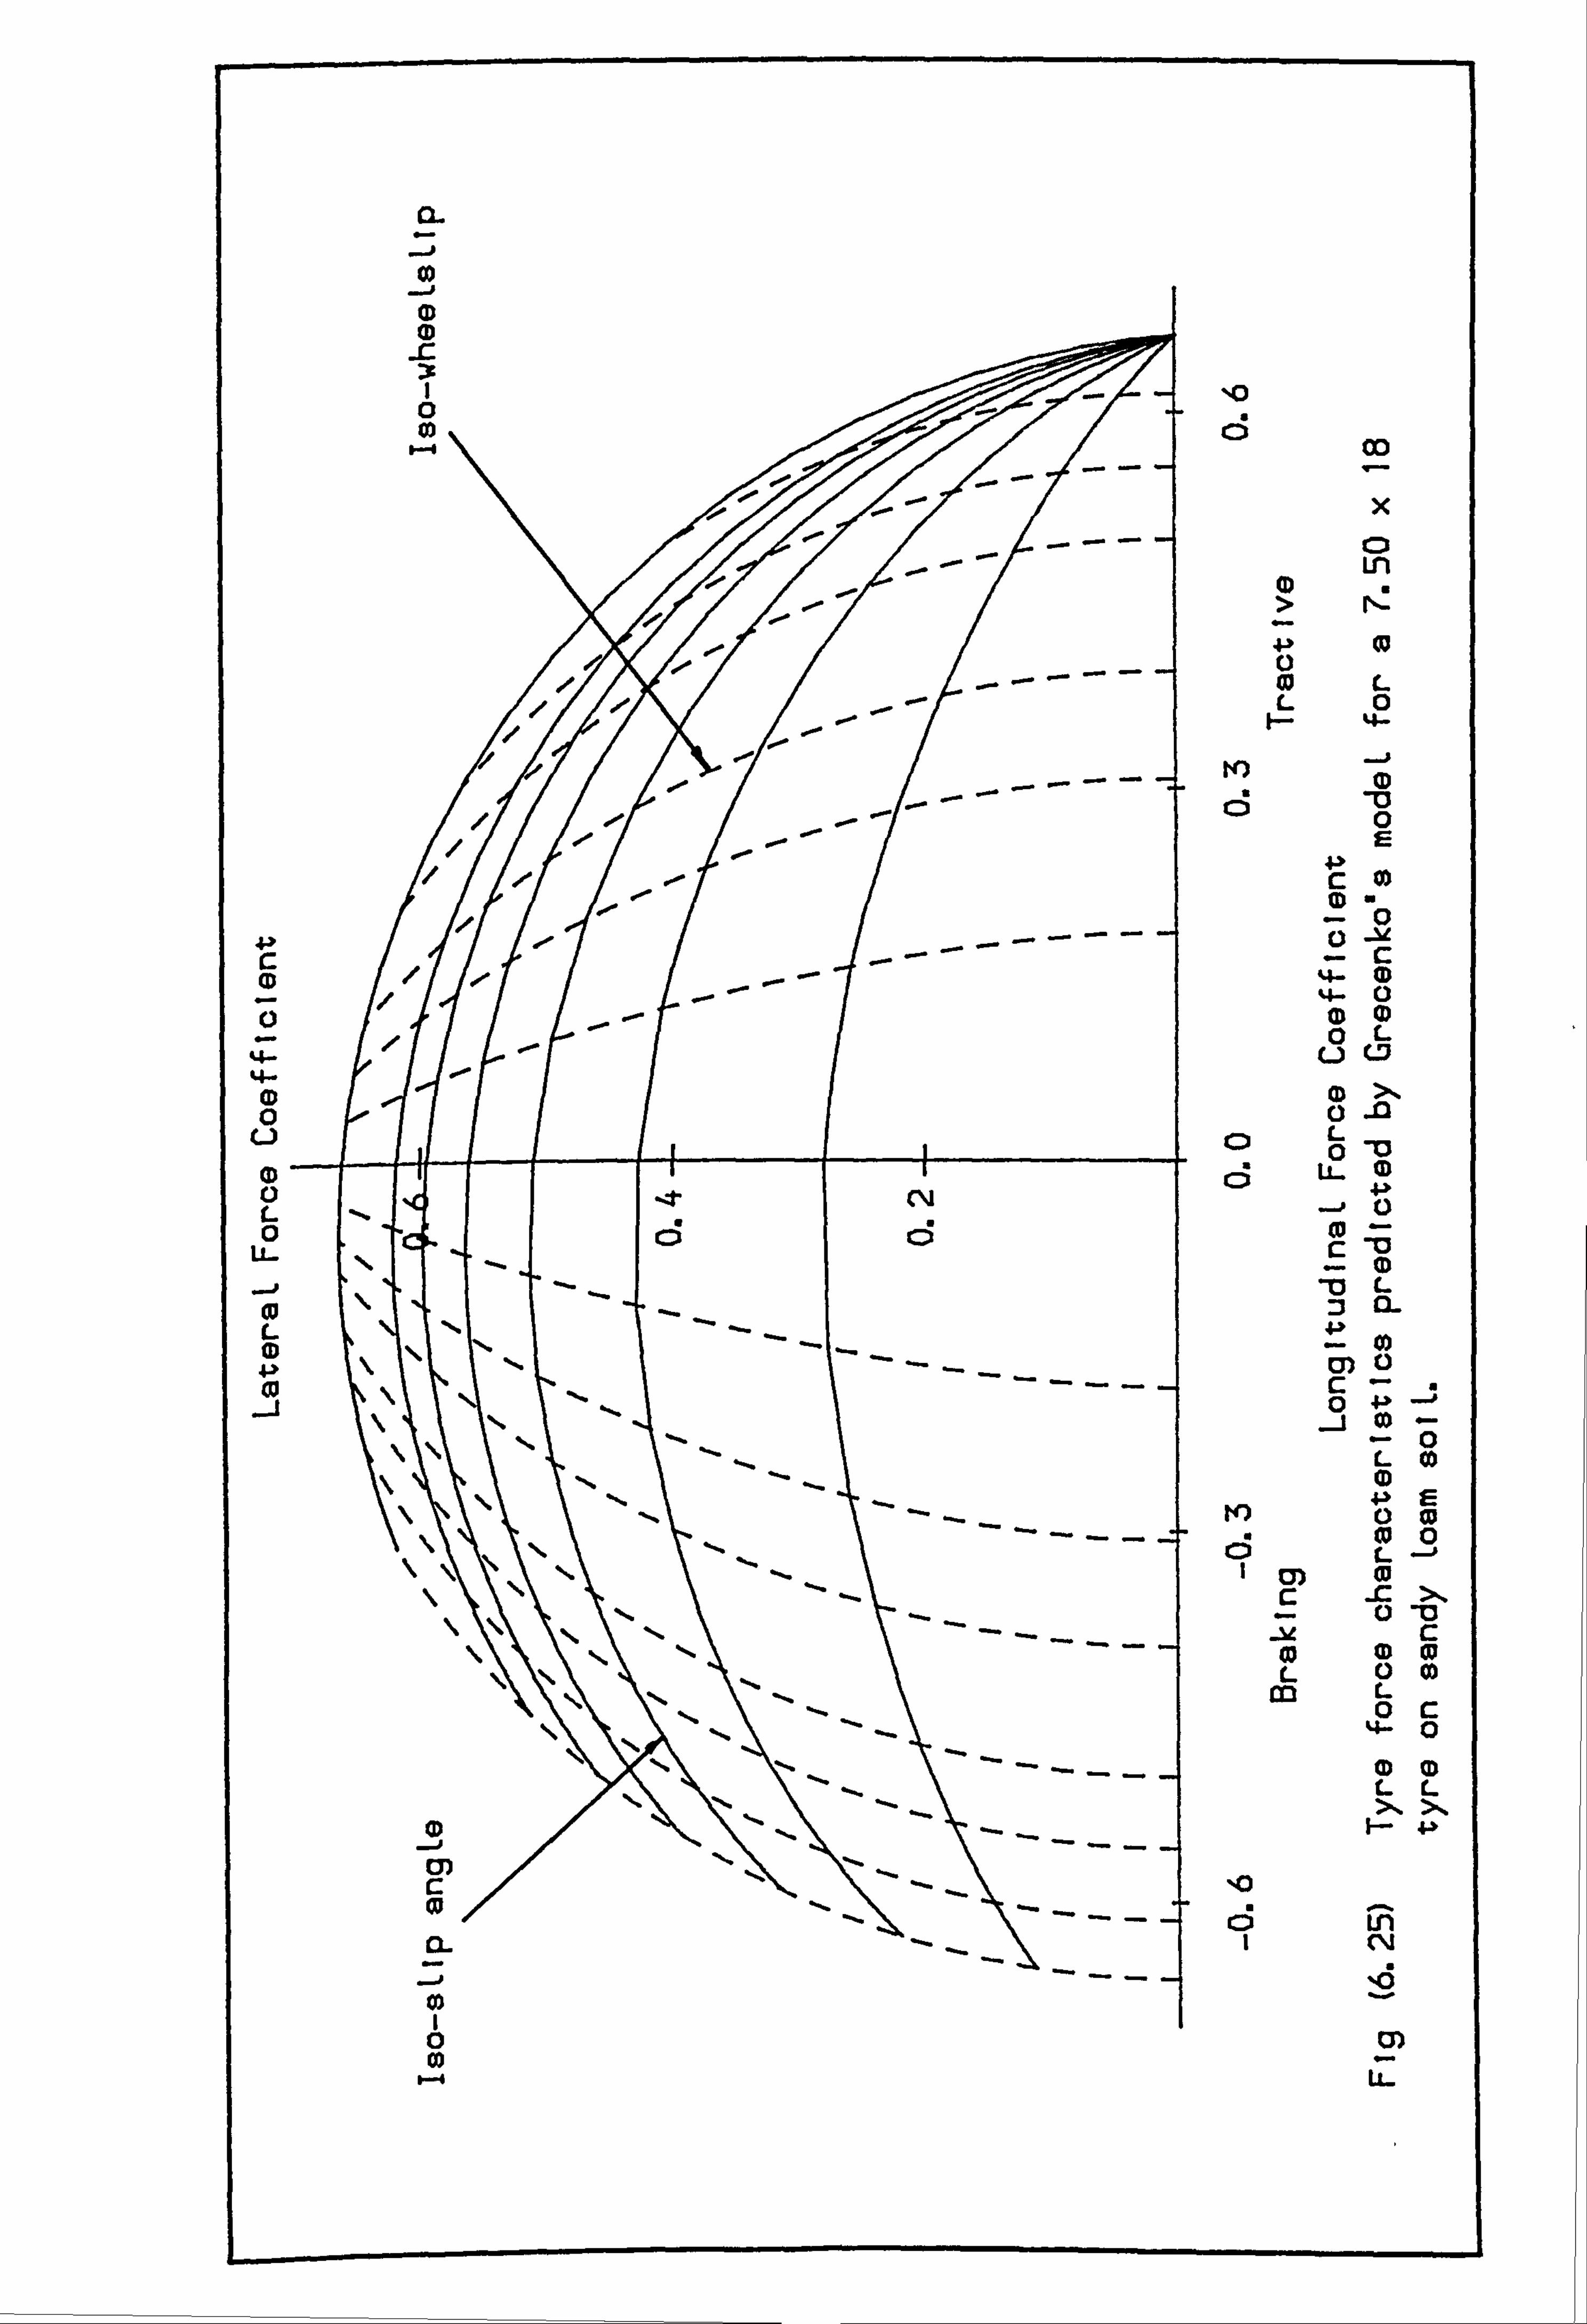
0 a) r
%0 u Cl Oo
x -- -- Cl - Ln
> 4-31 0 tv L L 0
(D 0
4> c w " 1-1 0
2 c . c (D 14- CD %4- 0 CD 0)
oe 0 L 4- L3
4- (D (D 0 0 -0 L)
I 1 0 L 0 -0
1 C5 U- m
L CM
--j 4> a
0 C; CD c U-
(a L (1) 0)
C
w L
0 -. 0
s -C >1 .
CD (a L
m 0 L
0
0 c 4- 0
CD m L L
c 10 CD
0 Ln a- I C\l
u 0
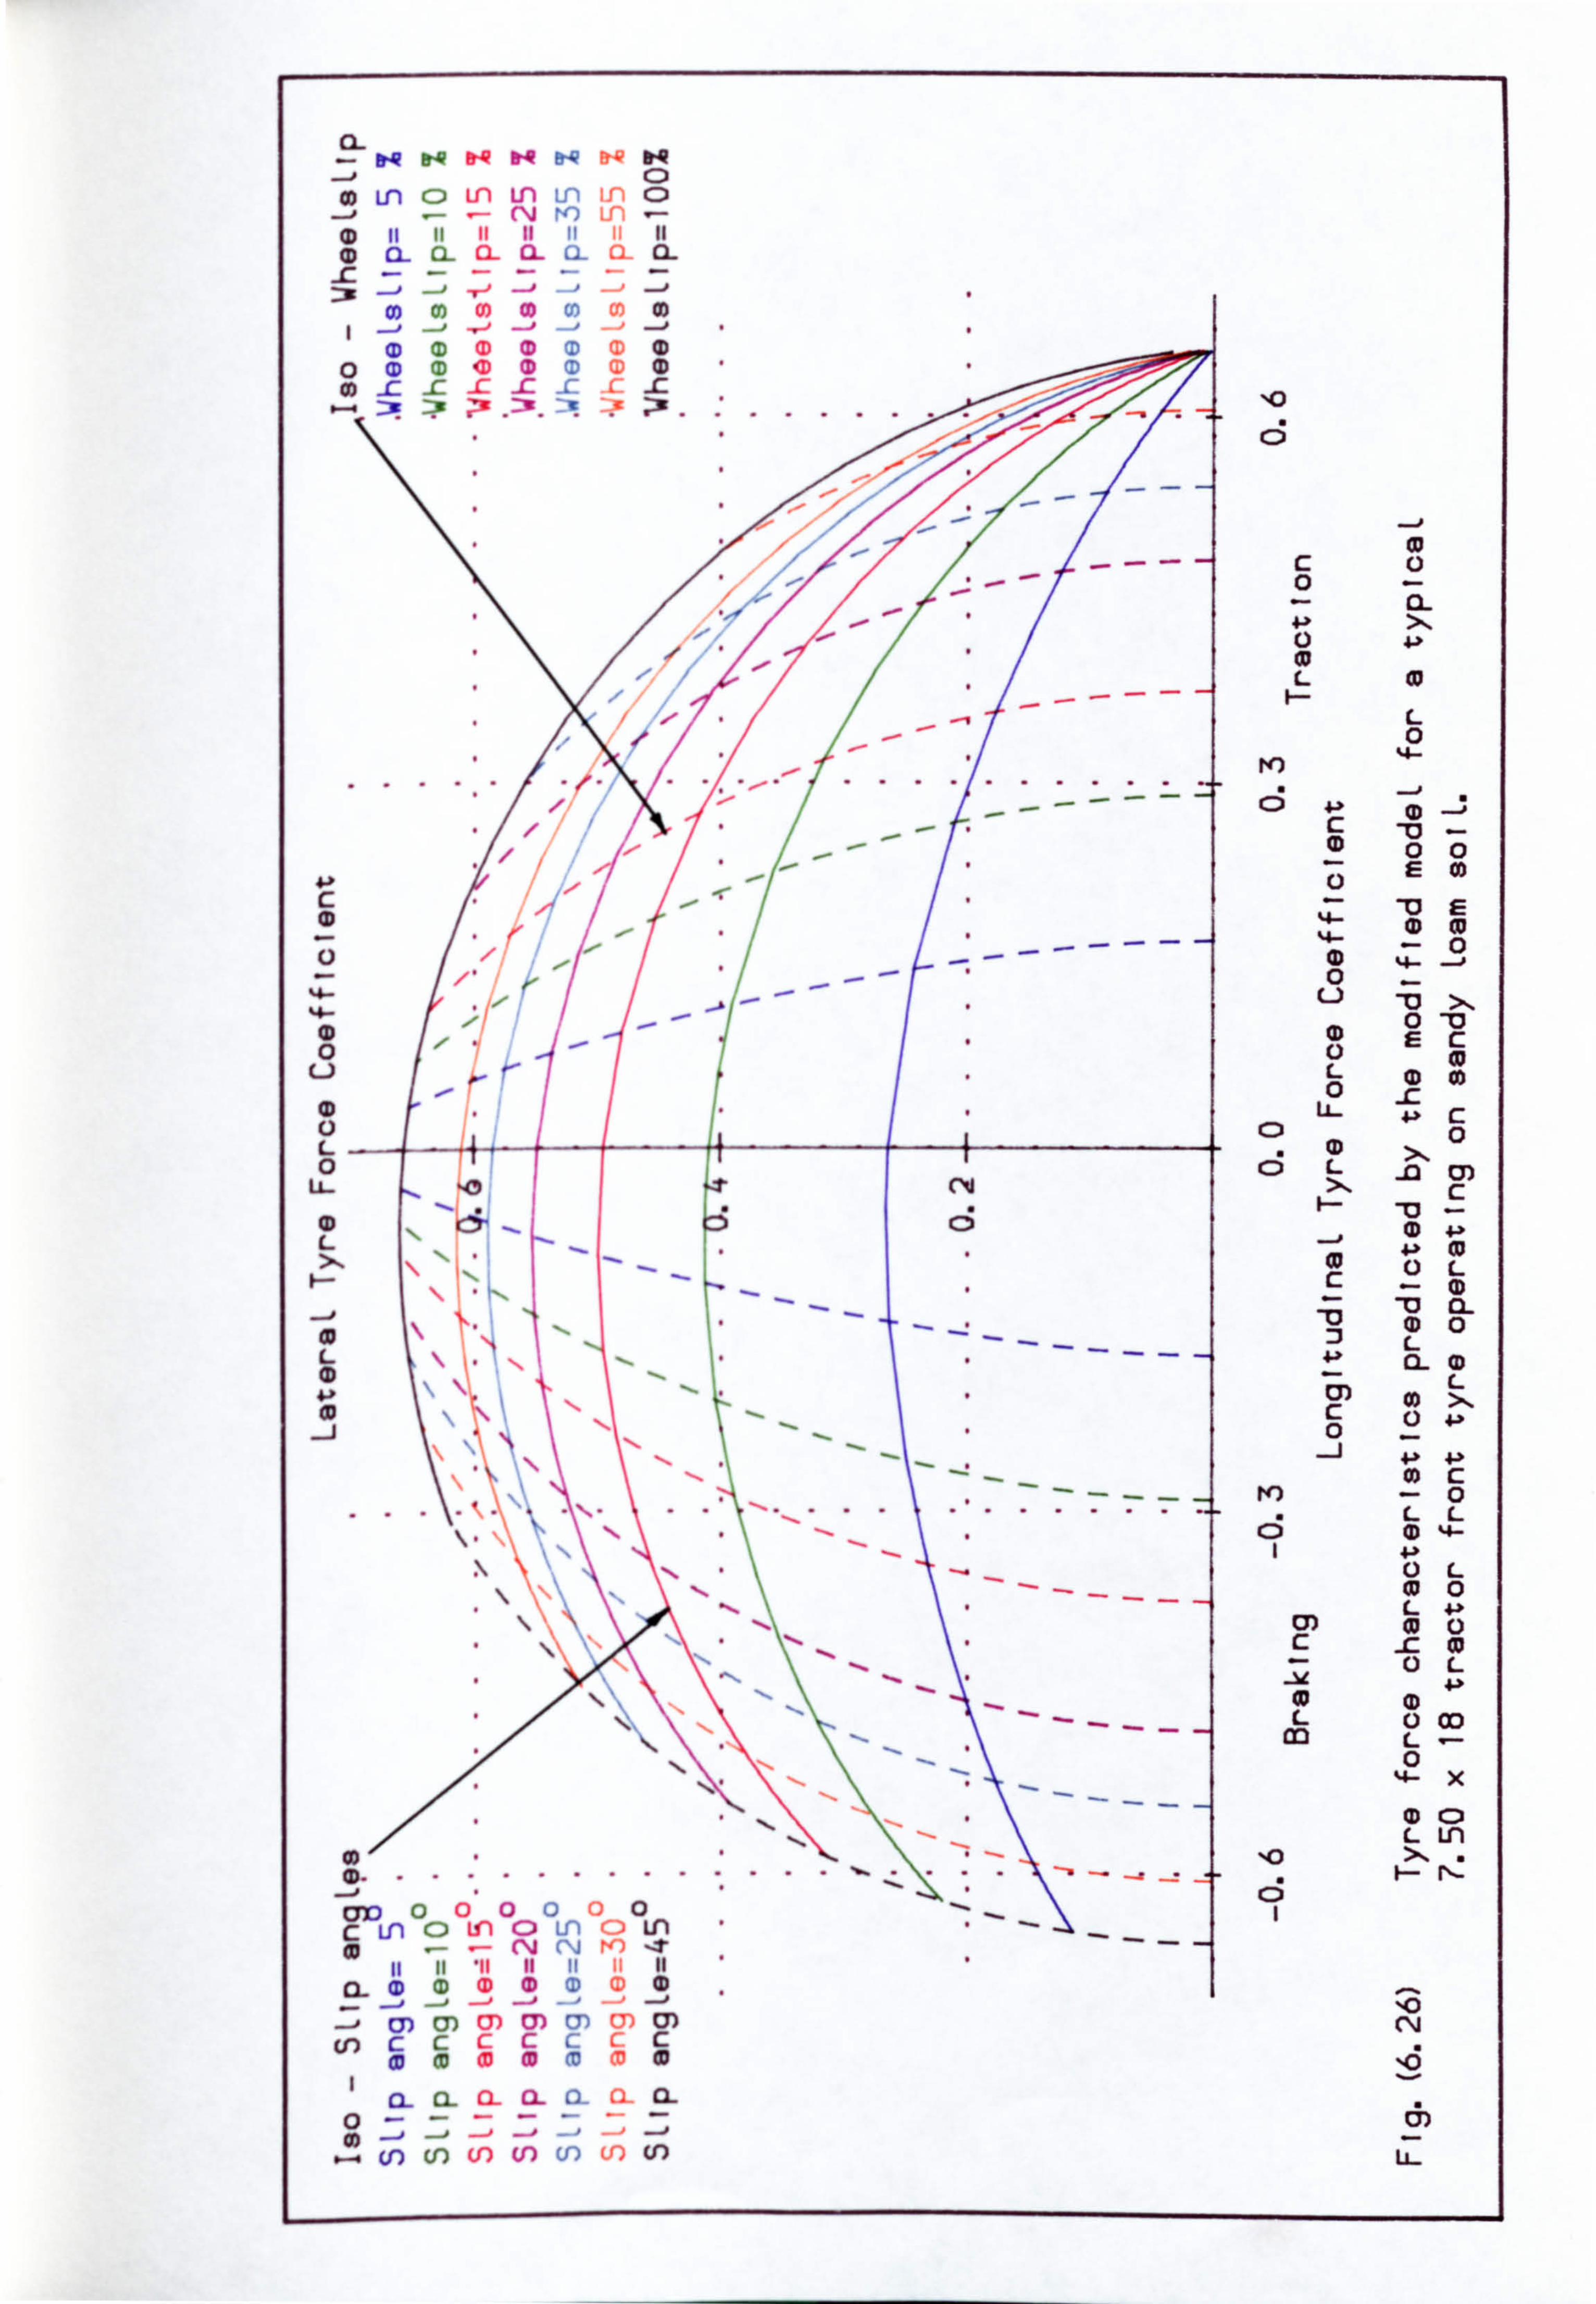
CL C)
m Ln C) Ln Ln Ln CD --. P -- C%i
11 11 11 if CL CL CL CL CL (a a-
(D CD M0 (D CID CD 0 CD (D <D CD a) cl, 0 CD C -C -C -C -C I X
- : 3ý ........
C;
c 0 0
L F-
L 0
el - ....... C) 4J
c -0 - CD 0 0
CD m 0
-j /*
' 0 - t u -0
>1 %4- 0 -0 CD 0 E c
u L CD w CD 0
LL- c L
C) ID 0
>1 0 (D L (7) CN c C; CD 4. ). L -0
L c .2 (D
m a- 0 L
0 L CL (D
cn 0) L > c
0 1 4-ý 0 c
L 0 L
CD 4) 44
L ---
ca 0 N. L m
c L
L 0 co m L
0 X
(D
L Ln 10 >1
Eno 000000 C Ln CD Lf) a Ln c) Ln C%j ("i t1r) 11 11 11 -ýr 11 a- (D 0 a) (D (D (D CD
1 . 71 CF) a) CY) CF) U) a) CY) 0
C"i (n c cCCCC C
0 m00mm 0 16 1 CL CL Q- 0.0- a- Q- 0
-: 1 . 7,71 : 1- m Lo (f) cn U) (f )tr (J) LL-
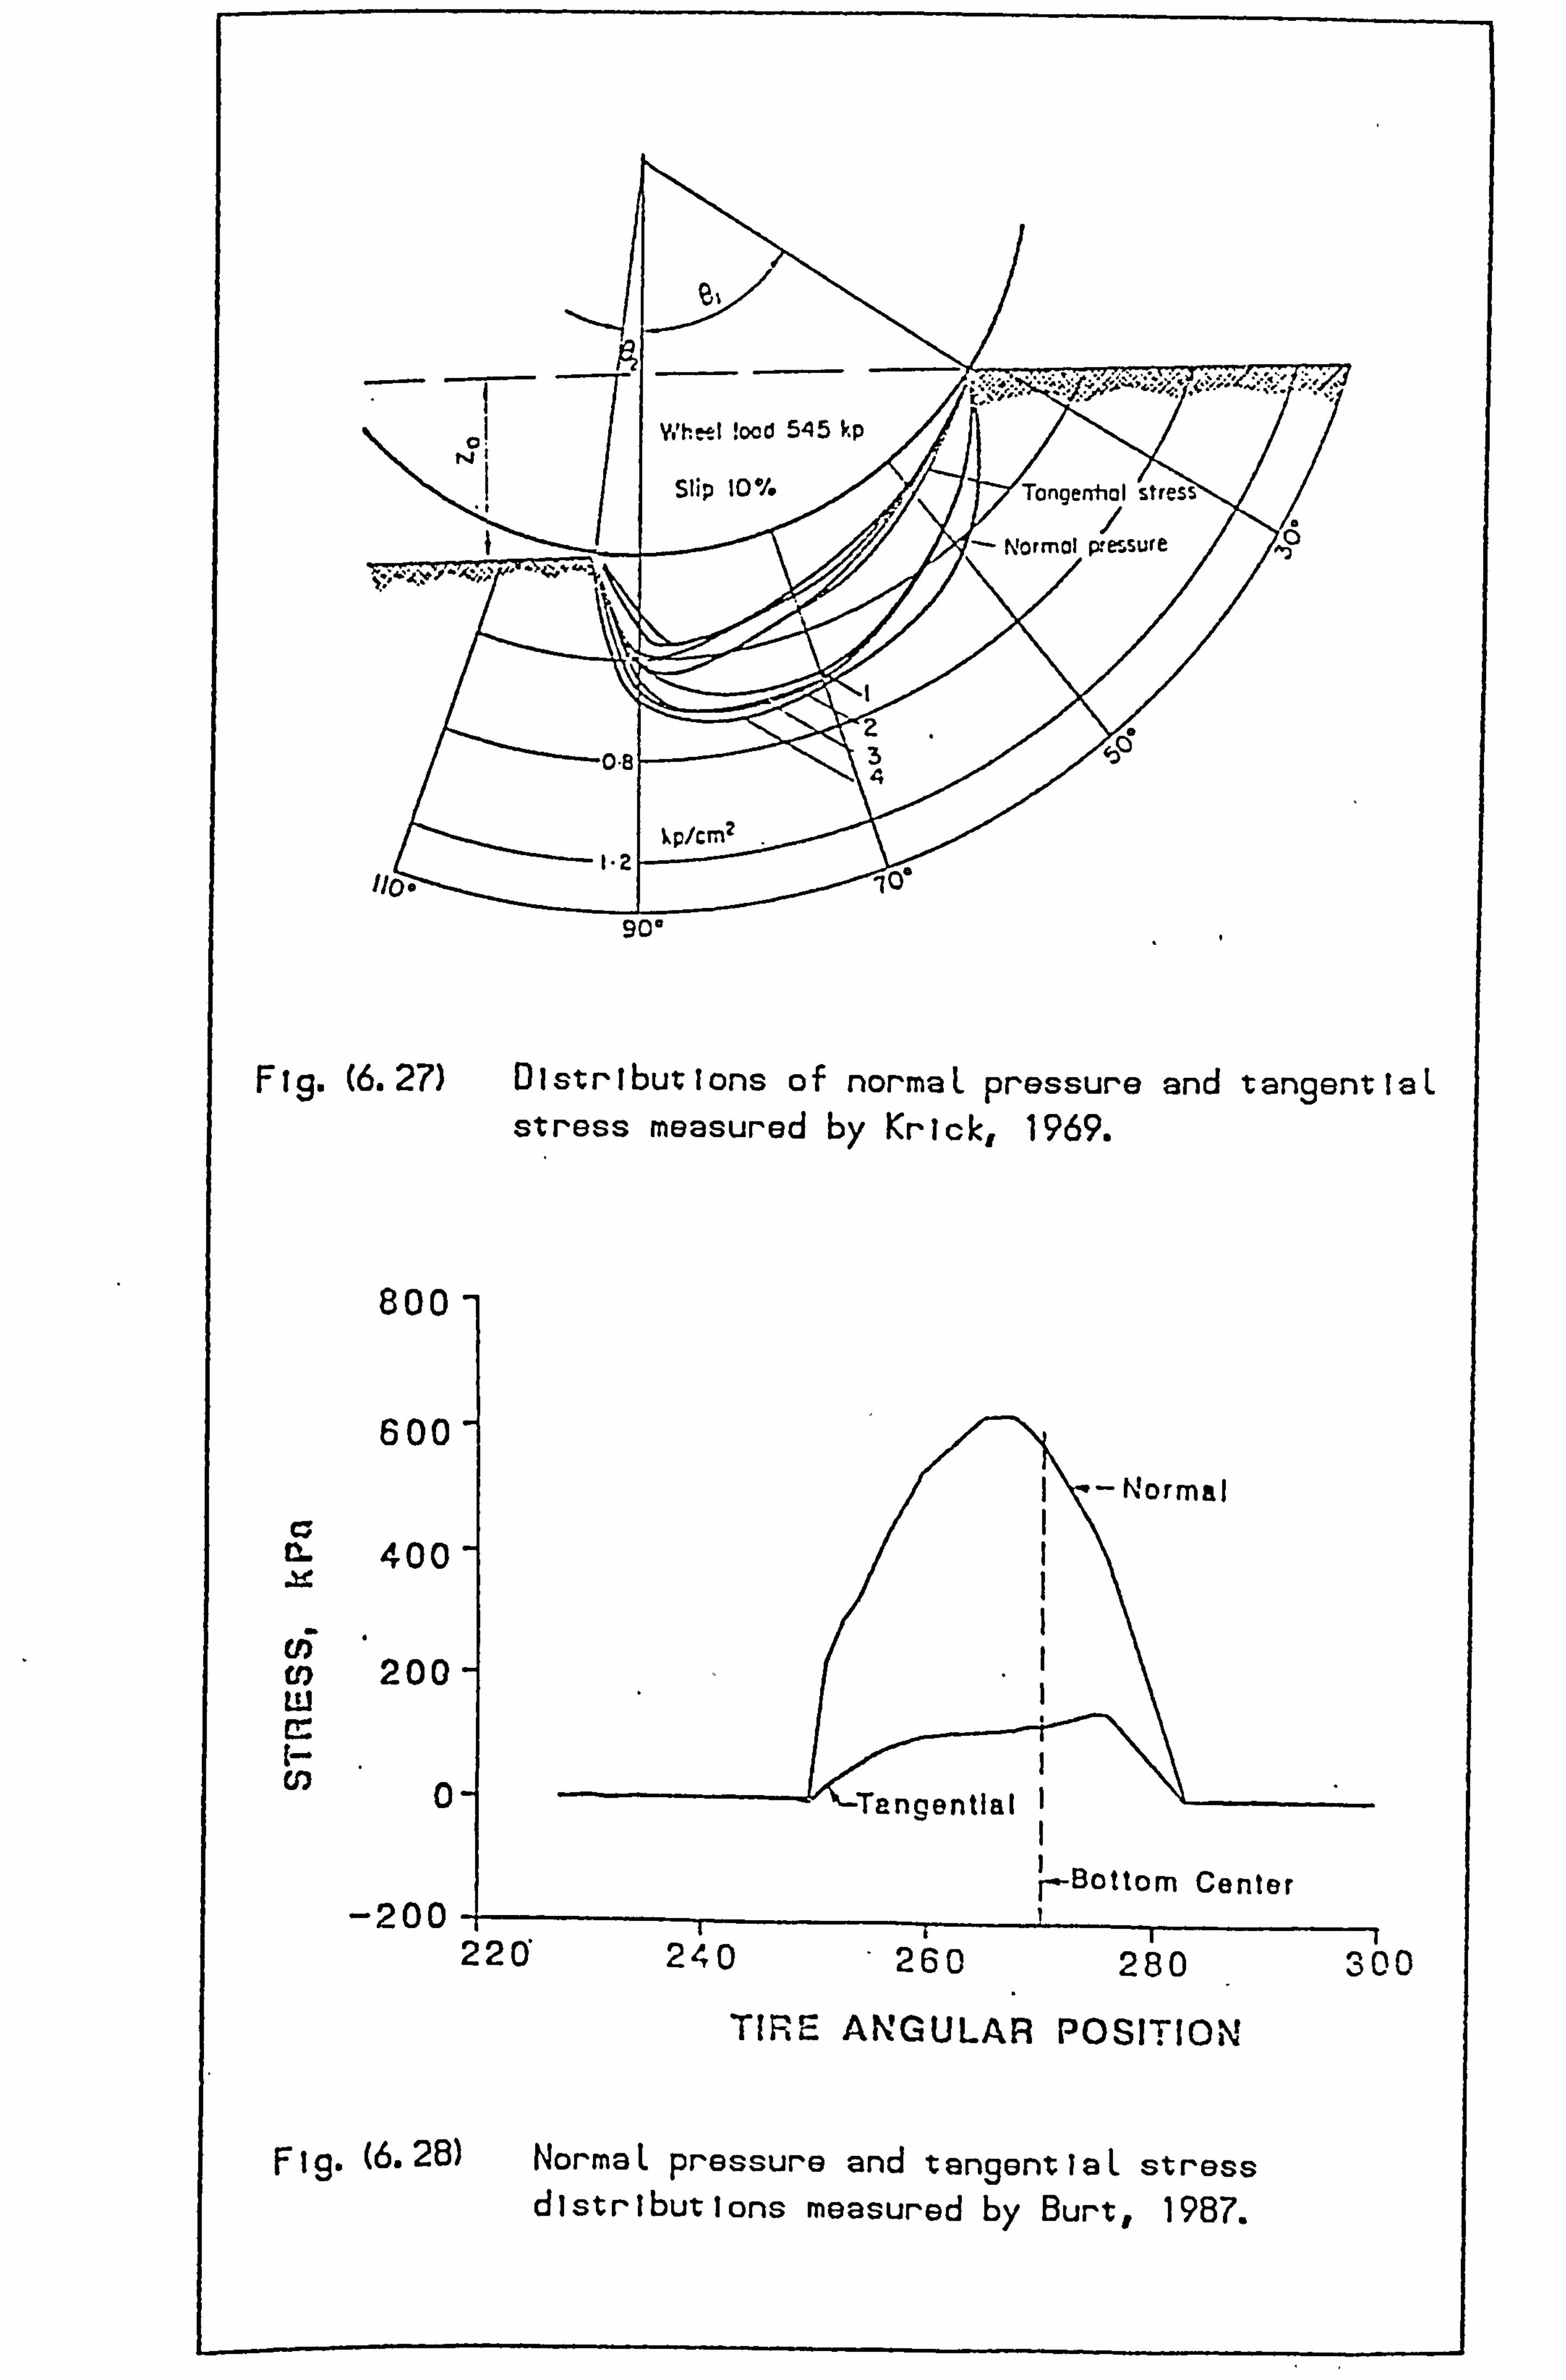
(6.27) Distributions of normaL pressure and tangentiaL stress measured by Krick, 1969.
800-
600-
Normal c; IL 400- A-0
U) 200- U. 1 CC U) 0- --j Tangential I
I Ir-Bottom Center
-200 11 22Y 240 260 280
TIRE ANGULAR POSITION
"I )00
(6.28) NormaL pressure and tangentiaL stress distributions measured by Burt, 1987.
qC)a
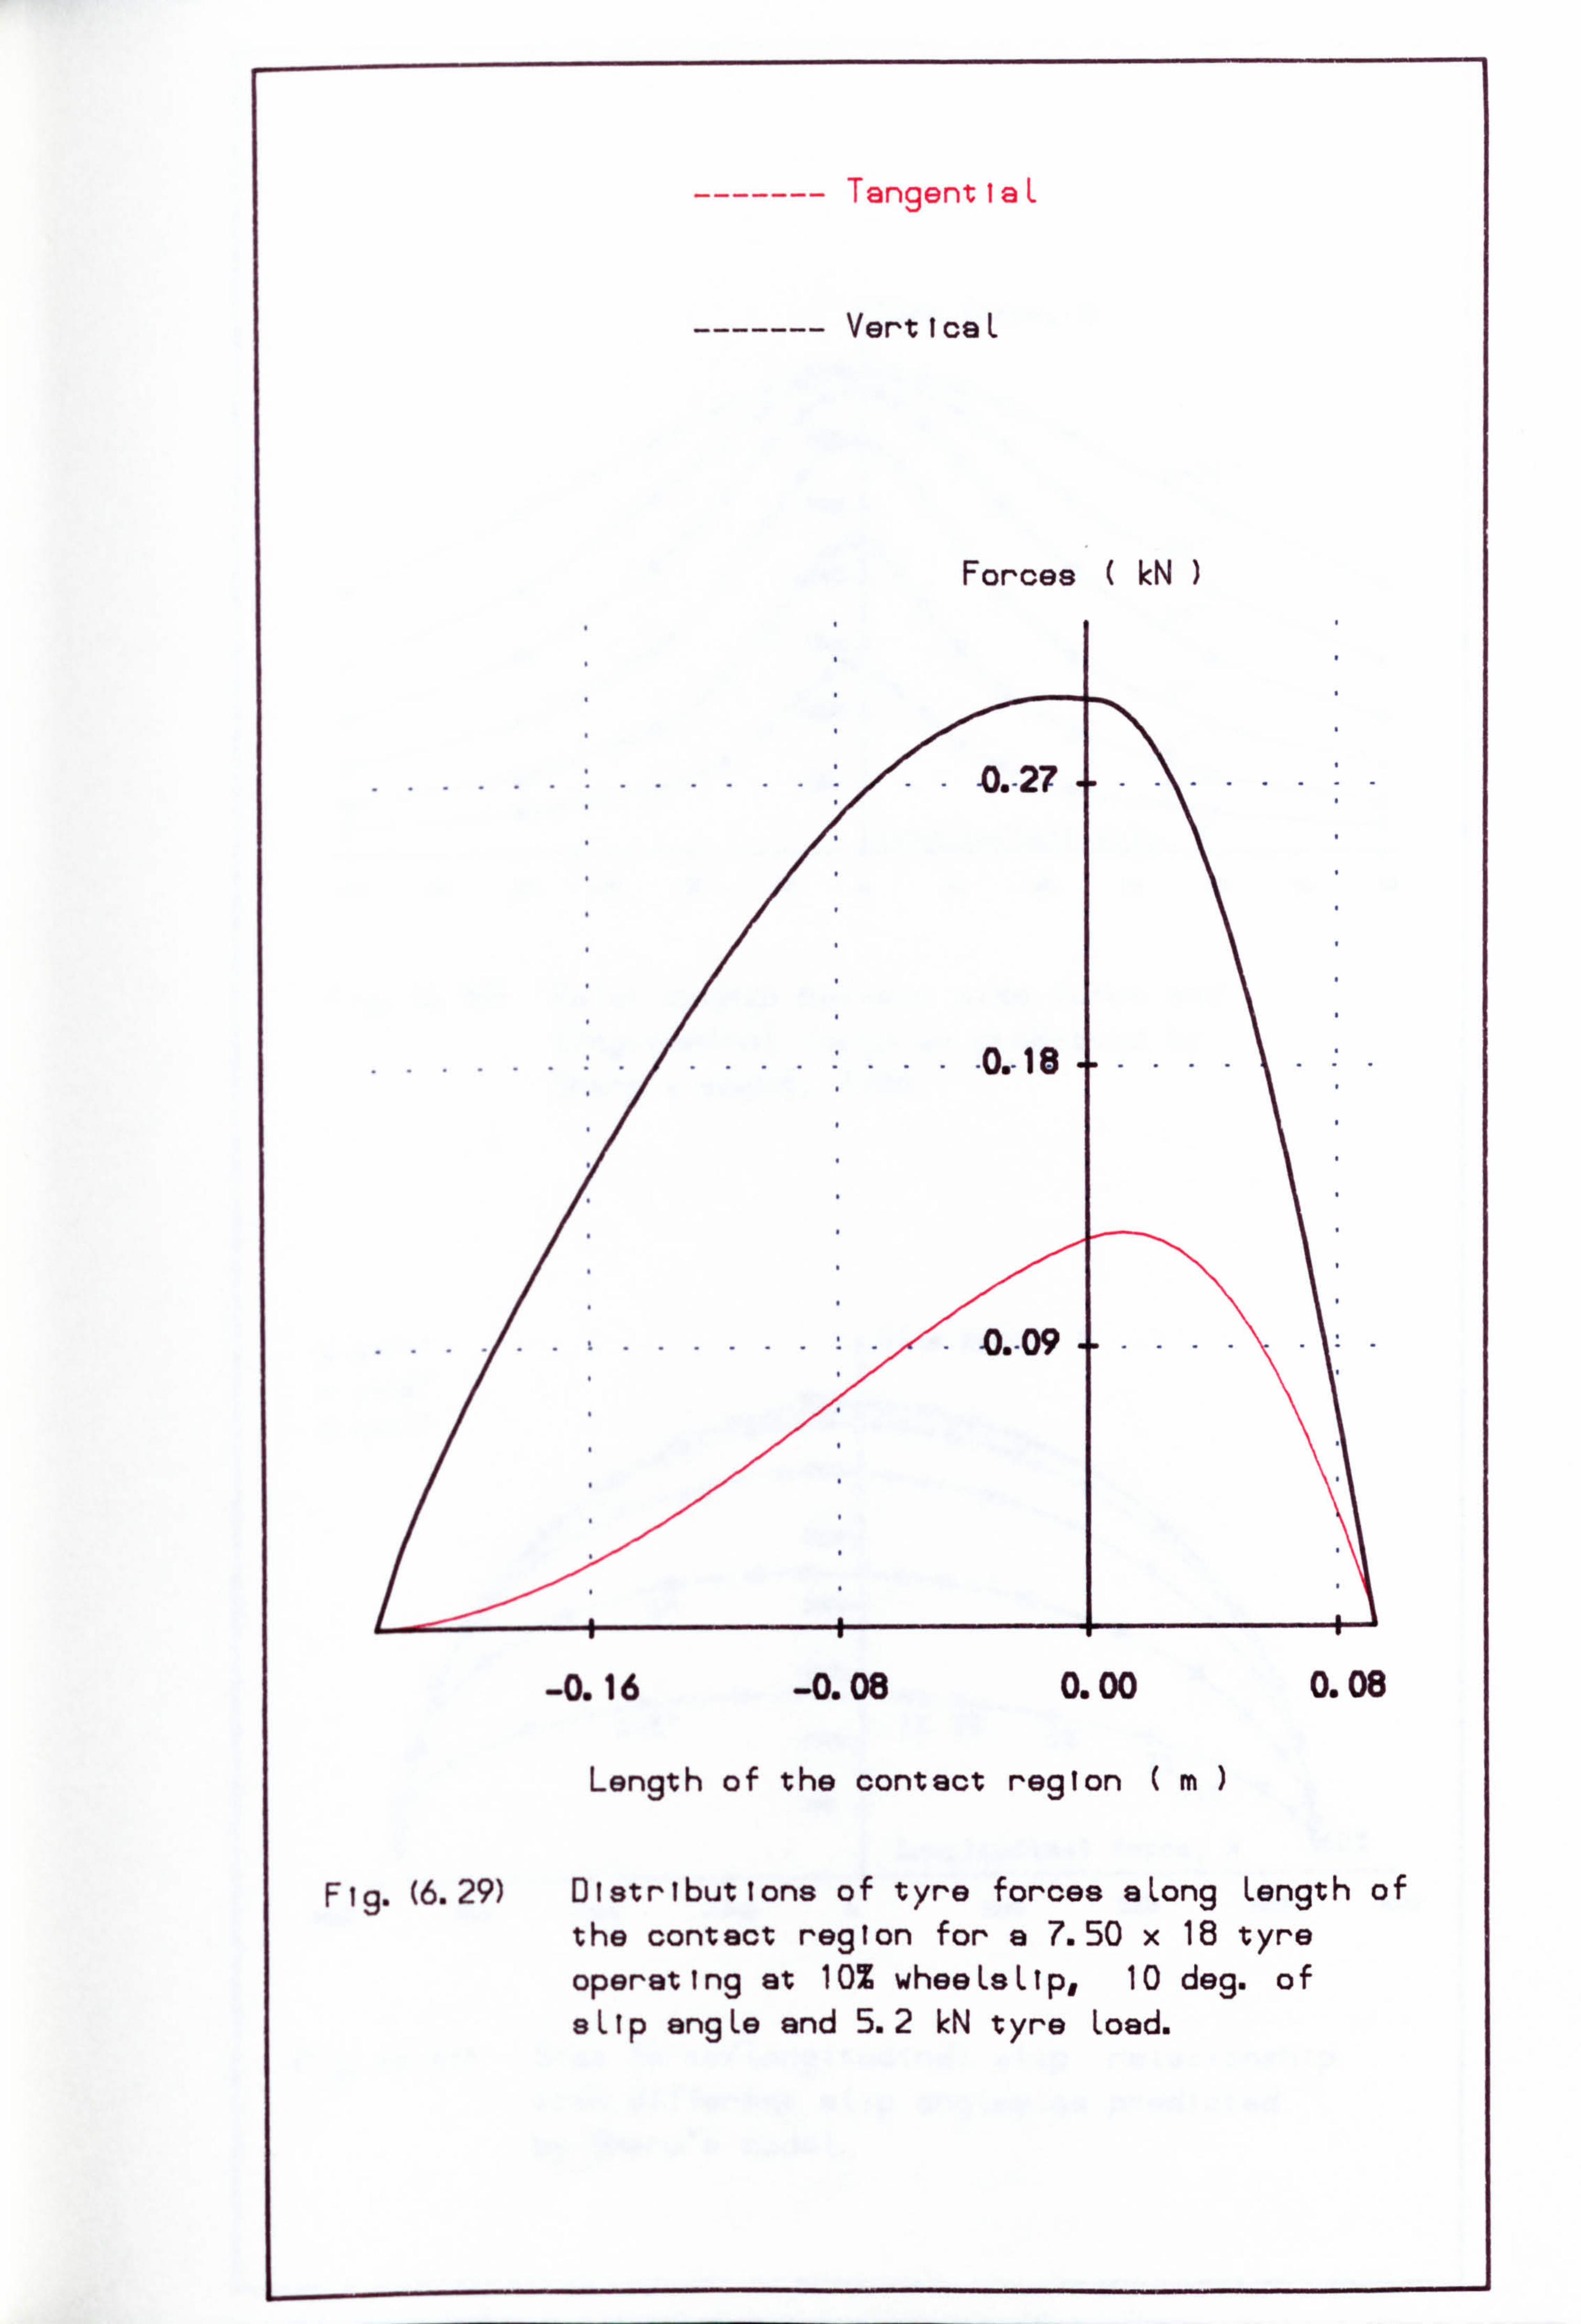
TangentiaL
VerticaL
Forces ( kN )
Length of the contact region (m)
Flg. (6.29) Distributions of tyre forces sLong Length of the contact region for a 7.50 x 18 tyre operating at 10% wheeLaLlp, 10 deg. of aLIp ang Le and 5.2 kN t yre Load.
-0.16 -0.08 0.00 0.08
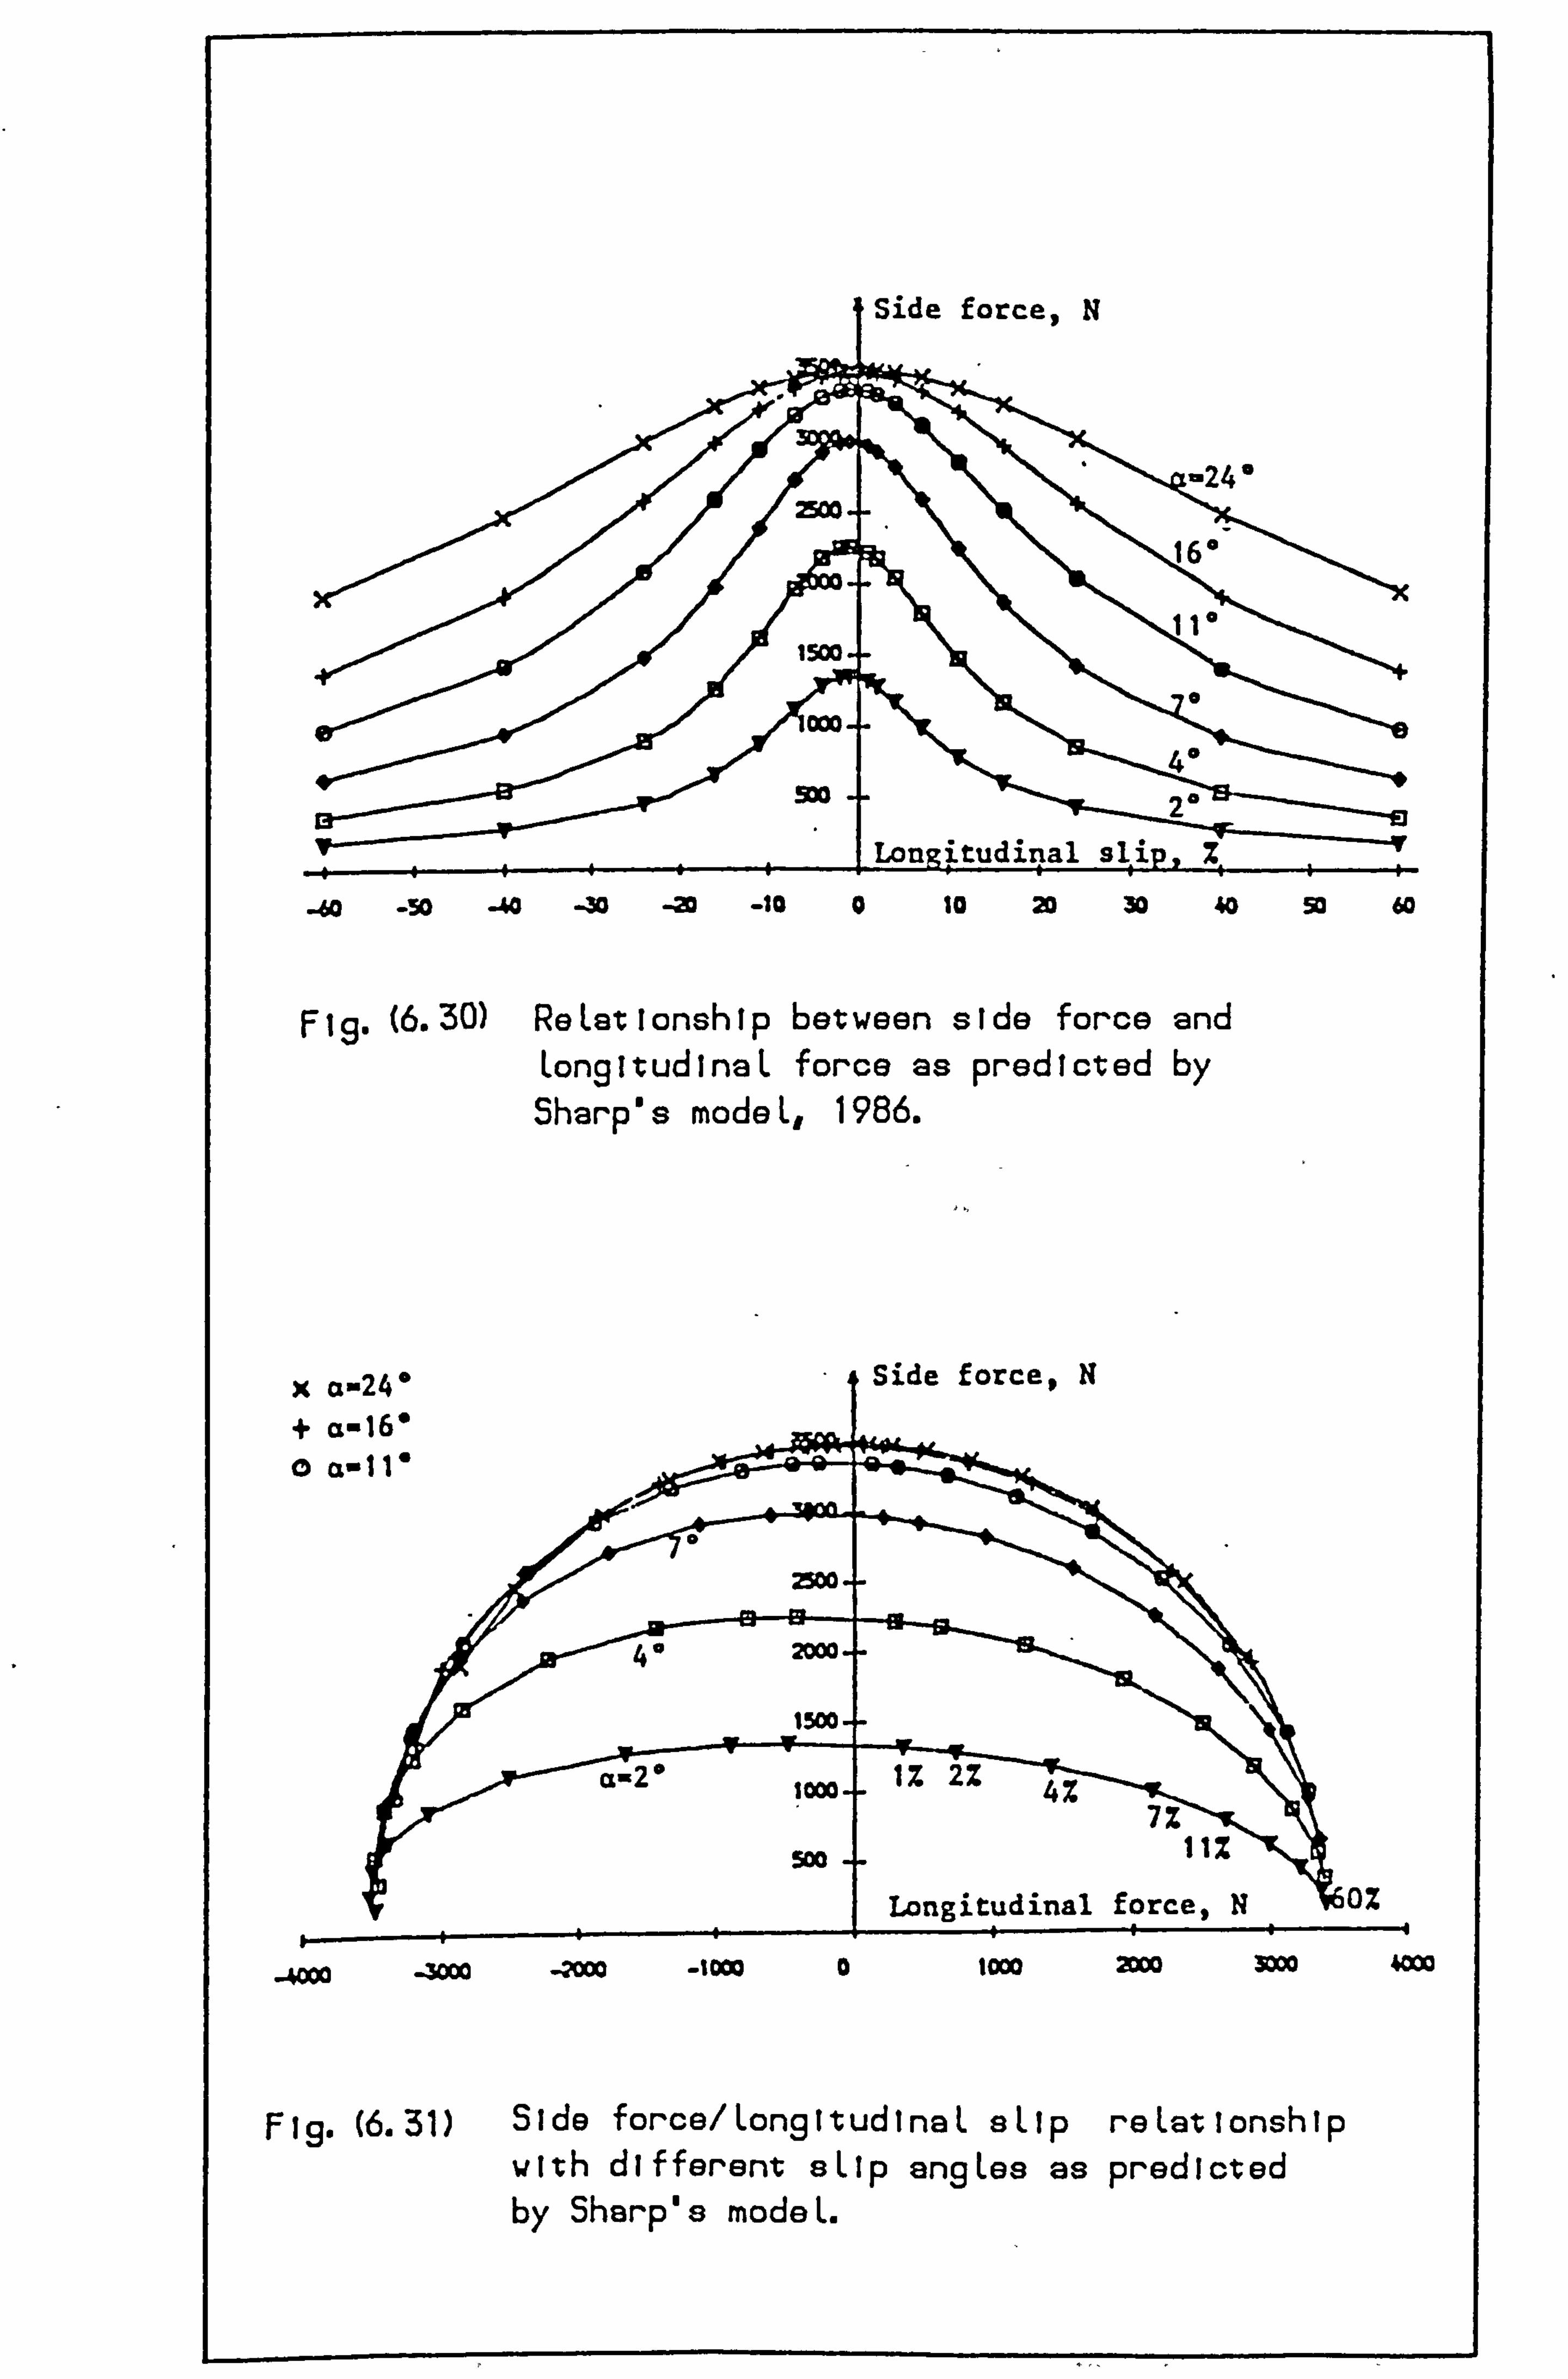
F (6.30) ReLationship between side force and LongitudinaL force as predicted by Sharp's modeL, 1986.
x a-24* + a-16* 0 a-11,
2500
40
Side force, N
1500--
cýL-2* 1000-- 1 Tý2 Z 4%
7% Soo
force, N 0% Longitudinal rp
-4000 -1000 low 2DW swo 4=
Fig. (6.31) Side force/ Long itudi ne L sLip reLationship with different sLlp angLes as predicted by Sharp's modeL.
-60 -50 AA -W -0 -10 0 10 20 30 40 So 60
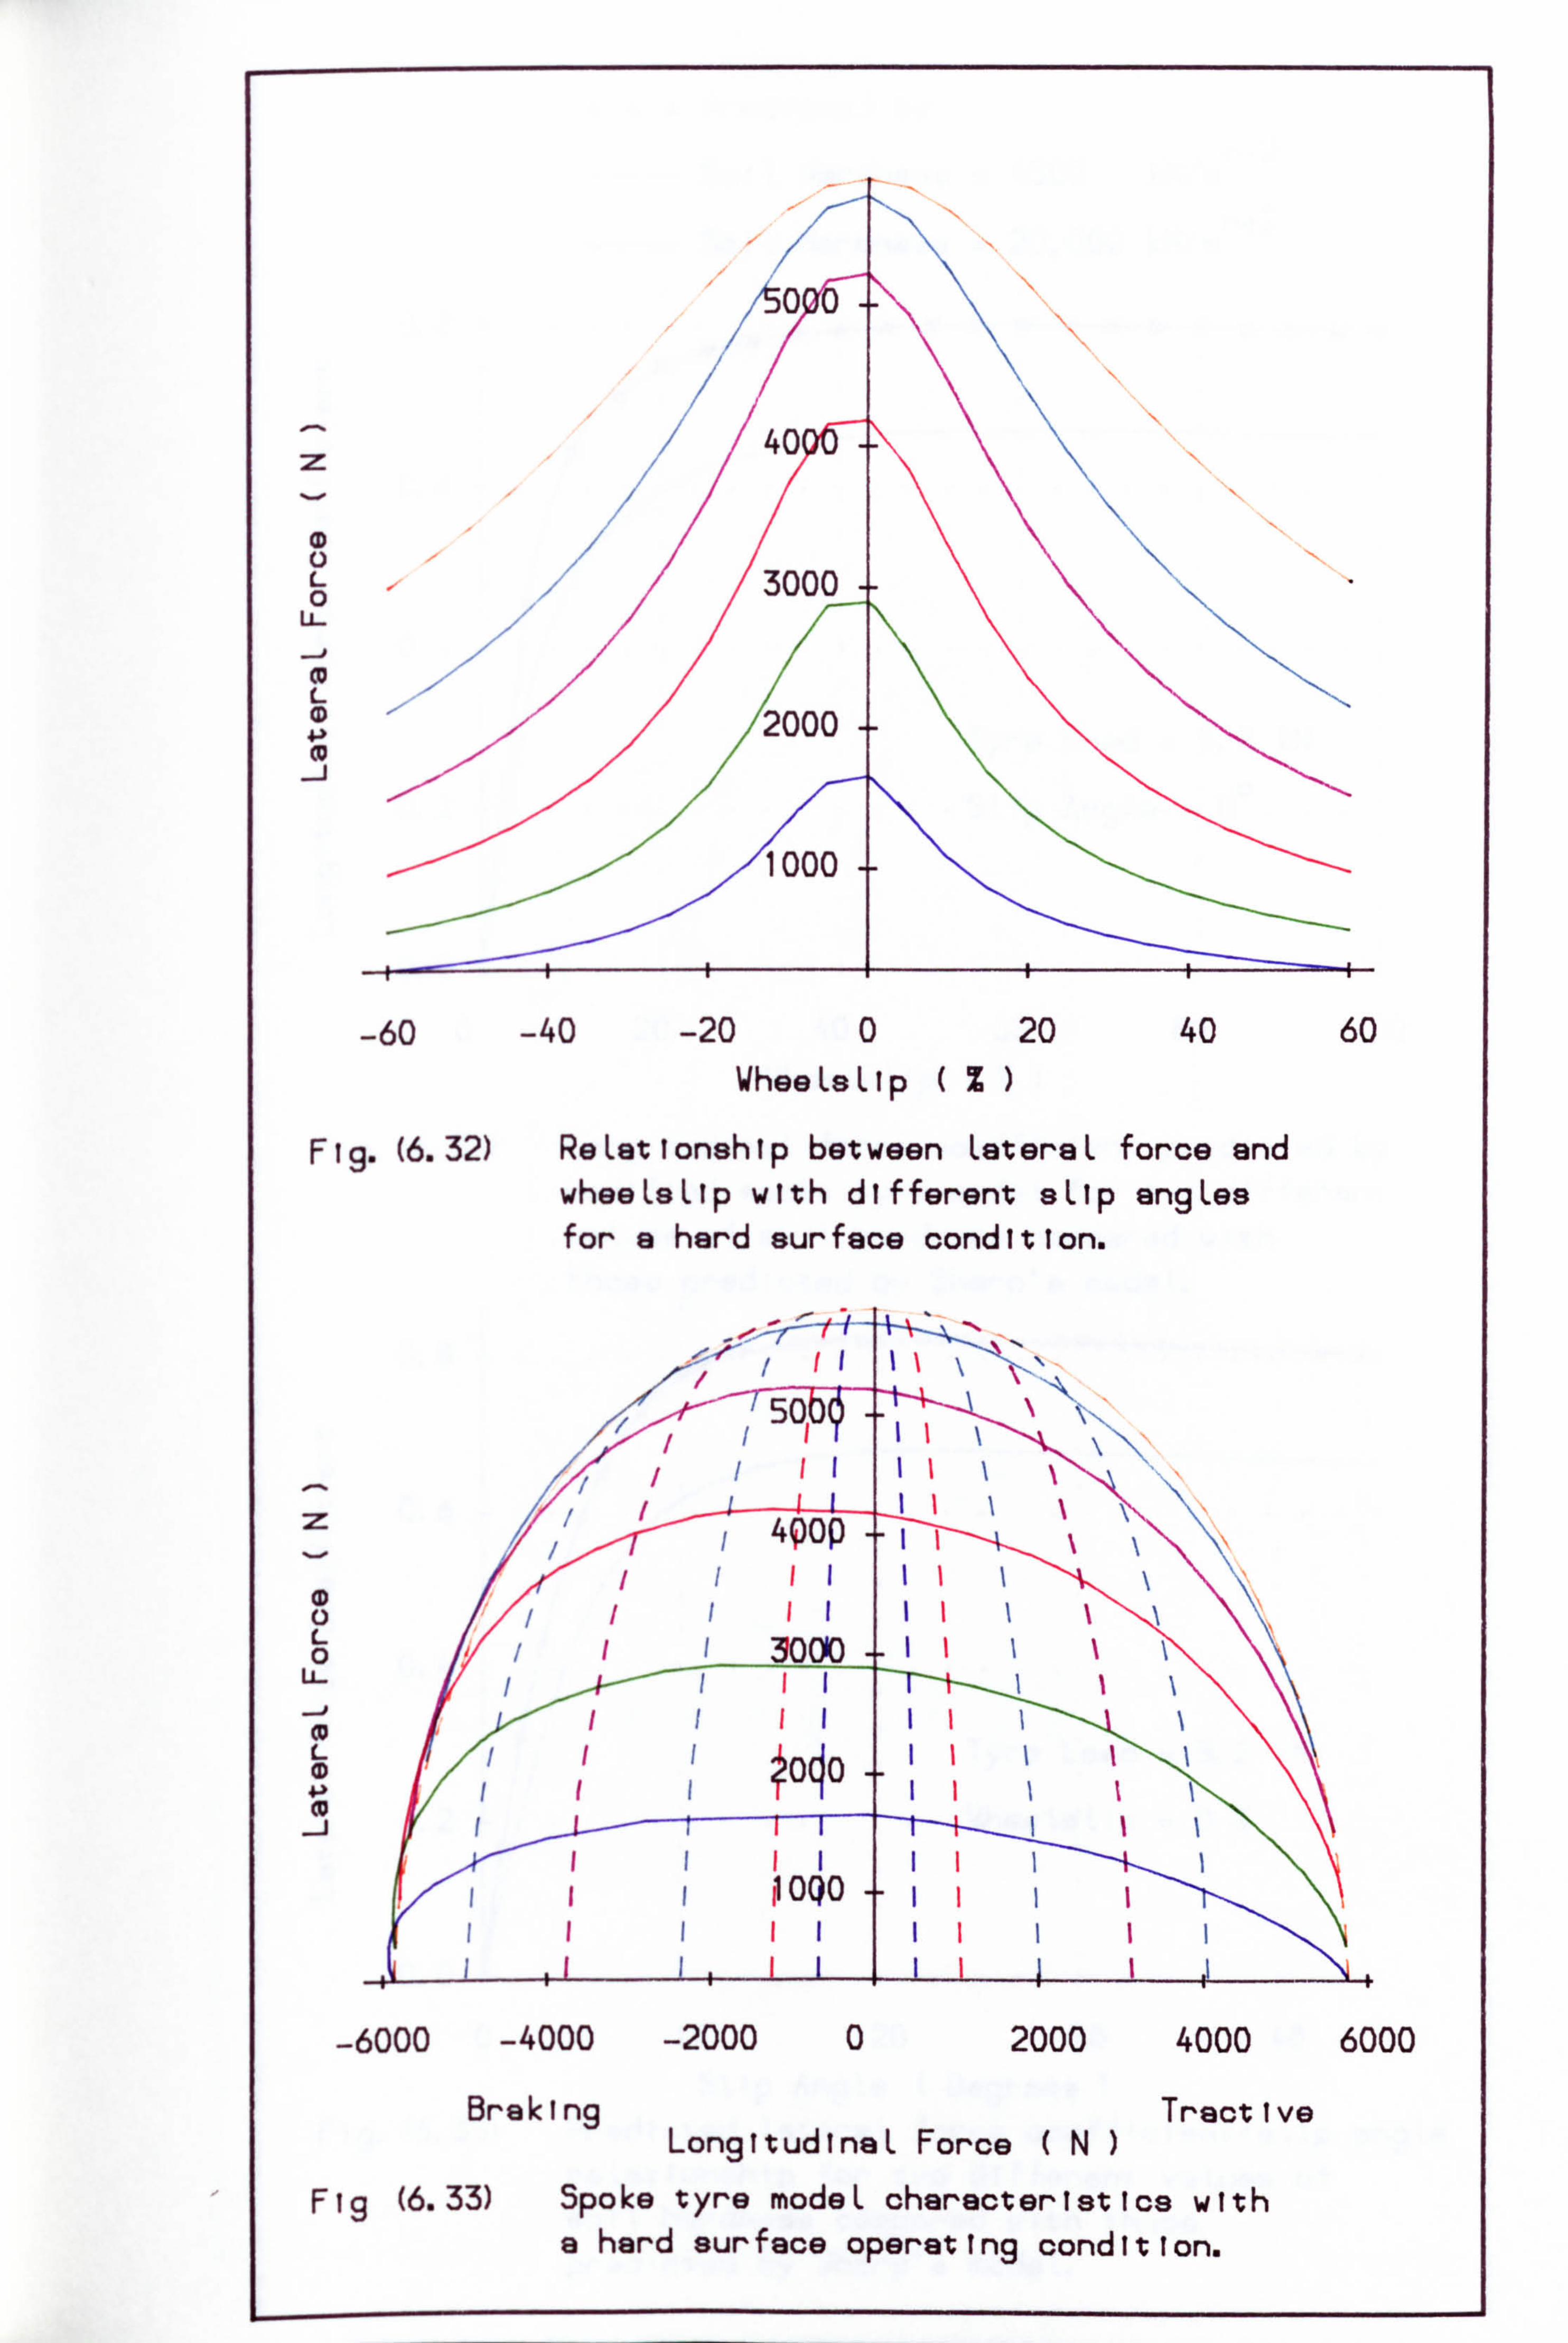
:Z
(9 1
-60
Ig. (6.32)
(0
(0 1
-40 -20 0 20 40 WheeLsLlp (%)
ReLationship between LateraL force and wheeLeLlp with different aLlp angLes for a hard surface condition.
-6000 -4000 -2000 Brek I nq
0 2000 4000
Tractive LongttudinaL Force (N)
Fig (6.33) Spoke tyre modeL characteristics with a hard surface operating condition.
60
6000
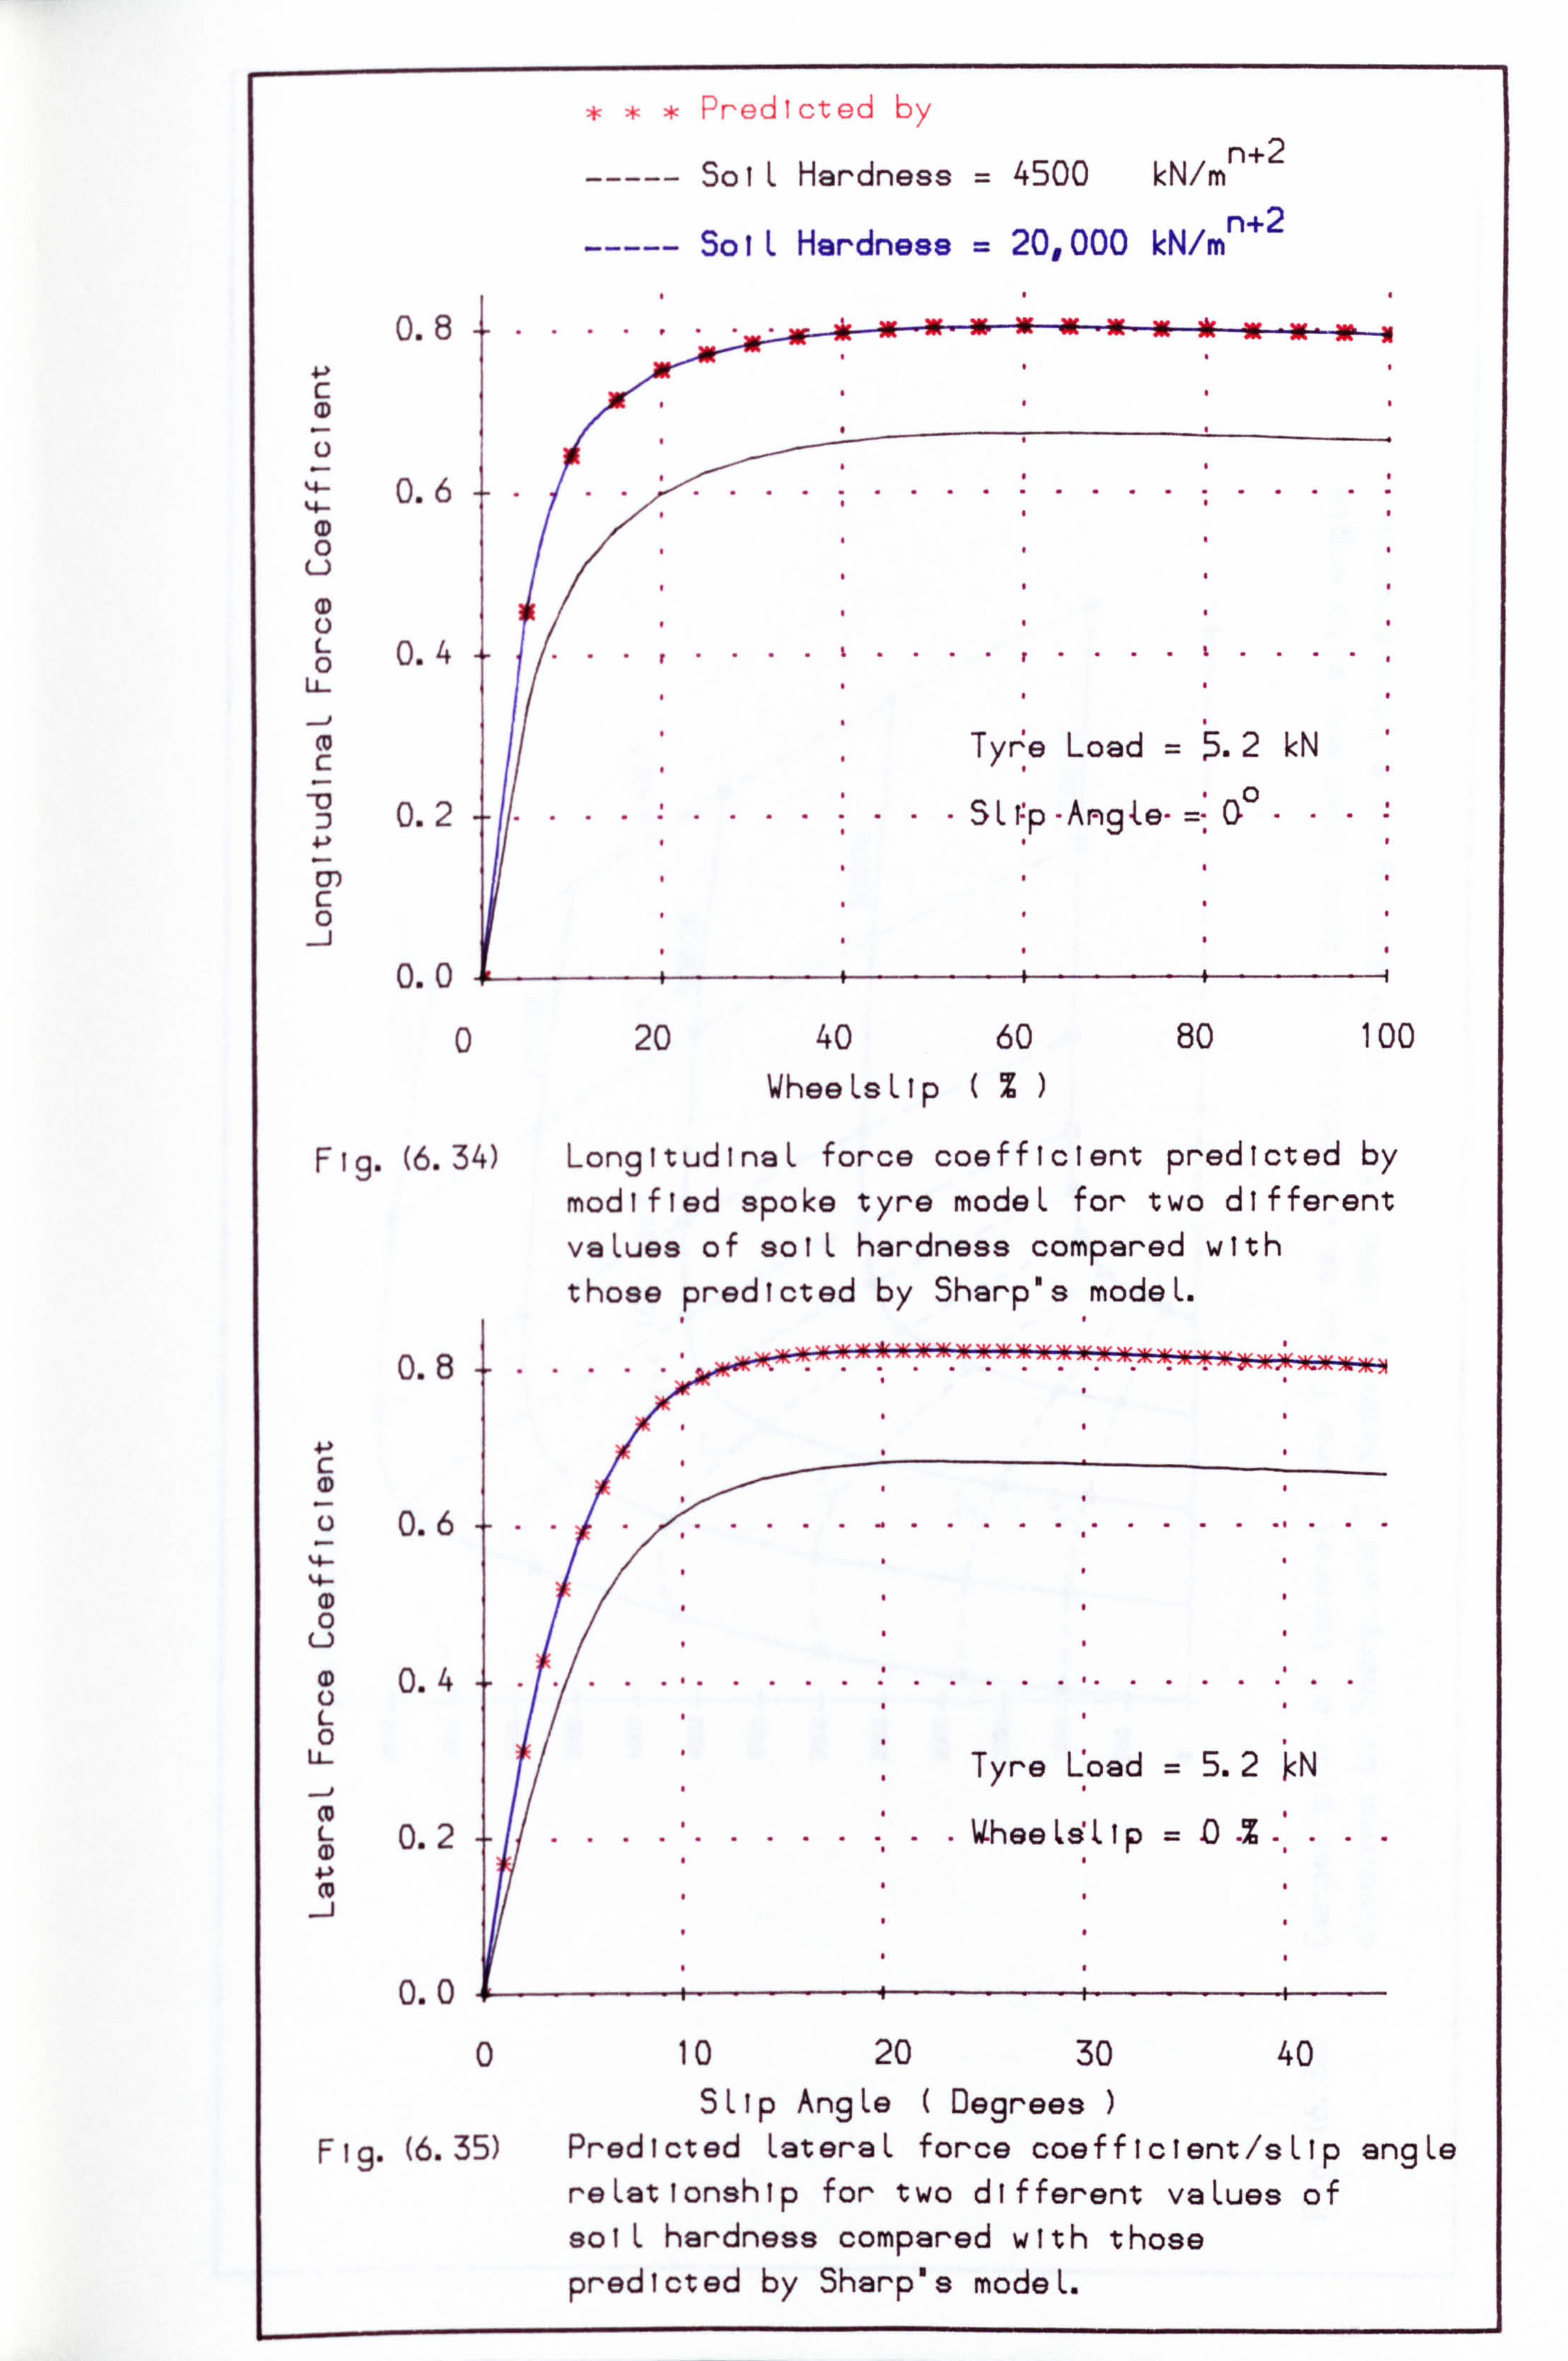
Predicted by
SoIL Hardness = 4500 kN/m n+2
SoIL Hardness = 20,000 kN/m n+2
0.8 4ý c
k4- 0.6 %4- CD 0
u
0.4
-i (0 c
_0 0.2
0.0
0 20 40 60 80 100 WheeLsLlp (%)
Fig. (6.34) LongitudinaL force coefficient predicted by
modified spoke tyre modeL for two different
vaLues of solL hardness compared with those predicted by Sharp's-modeL.
0.8
4->
0.6 14- %4-
(D 0
U
a) 0.4 0 L
L 0.2 (0
0.0
0 10 20 30 40 SLip AngLe ( Degrees )
F 19. (6.35) Pred i ct ed Latera Lf orce coef fIcI ant /9 LIp ang Le reLationship for two different vaLues of solL hardness compared with those predicted by Sharp's modeL.
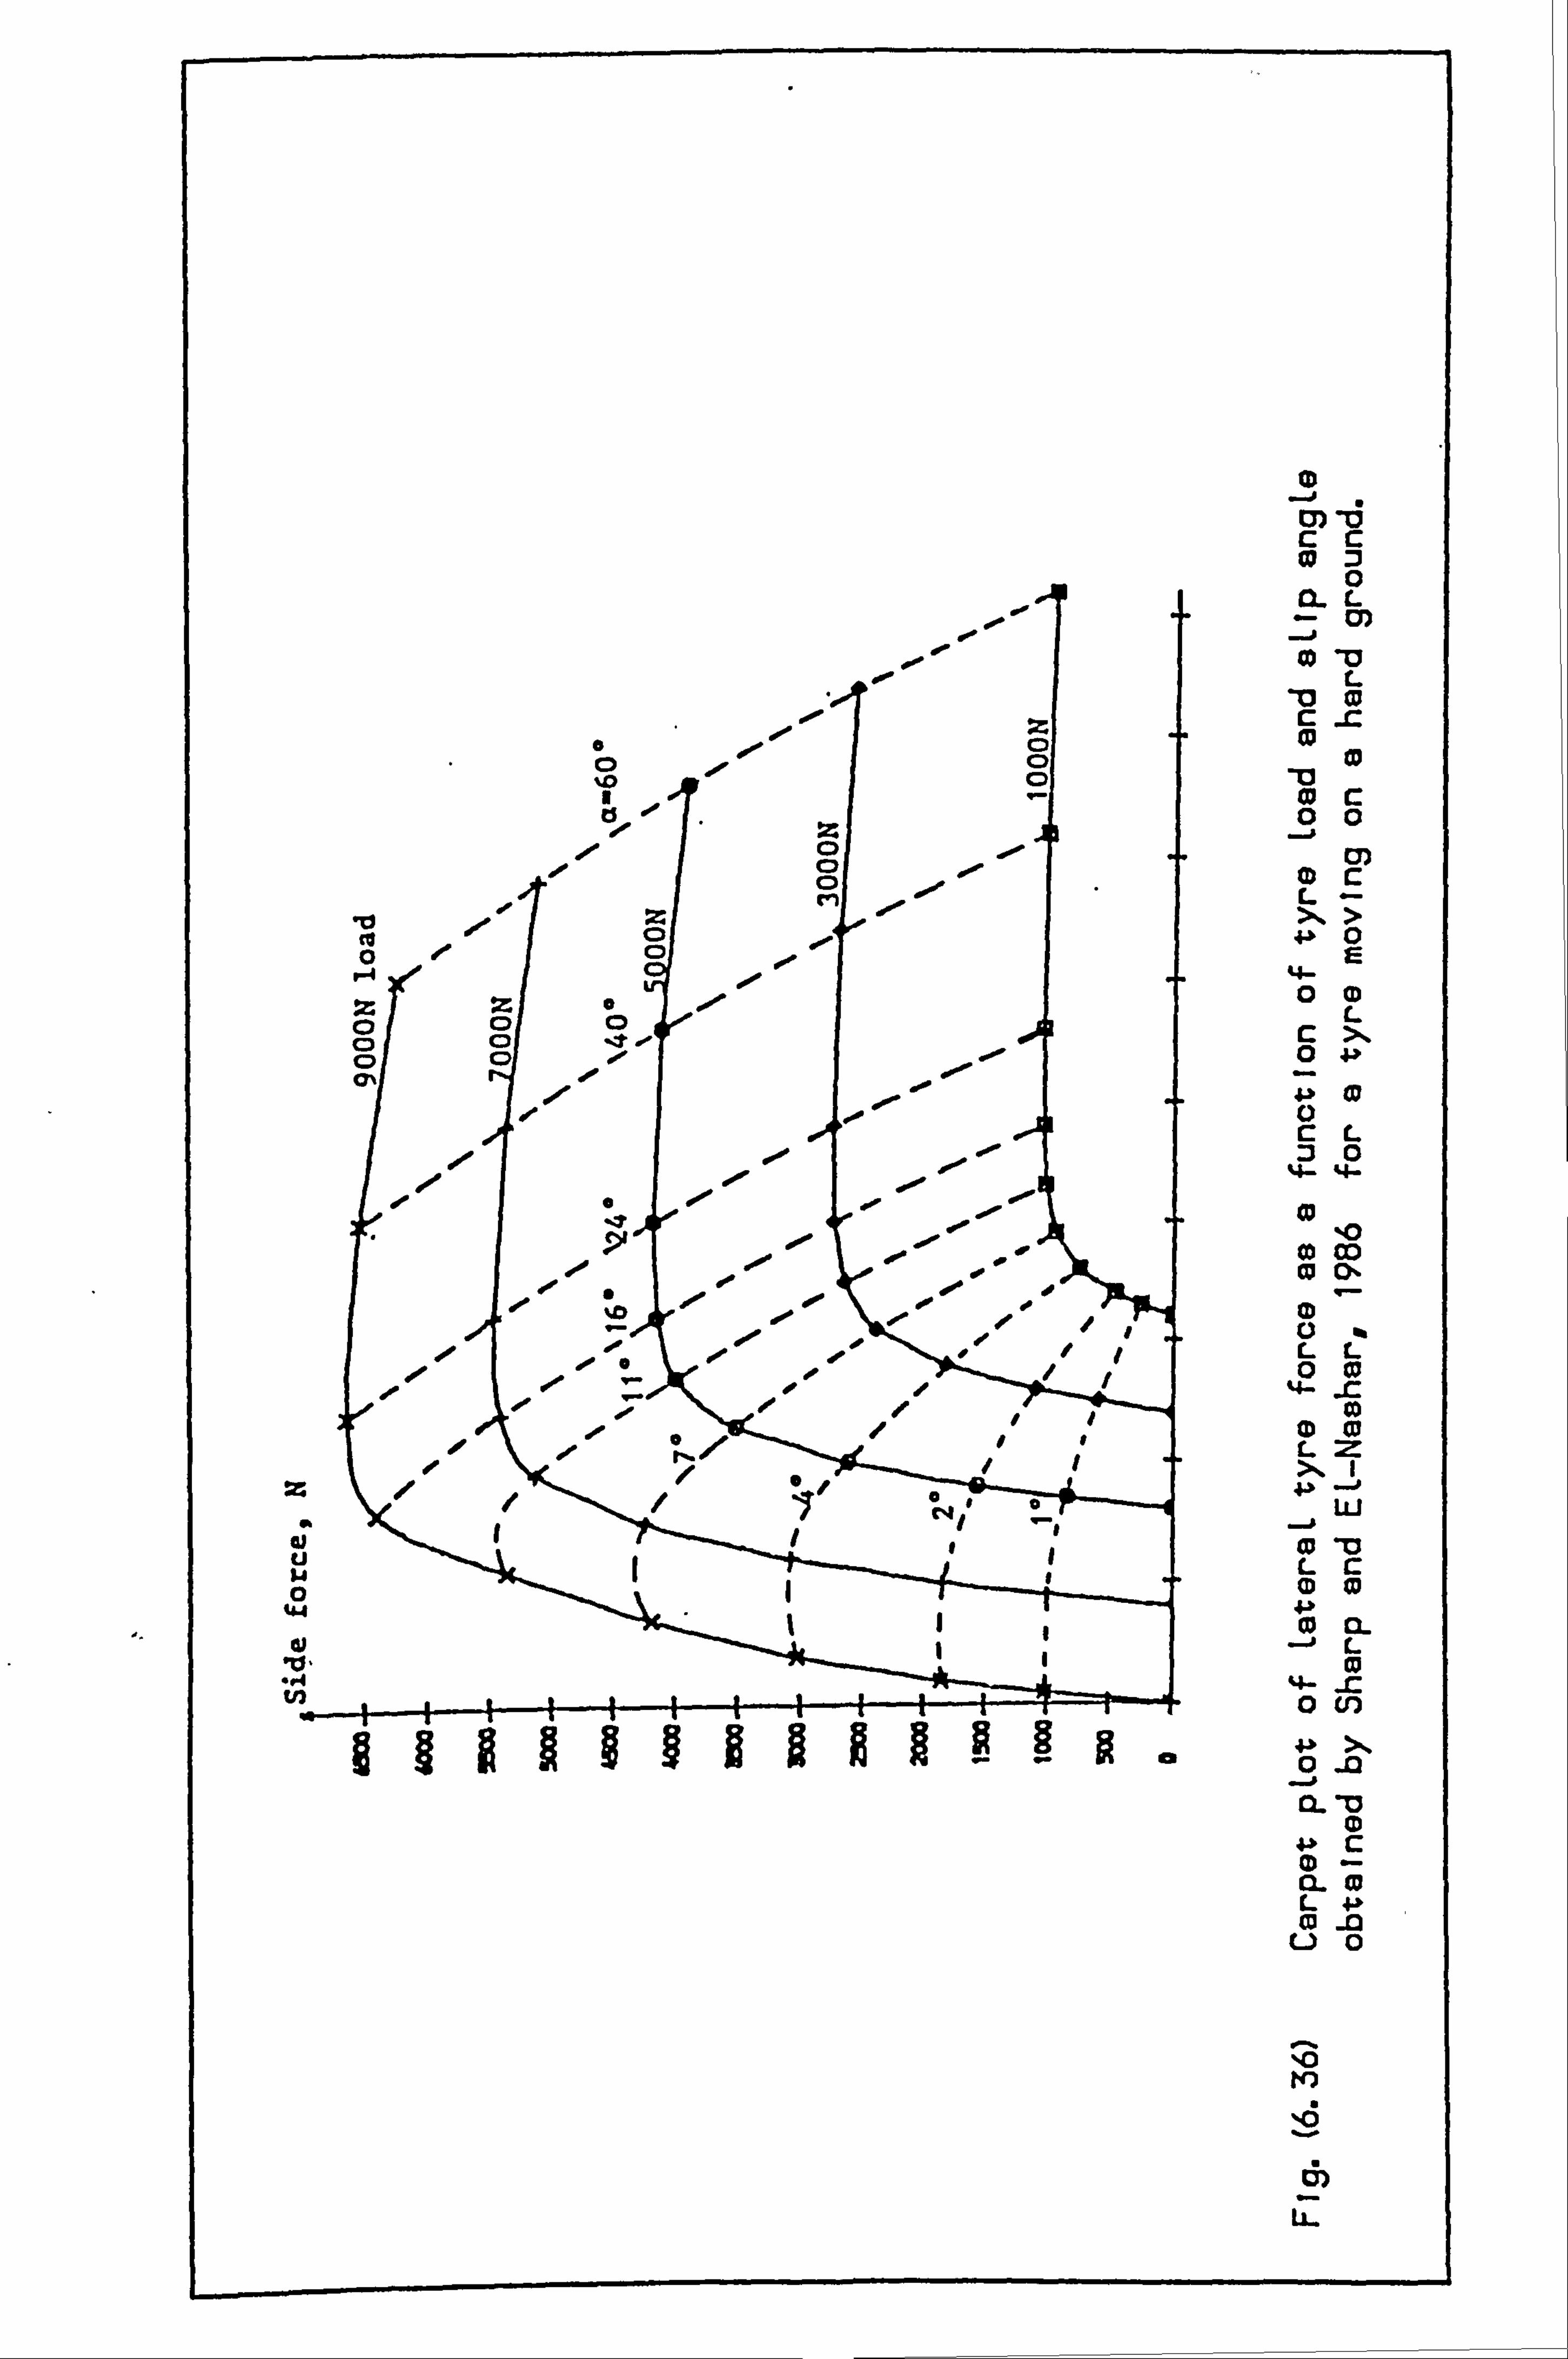
CD i a) -X5 cc
0 CL L
-0 ca z
r- c -C 001 On
. CD
ts z 00
. 00, 0 C) op
CD c
10 .I -1
0 9 cn 'I
z L
> cis 0
0 CI 1
0 E
r4 0. 44-
z z 0 (D L
0 C)
0 C) cx
C) 0 41
0 4j. - C% .
. le .0 4-% CD le 0
CL el
0, 0.0
. 00, 0,
:30 %4- 4-
0 0 ., 0
00 %0
- wl o 0 a) m 0.
oll dom zo "e
- '. 0
10 4p 0 0' 1 .1 LL
. .00
0 . 0w
CD Co L XI 4-% -j
0 0
uj -. CD Lc Q CD
0 U)
43. X 0 -0 -. j CL -0
la) 43, c (D - 92. CD L 4-1 ca -Q L. ) 0
to
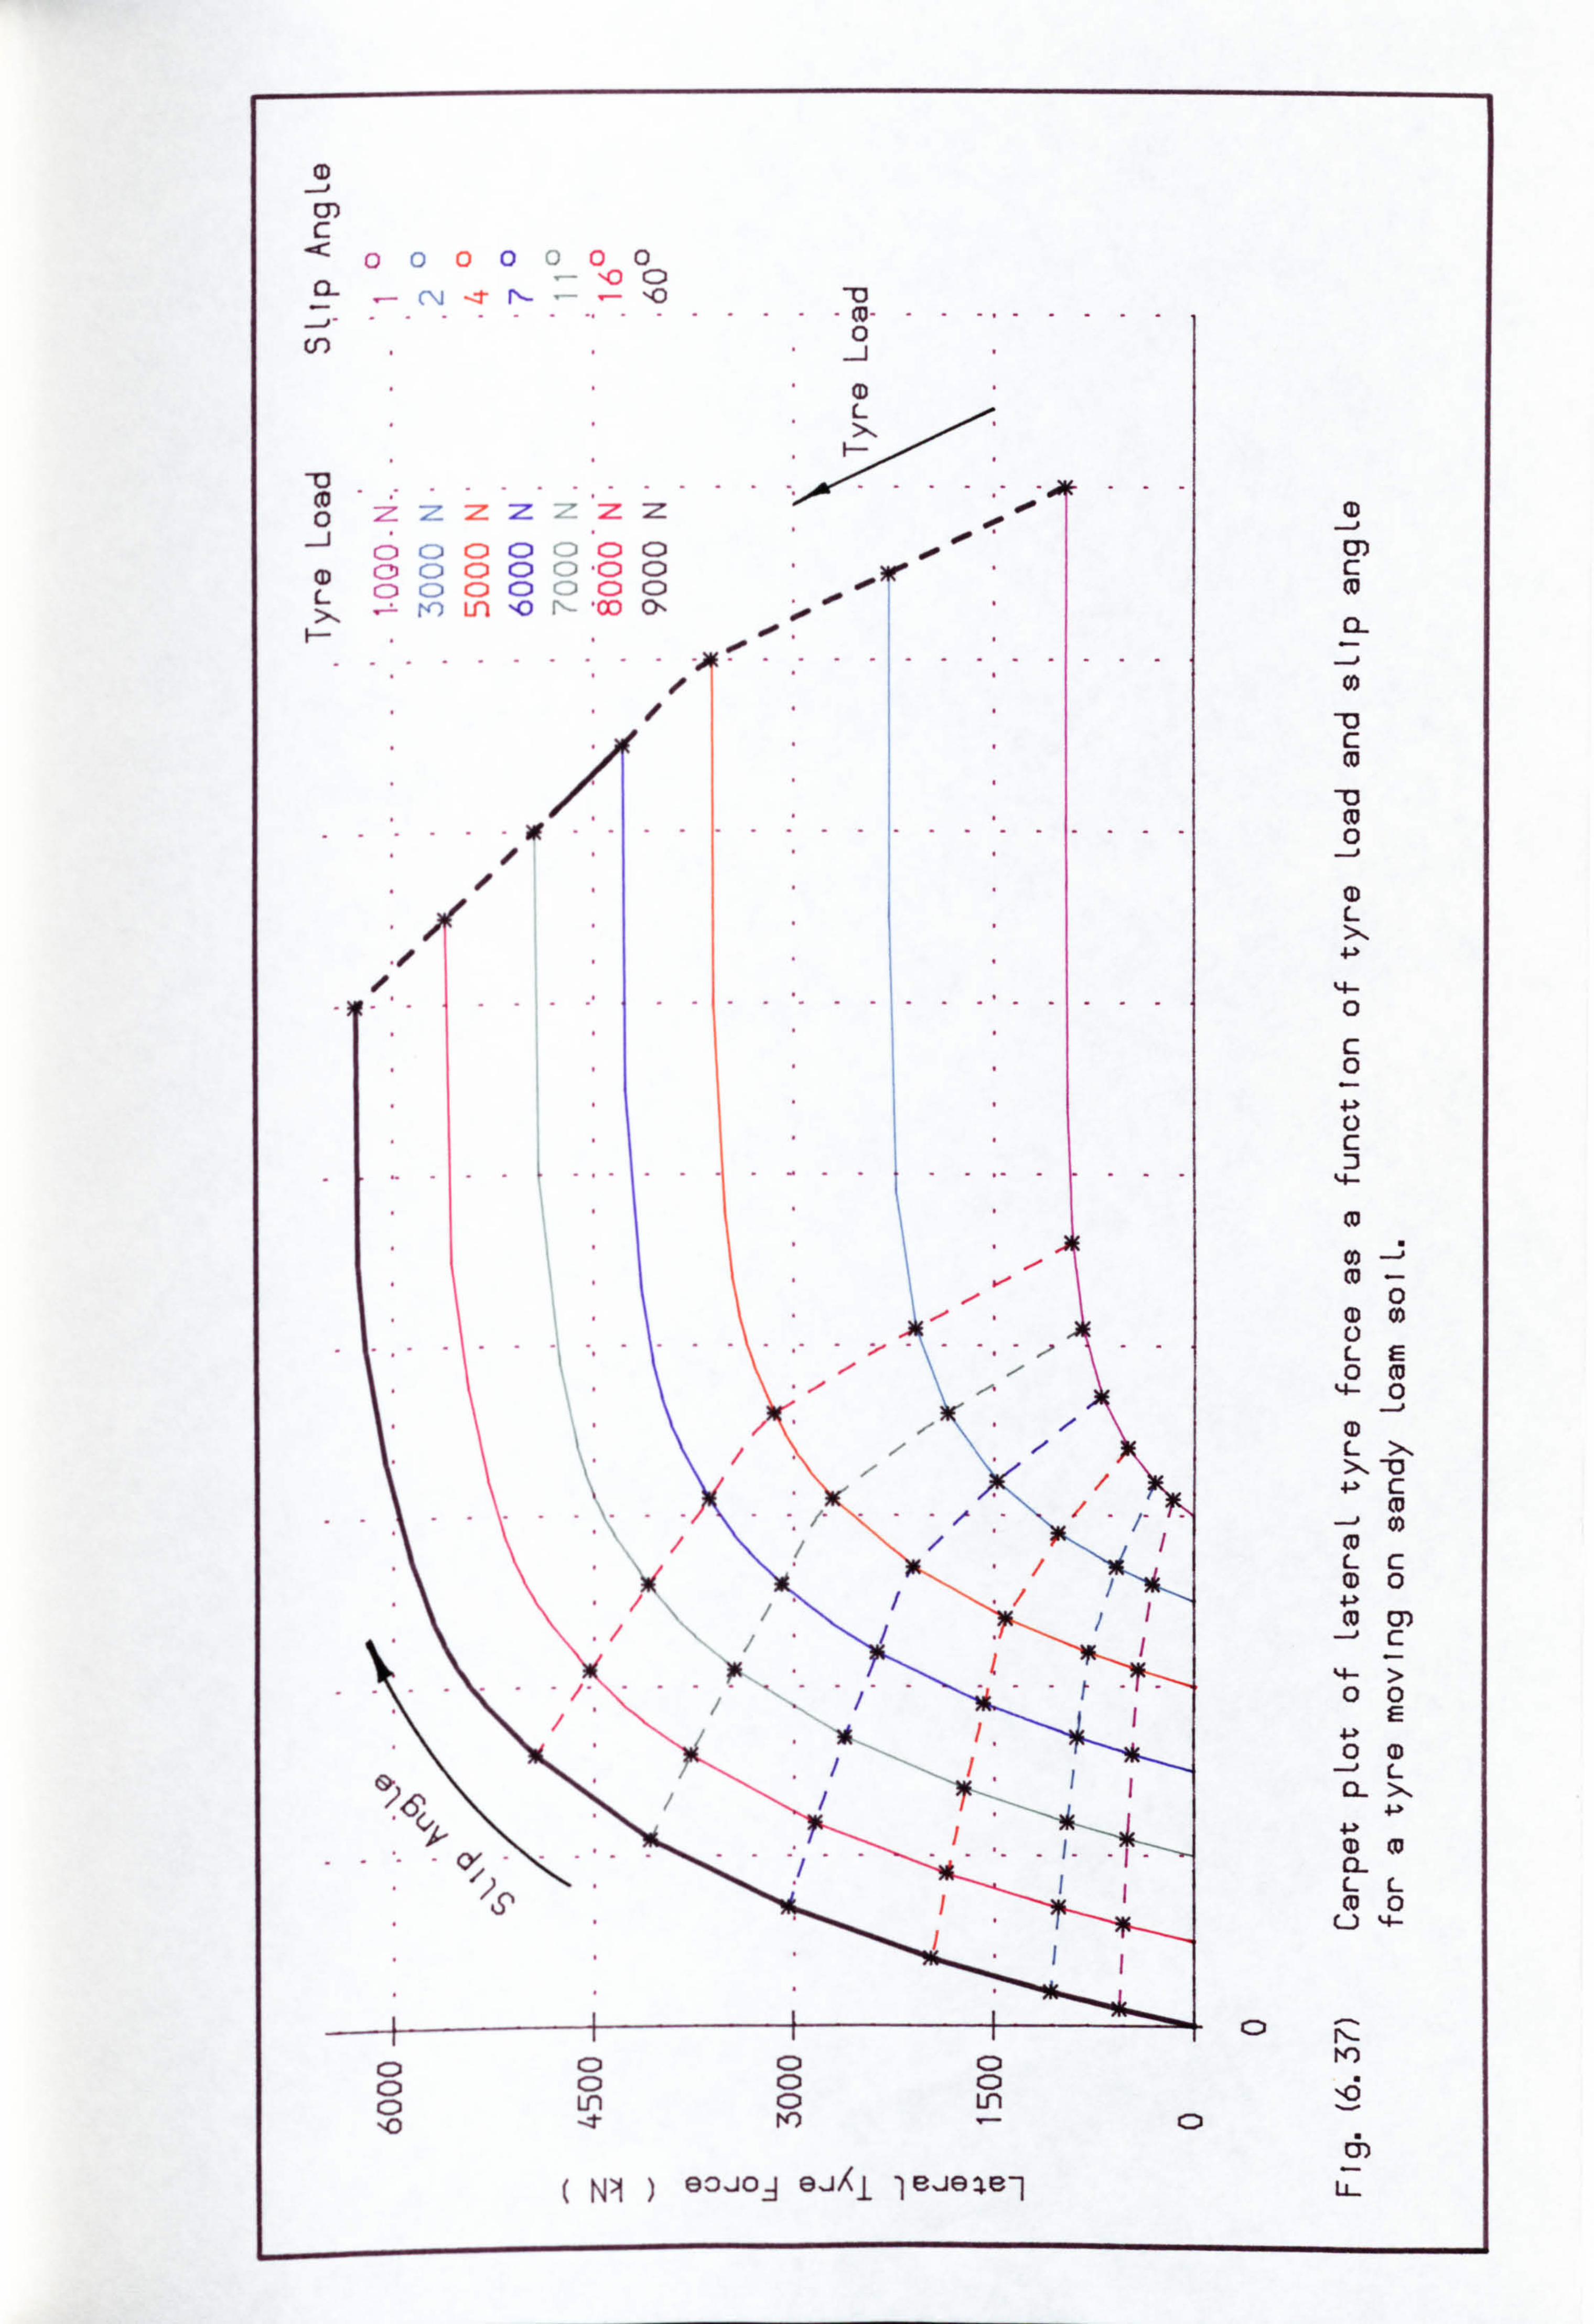
CD
m c
-< oo00U00 CL
- c-, i -, I,, - : ý: ý2
loo _0 ......... ....... (a- ----
V) 0 -i
L
----------------- CD 0 aý :ZZZZ
-i C) C) CD C) (D C) 0 CD (2) CD 0 C) CD - CD 0 L (D C) CD Q (---: ) C) CD
. 00
>1 - W) Ln '0 f-- -01) o' low F- 00 op
........... A---------
.......... /
..... ..........
C) CD C) CD CD 0 C) 0
C) Ln 0 Ln 0 --t ýo -
NI ) 90JO-ý 9-Jýi IOJ918-1
0)
73
0
(D L X
0
c 0
ca 0) ý
(1) 0) C) L 0m
0
(D LX
7) C
(0 Lc (D 0 4ý (U m
-4- > 00
0 CD L
4ý
CI- LL (o 0
U %4-
CD
C)
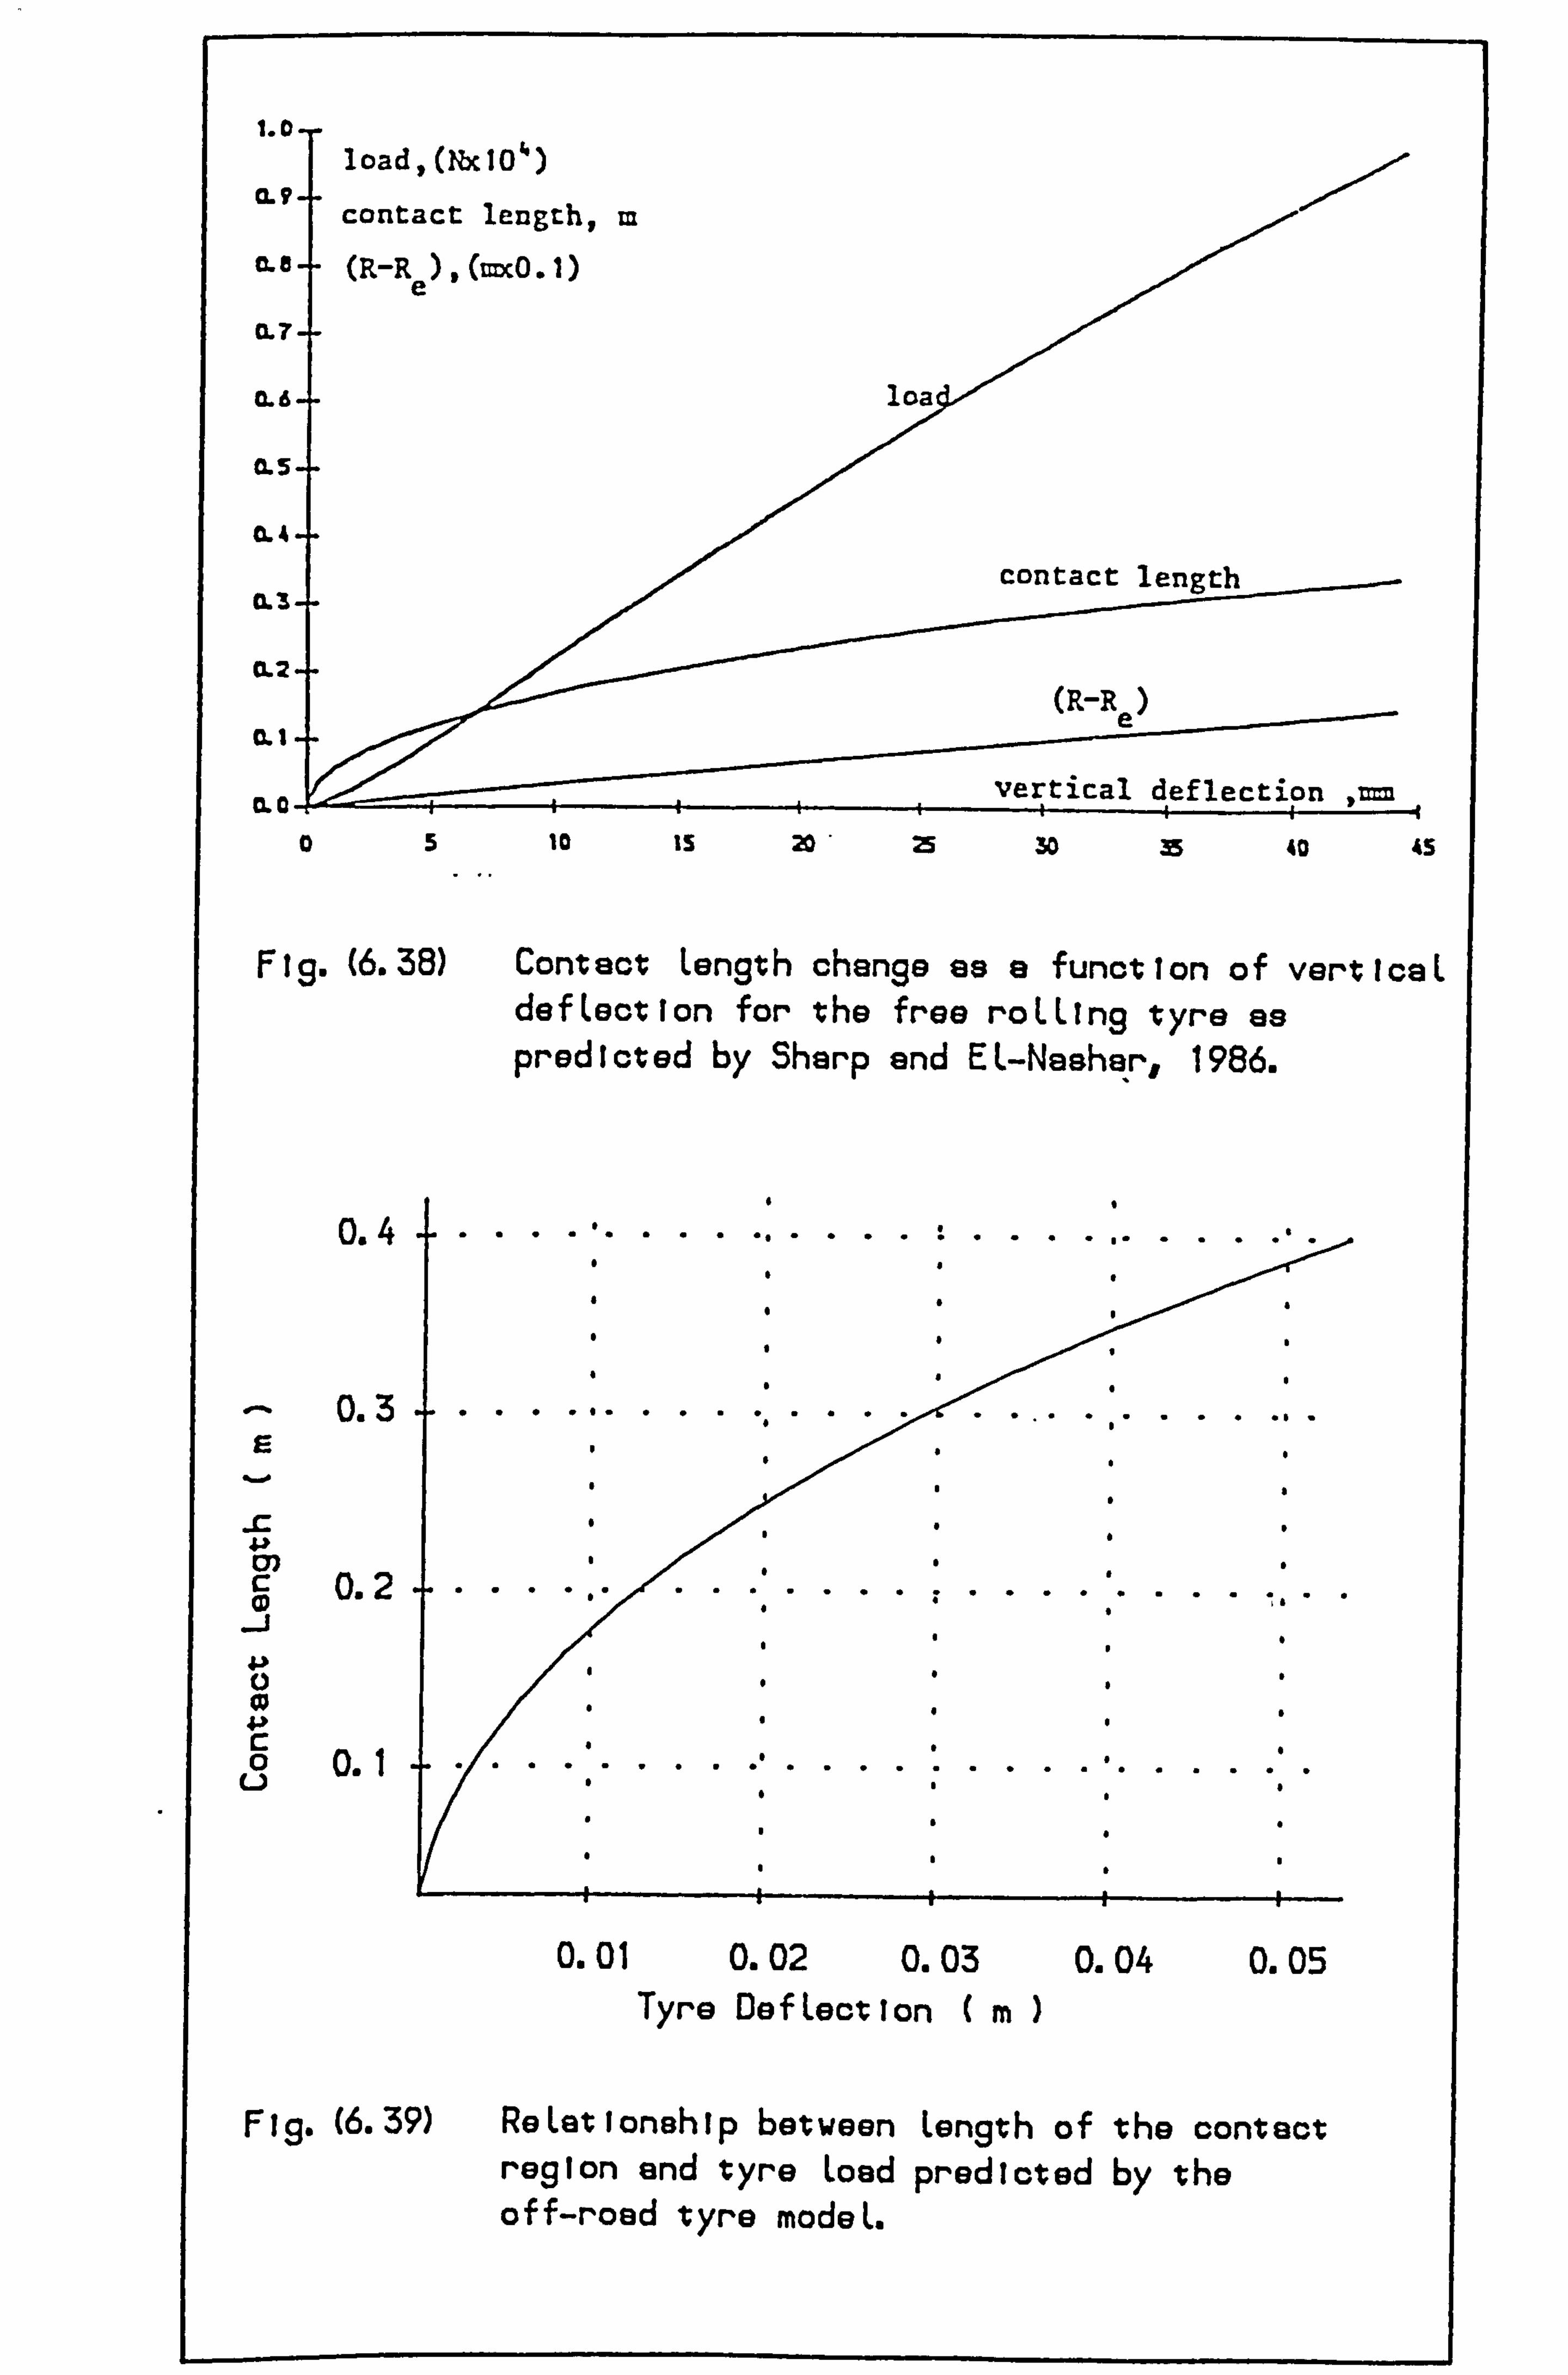
1.0--
CL 9- -
load , (Nx 10'*
contact length, m 0- a-- (R-R
e). (=CO. 1)
CL7- -
a. 6- - loa
ILS- -
(L4 -- contact length
CL2 -- (R-R
e ILI. " vertical deflection CL 0. i
05 10 IS 20 25 30 B 40 4S
Ftg. (6.38) Contact Length change as a function of verticaL defLection for the free roLLInq tyre as predicted by Sharp and EL-Nesher, 1986.
o. 4 ............. .......... ......
............ .... E
-C
C 0.2 1---- .-. '------------- -'. --
0 0.1 ............... U
0.01 0.02 0.03 0.04 0.05 Tyre DefLection (m
Fl. g. (6.39) ReLationship between Length of the contact region and tyre Load predicted by the off-road tyre modeL.
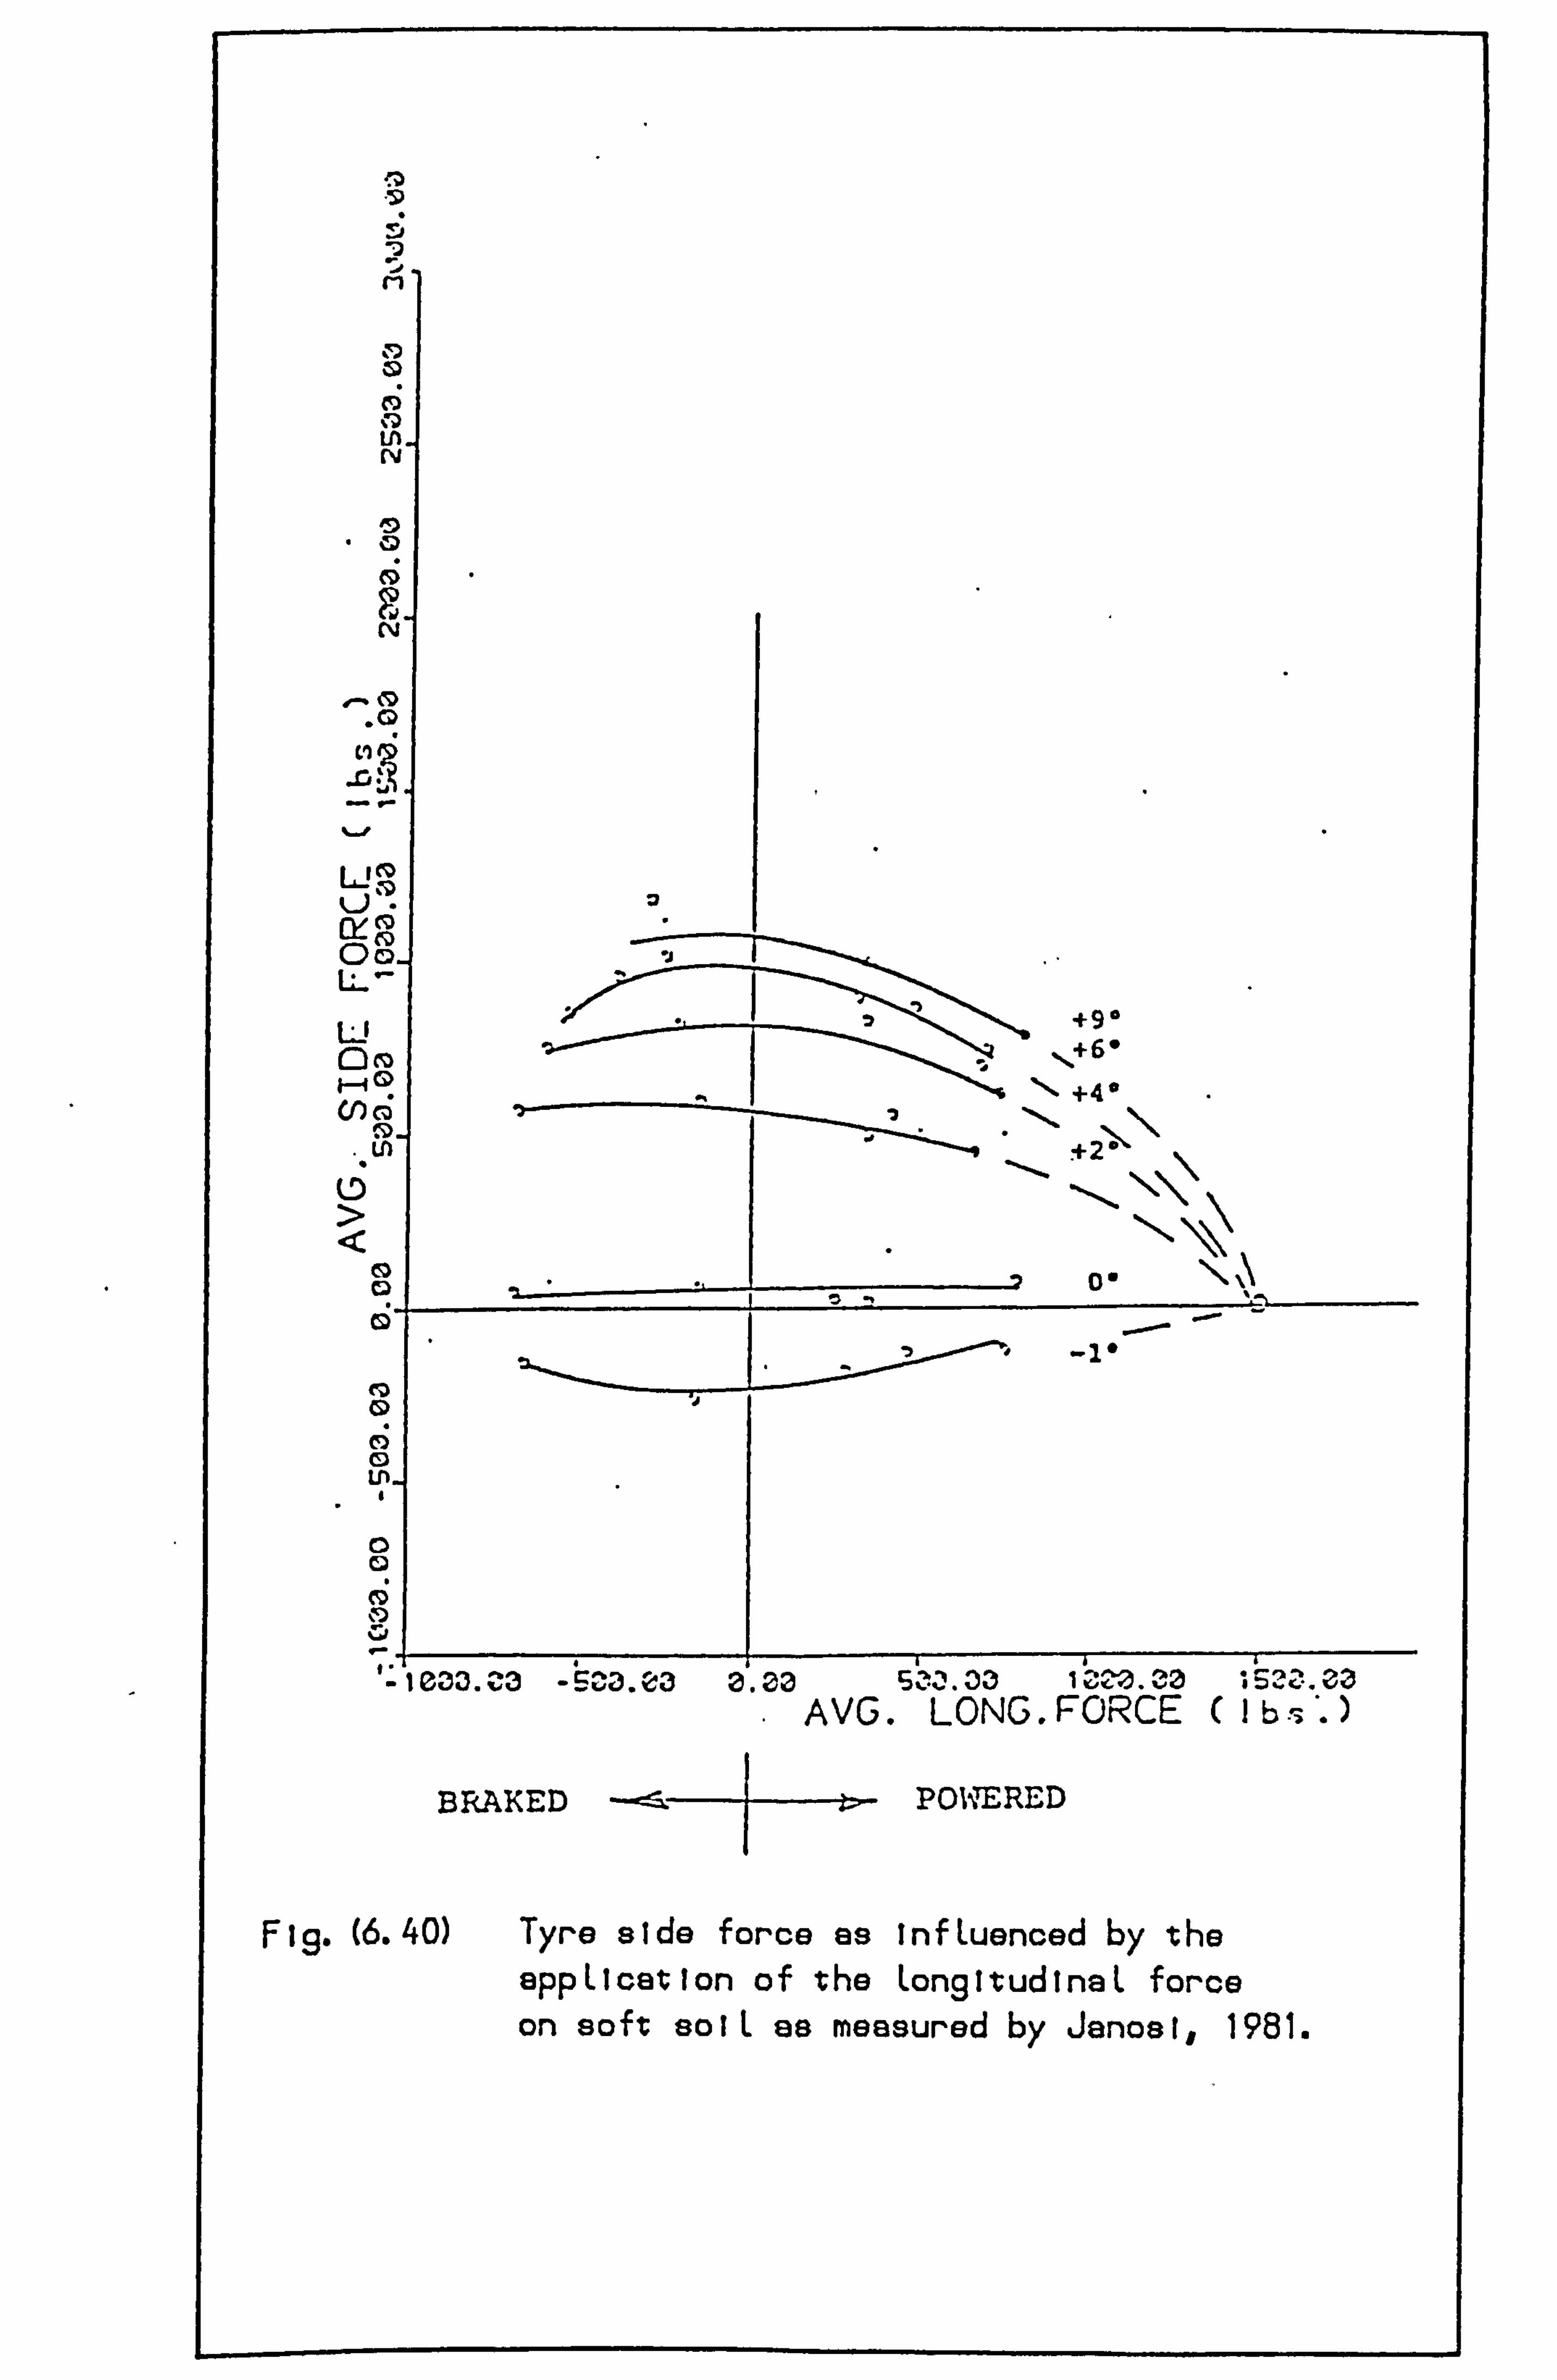
ry
.0
00-
+90 On 1-49 1 "- +4
Lr) +20
Ca
9
0 0
0
13 -SCO3. e3 0.33 33 1 zzo. ea ý23.03 1 e33. %
- AVG. LONG. FORCE (lb! 3*. )
BRAKED > POWERED
Fig. (6.40) Tyre side force as InfLuenced by the appLication of the LongitudinaL force on soft solL as measured by Janost, 1981.
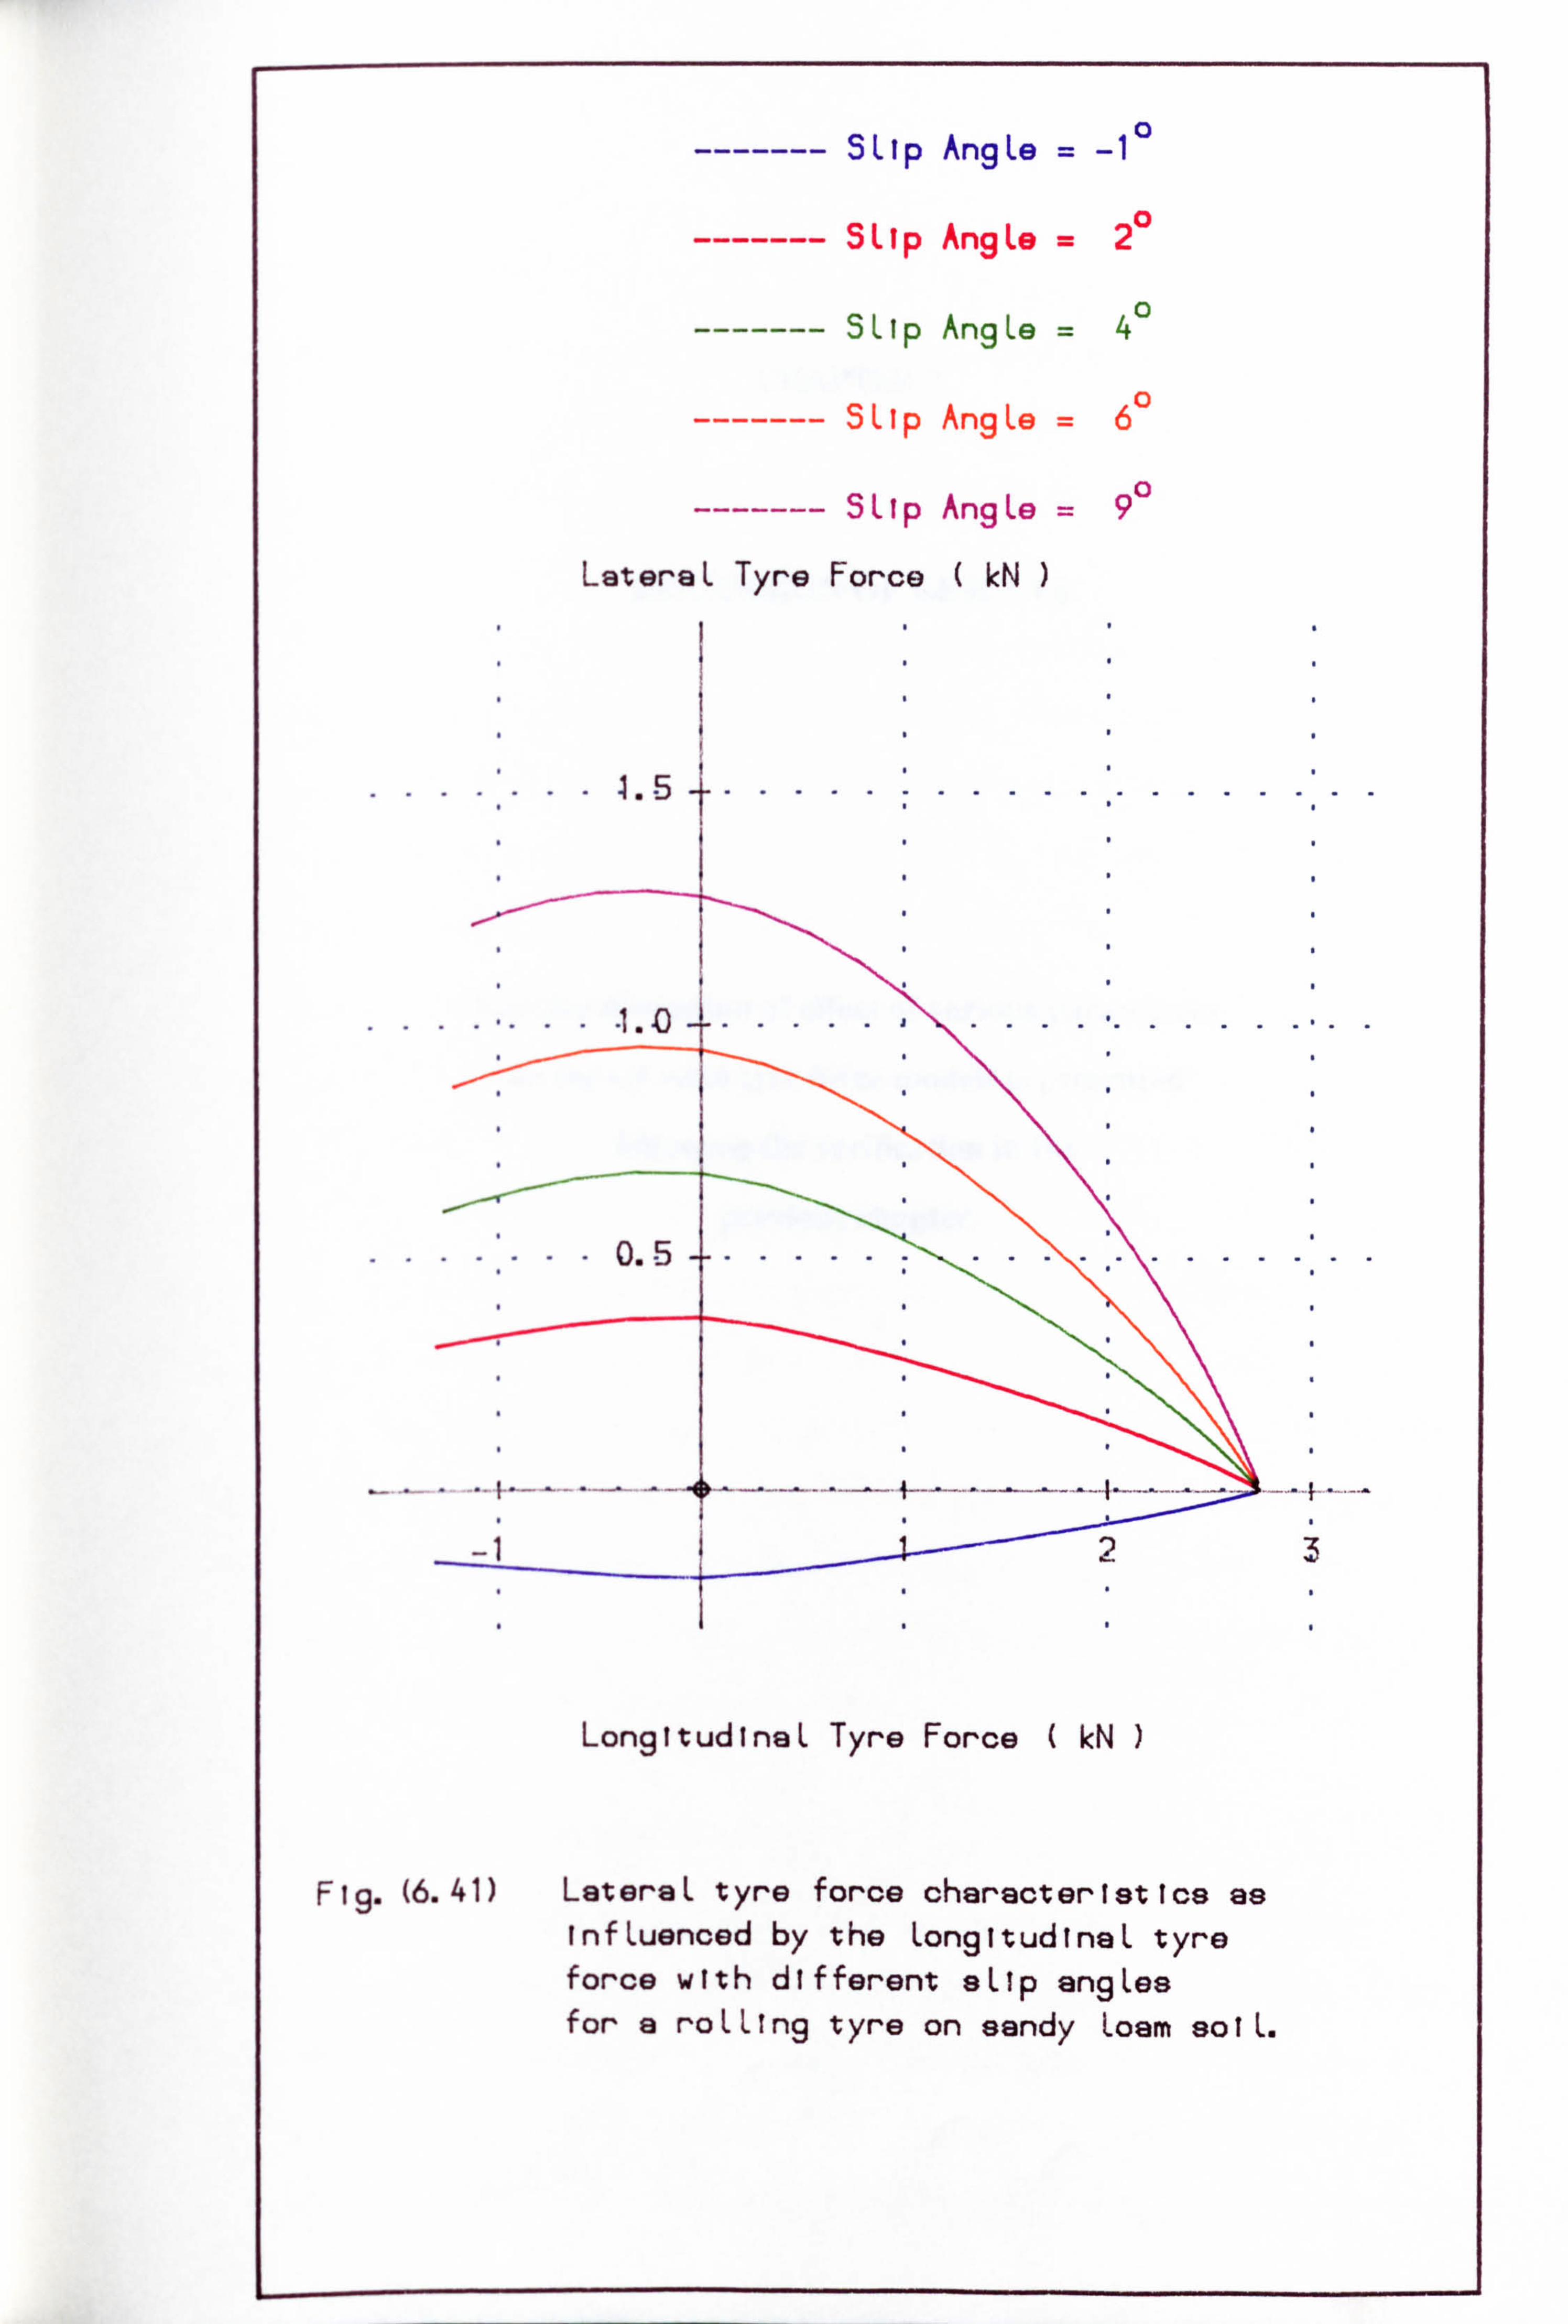
SLIp AngLe = -1 0
SLIp AngLe =20
SLIp AngLe =40
-- SLIp AngLe = 6"
SLIp AngLe =90
LongitudinaL Tyre Force ( kN )
Fig. (6.41) LateraL tyre force characteristics as InfLuenced by the LongitudinaL tyre force with different eLlp angLes for a roLLIng tyre on sandy Loam soiL.
LateraL Tyre Force ( kN )
CHAPTER7
DISCUSSION OF RESULTS
Further discussion of effect of various parameters
on the off-road tyre force models is presented
following the verification in the
previous chapter.
-182-
7.1. INTRODUCTION
This chapter concerns the presentation of results obtained from the various off-road
tyre models that have been developed to help investigate the handling and stability of
off-road vehicles under specific operating conditions of wheelslip or wheelskid
(traction or braking condition), slip angle and tyre load.
The predicted and measured results for various operating conditions have the
same trends with slight differences in the magnitudes. This difference is expected as
the data used in the models do not exactly match those used for the experiments usually
because of insufficient data being provided in experimental papers or because it is
presented in a form different from that used in the model.
General trends of the lateral force vs. slip angle relationship for a 7.50 x 18 front
tractor tyre, for example are very close to those results obtained by Schwanghart
[1968], Grecenko [1975], Matejka [1977] and Sharp and EI-Nashar [1986] under
similar operating conditions of slip angle, wheelslip and tyre loads.
With regard to Chapter 6, some insight into the general behavioural trends has
been gained when comparing the results of off-road tyre force models with those
obtained experimentally by a wide range of researchers. The factors affecting the
behaviour of off-road tyre forces can be shown to have differing relative importance.
71ese factors can be categorised into three main types. Firstly, the influence of the tyre
load, second, the influence of the slip angle and finally the influence of wheelslip. The
following results all refer to the spoke tyre model.
7.2. INFLUENCE OF TYRE LOAD
The radial tyre deflection and the soil sinkage are influenced by tyre load for a
static tyre as shown in Fig. (7.1). The resulting tyre deflection and the soil sinkage
noticeably increase with increasing tyre load. The maximum value of the soil sinkage
and radial deflection occur at the centre of the wheel and decreases symmetrically till it
reaches the minimum value at ends of the contact length. The effects of the tyre load
-183-
on the vertical and horizontal force distributions along the length of the contact region
are shown in Fig. (7.2). The results show that the tyre forces generated from a static tyre
on a deformable surface are significantly influenced by the tyre load.
lie relationship between the lateral tyre force and tyre load is shown in Fig. (7.3).
The curves representing this relationship are dependent on slip angle, the slope
increasing with an increase in the slip angle. In general, lateral tyre force increases
with the increasing tyre load with the shape of the relationship changing slightly as slip
angle is increased from 5 to 30'.
The, relationship between longitudinal tyre force and tyre load in Fig. (7.4) shows
that the longitudinal tyre force increases significantly with increasing tyre load at
constant wheelslip in an approximately linear manner over the range tested which
represents approximately ± 20% of the nominal tyre rated load.
7.3. INFLUENCE OF SLIP ANGLE
The influence of slip angle on lateral tyre force is shown in Fig. (7.5). The relationship
between the lateral tyre force and slip angle with various wheelslip values indicates that
the lateral tyre force increases with an increase in slip angle in an approximately
exponential manner. This result confirms the measured results obtained by
Schwanghart [1968]. Fig. (7.6) shows the influence of slip angle on longitudinal iyre
force with different wheelslip ranged between 5% and 30%. Increasing slip angle
produces decreases longitudinal tyre force.
Fig. (7.7) shows the influence of the slip angle on the lateral tyre force generated
with various tyre loads. The tyre load is ranged from 2 up to 12 W and slip angle from
0 to 45". The general trend of lateral tyre force vs. slip angle at different tyre loads is
very close to the results measured by Schwanghart [1968].
Lateral and longitudinal force coefficient distributions throughout the length of
the contact region are shown in Fig. (7.8). As the slip angle increases the lateral force
coefficient increases, while the longitudinal force coefficient decreases. In general, the
-184-
resultant of lateral and longitudinal force act at some distance behind the contact centre.
This distance decreased with increasing slip angle in the case of the lateral force
coefficient and it is this distance together with the force which controls the value of the
aligning moment. The initial slope of the relationship between the aligning moment and
slip angle is increased with tyre load increasing as shown in Fig. (7.9). As slip angle is
then increased further, two things happen : the lateral force increases but the distance of
its effective line of action relative to the tyre centreline decreases. Tbus, the aligning
moment reaches a maximum value and then drops to lower values. The way in which
this trend is affected by tyre load is shown in detail in Fig. (7.9). Fig. (7.10) illustrates
the relationships between the lateral tyre force and the aligning moment with different
tyre load. The initial slope of this relationship is decreased with an increasing tyre load.
on other hand, in the case of the longitudinal force coefficient, both the force
itself and the distance of the effective line of action of the resultant longitudinal force
behaind the tyre centreline continue to decrease with increasing slip angle as more of
the soil shear forces are used up in generating lateral force.
7.4. INFLUENCE OF WIIEELSLIP
Wheelslip significantly influences lateral tyre force as shown in Fig. (7.11). For a
specific slip angle, the lateral tyre force decreases as wheelslip increases as more of the
soil forces are used to generate longitudinal force. the rate of increasing decreased with
increase of the slip angle. Fig. (7.12) illustrates the relationship between the
longitudinal tyre force and wheelslip at different slip angles. The slip angle
significantly affects the shape of the important tractive force vs. wheelslip curve, and in
marginal traction conditions it is clear that trying to manoeuvre a vehicle and thereby
generating slip angles at the tyres could cause the vehicle to stall through insufficient
traction force being available.
In Fig. (7.13) the longitudinal tyre force is plotted against wheelslip with various
tyre loads. Ilie slope of the relation between longitudinal tyre force and wheelslip
-185-
shows a significant increase as tyre load increases. The behaviour of lateral and
longitudinal force coefficient distributions through the length of the contact region are
shown in Fig. (7.14). At low values of wheelslip, most of the longitudinal force is
generated at the rear of the contact area. However, as the wheelslip increases, more of
the contact area is used to generate force and the shape of the curve changes.
The overall behaviour of the tyre as summarised in Fig. (7.15), gives a complete
assessment of the influence of the main factors of the operating conditions. The forces
available under any general conditions of slip angle, wheel slip or skid can be
interpolated from these curves.
These relationships between lateral force, braking force, tractive force, wheelslip
and slip angle, illustrated in the friction ellipse graph shown in Fig. (7.15), are for a 7.50
x 18 front tractor tyre in sandy loam soil with a tyre load of 5.2 kN. The longitudinal
force (braking or tractive) significantly decreases with increasing lateral force as shown
by lines of constant slip angle. On the other hand, there is a relatively sharp fall in
lateral force with increasing tractive force at constant wheelslip, with a slow rising of
the lateral force with braking force at constant wheelskid.
As a result, the relationships between the lateral and longitudinal forces are
asymmetric. Of course, the distance that the tyre travels when subject to a tractive
operating condition will be less than that in the free rolling case Whereas when a
braking operating condition is applied, the distance will be greater than that in free
rolling condition. However, the braking force gives a higher obtainable lateral force
than when the tyre is producing a tractive force. The presence of the tractive force
means that a higher slip angle is required to generate the same lateral force as in
braking conditions.
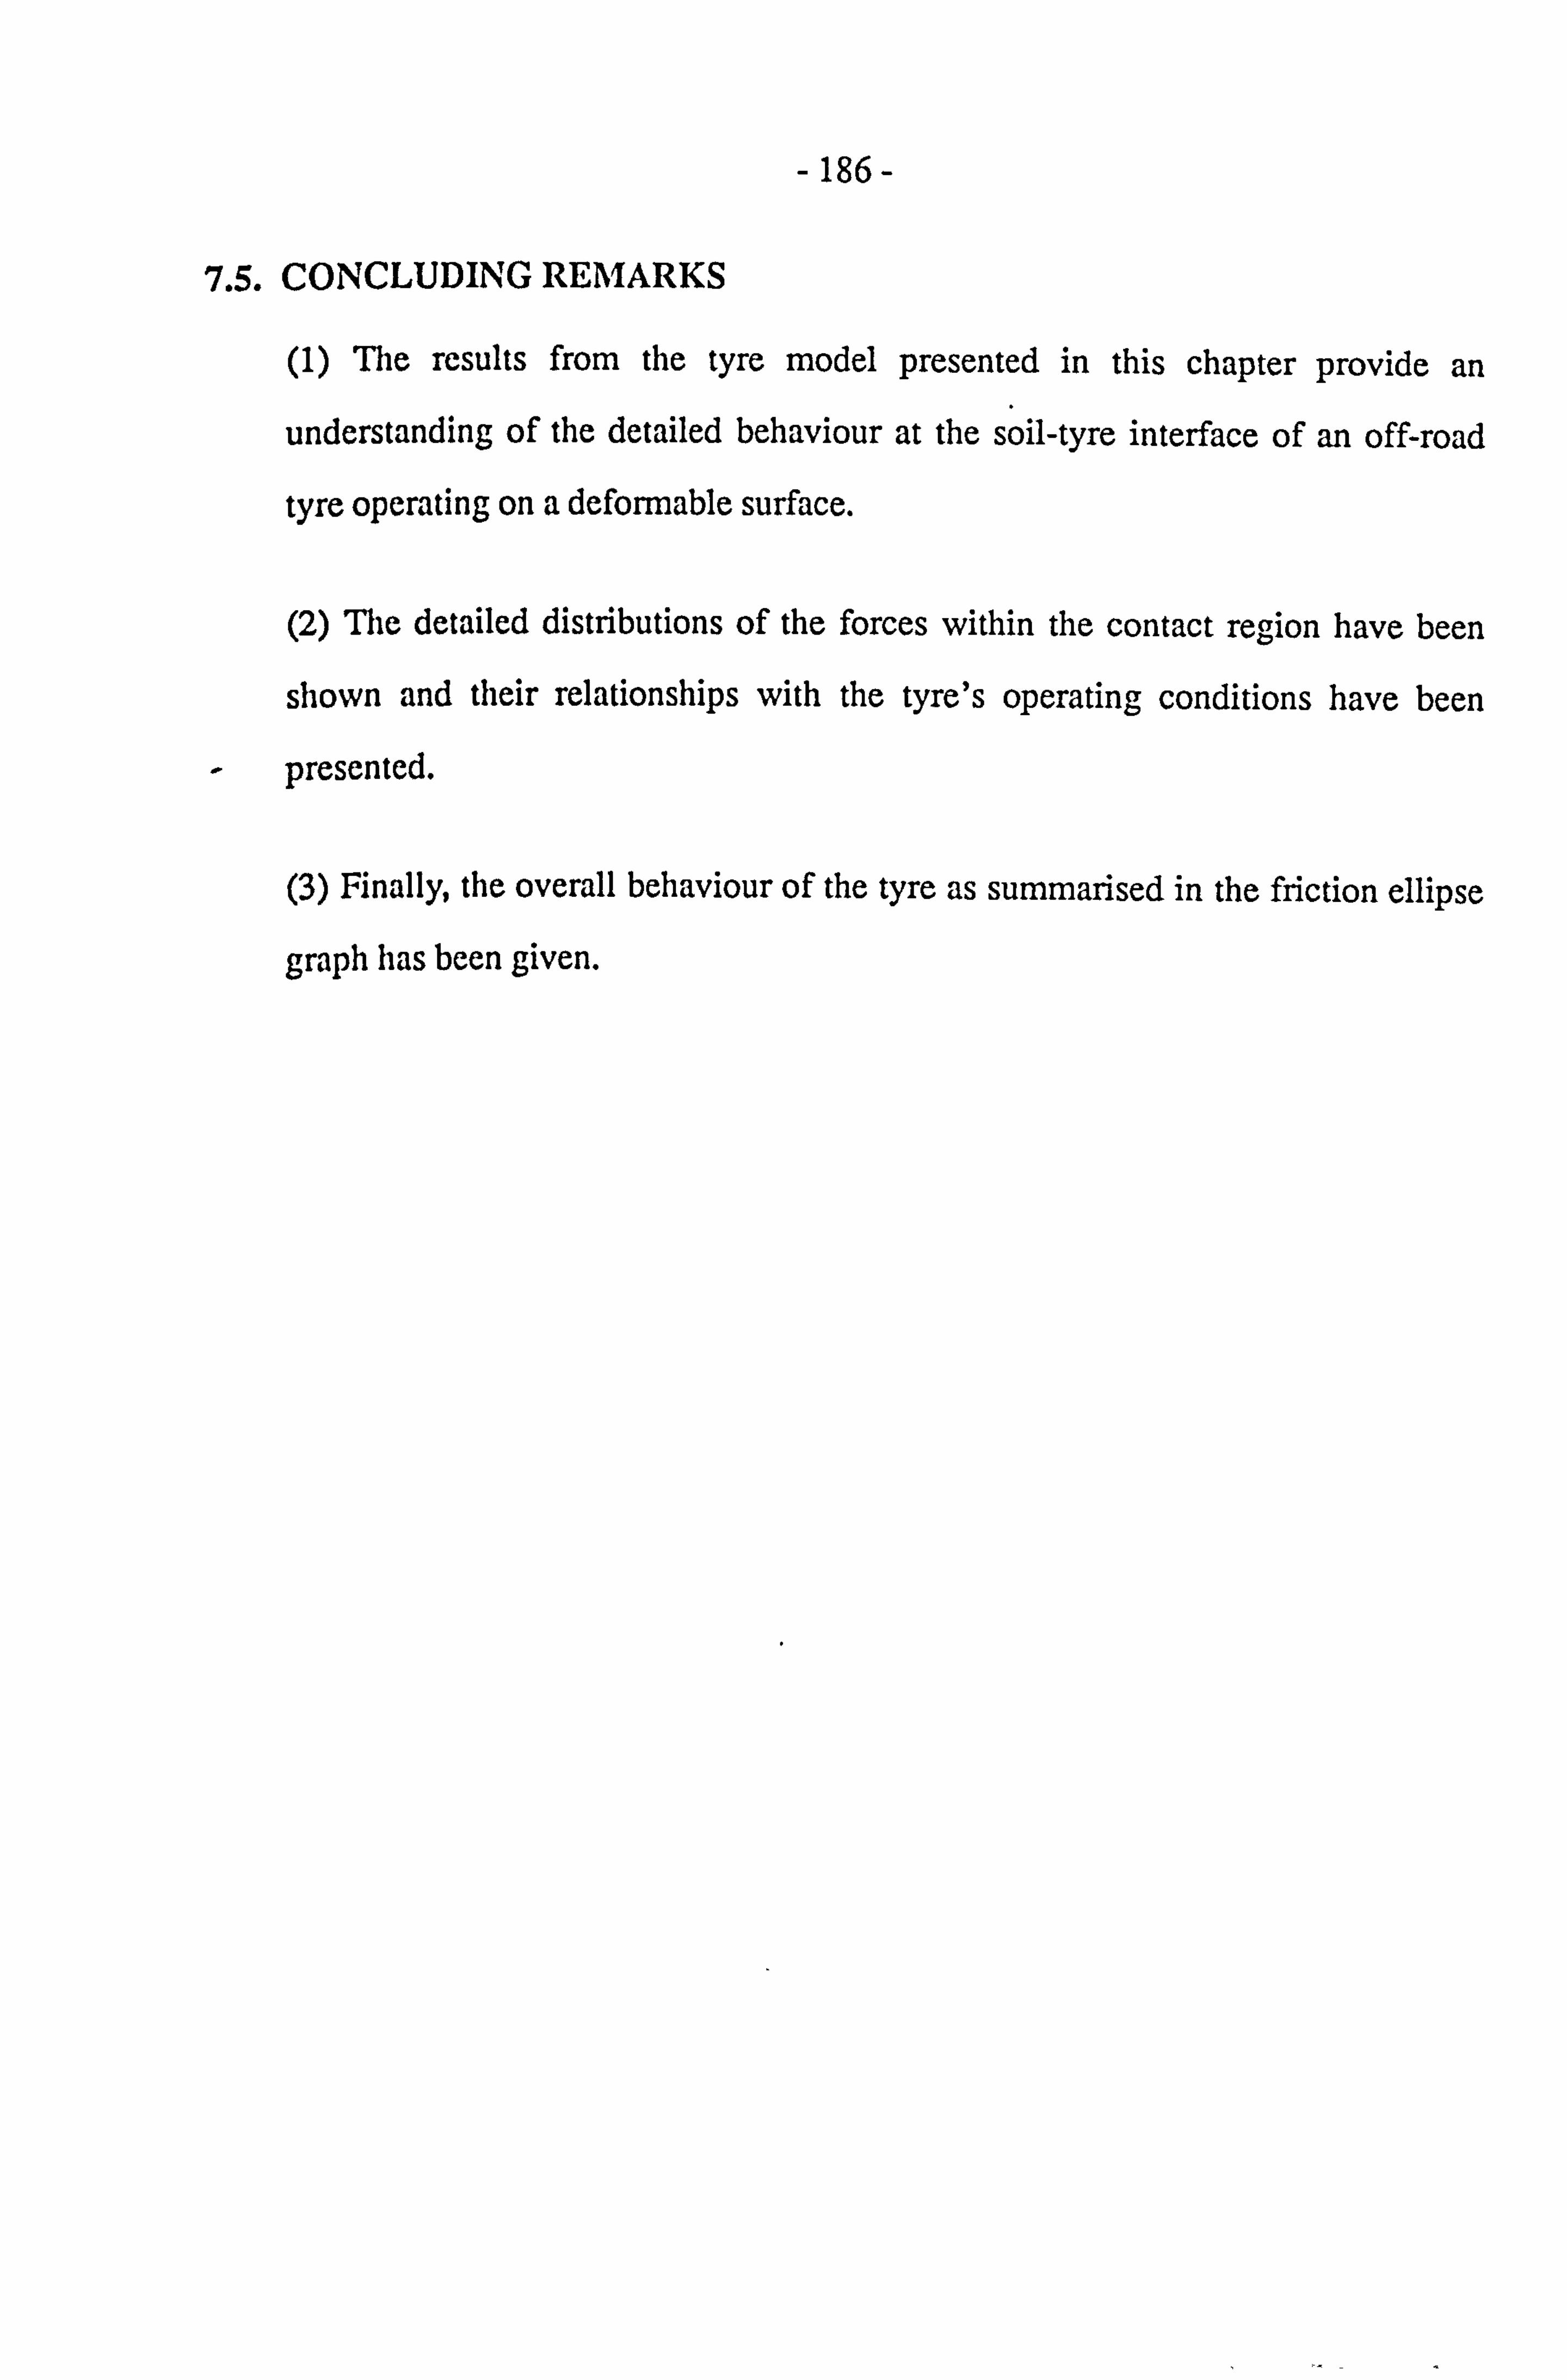
-186-
7.5. CONCLUDING REMARKS
(1) The results from the tYre model presented in this chapter provide an
understanding of the detailed behaviour at the soil-tyre interface of an off-road
tyre operating on a deformable surface.
(2) I'lie detailed distributions of the forces within the contact region have been Zý shown and their relationships with the tyre's operating conditions have been
presented.
(3) Finally, the overall behaviour of the tyre as surnmarised in the fliction ellipse
graph has been given.
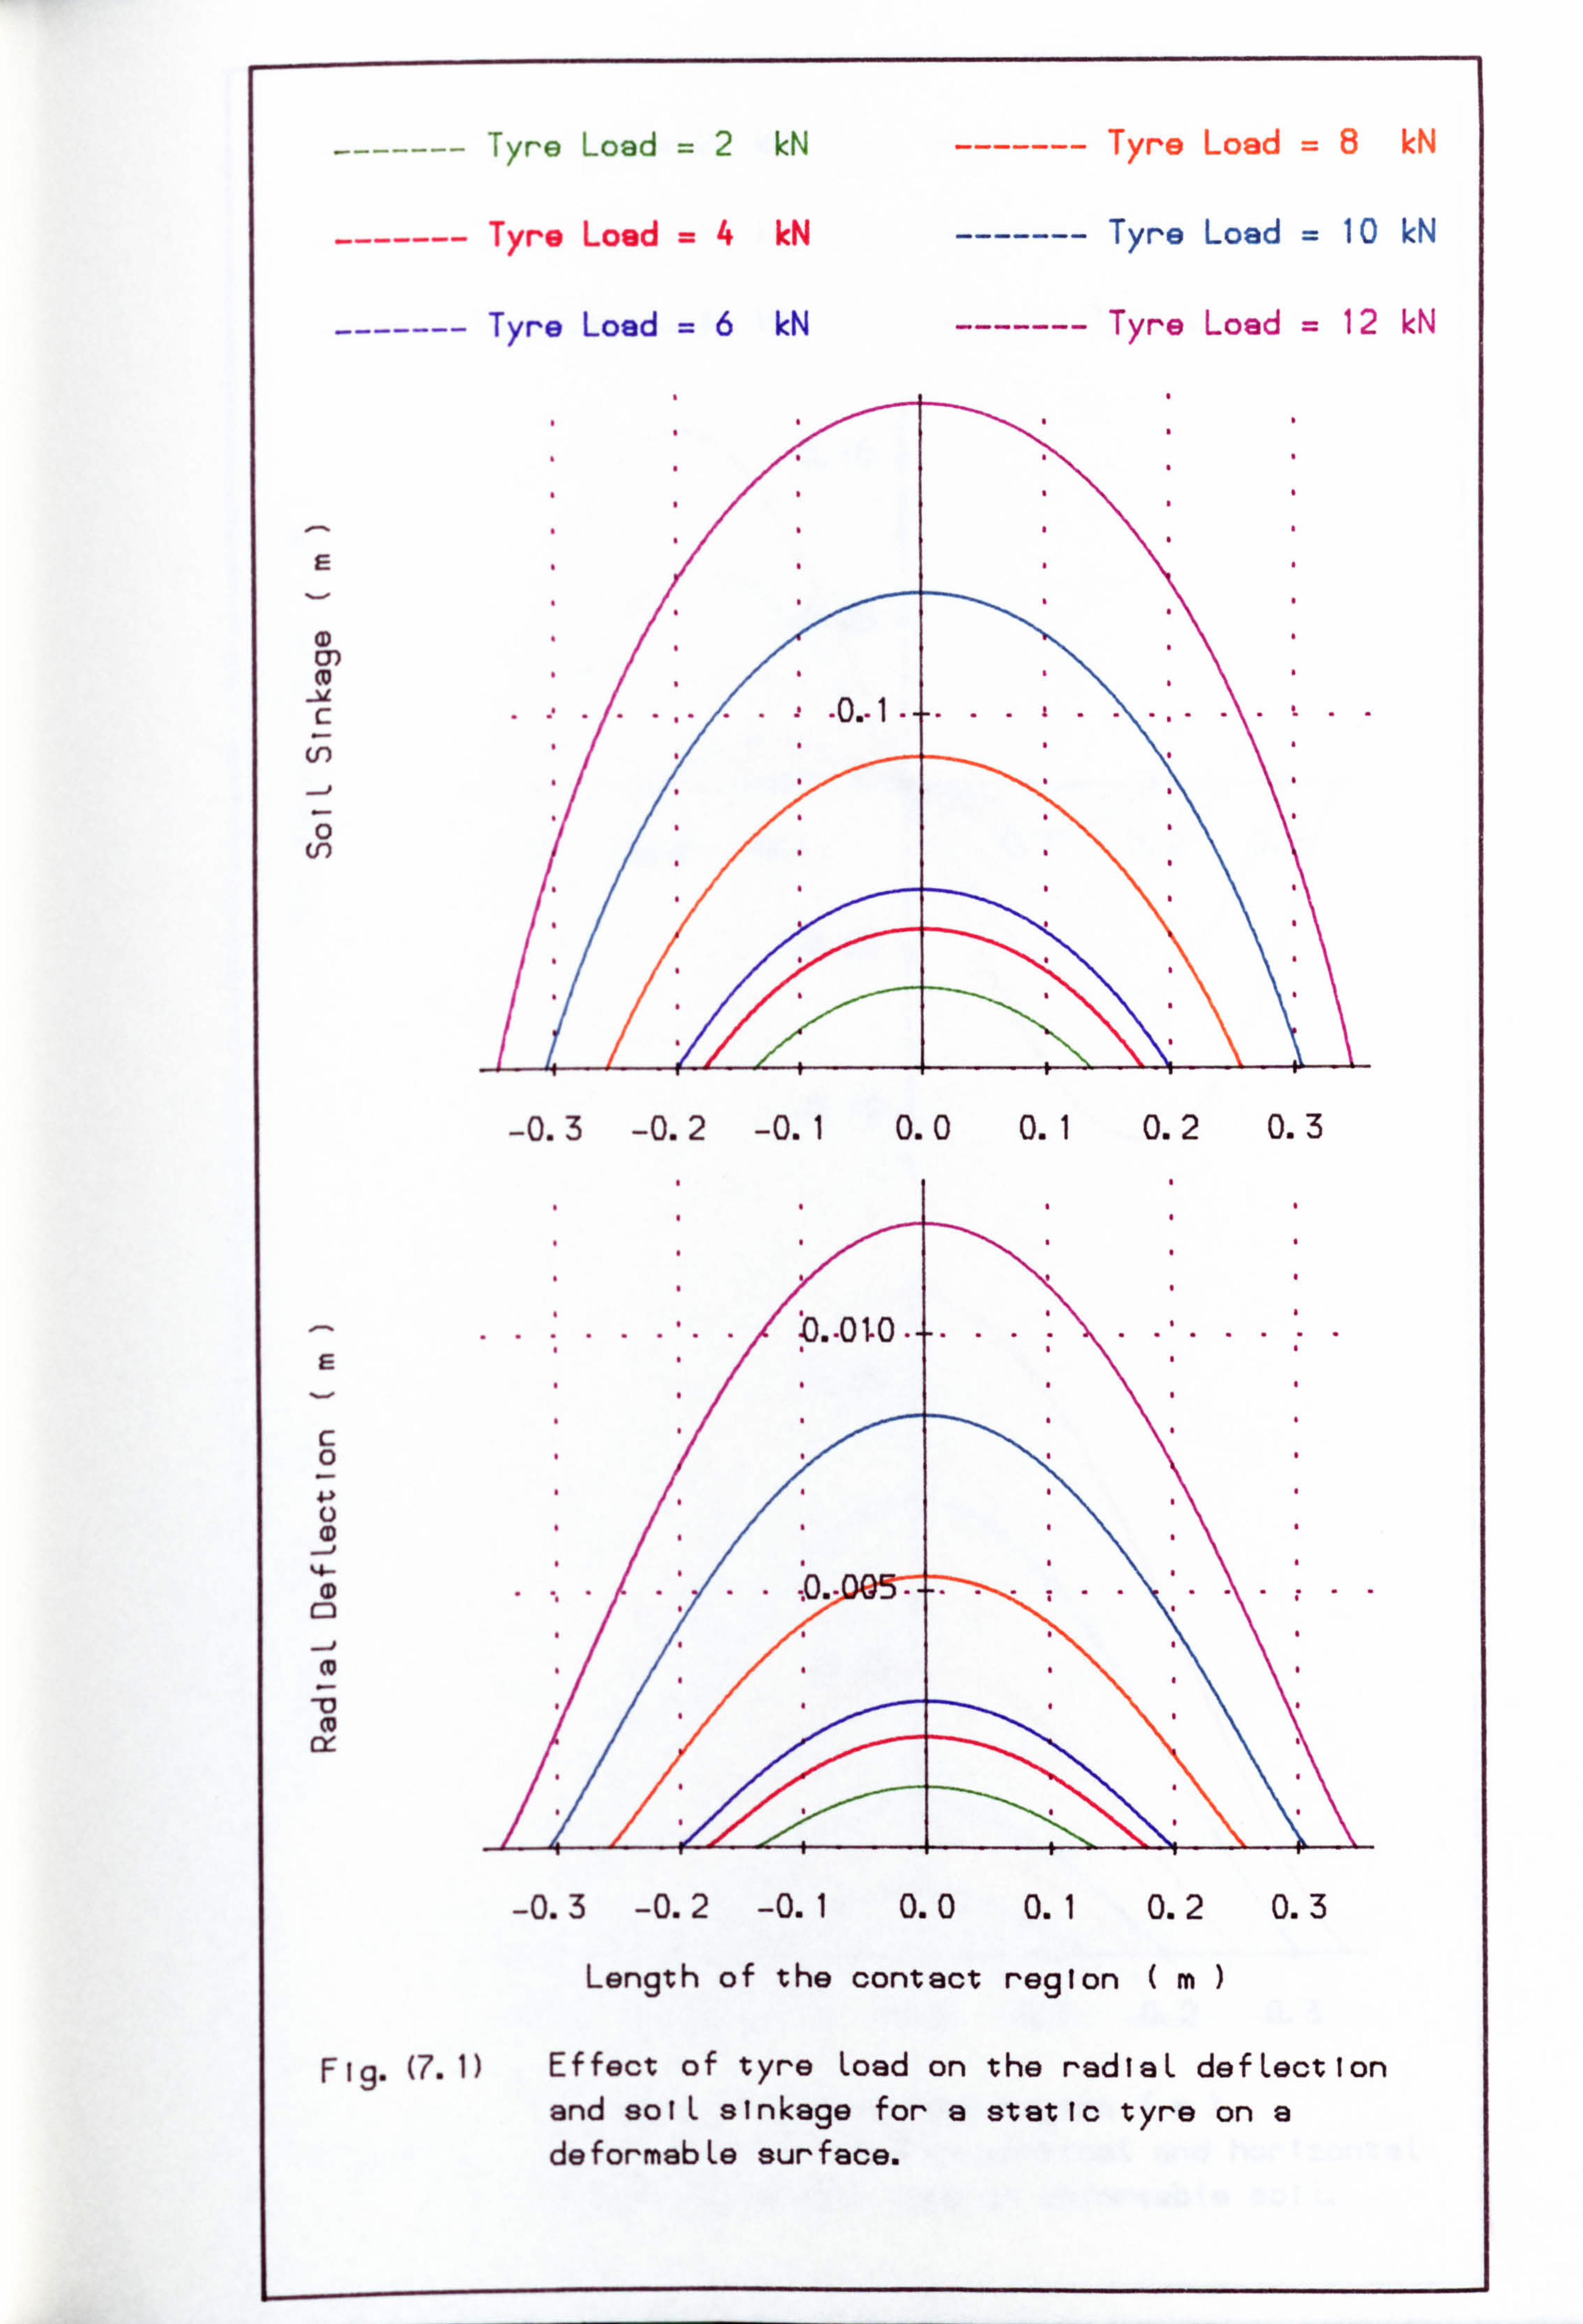
--- ---- Tyre Load = 2 kN -- ----- Tyre Load =8 kN
--- ---- Tyre Load = 4 kN -- ----- Tyre Load = 10 kN
--- ---- Tyre Load = 6 kN -- ----- Tyre Load = 12 kN
E
CY) m
C -0,1 ---- - -I..... ..... LO
0
-0.3 -0.2 -0.1 0.0 0.1 0.2 0.3
C 0
0 .. -. 0, ... ..... .. III C)
-0.3 -0.2 -0.1 0.0 0.1 0.2 0.3
Length of the contact region (m
Fig- (7.1) Effect of tyre Load on the radiaL defLection and solL sinkage for a static tyre on a deformabLe surface.
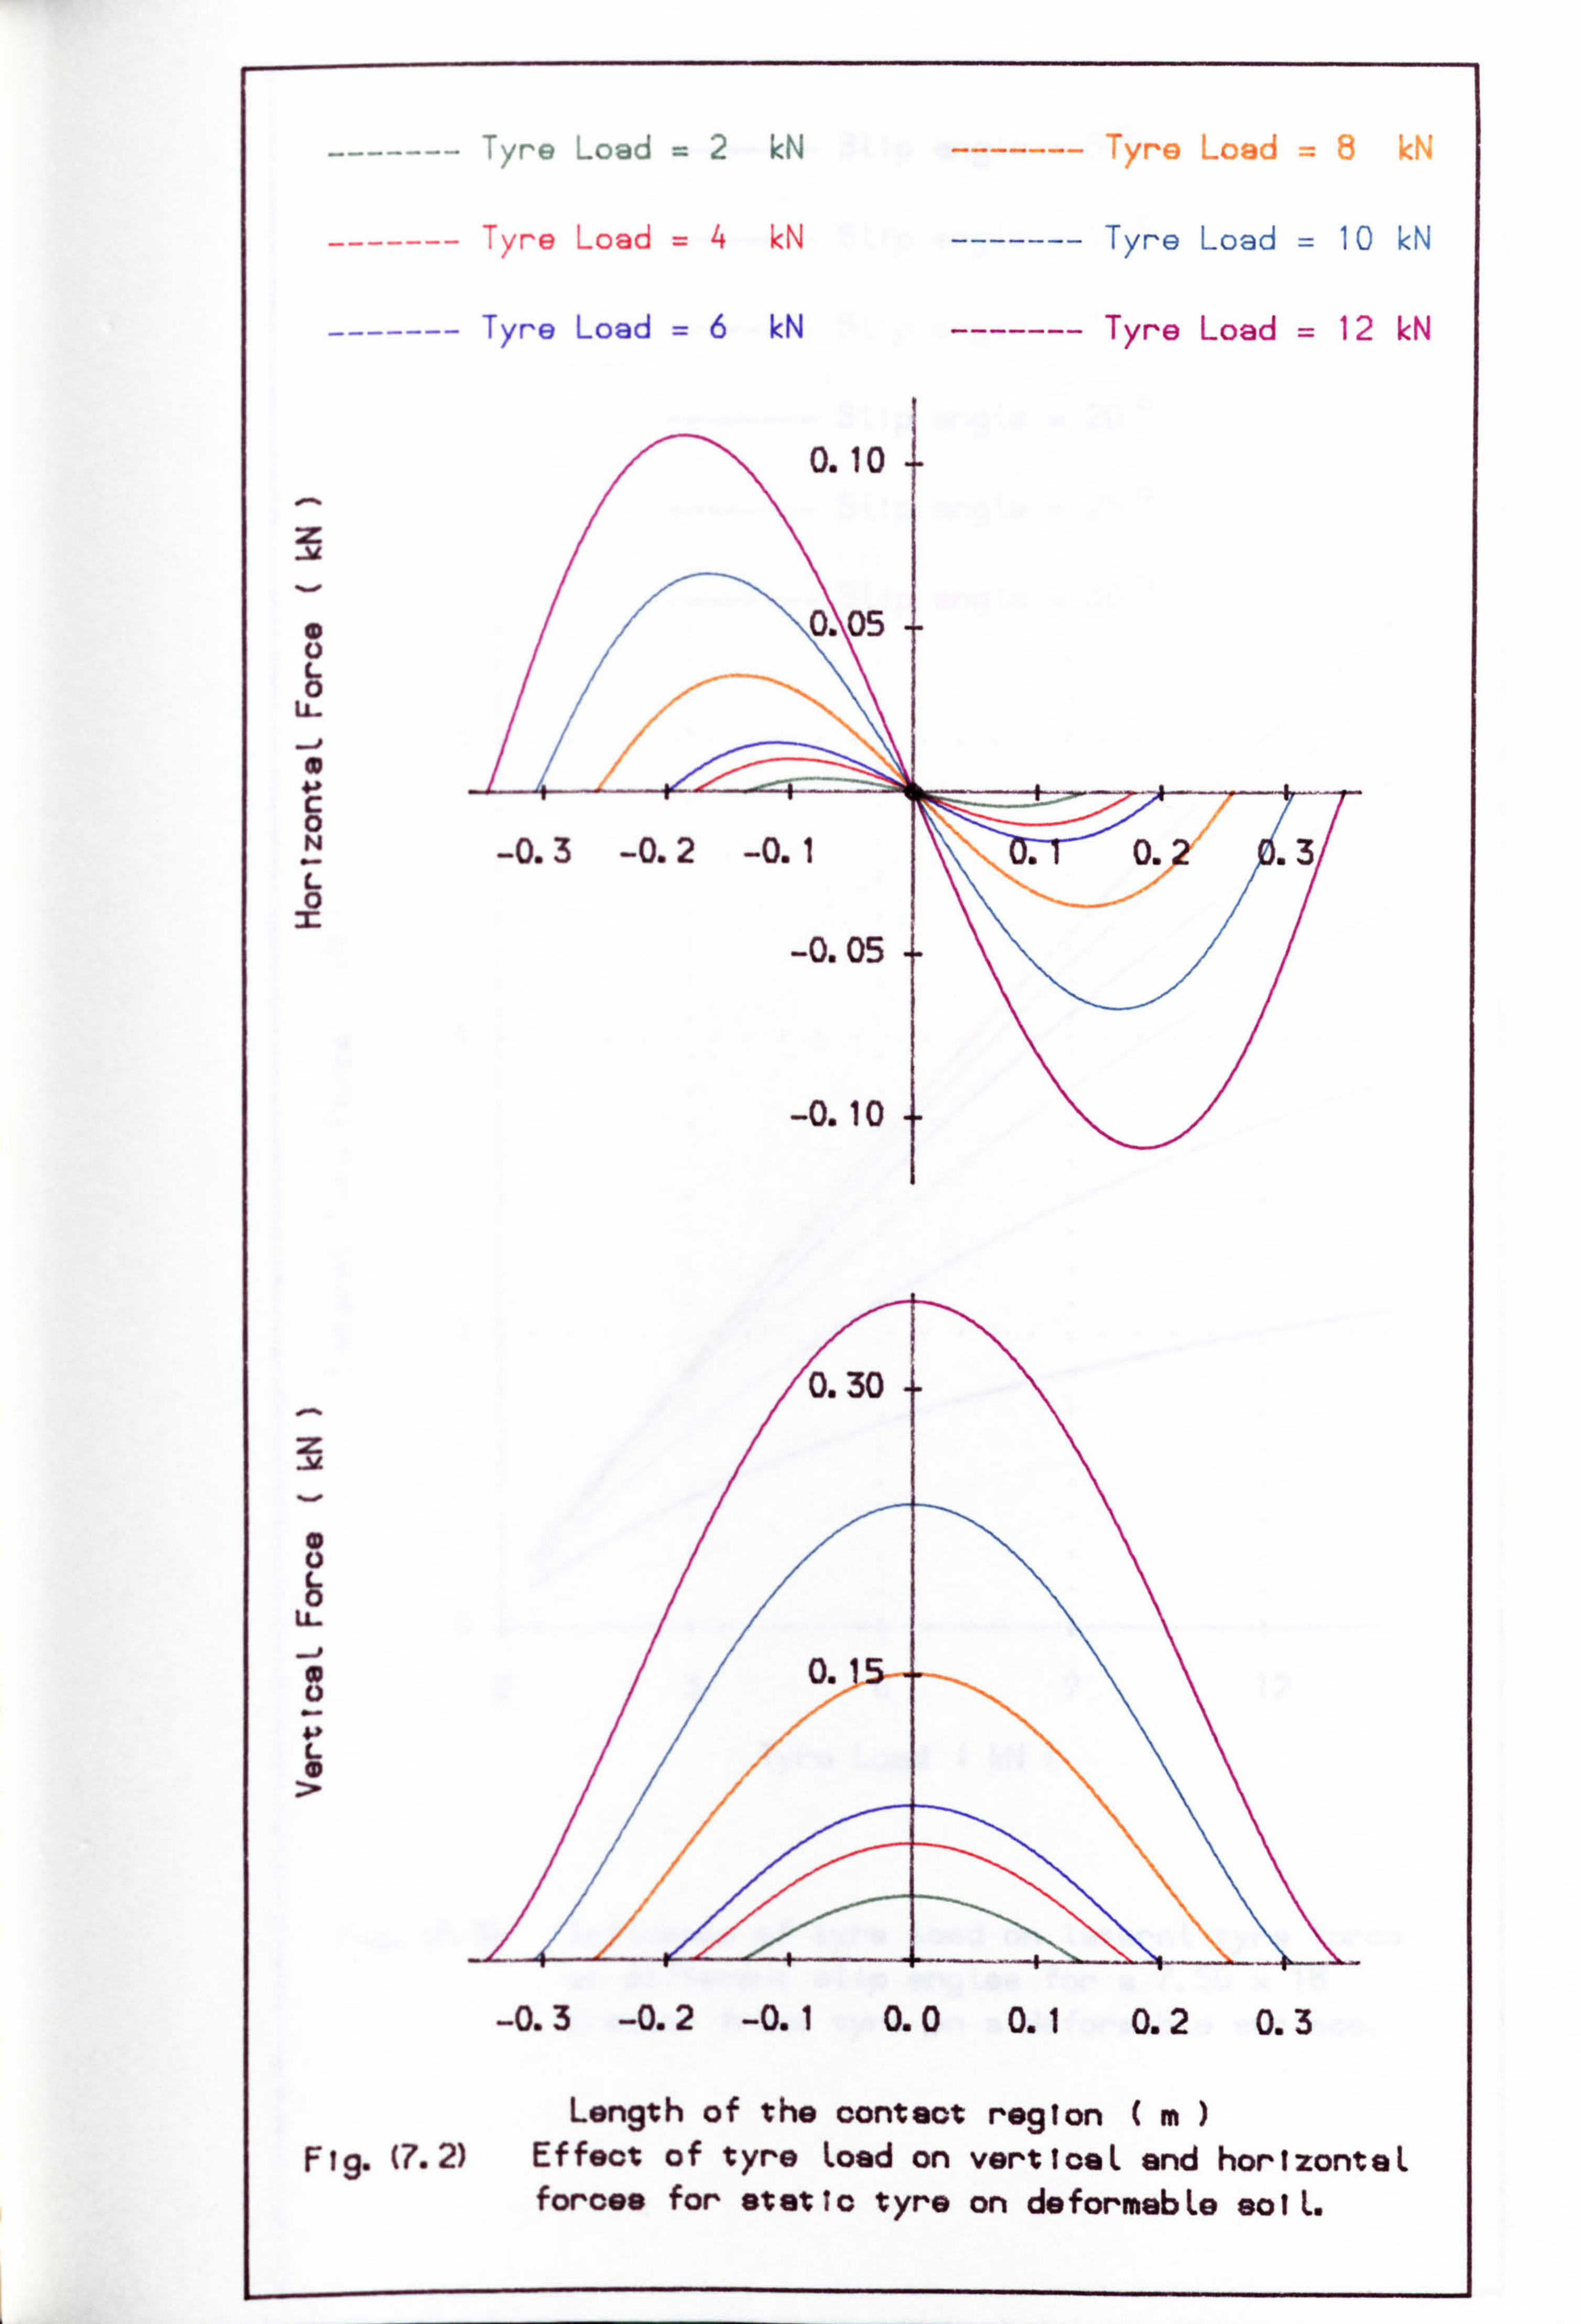
-------
L 0 U-
a
/re 2 kN
yre Load =4 kN ------- T re Load = 10 kN Iy
Tyre Load =6 kN ------- Tyre Load = 12 kN
0.10
0.05 05
04 10
C 0 " N -0.3 -0.2 -0.1 .3 0. ý
.3 2 0 ý
m -0.05
-0.10
0.30
z
U- 0. is
L
-0.3 -0.2 -0.1 0.0 0.1 0.2 0.3
Length of the contact region (m Fig. (7.2) Effect of tyre Load on vertioaL and horlzonteL
forces for static tyro on deformabLe eolL.
SLIp angLe - 50
SLIp angLe = 10
SLIp angLe = 15 0
SLIp angLe = 200
3LIp ang Le = 25 "
2:
L 0
LL- 0 L
6
4
....... ...... ...... ....
12
Tyre Load (
Flg. (7.3) InfLuence of tyre Load on LateraL tyre force at different eLlp angLes for a 7.50 x 18 tractor front tyre on a deformabLe surface.
SLIp engLe = 300
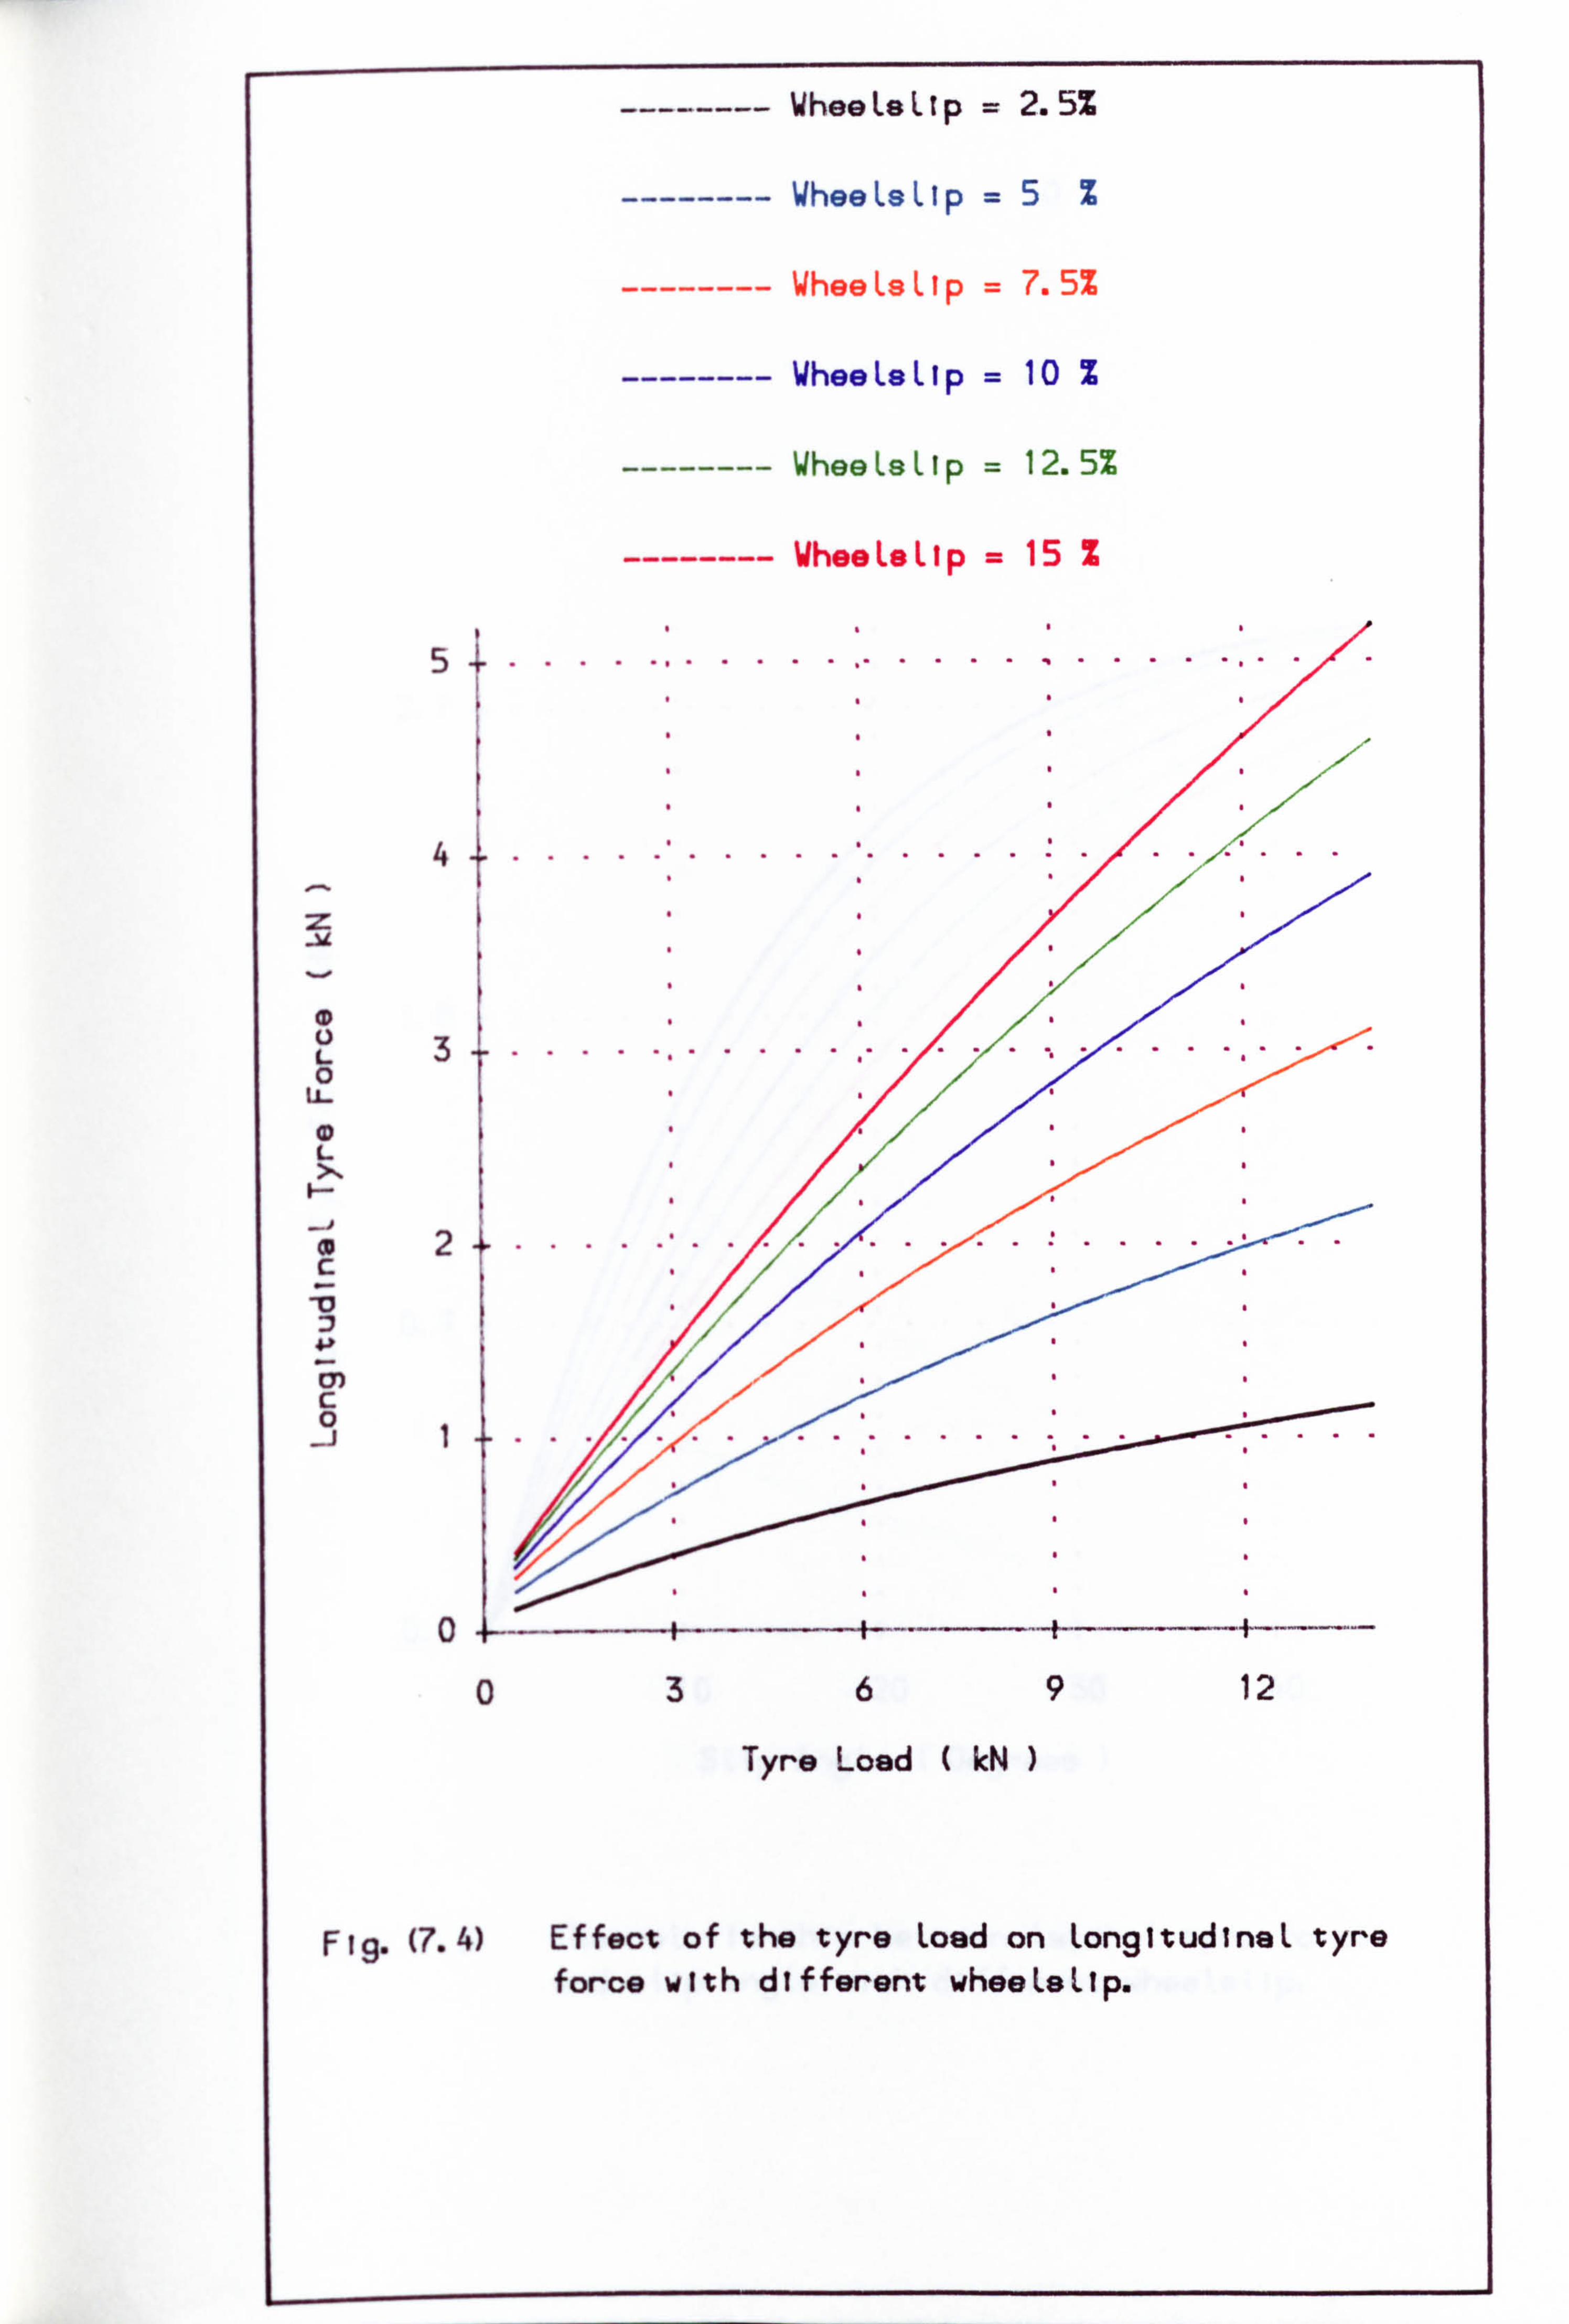
-------- WheeLeLlp = 2.5%
-------- WheeLeLlp =5%
-------- WheeLsLlp = 7.5%
-------- WheeLeLlp = 10 %
-------- WheeLeLlp = 12.5%
-------- WheeLeLip = 15 %
5....... ...... ........... .
4.................... ..
Z:
u L3.. ....... ...... ............ . 0 U-
L
a2..................... .. C
C" C 0
0
0369 12
Tyre Load W
Fig. (7.4) Effect of the tyre Load on LongitudinaL tyre force with different wheeLeLlp.
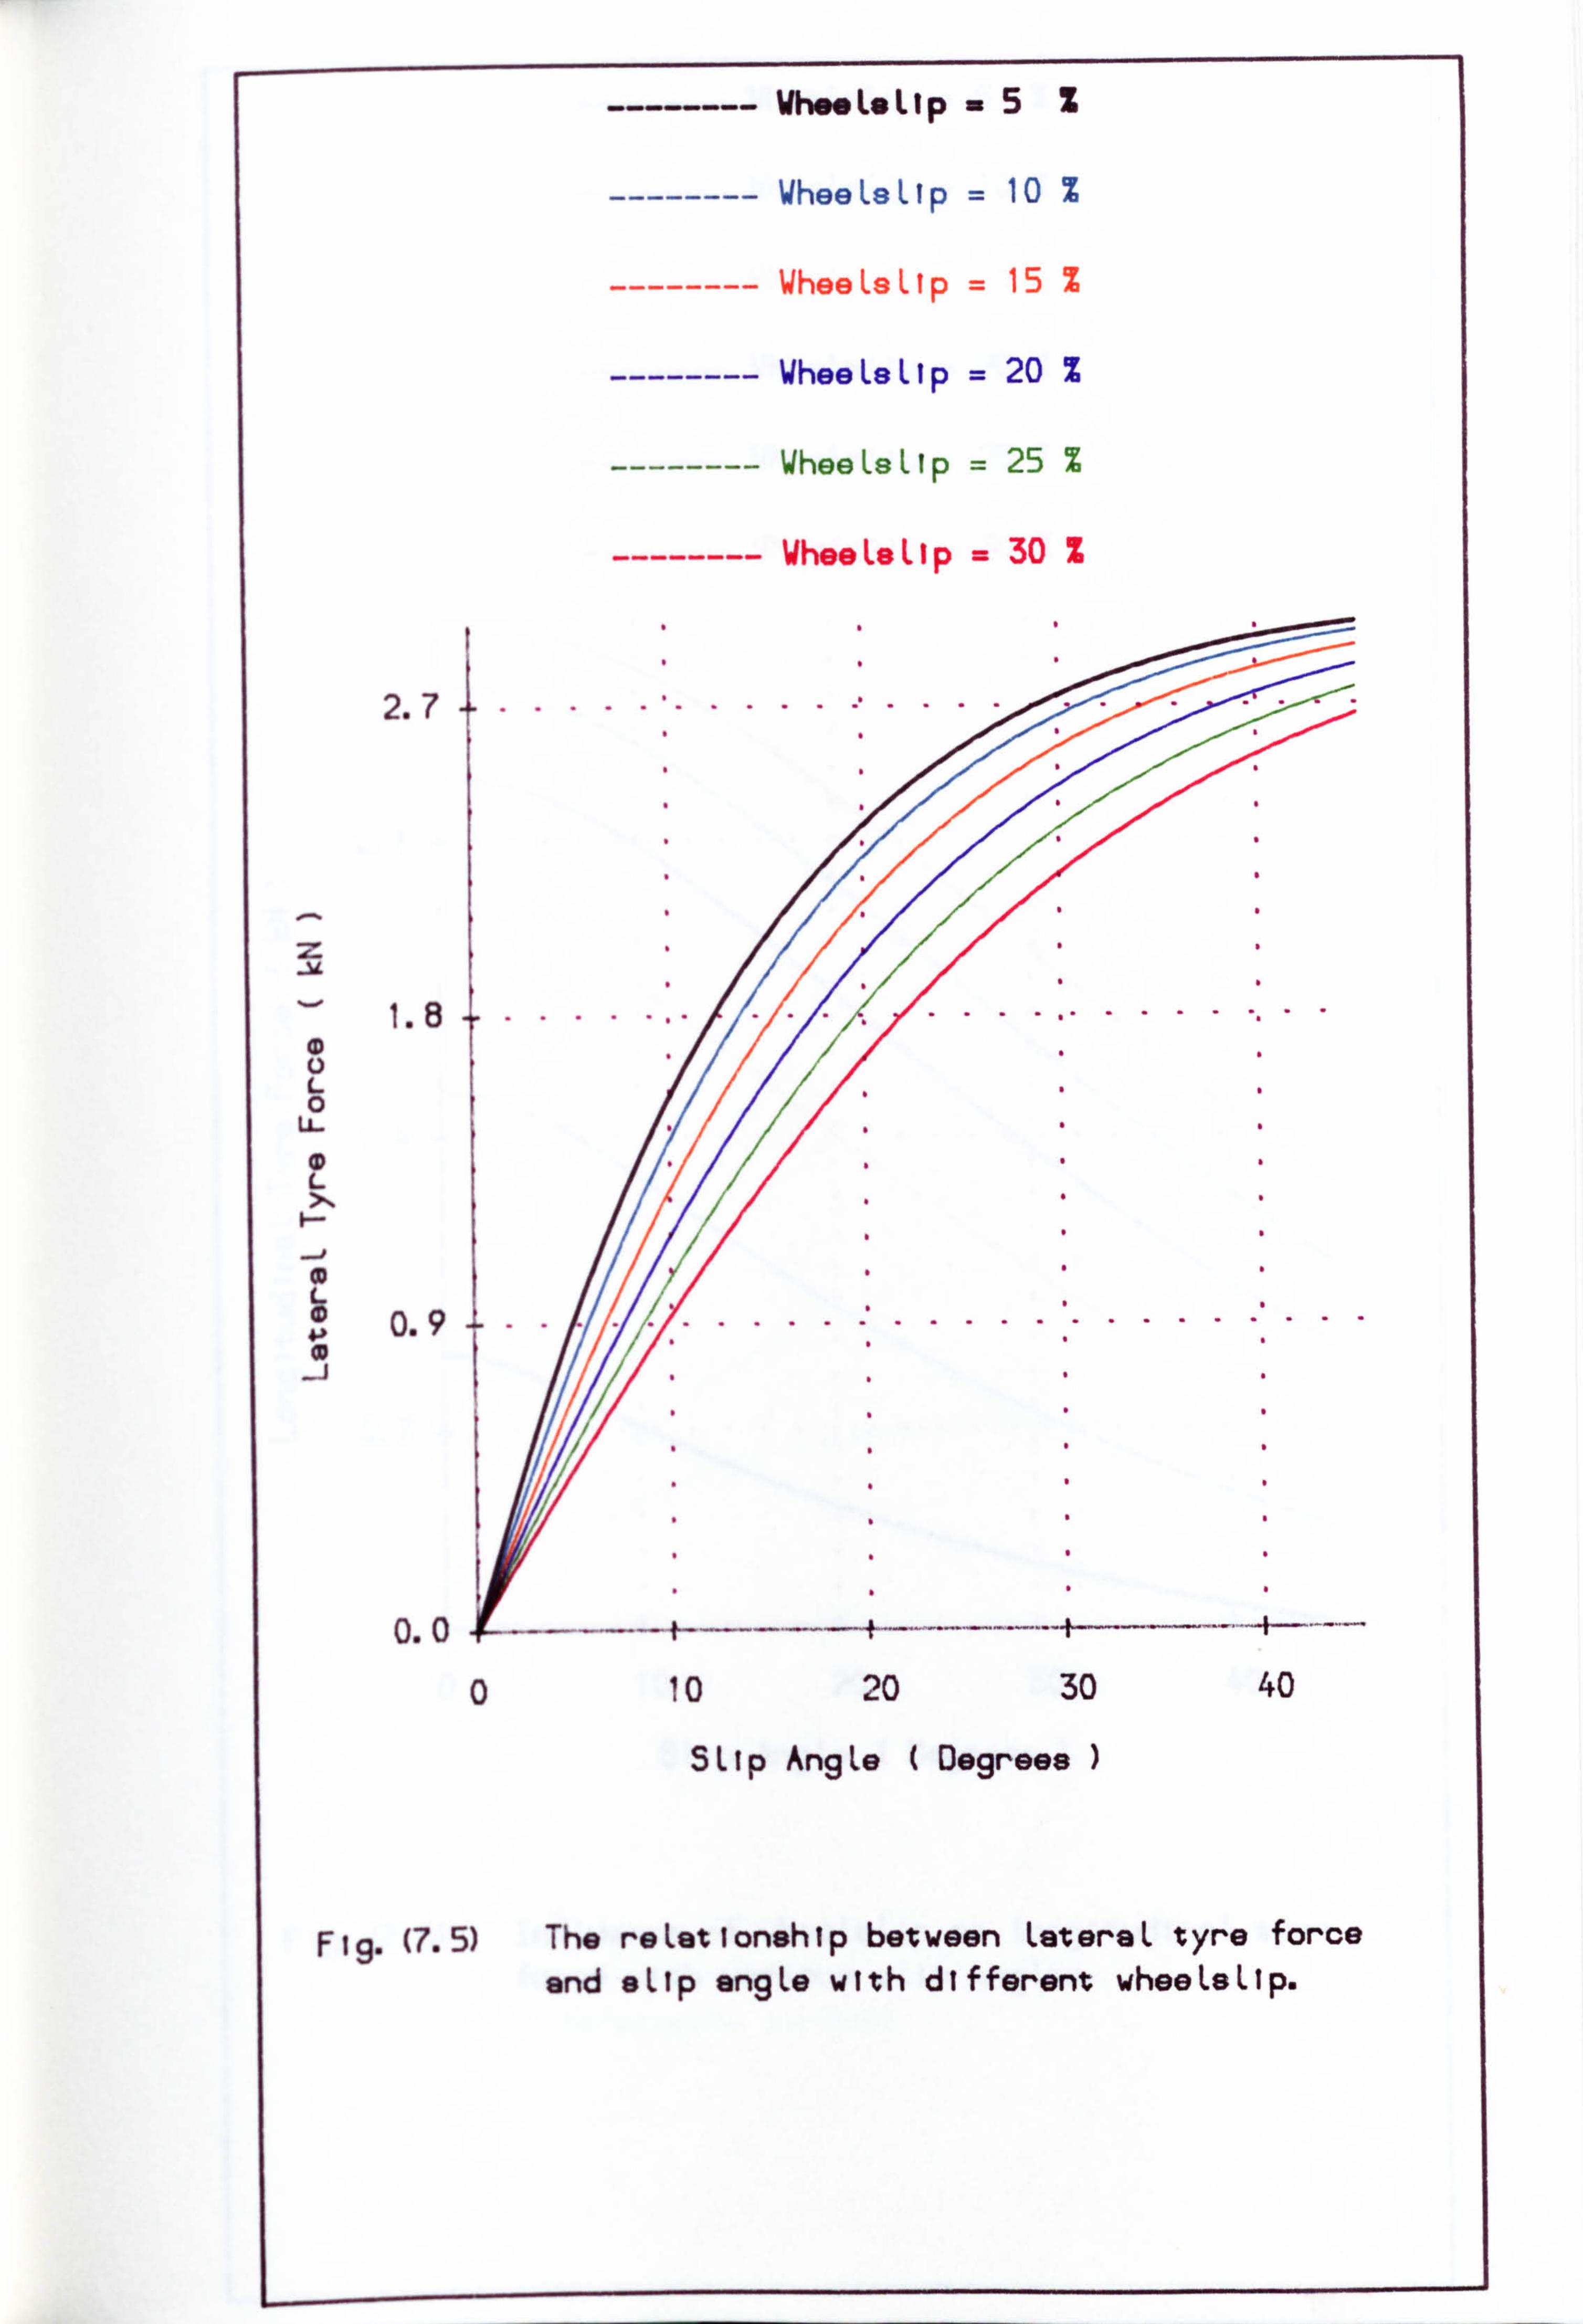
------- WheoLeLlp =5Z
-------- WheeLaLlp = 10 %
-------- WheeLaLtp = 15 %
-------- WheeLsLlp = 20 %
-------- WheeLaLtp = 25 %
-------- WheeLeLlp = 30 Z
2.7
1.8 ....... ...... ...... ..
L 0 U-
L
0.9 . ......... ....
-j
0.0
0 10 20 30 40
5LIp Ang Le Degrees )
Fig. (7.5) The reLationship between LateraL tyre force
and eLlp angLe with different wheeLeLlp.
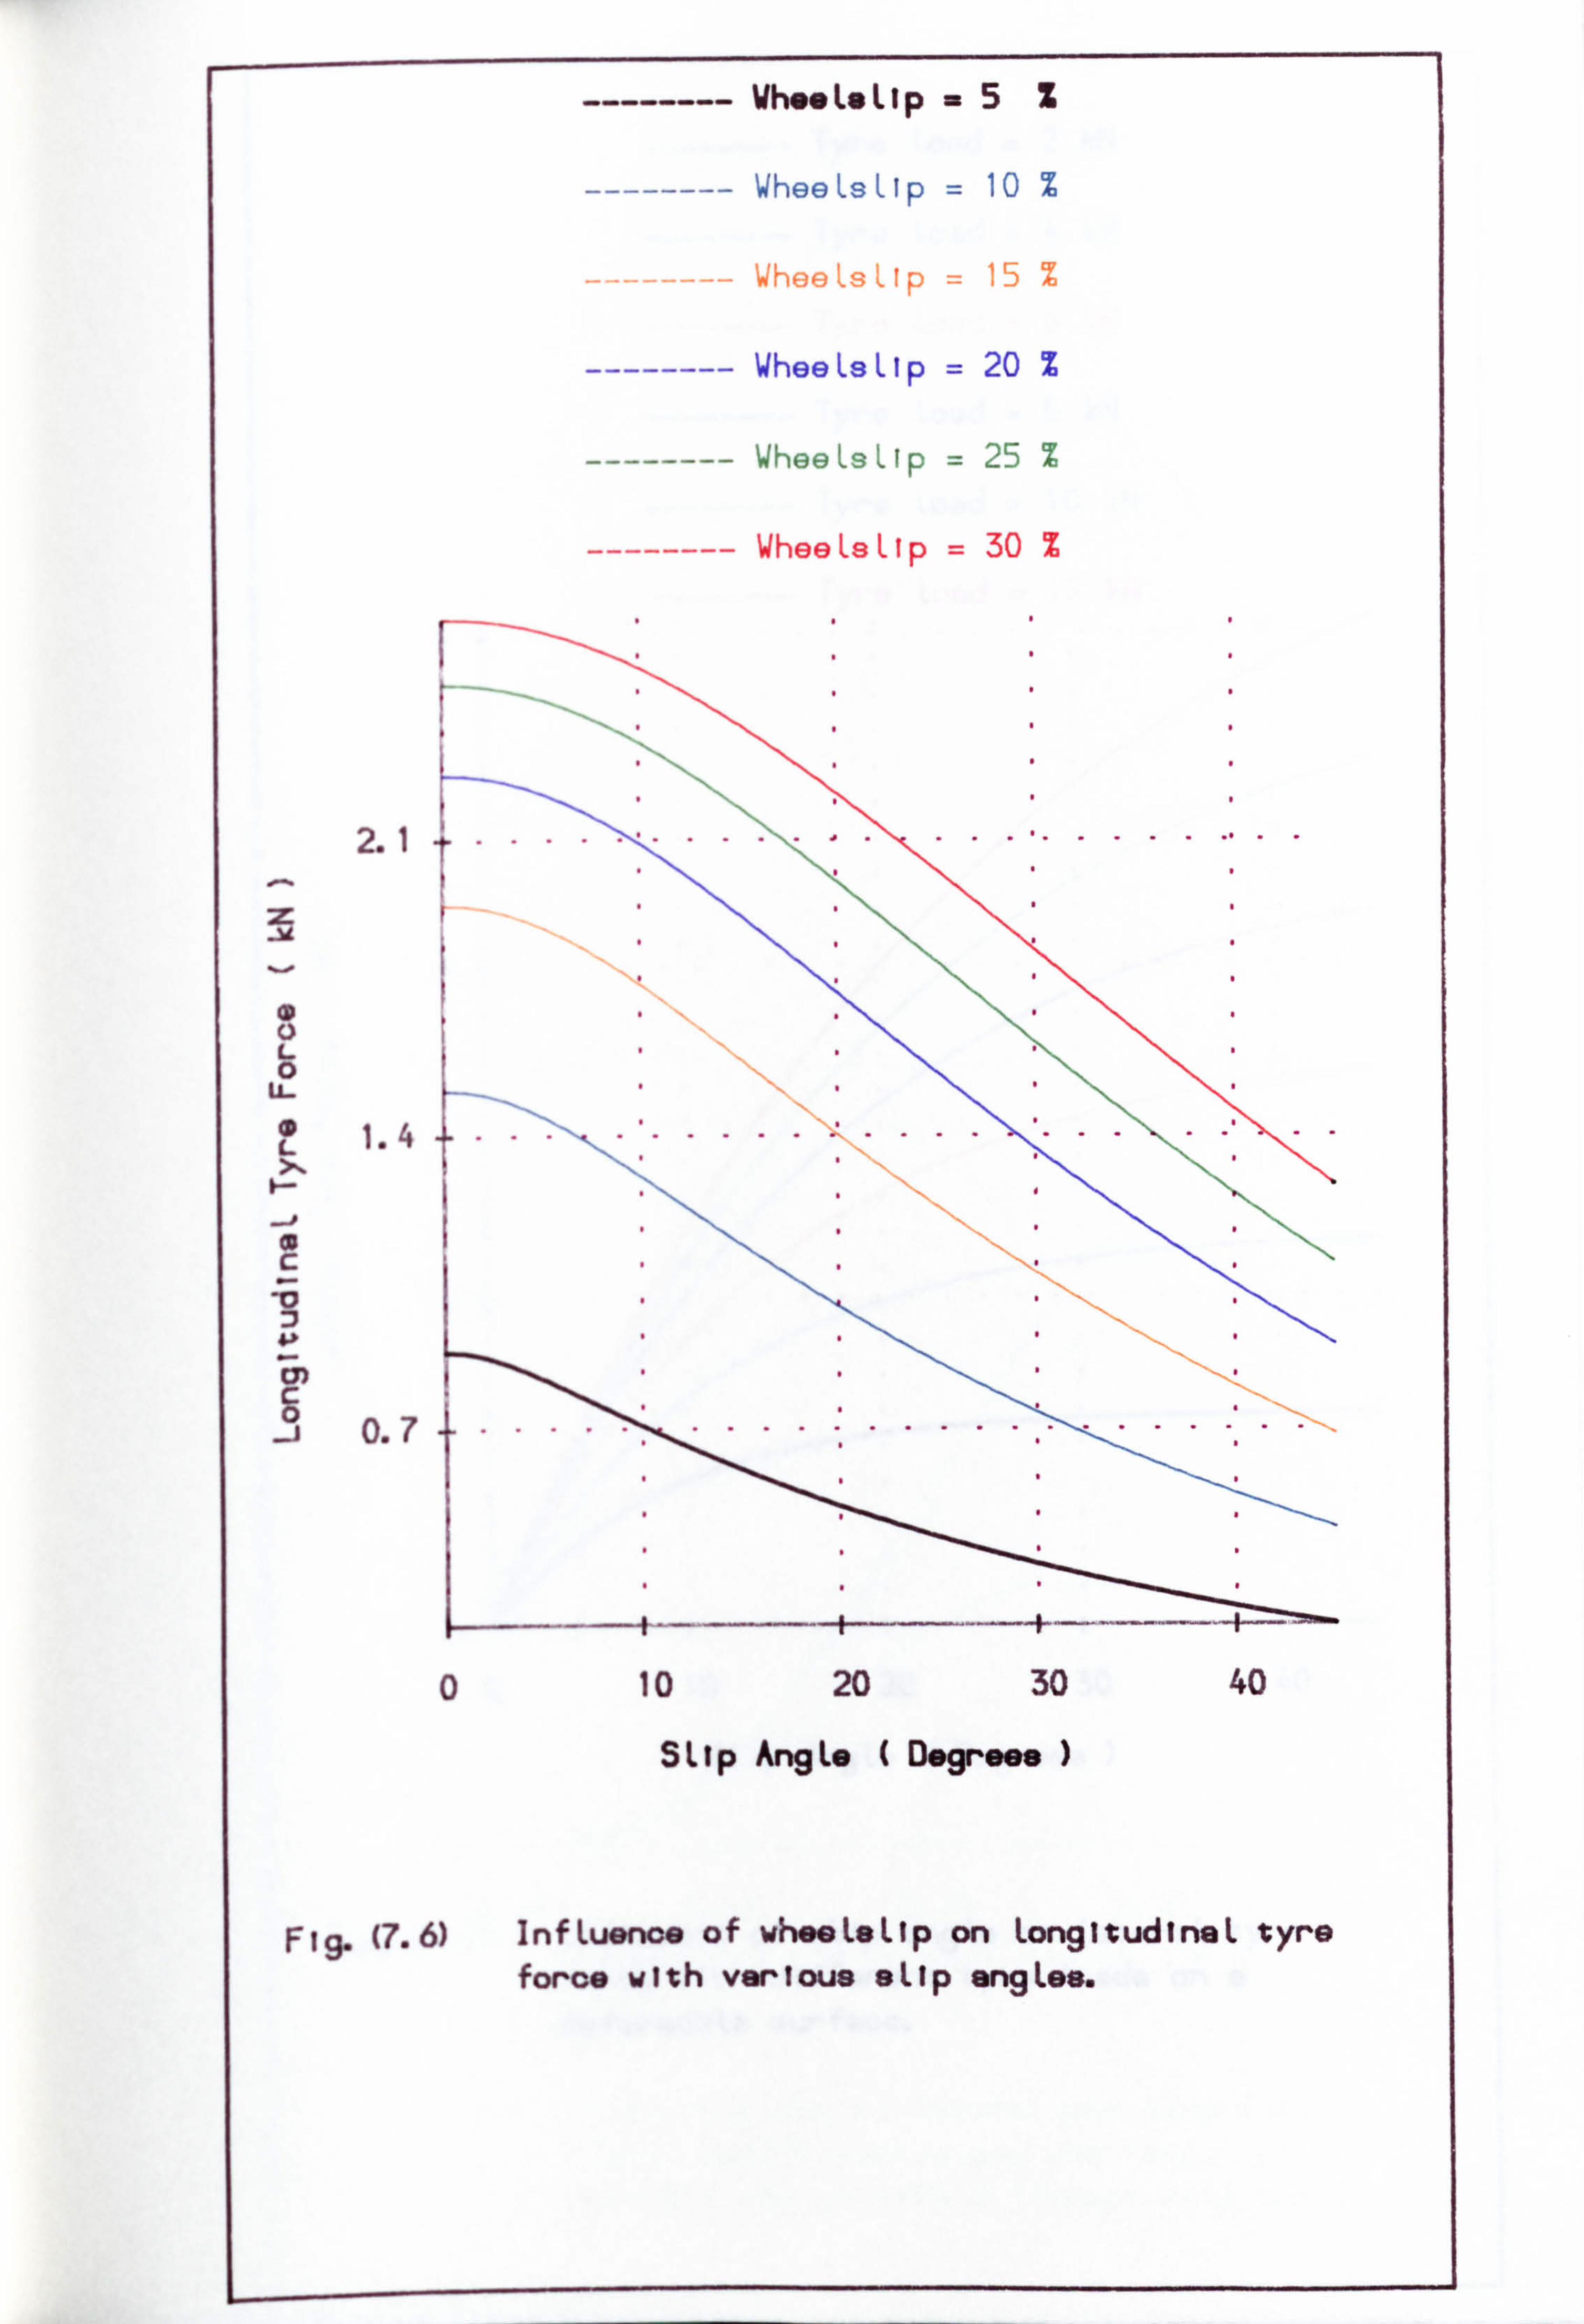
Whe*L*Llp - 5 Z
WheeLsLip = 10 %
ý ý) oo 1ý 's ýý i 15 T
WheeLsLip = 20 %
WheeLsLlp = 25 %
WheeLaLip = 30 %
2.1
1.4
0.7
..... ...... ..
r
F 19. (7.6) Inf Luenee of whee Le Lip on Longi tudineL tyro foroe with various aLlp angLes.
0 10 20 30 40
SLIp AngLe ( Degrees )
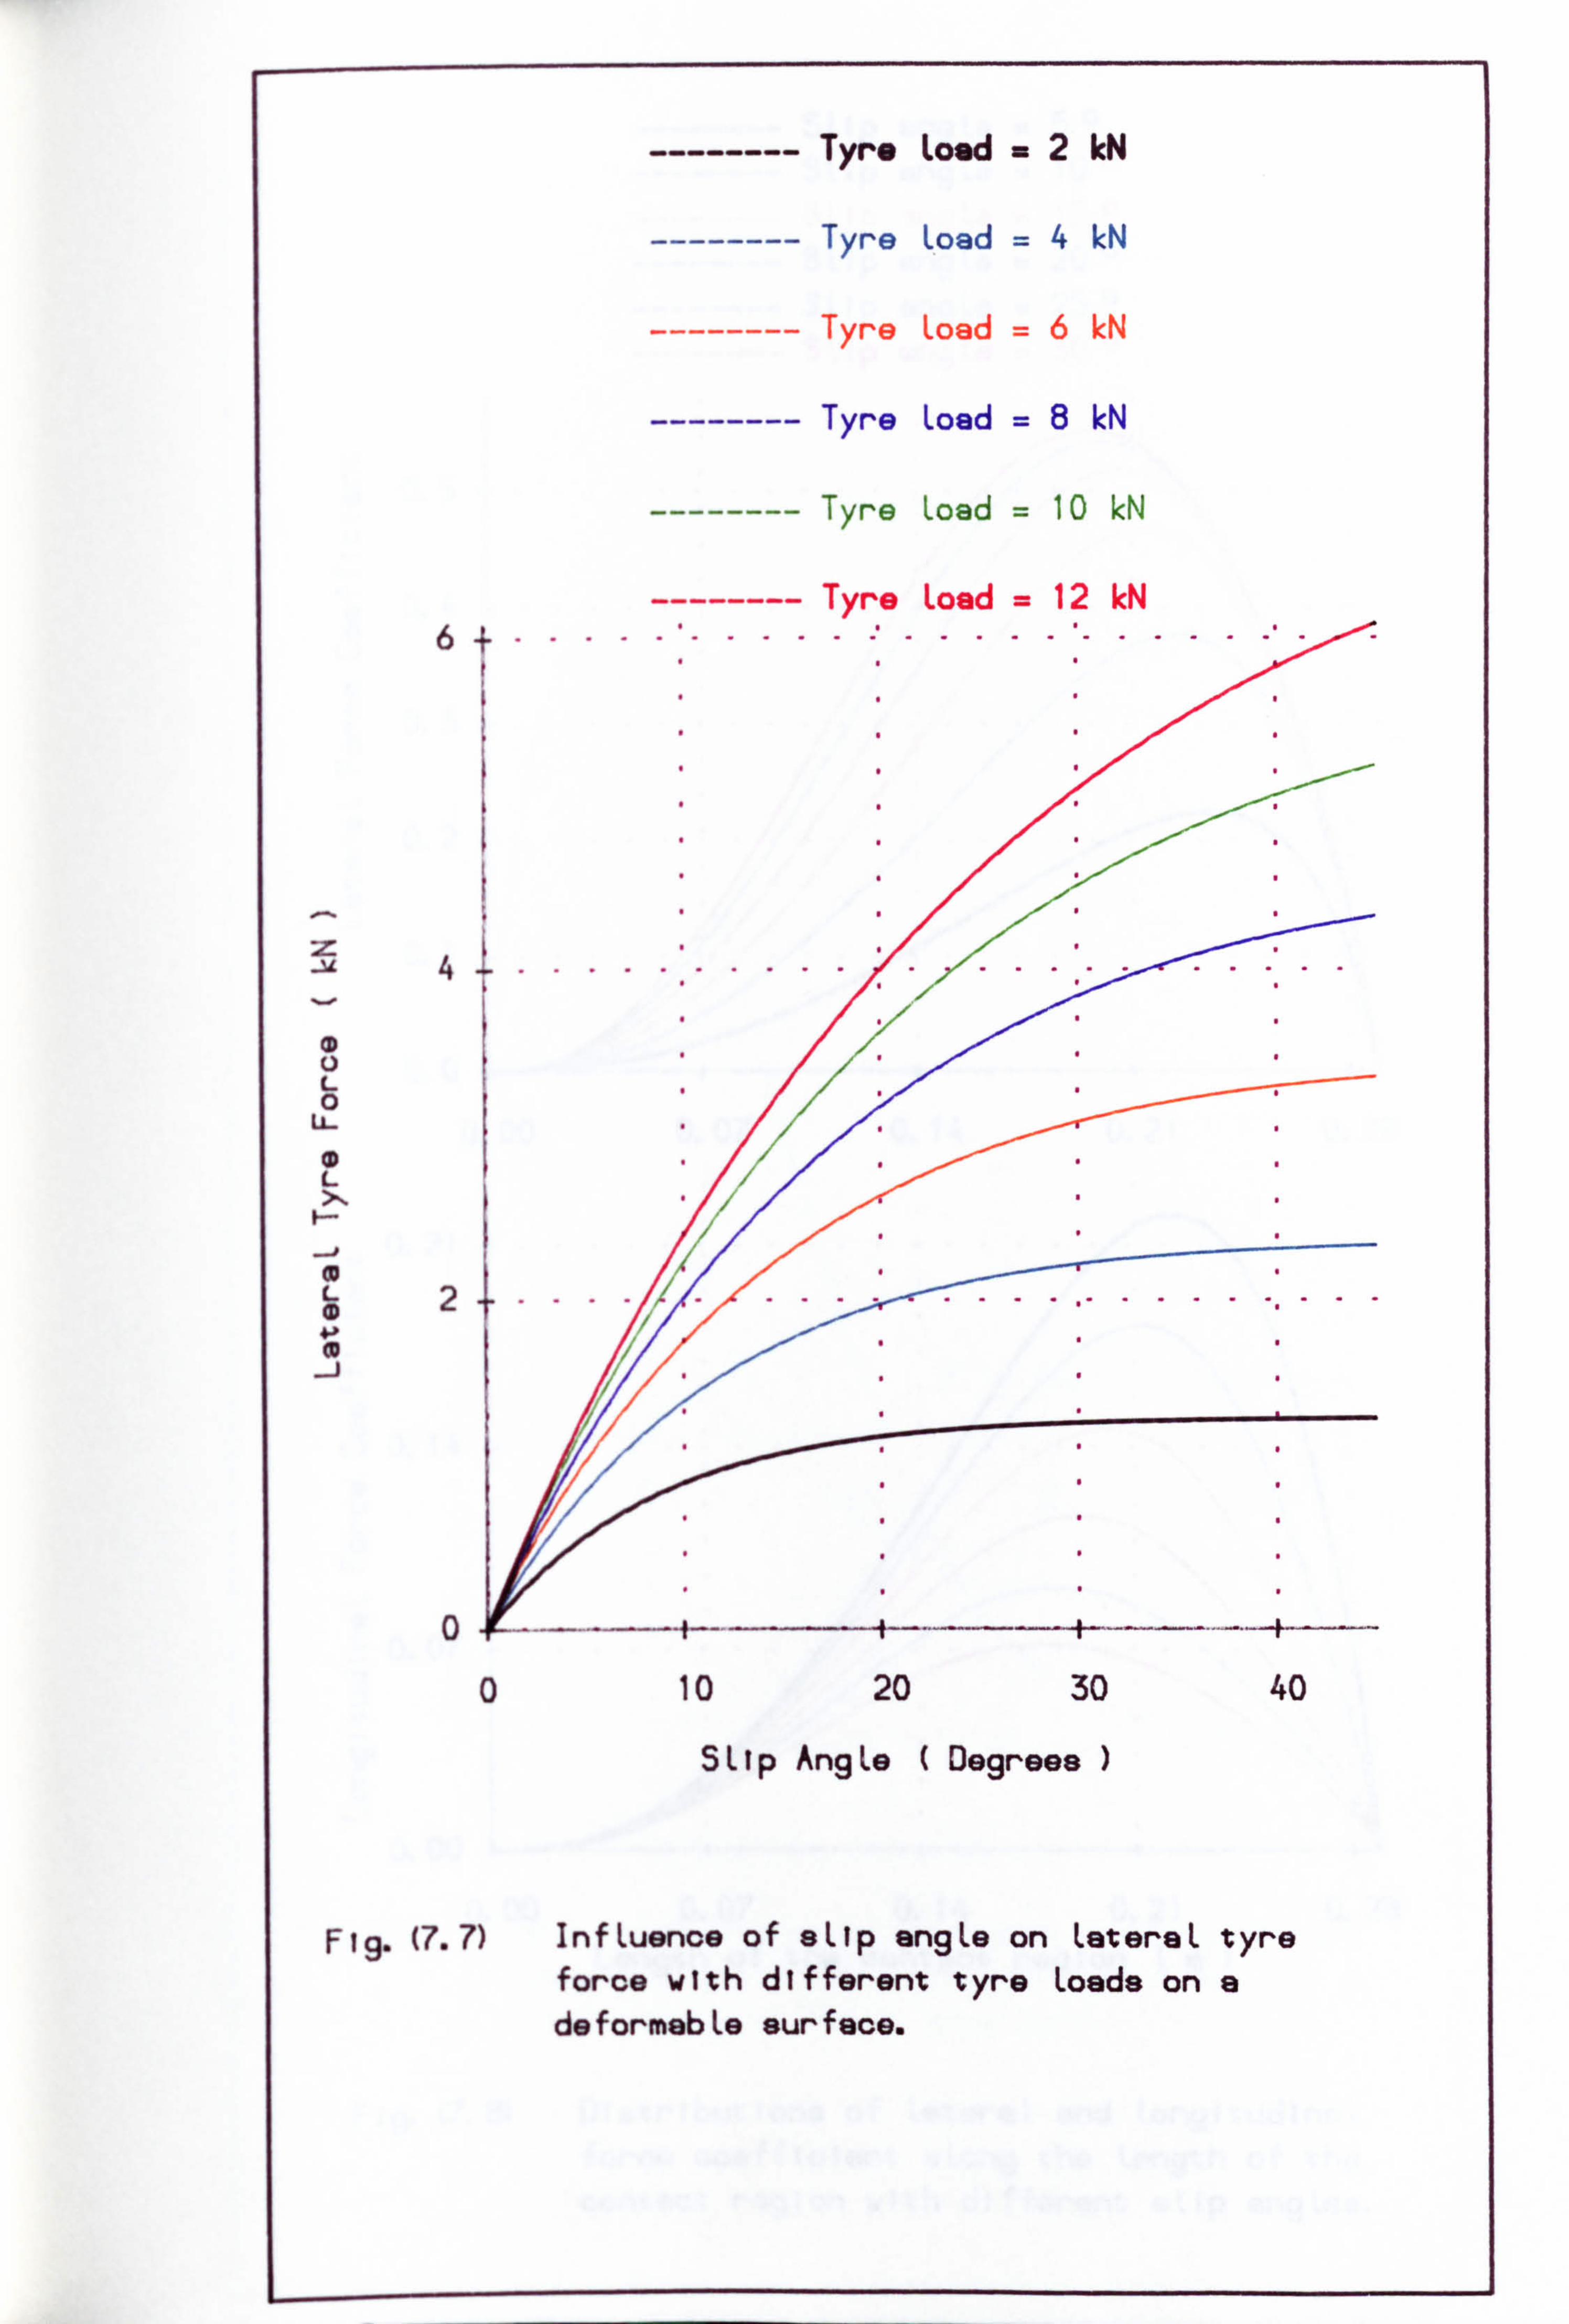
-------- Tyre Loud 2M
-------- Tyre Load 4M
-------- Tyre Load 6 kN
-------- Tyre Load 8 kN
-------- Tyre Load 10 kN
-------- Tyre Load 12 M 6........ ................. .
4....... ........... .
L 0
U-
L
L2----...... ...... ... 0
0
0 10 20 30 40
SLIp AngLe Degrees )
F 19. (7.7) InfLuence of aLlp angLe on LateraL tyre force with different tyro Loads on a deformebLe surface.
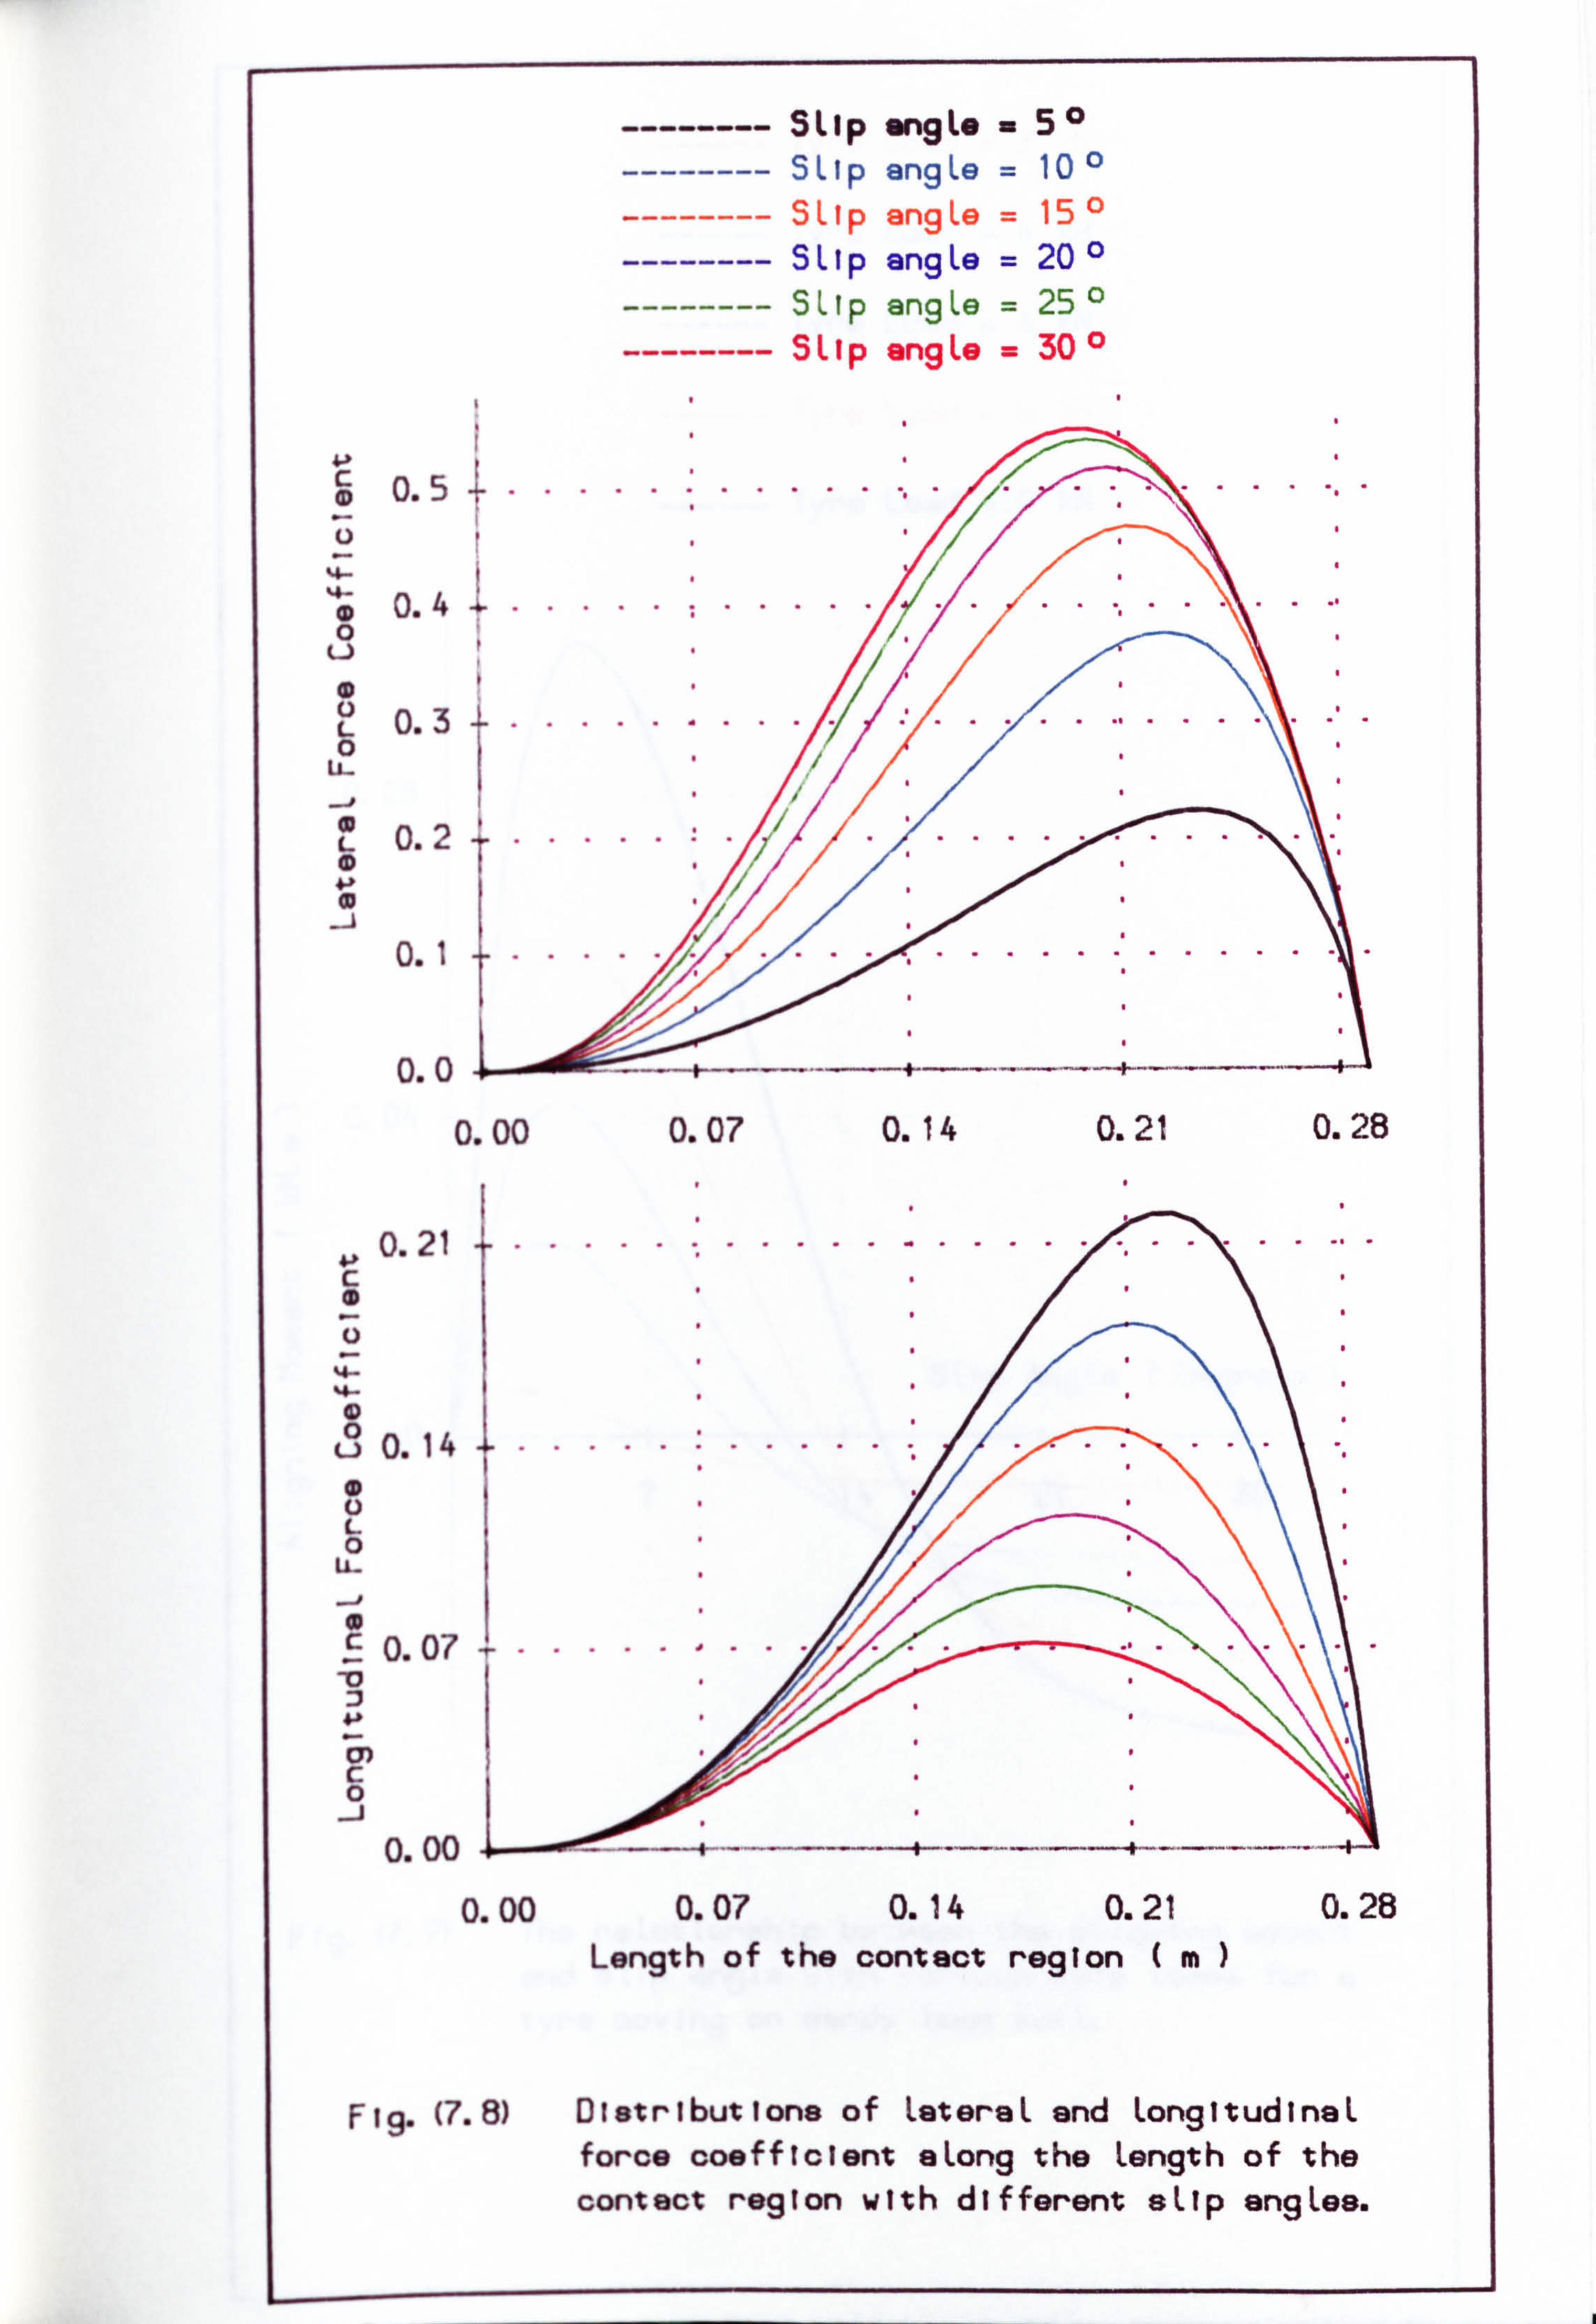
SLip angLe - 50 SLip angLe = 10 1 SLIp ang Le = 15 ' 5LIp ang Le = 20 0 SLIp ang Le = 25 ' SLIp angLe = 300
0.5
0.4
0.3
0.2
0.1
0.0
4. p 0.21
u 0.14
0.07
or) c
0.00
0.00
F 19. (7.8) Distributions of LeteraL and Longi-tudinaL force coefficient eLong the Length of the contact region with different sLlp engLes.
0.00 0.07 0.14 0.21 0.28
0.07 0.14 0.21 0.28 Length of the contact region (m
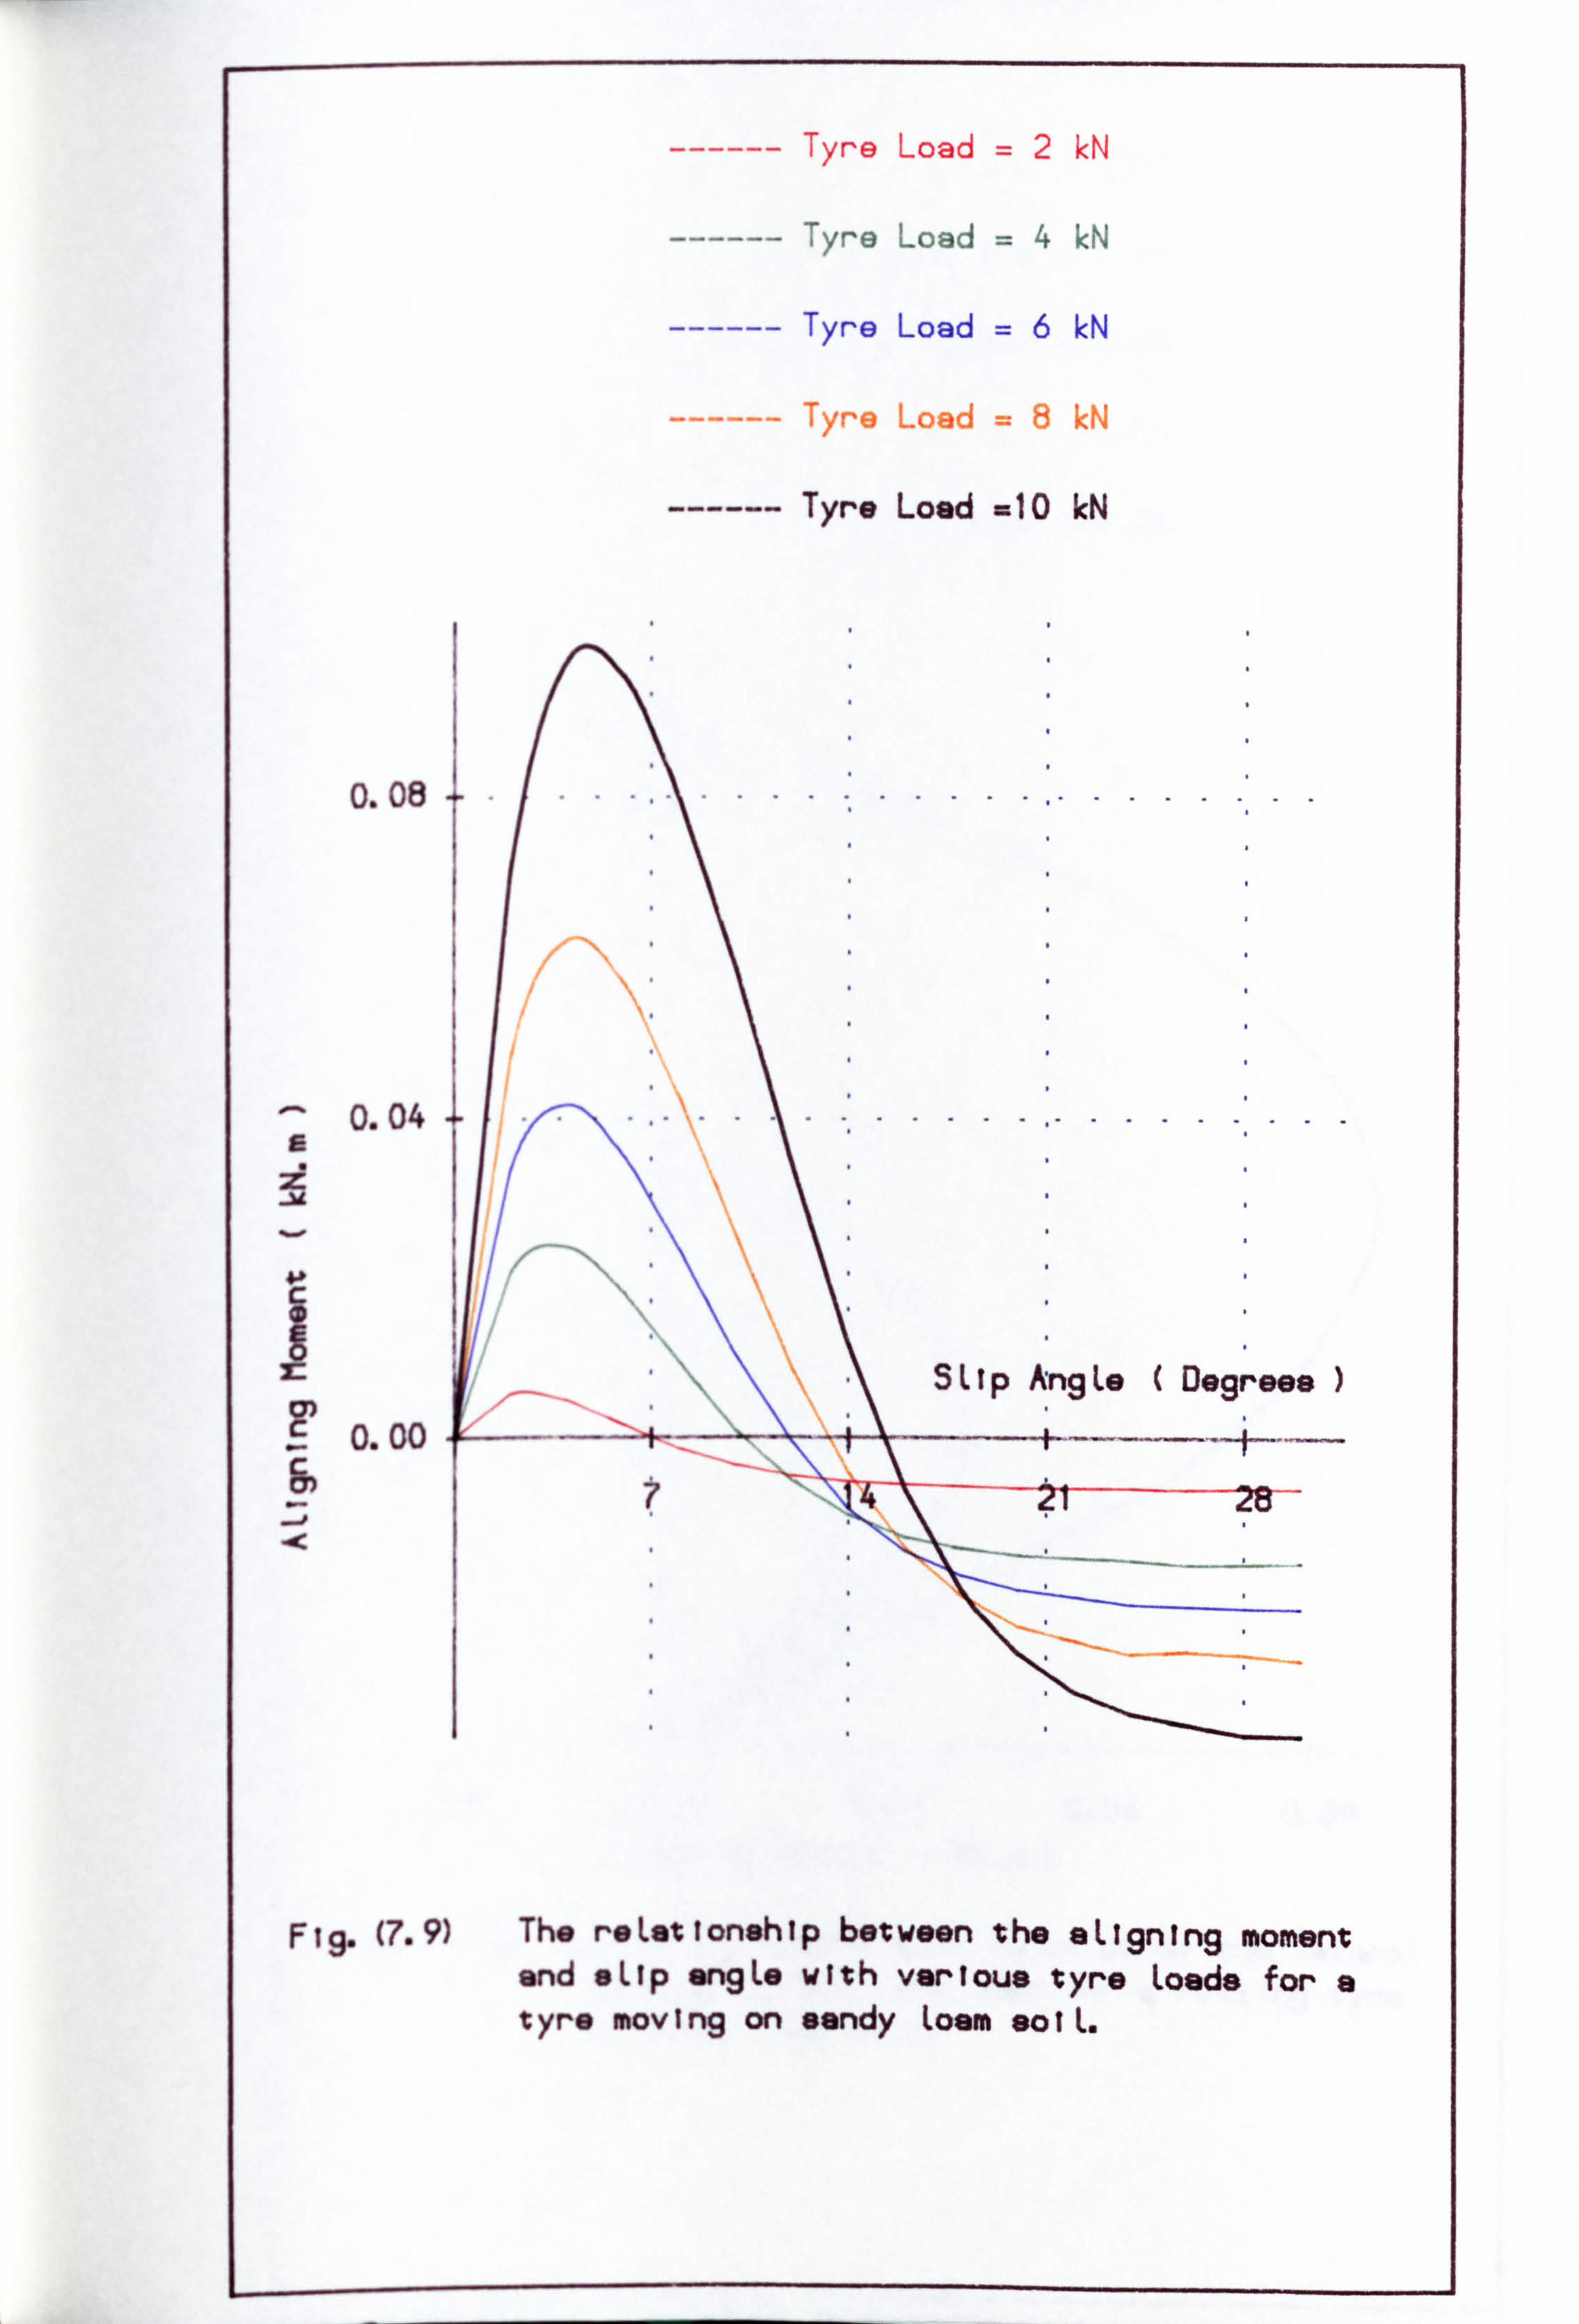
------ lyre Load = 2 kN
ýYre Load = 4 ýN
------ Tyre Load = 6 kN
------ Tyre Load - 10 kN
0.08 ..... ... ... ... ... ...... ..
0.04 ... ... . ... ... ... ..... ... a .
SLTp Ang Le Degrees
0.00
Fig. (7.9) The reLationship bet ween t he aLignIng moment and sLip angLe with variou s tyro Loads for a tyro moving on sandy Loam soiL.
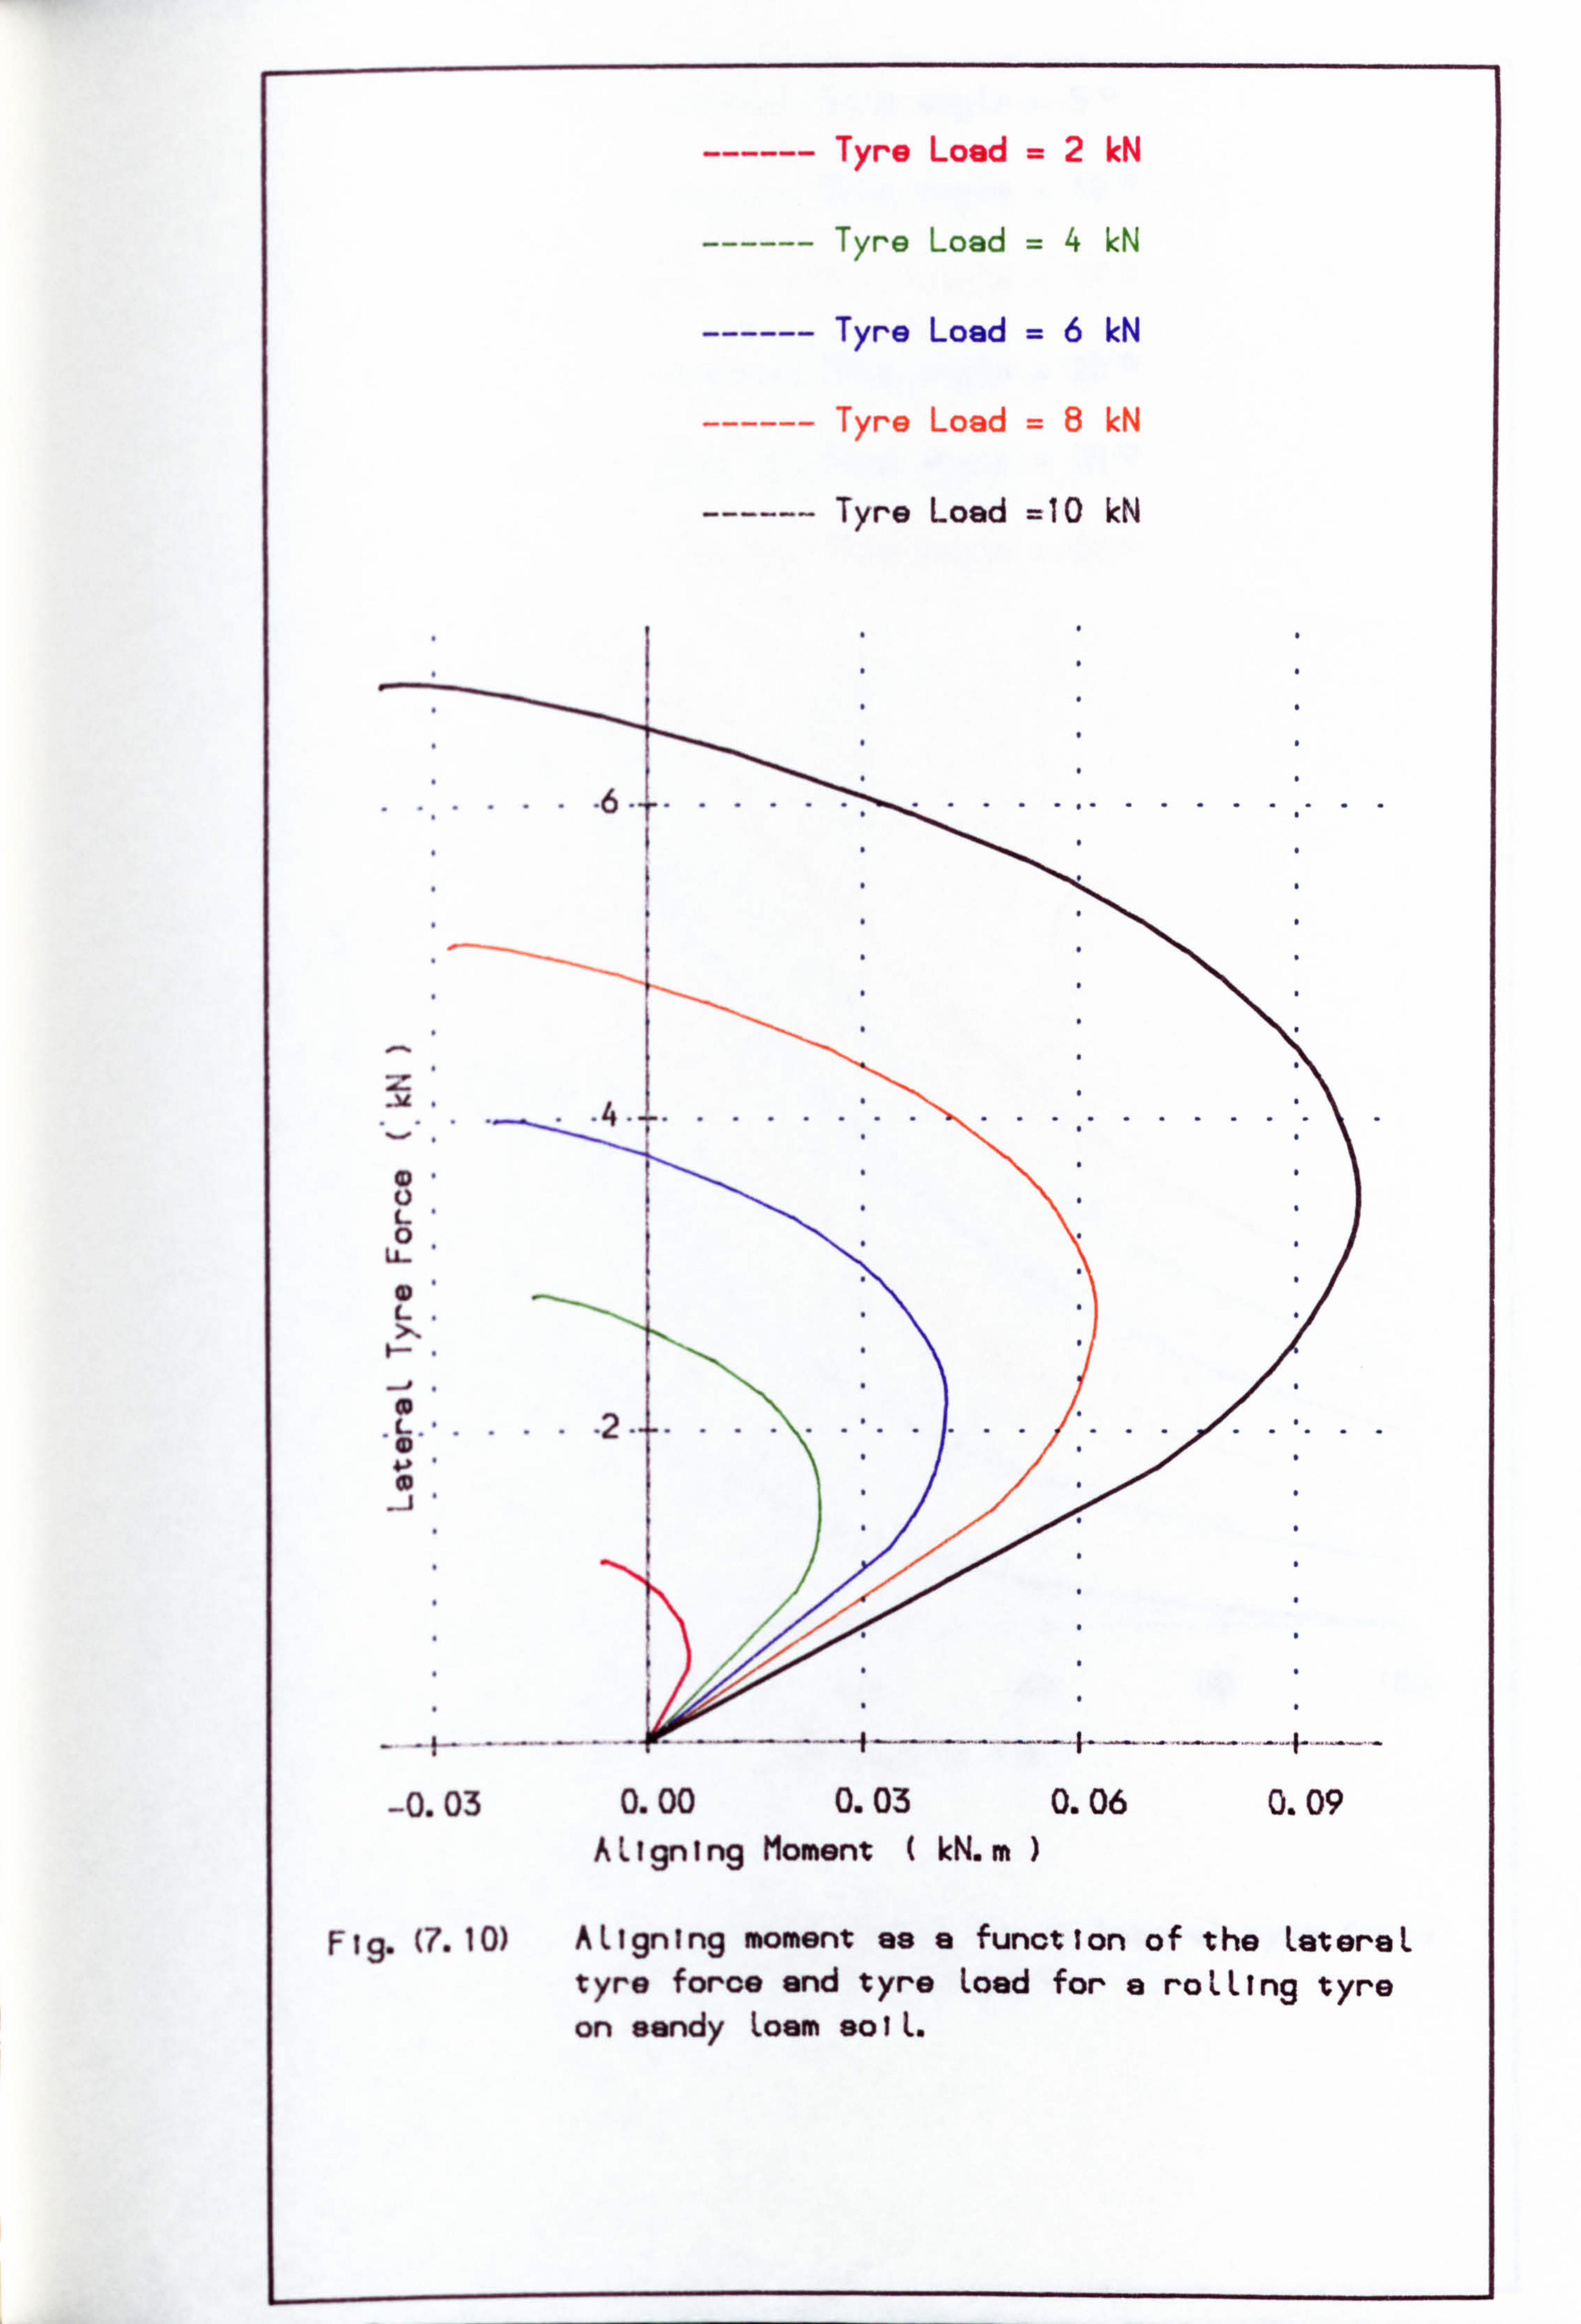
Tyre Load =2M
Tyre Load =4 kN
Tyre Load =6 kN
Tyre Load =8 kN
Tyre Load =10 kN
F 19. (7.10) ALIgning moment as a function of the LateraL tyre force and tyre Load for a roLLing tyre on sandy Loam solL.
-0.03 0.00 0.03 0.06 0.09 AL Ign I ng Moment ( W. m)
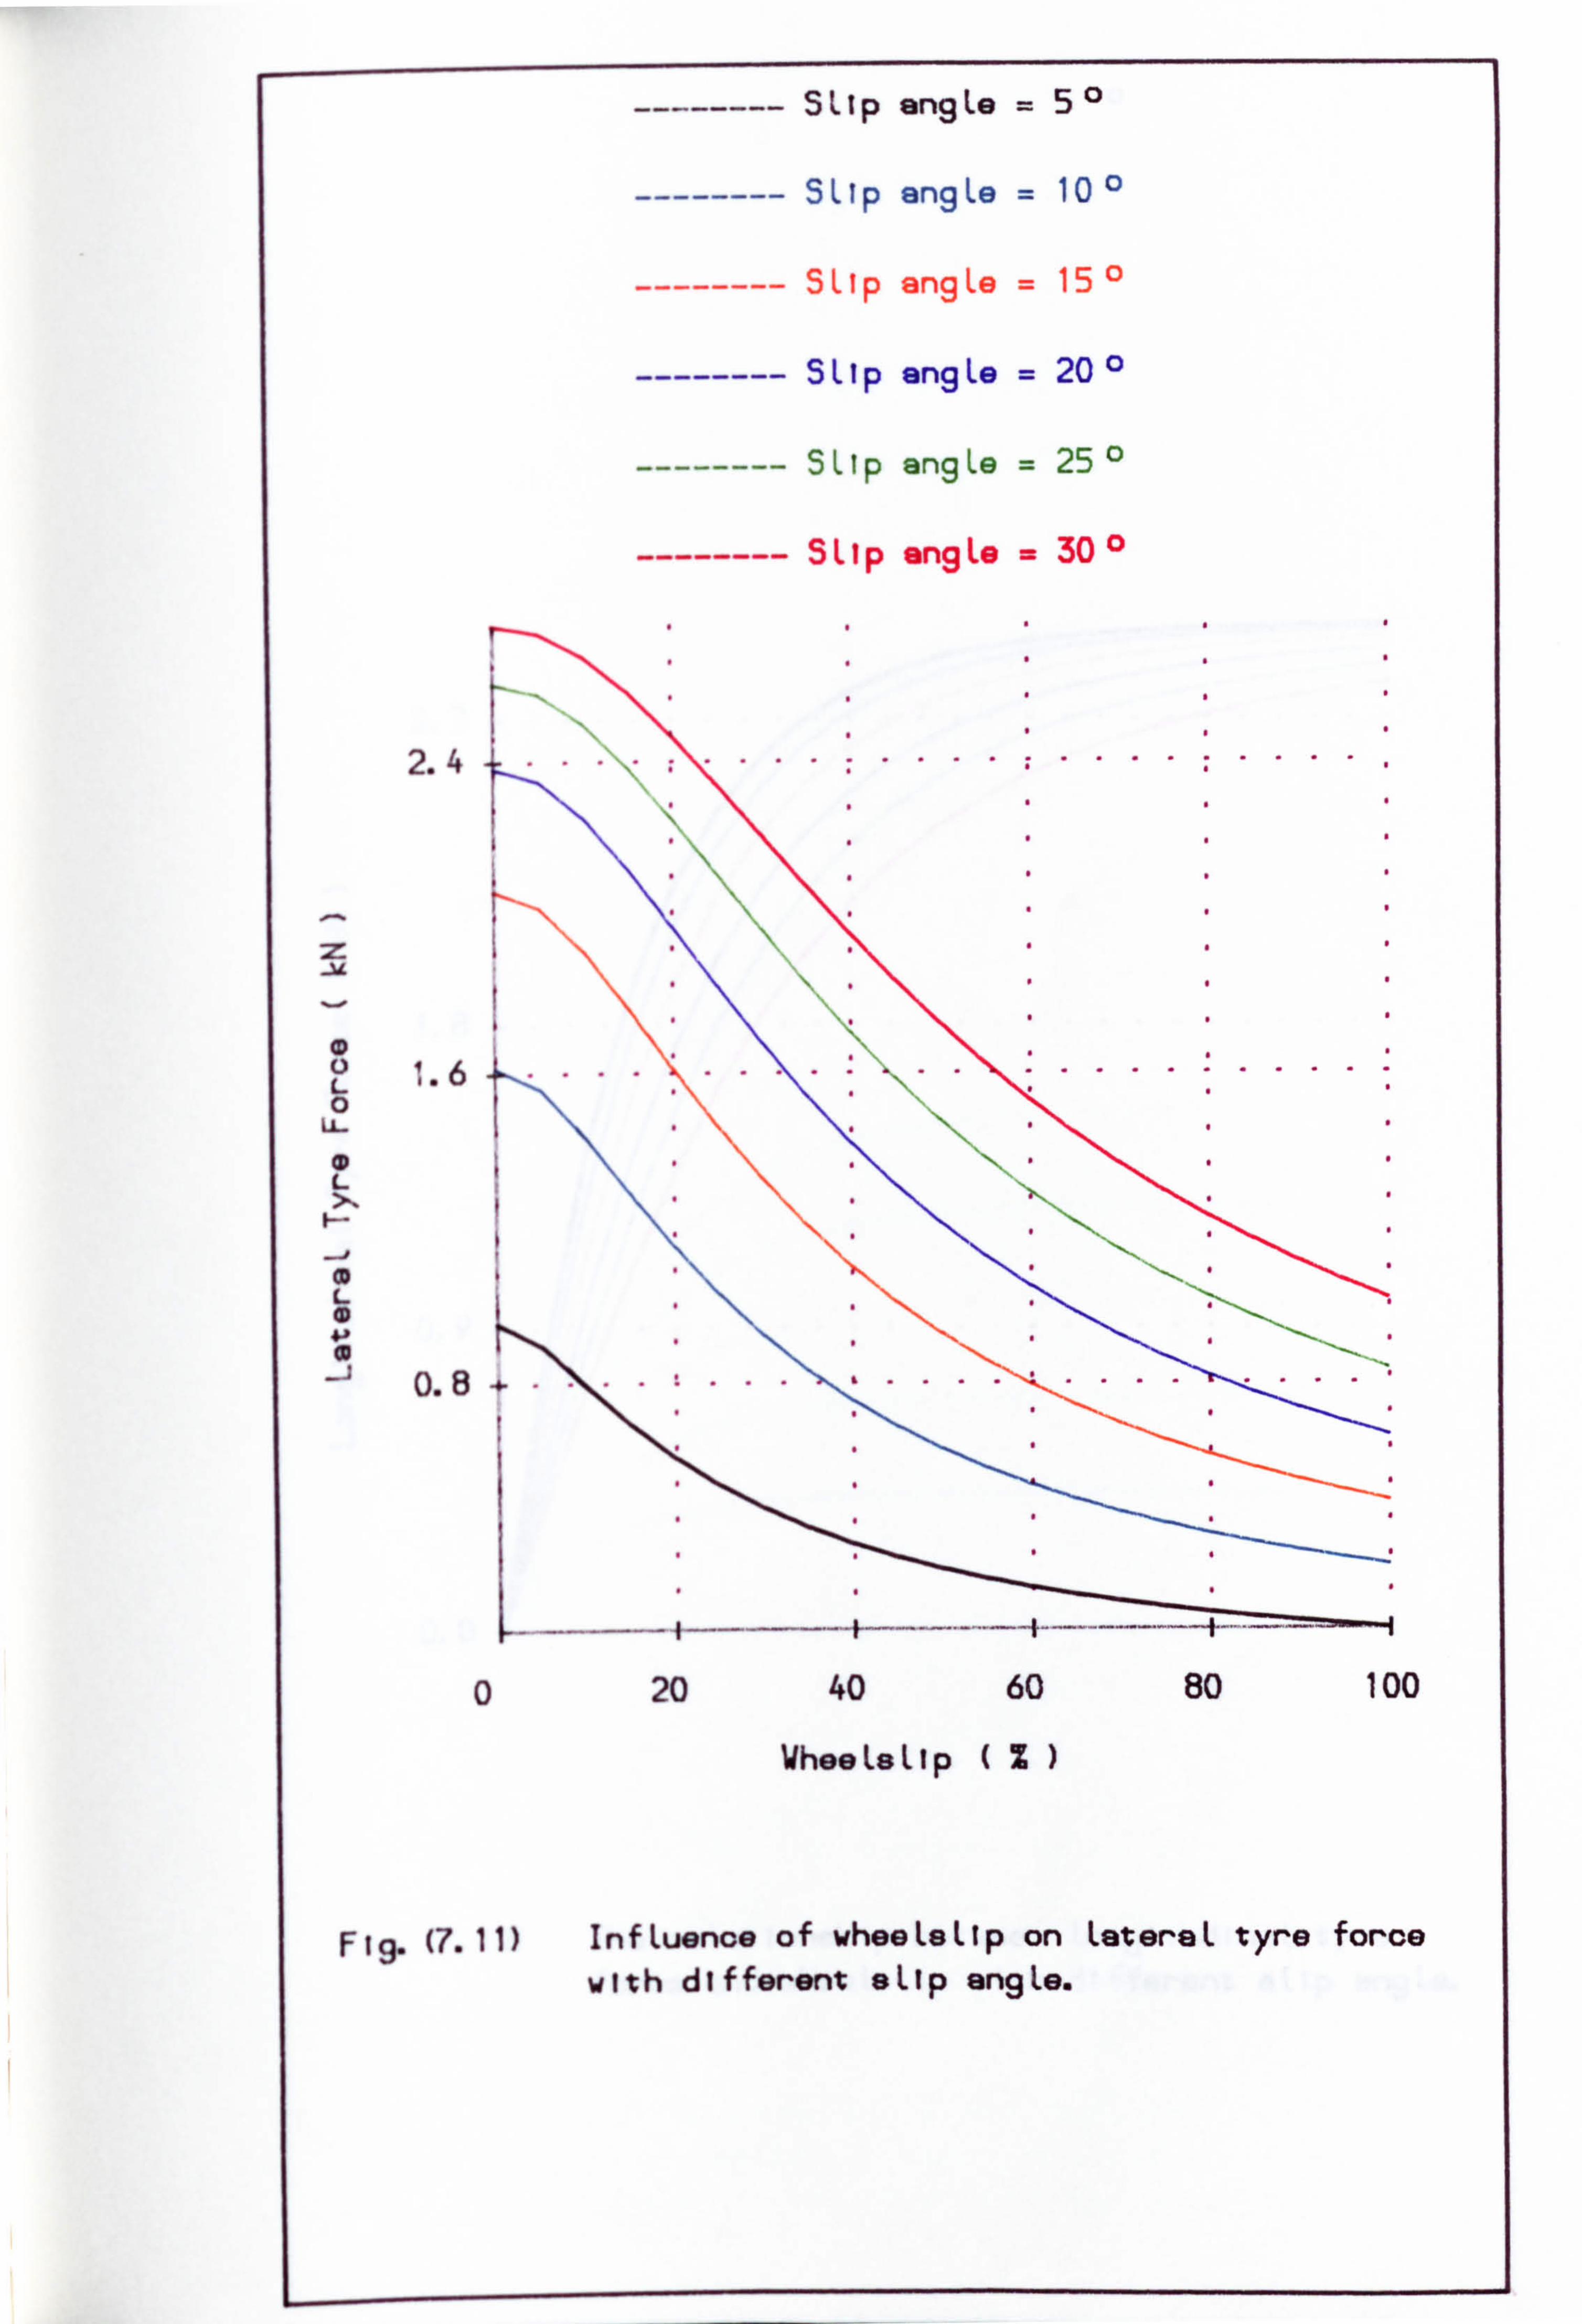
2.4
:Z1
0 IL
0 C- >'
I- -I 0 C- 0
0
-j 0.8
I-
SLIp angLe =51
SLIp angLe = 10
SLIp angLe = 15
SLIp angLe = 20 0
SLIp angLe = 25 0
SLip angLe = 30"
.................
WheeLeLip (%)
Fig. (7.11) InfLuence of wheeLeLlp on LetereL tyre force
with different eLlp angLe.
20 40 60 80 100
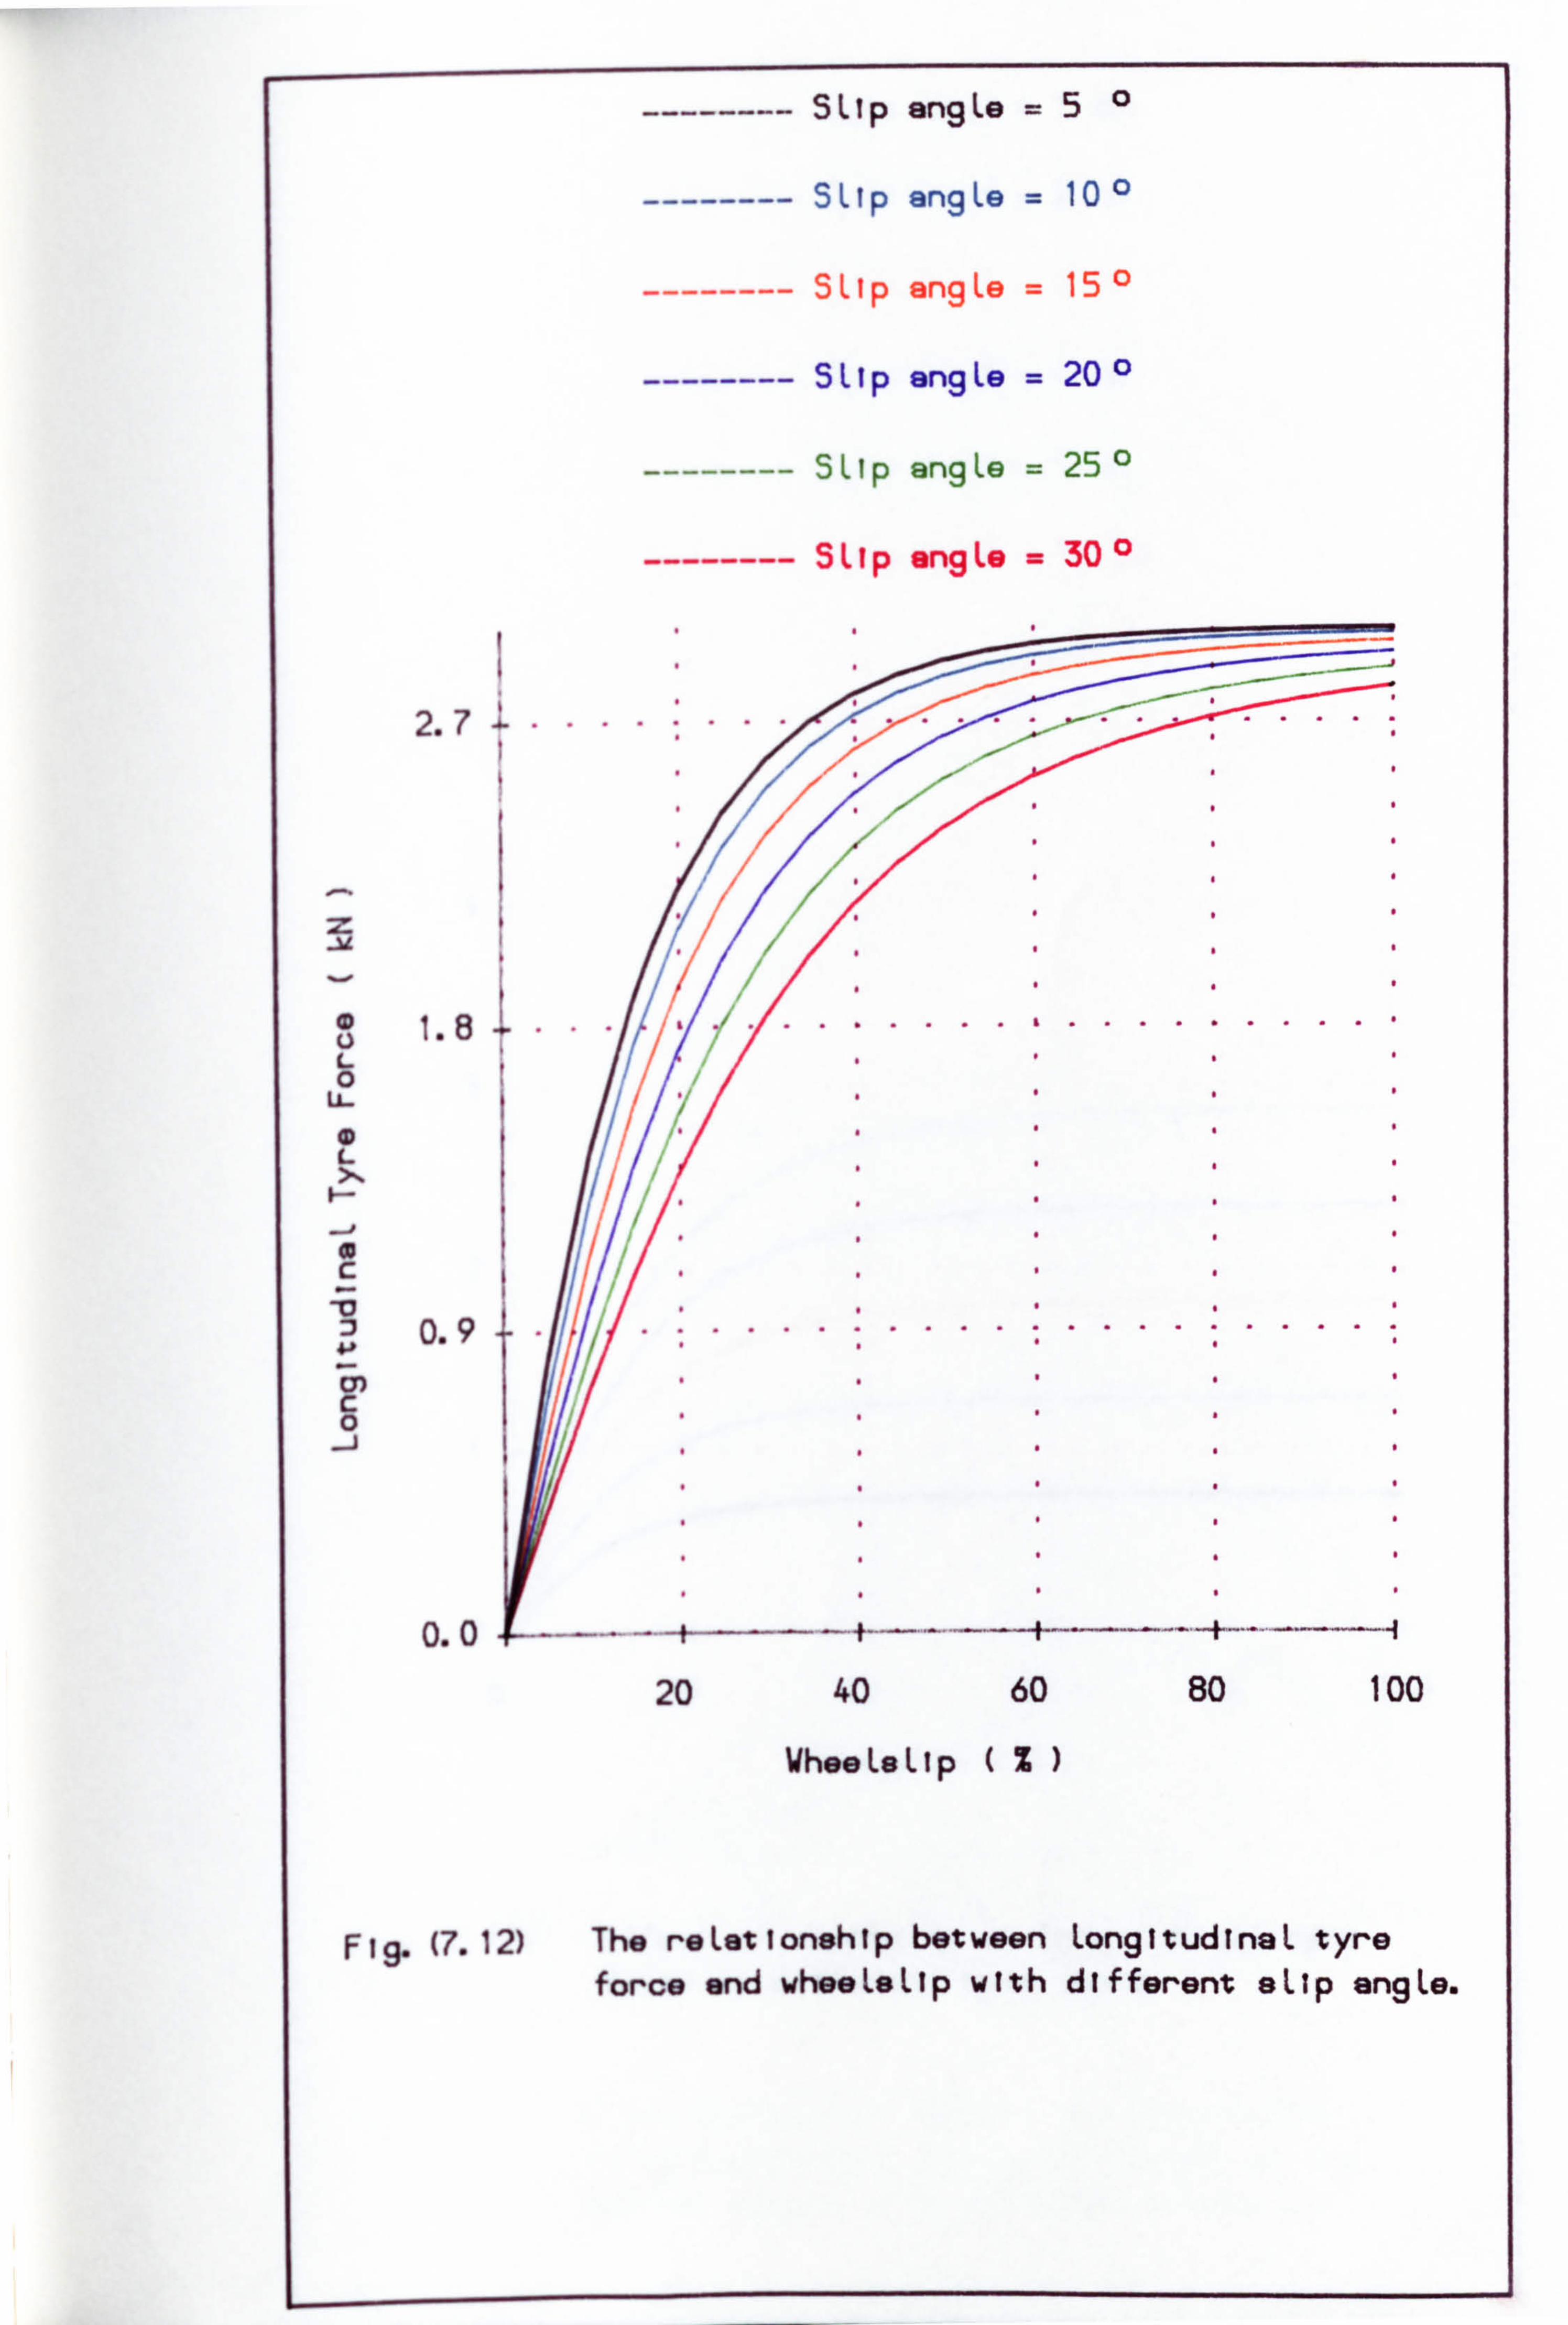
-------- SLip angLe =5
-------- SLIp angLe = 10
-------- SLIp angLe = 15
-------- SLIp engLe = 20
-------- SLIp angLe = 25 o
-------- SLIp angLe = 30
2.7 ........................
.......... u 1.8 L 0
U-
L
0.9
U) C 0
0.0
20 40 60 80 100
WheeLsLip %
Fig. (7.12) The reLationshtp between LongitudinaL tyre force and wheeLeLlp with different eLlp angLe.
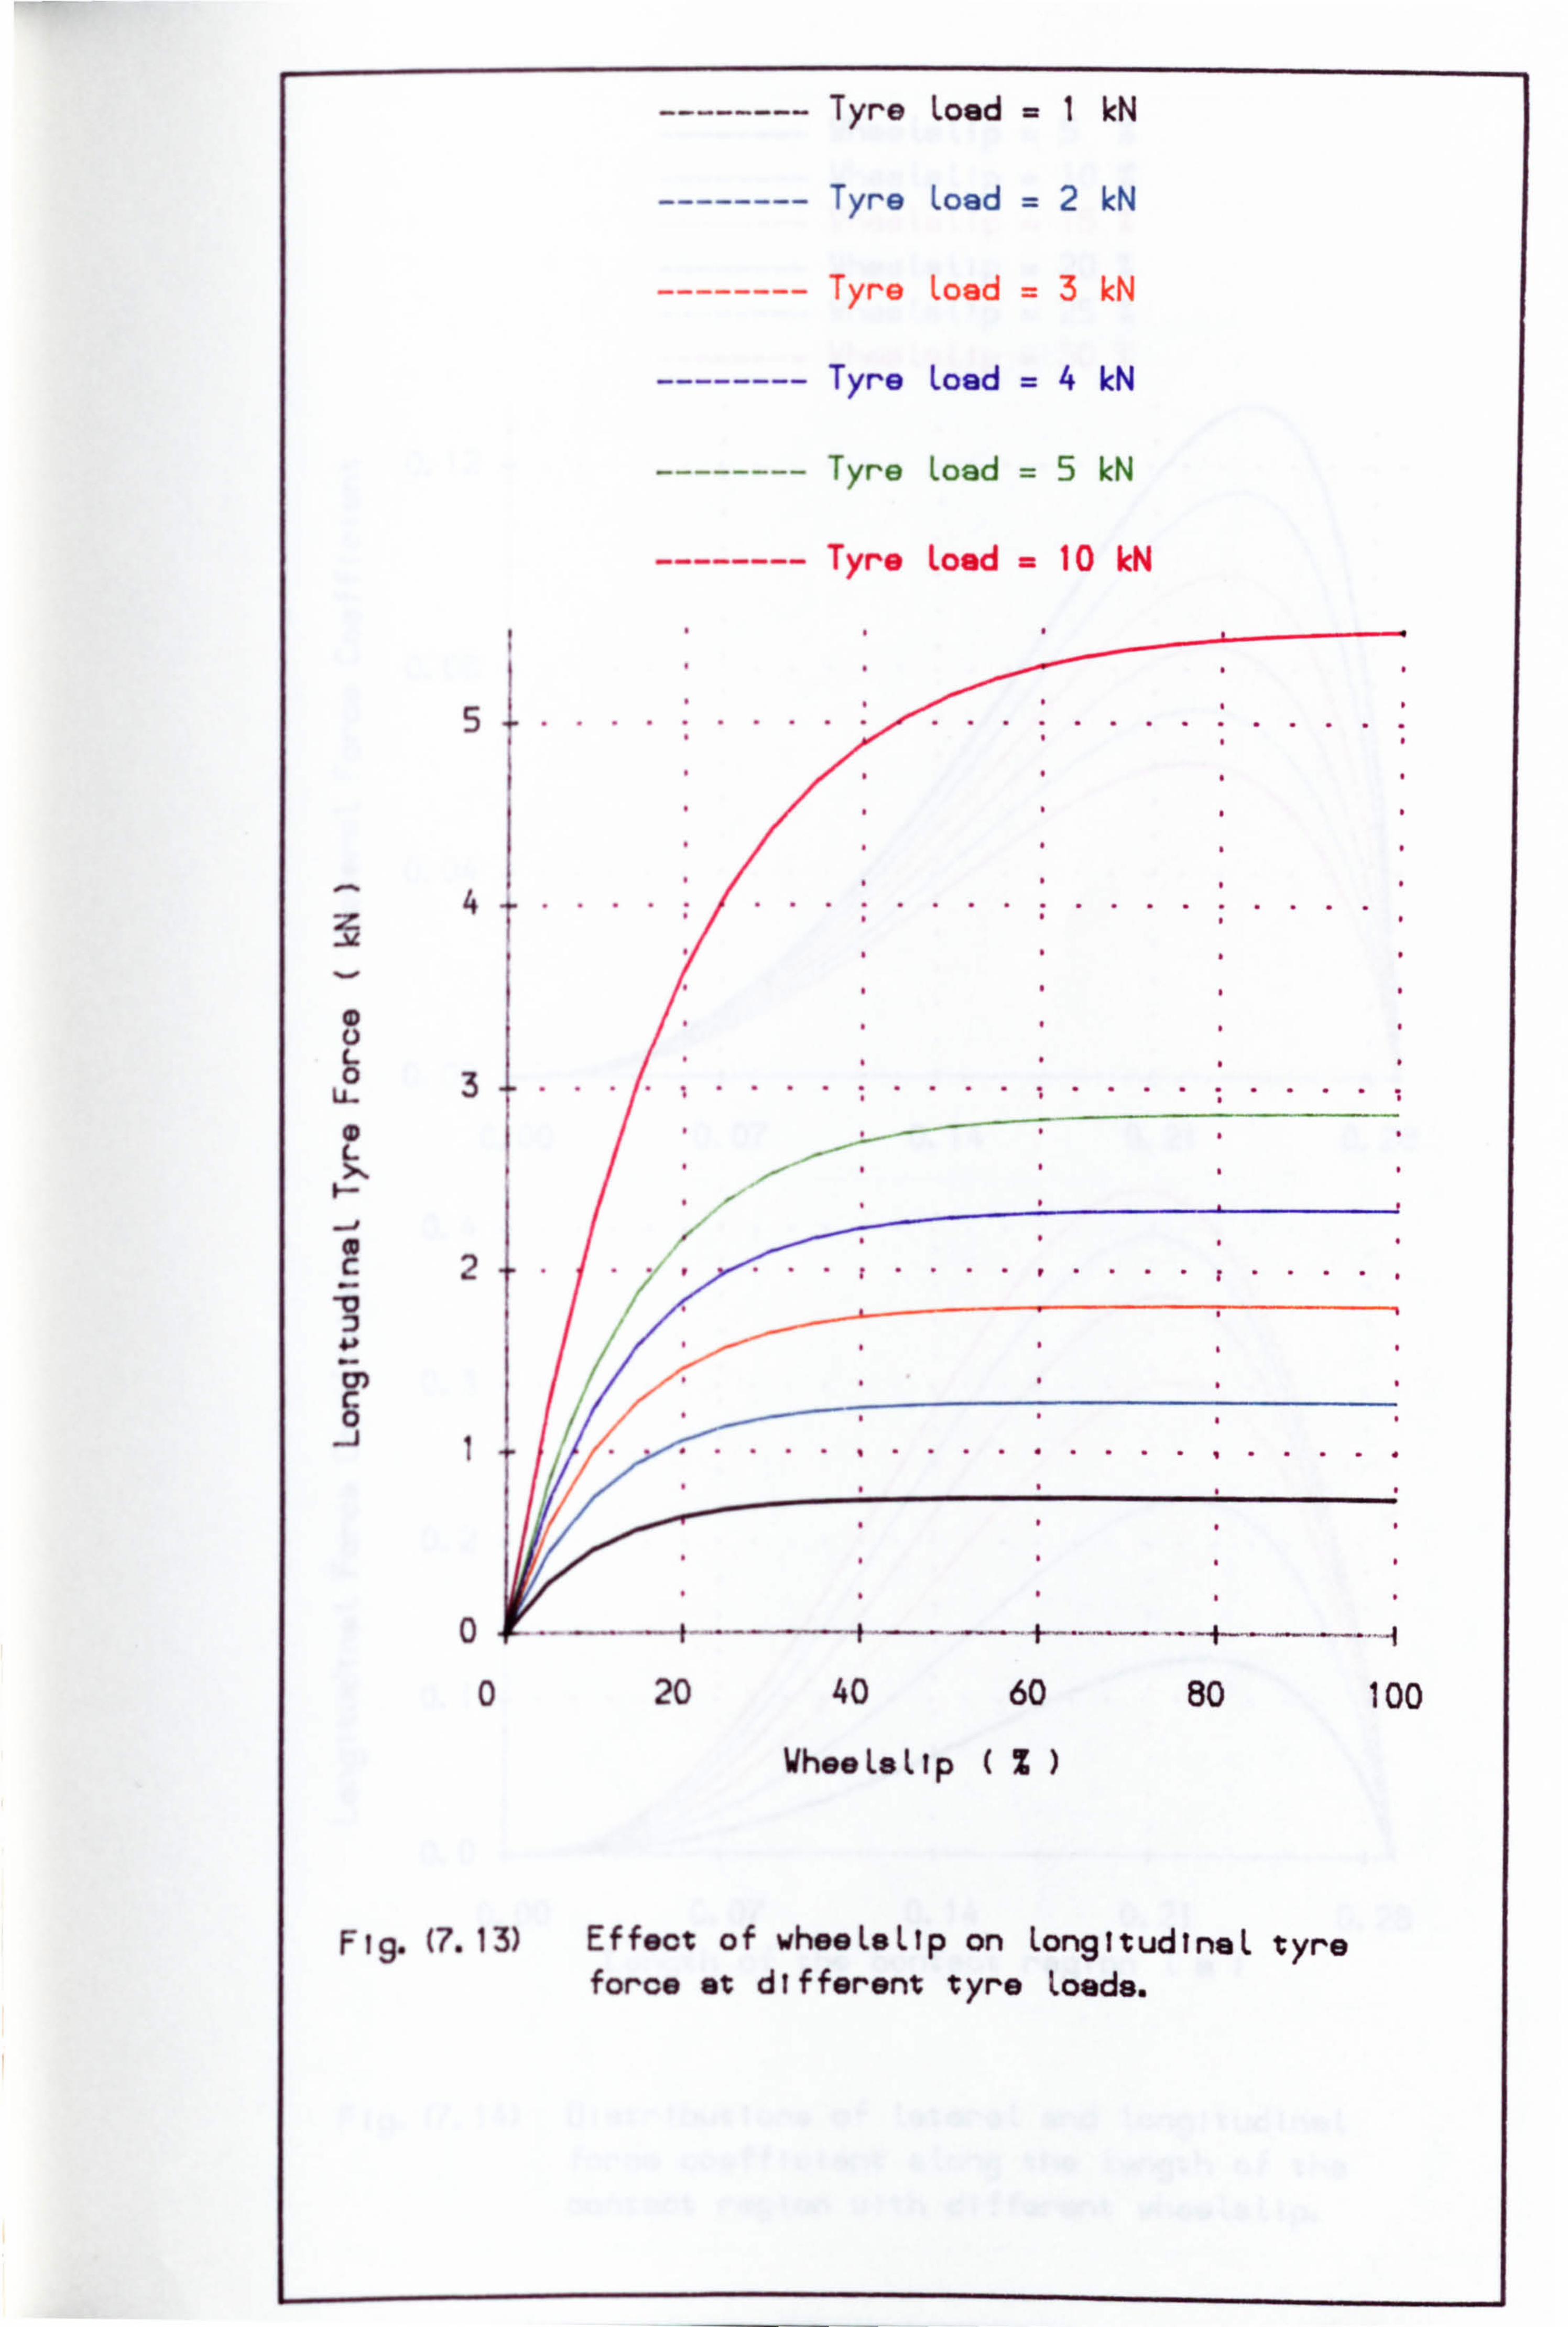
-------- Tyre Load =I kN
-------- Tyre Load =2 kN
-------- Tyre Load =3 kN
-------- Tyre Load =4 kN
-------- Tyre Load =5 kN
-------- Tyre Load = 10 M
5 ....... ...........
4 .............
L 0 U- 3 ............. ........... L
C 2
0 0 20 40 60 80 100
WheaLeLlp %
F (7.13) Effect of wheeLeLlp on LongitudinaL tyre force at different tyre Loads.
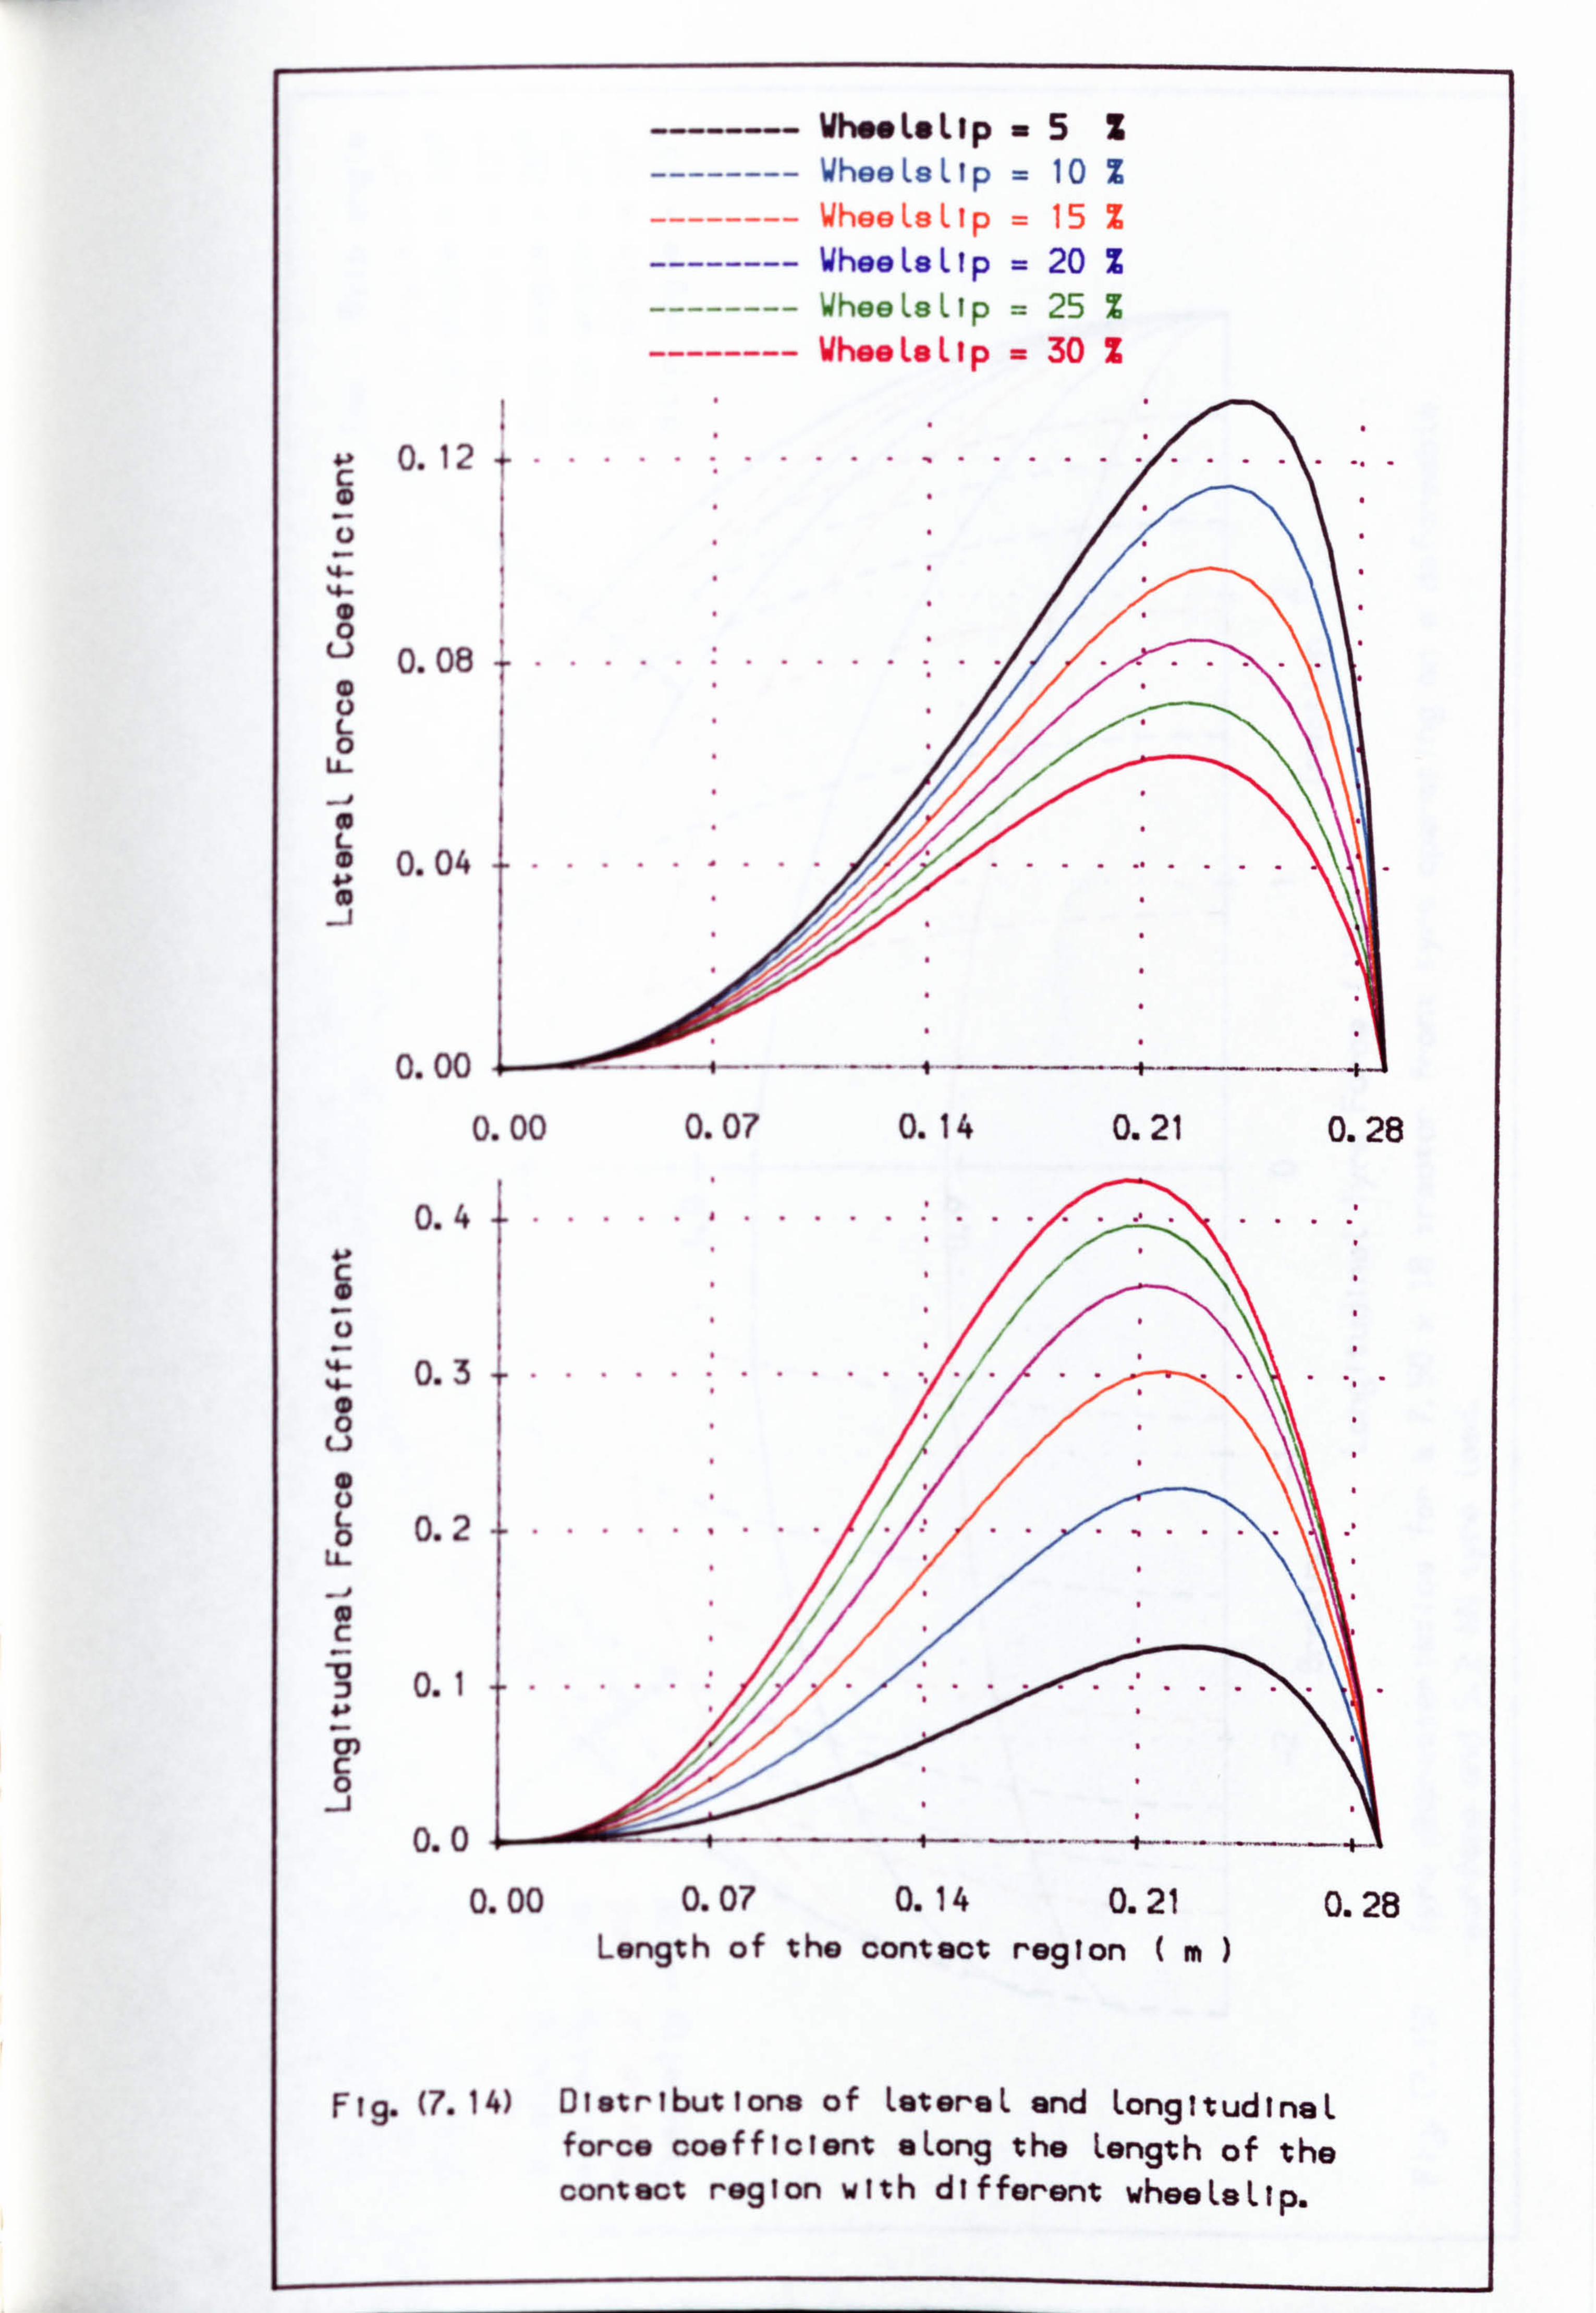
- ----- Whos, Le LIp-5Z -------- WheeLaLlp = 10 %
-------- WheeLsLlp = 15 %
-------- WheeLeLlp = 20 %
-------- WheeLeLlp = 25 %
-------- VheeLeLlp = 30 Z
4.11 C 0.12 t. .......... I............. .
0 U 0.08 ............
L 0 U-
.
L 0.04 ...... ....
0.00
0.00 0.07 0.14 0.21 0.28
0.4 . .............
0.3 ........ 0 U
U b 0.2 .......... I
C
0.1 .. ............. .....
C 0
0.0 0.00 0.07 0.14 0.21 0.28
Length of the contact region (m
F 19. (7.14) Distributions of LetereL and LongitudinaL force coefficient sLong the Length of the contact region with different wheeLaLip.
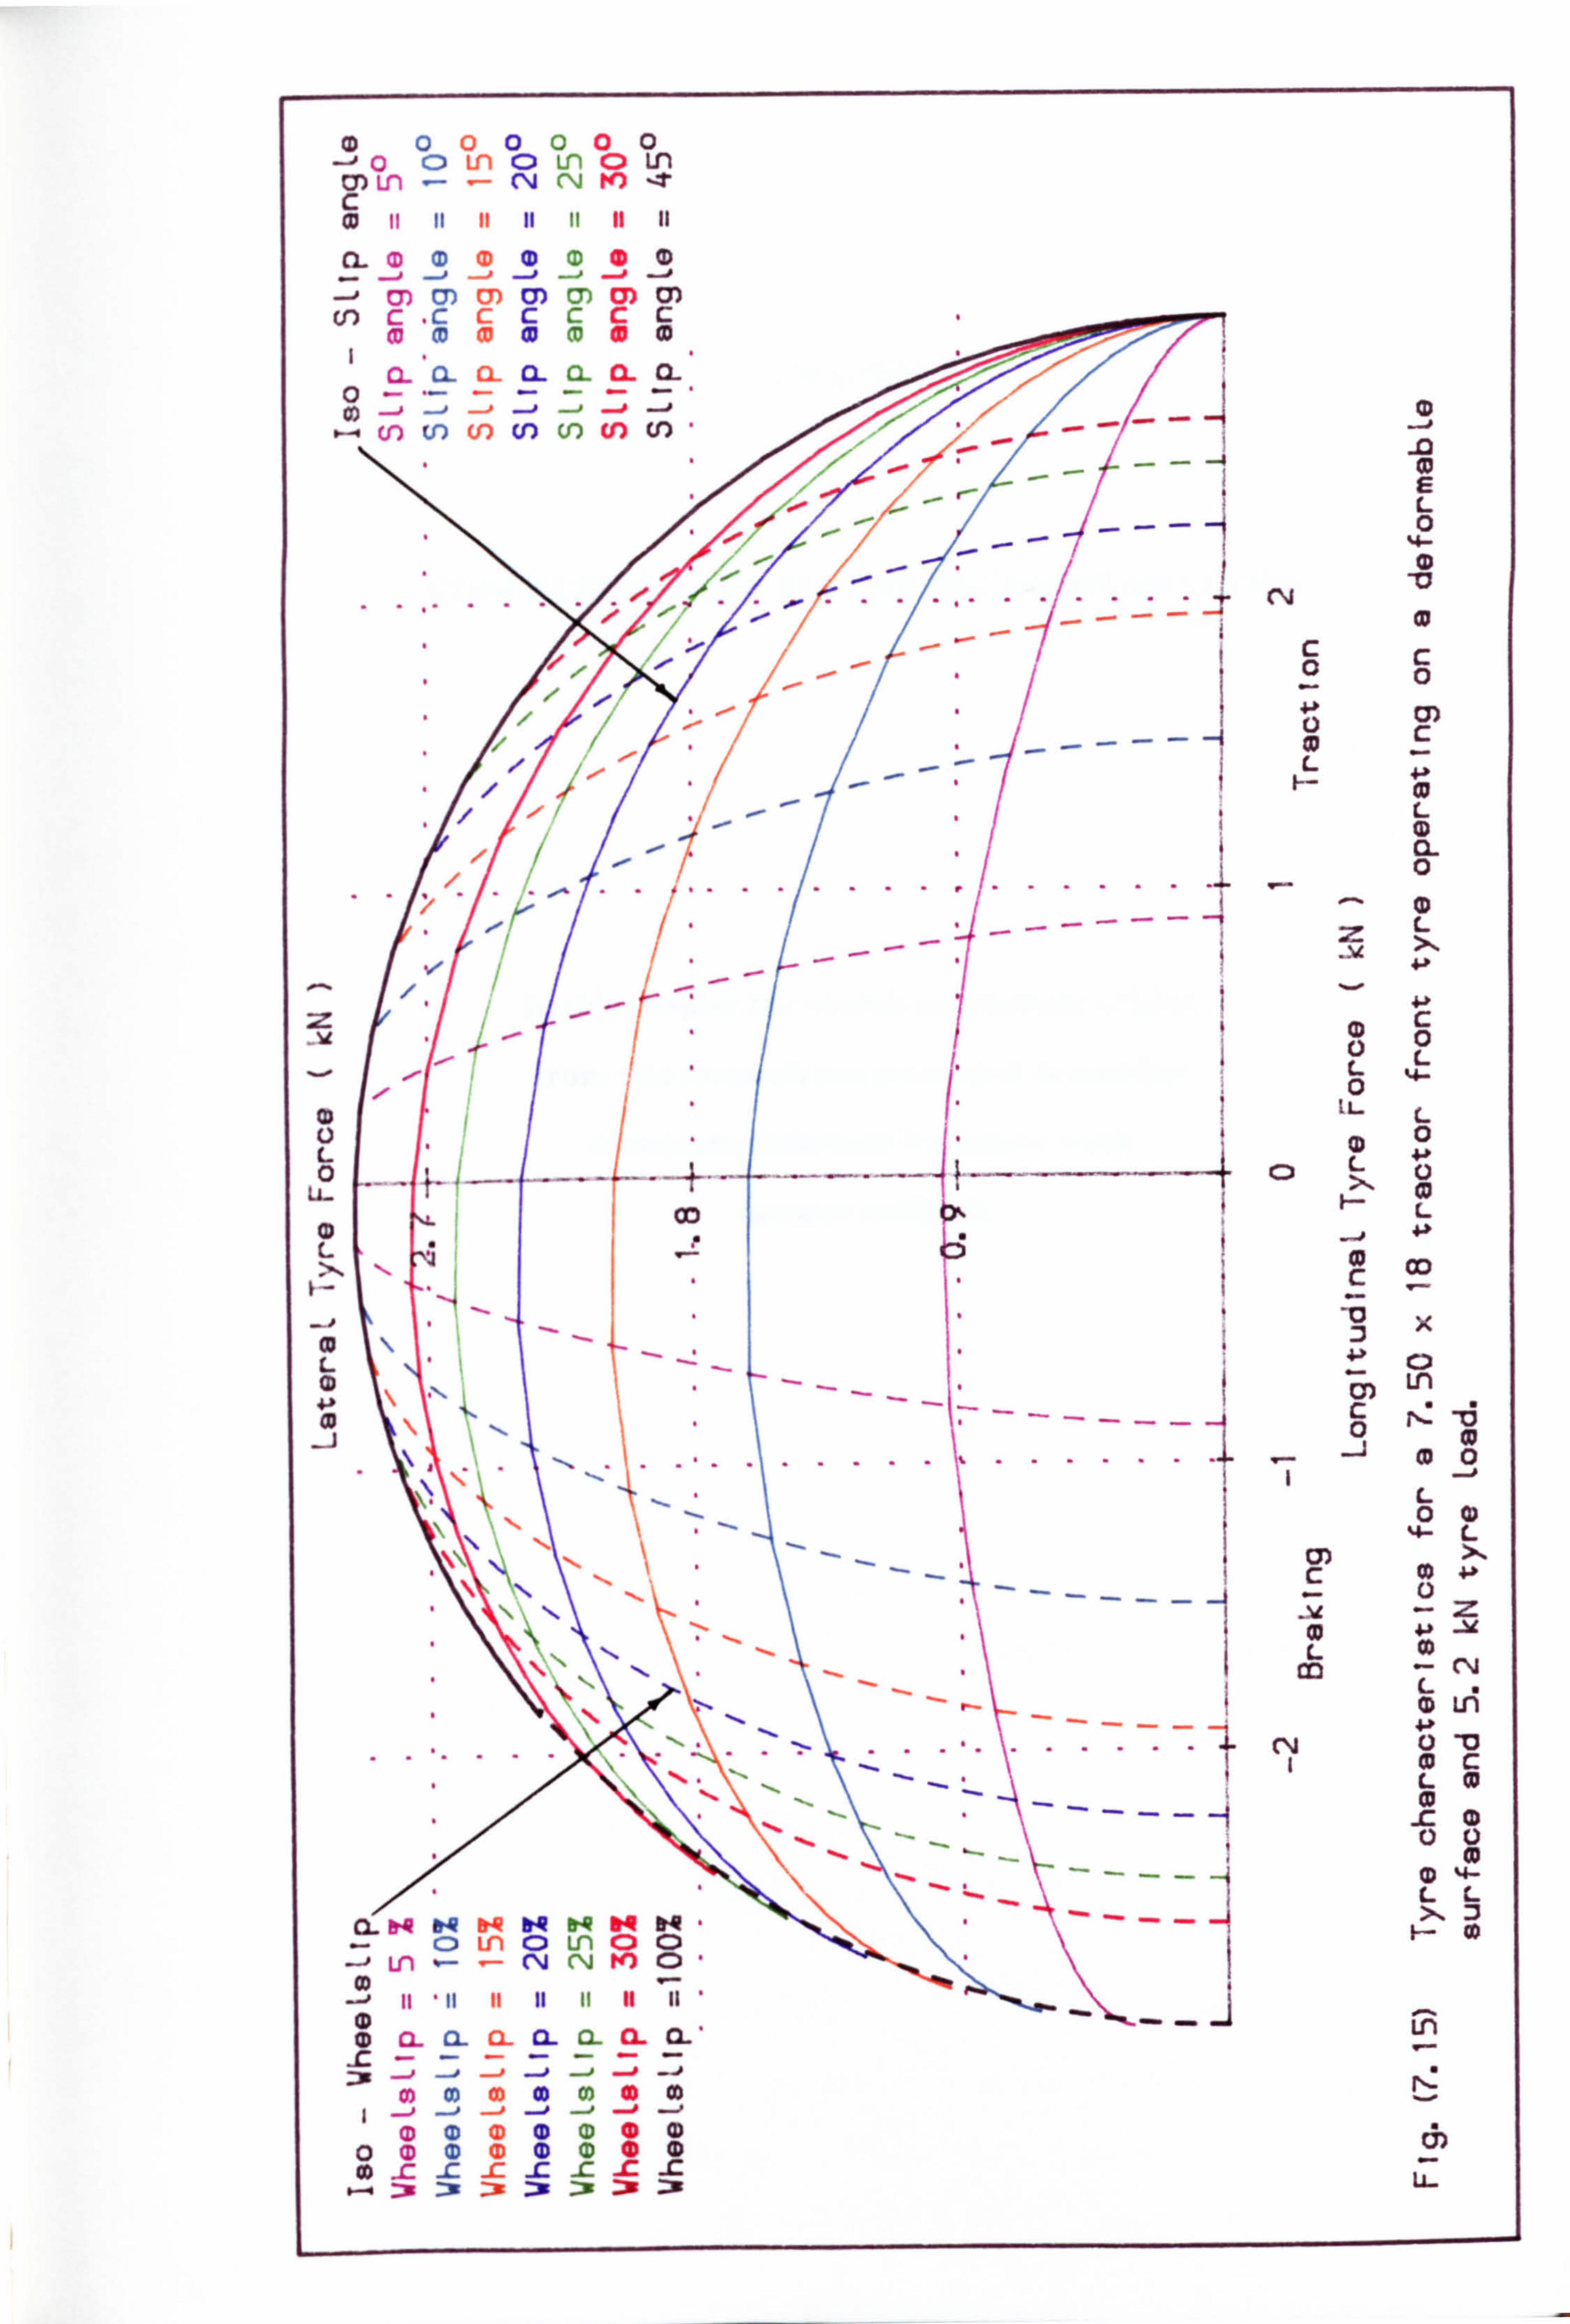
0000000 -50 0 In 0 Ln cl Ln 0) In -- CN C\J W) --T c CD 11 11 11 11 11 11 11
CLOOMCDOO(l)
-:; (7) 0) m a) 0) a) m (r) c Ic ccccc
(D OD CC CD M0 CD I
Cl- Q- Q- CL (2- CL a_ 0
(f) (. 0 Cf) U) U) U) (0 -4.
E L 0
0c 0
4-1
c
ol 4-P 1-- Lw
L
L z >1 4-P
c z 0 L
L 14- 0
uL 0 L 4-J. 0L
CD i CD L
L 4-*
c m\----1 -10 x
cl L CD In
C: 0 .............. m0
"I IIL-. 0
0W L
M
Lm mz 1ý
0 Ln . ... ... "t ...... ......
I IN 0 73
mc
Lw
-C 0
LL C) U) C) Lr) a Cl
Ln
a- C2- CL (2-'
0) Co OD 0 0) 0 Co
0 0 (D 0 0 0 0 ch OQ O CD O O O O 0 _ic
Z _c _c Z - _c _c
Z
_: x -39 :: ir Dic - ic :: 39 -: x
CHAPTER8
CONCLUSIONS AND FUTURE RECOMMENDATIONS
In this chapter the overall conclusions arising
from this research are presented. A number
of recommendations for future work
are also outlined.
-203-
8.1. CONCLUSIONS
The proposed spoke tyre model offers an improved qualitative description of behaviour
in the tyre/soil contact region by incorporating both longitudinal and lateral tyre
stiffness and by recognising that the soil forces necessary to sustain tyre deformations
result, in general, in soil displacements throughout the contact region.
The resulting spoke model requires slightly more computation than previous
models, but may conveniently be incorporated in off-road vehicle handling models to
study combined steering and braking or traction manoeuvres. Although the model gives
good qualitative agreement with previous measured data, further verification requires a
more detailed set of measurements of tyre and soil deformations under a wide range of
operation conditions.
It is believed that comparisons of the results obtained from the off-road tyre
models with those results obtained from a wide range of work recorded in the literature
presented, demonstrates the usefulness of an analysis using soil and tyre parameters.
This is emphasised by the. freedom to run the model under totally variable operating
conditions and model parameters. The general conclusions to be made are as follows-
1) A review of published work has established that there is a need for more study
of lateral off-road tyre behaviour.
2) Various models for off-road tyres are proposed. One model is expressed in a
simple form in terms of unspecified values for the operating conditions. The constraints
are determined by solving a set of non-linear equations by using the simple
optimization procedure.
3) A simple tyre model for off-road surface predicts forces in the vertical and
longitudinal directions for a static and rolling tyre in steady state conditions.
4) 717he results from a simple tyre model are significantly in agreement in
qualitative terms with the trends of the measured data obtained by a wide range of
researchers. Ile quantitative agreement between the predicted and measured results has
been also included and shown to be reasonable.
-204-
5) An extended model for combined lateral and longitudinal off-mad tyre
behaviour has been presented. It is based on the idea that in the tyre/ground contact
region the forces due to soil shear must equal those due to tyre deflection at any point.
6) Predicted force relationships with slip angle and wheelslip using the extended
model agree qualitatively with those obtained from measured data by a wide range of
researchers.
7) The most important finding for the scope of the extended tyre model is that the
model becomes the same as that proposed by Grecenko [19751 as the tyre stiffness is
increased and it becomes the same as that proposed by Dugoff et al [19701 at
U. M. T. R. I. as the soil strength increases. Additionally, the model is in a form which is
suitable for inclusion in vehicle models to predict handling and steering behaviour.
8) The extended tyre model offers an improved qualitative description of
behaviour in the tyre/soil contact region by incorporating both longitudinal and lateral
tyre stiffness and by recognising that the soil forces necessary to obtain tyre
deformations result, in general, in soil displacements throughout the contact region.
9) 'I'he resulting extended model requires slightly more computation than models
previously proposed in the literature, but may conveniently be incorporated in off-road
steering and braking or tractive modelling manoeuvres.
10) Although the extended model gives good qualitative agreement with
previously measured data, further verification requires a more detailed set of
measurements of tyre and soil deformations under combined longitudinal and lateral
force conditions. A further research project at the University of Leeds is in progress to
obtain such data.
11) The extended model represents a significant advance over previous models in
that it is the first time that tyre/soil interaction has incorporated both the tyre
flexibilities and soil deformation characteristics. At the extreme conditions of a very
stiff tyre or very stiff soil, however, it reduces to models previously derived for off-
road and on-road conditions respectively.
-205-
12) The multi-spoked tyre model on deformable soils is well suited to calculating
the tyre forces in vehicle simulations because of its generality in that it can be used for
on and off-road conditions, its reliance on readily available computing devices, and its
mode of operation involving the specification of the motion and deduction of the
forces.
13) The spoke tyre simulation represents a better understanding of the tyre
behaviour in rapid manoeuvring and steering on off-road surface conditions. The
method for modelling the tyre shows advantages over the extended tyre model because
the forces obtained can be investigated in greater detail throughout the length of the
contact region and the aligning moment as a function of the slip angle and tyre load is
developed.
14) The predicted results show a significant qualitative agreement with measured
data which have been collected from many sources and relate to a wide range of
operating conditions. Quantitative agreement between the results and measured data is
also shown although it is recognised that this comparigon is often difficult because of
the lack of soil and tyre data quoted in reports of measurements.
15) This application in this thesis of spoke tyre model, which was originally
derived for road vehicle tyres, is novel in that it is the first attempt to model a flexible
and deformable surface under the spoke tips. As the soil becomes infinitely stiff, the
model reduces to that already proposed for a road tyre.
16) Each of the models is implemented in a computer programme suitable for
inclusion in vehicle handling models, i. e. given the relevant data and operating
conditions, the model produces the predicted tyre forces as outputs.
-206-
8.2. FUTURE RECOMMENDATIONS
From the work detailed and the conclusions drawn in this thesis it is apparent that
several avenues for future work exist and these should be explored. In order to
overcome the limitations described above, the recommendations for future research on
off-road tyre models are summarised as follows: -
1) A detailed experimental study of the forces generated by off-road tyres model
carefully controlled conditions eg. in a soil tank. The soil and tyre data should be
measured and then the tyre forces measured over the entire range of operating
conditions. This would provide a detailed and reliable data set against which to
compare the model predictions.
2) Further extensions of these measurements would include various soil types,
inflation pressures, tread pattern etc. In fact, such a programme of work is now in
Progress at the University of Leeds.
3) Development of off-road tyre models to include the real contact width which is
expected to affect the tyre deflections and tyre forces.
LIST OF REFERENCES
Abeels, P. F. J. [1976] "Tire deflection and contact studies". I of Terramechanics, Vol. 13 No. 3, pp (183-196).
Abeels, P. F. J. [1984] "Modeling of off-road tyres and soil for improved
traction". Proceeding of 8th Int. Conf. of I. S. T. V. S., pp (16-31).
Abeels, P. F. J. [1987] "Off the road tyres". Proceedings of 9th Int. Conf of
I. S. T. V. S., Vol. I, pp (244-248).
Baker, C. J. and Collins, R. M. [1972] "A comparison of tractor rear tyres in
their resistance to side slip". J. Agric. Engng. Res. 17s, 5 1, p 9.
Baladi, G. Y. and Rohani, B. [1984] "Development of a soil-wheel interaction model". Proceedings of 8th of Int. Conf. of I. S. T. V. S., pp (33-60).
Bekker, M. G. [1956] "Theory of Land Locomotion". University of Michilapan
Press, Ann Arbor, U. S. A.
Bekker, M. G. [1960] "Off-thp-road locomotion". University of Nfichigan
Press, Ann Arbor, U. S. A.
Bekker, M. G. and Janosi, Z. J. [1960] "Analysis of towed pneumatic tires
moving in soft ground". U. S. Army O. T. A. C., Land Locomotion Laboratory
Report RR-6.
Bekker, M. G. [1969] "Introduction to terrain-vehicle systems". The University
of Michigan press, Ann Arbor, U. S. A.
Bekker, M. G. and Senionin, EN. [19751 "Motion resistance of pneumatic tyres". J. of Automotive Engineering (J. A. E. ), pp (6-10).
Bekker, M. G. [1985] "Parametric analyses of pneumatic tires update-samples
of engineering problems and solutions in off-road locomotion". S. A. E.
Transactions, Technical Series No 850536.
-208-
Bernard, J. E. ; Segel, L. and Wild, R. E. [1977] "Tire shear force
generation during combined steering and braking maneuvers". S. A. E. Transactions, Paper No. 770852.
Bolling, 1. [1981] "Distribution of vertical stresses in soil beneath wheels". Proceedings of 7th Int. Conf. of I. S. T. V. S., Vol. 2, pp (497-529).
Bolling, 1. [1984] "Pressure tests in soil below tires of agricultural vehicles". Proceedings 8th Int. Conf. of I. S. T. V. S., pp (675-690).
Boonsinsuk, P. and Yong, R. N. [1984] "Soil compliance influence on tyre
performance". Proceedings of 8th Int. Conf. of I. S. T. V. S., pp (61-80).
Burt, E. C. and Bailey, A. C. [1982] "Load and inflation pressure effects on tires". Transactions of the A. S. A. E., Vol. 25 No. 4, pp (881-884).
Burt, E. C. and Turner, J. L. [1983] "Soil mechanics in off-road vehicle design :A historical perspective". S. A. E., Paper No. 830805, pp (1-7).
Captain, K. M. ; Bogliani, A. B. and Wormley, D. N. [1979] "Analytical
tire models for dynamic vehicle simulation". Vehicle System Dynamics, Vol. 8,
pp
Clark, S. K. [19651 "The rolling tire under load". -S. A. E. Transactions, pp(l -9), Paper No. 650493.
Clark, S. K. [1982] "Mechanics of pneumatic tyre". U. S. Dept. of Transportation, National Highway Traffic Safety Adminstration, Washington,
U. S. A.
Crolla, D. A. and Hales, F. D. [19791 "The lateral stability of tractor and tractor trailer combinations". J. of Terramechanics, Vol. 16 No. 1, pp (1-22).
Crolla, , D. A. and Horton, D. N. L. [19841 "Factors affecting the dynamic
behaviour of higher speed agricultural vehicles". j. Agric. Engng. Res., Vol. 30,
pp (277-288).
-209-
Crolla, D. A. and El-Razaz, A. S. A. [1987] "A review of the combined lateral and longitudinal force generation of tyres on deformable surfaces". J. of Terramechanics, Vol. 23, No 3, pp (199-225).
Crolla, D. A.; EI-Razaz, A. S. A.
; Alstead, C. J. and Hockley, C. [1987] "A model to predict the combined lateral and longitudinal forces on an off-road tyre". Proceedings of 9th Int. Conf.
of I. S. T. V. S., Vol. 1, pp (362-372).
Chung, T. J. and Lee, J. K. [1975] "Dynarnics of viscoelastoplastic soil under
a driving wheel". I of Terramechanics, Vol. 12, No. 1, pp (15-31).
Del Rosario, C. R. [19801 "Lateral force investigations on steered pneumatic
tyres operating under soil conditions". Ph. D. Iliesis, Silsoe College Cranfield
Institute of Technology, England.
Dugoff, H. ; Fancher, P. S. and Segel, L. [19691 "Tire performance
characteristics affecting vehicle response to steering and braking control inputs".
Highway Safety Research Institute, University of Michigan, Report No. C5T-
460, pp (897-00).
Dugoff, H. ; Fancher, P. S. and Segel, L. [1970] "An analysis of tire
traction properties and their influence on vehicle dynamic performance". S. A. E.
Transactions, Paper No. 700377, pp (341-366). -
Dwyer, M. J. [1972] "Field measurement of agricultural tractor tyre
performance at the National Institute of Agricultural Engineering". Proceedings
of 4th I. S. T. V. S., Held Stockholm, pp (39-60).
Dwyer, M. J. ; Comely, D. R. and Evernden, D. W. [1974a] "The
development of the N. I. A. E. handbook of agricultural tyre performance". N. I. A. E. Departmental Note DN/T/517/1415, pp, (679-699).
Dwyer, M. J. ; Comely, D. R. and Evernden, D. W. [1974b] "The field
performance of some tractor tyres related to soil mechanical properties". I of Agric. Engng. Res., Vol. 19, pp (35-50).
-210-
EI-Nashar, M. A. [1985] "The generation of shear forces by pneumatic tyres". Ph. D. Tbesis University of Leeds, England.
Fancher, P. S. [1970) "Experimental studies of tire shear force mechanics". The University of Mchigan, Ann Arbor Dot-HS-800-416. FH-11-6090, NBS
CST 9285 18P.
Freeman, C. A. [19601 "Experimental determination of the effect of traction on cornering force". S. A. E. Transactions, Preprint Paper No 186B.
Freitag, D. R. [1965] "Wheels on soft soils, an analysis of existing data". Waterway Experiment Station, Technical Report No. 3-670.
Freitag, D. R. and Smith, M. E. [1966] "Center-line deflection of pneumatic tires moving in dry sand". I of Terrarnechanics, Vol. 3 No. 1, pp (31-46).
Freitag, D. R. [1968] "Dimensional analysis of performance of pneumatic tires
on sand". Transactions of the A. S. A. E., Vol. 2 No. 5, pp (669-672).
Freitag, D. R. ; Green, A. J. and Murphy, N. R. JR. [1975] "Normal
stresses at the tyre-soil interface in yielding soils". U. S. Army Engineer Waterways Experiment Station, CE, Vicksburge pp (1 - 18).
Fujimoto, Y. [1977] "Performance of elastic wheels on yielding cohesive soils". J. of Terramechanics, Vol. 14 No 4, pp (191-210).
Gee-Clough, D. [1980] "Selection of tyre sizes for agricultural vehicles". J. of Agric. Engng. Res., Vol. 25, pp (261-278).
Gee-Clough, D. and Sommer, M. S. [19811 "Steering forces on undriven angled wheels". I of Terrarnechanics, Vol. 18, No. 1, pp (25-49).
Gilfillan, G.; Spencer, H. B. and Rowe, F. P. H. (1976] "Some preliminary results from side force tests on a 7.50 x 16 tractor front tyre". Scottish Inst. of Agric. Engng. Departmental note SSN/203.
-211-
Gohich, H. [1984] "The development of tractors and other agricultural
vehicles". I of Engng. Res., Vol. 29 No. 1, pp (3-16).
Grecenko, A. [1967] "Binomic slip-thrust equation for tractors on
predominantly frictional soil". I of Terramechanics, Vol. 4 No. 4, pp (37-54).
Grecenko, A. [1969] "Slip and drift of the wheel with tyre on soft ground". Proc. 3rd I. S. T. V. S. Conf., Essen, Vol. II, pp (76-95-).
Grecenko, A. [19751 "Some applications of the slip and drift theory of the
wheel". 5th Int. Conf. of I. S. T. V. S. , NEchigan, U. S. A.
Grecenko, A. [1984a] "Study of the motion of agricultural vehicles on steep
grass-covered slopes". 8th Int. Conf. of I. S. T. V. S. Cambridge, England.
Grecenko, A. [1984b] "Operation on steep slopes : State-Of-The-Art Report".
I of Terramechanics, Vol. 21 No 2, pp (181-194).
Hettiaratchi, D. R. P. ; Witney, B. D. and Reece, A. R. [1966] "The
calculation of passive pressure in two-dimensional soil failure". J. of Agric.
Engng. Res., Vol. 11 No. 2, pp (89-107).
Hettiaratchi, D. R. P. [19691 "The calculation of passive earth pressure". Ph. D.
Thesis, University of Newcastle-Upon-Tyne.
Horton, D. N. L. and Crolla, D. A. [19841 "The handling behaviour of off-
road vehicles". Int. I of Vehicle Design Vol. 5 Nos. 1/2, pp (197-218).
Ipek, I. S. [19591 "Forces and moments on a pneumatic tyre and their effect on
the behaviour of pneumatic tyred vehicles on slopes". Thesis Tech. Hoclisch.
Brauschweig.
Iritanis, S. and Baba, T. [1964] "Forces on the contact patch of the tyre". Proceedings of 10th Int. Automobile Technical Congress, FIRTA, pp, (212-
224).
-212-
Janosi, Z. J. [1962] "An analysis of pneumatic tire performance on deformable
soils". Proceedings lst Int. Conf. of Mechanics on Soil-Vehicle Systems, pp (737-762).
Janosi, Z. J. [1963] "Performance analysis of a driven non-deflecting tyre in
soil". Land Locomotion Lab., Report No 809 1.
Janosi, Z. J. ; Kamm, 1.0. and Wray, G. [19811 "Tire turning forces under
on-and off-road conditions". Proc. of the 7th Int. Conf. I. S. T. V. S., Calgary, late
submission.
Jurkat, M. P. and Brady, P. M. [1981] "On a lateral force tire model for both
highway and soft soil conditions". Proc. of the 7th Int. Conf. I. S. T. V. S., Calgary, late submission.
Karaflath, L. L. and Nowatzki, E. A. [1978] "Soil mechanics for off- road
vehicle". Series on Rock and Soil Mechanics Vol. 2 No. 5 (1974f77), First Edition.
Kniglit, S. J. and Green, Aj. [1962] "Deflection of moving tire on firm to
soft ground". Transactions of the A. S. A. E., Vol. 2, pp (116-120).
Kolobov, G. G. [19661 "Soil pressure measurements beneath tractor tyres".
of Terramechanics, Vol. 3 Part 4, pp (9-15).
Komandi, G. [1976] "The detennination of the deflection, contact area, dimensions, and load carrying capacity for driven pneumatic tires operating on
concrete pavement" J. of Terramechanics, Vol. 13 No 1, pp (15-20).
Koolen, AJ. and Kuipers, H. [1983] "Agricultural Soil Mechanics".
Springer-Verlag, Berlin Heidelberg New York Tokyo.
Kraft, D. C. and Phillips, N. S. [1975] "Turning forces developed by a
pneumatic tire operating in soils, with application to vehicle design criteria". Proceedings of 5th Int. Conf. for Terrain-Vehicle Systems, Detroit, pp (473-
792).
-213-
Krick, G. [1969] "Radial and shear stress distribution under rigid wheels and
pneumatic tyres operating on yielding soils with consideration of tyre deformation". I of Terramechanics, Vol. 6 No 3, pp (73-98).
Krick, G. [1973] "Behaviour of tyres driven in soft ground with side slip" J. of Ten-amechanics, Vol. 9 No 4, pp (9-30).
McAllister, M. [19791 "A rig for measuring the forces on a towed wheel". I
Agric. Engng. Res. Vol. 24, pp (259-265).
McAllister, M. ; Gee-Clough, D. and Evernden, G. W. [1981] "An investigation into forces on undri'ven angled wheels". N. I. A. E. Departmental
note DN 1045.
McAllister, M. [19841 "Forces on undriven, angled wheels". Proceedings 8th
Int. Conf. of I. S. T. V. S., pp (803-819).
Meyer, M. ; Marti, F. ; Schiess, J. and Schlapfer, H. [1978]
"Performance of tractor rear tyres when operating across slopes". N. I. A. E.
translation No 443, Silsoe, England, pp (1-13).
National Institute of Agricultural Engineering [1978] "Performance of tractor tyres". Project review PRfF/78/01002.
Nordeen, D. L. and Cortese, A. D. [1964] "Force and moment characteristics of rolling tires". S. A. E. Transactions, pp (1-13), Paper No. 713A (Preprint).
Nordeen, D. L. [1967] "Analysis of tire lateral forces and interpretation of experimental tire data". S. A. E. Transactions, Paper No. 670173.
Pacejka, H. B. [1981] "Analysis of tire properties". Chapter 9 of Mechanics of
pneumatic tires S. K. Clark (ed. ) N. B. S. Monograpb 122 2nd ed.
Painter, D. J. [19811 "A simple deflection model for agricultural tyres". I of Agric. Engng. Res., Vol. 26, pp (9-20).
-214-
Perdok, U. D. [1978] "A prediction model for the selection of tyres for towed
vehicle on tilled soil". J. of Agric. Engng. Res., Vol. 23, pp (369-383).
Phillips, J. R. [19591 "Experimental determination of the forces on some towed drifting wheels". J. of Agric. Engng. Res., Vol. 4, pp (294-306).
Plackett, C. W. [1983] "Hard surface contact area measurement for
agricultural tyres". Div. Note DN/1200, N. I. A. E., Silsoe, England.
Plackett, C. W. [19841 "The ground pressure of some agricultural tyres at low
load and with zero sinkage". J. Agric. Engng. Res., Vol. 29, pp (159-166).
Plackett, C. W. [1985] "A review of force prediction methods for off-road
wheels". J. Agri&. Engng. Res. Vol. 3 1) pp (1 -29).
Prettyman, C. E. [19811 Tomputerised tyre footprint area measurements". A. S. E., PaperNo. 810511, pp(1-5).
Reece, A. R. [19641 "Theory and practice of off-the-road locomotion".
Presented at the Annual Conference, London 28th April, pp (82-90).
Reec, e, A. R. [19651 "The fundamental equation of earthmoving mechanics". I.
Mech. E. Symposium on Earthmoving Equipment. Vol. 119, part 3F.
Rileyj J. G. [19681 ''The design of a single wheel tester". M. Sc. Thesis,
University of Newcastle Upon Tyne.
Sakai, H. [19811 "Part 3: Calculation of the six components force of a tyre". Int. J. of vehicle Design Vol. 2 No 3, pp (335-372).
Satake, M. and Mukai, T. [1972] "Traction and flotation characteristics of
earthmover tires on soft soil". S. A. E. Transactions, Vol. 81, pp (2242-2250),
Paper No. 720743.
Savkoor, A. R. [1970] "The lateral flexibility of pneumatic tyre and its
application to the lateral rolling contact problem". S. A. E. Transactions, pp (367-
38 1), Paper No. 70037 8.
-215-
Schwangliart, H. [1968] "Lateral forces on steered tyres in loose soil". J. of Terramechanics, Vol. No. 5 No 1, pp (9-29).
Schwanghart, H. [1981] "Measurements of forces on steered towed wheels". Proc. of the 7th Int. Conf. I. S. T. V. S. Calgary, Vol. 1, pp (335-356).
Schwanghart, H. and Rott, K. [1984] "The influence of the tyre tread on the
rolling resistance and steering forces on undriven wheels,. 8th Int. Conf. of I. S. T. V. S. Cambridge, England, pp (872-888).
Segel, L. [19841 "Measuring and modeling mechanical properties of pneumatic tires". International Rubber Conference, Moscow.
Seitz, N. and Hussmann, A. W. [1971] "Forces and displacement in contact
area of free rolling tires". S. A. E. Transactions, Vol. 80, pp (2323-2329), Paper
No 710626.
Sliarp, R. S. and E I-Nashar, M. A. [19861 "A generally applicable digital
computer based mathematical model for the generation of shear forces by
pneumatic tyres. " Vehicle System Dynamics, Vol. 15 No 4, PP (187-209).
Soane, B. D. ; Blackwell, P. S. ; Dickson, J. W. and Painter, D. J. [1981] "Computation by agricultural vehicles (A review in soil and wheel characteristics )". Soil and Tillage Research, Vol. 1, pp (207-237).
Sochne, W. [1953] "Distribution of pressure in the soil and soil defonnation
under tractor tyres". Grundl Landtech, Vol. 5, pp (49-63).
Taylor, P. A. and Birtivliisfle, R. [1966] "Experimental studies of force
systems on steered agricultuml tyres". Proc. of the Inst. of Mech. Eng., Vol. 181 Part 24, pp (1-14).
IYolli, C. and Viola, L. [1987 ,I
"A new large base agricultural drive tyre : field tests on clay soil". Institute of Agricultural Engineering of the University
of Milan Via Celoria, 2-20133 Milano, Italy.
4
-216-
Turnage, G. W. [1976] "In-soil tractive performance of selected radial and bias-ply tyres". Transactions of the A. S. A. E., paper No. 76-1520.
Vandenberg, G. E. and Gill, W. R. [1962] "Pressure distribution between a
smooth tire and the soil". Transactions of the A. S. A. E., pp (105-107).
Wills, B. M. D. [1966] "The load sinkage equation in theory and practice". Proceedings of 2nd Int. Conf. of I. S. T. V. S., Held Quebec.
Wismer, R. D. and Luth, H. J. [1973] "Off-road traction prediction for
wheeled vehicles". I of Terramechanics, Vol. 10 No 2, pp (49-61).
Wong, J. Y. [19781 "Theory of ground vehicles". Carleton University, Ottawa,
Ontario, U. S. A.
Yin, L. ; Wang, Z. ; Qiu, X. and Wang, Q. [1985] "Distribution of stresses beneath a drive pneumatic tyre and preduction of its tractive performance on
sand". Proceedings of Int. Conf. on Soil Dynamics, Vol. 4, pp (738-755).
Yong, R. N. and Windish, E. J. [19701 "Determination of wheel contact
stresses from measured instantaneous soil deformations". I of Terramechanics, Vol. 7 Nos. 3/4, pp (57-67).
Yong, R. N. , Boonsinsuk, P. and Fattah, E. A. [1978a) "Prediction of tyre
performance on soft soils relative to carcass stiffness and contact areas". J. of Terramechanics, Vol. 15 No 1, pp (643-675).
Yong, R. N. ; Fattah, E. A. and Boonsinsuk, P. [1978b] "Analysis and
prediction of tyre-soil interaction and performance using finite elements". I of Terramechanics, Vol. 15, No 1, pp (43-63).
Yong, R. N. ; Boonsinsuk, P. and Fattah, E. A. [1980] "Tyre flexibility and
mobility on soft soils". I of Terramechanics, Vol. 17, No 1, pp (43-58).
Related Documents