University of New Mexico UNM Digital Repository Civil Engineering ETDs Engineering ETDs 9-10-2010 Lateral outflow from supercritical channels Nelson Bernardo Follow this and additional works at: hps://digitalrepository.unm.edu/ce_etds is esis is brought to you for free and open access by the Engineering ETDs at UNM Digital Repository. It has been accepted for inclusion in Civil Engineering ETDs by an authorized administrator of UNM Digital Repository. For more information, please contact [email protected]. Recommended Citation Bernardo, Nelson. "Lateral outflow from supercritical channels." (2010). hps://digitalrepository.unm.edu/ce_etds/32

Welcome message from author
This document is posted to help you gain knowledge. Please leave a comment to let me know what you think about it! Share it to your friends and learn new things together.
Transcript

University of New MexicoUNM Digital Repository
Civil Engineering ETDs Engineering ETDs
9-10-2010
Lateral outflow from supercritical channelsNelson Bernardo
Follow this and additional works at: https://digitalrepository.unm.edu/ce_etds
This Thesis is brought to you for free and open access by the Engineering ETDs at UNM Digital Repository. It has been accepted for inclusion in CivilEngineering ETDs by an authorized administrator of UNM Digital Repository. For more information, please contact [email protected].
Recommended CitationBernardo, Nelson. "Lateral outflow from supercritical channels." (2010). https://digitalrepository.unm.edu/ce_etds/32

i
Nelson Bernardo Candidate
Civil Engineering
Department
This thesis is approved, and it is acceptable in quality
and form for publication:
Approved by the Thesis Committee:
, Chairperson

ii
LATERAL OUTFLOW FROM
SUPERCRITICAL CHA��ELS
By
�ELSO� BER�ARDO
B.S. E�VIRO�ME�TAL E�GI�EERI�G
U�IVERSITY OF VERMO�T, 2008
THESIS
Submitted in Partial Fulfillment of the
Requirements for the Degree of
Master of Science
Civil Engineering
The University of New Mexico
Albuquerque, New Mexico
July, 2010

iii
ACK�OWLEDGME�TS
I would like to thank my committee chair Dr. Julie Coonrod for her support and
encouragement throughout my time at the University of New Mexico, my committee
members Dr. Bruce Thomson and Dr. Mark Stone for helping me with my thesis and
graduate career, and the Albuquerque Metropolitan Arroyo Flood Control Authority
(AMAFCA) for the funding to allow this research to be performed.
I also would like to thank all of the professors that I had courses with during my
graduate school career for all of the knowledge I have gained from them, Dr. Jungseok
Ho for assisting the beginning portions of the experiment, fellow graduate students Kyle
Shour for assisting in collecting data for one of my experiments and for the various
AMAFCA projects we have conducted in the last year or so, and also Elizabeth Field for
assisting me with one of my experiments and helping me keep my sanity by keeping me
company in the hydraulics laboratory.

iv
LATERAL OUTFLOW FROM
SUPERCRITICAL CHA��ELS
BY
�ELSO� BER�ARDO
ABSTRACT OF THESIS
Submitted in Partial Fulfillment of the
Requirements for the Degree of
Master of Science
Civil Engineering
The University of New Mexico
Albuquerque, New Mexico
July, 2010

v
LATERAL OUTFLOW FROM
SUPERCRITICAL CHA��ELS
By
�elson Bernardo
B.S., Environmental Engineering, University of Vermont, 2008
M.S., Civil Engineering, University of New Mexico, 2010
ABSTRACT
Stormwater pollutants caused by urban runoff are a major concern for the
Albuquerque Metropolitan Arroyo Flood Control Authority (AMAFCA), and other flood
control authorities, as stormwater channels eventually are discharged into natural
waterways. One method of improving stormwater quality is diverting frequent storms or
the first flush of less frequent storms to a structural debris filter and/or a constructed
wetland prior to reentrance into the channel. The focus of this study was to develop a
reasonable method of retrofitting a supercritical stormwater channel with a diversion
structure that would route frequent flows to treatment.
A range of design flows were tested and evaluated for a trapezoidal channel with
a lateral outflow pipe. Lateral pipe angle, pipe invert, and vane configurations were
tested for outflow efficiency and to observe hydraulic effects in the main channel. A
bench-top model was constructed and tested to determine which pipe invert,
configuration, and pipe diameter would be used for the larger scale experiments.
An 8 inch (20.32 cm) diameter pipe set across the base of the channel with a pipe
invert of 50% increased the diversion ratio within the range of 15% to 100%, depending

vi
on the configuration tested. HEC-RAS was used to model three different pipe angles
relative to the main channel axis to determine if the numerical program was able to
capture the hydraulic effects observed from the physical model. The results from the
program were in agreement with the physical model.

vii
Table of Contents
List of Figures ............................................................................................................................... ix
List of Tables................................................................................................................................. xi
1. Introduction ........................................................................................................................... 1
2. Background & Literature Review ....................................................................................... 3
2.1 Lateral Outflow of Channels ................................................................................ 3
2.1.1 Supercritical Rectangular Channel ................................................................ 3
2.1.2 Subcritical Rectangular Conditions ............................................................... 4
2.1.3 University of New Mexico Open Channel Lab Model Studies .................... 5
2.2 Flow over Side Weirs ........................................................................................... 8
2.2.1 Effects of Curvature in Supercritical Side Weir Flow .................................. 8
2.2.2 Lateral Outflow over Side Weirs .................................................................. 8
2.2.3 Effects of Coefficient of Discharge for Supercritical Side Weir Flow ......... 9
2.2.4 Sharp Crested Side Weir ............................................................................... 9
2.3 Supercritical Channel Flow Characteristics ....................................................... 10
2.3.1 Supercritical Flow near Wall Deflection ..................................................... 10
2.3.2 Supercritical Channel Bend Flow ............................................................... 10
2.3.3 U-Shaped Channel Bend Flow in Manhole................................................. 12
2.3.4 Wave Type at Abrupt Drops ....................................................................... 12
2.4 Flow Patterns past Submerged Vane Structures ................................................. 14
2.4.1 Flow Field Analysis of Angle of Attacks .................................................... 14
2.4.2 Vane Height and Angle Analysis ................................................................ 14
2.4.3 Tapered Vane .............................................................................................. 15
3. Physical Modeling ............................................................................................................... 16
3.1 Side Wall Outlet Experiment .............................................................................. 17
3.1.1 Side Wall Outlet Physical Model ................................................................ 17
3.1.2 Vane Structure ............................................................................................. 19
3.2 Bench Top Model ............................................................................................... 20
3.2.1 Bench Top Physical Model ......................................................................... 20
3.2.2 Bench Top Model with Vane ...................................................................... 22
3.3 Increased Contact Area Model ........................................................................... 22
3.3.1 Physical Model of Increased Contact Area ................................................. 22
3.3.2 Vane Structure ............................................................................................. 23
4. Results/Discussion ............................................................................................................... 25
4.1 Side Wall Outlet Results .................................................................................... 25
4.1.1 Pipe Angle Results ...................................................................................... 25
4.1.2 Vane Results ................................................................................................ 26
4.2 Bench Top Model Results .................................................................................. 28
4.2.1 Pipe Angle Results ...................................................................................... 28
4.2.2 Vane Results ................................................................................................ 29
4.3 Increased Contact Area Results .......................................................................... 31
4.3.1 Pipe Angle Results ...................................................................................... 31
4.3.2 Uniform Vane Structure Results ................................................................. 35
4.3.3 Tapered Vane Structure Results .................................................................. 38
viii
5. Computer Modeling ............................................................................................................ 43
5.1 HEC-RAS Modeling .......................................................................................... 43
5.1.1 HEC-RAS 90 Degree Pipe .......................................................................... 44
5.1.2 HEC-RAS 45 Degree Pipe .......................................................................... 46
5.1.3 HEC-RAS 30 Degree Pipe .......................................................................... 49
6. Conclusions and Recommendations .................................................................................. 52
Appendix A: Schematic Drawings ............................................................................................. 55
Appendix B: Upstream Velocity and Diversion Ratios............................................................ 60
Appendix C: HEC-RAS Modeling Data Sheets ........................................................................ 63
Appendix D: Physical and numerical WSP .............................................................................. 71
Appendix E: Dimensional Analysis ........................................................................................... 72
Appendix F: Similitude ............................................................................................................... 74
REFERE�CES ............................................................................................................................ 79

ix
List of Figures
Figure 1: Smaller pipe on the bottom system with hydraulic jump (Coonrod, 2002)......... 5
Figure 2: Sloped Side wall with step at 133 cfs discharge (Coonrod, 2003). ..................... 6
Figure 3: 45° pipe angle and tapered vane for side wall experiment (Coonrod, 2009). ..... 7
Figure 4: Dimensions of channel piece. ............................................................................ 18
Figure 5: Side wall set-up on tilting table. ........................................................................ 18
Figure 6: Side wall experiment with 45 degree pipe and vane. ........................................ 20
Figure 7: Bench top set-up with variables. ........................................................................ 21
Figure 8: 90 degree pipe with 35 degree vane at a height ratio of 0.5. ............................. 24
Figure 9: Configurations with Trapezoidal Froude Number versus diversion ratio. ........ 26
Figure 10: Linear relationship of different vane structures. .............................................. 27
Figure 11: "Rooster tail" wave from vane ......................................................................... 27
Figure 12: Diversion ratio at different inverts and diameters. .......................................... 28
Figure 13: Pipe invert of 25%, 50%, and 75% from left to right. ..................................... 29
Figure 14: Vorticity with 90 degree pipe. ......................................................................... 32
Figure 15: Diversion ratio variation for Froude number at different pipe angles. ............ 33
Figure 16: Diversion ratio for varying upstream velocity of different pipe angles........... 34
Figure 17: Hydraulics of 30 degree pipe below 100% removal. ....................................... 34
Figure 18: 30 degree pipe with 45 degree uniform vane................................................... 35
Figure 19: 90 degree pipe at different vane angles for Froude number; uniform. ............ 36
Figure 20: 45 degree pipe at different vane angles for Froude number; uniform. ............ 37
Figure 21: 30 degree pipe at different vane angles for Froude number; uniform. ............ 38
Figure 22: 30 degree pipe with 35 degree tapered vane. ................................................... 39
Figure 23: 90 degree pipe at different vane angles for Froude number; tapered. ............. 40
Figure 24: 45 degree pipe at different vane angles for Froude number; tapered. ............. 41
Figure 25: 30 degree pipe at different vane angles for Froude number; tapered. ............. 42
Figure 26: HEC-RAS 90 degree pipe model. .................................................................... 45
Figure 27: WSP of 90 degree pipe. ................................................................................... 46
Figure 28: HEC-RAS 45 degree pipe model. .................................................................... 47
Figure 29: WSP of 45 degree pipe. ................................................................................... 48
Figure 30: HEC-RAS 30 degree pipe model. .................................................................... 50
Figure 31: WSP of 30 degree pipe. ................................................................................... 51
Figure 32: Dimensions of 30 degree pipe configuration. .................................................. 55
Figure 33: Dimensions of 45 degree pipe configuration. .................................................. 55
Figure 34: Dimensions of 90 degree pipe configuration. .................................................. 56
Figure 35: Uniform vane dimensions at 35 degrees. ......................................................... 56
Figure 36: Uniform vane dimensions at 40 degrees. ......................................................... 57
Figure 37: Uniform vane dimensions at 45 degrees. ......................................................... 57
Figure 38: Tapered vane dimensions at 35 degrees. ......................................................... 58
Figure 39: Tapered vane dimensions at 40 degrees. ......................................................... 58
Figure 40: Tapered vane dimensions at 45 degrees. ......................................................... 59
Figure 41: 90 degree pipe at different vane angles for velocity; uniform. ........................ 60
Figure 42: 45 degree pipe at different vane angles for velocity; uniform. ........................ 60
Figure 43: 30 degree pipe at different vane angles for velocity; uniform. ........................ 61
Figure 44: 90 degree pipe at different vane angles for velocity; tapered. ......................... 61

x
Figure 45: 45 degree pipe at different vane angles for velocity; tapered. ......................... 62
Figure 46: 30 degree pipe at different vane angles for velocity; tapered. ......................... 62
Figure 47: WSP of physical and numerical model of 90 degree pipe. .............................. 71
Figure 48: WSP of physical and numerical model of 45 degree pipe. .............................. 71
Figure 49: WSP of physical and numerical model of 30 degree pipe. .............................. 71
Figure 50: Variables used in the dimensional analysis. .................................................... 72
Figure 51: Locations of possible sites. .............................................................................. 76

xi
List of Tables
Table 1: Diversion ratios for bench top model. ................................................................. 29
Table 2: Diversion ratios from bench top model vane test. .............................................. 31
Table 3: Velocity and Froude values with percent errors. ................................................ 44
Table 4: Storm event discharge values (U.S. Army, 1995). .............................................. 76
Table 5: Vineyard arroyo prototype flows and diversions. ............................................... 77
Table 6: Hahn arroyo prototype flows and diversions. ..................................................... 77
Table 7: Princeton basin prototype flows and diversions. ................................................ 78

1
1. Introduction Many communities in the United States have supercritical channels due to drastic
elevation changes including New Mexico, Arizona, Nevada, Colorado, Utah, Hawaii, and
other mountainous areas. Supercritical channel research has also been done in Japan and
Switzerland.
The Albuquerque Metropolitan Arroyo Flood Control Authority (AMAFCA) has
approximately 50 miles (80.5 km) of hard and soft lined stormwater channels throughout
the city of Albuquerque. Many of the hard-lined channels experience supercritical
conditions because of their smooth concrete finish and steep slope. The elevation of the
Albuquerque Metropolitan area varies from 4,992 feet (1,522 m) near the Rio Grande to
6,400 feet (1,951 m) at the eastern city limits near the base of the Sandia Mountains. The
distance between the Rio Grande to the Sandia Mountains is 9.0 miles (14.5 km) to 11.0
miles (17.7 km), depending on the river location. These steep elevation changes cause
the storm water to experience supercritical conditions with bed slopes from 0.1% to 2.5%
and Froude numbers easily reaching three. The majority of the stormwater east of the
river is routed into concrete channels that eventually discharge into the Rio Grande at a
single point. This stormwater can accumulate many things such as sediment, natural
debris, and man-made debris. Diverting water from channels to a stormwater treatment
structure is sometimes used before the water is discharged into the Rio Grande.
Stormwater discharges from large municipalities such as Albuquerque are required to
have a Municipal Separate Storm Sewer Systems (MS4) permit under the National
Pollutant Discharge Elimination System (NPDES) of the Clean Water Act. Diverting

2
stormwater to treatment is considered a Best Management Practice (BMP). Permitted
entities should implement BMPs.
A laboratory supercritical channel was retrofitted with a pipe outflow structure to
observe the effectiveness of flow removal. Different pipe angles were tested to determine
trends. Vane structures, at different angles, were implemented to increase diversions
from the channel. Adverse hydraulic effects, such as hydraulic jumps and splashing, tend
to occur when supercritical flow is disturbed and should be minimized.
3
2. Background & Literature Review
2.1 Lateral Outflow of Channels
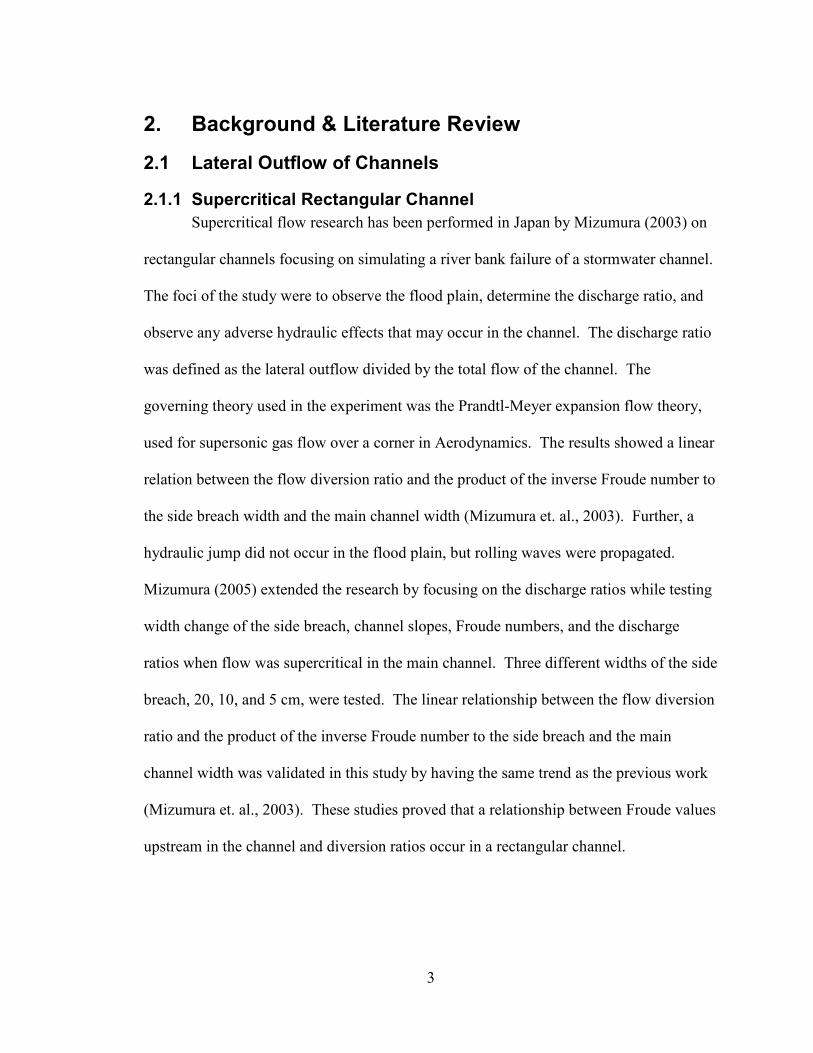
2.1.1 Supercritical Rectangular Channel
Supercritical flow research has been performed in Japan by Mizumura (2003) on
rectangular channels focusing on simulating a river bank failure of a stormwater channel.
The foci of the study were to observe the flood plain, determine the discharge ratio, and
observe any adverse hydraulic effects that may occur in the channel. The discharge ratio
was defined as the lateral outflow divided by the total flow of the channel. The
governing theory used in the experiment was the Prandtl-Meyer expansion flow theory,
used for supersonic gas flow over a corner in Aerodynamics. The results showed a linear
relation between the flow diversion ratio and the product of the inverse Froude number to
the side breach width and the main channel width (Mizumura et. al., 2003). Further, a
hydraulic jump did not occur in the flood plain, but rolling waves were propagated.
Mizumura (2005) extended the research by focusing on the discharge ratios while testing
width change of the side breach, channel slopes, Froude numbers, and the discharge
ratios when flow was supercritical in the main channel. Three different widths of the side
breach, 20, 10, and 5 cm, were tested. The linear relationship between the flow diversion
ratio and the product of the inverse Froude number to the side breach and the main
channel width was validated in this study by having the same trend as the previous work
(Mizumura et. al., 2003). These studies proved that a relationship between Froude values
upstream in the channel and diversion ratios occur in a rectangular channel.
4
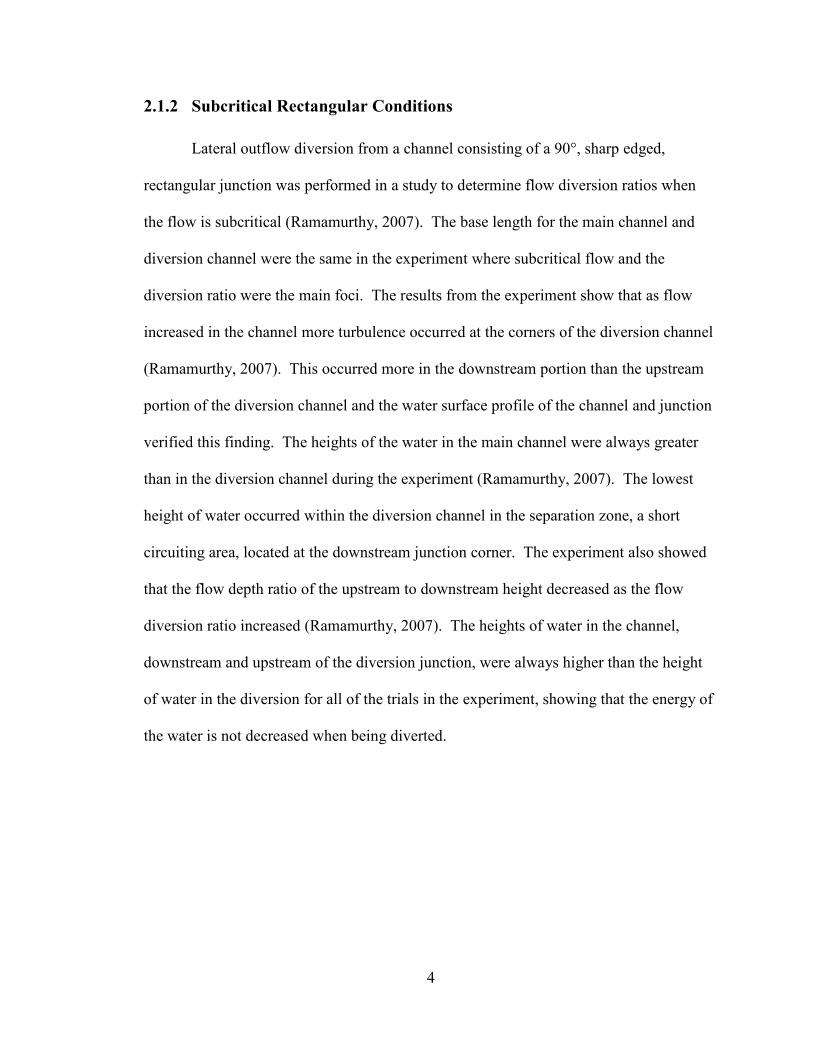
2.1.2 Subcritical Rectangular Conditions
Lateral outflow diversion from a channel consisting of a 90°, sharp edged,
rectangular junction was performed in a study to determine flow diversion ratios when
the flow is subcritical (Ramamurthy, 2007). The base length for the main channel and
diversion channel were the same in the experiment where subcritical flow and the
diversion ratio were the main foci. The results from the experiment show that as flow
increased in the channel more turbulence occurred at the corners of the diversion channel
(Ramamurthy, 2007). This occurred more in the downstream portion than the upstream
portion of the diversion channel and the water surface profile of the channel and junction
verified this finding. The heights of the water in the main channel were always greater
than in the diversion channel during the experiment (Ramamurthy, 2007). The lowest
height of water occurred within the diversion channel in the separation zone, a short
circuiting area, located at the downstream junction corner. The experiment also showed
that the flow depth ratio of the upstream to downstream height decreased as the flow
diversion ratio increased (Ramamurthy, 2007). The heights of water in the channel,
downstream and upstream of the diversion junction, were always higher than the height
of water in the diversion for all of the trials in the experiment, showing that the energy of
the water is not decreased when being diverted.

5
2.1.3 University of �ew Mexico Open Channel Lab Model Studies
Research on lateral outflow has been conducted in the Hydraulics Laboratory at
the University of New Mexico in 2002, 2003, and 2009. In 2002 a modeling report was
prepared for the Albuquerque Metropolitan Arroyo Flood Control Authority (AMAFCA)
for the North Domingo Baca Diversion Wye. The report modeled two different
configurations: a main pipe with a smaller pipe diversion on the side and a main pipe
with a smaller pipe on the bottom (Coonrod, 2002). The results from the modeling
showed that as flow increased, for the smaller bottom pipe configuration, a jump began to
form in the main pipe. As flow increased a momentum wave began to form and the
effects of the wye to divert the flow were unnoticeable, as shown in Figure 1.
Figure 1: Smaller pipe on the bottom system with hydraulic jump (Coonrod, 2002).

6
Figure 2: Sloped Side wall with step at 133 cfs discharge (Coonrod, 2003).
The modeling report performed in 2003 for AMAFCA was an Off-Site Storm
Water Quality Facility in North Pino. The report modeled three different configurations:
As-design weir mode, sloped side wall model, and sloped side wall with step model
(Coonrod, 2003). The objective of the study was to maximize the intake area for
stormwater debris removal to be relocated into a detention pond. The As-design weir
model was not able to remove debris from the main channel. Additionally, several
adverse hydraulic effects occurred within this design such as hydraulic jumps and
splashing water (Coonrod, 2003). The weir structure that was installed in the channel
may have been a safety hazard during heavy stormwater events due to the hydraulic jump
that would be created (Coonrod, 2003). The sloped side wall with step model was
determined to be the best option since it removed most of the flow from the main channel
with no negative hydraulic effects occurring in the main channel, such as splashing or a
hydraulic jump (Coonrod, 2003). An image of the sloped side wall with step is shown in

7
Figure 2. The set-up that was chosen required the channel to be drastically altered by
creating the dropped area that acted essentially as a stilling basin.
A conference proceeding conducted in 2009 for the International Association of
Hydro-Environment Engineering and Research (IAHR) was conducted on the topic of
Lateral Outflow from Supercritical Channels. The model consisted of a pipe diversion
from a supercritical trapezoidal channel with the pipe flush to one of the side walls and
protruded past the channel to allow the flow to be measured. There were three different
pipe angles, 30°, 45°, and 90°, in reference to the direction of flow, used in the
experiment and the diversion from the channel was measured (Coonrod, 2009). The
experiment showed that very little water was diverted from the channel with the pipe
alone so the addition of different types of vanes were used to increase the diversion of the
water, as shown in Figure 3. There were four different configurations of vanes tested and
placed downstream of the diversion: a broad vane similar to a weir structure at a 90° and
a 45° angle and a tapered vane at 90° and 45° angle.
Figure 3: 45° pipe angle and tapered vane for side wall experiment (Coonrod, 2009).

8
The placement of a vane downstream did increase the diversion ratio with little adverse
hydraulic effects to the channel for lower flows, but as the flow increased this did not
hold. A numerical model was performed on the physical model and was in agreement
with the experimental results.
2.2 Flow over Side Weirs
2.2.1 Effects of Curvature in Supercritical Side Weir Flow
Lateral outflow over side weirs is predominately used in irrigation, land drainage,
and urban sewer systems. A study observing the effects of curvature in a rectangular
channel with supercritical side weir flow was performed (Balmforth, 1983). The study
showed that the depth upstream from the side weir was dependent on the upstream
critical depth and the channel slope. The authors also determined that supercritical flow
over the side weir's lower portion, downstream of flow, will occur if the specific energy
of the upstream flow exceeds the crest height (Balmforth, 1983). This applies when the
upstream flow of the side weir is subcritical and downstream flow of the side weir is
supercritical.
2.2.2 Lateral Outflow over Side Weirs
Lateral outflow over side weirs using a one dimensional approach was studied by
Hager (1987) to determine the velocity profile of the water. The study looked at the
spatially varied flow caused by the side weir, but specifically excluded looking at the
hydraulic jump that occurred in a rectangular shaped channel and observed the velocity
profile of the side weir under subcritical and supercritical conditions (Hager, 1987). The
study showed that the velocity profile decreased for subcritical conditions as it passed the

9
side weir and the velocity over the side wall increased further downstream of the side
wall when supercritical conditions occurred. The beginning portion of the lateral outflow
had the lowest velocity values while further downstream of the outflow the velocity was
the greatest, showing that supercritical conditions occur further downstream of the lateral
outflow over a rectangular side weir.
2.2.3 Effects of Coefficient of Discharge for Supercritical Side Weir Flow
Further research on a rectangular channel with a rectangular side weir, of various
heights and lengths, was used to determine the coefficient of discharge for different
Froude numbers (Durga Rao, 2008). The results from the experiment found a trend
between the coefficient of discharge and Froude number for different side weir heights.
As the Froude number, between 1.5 and 3.0, increased the coefficient of discharge
decreased, implying that as the flow becomes supercritical the actual flow diverted is less
than the ideal flow diverted. The study also concluded no relationship between the
discharge ratio and Froude number existed (Durga Rao, 2008).
2.2.4 Sharp Crested Side Weir
Ghodsian (2003) studied the hydraulic characteristics in a rectangular channel
with a sharp crested rectangular side weir under supercritical flow to determine an
accurate equation for the elementary discharge coefficient for the sharp crested weir
(Ghodsian, 2003). The discharge coefficient for the sharp crested weir was found to be a
function of the local Froude number and the ratio of depth of flow to the height of the
weir. The study showed that supercritical flow occurred further downstream of the side
weir, which had been seen in previous research by Hager (1987).

10
2.3 Supercritical Channel Flow Characteristics
2.3.1 Supercritical Flow near Wall Deflection
Different characteristics of supercritical flow were investigated, one being
supercritical flow near an abrupt wall with various deflection wall angles with the
velocity profiles being observed (Hager, 1994). A relationship between the Froude
number and the height of water from the abrupt wall was determined in the study, where
lower Froude numbers, 2.0 – 4.0, tended to have higher heights of water that deviated
from the abrupt wall than higher Froude numbers, 4.5 – 8.0. The study also looked at the
shock waves that propagated on the surface where the flow lines have a larger velocity
value closer to the abrupt deflection wall (Hager, 1994). The velocity distribution of the
channel near the abrupt deflection wall was also observed, showing that the velocity
vector field was closer to the deflection wall due to that fact that the abrupt deflection
wall choked the flow in the channel. A numerical model based on the St. Venant
equation with a second order MacCormack explicit finite difference system was
performed in the study to validate the results from the experiment (Hager, 1994). The
numerical model and experimental data were in agreement and the hydraulic effects, such
as a jump, within the channel were not observed in the program.
2.3.2 Supercritical Channel Bend Flow
Bend flow in supercritical channels is common in many stormwater systems. A
study on supercritical bend flow in a rectangular channel with three different base lengths
that observed the flow characteristics was performed, since it is a common issue
(Reinauer, 1997). A standing wave was generated during the experiment as the angle of
the bend increased. The experiment determined that the maximum standing wave height

11
is influenced by the bend number, which is the product of the approaching Froude
number and the square root of the average relative curvature of the bend (Reinauer,
1997). As the bend number increased supercritical flow was closer to the outer wall,
which the author called a "wall wave". The study also observed the velocity field of the
channel with the curvature and showed that the velocity towards the outer wall was
higher with the velocity lines tighter together with little change (Reinauer, 1997). This
trend in the velocity field is similar to what had been shown in a previous study (Hager,
1994).
Another study on supercritical bend flow was performed in a rectangular shaped
channel that curved 180°; the channel was a U-shape (Beltrami, 2007). A dimensional
analysis was performed and a relationship between the approaching Froude number and
two different parameters was determined. These two parameters were the quotient of the
height of water and the channel width and the quotient of the radius curve and channel
width (Beltrami, 2007). A relationship between the Froude number and the previously
mentioned parameters were developed. The radius curve was in respect to the curved
portion where the channel turns 180°. Different water flaps were used on the curved
portion of the channel to decrease the velocity. The different shapes that were tested
were: circular, square, half circular, quarter circular, triangular, and smoothed triangular
(Beltrami, 2007). Different quantities of the different shapes were tested in the Froude
number range of 2.50 – 3.25. The study determined that the wave instability around the
U-shape portion of the channel can be reduced 30 to 80% by using the circular sections
against the inner wall of the channel (Beltrami, 2007). The other shapes used did not

12
decrease the velocity substantially and created negative effects in the channel, such as a
jump or splashing.
2.3.3 U-Shaped Channel Bend Flow in Manhole
Observing supercritical flow in a manhole bend was performed in a U-shaped
channel at two different deflection angles, 45° and 90° (Del Giudice, 2000). The velocity
field and water surface profile from the experiment was higher on the outer wall than the
inner wall, which follows the same trend in previous research performed (Reinauer, 1997
and Hager, 1994). The 45° and 90° angle deflection bends created adverse effects to the
upstream portion of the channel in the study. At higher Froude numbers choking
occurred in the channel and the formation of an undular hydraulic jump occurred at the
bend of the channel and manhole outlet (Del Giudice, 2000). The upstream flow
experienced supercritical flow while the flow near the bend experiences a subcritical flow
due to the velocity of the water near the outer wall being higher than the inner wall,
implying that a hydraulic jump occurred before the bend. A plot of the inner Froude
number of the pipe and filling ratio, ratio of the height of water to diameter of pipe,
showed that the Froude number of the downstream and upstream were the same at a
filling ratio of 0.55. After this point the jump moved from the downstream to the
upstream of the manhole and pipe (Del Giudice, 2000). This pattern occurred for the 45°
degree bend, but at higher Froude number values.
2.3.4 Wave Type at Abrupt Drops
Freefalling water past an abrupt drop is common in many sewer and waterway
systems. The wave type flow downstream of an abrupt drop in a rectangular shaped

13
channel was observed on a square edge drop, similar to a step-down (Kawagoshi, 1990).
The study showed that directly after the drop, a dead zone, area of short-circuiting,
occurred that consisted of a circulating area where air was trapped and caused cavitation.
At the crest of this dead zone the height of water was the highest and then oscillated until
stability was achieved further downstream. Past the apex of the wave another dead zone
near the surface of the water was seen with significant rolling waves (Kawagoshi, 1990).
This dead zone was less prominent further downstream of the channel and seemed to
dissipate. For small values of Froude numbers, 1.0 – 4.0, the experiment showed that as
the Froude number increased and the maximum wave height decreased due to the
velocity of the water (Kawagoshi, 1990). When the flow became more supercritical, the
drop did not effectively decrease the velocity and the flow was not altered compared to
lower Froude numbers.
Chanson (1998) observed the flow patterns and aeration of supercritical flow at an
abrupt drop in a rectangular shaped channel. The set-up consisted of a drop after a
certain length followed by a second drop. The drop was a square edge shape, which is
similar to that of a step down. Hydraulic instability occurred downstream of the drop
which included shock waves, standing waves, and jet deflections (Chanson, 1998). The
shock waves formed upstream of the second drop and were in a V-shaped pattern pointed
downstream. The standing waves that formed were slightly downstream of the first drop
and caused a “rebounding water” effect (Chanson, 1998). The “rebounding water” was
the water splashing chaotically, which exhibited the supercritical nature of the water.
Standing waves were also observed on the side walls where the “rebounding water” were
located. Another type of standing wave that occurred was located at the second drop,

14
resembling a “rooster tail”, also called a momentum wave. A relationship between the
quotient of the drop length and channel width versus the Froude number was determined
to be linear. This showed that the drop length had a greater influence on the Froude
number since it decreased the velocity, but caused more splashing and hydraulic
instabilities.
2.4 Flow Patterns past Submerged Vane Structures
2.4.1 Flow Field Analysis of Angle of Attacks
Vane structures are widely used in river systems for sediment control. The flow
patterns, with respect to the angle of attack, of a vane structure in a rectangular shaped
channel were observed in an experiment. The vane angle of attack, with respect to the
flow direction, was varied: 25°, 36°, 45°, and 57° (Marelius, 1998). The angle of attack
versus the moment of momentum was plotted with an optimal angle of attack somewhere
between 36° and 45°. The moment of momentum was the product of the tangential
momentum component and radial distance to a set origin in the experiment that
determined the vortex strength that caused scour in the river bed (Marelius, 1998). The
velocity of the channel with respect to the vane structure decreased the closer the flow
was to the vane structure, showing the vane structure decreased the velocity of the water
and caused standing waves to propagate away from the vane.
2.4.2 Vane Height and Angle Analysis
The height of a vane structure used in a river system for sediment transport varies
depending on the situation. A study to determine the optimal height of a vane to resist
the bedload from overtopping the structure in a rectangular shaped channel was

15
performed (Tan, 2005). Four different vane heights (5, 8, 10, 15 cm) were tested in the
experiment. Scouring began in the upstream and downstream portions of the vane
structure and continued towards the center. The majority of the scouring occurred on the
back side of the vane structure where the water overtopped, showing where the velocity
was the greatest. The optimal vane height was determined to be two or three times the
height of the sediment bed (Tan, 2005). Several different vane angles, in reference to the
flow direction, were tested. These angles were: 90°, 60°, 45°, 30°, and 15° (Tan, 2005).
The optimal vane angle with respect to the diversion of sediment was determined to be
around 30°, slightly lower than what previous research indicates (Marelius, 1998).
2.4.3 Tapered Vane
Tapered vane structures tend to be used in river systems for sediment control, but
can also be used for debris removal. A performance evaluation of a trapezoidal tapered
vane at different angles in a rectangular shaped channel was performed (Gupta, 2007).
Three different tapered angles (45°, 39.8°, and 33.7°) were investigated with a 40° vane
angle experiment. The vane angle was in reference to the direction of flow. This 40°
angle was chosen based on previous research conducted (Marelius, 1998). The tapered
angle was the angle between the horizontal and vertical length of the vane structure
(Gupta, 2007). A more tapered vane decreased the velocity of the incoming water. A
trend between the tapered vane angle and moment of momentum was determined and the
optimal tapered angle was concluded to be between 33.7° and 45° (Gupta, 2007).

16
3. Physical Modeling Many of Albuquerque’s stormwater channels are lined with concrete and designed
for supercritical flow with slopes ranging from 0.1% to 2.5%. Stormwater can be
diverted to an offline structure intended to improve the water quality before entering
natural waterways. The Albuquerque Metropolitan Arroyo Flood Control Authority
(AMAFCA) funds research for various stormwater modeling projects that are performed
at the University of New Mexico’s Open Channel Hydraulics Laboratory in the Civil
Engineering Department.
The laboratory contains an 8.0 feet (1.44 m) wide by 48 feet (14.63 m) long tilting
table that was used for the experiment. The laboratory’s pump is a Rodgers & Co. Inc.
pump with a capacity of 1,900 Gallon per minute (GPM) (0.126 cm3/s) variable speed
pump. The water supply for the pump is located in a sump in the laboratory where it is
pumped, flows downstream of the tilting table, and recirculates back to the sump area. A
Rickly Hydrological Co. Lory Hook & Point Gage Type-B with a precision of 0.01
inches (0.0254 cm) was used to measure the height of water within the channel. Two
different velocity meters were used during the experiments. The Marsh-McBirney, Inc.
Flo-Mate™ model 2000 portable flowmeter has an accuracy of ±2% of reading for
measuring velocities in the range of -0.15 m/s to +6 m/s (-.05-19.99ft./sec) (Marsh,
1990). The meter uses Faraday’s Law of electromagnetic induction to determine the
velocity. The other velocity meter was a SonTek® FlowTracker Handheld ADV®
(Acoustic Doppler Velocimeter) with an accuracy of ±1% of measured velocity and with
a range of ±0.001 to 4.0 m/s (0.003 – 13.0 ft/s) ( Ward, 2007).
The original constructed experiment had a side wall outlet where the lateral
outflow pipe was located; essentially acting as a weir at different pipe angles. This model

17
performed poorly and required modifications to increase the diversion ratio and decrease
negative hydraulic effects. A bench top model, that was much easier to alter, was
constructed with the pipe placed across the base of the channel, increasing the contact
area to allow higher diversions from the main channel. The pipe invert ratio, in reference
to the base of the channel, was altered to increase the contact area. The model performed
well, but the vane structure used created adverse hydraulic effects within the channel. A
final model was constructed to test different parameters for the vane structure such as
height ratio and vane angle.
3.1 Side Wall Outlet Experiment
3.1.1 Side Wall Outlet Physical Model
The original model was made of bent sheet metal that was fabricated by a local
vendor, Miller Bonded Inc. The sheet metal was bent into a trapezoidal shaped channel
with a base of 1.0 foot (30.48 cm), horizontal to vertical side slope ratio of 2:1 and a total
depth of 10 inches (25.4 cm) as shown in Figure 4. The uniform trapezoidal channel ran
the length of the table as shown in Figure 5. An energy dissipator was constructed in the
upstream portion of the channel where the flow entered the channel to allow uniform
flow to occur, allowing the height of water and velocity upstream of the pipe outlet
junction area to be measured. Three different pipe diameters (4 inches (10.16 cm), 6
inches (15.24 cm), and 8 inches (20.32 cm)) at different angles (30°, 45°, and 90° to the
direction of flow) were tested in the experiment to determine the diversion capabilities.
Thus, nine different combinations of pipe diameter and angle were tested in the
experiment. The lateral outflow pipe was located and mitered to the side wall of the
channel.

18
Figure 4: Dimensions of channel piece.
Figure 5: Side wall set-up on tilting table.
For every variation of the experiment four trials at different flows were
performed, with 36 trials in total. Each trial consisted of measuring the lateral outflow
and downstream flow three times to determine an average by using a volumetric method.
19
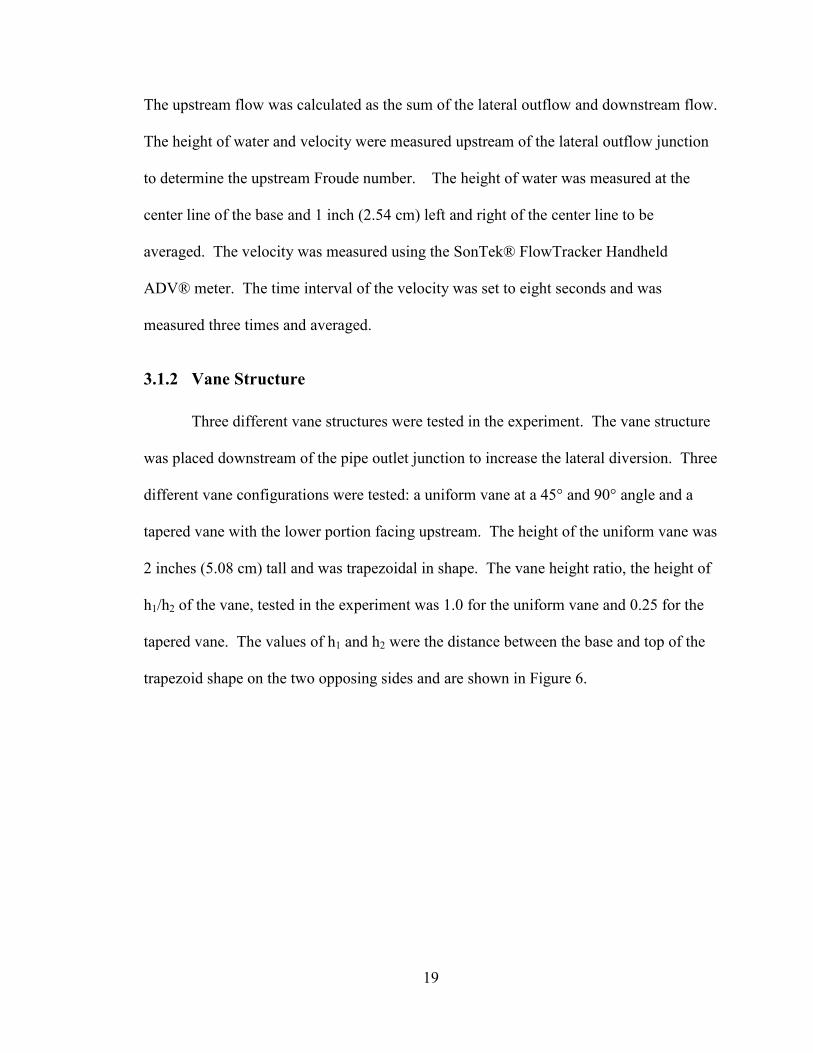
The upstream flow was calculated as the sum of the lateral outflow and downstream flow.
The height of water and velocity were measured upstream of the lateral outflow junction
to determine the upstream Froude number. The height of water was measured at the
center line of the base and 1 inch (2.54 cm) left and right of the center line to be
averaged. The velocity was measured using the SonTek® FlowTracker Handheld
ADV® meter. The time interval of the velocity was set to eight seconds and was
measured three times and averaged.
3.1.2 Vane Structure
Three different vane structures were tested in the experiment. The vane structure
was placed downstream of the pipe outlet junction to increase the lateral diversion. Three
different vane configurations were tested: a uniform vane at a 45° and 90° angle and a
tapered vane with the lower portion facing upstream. The height of the uniform vane was
2 inches (5.08 cm) tall and was trapezoidal in shape. The vane height ratio, the height of
h1/h2 of the vane, tested in the experiment was 1.0 for the uniform vane and 0.25 for the
tapered vane. The values of h1 and h2 were the distance between the base and top of the
trapezoid shape on the two opposing sides and are shown in Figure 6.

20
Figure 6: Side wall experiment with 45 degree pipe and vane.
3.2 Bench Top Model
3.2.1 Bench Top Physical Model
The bench model, ¼ size of the side wall outlet experiment, allowed the testing
for more variables at a faster rate while conserving time and material. The water supply
was tap water from a garden hose that entered a constructed container acting as an energy
dissipator before the flow entered the channel. Dropping the invert of the lateral pipe
below that of the channel resulted in much higher diversion rates. The material used for
the channel was corrugated plastic, commonly called coroplast, on a constructed wooden
frame, which is shown in Figure 7. Three different lateral pipe angles of 30°, 45°, and
90° were tested in the channel.

21
Figure 7: Bench top set-up with variables.
Pipe diameters of 1 inch (2.54 cm), 2 inches (5.08 cm), and 3 inches (7.62 cm)
were tested in the experiment, each at three different pipe invert ratios (25%, 50%, and
75% of the given pipe diameter) to determine the optimal ratio for diversion. The lateral
outflow, the channel outflow, and slope of the channel were measured three times and
averaged for each trial performed in the experiment. This was done twice with all 27
configurations in the experiment. These variables were measured to determine the height
of water upstream using Manning’s equation and then used to determine the Froude
number. The Manning’s roughness coefficient of the coroplast was assumed to be the
same as Lucite, which is 0.009 (Sturm, 2010). Lucite is another name for Plexiglas and
has the same roughness as the coroplast. This new modification of the pipe outlet across
the base of the channel drastically increased the lateral outflow diversion ratios for all of
the pipe angles. The pipe diameter and invert ratio influenced the diversion in different
ways. The diversion ratio increased when the pipe diameter increased, but splashing and
Variable Description
Q Upstream channel flow
hw Height of water upstream
A Lateral outflow contact area
q Lateral outflow
θ Pipe angle
D Ratio of upstream top width and area
g Gravity
V Upstream velocity
b Base length of channel
Φ Diameter of pipe
S Channel slope
h1 Lower height of vane
h2 Higher height of vane
ω Vane angle

22
vorticity occurred with the 3 inch (7.62 cm) diameter pipe. The 50% pipe invert
performed the best as far as diverting the water and having little hydraulic effects to the
main channel, while the 25% and 75% caused splashing and a slight jump in the channel
due to the decrease in contact area.
3.2.2 Bench Top Model with Vane
A vane test, as shown in Figure 7, was performed to increase the lateral outflow
diversion of water. The vane structures were trapezoidal in shape and had a height of 0.5
inch (1.27 cm) and were placed 2 inches (5.08 cm) downstream of the pipe outlet
junction area. Uniform and tapered vane structures were tested at two different angles in
reference to the flow direction: 45° and 90°. The tapered vane had a vane height ratio,
h1/h2, of 0.5 with the lower height facing downstream. A height ratio of 0.5 was tested to
determine if less adverse hydraulic affects would occur in the channel compared to the
previous research from the side wall experiment where the height ratio was 0.25.
3.3 Increased Contact Area Model
3.3.1 Physical Model of Increased Contact Area
A final experiment was constructed using the modifications suggested from the
previous two experiments. Trapezoidal channel pieces with the same dimensions as
Figure 4 were constructed and placed on the tilting table at a 2.1% grade located in the
Hydraulics Laboratory, where they were modified for the experiment. An energy
dissipator was placed near the pump inlet to allow uniform flow within the channel. One
pipe diameter, 8 inches (20.23 cm), was tested at three different angles (30°, 45°, and
90°) in reference to the direction of flow. The lateral outflow pipe was constructed in the
same manner as the bench model with the pipe going across the base of the channel while
23
being flush to the base and side wall. Schematics of the three different pipe
configurations are included in Appendix A (Figure 32, Figure 33 and Figure 34). For
every variation of the experiment 15 trials were performed, yielding a total of 45 trials for
the experiment. Each trial consisted of measuring the lateral outflow and downstream
channel outflow three times and averaging. A volumetric method was used to determine
the flows of the experiment and the upstream flow was determined to be the sum of the
two measured flows. The height and velocity of water were measured upstream of the
lateral outflow junction where the flow seemed to be uniform. The height of water was
measured at the center line of the of the base and 1 inch (2.54 cm) left and right of the
center line, then averaged to determine the upstream height. The Lory Point gage was
used to determine the height of water. The velocity was measured using the Flo-Mate™
velocity meter with a time interval set to five seconds and was measured three times and
averaged.
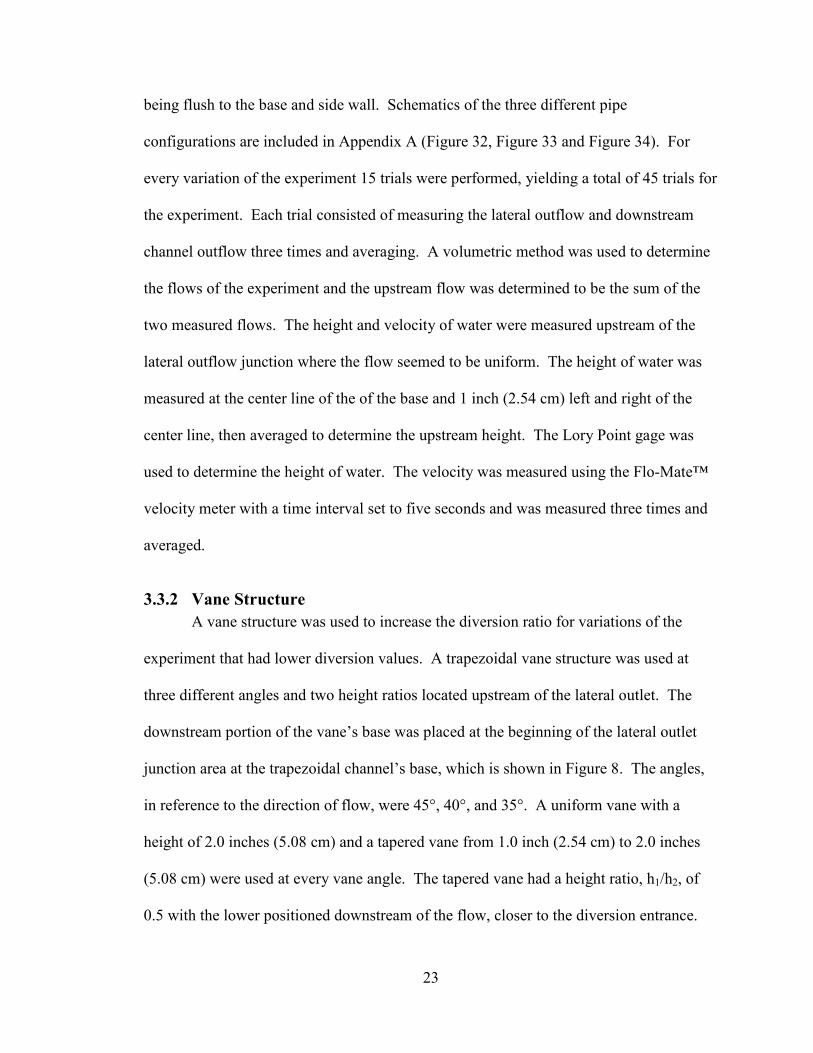
3.3.2 Vane Structure
A vane structure was used to increase the diversion ratio for variations of the
experiment that had lower diversion values. A trapezoidal vane structure was used at
three different angles and two height ratios located upstream of the lateral outlet. The
downstream portion of the vane’s base was placed at the beginning of the lateral outlet
junction area at the trapezoidal channel’s base, which is shown in Figure 8. The angles,
in reference to the direction of flow, were 45°, 40°, and 35°. A uniform vane with a
height of 2.0 inches (5.08 cm) and a tapered vane from 1.0 inch (2.54 cm) to 2.0 inches
(5.08 cm) were used at every vane angle. The tapered vane had a height ratio, h1/h2, of
0.5 with the lower positioned downstream of the flow, closer to the diversion entrance.

24
Fifteen trials each were performed for all of the variations at the three different vane
angles. This means that 270 trials were performed for all of the pipe angles, vane angles,
and height ratios for the vane structure analysis. The dimensions for the uniform and
tapered vane are shown in Appendix A as Figure 35 to Figure 40.
Figure 8: 90 degree pipe with 35 degree vane at a height ratio of 0.5.
25
4. Results/Discussion
4.1 Side Wall Outlet Results
4.1.1 Pipe Angle Results
The original side wall outlet model diverted less than five percent for all tested
configurations as shown in Figure 9. The highest diversion achieved in the experiment
was 4.4% with the 45° pipe angle and a 6 inch (15.24 cm) diameter pipe. As the
upstream flow of the channel increased the diversion ratio seemed to stay constant. The
30° pipe angle diverted the most water for the 4 inch (10.16 cm) diameter pipe while the
45° pipe angle diverted the most water for the 6 inch (15.24 cm) diameter pipe of all of
the configurations tested. The 45° pipe angle diverted the most water for the 8 inch
(20.32 cm) diameter pipe due to the contact area of the side wall outlet. The pipe angle
and the diameter of the pipe on the side wall created unique contact areas for all of the
configurations. A method to increase the diversion of the 45° pipe angle with a 6 inch
(15.24 cm) diameter pipe was explored, since it produced the highest diversion ratio
tested in the experiment.

26
Figure 9: Configurations with Trapezoidal Froude �umber versus diversion ratio.
4.1.2 Vane Results
A vane test was performed to increase the diversion of the 45° angle pipe with a 6
inch (15.24 cm) diameter. Three different downstream vane configurations were tested:
a vane with a height ratio of 1.0 tested at 45° and 90° angles and a tapered vane structure
with a 0.25 height ratio at a 45° vane angle, where the angle of the vane was with respect
to the direction of flow. A linear relationship between the upstream Froude number and
diversion was apparent as shown in Figure 10. The 45° tapered vane angle performed the
best, diverting 17.1%. Although this configuration had the highest diversion of water
from the main channel, adverse hydraulics was apparent in the channel. These effects
included splashing and a momentum wave, or “rooster tail” wave, where the vane
structure was located, as seen in Figure 11.
R² = 0.8777
R² = 0.9498
R² = 0.8029
R² = 0.8723
R² = 0.8838
R² = 0.8575R² = 0.917
R² = 0.8463
R² = 0.9961
1
1.5
2
2.5
3
3.5
0.0 1.0 2.0 3.0 4.0 5.0
Tra
pe
zoid
al F
rou
de
Nu
mb
er,
Fr
Diversion Ratio (%)
90°, 4 in. 90°, 6 in. 90°, 8 in. 45°, 4 in. 45°, 6 in.45°, 8 in. 30°, 4 in. 30°, 6 in. 30°, 8 in.

27
Figure 10: Linear relationship of different vane structures.
Figure 11: "Rooster tail" wave from vane
R² = 0.9555
R² = 0.9117
R² = 0.9532
1
1.2
1.4
1.6
1.8
2
2.2
2.4
2.6
2.8
3
0 5 10 15 20
Fro
ud
e N
um
be
r, F
r
Diversion Ratio (%)
45° Vane 90° Vane 45° Tapered Vane
28
4.2 Bench Top Model Results
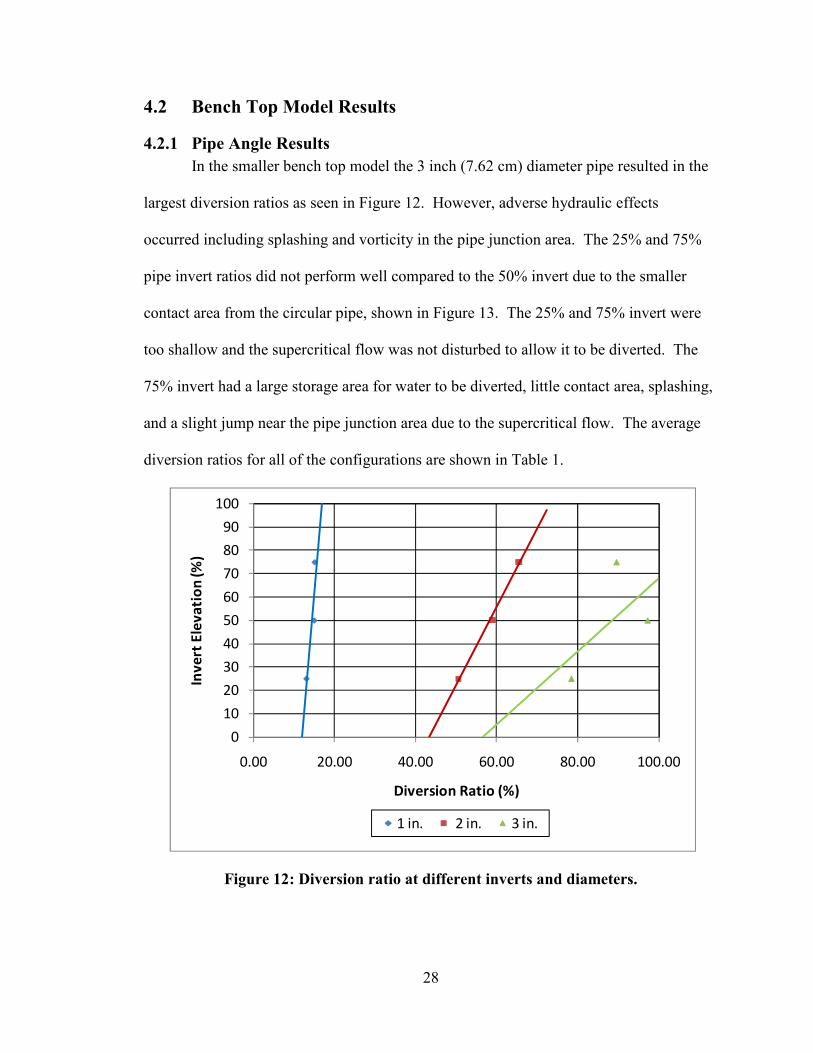
4.2.1 Pipe Angle Results
In the smaller bench top model the 3 inch (7.62 cm) diameter pipe resulted in the
largest diversion ratios as seen in Figure 12. However, adverse hydraulic effects
occurred including splashing and vorticity in the pipe junction area. The 25% and 75%
pipe invert ratios did not perform well compared to the 50% invert due to the smaller
contact area from the circular pipe, shown in Figure 13. The 25% and 75% invert were
too shallow and the supercritical flow was not disturbed to allow it to be diverted. The
75% invert had a large storage area for water to be diverted, little contact area, splashing,
and a slight jump near the pipe junction area due to the supercritical flow. The average
diversion ratios for all of the configurations are shown in Table 1.
Figure 12: Diversion ratio at different inverts and diameters.
0
10
20
30
40
50
60
70
80
90
100
0.00 20.00 40.00 60.00 80.00 100.00
Inv
ert
Ele
va
tio
n (
%)
Diversion Ratio (%)
1 in. 2 in. 3 in.

29
Figure 13: Pipe invert of 25%, 50%, and 75% from left to right.
Table 1: Diversion ratios for bench top model.
4.2.2 Vane Results
A vane test was performed for all of the pipe diameters with a pipe invert ratio of
50% since it yielded favorable conditions. The vane structure was placed downstream of
the junction area for all of the pipe angles and three different vane structures were tested:
a vane with a height ratio of 1.0 tested at 45° and 90° angles and a tapered vane structure
1 2 3
30 13.15 50.62 78.58
45 14.68 30.52 82.30
90 7.38 33.98 56.67
30 15.00 58.88 97.30
45 18.20 50.21 77.39
90 15.05 51.68 100.00
30 15.12 65.43 89.67
45 23.50 44.18 70.47
90 12.84 41.05 100.00
Diameter
(in.)
25
50
75
Invert
Elevation
Ratio
(%)
Pipe Angle
(°)

30
with a 0.5 height ratio for the 45° vane angle. The results from the vane tests are shown
in Table 2, where the highest diversion ratios occurred with the 3 inch (7.62 cm) diameter
pipe. The vane that yielded higher diversions was the uniform vane that had a height
ratio of 1.0. This height ratio diverted more water to the lateral outflow pipe compared to
the 0.5 height ratio, but a jump and splashing was more noticeable in the 1.0 ratio. The
tapered vane, height ratio of 0.5, resulted in no visible jump nor observed splashing.
With supercritical flow conditions, the vane served as an obstruction rather than a guide
for the water. Alternatively, placing the vane upstream of the flow forces a jump
allowing for more head on the outlet.

31
Table 2: Diversion ratios from bench top model vane test.
4.3 Increased Contact Area Results
4.3.1 Pipe Angle Results
The model that produced the largest diversion ratios had a 30° pipe angle, while
the model that produced the smallest diversion ratios had a 90° angle. The lowest
diversion ratio observed was approximately 60% for the 90° pipe at higher flows. The
30° angle resulted in no adverse hydraulic effects, especially compared to the 90° angle,
where splashing and vorticity occurred in the lateral outlet pipe, as shown in Figure 14.
1 2 3
100 100 100
100 100 100
95 95 95
93 93 95
94 94 95
92 93 95
89 89 86
89 88 84
48 84 100
47 83 100
35 80 95
35 76 95
55 79 95
53 76 95
43 75 86
40 68 84
100 100 100
100 100 99
70 89 83
67 89 80
64 89 88
63 88 85
38 66 77
35 61 76
30 45
9030
4545
DiameterPipe
Angle
Vane
Angle
Height
Ratio
9045
30 45
9030
0.5
1.0
0.5
1.0
0.5
1.0
0.5
1.0
0.5
1.0
0.5
1.0

32
Figure 14: Vorticity with 90 degree pipe.
Linear relationships between the Froude number and diversion ratio were
observed for each of the modeled pipe angles in the experiment and are shown in Figure
15. As the upstream Froude number increased, the lateral outflow diversion decreased.
This implies that less water was diverted as the velocity of the water upstream increases,
increasing the Froude number.
The 30° pipe angle performed the best by removing the majority of the water
from the channel. A linear relationship proved to fit all of the data for the 90° and 45°,
but not for the 30° pipe. All of the water in the channel was diverted for most of the 30°
angle until the Froude number was greater than 2.0. Figure 15 shows that the 30° pipe is
linear when the Froude number is around 2.7, resulting in approximately 98% diversion.
The hydraulics of the channel at this angle was not severely altered and no negative
hydraulic effects were seen. A similar trend occurred when the upstream velocity was
plotted against the diversion ratio. The linear relationships for all the pipe angles are
shown in Figure 15 and Figure 16. The 30° pipe diverted the greatest amount of water,
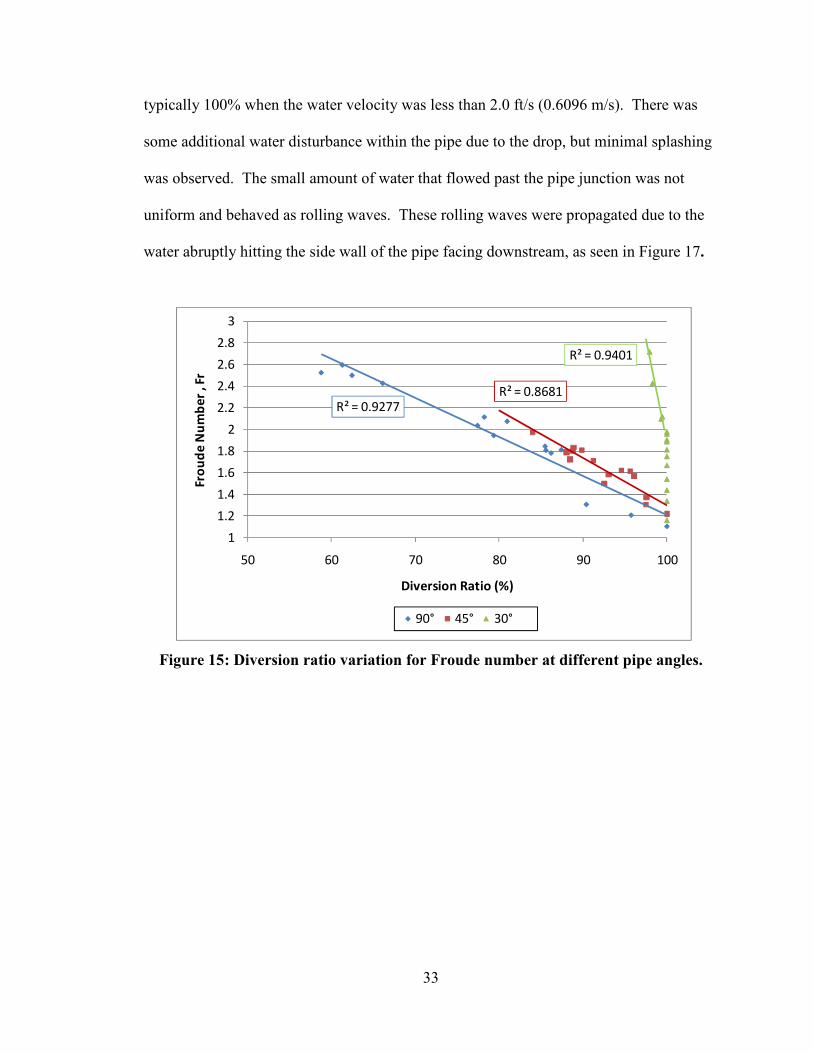
33
typically 100% when the water velocity was less than 2.0 ft/s (0.6096 m/s). There was
some additional water disturbance within the pipe due to the drop, but minimal splashing
was observed. The small amount of water that flowed past the pipe junction was not
uniform and behaved as rolling waves. These rolling waves were propagated due to the
water abruptly hitting the side wall of the pipe facing downstream, as seen in Figure 17.
Figure 15: Diversion ratio variation for Froude number at different pipe angles.
R² = 0.9277R² = 0.8681
R² = 0.9401
1
1.2
1.4
1.6
1.8
2
2.2
2.4
2.6
2.8
3
50 60 70 80 90 100
Fro
ud
e N
um
be
r , F
r
Diversion Ratio (%)
90° 45° 30°

34
Figure 16: Diversion ratio for varying upstream velocity of different pipe angles.
Figure 17: Hydraulics of 30 degree pipe below 100% removal.
R² = 0.9441
R² = 0.9302
R² = 0.8804
0.5
1
1.5
2
2.5
3
3.5
4
50 60 70 80 90 100
Up
stre
am
Ve
lco
ity
(ft
./s)
Diversion Ratio (%)
90° 45° 30°
35
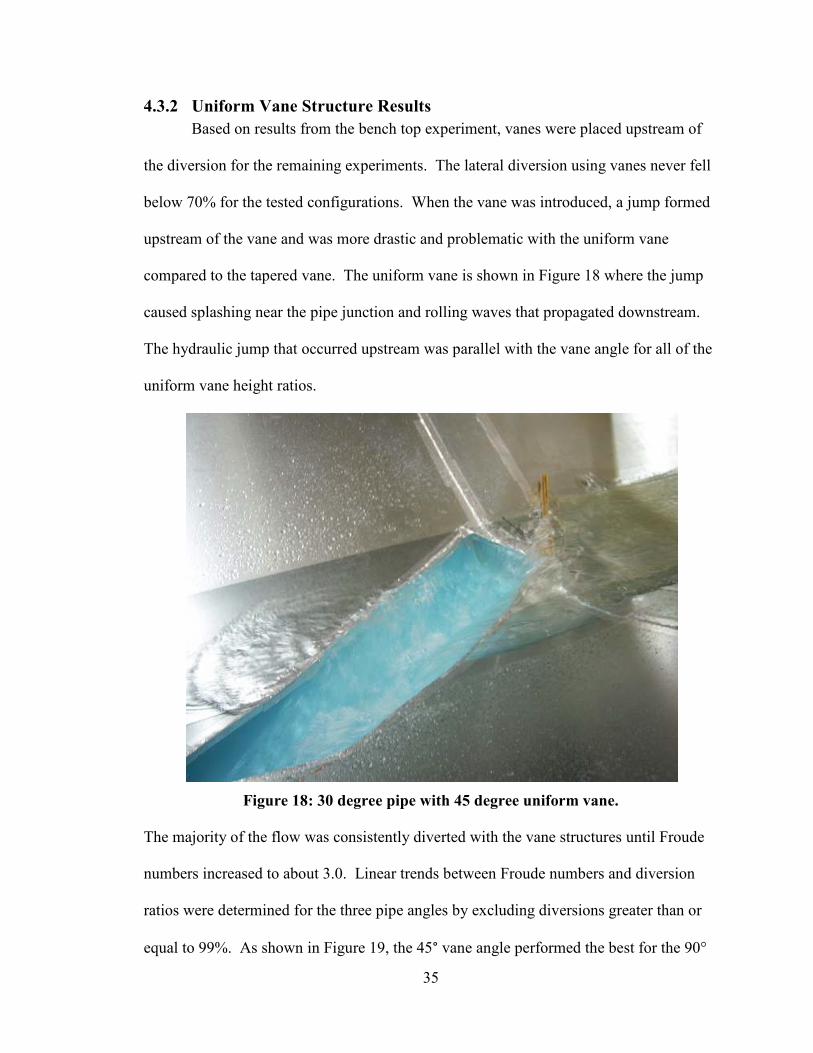
4.3.2 Uniform Vane Structure Results
Based on results from the bench top experiment, vanes were placed upstream of
the diversion for the remaining experiments. The lateral diversion using vanes never fell
below 70% for the tested configurations. When the vane was introduced, a jump formed
upstream of the vane and was more drastic and problematic with the uniform vane
compared to the tapered vane. The uniform vane is shown in Figure 18 where the jump
caused splashing near the pipe junction and rolling waves that propagated downstream.
The hydraulic jump that occurred upstream was parallel with the vane angle for all of the
uniform vane height ratios.
Figure 18: 30 degree pipe with 45 degree uniform vane.
The majority of the flow was consistently diverted with the vane structures until Froude
numbers increased to about 3.0. Linear trends between Froude numbers and diversion
ratios were determined for the three pipe angles by excluding diversions greater than or
equal to 99%. As shown in Figure 19, the 45° vane angle performed the best for the 90°

36
pipe until a Froude number of 3.0 were reached. When the Froude number was higher
than about 3.0, the 40° vane angle performed the best. The results for the 90° pipe at the
different vane angles for different upstream velocities are shown in Appendix B:
Upstream Velocity and Diversion Ratios.
Figure 19: 90 degree pipe at different vane angles for Froude number; uniform.
The 45° degree pipe angle diverted 100% of the water for many of the trials in the
same way as the 90° pipe angle. A linear trend between the Froude number and velocity
versus the diversion ratios was determined for values less than 99%. The linear trend
between the three different vane angles for the 45° pipe angle is shown in Figure 20m,
where the best vane angle was 40° while the worst was the 35° vane angle. When the
Froude number was greater than 2.8, the 45° vane angle performed the best compared to
the 40° vane angle. The linear trend for the velocity between the three different vane
R² = 0.9311
R² = 0.8613
R² = 0.9964
1
1.5
2
2.5
3
3.5
4
70 75 80 85 90 95 100
Fro
ud
e N
um
ber
Diversion Ratio, q/Q1 (%)
35° 45° 40°

37
angles for the 45° pipe angle is shown in Appendix B: Upstream Velocity and Diversion
Ratios.
Figure 20: 45 degree pipe at different vane angles for Froude number; uniform.
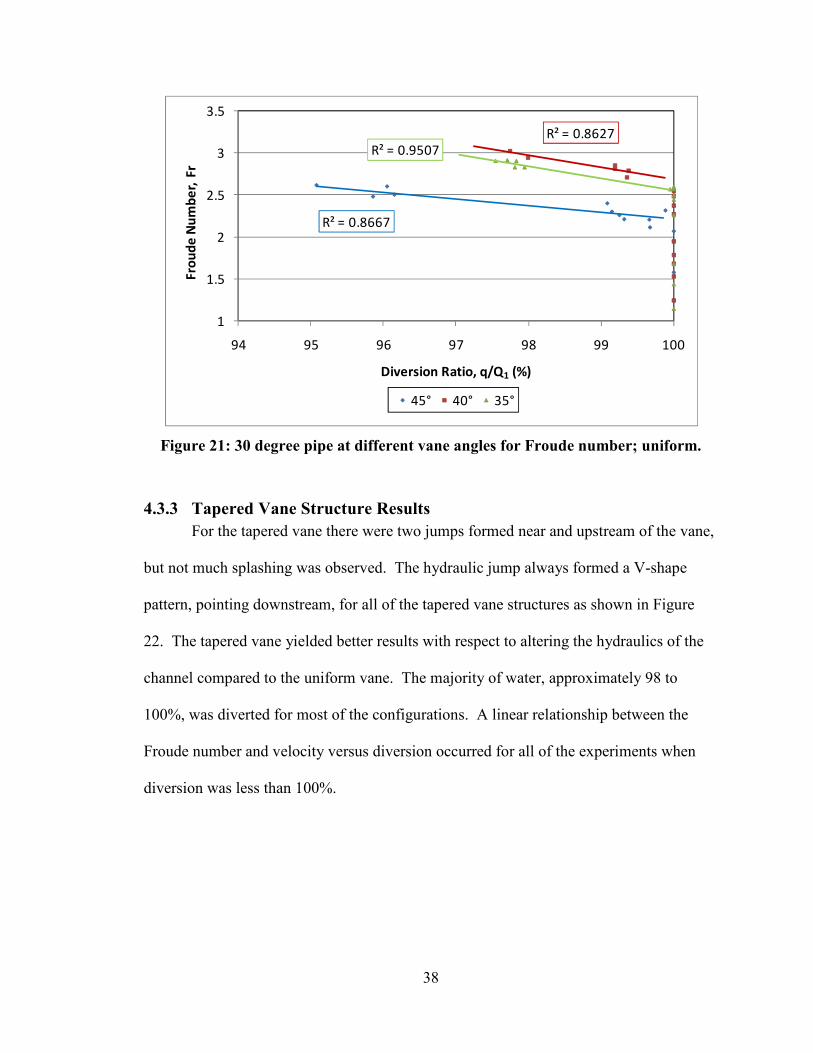
The 30° pipe angle diverted 100% of the water for many of the trials, like the
other two pipe angles tested. A linear trend between the Froude number versus the
diversion ratios was determined for values less than 99% and is shown in Figure 21. The
vane angle that performed the best was the 40° while the worst was the 45° for a Froude
number range of 2.2 to 3.1 and is shown Figure 21. The linear trend for the velocity
between the three different vane angles for the 30° pipe is shown in Appendix B:
Upstream Velocity and Diversion Ratios.
R² = 0.8661
R² = 0.9407
R² = 0.8814
1
1.5
2
2.5
3
3.5
88 90 92 94 96 98 100
Fro
ud
e N
um
be
r, F
r
Diversion Ratio, q/Q1 (%)
45° 40° 35°
38
Figure 21: 30 degree pipe at different vane angles for Froude number; uniform.
4.3.3 Tapered Vane Structure Results
For the tapered vane there were two jumps formed near and upstream of the vane,
but not much splashing was observed. The hydraulic jump always formed a V-shape
pattern, pointing downstream, for all of the tapered vane structures as shown in Figure
22. The tapered vane yielded better results with respect to altering the hydraulics of the
channel compared to the uniform vane. The majority of water, approximately 98 to
100%, was diverted for most of the configurations. A linear relationship between the
Froude number and velocity versus diversion occurred for all of the experiments when
diversion was less than 100%.
R² = 0.8667
R² = 0.8627R² = 0.9507
1
1.5
2
2.5
3
3.5
94 95 96 97 98 99 100
Fro
ud
e N
um
be
r, F
r
Diversion Ratio, q/Q1 (%)
45° 40° 35°

39
Figure 22: 30 degree pipe with 35 degree tapered vane.
The results from the 90° pipe at various vane angles were linear when diversion
was less than 100%, and is shown in Figure 23. The vane angle that performed the best
was the 40° until the Froude number was less than 2.15, then the 45° vane angle
performed the best. The linear trend of the velocity verses diversion was observed for all
the vane angles and is shown in Appendix B: Upstream Velocity and Diversion Ratios.

40
Figure 23: 90 degree pipe at different vane angles for Froude number; tapered.
The results for the 45° pipe angle for the different vane angles followed a similar
trend to the 90° pipe. When accounting for diversions less than 100%, a linear trend can
be observed with the Froude number to the diversion ratio, which is shown in Figure 24.
The vane angle that performed the best was the 40° when the Froude number was less
than 2.75 and was the 45° when a higher Froude number was achieved. The vane that
performed the worse was the 35° vane angle. The linear trend of the velocity to diversion
is shown in Appendix B: Upstream Velocity and Diversion Ratios.
R² = 0.9325
R² = 0.9672
R² = 0.9308
1
1.2
1.4
1.6
1.8
2
2.2
2.4
2.6
2.8
88 90 92 94 96 98 100
Fro
ud
e N
um
be
r, F
r
Diversion ratio (%)
45° 40° 35°

41
Figure 24: 45 degree pipe at different vane angles for Froude number; tapered.
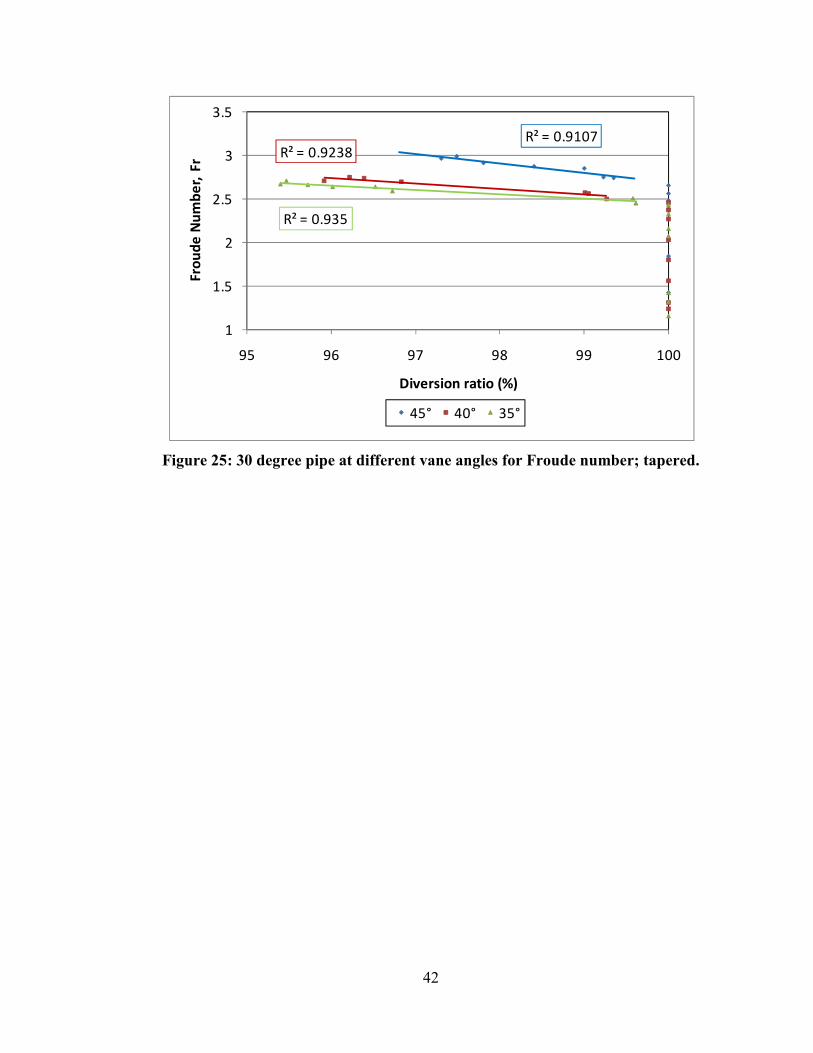
The results from the 30° pipe at different vane angles followed a similar linear
trend as the previous pipe angles when accounting for diversion values less than 100%.
The linear trend of the Froude number verses diversion for the 30° pipe angle is shown in
Figure 25. The vane angle that performed the best was the 45°, while the worst was the
35° vane angle. The linear trend of the velocity to diversion is shown in Appendix B:
Upstream Velocity and Diversion Ratios.
R² = 0.9585R² = 0.9416
R² = 0.9114
1
1.5
2
2.5
3
3.5
88 90 92 94 96 98 100
Fro
ud
e N
um
be
r, F
r
Diversion Ratio (%)
45° 40° 35°
42
Figure 25: 30 degree pipe at different vane angles for Froude number; tapered.
R² = 0.9107R² = 0.9238
R² = 0.935
1
1.5
2
2.5
3
3.5
95 96 97 98 99 100
Fro
ud
e N
um
be
r, F
r
Diversion ratio (%)
45° 40° 35°
43
5. Computer Modeling
5.1 HEC-RAS Modeling
The United States Army Corps of Engineers has developed a 1-D program that
analyzes open channel systems called HEC-RAS, which is an acronym for the
Hydrological Engineering Centers – River Analysis System (Brunner, 2002). The
program can compute a water surface profile of an open channel system and can be used
to model various open channel flow systems such as rivers systems, flood control
channels, levee systems, bridges, and culverts. The program was first developed for
steady state flow based on the energy and momentum equations. The increased contact
area experiment was constructed in the program to see if the hydraulics from the physical
model could be captured in the numerical model. The length of the channel constructed
in the modeling program was the 48 feet (14.63 m) long tilting table in the experiment.
As the flow upstream of the lateral outflow increased, the diversion ratio decreased at
different rates depending on the pipe angle. The lowest flow ratios that were observed in
the physical experiment were modeled in the program. The cross section dimensions of
the channel were the same as the experiment, which are shown in Figure 4. The models
consisted of three reaches that meet at a junction with a 2.1% slope from the upstream to
downstream portion. The model consisted of an upstream, downstream, outlet, and pipe
junction area portion. The upstream and downstream portions of the model had the same
dimensions as the channel and accounted for the slope change. The results from the
program show the instability in the junction area that occurred in the physical model and
the upstream velocity and Froude number in the model were similar to the physical
model. The water surface profile (WSP) from the program and the physical model were
compared and are shown in Appendix D: Physical and numerical WSP. The upstream

44
velocity and upstream Froude number of the physical and numerical models are shown in
Table 3. The error is the difference between the calculated and measured values divided
by the measured values in the channel, expressed as a percent. The reason the percent
error for the Froude number is high is due to the fact that HEC-RAS assumes a uniform
water surface for each cross section, which was not observed during the experiment.
Table 3: Velocity and Froude values with percent errors.
5.1.1 HEC-RAS 90 Degree Pipe
The physical model for the 90° pipe angle diverted the least amount of water
compared to the other pipe angles. The upstream reach consisted of 10 cross sections
from stations 48 to 24.333 while the downstream reach consisted of 25 cross sections
from stations 23.667 to 0 with the junction area between the two. The junction point,
where the water is diverted, was located at station 24. This junction area accounted for
the different cross sections for the lateral outflow pipe that reached across the base of the
channel. These cross sections had unique shapes that were individually measured and
constructed in the program. The center of this region was where the junction was located
for the downstream and outlet flow of the channel. There were a total of 10 cross
sections from stations 24.2854 to 23.7502 that accounted for the different shapes in the
junction area. The outlet reach consisted of 17 cross sections with the dimensions of the
8 inch (20.32 cm) diameter pipe from the physical model. The constructed HEC-RAS
Angle
(°)
Velocity
(ft./s)
Froude
Number
Angle
(°)
Velocity
(ft./s)
Froude
NumberVelocity
Froude
Number
90 3.430 2.60 90 3.442 2.088 0.35 19.69
45 2.604 1.97 45 2.826 1.682 8.53 14.62
30 2.970 2.71 30 2.8758 2.3271 3.17 14.13
Physical Model Numerical ModelPercent Error
(%)

45
model with all of the reaches is shown in Figure 26. The upstream channel flow tested
was 0.4049 cfs (0.0115 cms) with a 61.35% diversion. This means that the downstream
flow was 0.1565 cfs (4.432E-3 cms) and the outlet flow was 0.2484 cfs (7.034E-3).
Figure 26: HEC-RAS 90 degree pipe model.
The instability of the junction area before the flow reached the downstream was
captured in the program. The original data and design information used for the modeling
is shown in Appendix C: HEC-RAS Modeling Data Sheets, along with the results from
the program. The data shows that the velocity of the water before entering the pipe
junction area was around 3.4419 ft/s (1.05 m/s) and dropped to 0.6349 ft/s (0.193 m/s)
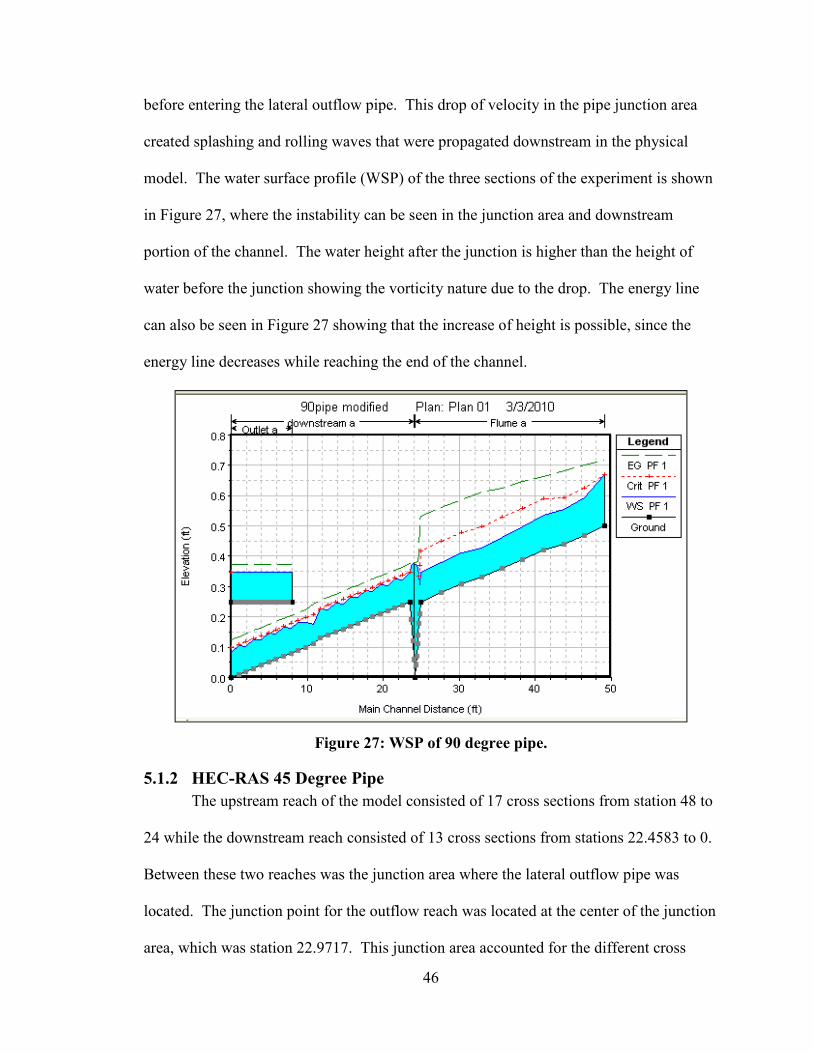
46
before entering the lateral outflow pipe. This drop of velocity in the pipe junction area
created splashing and rolling waves that were propagated downstream in the physical
model. The water surface profile (WSP) of the three sections of the experiment is shown
in Figure 27, where the instability can be seen in the junction area and downstream
portion of the channel. The water height after the junction is higher than the height of
water before the junction showing the vorticity nature due to the drop. The energy line
can also be seen in Figure 27 showing that the increase of height is possible, since the
energy line decreases while reaching the end of the channel.
Figure 27: WSP of 90 degree pipe.
5.1.2 HEC-RAS 45 Degree Pipe
The upstream reach of the model consisted of 17 cross sections from station 48 to
24 while the downstream reach consisted of 13 cross sections from stations 22.4583 to 0.
Between these two reaches was the junction area where the lateral outflow pipe was
located. The junction point for the outflow reach was located at the center of the junction
area, which was station 22.9717. This junction area accounted for the different cross
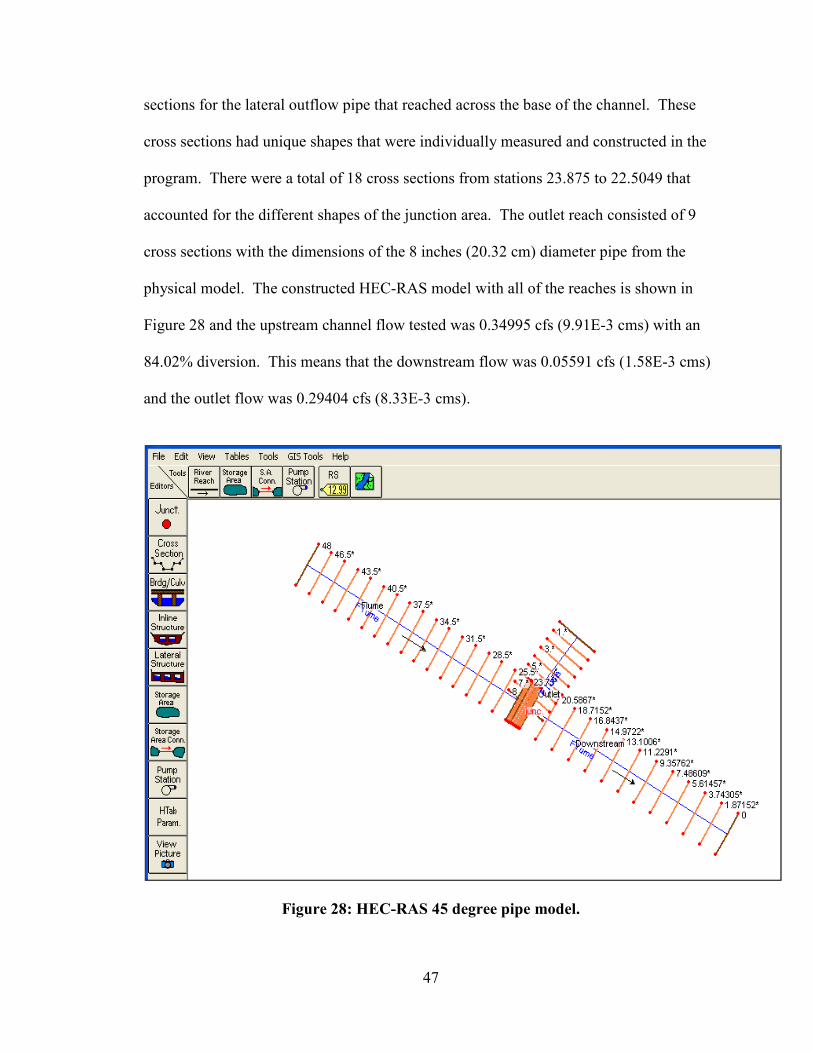
47
sections for the lateral outflow pipe that reached across the base of the channel. These
cross sections had unique shapes that were individually measured and constructed in the
program. There were a total of 18 cross sections from stations 23.875 to 22.5049 that
accounted for the different shapes of the junction area. The outlet reach consisted of 9
cross sections with the dimensions of the 8 inches (20.32 cm) diameter pipe from the
physical model. The constructed HEC-RAS model with all of the reaches is shown in
Figure 28 and the upstream channel flow tested was 0.34995 cfs (9.91E-3 cms) with an
84.02% diversion. This means that the downstream flow was 0.05591 cfs (1.58E-3 cms)
and the outlet flow was 0.29404 cfs (8.33E-3 cms).
Figure 28: HEC-RAS 45 degree pipe model.

48
There was some instability in the junction area, but not as significant as the 90°
pipe angle. The original data and design information used for the modeling is shown in
Appendix C: HEC-RAS Modeling Data Sheets, along with the results from the program.
The data shows that before entering the pipe junction area the velocity was 2. 9238 ft/s
(0.891 m/s) and dropped to 0.6377 ft/s (0.194 m/s) before entering the lateral outflow
pipe. The drop into the junction area where the velocity changed caused a jump to occur,
like the 90° pipe angle. The jump that occurred was not as drastic though and can be
seen in Figure 29 where the WSP for the entire experiment is shown. The height
upstream of the junction is slightly higher than the height observed in the lateral junction
outlet compared to the drastic jump in the 90° pipe model.
Figure 29: WSP of 45 degree pipe.

49
5.1.3 HEC-RAS 30 Degree Pipe
The upstream reach of the model consisted of 18 cross sections from stations 48
to 24.375 while the downstream reach consisted of 13 cross sections from stations 22.875
to 0. Between these two reaches was the junction area where the lateral outflow pipe was
located. The junction point for the outflow reach was located at the center of the junction
area, which was station 23.583. This junction area accounted for the different cross
sections for the lateral outflow pipe that reaches across the base of the channel. These
cross sections had unique shapes that were individually measured and constructed in the
program. There were a total of 37 cross section from stations 24.3486 to 23.052 that
accounted for the different shapes of the junction area. The outlet reach consisted of 17
cross sections with the dimensions of the 8 inch (20.32 cm) diameter pipe from the
physical model. The constructed HEC-RAS model with all of the reaches is shown in
Figure 30. The upstream channel flow tested was 0.1648 cfs (4.67E-3 cms) with a
97.94% diversion ratio, which means the downstream flow was 0.0034 cfs (9.63E-5 cms)
and the outlet flow was 0.1614 cfs (4.57E-3 cms).

50
Figure 30: HEC-RAS 30 degree pipe model.
There was some instability in the junction area that was similar to that of the 45°
pipe angle. The original data and design information used for the modeling is shown in
Appendix C: HEC-RAS Modeling Data Sheets, along with the results from the program.
The data shows that before entering the pipe junction area the velocity was 2.805 ft/s
(0.855 m/s) and dropped to 1.206 ft/s (0.368 m/s) before entering the lateral outflow pipe.
The drop into the junction area where the velocity changed caused a jump to occur within
the junction area, which is shown in Figure 31. Figure 31 shows the WSP for the
experiment where the jump can be seen. The jump that occur was not as drastic
compared to the 90° pipe angle where splashing occurred and acted like a stationary
standing wave.

51
Figure 31: WSP of 30 degree pipe.

52
6. Conclusions and Recommendations Three physical models were constructed (side wall outlet, bench top, and
increased contact area) with different modifications that increased the amount of water
that was laterally diverted from a supercritical channel. The original model consisted of
three different pipe diameters at three different angles on the side wall of a trapezoidal
channel that acted as a weir. The diversion ratio from the channel was 4.4% and adverse
hydraulic affects occurred, such as a hydraulic jump, momentum waves, and splashing
due to the supercritical flow of the channel where the specific energy and momentum was
high. Vane structures at different height ratios and angles placed downstream of the pipe
junction area were then tested to increase the diversion ratio. A tapered vane with a
height ratio of 0.25 and 45° angle achieved a diversion of 17.1%. With increased
diversion, the resulting hydraulic jump and momentum were more severe with the vane
than without.
After the low diversion ratios from the first experiment, a bench scale model that
could be more easily modified, was constructed and tested to determine which physical
parameters would increase the diversion ratio. Placing the pipe across the base of the
channel, mitered to the channel, increasing the contact area allowed higher diversions.
Altering the height of pipe invert, in reference to the base of the channel, pipe diameter,
and angles were tested to determine affects on diversion ratios and hydraulic conditions.
Diversion ratios improved significantly; however, adverse hydraulic conditions occurred
such as splashing, hydraulic jumps, and standing waves due to the pipe invert ratios
where the contact area was not sufficient enough to allow diversion. A vane structure at
two different angles was placed downstream to increase the diversion, but rolling waves
overtopping the vane occurred downstream of the vane and vortices formed upstream of

53
the vane for the various configurations. The bench model allowed for easy modifications
to increase diversion ratios and observe hydraulic patterns, but some data were not
reliably measured because of the small size and the difficulty in reaching a steady state.
The final experiment with the increased contact area model was built at the same
size as the side wall outlet model and as a a larger scale than the bench top model
allowing for more reliable measurements and steady state conditions. Three different
pipe angles at various flows were tested to determine a relationship between the diversion
ratio to the upstream Froude number and upstream velocity. For the 45° and 90° pipe
angles, the diversion ratio increased linearly from about 75% at a Froude number of 2 to
100% at a Froude number of 1.2. For the 30° pipe angle, all Froude numbers tested (1.2
– 2.8) resulted in greater than 97% diversion ratios. Vane structures at different height
ratios and vane angles were tested upstream of the pipe junction area to increase the
diversion ratio for the lower diversion ratios, but some adverse affects occurred in the
channel. The uniform vane with a height ratio of 1.0 caused a hydraulic jump to occur
upstream of the vane and tended to cause splashing while the tapered vane had less effect
upstream, but caused a jump to occur. A vane structure can be added to increase the
diversion for higher Froude numbers, but the vane should have a height ratio of 0.5 and
be placed at 45° since this produced little adverse affects to the main channel. The final
experiment was constructed in the numerical modeling program HEC-RAS to see if the
model was capable of capturing the hydraulics of the channel. The three different pipe
angles were constructed in the model with the lowest diversion ratios without the vane
structures. The program achieved this goal and the upstream velocity values, upstream

54
Froude number values, and WSPs from the numerical model were similar to those of the
physical model.
When constructing the increased contact area experiment in a full scale channel, a
30° pipe angle without a vane should be used. Although a vane structure would increase
the diversion, compared to without, from the channel at higher velocities and Froude
number it would create a safety issue and would increase the cost.
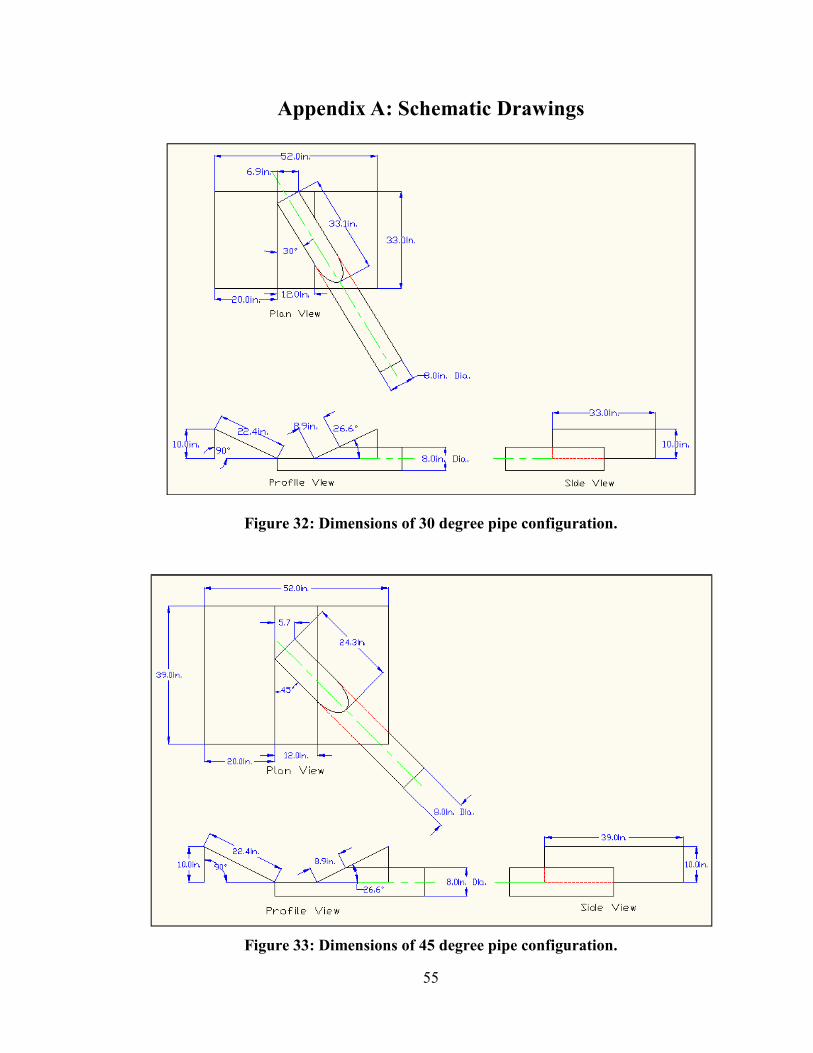
55
Appendix A: Schematic Drawings
Figure 32: Dimensions of 30 degree pipe configuration.
Figure 33: Dimensions of 45 degree pipe configuration.

56
Figure 34: Dimensions of 90 degree pipe configuration.
Figure 35: Uniform vane dimensions at 35 degrees.

57
Figure 36: Uniform vane dimensions at 40 degrees.
Figure 37: Uniform vane dimensions at 45 degrees.

58
Figure 38: Tapered vane dimensions at 35 degrees.
Figure 39: Tapered vane dimensions at 40 degrees.

59
Figure 40: Tapered vane dimensions at 45 degrees.

60
Appendix B: Upstream Velocity and Diversion Ratios
Figure 41: 90 degree pipe at different vane angles for velocity; uniform.
Figure 42: 45 degree pipe at different vane angles for velocity; uniform.
R² = 0.8634
R² = 0.8912
R² = 0.8647
1
1.5
2
2.5
3
3.5
4
4.5
70 75 80 85 90 95 100
Up
stre
am
Ve
loci
ty, V
(ft
./s)
Diversion Ratio , q/Q1 (%)
45° 40° 35°
R² = 0.8377R² = 0.8539
R² = 0.9081
1
1.5
2
2.5
3
3.5
4
86 88 90 92 94 96 98 100
Up
stre
am
Ve
loci
ty (
ft./
s)
Diversion Ratio, q/Q1 (%)
45° 40° 35°

61
Figure 43: 30 degree pipe at different vane angles for velocity; uniform.
Figure 44: 90 degree pipe at different vane angles for velocity; tapered.
R² = 0.9065
R² = 0.9859R² = 0.9299
1.00
1.50
2.00
2.50
3.00
3.50
4.00
4.50
94 95 96 97 98 99 100
Up
stre
am
Ve
loci
ty,
V (
ft./
s)
Diversion Ratio, q/Q1 (%)
45° 40° 35°
R² = 0.9622
R² = 0.8132
R² = 0.9196
1
1.5
2
2.5
3
86 88 90 92 94 96 98 100
Up
stre
am
Ve
loci
ty,
V (
ft./
s)
Diversion ratio (%)
45° 40° 35°

62
Figure 45: 45 degree pipe at different vane angles for velocity; tapered.
Figure 46: 30 degree pipe at different vane angles for velocity; tapered.
R² = 0.9285
R² = 0.9277
R² = 0.8386
1
1.5
2
2.5
3
3.5
4
4.5
88 90 92 94 96 98 100
Up
stre
am
Ve
loci
ty,
V (
ft./
s)
Diversion Ratio (%)
45° 40° 35°
R² = 0.8968R² = 0.9523
R² = 0.9563
1.00
1.50
2.00
2.50
3.00
3.50
4.00
4.50
95 96 97 98 99 100
Up
stre
am
Ve
loci
ty,
V (
ft./
s)
Diversion ratio (%)
45° 40° 35°

63
Appendix C: HEC-RAS Modeling Data Sheets
Upstream cross section where the flow entered the main channel.
Downstream cross section where the flow exited the channel.
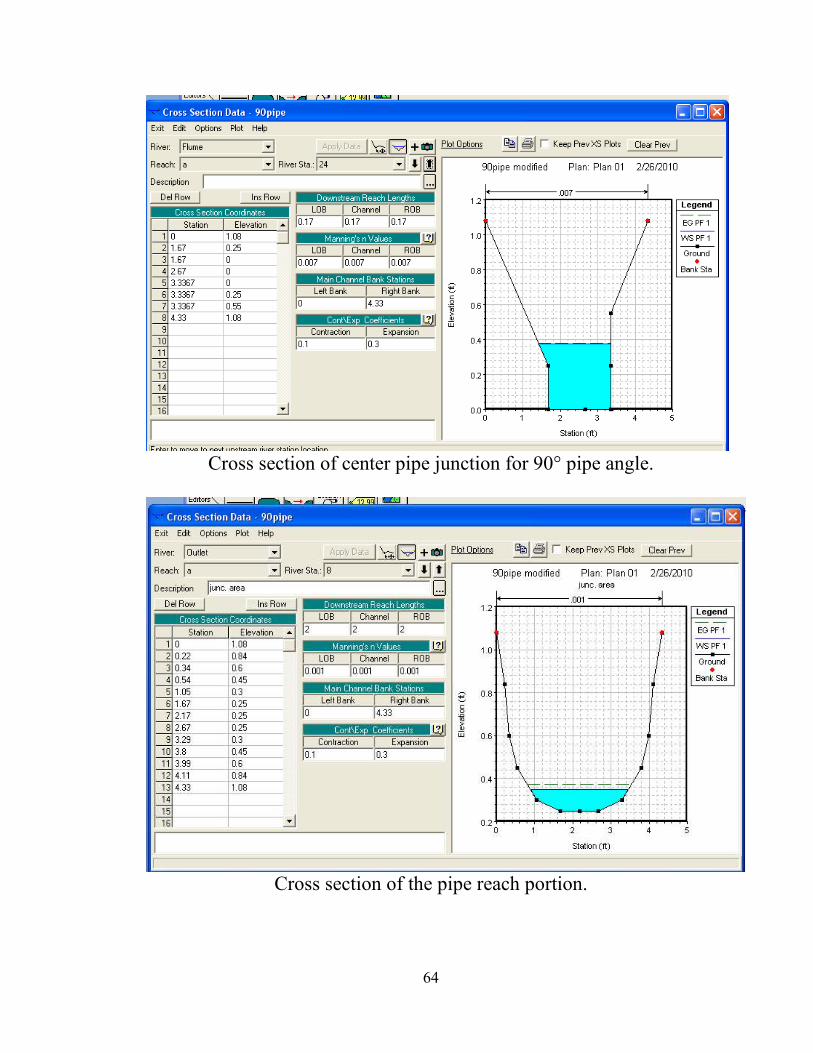
64
Cross section of center pipe junction for 90° pipe angle.
Cross section of the pipe reach portion.
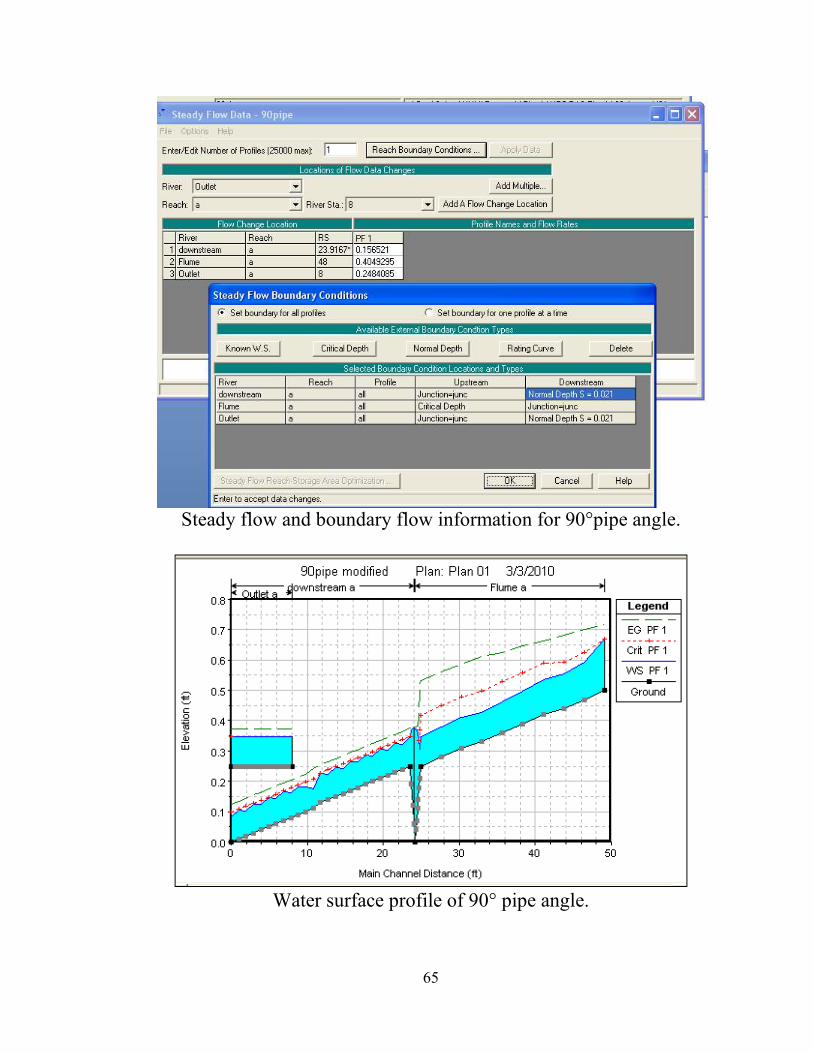
65
Steady flow and boundary flow information for 90°pipe angle.
Water surface profile of 90° pipe angle.

66
Original data from 90° angle pipe from HEC-RAS.
River Reach River Sta Profile Q Total Min Ch El W.S. Elev Crit W.S. E.G. Elev E.G. Slope Vel Chnl Flow Area Top Width Froude # Chl
(cfs) (ft) (ft) (ft) (ft) (ft/ft) (ft/s) (sq ft) (ft)
Outlet a 8 PF 1 0.2484 0.25 0.348 0.3728 0 1.2656 0.1963 2.5662 0.8065
Outlet a 7.5* PF 1 0.2484 0.25 0.348 0.3728 0 1.2659 0.1962 2.5661 0.8067
Outlet a 7.* PF 1 0.2484 0.25 0.3479 0.3728 0 1.2663 0.1962 2.5659 0.807
Outlet a 6.5* PF 1 0.2484 0.25 0.3479 0.3728 0 1.2666 0.1961 2.5658 0.8073
Outlet a 6.* PF 1 0.2484 0.25 0.3479 0.3728 0 1.2669 0.1961 2.5657 0.8076
Outlet a 5.5* PF 1 0.2484 0.25 0.3479 0.3728 0 1.2672 0.196 2.5655 0.8079
Outlet a 5.* PF 1 0.2484 0.25 0.3479 0.3728 0 1.2675 0.196 2.5654 0.8082
Outlet a 4.5* PF 1 0.2484 0.25 0.3478 0.3728 0 1.2679 0.1959 2.5653 0.8085
Outlet a 4.* PF 1 0.2484 0.25 0.3478 0.3728 0 1.2682 0.1959 2.5651 0.8088
Outlet a 3.5* PF 1 0.2484 0.25 0.3478 0.3728 0 1.2685 0.1958 2.565 0.809
Outlet a 3.* PF 1 0.2484 0.25 0.3478 0.3728 0 1.2688 0.1958 2.5649 0.8093
Outlet a 2.5* PF 1 0.2484 0.25 0.3478 0.3728 0 1.2692 0.1957 2.5647 0.8096
Outlet a 2.* PF 1 0.2484 0.25 0.3477 0.3728 0 1.2695 0.1957 2.5646 0.8099
Outlet a 1.5* PF 1 0.2484 0.25 0.3477 0.3728 0 1.2698 0.1956 2.5645 0.8102
Outlet a 1.* PF 1 0.2484 0.25 0.3477 0.3727 0 1.2701 0.1956 2.5643 0.8105
Outlet a .5* PF 1 0.2484 0.25 0.3477 0.3727 0 1.2705 0.1955 2.5642 0.8108
Outlet a 0 PF 1 0.2484 0.25 0.3477 0.3477 0.3727 0 1.2708 0.1955 2.5641 0.8111
Flume a 48 PF 1 0.4049 0.5 0.6684 0.6684 0.7186 0.0011 1.799 0.2251 1.6735 0.8644
Flume a 45.3703* PF 1 0.4049 0.47 0.5926 0.6239 0.7023 0.0034 2.6583 0.1523 1.4858 1.4631
Flume a 42.7406* PF 1 0.4049 0.44 0.555 0.5939 0.6827 0.0043 2.8685 0.1412 1.4558 1.6233
Flume a 40.111* PF 1 0.4049 0.42 0.5344 0.5882 0.6631 0.0044 2.8785 0.1407 1.459 1.6337
Flume a 37.4813* PF 1 0.4049 0.39 0.4969 0.5582 0.6479 0.0055 3.1188 0.1298 1.4289 1.8234
Flume a 34.8516* PF 1 0.4049 0.36 0.4636 0.5282 0.6262 0.0062 3.2359 0.1251 1.4157 1.9181
Flume a 32.222* PF 1 0.4049 0.33 0.4283 0.4982 0.6122 0.0074 3.441 0.1177 1.3944 2.0874
Flume a 29.5923* PF 1 0.4049 0.31 0.4101 0.4782 0.5862 0.007 3.3675 0.1202 1.4017 2.0262
Flume a 26.9626* PF 1 0.4049 0.28 0.3791 0.4482 0.5596 0.0072 3.4095 0.1188 1.3975 2.0611
Flume a 24.333 PF 1 0.4049 0.25 0.3483 0.4182 0.5322 0.0074 3.4419 0.1176 1.3943 2.0881
Flume a 24.2854* PF 1 0.4049 0.21 0.3052 0.3696 0.5234 0.0093 3.7481 0.108 1.2412 2.2387
Flume a 24.2378* PF 1 0.4049 0.18 0.3443 0.3343 0.4052 0.0014 1.9797 0.2045 1.3884 0.909
Flume a 24.1902* PF 1 0.4049 0.14 0.3571 0.3871 0.0005 1.3884 0.2917 1.5056 0.5559
Flume a 24.1427* PF 1 0.4049 0.11 0.3645 0.3837 0.0003 1.1112 0.3644 1.6104 0.4117
Flume a 24.0951* PF 1 0.4049 0.07 0.3693 0.3815 0.0001 0.8854 0.4574 1.7201 0.3026
Flume a 24.0475* PF 1 0.4049 0.04 0.3716 0.3805 0.0001 0.7561 0.5355 1.8147 0.2453
Flume a 24 PF 1 0.4049 0 0.3735 0.3797 0.0001 0.6349 0.6378 1.9151 0.1939
downstream a 23.9167* PF 1 0.1565 0.06 0.3767 0.3783 0 0.3187 0.4912 1.7549 0.1061
downstream a 23.8335* PF 1 0.1565 0.12 0.3751 0.3781 0 0.4409 0.355 1.5817 0.164
downstream a 23.7502* PF 1 0.1565 0.19 0.3703 0.3777 0.0002 0.6891 0.2271 1.4921 0.3113
downstream a 23.667 PF 1 0.1565 0.25 0.3477 0.3477 0.3755 0.0011 1.3402 0.1168 1.3918 0.8153
downstream a 22.6808* PF 1 0.1565 0.24 0.3232 0.3377 0.3636 0.002 1.6113 0.0971 1.334 1.0522
downstream a 21.6947* PF 1 0.1565 0.23 0.3257 0.3277 0.3549 0.0012 1.3728 0.114 1.3838 0.8428
downstream a 20.7086* PF 1 0.1565 0.22 0.3032 0.3177 0.3436 0.002 1.6113 0.0971 1.334 1.0522
downstream a 19.7225* PF 1 0.1565 0.21 0.3056 0.3077 0.3349 0.0012 1.3735 0.114 1.3836 0.8434
downstream a 18.7363* PF 1 0.1565 0.2 0.2832 0.2977 0.3236 0.002 1.6113 0.0971 1.334 1.0522
downstream a 17.7502* PF 1 0.1565 0.19 0.2856 0.2877 0.3149 0.0012 1.3735 0.114 1.3836 0.8434
downstream a 16.7641* PF 1 0.1565 0.18 0.2632 0.2777 0.3036 0.002 1.6113 0.0971 1.334 1.0522
downstream a 15.778* PF 1 0.1565 0.17 0.2656 0.2677 0.2949 0.0012 1.3735 0.114 1.3836 0.8434
downstream a 14.7918* PF 1 0.1565 0.16 0.2432 0.2577 0.2836 0.002 1.6113 0.0971 1.334 1.0522
downstream a 13.8057* PF 1 0.1565 0.15 0.2456 0.2477 0.2749 0.0012 1.3735 0.114 1.3836 0.8434
downstream a 12.8196* PF 1 0.1565 0.14 0.2232 0.2377 0.2636 0.002 1.6113 0.0971 1.334 1.0522
downstream a 11.8335* PF 1 0.1565 0.13 0.2256 0.2277 0.2549 0.0012 1.3735 0.114 1.3836 0.8434
downstream a 10.8473* PF 1 0.1565 0.11 0.1765 0.2087 0.2437 0.0043 2.0802 0.0752 1.2636 1.5022
downstream a 9.86125* PF 1 0.1565 0.1 0.1809 0.1987 0.2241 0.0022 1.668 0.0938 1.3206 1.1027
downstream a 8.87512* PF 1 0.1565 0.09 0.1824 0.1887 0.2142 0.0014 1.4314 0.1093 1.3664 0.8917
downstream a 7.88900* PF 1 0.1565 0.08 0.164 0.1787 0.2036 0.0019 1.5965 0.098 1.3332 1.0375
downstream a 6.90288* PF 1 0.1565 0.07 0.1663 0.1687 0.1952 0.0012 1.3651 0.1147 1.3817 0.8351
downstream a 5.91675* PF 1 0.1565 0.06 0.1432 0.1577 0.1836 0.002 1.6113 0.0971 1.334 1.0522
downstream a 4.93063* PF 1 0.1565 0.05 0.1456 0.1477 0.1749 0.0012 1.3733 0.114 1.3837 0.8432
downstream a 3.94450* PF 1 0.1565 0.04 0.1232 0.1377 0.1636 0.002 1.6113 0.0971 1.334 1.0522
downstream a 2.95838* PF 1 0.1565 0.03 0.1256 0.1277 0.1549 0.0012 1.3735 0.114 1.3836 0.8434

67
Steady flow and boundary flow information for 45°pipe angle.
Water surface profile of 45° pipe angle.

68
Original data from 45° angle pipe from HEC-RAS.
Reach River Sta Profile Q Total Min Ch El W.S. Elev Crit W.S. E.G. Elev E.G. Slope Vel Chnl Flow Area Top Width Froude # Chl
(cfs) (ft) (ft) (ft) (ft) (ft/ft) (ft/s) (sq ft) (ft)
Flume 48 PF 1 0.35 0.5 0.6415 0.6415 0.6992 0.0015 1.9278 0.1815 1.5659 0.9978
Flume 46.5* PF 1 0.35 0.48 0.5988 0.6216 0.6871 0.0029 2.3837 0.1468 1.4711 1.3297
Flume 45.* PF 1 0.35 0.47 0.5957 0.6114 0.6724 0.0023 2.2224 0.1575 1.5045 1.2106
Flume 43.5* PF 1 0.35 0.45 0.5636 0.5916 0.6618 0.0034 2.5156 0.1391 1.4502 1.4313
Flume 42.* PF 1 0.35 0.44 0.5594 0.5814 0.6462 0.0028 2.3649 0.148 1.479 1.3176
Flume 40.5* PF 1 0.35 0.42 0.5306 0.5614 0.6347 0.0037 2.5888 0.1352 1.4438 1.491
Flume 39.* PF 1 0.35 0.41 0.5258 0.5514 0.6192 0.0031 2.4514 0.1428 1.4647 1.3838
Flume 37.5* PF 1 0.35 0.39 0.499 0.5314 0.6068 0.0039 2.6359 0.1328 1.4371 1.5283
Flume 36.* PF 1 0.35 0.38 0.4938 0.5214 0.5912 0.0033 2.5049 0.1397 1.4564 1.4252
Flume 34.5* PF 1 0.35 0.36 0.4637 0.5014 0.5849 0.0046 2.7932 0.1253 1.4161 1.6549
Flume 33.* PF 1 0.35 0.34 0.4411 0.4814 0.5698 0.005 2.8787 0.1216 1.4055 1.725
Flume 31.5* PF 1 0.35 0.33 0.4339 0.4714 0.5546 0.0046 2.7883 0.1255 1.4167 1.6509
Flume 30.* PF 1 0.35 0.31 0.4105 0.4514 0.541 0.0051 2.8989 0.1207 1.4031 1.7416
Flume 28.5* PF 1 0.35 0.3 0.4032 0.4414 0.5257 0.0047 2.809 0.1246 1.4141 1.6678
Flume 27.* PF 1 0.35 0.28 0.3801 0.4214 0.5118 0.0052 2.9126 0.1202 1.4015 1.753
Flume 25.5* PF 1 0.35 0.27 0.3727 0.4114 0.4967 0.0048 2.8263 0.1238 1.4119 1.6819
Flume 24 PF 1 0.35 0.25 0.3497 0.3914 0.4825 0.0053 2.9238 0.1197 1.4001 1.7623
Flume 23.875* PF 1 0.35 0.19 0.2892 0.3457 0.4709 0.0077 3.4205 0.1023 1.1574 2.0274
Flume 23.75* PF 1 0.35 0.12 0.2805 0.2805 0.3526 0.0018 2.1554 0.1624 1.1223 0.9987
Flume 23.625* PF 1 0.35 0.06 0.2948 0.2142 0.3281 0.0006 1.4657 0.2388 1.1795 0.5741
Flume 23.5 PF 1 0.35 0 0.3039 0.3238 0.0003 1.1297 0.3098 1.2164 0.3945
Flume 23.3679* PF 1 0.35 0 0.3079 0.3218 0.0002 0.9465 0.3697 1.3058 0.3134
Flume 23.2358* PF 1 0.35 0 0.3103 0.3207 0.0001 0.8162 0.4288 1.4906 0.2682
Flume 23.1037* PF 1 0.35 0 0.312 0.3199 0.0001 0.7134 0.4905 1.684 0.2329
Flume 22.9717 PF 1 0.35 0 0.3131 0.3194 0.0001 0.6377 0.5487 1.8669 0.2073
Outlet 8 PF 1 0.294 0.25 0.3536 0.3838 0 1.3939 0.2109 2.6048 0.8632
Outlet 7.* PF 1 0.294 0.25 0.3536 0.3838 0 1.3947 0.2108 2.6045 0.8639
Outlet 6.* PF 1 0.294 0.25 0.3536 0.3838 0 1.3955 0.2107 2.6041 0.8646
Outlet 5.* PF 1 0.294 0.25 0.3535 0.3838 0 1.3963 0.2106 2.6038 0.8653
Outlet 4.* PF 1 0.294 0.25 0.3535 0.3838 0 1.3971 0.2105 2.6035 0.866
Outlet 3.* PF 1 0.294 0.25 0.3534 0.3838 0 1.3979 0.2103 2.6032 0.8667
Outlet 2.* PF 1 0.294 0.25 0.3534 0.3837 0 1.3987 0.2102 2.6029 0.8674
Outlet 1.* PF 1 0.294 0.25 0.3533 0.3837 0 1.3996 0.2101 2.6026 0.8681
Outlet 0 PF 1 0.294 0.25 0.3533 0.3533 0.3837 0 1.4 0.21 2.6024 0.8685
Downstream 22.9250* PF 1 0.0559 0.02 0.3173 0.3175 0 0.1116 0.5011 1.8046 0.0373
Downstream 22.8783* PF 1 0.0559 0.05 0.3172 0.3175 0 0.1286 0.4348 1.7445 0.0454
Downstream 22.8316* PF 1 0.0559 0.07 0.3172 0.3175 0 0.1452 0.3852 1.6743 0.0533
Downstream 22.7850* PF 1 0.0559 0.09 0.3171 0.3175 0 0.1653 0.3383 1.6041 0.0634
Downstream 22.7383* PF 1 0.0559 0.11 0.3169 0.3175 0 0.1901 0.2942 1.5338 0.0765
Downstream 22.6916* PF 1 0.0559 0.14 0.3166 0.3174 0 0.2319 0.2411 1.4732 0.101
Downstream 22.6449* PF 1 0.0559 0.16 0.3162 0.3174 0 0.2757 0.2028 1.4025 0.1278
Downstream 22.5983* PF 1 0.0559 0.18 0.3156 0.3174 0 0.3347 0.167 1.3312 0.1665
Downstream 22.5516* PF 1 0.0559 0.2 0.3145 0.3173 0.0001 0.4185 0.1336 1.2591 0.2264
Downstream 22.5049* PF 1 0.0559 0.23 0.3112 0.3169 0.0003 0.6108 0.0915 1.2542 0.3984
Downstream 22.4583 PF 1 0.0559 0.25 0.2923 0.2923 0.3153 0.0025 1.218 0.0459 1.1698 1.0836
Downstream 20.5867* PF 1 0.0559 0.23 0.2649 0.2723 0.2997 0.0048 1.4967 0.0374 1.1401 1.457
Downstream 18.7152* PF 1 0.0559 0.21 0.2435 0.2523 0.2815 0.0056 1.5639 0.0357 1.1344 1.5525
Downstream 16.8437* PF 1 0.0559 0.19 0.2238 0.2323 0.2611 0.0054 1.5509 0.0361 1.1355 1.5338
Downstream 14.9722* PF 1 0.0559 0.17 0.2037 0.2123 0.2412 0.0054 1.5543 0.036 1.1352 1.5388
Downstream 13.1006* PF 1 0.0559 0.15 0.1837 0.1923 0.2212 0.0054 1.5535 0.036 1.1353 1.5375
Downstream 11.2291* PF 1 0.0559 0.12 0.1479 0.1625 0.2041 0.0103 1.9024 0.0294 1.1104 2.0608
Downstream 9.35762* PF 1 0.0559 0.1 0.1293 0.1425 0.1797 0.0087 1.8009 0.031 1.1163 1.9031
Downstream 7.48609* PF 1 0.0559 0.08 0.1116 0.1225 0.1547 0.0068 1.6677 0.0335 1.1251 1.7025
Downstream 5.61457* PF 1 0.0559 0.06 0.0893 0.1023 0.1399 0.0088 1.8054 0.031 1.1174 1.9111
Downstream 3.74305* PF 1 0.0559 0.04 0.0693 0.0823 0.1199 0.0088 1.8054 0.031 1.1174 1.9111
Downstream 1.87152* PF 1 0.0559 0.02 0.0493 0.0623 0.0999 0.0088 1.8054 0.031 1.1174 1.9111
Downstream 0 PF 1 0.0559 0 0.0293 0.0424 0.0798 0.0087 1.804 0.031 1.1171 1.9087

69
Steady flow and boundary flow information for 90°pipe angle.
Water surface profile of 30° pipe angle.

70
Original data from 30° angle pipe from HEC-RAS.
Reach River Sta Profile Q Total Min Ch El W.S. Elev Crit W.S. E.G. Elev E.G. Slope Vel Chnl Flow Area Top Width Froude # Chl
(cfs) (ft) (ft) (ft) (ft) (ft/ft) (ft/s) (sq ft) (ft)
a 48 PF 1 0.165 0.5 0.543 0.598 0.738 0.021 3.541 0.047 1.171 3.131
a 46.6102* PF 1 0.165 0.49 0.537 0.588 0.695 0.015 3.192 0.052 1.189 2.7
a 45.2205* PF 1 0.165 0.47 0.517 0.568 0.675 0.015 3.192 0.052 1.189 2.7
a 43.8308* PF 1 0.165 0.46 0.512 0.558 0.638 0.011 2.844 0.058 1.21 2.29
a 42.4411* PF 1 0.165 0.44 0.494 0.538 0.613 0.01 2.778 0.059 1.215 2.216
a 41.0514* PF 1 0.165 0.43 0.484 0.528 0.603 0.01 2.778 0.059 1.215 2.216
a 39.6617* PF 1 0.165 0.41 0.463 0.508 0.585 0.01 2.805 0.059 1.213 2.246
a 38.2720* PF 1 0.165 0.4 0.453 0.498 0.575 0.01 2.805 0.059 1.213 2.246
a 36.8823* PF 1 0.165 0.38 0.433 0.478 0.557 0.01 2.831 0.058 1.211 2.276
a 35.4926* PF 1 0.165 0.37 0.423 0.468 0.547 0.01 2.831 0.058 1.211 2.276
a 34.1029* PF 1 0.165 0.35 0.403 0.448 0.524 0.01 2.788 0.059 1.214 2.227
a 32.7132* PF 1 0.165 0.34 0.393 0.438 0.514 0.01 2.788 0.059 1.214 2.227
a 31.3235* PF 1 0.165 0.32 0.373 0.418 0.496 0.01 2.816 0.059 1.212 2.259
a 29.9338* PF 1 0.165 0.31 0.363 0.408 0.486 0.01 2.816 0.059 1.212 2.259
a 28.5441* PF 1 0.165 0.29 0.342 0.388 0.468 0.011 2.842 0.058 1.21 2.288
a 27.1544* PF 1 0.165 0.28 0.332 0.378 0.458 0.011 2.842 0.058 1.21 2.288
a 25.7647* PF 1 0.165 0.26 0.313 0.358 0.435 0.01 2.805 0.059 1.213 2.246
a 24.375 PF 1 0.165 0.25 0.303 0.348 0.425 0.01 2.805 0.059 1.213 2.246
a 24.3486* PF 1 0.165 0.24 0.302 0.344 0.411 0.008 2.651 0.062 1.2 2.053
a 24.3222* PF 1 0.165 0.23 0.286 0.334 0.418 0.011 2.917 0.057 1.115 2.283
a 24.2958* PF 1 0.165 0.22 0.278 0.326 0.409 0.01 2.905 0.057 1.078 2.231
a 24.2694* PF 1 0.165 0.22 0.281 0.318 0.409 0.009 2.869 0.057 1.059 2.171
a 24.243* PF 1 0.165 0.21 0.273 0.312 0.402 0.009 2.881 0.057 1.013 2.136
a 24.2166* PF 1 0.165 0.2 0.265 0.305 0.397 0.009 2.913 0.057 0.969 2.124
a 24.1902* PF 1 0.165 0.19 0.26 0.293 0.387 0.008 2.864 0.058 0.92 2.018
a 24.1638* PF 1 0.165 0.18 0.253 0.288 0.378 0.008 2.832 0.058 0.873 1.934
a 24.1374* PF 1 0.165 0.17 0.246 0.283 0.37 0.007 2.825 0.058 0.837 1.885
a 24.111* PF 1 0.165 0.17 0.33 0.287 0.351 0.001 1.155 0.143 1.248 0.602
a 24.0846* PF 1 0.165 0.16 0.331 0.35 0.001 1.122 0.147 1.225 0.571
a 24.0582* PF 1 0.165 0.15 0.332 0.35 0.001 1.082 0.152 1.245 0.545
a 24.0318* PF 1 0.165 0.14 0.333 0.35 0 1.043 0.158 1.264 0.52
a 24.0054* PF 1 0.165 0.13 0.333 0.349 0 1.019 0.162 1.276 0.504
a 23.979* PF 1 0.165 0.12 0.333 0.349 0 1.005 0.164 1.273 0.494
a 23.9526* PF 1 0.165 0.12 0.332 0.349 0 1.048 0.157 1.271 0.525
a 23.9262* PF 1 0.165 0.11 0.332 0.349 0 1.032 0.16 1.309 0.521
a 23.8998* PF 1 0.165 0.1 0.332 0.349 0 1.039 0.159 1.277 0.52
a 23.8734* PF 1 0.165 0.09 0.332 0.348 0 1.011 0.163 1.33 0.509
a 23.847* PF 1 0.165 0.08 0.332 0.348 0 1.014 0.163 1.32 0.509
a 23.8206* PF 1 0.165 0.07 0.333 0.348 0 0.989 0.167 1.341 0.495
a 23.7942* PF 1 0.165 0.07 0.331 0.348 0.001 1.039 0.159 1.334 0.531
a 23.7678* PF 1 0.165 0.06 0.331 0.348 0.001 1.042 0.158 1.324 0.531
a 23.7414* PF 1 0.165 0.05 0.331 0.348 0.001 1.02 0.162 1.345 0.519
a 23.715* PF 1 0.165 0.04 0.329 0.347 0.001 1.078 0.153 1.308 0.556
a 23.6886* PF 1 0.165 0.03 0.329 0.347 0.001 1.076 0.153 1.318 0.556
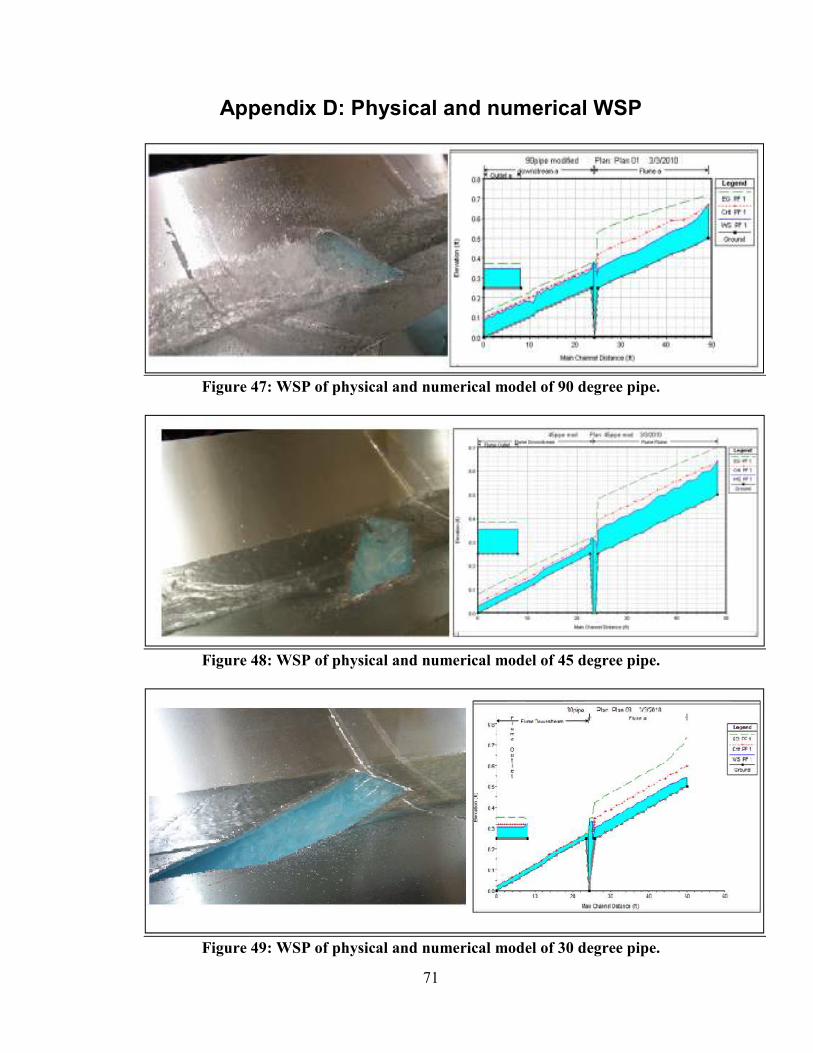
71
Appendix D: Physical and numerical WSP
Figure 47: WSP of physical and numerical model of 90 degree pipe.
Figure 48: WSP of physical and numerical model of 45 degree pipe.
Figure 49: WSP of physical and numerical model of 30 degree pipe.

72
Appendix E: Dimensional Analysis A dimensional analysis was performed to determine if any trends may occur in
the Increased Contact Area experiment. The dimensions that were considered in the
dimensional analysis are shown in Figure 50 and were in units of Length (L) and time
(T). The number of variables was six, implying a total of four Buckingham Pi terms.
The repeating variables chosen for analysis were upstream velocity (V) and gravity (g)
since this would allow a relationship with the Froude number to be shown.
Figure 50: Variables used in the dimensional analysis.
The equations for the analysis are shown below.
�� = f(θ. Q, g, V, D) Eq. 1
When using upstream velocity and gravity as the repeating variables the following
Buckingham Pi Theorems are produced.
Variable Description
Q Upstream channel flow
q Lateral outflow
Q/q Diversion ratio
θ Pipe angle
D Hydraulic depth
g Gravity
V Upstream velocity

73
Π� = �� Π� = θ Π� = ���
��
� = ���� = �
������.
The dimensionless variables were combined into one pseudo-equation that contained a
Froude number with respect to the shape of the channel, which is shown in Equation 2.
Π� = Π�f(Π�, Π�, Π�, … )
�� = θ f (���
�� , Fr#�$%.) Eq. 2
The dimensional analysis shows that a relationship between the diversion ratio to the
Froude number and velocity may occur in respect to the pipe angle.

74
Appendix F: Similitude
To compare the flows in the existing channels to those from the increased contact
area experiment a Froude number similitude was used since the gravitational forces are
dominant in open channel systems.
Fr% = Fr& Eqn. 1
' �(�)*
%= ' �
(�)*&
Eqn. 2
Since gravity is the same in both of the Froude numbers under consideration it can be
canceled from the equation.
���)�
= �+�)+
Eqn. 3
Flow (Q), according to Continuity, is equal to the product of the cross sectional area (A)
and velocity (V) and can be substituted within the equation.
���)�, )�
= �+�)+, )+
Eqn. 4
���)��
= �+�)+�
Eqn. 5
-���+
.� = -)�)+
.� Eqn. 6
Q% = Q& -)�)+
.� �/
Eqn. 7
The length scale ratio, Lr, is defined in the following equation and was substituted into
the equation.
L� = )�)+
Eqn. 9
Q% = Q&(L�)�� Eqn. 10

75
To determine a suitable location for the lateral outflow junction in one of the
stormwater channels the dimensions and flow rates of several stormwater channels must
be determined. Three locations were determined suitable, due to their proximity to a
detention basin and the North Diversion Channel (NDC). These locations have
trapezoidal shape channels with a 2:1 (H:V) side slope, which was the same as the
experiment. These locations were: Vineyard Arroyo at NDC, Hahn Arroyo at NDC, and
the Princeton basin at NDC. The locations of these sites are shown in Figure 51. The
stormwater channels collect water throughout the city and are eventually deposited into
the NDC, where it is later discharged into the Rio Grande. The storm event flows for
these locations are shown in Table 4. The existing condition values are the flows of the
channel at the present moment and the future condition values are for when the area is
completely developed (U.S. Army, 1995). The percentage values represent the storm that
the channel would experience. This implies that a 10.0% event is a 10 year storm event
and the 0.1% event is a 1,000 year storm event.

76
Figure 51: Locations of possible sites.
Table 4: Storm event discharge values (U.S. Army, 1995).
The Vineyard Arroyo site shown in Figure 51 and can be retrofitted with a lateral
outflow pipe directed into the stormwater quality site in that area. The base width of the
channel at this site is 20 feet (6.1 m), which means a scale factor of 20 would be used to
compare the flows from the experiment. The scaled flow values of the Vineyard Arroyo
prototype are shown in Table 5. The flows show that a 10.0% and 2.0%, existing
conditions, storm event can easily be diverted while a 10.0%, future conditions, storm
Location10.0%
(cfs)
2.0%
(cfs)
1.0%
(cfs)
0.1%
(cfs)
10.0%
(cfs)
2.0%
(cfs)
1.0%
(cfs)
0.1%
(cfs)
Vineyard Arroyo @ Diversion 300 700 900 1200 400 800 900 1300
Hahn Arroyo @ Diversion Channel 1900 3400 4000 5500 1900 3400 4100 5600
Princeton Basin Pumping
Station @ Diversion Channel800 1400 1600 2200 900 1400 1700 2200
Exisiting Conditions Future Conditions

77
can only be compared. This shows that the frequent storm events that the channel
experiences can easily be removed from the channel at reasonable diversion ratios.
Table 5: Vineyard arroyo prototype flows and diversions.
The Hahn Arroyo site shown in Figure 51 can be retrofitted with a lateral outflow
pipe that is directed to the Comanche Detention Basin. The lateral outflow pipe would
have to be retrofitted at the segment where the NDC channel meets the Hahn Arroyo, the
blue line segment between the NDC and Hahn Arroyo in the image, since this portion of
the channel has a base width of 30 feet (9.1 m). Using this value as the scale factor the
flow values of the prototype are shown in Table 6. The table shows that the 10.0%,
existing and future conditions, storm events can easily be removed from the channel into
the detention basin with reasonable diversion ratios.
Table 6: Hahn arroyo prototype flows and diversions.
For the Princeton Basin location, shown in Figure 51, a channel can be
constructed and retrofitted for the basin to divert the water into the NDC. This would
allow the water from the detention basin to be relocated into the NDC instead of using the
pump station as this location. The base width of the constructed channel should be 30
feet (9.1 m), the same as the NDC. This would allow a smooth transition of the water
Configuration
Flow of
Model, Qm
(cfs)
Percent
Diversion
(%)
Flow of Prototype, Qp
(cfs)
90 degree pipe 0.4153 58.8 742.9
45 degree pipe 0.3500 84.0 626.0
30 degree pipe 0.2272 98.3 406.5
Configuration
Flow of
Model, Qm
(cfs)
Percent
Diversion
(%)
Flow of Prototype, Qp
(cfs)
90 degree pipe 0.4153 58.8 2047.1
45 degree pipe 0.3500 84.0 1725.1
30 degree pipe 0.2272 98.3 1120.1

78
from the detention basin to the NDC and prevent a hydraulic jump or choking to occur.
Using this value as the scale factor the flow values of the prototype can be seen in Table
7. The table shows that the 10.0%, 2.0%, and 1.0% storm events, existing and future
conditions, can be easily removed and allow reasonable diversion ratio values.
Table 7: Princeton basin prototype flows and diversions.
Configuration
Flow of
Model, Qm
(cfs)
Percent
Diversion
(%)
Flow of Prototype, Qp
(cfs)
90 degree pipe 0.4153 58.8 2047.1
45 degree pipe 0.3500 84.0 1725.1
30 degree pipe 0.2272 98.3 1120.1

79
REFERE�CES
Balmforth, D. J. & Sarginson, E. J. (1983), 'The Effects of Curvature In Supercritical
Side Weir Flow', Journal of Hydraulic Research 21(5), 333-343.
Beltrami, G. M.; Repetto, R. & Del Guzzo, A. (2007), 'A simple method to regularize
supercritical flow profiles in bends', JOURNAL OF HYDRAULIC RESEARCH 45(6),
773-786.
Brunner, G.W. (2002). “HEC-RAS River Analysis System User’s Manual.” U.S. Army
Corps. Of Engineers® < http://www.hec.usace.army.mil/software/hec-
ras/documents/userman/index.html> (January, 2, 2010).
Chanson, H. & Toombes, L. (1998), 'Supercritical flow at an abrupt drop: flow patterns
and aeration', CANADIAN JOURNAL OF CIVIL ENGINEERING 25(5), 956-966.
Coonrod, J. (2002). North Domingo Baca Diversion Wye. Unpublished report. Retrieved
April 14, 2009 from http://www.unm.edu/~hydlab/
Coonrod, J. (2003) Off-Site Storm Water Quality Facility in North Pino. Unpublished
report. Retrieved April 14, 2009 from http://www.unm.edu/~hydlab/
Coonrod, J., Ho, J. and Bernardo, N. (2009). Lateral Outflow from Supercritical
Channels. Unpublished report. Retrieved April 14, 2009 from
http://www.unm.edu/~hydlab/
Del Giudice, G.; Gisonni, C. & Hager, W. H. (2000), 'Supercritical flow in bend
manhole', Journal of Irrigation and Drainage Engineering-asce 126(1), 48--56.
Durga Rao, K. H. V. & Pillai, C. R. S. (2008), 'Study of flow over side weirs under
supercritical conditions', Water Resources Management 22(1), 131-143.
Finnemore, E. J., & Franzini, J. B. (2002). Fluid Mechanics with Engineering
Applications. (10th
ed.) New York: McGraw-Hill Companies, Inc., Chapter 7: Similitude
and Dimensional Analysis, 232 – 254.
Ghodsian, M. (2003), 'Supercritical flow over a rectangular side weir', Canadian Journal
of Civil Engineering 30(3), 596-600.
Gupta, U. P.; Sharma, N. & Ojha, C. S. P. (2007), 'Performance evaluation of tapered
vane', JOURNAL OF HYDRAULIC RESEARCH 45(4), 472-477.
Hager, W. H. (1987), 'Lateral Outflow Over Side Weirs', Journal of Hydraulic
Engineering-asce 113(4), 491-504.

80
Hager, W. H.; SCHWALT, M.; JIMENEZ, O. & CHAUDHRY, M. H. (1994),
'Supercritical-flow Near An Abrupt Wall Deflection', Journal of Hydraulic Research
32(1), 103--118.
Kawagoshi, N. & HAGER, W. H. (1990), 'Wave Type Flow At Abrupt Drops .1. Flow
Geometry', Journal of Hydraulic Research 28(2), 235--252.
Marelius, F. & Sinha, S. (1998), 'Experimental investigation of flow past submerged
vanes', JOURNAL OF HYDRAULIC ENGINEERING-ASCE 124(5), 542-545.
Marsh-McBirney Inc. (1990). “Model 2000 Installation and Operations Manual.” <
http://www.marsh-mcbirney.com/manuals/Model_2000_Manual.pdf> (January 4, 2010).
Mizumura, K.; Yamasaka, M. & Adachi, J. (2003), 'Side outflow from supercritical
channel flow', Journal of Hydraulic Engineering-asce 129(10), 769-776.
Mizumura, K. (2005), 'Discharge ratio of side outflow to supercritical channel flow',
Journal of Hydraulic Engineering-asce 131(9), 821-824.
Ramamurthy, A. S.; Qu, J. Y. & Vo, D. (2007), 'Numerical and experimental study of
dividing open-channel flows', Journal of Hydraulic Engineering-asce 133, 1135-1144.
Reinauer, R. & Hager, W. H. (1997), 'Supercritical bend flow', Journal of Hydraulic
Engineering-asce 123(3), 208--218.
Sturm, T.W. (2010). Open Channel Hydraulics. (2nd
ed.) New York: McGraw-Hill
Companies, Inc., Chapter 4: Uniform Flow, 130 – 134.
Tan, S. K.; Yu, G. L.; Lim, S. Y. & Ong, M. C. (2005), 'Flow structure and sediment
motion around submerged vanes in open channel', Journal of Waterway Port Coastal and
Ocean Engineering-asce 131(3), 132--136.
U.S. Army Corps of Engineers and the Albuquerque Metropolitan Arroyo Flood Control
Authority (1995). Albuquerque Arroyos Albuquerque, New Mexico Feasibility Study.
Unpublished report. Retrieved March 3, 2010 from AMAFACA library.
Ward, C. (2007). “FlowTracker® Handheld ADV® Technical Manual.” SonTek/YSI Inc.
<http://www.tceq.state.tx.us/assets/public/compliance/monops/water/wqm/v3.3_flow_tra
cker.pdf> (January 4, 2010).
Related Documents