Stormwater Lateral Loading Study Lower Duwamish Waterway, WA Combined Sampling and Analysis Plan and Quality Assurance Project Plan Prepared for Washington State Department of Ecology Toxics Cleanup Program Northwest Regional Office Bellevue, Washington Prepared by Science Applications International Corporation 18912 North Creek Parkway, Suite 101 Bothell, WA 98011 December 21, 2010

Welcome message from author
This document is posted to help you gain knowledge. Please leave a comment to let me know what you think about it! Share it to your friends and learn new things together.
Transcript

Stormwater Lateral Loading Study Lower Duwamish Waterway, WA
Combined Sampling and Analysis Plan and Quality Assurance Project Plan
Prepared for
Washington State Department of Ecology Toxics Cleanup Program
Northwest Regional Office Bellevue, Washington
Prepared by
Science Applications International Corporation
18912 North Creek Parkway, Suite 101 Bothell, WA 98011
December 21, 2010

Stormwater Lateral Loading Study SAP/QAPP
December 21, 2010 Page i
Table of Contents Page
1.0 Introduction ........................................................................................................................1 1.1 Background ......................................................................................................................1
2.0 Project Organization and Responsibilities ......................................................................2 2.1 Project Planning and Coordination ..................................................................................2 2.2 Sample Collection ............................................................................................................2 2.3 Laboratory Coordination and QA/QC Management ........................................................2 2.4 Health and Safety Manager ..............................................................................................2 2.5 Subcontractor Support .....................................................................................................3 2.6 Project Schedule ...............................................................................................................4
3.0 Field Sampling Plan ...........................................................................................................5 3.1 Sampling Locations .........................................................................................................5 3.2 Sampling Events ..............................................................................................................5
3.2.1 Storm Event Sampling .............................................................................................5 3.2.2 Base Flow Sampling ................................................................................................6
3.3 Sampler Design and Installation ......................................................................................6 3.3.1 Stormwater Sampler and Sensors ............................................................................6 3.3.2 Stormwater Solids Filtration ....................................................................................7 3.3.3 Sediment Trap ..........................................................................................................8
3.4 Preliminary Data Collection ............................................................................................8 3.5 Sample Collection and Handling Methods ......................................................................9
3.5.1 Equipment Decontamination ...................................................................................9 3.5.2 Storm Tracking ........................................................................................................9 3.5.3 Whole Water Sample Collection .............................................................................9 3.5.4 Filtered Solids Collection ......................................................................................10 3.5.5 Sediment Trap Sample Collection .........................................................................11 3.5.6 Catch Basin Solids Grab Sample Collection .........................................................11
3.6 Sample Identification, Containers, and Labels ..............................................................12 3.7 Sample Storage and Delivery .........................................................................................12 3.8 Documentation ...............................................................................................................13
3.8.1 Field Logbooks ......................................................................................................13 3.8.2 Chain-of-Custody Procedures ................................................................................14
3.9 Laboratory Analyses ......................................................................................................14 3.9.1 Whole Water Analyses ..........................................................................................14 3.9.2 Filtered Suspended Solids Analyses ......................................................................15 3.9.3 Sediment Trap Solids Analyses .............................................................................15 3.9.4 Catch Basin Solids Sample Analyses ....................................................................16 3.9.5 Analytical Laboratory Reporting ...........................................................................16
4.0 Quality Assurance Project Plan ......................................................................................17 4.1 Measurements of Data Quality ......................................................................................17 4.2 QA/QC for Chemistry Samples .....................................................................................18
4.2.1 Field QA/QC for Water and Sediment Chemistry .................................................18 4.2.2 Laboratory QA/QC for Water and Sediment Chemistry .......................................18
4.3 Data Validation ..............................................................................................................18

Stormwater Lateral Loading Study SAP/QAPP
December 21, 2010 Page ii
5.0 Data Analysis ....................................................................................................................20 5.1 Analysis of Water and Solids Chemistry Data ..............................................................20 5.2 Comparison of Solids Sampling Methods .....................................................................20 5.3 Lateral Loading Calculations .........................................................................................20
5.3.1 Stormwater Discharge Volume ..............................................................................20 5.3.2 Annual Mean Contaminant Concentration ............................................................21 5.3.3 Contaminant Loading.............................................................................................22
6.0 Data Reporting .................................................................................................................23
7.0 References .........................................................................................................................24 Figures Figure 1. Overview of Stormwater Lateral Loading Sampling Sites Figure 2. Norfolk Storm Drain Basin and Outfall Location Figure 3. King County International Airport Storm Drain #2 Drainage Basin and Outfall
Location Figure 4. Port of Seattle Terminal 115 Drainage Sub-basin and Outfall Location Figure 5. Boeing Developmental Center Storm Drain Basin and Outfall Location Figure 6. ISCO Whole Water Sampler Figure 7. Suspended Solids Filtration Unit Figure 8. Modified Ecology Sediment Trap Figure 9. Sediment Traps Installed in a Storm Drain Line Tables Table 1. Stormwater Outfall Information Table 2. Storm Drain Access Location Information Table 3. Event-based Sample Collection Table 4. Whole Water Sample Analytes Table 5. Stormwater Solid Sample SMS Analytes Table 6. Dioxin/Furan Congeners and Method Detection Limits Table 7. PBDE Congeners and Method Detection Limits Table 8. Sediment Trap and Catch Basin Solid Analytes

Stormwater Lateral Loading Study SAP/QAPP
December 21, 2010 Page iii
List of Acronyms ARI Analytical Resources, Inc. COC chain of custody CSL Cleanup Screening Level DC direct current EAP Environmental Assessment Program Ecology Washington State Department of Ecology EIM Environmental Information Management EPA Environmental Protection Agency FM field manager FS feasibility study gph gallons per hour GPM government project manager HSP health and safety plan LAET lowest apparent effects threshold LCS laboratory control sample LCSD laboratory control sample duplicate LDW Lower Duwamish Waterway LDWG Lower Duwamish Waterway Group MDL method detection limit MS matrix spike MSD matrix spike duplicate MRL method reporting limit MTCA Model Toxics Control Act NBF-GTSP North Boeing Field-Georgetown Steam Plant NOAA National Oceanic and Atmospheric Administration OPR ongoing precision and recovery OPRD ongoing precision and recovery duplicate PAH polycyclic aromatic hydrocarbon PBDE polybrominated diphenyl ether PCB polychlorinated biphenyl PPE personal protective equipment PSEP Puget Sound Estuary Program QA quality assurance QC quality control QAPP quality assurance project plan RI remedial investigation RPD relative percent difference SAIC Science Applications International Corporation SAP sampling and analysis plan SD storm drain SOP standard operating procedure SQS Sediment Quality Standard SMS Sediment Management Standards SVOC semi-volatile organic compound TEF toxic equivalency factor TEQ toxic equivalent

Stormwater Lateral Loading Study SAP/QAPP
December 21, 2010 Page iv
List of Acronyms (continued) TOC total organic carbon WAC Washington Administrative Code WHO World Health Organization

Stormwater Lateral Loading Study SAP/QAPP
December 21, 2010 Page 1
1.0 Introduction
Science Applications International Corporation (SAIC) is assisting the Washington State Department of Ecology (Ecology) with the development of a study to better understand the potential for sediment recontamination associated with stormwater discharges in the Lower Duwamish Waterway (LDW) (SAIC 2009a; 2009b; 2009c). NewFields provides project support as a subcontractor to SAIC. The Stormwater Lateral Loading Study includes measurement of contaminant concentrations associated with stormwater discharges and estimation of lateral contaminant loadings from significant storm drain outfalls in the LDW. To facilitate this process, Ecology has tasked SAIC with the collection of stormwater, storm drain solids, and flow measurements from four LDW storm drain lines representative of different land use types. The Sampling and Analysis Plan/Quality Assurance Project Plan (SAP/QAPP) for this study was prepared in accordance with the requirements outlined in Washington Administrative Code (WAC) 173-340-820. Analytical procedures are also identified in the SAP/QAPP in accordance with WAC 173-340-830.
1.1 Background
A wide range of contaminants are present in a 5.5-mile reach of the LDW, including polychlorinated biphenyls (PCBs), polycyclic aromatic hydrocarbons (PAHs), and metals. High concentrations of these contaminants have made this portion of the LDW a Federal Superfund and state Model Toxics Control Act (MTCA) site. Ecology supports the Environmental Protection Agency (EPA) efforts on the LDW Remedial Investigation/Feasibility Study (RI/FS) and is leading source control efforts in coordination with local governments. Ecology and EPA are currently implementing a two-phase RI/FS with the potentially responsible parties, collectively known as the Lower Duwamish Waterway Group (LDWG). The LDWG members are: City of Seattle, The Boeing Company, Port of Seattle, and King County.
The LDWG has estimated contaminant loading to the LDW through a multi-step process including stormwater runoff modeling, sediment transport modeling, and the application of catch basin and inline solids data. Ecology would like to begin collecting data to help evaluate how well these estimates correlate to actual input of contaminants to the waterway. As part of this evaluation, Ecology plans to measure contaminant concentrations and estimate loadings in stormwater and storm drain solids from significant stormwater outfalls within the LDW study area.
The objectives of the lateral loading study include:
• Collection of data necessary to assess contaminant loading from four significant municipal and industrial stormwater outfalls;
• Identification of stormwater contaminants associated with different land use types; • Estimation of stormwater contaminant lateral loadings for the studied outfalls; and • To the extent possible, correlation of inline sediment trap, filtered suspended solids, and
catch basin solids data with stormwater data.

Stormwater Lateral Loading Study SAP/QAPP
December 21, 2010 Page 2
2.0 Project Organization and Responsibilities
SAIC and its subcontractors will implement the SAP/QAPP under the direction of Ecology. The following sections describe the key roles and responsibilities of the project team.
2.1 Project Planning and Coordination
Dan Cargill of Ecology will serve as the Government Project Manager (GPM) who will conduct overall project coordination, supply government-furnished services, review reports, and coordinate with contractors. Glen Vedera will serve as the SAIC project manager and be responsible for executing the approved SAP/QAPP, overseeing the collection and analysis of field samples, and reporting analytical results.
SAIC Glen Vedera 18912 North Creek Parkway, Suite 101 Bothell, WA Phone: (425) 482-3329 Fax: (425) 487-1491 [email protected]
2.2 Sample Collection
Dr. Jon Nuwer of NewFields will serve as field manager (FM) responsible for collecting and processing samples in accordance with the SAP/QAPP, and transporting samples to the analytical laboratories for analysis. The FM will oversee field preparation to ensure all sampling equipment is built to specifications. The FM will oversee the installation of the samplers and monitor the confined space subcontractors.
2.3 Laboratory Coordination and QA/QC Management
Dr. Will Hafner of NewFields will serve as laboratory coordinator responsible for subcontracting state-certified laboratories, and ensuring observation of established protocols for decontamination, sample preservation, holding times, chain-of-custody (COC) documentation, and laboratory reporting. The quality assurance/quality control (QA/QC) manager, Marina Mitchell of SAIC, will provide quality assurance oversight for the laboratory programs, ensuring that the laboratory analytical and QA/QC data are considered valid, and that procedures meet the required analytical quality control limits.
2.4 Health and Safety Manager
Preston Martin of NewFields will serve as the designated Project Health and Safety Manager. The Health and Safety Manager is responsible for ensuring that all personnel are properly trained, fully aware of potential site hazards, conduct all work in a safe manner, wear appropriate

Stormwater Lateral Loading Study SAP/QAPP
December 21, 2010 Page 3
personal protective equipment (PPE), and abide by the conditions set forth in the Health and Safety Plan (HSP).
2.5 Subcontractor Support
The SAIC project team will consist of the following subcontractors to support the data collection activities, laboratory analytical services, and data reporting:
• Project Support NewFields John Nakayama 4729 NE View Drive Port Gamble, WA 98364 Phone: (360) 297-6040 [email protected]
• Analytical Chemistry Analytical Resources, Incorporated Cheronne Oreiro 4611 South 134th Place Tukwila, WA 98166 Phone: (206) 695-6200 [email protected]
• Dioxin/Furan Congener and Polybrominated Diphenyl Ether (PBDE) Analysis Axys Analytical Services, Ltd. Georgina Brooks 2045 Mills Road Sidney BC V8L 3S8 CANADA Phone: (250) 655-5801 Fax: (250) 655-5811 [email protected]
• ISCO Sampler Support
Whitney Equipment Co., Inc. Laura Haggard 21222 30th Dr. SE, Suite. 110 Bothell, WA 98021 Phone: (425)486-9499 Fax: (425)485-7409 [email protected]

Stormwater Lateral Loading Study SAP/QAPP
December 21, 2010 Page 4
• Analytical Data Validation EcoChem, Inc. Christine Ransom 710 Second Avenue, Suite 660 Seattle, WA 98104 Phone: (206)233-9332 [email protected]
• Confined Space Entry and Sampler Installation
Clearcreek Contractors Jay Wilcox 3203 15th Street Everett, WA 98201 Phone: (425)252-5800 [email protected]
2.6 Project Schedule
Field preparation and mobilization will begin in November following approval of the SAP/QAPP. Sampling and analysis will begin in November 2010 and will continue until April 30, 2011. During this time period, samples will be collected during up to eight storm events and two base flow events. Samples will be analyzed after each event and the analytical results will be validated as the data become available. Given the anticipated end date for stormwater sampling (April 2011) and the time required for analysis, data evaluation, and modeling, completion of the data report may not meet the June 30, 2011 deadline. Following completion of the stormwater sampling program, SAIC will coordinate with Ecology to determine and obtain a no-cost period of performance extension to complete the report, if possible and deemed necessary.

Stormwater Lateral Loading Study SAP/QAPP
December 21, 2010 Page 5
3.0 Field Sampling Plan
The purpose of the field sampling plan is to describe the manner and methods by which data collection efforts will be performed to characterize lateral loadings to the LDW. Each location will be sampled during eight storm events over the course of the rainy season (November 2010 – April 2011) in order to estimate the seasonal variability in contaminant loadings. Samples will also be collected during dry and wet base flow periods, if conditions permit. Sampling activities will consist of collecting stormwater (whole water), filtered suspended solids, sediment trap solids, and catch basin solids samples, as well as stormwater flow data. Whole water and filtered suspended solids samples will consist of one composite per individual storm event. Sediment trap samples will be composited over a period of several months to provide enough material for chemical analysis. Catch basin solids grab samples will be collected twice at each location over the course of the sampling season.
3.1 Sampling Locations
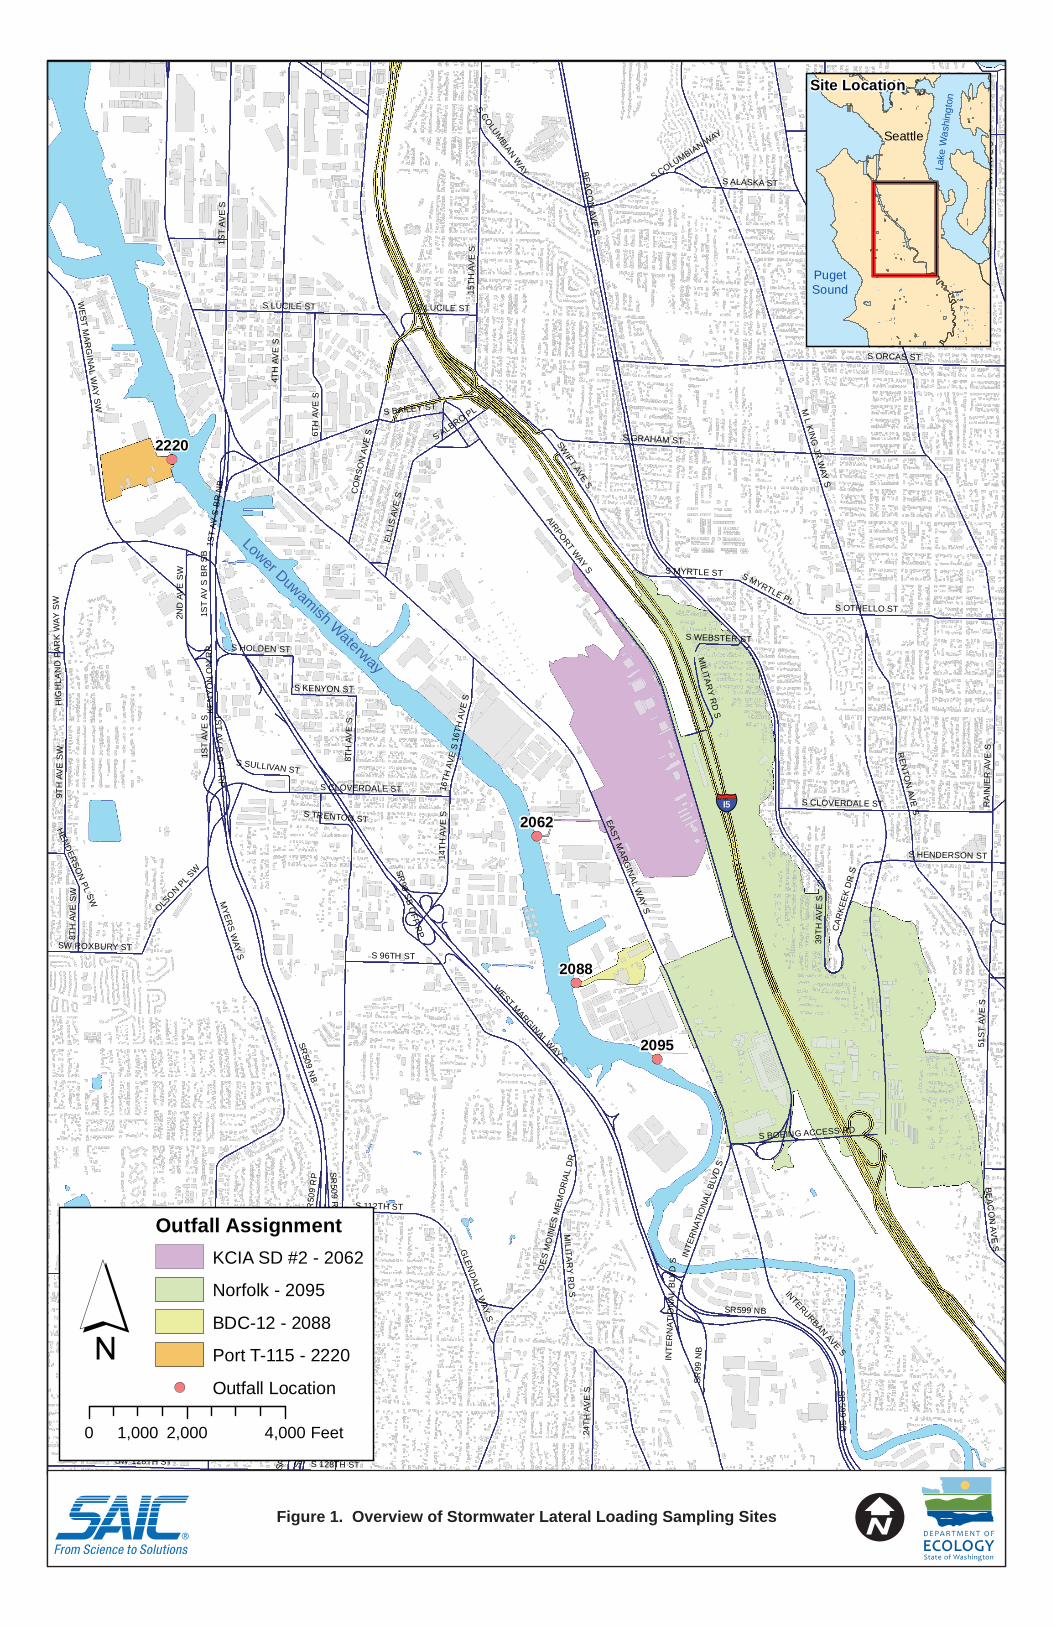
The four outfalls to be sampled include one outfall each owned by the City of Seattle, King County, Port of Seattle, and a private business entity. The goal is to sample stormwater from a variety of land uses in different basins. Individual outfalls and their drain lines are identified in this report by their LDW RI identification number (e.g., 2095). Sampling will take place at drain line access locations (manholes) as close to the outfalls as possible. Field reconnaissance conducted between May and June 2009 (SAIC 2009c), and again between September and October 2010, identified outfalls and access locations appropriate for sampling (Table 1, Table 2, Figure 1). Figures 2 through 5 display the drainage basin, drain lines, and sampling access locations for outfalls 2095, 2062, 2220, and 2088, respectively.
3.2 Sampling Events
3.2.1 Storm Event Sampling
Whole water and filtered suspended solids samples will be collected during eight storm events over the course of the 2010 – 2011 sampling season. Targeted storm events will meet the following criteria (Ecology 2007):
• Wet Season: October 1st through April 30th • Rainfall volume: 0.20” minimum, no fixed maximum • Rainfall duration: No fixed minimum or maximum • Antecedent dry period: Less than or equal to 0.02” rain in the previous 24 hours • Inter-event dry period: 6 hours
Each sampling event will be evaluated relative to these criteria. Due to the time and effort required to deploy sampling gear immediately prior to a sampling event, a flexible interpretation of storm event criteria is suggested for this project. It is anticipated that storm event volume may not meet the minimum requirement for all sampled events. In the case that the above criteria cannot be met for a targeted storm event, Ecology will be contacted to discuss whether to proceed with sampling.

Stormwater Lateral Loading Study SAP/QAPP
December 21, 2010 Page 6
3.2.2 Base Flow Sampling
Contaminants may enter the storm drain system during base flow conditions via groundwater infiltration or as a result of unidentified connections to the storm drain system. Whole water and filtered suspended solids will be collected during two base flow events in order to assess the presence of contaminants in base flow and the contribution of contaminants in base flow to outfall discharges. Collection of base flow samples will occur during two periods of little or no precipitation, one event during extended dry conditions and one event between typical storm events. It is anticipated that some of the sampling locations may not have enough base flow to collect a representative sample volume.
3.3 Sampler Design and Installation
This section describes specifications of the samplers being used and the methodology for positioning these devices in the storm drains. The installation and potential maintenance of both the whole water sampling equipment and sediment traps will require confined space entry. Certain components of the sampling systems will remain installed at each sampling location through the entire duration of the sampling season. Sampler installation will vary between locations due to site-specific characteristics (pipe shape, diameter, vault depth, etc.). The whole water sample reservoir and stormwater filtration apparatus for each sampling location will be installed for the duration of the sampled storm event only, and will be removed between sampling events.
3.3.1 Stormwater Sampler and Sensors The general methods outlined in this section for collecting automated stormwater samples are taken from Ecology’s Environmental Assessment Program’s (EAP) standard operating procedures (SOPs) (Ecology 2009a). Specific details on installation and programming of the stormwater samplers can be found in the 6712 Portable Samplers Installation and Operation Guide (Teledyne ISCO 2009), and the 750 Area Velocity Module Installation and Operation Guide (Teledyne ISCO 2007). All field personnel will be familiar with these documents.
Stormwater samples will be collected at each location using an ISCO 6712c automated sampler (Figure 6). Each stormwater sample will be a flow-weighted composite collected in a 2.5-gallon glass carboy located in the base of the ISCO unit. The sample collected in the carboy will consist of equal volume aliquots sampled at predetermined runoff volume intervals. This sampling scheme samples more frequently at higher flow rates, and less frequently at lower flow rates.
Each sampler will be equipped with a Model 750 area velocity flow module capable of measuring flow where submerged, full-pipe, surcharged, and reverse flow conditions may occur. Area velocity flow measurements require the collection of water level, water velocity, and pipe dimensions. The Model 750 module measures water level and velocity (Teledyne ISCO 2007). Pipe dimensions will be measured during sampler deployment by the confined space entry crew. At locations with a suspected tidal influence, a YSI 600 Sonde with a conductivity probe will be connected to the ISCO sampler to measure salinity. Salinity readings will aid in the differentiation of stormwater flow from LDW tidal inflow. However, salinity will not be used as

Stormwater Lateral Loading Study SAP/QAPP
December 21, 2010 Page 7
the primary criterion for identifying tidal inflow, as tidal water moving up the storm drain from the LDW will generally be low salinity surface water.
During sampling, the sampler’s peristaltic pump will pull the stormwater though a Teflon® suction line connected to a stainless steel strainer. Inside the sampler container, the suction line feeds into a small section of silicone line prior to the stormwater being deposited into the carboy.
The strainer and area velocity flow sensor will all be attached to an anchored mounting plate or a scissors ring with a diameter matching the pipe dimensions. Installation will require confined space entry. The flow sensor will be installed so it faces upstream and will be located away from items that may interfere with flow velocity, such as the pump for the collection of filtered suspended solids. The strainer will also be installed facing upstream and situated so that the intake screen is near but not touching the surface of the pipe to avoid excess sediment accumulation.
The strainer must be positioned so that it is completely underwater during storm events, otherwise improper aliquot volumes may be collected due to the presence of air. The suction line and electrical cords will be secured to the side of the pipe using concrete bolts or plastic ties. Care will be taken to make sure the suction line will not kink under higher velocity flows and that no loops are present in the line that can hold residual water or cause disturbances in flow that may affect the flow sensor. Flow through the strainer and suction line will be checked periodically to make sure that neither has become plugged with debris.
While the flow sensor and sample collection strainer will remain installed in the drain line throughout the entire sampling season, the conductivity probe will only be deployed during sampling events. The conductivity probe needs to remain wet to function properly. The probe will be secured inside a small, wide mouth jar that will be deployed along with the suspended solids filtration pump (Section 3.3.2). The jar will continually flush when there is sufficient flow through the drain line, and retain enough residual water to prevent damage to the sensor when flow subsides.
3.3.2 Stormwater Solids Filtration
A stormwater filtered suspended solids collection system will be installed at all sampling locations during sampling events. The design of the filtration system is a condensed version of that used by SAIC for collecting stormwater filtered solids at the North Boeing Field/Georgetown Steam Plant Site (NBF-GTSP) (SAIC 2009d). The filtration units are designed to be deployed at the beginning of each sampling event within the storm drain line, fully contained beneath the manhole cover. The system consists of a direct current (DC) powered bilge pump and float switch connected to a frame which supports two parallel filtration housings and batteries (Figure 7). The weighted pump will sit on the bottom of the storm drain vault while the filtration apparatus will be tethered to the vault access ladder, out of the flowing stormwater.
For each storm event, the 2,000-gph submersible bilge pump will be positioned in the drain line downstream of the flow sensor and strainer of the ISCO sampler. Positioning the pump too close to the flow sensor may interfere with flow measurements. The pump will be well secured in a weighted cage to prevent movement during high flow events.

Stormwater Lateral Loading Study SAP/QAPP
December 21, 2010 Page 8
Unlike the ISCO sampler, the filtration system does not flow-weight samples. Prior to each sampling event, a DC timer on each unit will be set to ensure that filtration only occurs when tidal water is not backed up in the drain line. During the periods when the timer closes the electrical circuit, stormwater flowing along the bottom of the storm drain line will trigger the float switch, activating the bilge pump. The float switch will be situated high enough off of the bottom of the drain line so that it does not activate during base flow conditions. Stormwater will be pushed through the pump hose where the flow is split and forced through two independent filter canisters. Flow totalizers connected to the outflow side of each filter canister will measure the volume of water passing through each filter. Filtered stormwater exits the system through a hose positioned several feet downstream of the pump to avoid re-sampling water. As the filter bags accumulate solids, flow velocity through the system will eventually diminish to the point where fine-grained materials will preferentially be collected. In order to prevent the over-sampling of fine-grained material, an adjustable in-line pressure relief valve is located upstream of the filtration housings.
The filtration housings are each equipped with a 20-inch long, 4-inch diameter filter bag. All bags are made of 5 micron polypropylene felt, pressure rated to 15 psi. This parallel system allows for the concurrent collection of two discrete storm drain solids samples representative of the storm event. Each of the filter bags will be restricted in the compound classes which can be analyzed, as independent whole bag extractions are required for PCB Aroclor, semi-volatile organic compound (SVOC), dioxin/furan congener, and PBDE analysis.
3.3.3 Sediment Trap
A modified Ecology-designed sediment trap (Figure 8) will be used for this study. The trap consists of a stainless steel bracket which holds a one-liter Teflon® sample bottle. The traps will be mounted to the wall of the drain line pipe or vault. Ideally, the bracket should be installed at a height at which the top of the bottle is above water level due to tides or base flow. Due to the low elevations of the drain lines being sampled, it may not be possible to ensure the traps do not become submerged during high tidal stages.
The trap bracket will be attached to the drain pipe or the vault wall using either epoxy or by mounting it to studs installed by the confined space entry crew (Figure 9). If neither of these installation options is feasible, the bracket may be attached to the scissors ring that holds the ISCO flow meter and suction line. Two sediment traps will be installed per location to ensure sufficient quantity of sediment is collected in a timely manner. The traps will be deployed for the entire sampling season.
3.4 Preliminary Data Collection
After confined space entry equipment installation has occurred, but before the first sampling event, a preliminary data collection period will take place. The deployed sensors will be allowed to collect drain line water depth, velocity, and conductivity data over the course of multiple days and at least one storm event. These data will be used to determine:
• The tidal height at which the drain line becomes inundated with tidal water, • The expected flow volume for a known storm event, and • A rainfall/runoff relationship for each outfall sub-basin.

Stormwater Lateral Loading Study SAP/QAPP
December 21, 2010 Page 9
This information will aid in programming both the ISCO whole water samplers (Section 3.5.3) and filtered suspended solids samplers (Section 3.5.4).
3.5 Sample Collection and Handling Methods
This section describes the methodology for equipment decontamination and sample collection for the proposed field investigation.
3.5.1 Equipment Decontamination Prior to field mobilization, all sampling equipment and utensils will be thoroughly decontaminated. Analytical Resources, Inc. (ARI) will be responsible for the decontamination of the whole water sample carboys. After each sampling event, field staff will complete the Equipment Cleaning Sheet and submit it to ARI with the filled carboy. Decontamination will be in accordance with Puget Sound Estuary Program (PSEP 1997) protocols (i.e., washed with Liquinox™ soap and water, rinsed with fresh water, and rinsed with distilled water). The Teflon® suction line, strainer, filter bags, and sediment trap bottles will be all new materials. The suction lines will not be decontaminated between storm events because they are dedicated to a location and are semi-permanently installed. Prior to each sampling event the ISCO will automatically purge the suction line with site water. Stormwater filtration equipment will be flushed with tap water between sampling events to remove any residual solids from the system.
All hand work will be conducted with phthalate-free disposable gloves, which will be changed after handling each individual sample, as appropriate, and between sampling locations to prevent cross contamination between samples.
3.5.2 Storm Tracking
The sample collection process begins with precipitation monitoring. Precipitation can be tracked online through the Seattle Boeing Field (KBFI) rain gauge at http://www.wrh.noaa.gov/mesowest/getobext.php?wfo=sew&sid=KBFI&num=48&raw=0&dbn=m. Once the required 24-hour dry period is achieved, the stormwater sampling team will begin to monitor for potential storm conditions. The National Oceanic and Atmospheric Administration (NOAA) website offers a Quantitative Precipitation Forecast for 6-hour increments: http://www.wrh.noaa.gov/forecast/wxtables/index.php?lat=47.5405059&lon=-122.3045438&table=custom&duration=7&interval=6. When the forecasts indicate that a storm is coming that is likely to meet the 0.2-inch criterion, the sampling team will begin preparations for sampling.
3.5.3 Whole Water Sample Collection
Flow-weighted whole water samples will be collected by ISCO samplers based on computer programs specific to both the sampling location and predicted storm event. Because some of the proposed sampling locations are tidally influenced, sample aliquots should only be collected when the tidal height is less than the elevation of the drain line at the sampling location. Elevations of drain lines were determined for each sampling location during field reconnaissance (Table 2). ISCO samplers will be programmed to initiate/terminate sampling based on these drain line elevations and predicted daily tidal levels in the LDW. Additionally, sensors will be
Stormwater Lateral Loading Study SAP/QAPP
December 21, 2010 Page 10
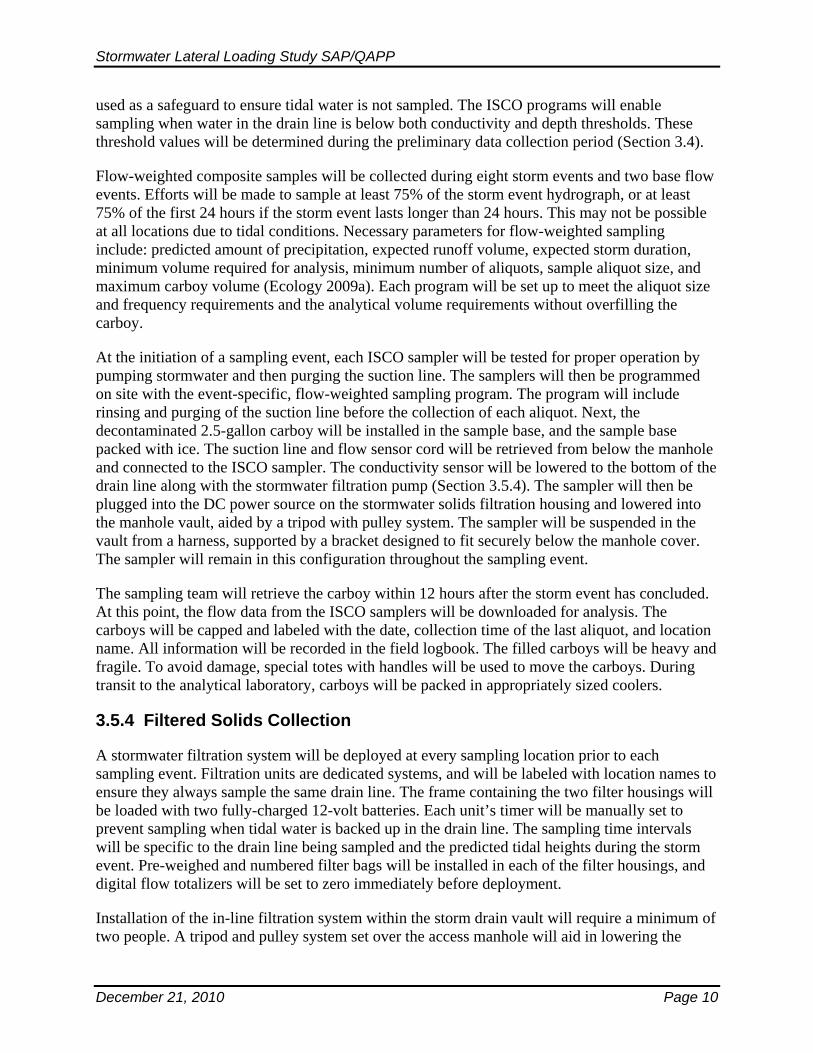
used as a safeguard to ensure tidal water is not sampled. The ISCO programs will enable sampling when water in the drain line is below both conductivity and depth thresholds. These threshold values will be determined during the preliminary data collection period (Section 3.4).
Flow-weighted composite samples will be collected during eight storm events and two base flow events. Efforts will be made to sample at least 75% of the storm event hydrograph, or at least 75% of the first 24 hours if the storm event lasts longer than 24 hours. This may not be possible at all locations due to tidal conditions. Necessary parameters for flow-weighted sampling include: predicted amount of precipitation, expected runoff volume, expected storm duration, minimum volume required for analysis, minimum number of aliquots, sample aliquot size, and maximum carboy volume (Ecology 2009a). Each program will be set up to meet the aliquot size and frequency requirements and the analytical volume requirements without overfilling the carboy.
At the initiation of a sampling event, each ISCO sampler will be tested for proper operation by pumping stormwater and then purging the suction line. The samplers will then be programmed on site with the event-specific, flow-weighted sampling program. The program will include rinsing and purging of the suction line before the collection of each aliquot. Next, the decontaminated 2.5-gallon carboy will be installed in the sample base, and the sample base packed with ice. The suction line and flow sensor cord will be retrieved from below the manhole and connected to the ISCO sampler. The conductivity sensor will be lowered to the bottom of the drain line along with the stormwater filtration pump (Section 3.5.4). The sampler will then be plugged into the DC power source on the stormwater solids filtration housing and lowered into the manhole vault, aided by a tripod with pulley system. The sampler will be suspended in the vault from a harness, supported by a bracket designed to fit securely below the manhole cover. The sampler will remain in this configuration throughout the sampling event.
The sampling team will retrieve the carboy within 12 hours after the storm event has concluded. At this point, the flow data from the ISCO samplers will be downloaded for analysis. The carboys will be capped and labeled with the date, collection time of the last aliquot, and location name. All information will be recorded in the field logbook. The filled carboys will be heavy and fragile. To avoid damage, special totes with handles will be used to move the carboys. During transit to the analytical laboratory, carboys will be packed in appropriately sized coolers.
3.5.4 Filtered Solids Collection
A stormwater filtration system will be deployed at every sampling location prior to each sampling event. Filtration units are dedicated systems, and will be labeled with location names to ensure they always sample the same drain line. The frame containing the two filter housings will be loaded with two fully-charged 12-volt batteries. Each unit’s timer will be manually set to prevent sampling when tidal water is backed up in the drain line. The sampling time intervals will be specific to the drain line being sampled and the predicted tidal heights during the storm event. Pre-weighed and numbered filter bags will be installed in each of the filter housings, and digital flow totalizers will be set to zero immediately before deployment.
Installation of the in-line filtration system within the storm drain vault will require a minimum of two people. A tripod and pulley system set over the access manhole will aid in lowering the

Stormwater Lateral Loading Study SAP/QAPP
December 21, 2010 Page 11
filtration system components. After connecting the bilge pump to the timer, the weighted pump cage will be lowered by hand to the bottom of the drain line using a rope. The deployment rope will be tied securely to the manhole access ladder. The filter frame (attached to the pump cage by the pump hose, electrical leads, and tether line) will simultaneously be lowered into the vault using the tripod setup. The filter frame will be secured to the manhole access ladder with a 4-point harness. The position of the filter frame will be low enough in the vault so that it does not interfere with the installation of the ISCO sampler, and high enough in the vault to not impede stormwater flow through the drain line.
At the completion of the sampling event, the sampling team will retrieve the filtration system along with the ISCO sampler. The filtration system will be completely removed from the drain line at the completion of sampling. Residual water in the filtration housings following sampling adds approximately 70 lbs to the weight of the filter frame. The surface tripod and pulley system will be used to lift the filtration system out of the vault. Drain valves in the bottom of the filtration housings will then be opened to allow remaining filtrate to drain down the manhole into the drain line. Filter bags will be removed from the filter housings, squeezed of their excess water, and placed into the same labeled sample bags that they were removed from prior to sampling. These bags will be labeled with the sample location name, filtered volume, and date. All information will be recorded in the field logbook. Collected filters will be stored on ice until delivery to the analytical laboratory. Following sampling, the filtration systems will be taken back to SAIC’s warehouse to be flushed and have their batteries recharged.
3.5.5 Sediment Trap Sample Collection
Two sediment traps will be installed at each location by a confined space entry crew at the beginning of the sampling and left to collect sediment until the end of the final sampling event. At the end of the final sampling event, the confined space entry crew will be utilized to cap the collection bottles with Teflon®-lined caps, remove the bottles from the mounting brackets, and remove the brackets from the drain lines. Sample bottles will be labeled with the location name and recovery date. Sediment trap samples will be sent to the analytical laboratory, where all sediment from a single location will be composited and homogenized.
3.5.6 Catch Basin Solids Grab Sample Collection
Up to eight catch basin solids grab samples will be collected during the sampling season. These samples will be collected at opportunistic times when there is limited water flow through the drain lines. Sampling will likely occur during mobilization/demobilization of a sampling event. Catch basin solids grab samples will be collected twice at each of the sampling locations. If catch basin solids are not present at a designated sampling location, an attempt will be made to collect the sample from an alternate access location along the drain line.
Catch basin solids grab samples will be collected with a decontaminated stainless steel scoop at the end of a long arm. Once brought to the surface, material greater than 2 centimeters in diameter will be removed. The remaining solids will be transferred from the scoop to glass sample jars using stainless steel spoons. If possible, solids from multiple locations in each catch basin (corners, depressions, etc.) will be composited to form a sample representative of the location. Sample jars will be labeled with the location name and recovery date.
Stormwater Lateral Loading Study SAP/QAPP
December 21, 2010 Page 12
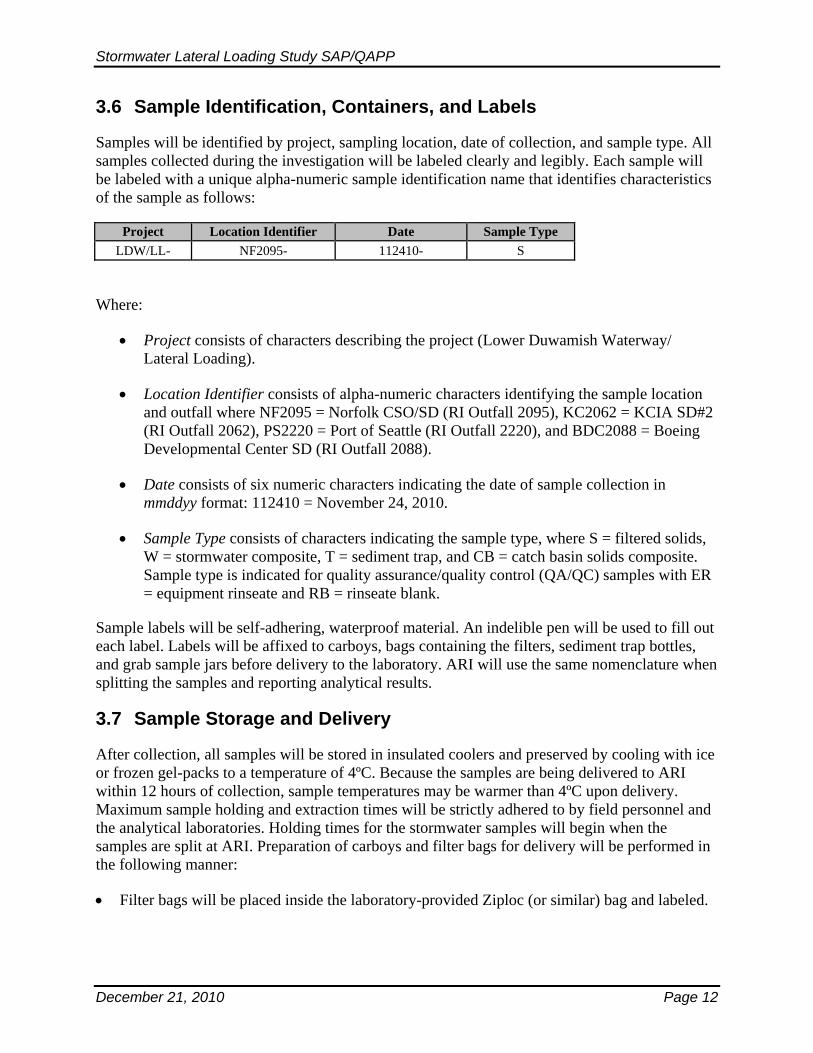
3.6 Sample Identification, Containers, and Labels
Samples will be identified by project, sampling location, date of collection, and sample type. All samples collected during the investigation will be labeled clearly and legibly. Each sample will be labeled with a unique alpha-numeric sample identification name that identifies characteristics of the sample as follows:
Project Location Identifier Date Sample Type LDW/LL- NF2095- 112410- S
Where:
• Project consists of characters describing the project (Lower Duwamish Waterway/ Lateral Loading).
• Location Identifier consists of alpha-numeric characters identifying the sample location and outfall where NF2095 = Norfolk CSO/SD (RI Outfall 2095), KC2062 = KCIA SD#2 (RI Outfall 2062), PS2220 = Port of Seattle (RI Outfall 2220), and BDC2088 = Boeing Developmental Center SD (RI Outfall 2088).
• Date consists of six numeric characters indicating the date of sample collection in mmddyy format: 112410 = November 24, 2010.
• Sample Type consists of characters indicating the sample type, where S = filtered solids, W = stormwater composite, T = sediment trap, and CB = catch basin solids composite. Sample type is indicated for quality assurance/quality control (QA/QC) samples with ER = equipment rinseate and RB = rinseate blank.
Sample labels will be self-adhering, waterproof material. An indelible pen will be used to fill out each label. Labels will be affixed to carboys, bags containing the filters, sediment trap bottles, and grab sample jars before delivery to the laboratory. ARI will use the same nomenclature when splitting the samples and reporting analytical results.
3.7 Sample Storage and Delivery
After collection, all samples will be stored in insulated coolers and preserved by cooling with ice or frozen gel-packs to a temperature of 4ºC. Because the samples are being delivered to ARI within 12 hours of collection, sample temperatures may be warmer than 4ºC upon delivery. Maximum sample holding and extraction times will be strictly adhered to by field personnel and the analytical laboratories. Holding times for the stormwater samples will begin when the samples are split at ARI. Preparation of carboys and filter bags for delivery will be performed in the following manner:
• Filter bags will be placed inside the laboratory-provided Ziploc (or similar) bag and labeled.

Stormwater Lateral Loading Study SAP/QAPP
December 21, 2010 Page 13
• An empty insulated cooler will be prepared by placing three to four ice packs at the bottom of the cooler. The wrapped filter bags will be placed in the cooler before transit to ARI for analysis.
• ARI will process and deliver filter bags to Axys Analytical Services Ltd., of Sydney, BC for dioxin/furan congener and PBDE analysis. Prior to shipping the filter bags to Axys, the headspace in the cooler will be packed with bubble wrap. COC forms will be enclosed in a plastic bag and taped to the inside lid of the cooler. The cooler will be wrapped with strapping tape, and signed COC seals will be taped across the cooler lid.
• Sample carboys will be carried using totes with handles. When in transit, carboys will be placed in a well padded cooler or similar hard-bodied protective structure.
• Samples for chemical analysis will be hand-couriered to ARI upon completion of sampling. The COC will be signed by the individual relinquishing samples to the onsite laboratory representative. Upon receipt of samples at the laboratory, the condition of the samples will be recorded by the receiver. The field personnel will be responsible for the following:
o Packaging the samples, o Signing the COC before placing inside the cooler or delivering to ARI staff, and o Notifying the laboratory of when the samples are being delivered.
3.8 Documentation
This section describes the record of field activities and documentation associated with the transfer of samples that will be maintained throughout the study.
3.8.1 Field Logbooks
Documentation necessary to meet QA objectives for this project include field notes and field forms, sample container labels, and COC forms. The field documentation will provide descriptions of all sampling activities, sampling personnel, and weather conditions, and will record all modifications, decisions, and/or corrective actions to the study design and procedures identified in this SAP.
Field logbook(s) will be kept on site during field operations. Daily activities will be recorded in a bound field logbook of water-resistant paper. All entries will be made legibly, in indelible ink, and will be signed and dated. Information recorded will include the following:
• Date, time, place, and location of sampling; • Onsite personnel and visitors; • Daily safety discussion and any safety issues; • Field measurements (depth to base flow conditions, etc.) and their units; • Observations about site, location, and samples (weather, odors, appearance, etc.); • Equipment decontamination verification; • Identification names of samples collected; and

Stormwater Lateral Loading Study SAP/QAPP
December 21, 2010 Page 14
• For filtered suspended solids, a record of the filter number (assigned by ARI) used at each location, the volume of water passed through the filter, and the time program used to collect filtered suspended solids.
Field logbooks are intended to provide sufficient data and observations to enable participants to reconstruct events that occur during project field activities. Entries will be factual, detailed, and objective. Unless restricted by weather conditions, all original data recorded in field logbooks and on sample identification tags, COC records, and field forms will be written in waterproof ink. If an error is made, the individual responsible may make corrections simply by crossing out the error and entering the correct information. The erroneous information will not be obliterated. All corrections must be initialed and dated. All documentation, including voided entries, must be maintained within project files.
3.8.2 Chain-of-Custody Procedures
The field crew will retain samples at all times until contractor personnel deliver samples to the appropriate laboratory. COC forms will be initiated at the time of sample collection to ensure that all collected samples are properly documented and traceable through storage, transport, and analysis. When all line items on the form are completed or when the samples are relinquished, the sample collection custodian will sign and date the form, list the time, and confirm the completeness of all descriptive information contained on the form. Each individual who subsequently assumes responsibility for the sample will sign the COC form and provide the reason for assuming custody. The field chain-of-custody terminates when the laboratory receives the samples. The field manager will retain a copy of the completed, signed, COC form(s) for project files.
3.9 Laboratory Analyses
All of the chemical and physical analytical procedures used in this program will be performed by subcontracted laboratories in accordance with Ecology guidelines as outlined below. The laboratory analysis for storm drain solids will be consistent with Ecology’s Sediment Sampling and Analysis Plan Appendix (Ecology 2008). Each laboratory participating in this program will institute internal QA/QC plans. Analyses will be required to conform to accepted standard methods and internal QA/QC checks prior to final approval. Table 3 presents the number of samples to be analyzed for each sampling event.
3.9.1 Whole Water Analyses
Using a churn splitter or similar device, ARI laboratory staff will distribute proper volumes of homogenized stormwater to bottles for preservation or immediate analysis. At the laboratory, water for the dissolved metals sample will be drawn through a 0.45 µm filter. Should there be an event where sample volume is insufficient, SAIC will direct ARI in the priority of analysis. If, during the planning phase, it seems likely a sampling event will end on a weekend or during non-business hours, arrangements will be made with ARI staff to ensure that a technician is present to process the samples

Stormwater Lateral Loading Study SAP/QAPP
December 21, 2010 Page 15
Table 4 presents the specific analytes to be measured in the stormwater samples. The analytical methods, method detection limits (MDLs), and acute and chronic marine surface water criteria are also included. The MDLs listed may be subject to modification due to elevated sample concentrations and potential matrix interferences that may preclude obtaining the desired quantification limit. In the event the laboratory is unable to meet the MDLs, the reasons for the deviation will also be reported.
3.9.2 Filtered Suspended Solids Analyses
Two filter bags will be collected at each sampling location for every sampling event. When received by ARI, the wet filter bags will be weighed. Sample splits of the solids will be removed and weighed for metals and grain size analysis. Next, the bags and remaining solids will be dried and weighed again, with and without the filter bag ring. The filter bags and solids, minus the ring, will be extracted for either PCB Aroclors, dioxin/furan congeners, or PBDEs. In the case of SVOC analysis, filter bags will not be dried due to their volatility. Analytical results for these compounds will be reported in units of µg/filter bag and will have to be back calculated to µg/kg sediment based on the dry weight of the filter bag. Results will not be organic carbon-normalized, as total organic carbon (TOC) cannot be measured in the filtered suspended solids due to interference from the polypropylene filter bag.
Table 5 presents the specific chemical analytes and conventional parameters to be measured in the filtered suspended solids along with the associated sample preparation methods, analytical methods, and MDLs. In Table 5, Sediment Management Standards (SMS) numeric criteria (Sediment Quality Standards [SQS] and Cleanup Screening Levels [CSL]) (Chapter 173-204 WAC) are listed for metals and ionizable organic compounds, and the lowest apparent effects threshold (LAET), which is functionally equivalent to the SQS, or the second lowest apparent effects threshold (2LAET), which is functionally equivalent to CSL, are listed for PCB Aroclors and SVOCs (Barrick et al. 1988). As with the whole water analysis, the MDLs listed may be subject to modification due to elevated sample concentrations, heterogeneous samples, and potential matrix interferences that may preclude obtaining the desired quantification limit.
In addition to the analytes listed in Table 5, dioxin/furan congeners and PBDEs will also be analyzed in selected storm event samples (Table 4). At the direction of SAIC, ARI will ship dried filter bags to Axys Analytical of Sydney, British Columbia, for these analyses. Analysis of dioxins/furans will follow EPA Method 1613B for 2,3,7,8-substituted chlorinated dioxins and furans (Table 6) and PBDEs will be analyzed by EPA Method 1614 (Table 7). The concentration of dioxin/furan compounds will be normalized to the toxicity of 2,3,7,8-TCDD (tetrachlorodibenzo-p-dioxin) using toxic equivalency factors (TEFs) updated by the World Health Organization (WHO) in 2005 (Van den Berg et al. 2006). The toxic equivalent (TEQ) is equal to the sum of the concentrations of individual congeners multiplied by their TEF (potency relative to 2,3,7,8-TCDD). Non-detected values will be assessed as 0, ½, and 1 times the method detection limit for data evaluation purposes.
3.9.3 Sediment Trap Solids Analyses
In addition to the analytes listed in Tables 5 through 7, additional analytes that will be quantified in sediment trap solids samples are presented in Table 8. Chemistry data results will be compared

Stormwater Lateral Loading Study SAP/QAPP
December 21, 2010 Page 16
to SMS criteria when TOC is greater than 0.5 percent and less than 4.0 percent. When TOC is outside of this range, chemistry data results will be compared to the LAET and 2LAET.
3.9.4 Catch Basin Solids Sample Analyses
Catch basin solids grab samples will undergo all of the same analyses as sediment trap samples (Section 3.9.3).
3.9.5 Analytical Laboratory Reporting
Analytical laboratory reports will be accompanied by sufficient backup data and QC results to enable independent reviewers to evaluate the quality of the data results. Analytical data will be reported in the units specified by the MDLs listed in Tables 4 through Table 8.
The analytical laboratory deliverables will include the following:
• MDLs and method reporting limits (MRLs) for each sample; • Laboratory qualifier codes appended to analyte concentrations and a summary of code
definitions; • Case narrative (including any problems encountered, protocol modifications, and/or
corrective actions taken); • Sample analytical and QA/QC results with units; • All protocols used during analyses; • Any protocol deviations from the approved sampling plan; • Surrogate recovery results; • Matrix spike/matrix spike duplicate (MS/MSD) results when analyzed; • Laboratory duplicate/triplicate results; • Blank results; • Sample custody records (including original COC forms); and • Analytical results in Environmental Information Management (EIM) format.

Stormwater Lateral Loading Study SAP/QAPP
December 21, 2010 Page 17
4.0 Quality Assurance Project Plan
The purpose of the project QAPP is to provide confidence in the project data results through a system of quality control performance checks with respect to data collection methods, laboratory analysis, data reporting, and appropriate corrective actions to achieve compliance with established performance, and data quality criteria. This section presents the QA/QC procedures to ensure that the investigation data results are defensible and usable for their intended purpose.
4.1 Measurements of Data Quality
The tolerable limits for the data reported by the laboratory will be measured with precision, accuracy, representativeness, completeness, and comparability as described below.
Precision is a measure of mutual agreement among individual measurements of the same property under prescribed conditions. Precision will be assessed by the analysis of MS/MSDs, ongoing precision and recovery/ongoing precision and recovery duplicates (OPR/OPRD), and laboratory control sample/laboratory control sample duplicates (LCS/LCSD). The calculated relative percent differences (RPDs) for MS/MSD pairs will provide information on the precision of sampling and analytical procedures, and the RPDs for OPR/OPRD and LCS/LCSD pairs will provide information on precision of the analytical procedures. MS/MSD samples cannot be run on the filtered suspended solids because the filter bag must be extracted as one sample (subsamples cannot be cut from the filter bag).
Accuracy is the degree to which an observed measurement agrees with an accepted reference or true value. Accuracy is a measure of the bias in the system and is expressed as the percent recoveries of spiked analytes in MS/MSD and LCS/LCSD samples. Accuracy will also be evaluated through the surrogate spikes in each sample. The laboratory control limits for surrogates will be used for the project.
Representativeness expresses the degree to which data accurately and precisely represent an actual condition or characteristic at a particular sampling point. Representativeness is achieved by collecting samples representative of the matrix at the time of collection. Representativeness is generally evaluated through the analysis of field replicates and laboratory blanks. Field replicates will not be collected as a part of this study due to the addition equipment that would be required for their collection. Therefore, only blanks will be used to assess representativeness.
Completeness refers to the amount of measurement data collected relative to that needed to assess the project’s technical objectives. It is calculated as the number of valid data points achieved divided by the total number of data points requested by virtue of the study design.
Comparability is based on the use of established EPA-approved methods for the analysis of the selected parameters. The quantification of the analytical parameters is based on published methods, supplemented with well-documented procedures used in the laboratory to ensure reproducibility of the data.
Stormwater Lateral Loading Study SAP/QAPP
December 21, 2010 Page 18
4.2 QA/QC for Chemistry Samples
Field and laboratory QA/QC samples will be used to evaluate the data precision, accuracy, representativeness, and comparability of the analytical results. The field QA/QC samples to be collected are described in Section 4.2.1. The laboratory QA/QC samples are discussed in Section 4.2.2.
4.2.1 Field QA/QC for Water and Sediment Chemistry
Field QA/QC samples will be collected during sampling to quantitatively measure and ensure the quality of the sampling effort and the analytical data. QA/QC samples are to be handled in the same manner as the environmental samples collected. Field QA/QC samples include equipment rinseate and rinseate blanks. Equipment rinseates provide a quality control check on the potential for cross contamination by measuring the effectiveness of the sampling and decontamination procedures. The equipment rinseate sample consists of reagent grade water provided by ARI rinsed across sample collection and processing equipment. Equipment rinseates will be collected from the stormwater sampling equipment (Teflon® suction line, pump, and sample carboy). Equipment rinseates and rinseate blanks will be collected at the beginning and end of the sampling season.
4.2.2 Laboratory QA/QC for Water and Sediment Chemistry
MS/MSD samples for each analytical batch of samples will be analyzed SVOCs, pesticides, PCBs, metals, and TOC. The combination of these spiked samples will provide information on the accuracy and precision of the chemical analysis, and to verify that the extraction and measured concentrations are acceptable. The MS/MSDs will be analyzed in accordance with EPA methods for each respective analyte.
One laboratory method blank and LCS will be analyzed for all constituents (except water quality parameters and grain size) for each analytical batch to assess potential laboratory contamination and accuracy. An LCSD will be analyzed if required by the method, or if the laboratory does not have enough sample volume to prepare an MS/MSD.
Laboratory control samples, certified reference material, and surrogate spikes will be used as defined by the analytical methods and equipment calibration requirements. One certified reference material will be analyzed for dioxin/furan congeners.
4.3 Data Validation
The data generated as part of this investigation will undergo an independent Level III quality assurance review and data validation by EcoChem, Inc., of Seattle, WA. If data fail the review, the laboratory will be contacted and the data will be (a) reanalyzed, (b) qualified, or (c) unqualified with an explanation. For each data type, the quality of the data will be summarized in validation memos.
The analytical laboratory will provide Level III validation data packages that will allow for the examination of the complete analytical process from calculation of instrument and method
Stormwater Lateral Loading Study SAP/QAPP
December 21, 2010 Page 19
detection limits, practical quantification limits, final dilution volumes, sample size, and wet-to-dry ratios to quantification of calibration compounds and all analytes detected in blanks and environmental samples (PTI 1989).
EcoChem will validate the data as analysis is completed and submit the validated data to SAIC in an electronic deliverable. The final validation report including all events will be issued after the completion of the last round of sampling.

Stormwater Lateral Loading Study SAP/QAPP
December 21, 2010 Page 20
5.0 Data Analysis The purpose of this section is to describe the methods which will be used to evaluate data collected as a part of this study.
5.1 Analysis of Water and Solids Chemistry Data
The chemical data results for stormwater and solids will include comparison of the results to the marine water quality criteria (Table 4) and SMS numeric criteria (Table 5), respectively. The water and sediment chemistry data will be summarized and presented in tables indicating locations, detected contaminants, and any detection limits that exceed numeric criteria, along with any data qualifiers assigned by the laboratory or during the data validation efforts.
5.2 Comparison of Solids Sampling Methods
The chemical results for storm drain solids collected by stormwater filtration, sediment traps, and catch basin solids grab samples will be compared to determine their similarity. Each of the solids collection methods is not only representative of a different sampling interval, but also different physical properties that allow the sample material to accumulate.
Filtered suspended solids will be collected for individual storm events, where particle entrainment by the pump is likely to be unrelated to particle settling characteristics. The sediment trap samples integrate particles traversing the drain lines for the entire sampling season. Due to the height of the sediment trap bottle mouth above the drain line bottom, particles will only be deposited in the traps during deep water conditions caused by high stormwater flow volume or tidal inundation. Catch basin solids grab samples likely reflect intermittent deposition between large flushing events.
Comparing the results of the different sampling methods will allow an assessment of whether sediment traps and/or grab samples are useful and inexpensive tools to collect storm drain solids for use in lateral loading calculations.
5.3 Lateral Loading Calculations
Stormwater discharges have the potential to contribute to the contamination of LDW sediments, particularly in the vicinity of stormwater outfalls. To predict whether localized sediment contamination to levels above SMS or other approved cleanup standards is likely to occur, estimates of stormwater contaminant loads are needed for input into fate and transport estimation tools and models. Loadings are the product of an outfall’s annual discharge volume and annual mean concentration. Loadings will be calculated using the general methods presented in Ecology’s Standard Operating Procedure for Calculating Pollutant Loads for Stormwater Discharges (Ecology 2009b).
5.3.1 Stormwater Discharge Volume
Both annual and event-based stormwater discharge volumes used to calculate chemical loadings will be estimated using modeled rather than measured flow. The surface area of each lateral line

Stormwater Lateral Loading Study SAP/QAPP
December 21, 2010 Page 21
sub-basin drainage will be calculated using GIS software. Thiessen polygon analysis of storm drain structure shapefiles will be used to determine probable drainage boundaries. In order to take into account the large amounts of impervious surface found in these drainages, the surface areas will be adjusted for the ratio of impervious surface. Annual and event-based stormwater discharge volumes will be calculated with the following equations based on the Ecology SOP (Ecology 2009b):
V = (P/12) * A * RC
Where:
• V is the discharge volume for the sub-basin in units of cubic feet. • P is precipitation (annual or event) in units of inches. • A is the drainage sub-basin surface area in units of square feet. • RC is the runoff coefficient for sub-basin. RC = 0.009 * IMP + 0.05
Where:
• IMP is the percent impervious surface for the drainage sub-basin.
Measured flow volumes for storm events will not be used to directly calculate stormwater discharge volumes because of the intertidal nature of some of the sampled drain lines. Rising and falling tides influence both water velocity and depth measured by the flow sensor, leading to errors in stormwater volume estimates. Storm event flow data collected during time periods when drain lines are not tidally influenced will be used to assess the accuracy of the runoff coefficient used to estimate runoff volume.
5.3.2 Annual Mean Contaminant Concentration
Loadings for both whole water and filtered suspended solids will be calculated separately. Annual mean concentrations in both whole water and filtered suspended solids will be calculated using a volume-weighted mean approach:
( )∑
∑ ∗=
i
ii
FFC
AMC
Where:
• AMC is the annual mean contaminant concentration. • Ci is the concentration for storm or base flow event i. • Fi is the average flow for storm or base flow event i (total event discharge volume divided by
sampling time).

Stormwater Lateral Loading Study SAP/QAPP
December 21, 2010 Page 22
5.3.3 Contaminant Loading
Whole water loadings will be calculated using the following equation:
MLw = V * AMC
Where:
• ML is the annual contaminant mass loading from stormwater in units of mg/yr. • V is the annual predicted discharge volume in units of liters/yr. • AMC is the annual mean contaminant concentration of whole water in units of mg/liter.
Contaminant loadings from suspended solids will be calculated using the equation:
MLs = V * AMC * TSS
Where:
• MLs is the annual contaminant mass loading from solids in units of mg/yr. • V is the annual predicted discharge volume in units of liters/yr. • AMC is the annual mean contaminant concentration of suspended solids units of mg/kg. • TSS is the measured mean total suspended solids concentration in units of kg/L.

Stormwater Lateral Loading Study SAP/QAPP
December 21, 2010 Page 23
6.0 Data Reporting
SAIC, with the assistance of NewFields, will prepare a draft and final Stormwater Lateral Loading Report documenting all activities associated with collection, transportation, and chemical analysis of stormwater and storm drain solids samples. The chemical and QA/QC reports will be included as appendices. The written report will summarize the analytical results, flow modeling, and loading calculations.
At a minimum, the following will be included in the Data Report:
• Description of sampling and analysis activities, • Protocols used during sampling and testing and an explanation of any deviations from the
sampling plan protocols or the approved SAP, • Physical descriptions of samples, • Results of data comparisons to regulatory criteria (marine water quality criteria [WAC 173-
201A-240] and SMS criteria [WAC 173-204]), • COC records, • Chemistry testing results and laboratory reports, • QA/QC summary and data compliance reports, • Calculated contaminant lateral loadings to the LDW for the four studied outfalls, • Description of the modeling methods and results, and • Estimates of maximum allowable stormwater contaminant concentrations that will not
contaminate sediments to levels above LDW prescribed cleanup levels.
In addition, the validated chemistry data from the investigation will be entered into Ecology’s EIM database. Information for entering environmental data into EIM can be found on Ecology’s website: http://www.ecy.wa.gov/eim/.
Given the anticipated ending of stormwater sampling (April 2011) and the time required for analysis, data evaluation and modeling, completion of the data deliverable and report, and EIM data entry, completion of the study may require additional time and may not meet the June 30, 2011 deadline. Following completion of the stormwater sampling program, SAIC will coordinate with Ecology to determine and obtain a no-cost period of performance extension to complete the report, if possible and deemed necessary.

Stormwater Lateral Loading Study SAP/QAPP
December 21, 2010 Page 24
7.0 References
Anchor and Integral. 2007. Portland Harbor RI/FS, Round 3A Field Sampling Plan: Stormwater Sampling. Prepared for the Willamette Group by Anchor Environmental, LLC and Integral Consulting Inc. March 1, 2007.
Barrick, R.C., D.S. Becker, L.B. Brown, H. Beller, and R. Pastorak. 1988. Sediment Quality Values Refinement: 1988 Update and Evaluation of Puget Sound AET. Volume I. Final Report. Prepared for tetra tech, Inc., Bellevue, WA, and the U.S. Environmental Protection Agency, Region 10, Seattle, WA. Prepared by PTI Environmental Services, Bellevue, WA.
Ecology. 2007. Phase I Municipal Stormwater Permit. National Pollutant Elimination System and State Waste Discharge General Permit for discharges from Large and Medium Municipal Separate Storm Sewer Systems. Washington State Department of Ecology. Revised September 2010.
Ecology. 2008. Sediment Sampling and Analysis Plan Appendix. Guidance on the Development of Sediment Sampling and Analysis Plans Meeting the Requirements of the Sediment Management Standards (Chapter 173-204 WAC). Washington State Department of Ecology. Publication No. 03-09-043. Revised February 2008.
Ecology. 2009a. Standard Operating Procedure for Automatic Sampling for Stormwater Monitoring. Washington State Department of Ecology. Version 1.0
Ecology. 2009b. Standard Operating Procedure for Calculating Pollutant Loads for Stormwater Dsicharges. Washington State Department of Ecology. Version 1.0
PSEP. 1997. Recommended Protocols for Measuring Selected Environmental Variables in Puget Sound. U.S. Environmental Protection Agency, Region 10, Seattle, WA, for Puget Sound Estuary Program. April 1997.
PTI. 1989. Data validation guidance manual for selected sediment variable. Prepared for the Washington State Department of Ecology, Olympia, WA. PTI Environmental Services, Bellevue, WA.
SAIC. 2009a. Scoping of Lateral Loading Study, Technical Memorandum. Prepared for Washington State Department of Ecology. Prepared by Science Applications International Corporation, Bothell, WA. June 30, 2009.
SAIC. 2009b. Scoping of Lateral Loading Study, Previous Study and Existing Data. Prepared for Washington State Department of Ecology. Prepared by Science Applications International Corporation, Bothell, WA. June 30, 2009.
SAIC. 2009c. Scoping of Lateral Loading Study, Site Reconnaissance Report. Prepared for Washington State Department of Ecology. Prepared by Science Applications International Corporation, Bothell, WA. June 30, 2009.

Stormwater Lateral Loading Study SAP/QAPP
December 21, 2010 Page 25
SAIC. 2009d. North Boeing Field/Georgetown Steam Plant Site Remedial Investigation/Feasibility Study, Sampling and Analysis Plan for Preliminary Stormwater and Filtered Suspended Solids Sampling. Prepared for Washington State Department of Ecology by SAIC, Bothell, Washington; August 2009.
Teledyne ISCO. 2007. 750 Area Velocity Module Installation and Operation Guide. Teledyne ISCO, Lincoln, NE. May 2007. http://www.isco.com/pcfiles/PartPDF4/UP000ZX3.pdf
Teledyne ISCO. 2009. 6712 Portable Samplers Installation and Operation Guide. Teledyne ISCO, Lincoln, NE. March 2009. http://www.isco.com/pcfiles/PartPDF4/UP00130Z.pdf
Van den Berg, M., L.S. Bimbaum, M. Denison, M. De Vito, W. Farland, M. Feeley, H. Fiedler, H. Hakansson, A. Hanberg, L. Haws, M. Rose, S. Safe, D. Schrenk, C. Tohyama, A. Tritscher, J. Tuomisto, M. Tysklind, N. Walker, and R. Peterson. 2005. The 2005 World Health Organization Re-Evaluation of Human and Mammalian Toxic Equivalency Factors for Dioxins and Dioxin-like Compounds. Prepared for the World Health Organization (WHO). ToxSci Advance Access published July 7, 2006. Published by Oxford University Press on behalf of the Society of Toxicology.

Figures
SR50
9 S
B
SR509 N
B
AIRPORT WAY S
8TH
AV
E S
S E
VA R
EINI
AR
EAST MAR
GIN
AL WAY S
BEA
CO
N AV
E S
M L KIN
G JR
WAY S
4TH
AV
E S
S 128TH ST
1ST
AVE
S
SR599 NB
S ORCAS ST
WEST MARGINAL W
AY S
S GRAHAM ST
BS
995
RS
S E
VA HT51
REN
TON
AVE S
S E
VA TS15
SWIFT AVE S
MYER
S WAY S
DES
MO
INES
MEM
OR
IAL
DR
S E
VA HT05
S GENESEE ST
BS
RB
S VA T
S1
S OTHELLO ST
CO
RS
ON
AV
E S
WE
ST M
AR
GIN
AL W
AY SW
9TH
AV
E S
W
1ST
AV S
BR
NB
SW 116TH ST
S E
VA HT6
S CLOVERDALE ST
SW 128TH ST
S E
VA HT42
S ALASKA ST
SR99
NB
INTERURBAN AVE S
ELLI
S AV
E S
S E
VA HT41
S COLUMBIAN W
AY
S 112TH ST
S 96TH ST
S ALBRO PL
GLEN
DALE W
AY S
INTE
RN
ATIO
NA
L B
LVD
S
S HENDERSON ST
OLSON P
L SW
S 116TH ST
HIG
HLA
ND
PA
RK
WAY
SW
16TH
AVE
S
CAR
KEEK
DR
S
2ND
AV
E S
W
S E
VA HT93
S BOEING ACCESS RD
S MYRTLE ST
S E
VA HT83
S LUCILE ST
1ST AV
S O
FF RP
SW ROXBURY ST
S MYRTLE PL
5TH
AV
E S
8TH
AV
E S
W
MILITAR
Y RD
S
S BAILEY ST
SR50
9 R
P
S HOLDEN ST
S KENYON ST
SR99 SB O
FF RP
S SULLIVAN ST
S WEBSTER ST
S TRENTON ST
HEN
DER
SON
PL SW
PR
NO
NO
YN
EK
SR509 R
P
BEA
CO
N AV
E S
S COLUMBIAN WAY
S LUCILE ST
S CLOVERDALE ST
SR50
9 R
P
1ST
AVE
S
INTE
RN
ATIO
NAL
BLV
D S
16TH
AVE
S
8TH
AV
E S
1ST
AVE
S
MILITA
RY R
D S
SR50
9 R
P
§̈¦I5
2220
2095
2088
2062
Site Location
Seattle
Lake
Was
hing
ton
PugetSound
Lower Duwamish Waterway
L. Delwiche, Newfields Oct 2010
´0 2,000 4,0001,000 Feet
Outfall AssignmentKCIA SD #2 - 2062
Norfolk - 2095
BDC-12 - 2088
Port T-115 - 2220
!( Outfall Location
Figure 1. Lower Duwmaish Waterway and Proposed Drainage Basins for Lateral Load Stormwater Sampling
L. Delwiche, NewFields Oct 2010
IFigure 1. Overview of Stormwater Lateral Loading Sampling Sites
A

2095
Lower D
uwam
ish Waterw
ay
L. Delwiche, NewFields Oct 2010 0 2,000 4,0001,000 Feet´ Figure 2. Norfolk Storm Drain Basin and Outfall Location
sampling location
IFigure 2. Norfolk Storm Drain Basin
and Outfall Location
A 0 2,000 4,0001,000 Feet

2062
Lower D
uwam
ish Waterw
ay
L. Delwiche, NewFields Oct 2010 0 1,000 2,000500 Feet´Figure 3. King County International Airport Storm Drain # 2
drainage basin and outfall loation
sampling location
IFigure 2. King County International Airport
Storm Drain #2 Drainage Basin and Outfall Location
A 0 1,000 2,000500 Feet
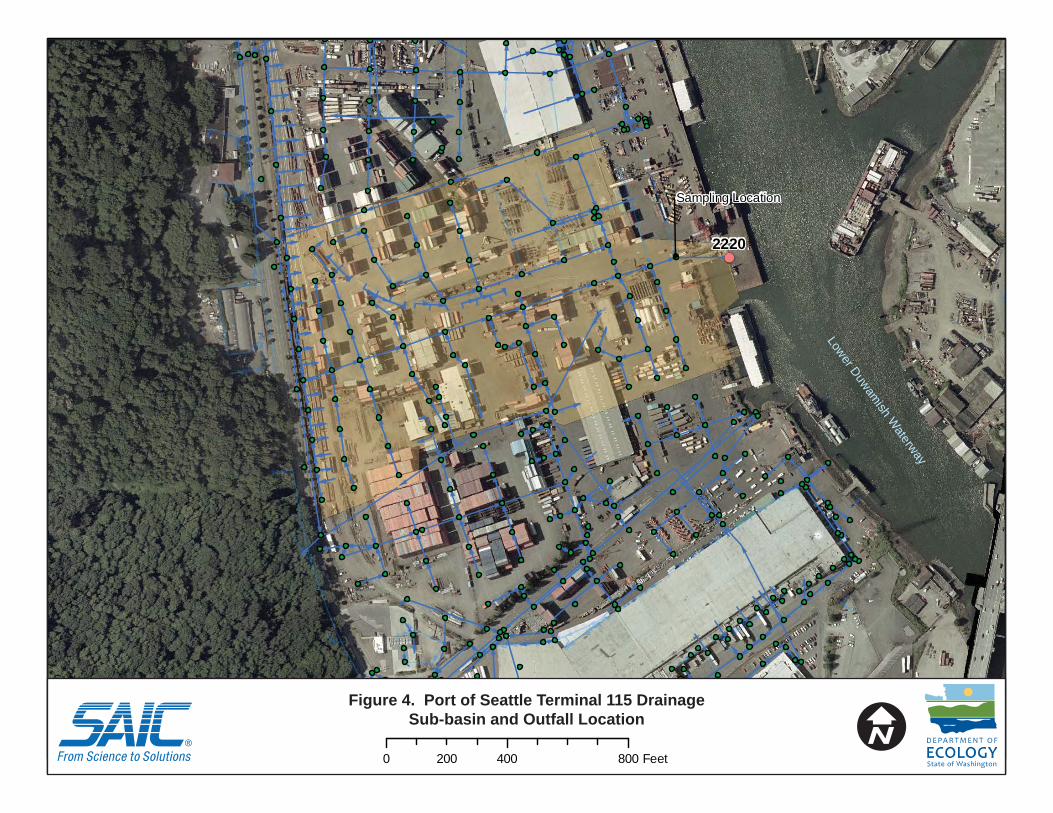
!(2220
Lower Duwamish W
aterway
L. Delwiche, NewFields Oct 2010 0 400 800200 Feet´
Sampling Location
Figure 4. Port of Seattle Terminal 115 Drainage Sub-Basin and Outfall Location IFigure 4. Port of Seattle Terminal 115 Drainage
Sub-basin and Outfall Location
A 0 400 800200 Feet

2088
Lower D
uwam
ish Waterw
ay
L. Delwiche, NewFields Oct 2010 0 250 500125 Feet´ Figure 5. Boeing Developmental Center Storm Drain Basin and Outfall Location
sampling location
IFigure 5. Boeing Developmental Center Storm Drain
Basin and Outfall Location
A 0 250 500125 Feet
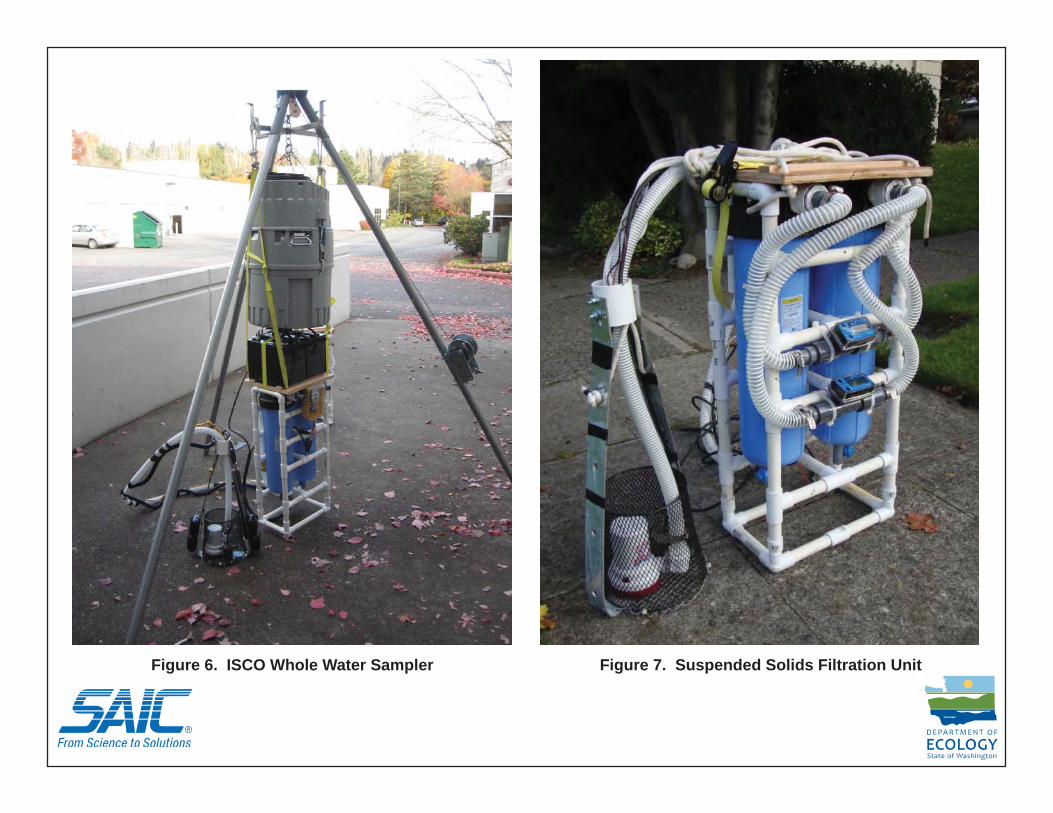
Figure 7. Suspended Solids Filtration UnitFigure 6. ISCO Whole Water Sampler
A

AFigure 9. Sediment Traps Installed
in a Storm Drain Line
Figure 8. Modified Ecology Sediment Trap

Tables

Table 1Stormwater Outfall Information
Owner RI Outfall # Name Easting1 Northing1Elevation (ft MLLW) Outfall Diameter (inch) Opening Cover
City of Seattle 2095 Norfolk CSO/SD 1278630.9 190180.0 5.11 84 TidegateKing County 2062 KCIA SD#2 1276177.3 194741.8 7.29 48 NonePort of Seattle 2220 Port T-115 SD 1268617.0 202385.0 5.38 24 NoneThe Boeing Company 2088 Boeing Developmental Center SD 127694.2 191734.2 7.01 36 Flapper
Notes:1. Washington State Plane North, NAD 83, feetMLLW = mean lower low water
Page 1 of 1

Table 2Storm Drain Access Location Information
C
Owner RI Outfall # Name Easting1 Northing1Elevation of Drain Bo
(feet MLLW)ttom Depth to Drain
Bottom (feet) Manhole Marking
City of Seattle 2095 Norfolk CSO/SD 1279329.6 190822.9 9.1 11.7 Pacific Foundry Co., SeattleKing County 2062 KCIA SD#2 1276793.5 195076.6 7.3 8.5 DRAINPort of Seattle 2220 Port T-115 SD 1268538.7 202443.6 5.4 12.75 DRAINThe Boeing Company 2088 Boeing Developmental enter SD 1277630.6 191977.4 7.1 11.33 DRAIN
Notes:1. Washington State Plane North, NAD 83, feetMLLW = mean lower low water
Page 1 of 1
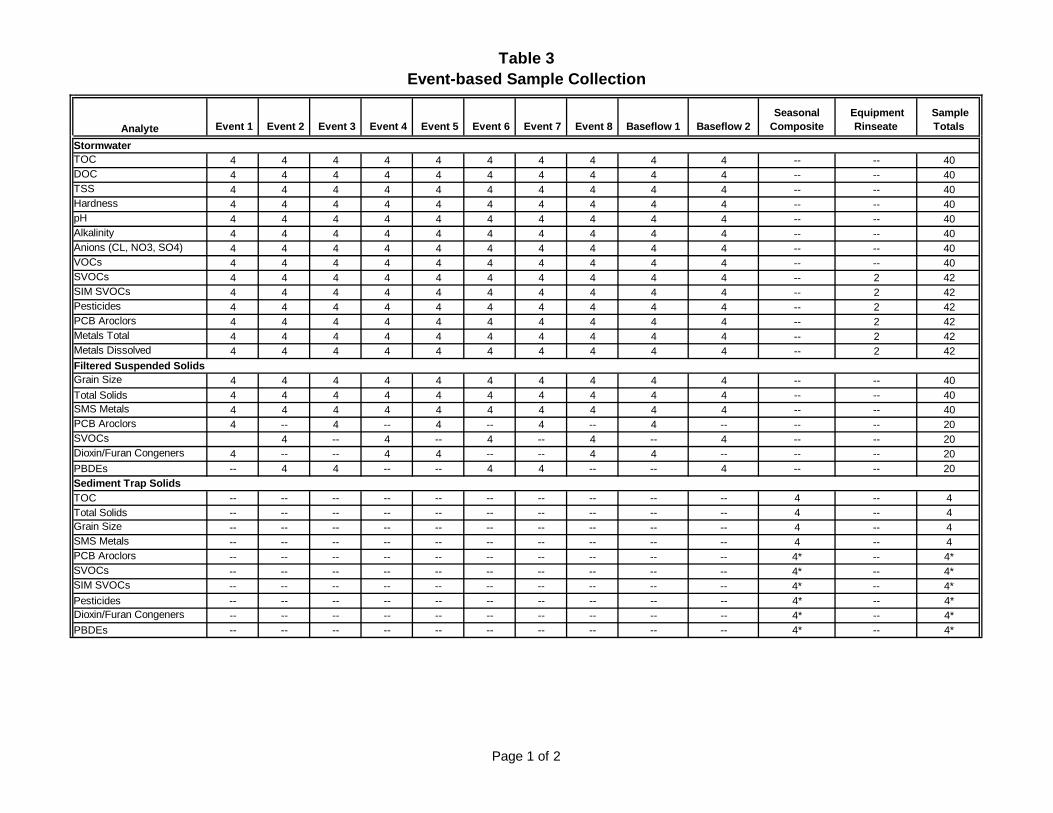
Table 3Event-based Sample Collection
Analyte Event 1 Event 2 Event 3 Event 4 Event 5 Event 6 Event 7 Event 8 Baseflow 1 Baseflow 2Seasonal
Composite Equipment
Rinseate Sample Totals
Stormwater TOC 4 4 4 4 4 4 4 4 4 4 -- -- 40DOC 4 4 4 4 4 4 4 4 4 4 -- -- 40TSS 4 4 4 4 4 4 4 4 4 4 -- -- 40Hardness 4 4 4 4 4 4 4 4 4 4 -- -- 40pH 4 4 4 4 4 4 4 4 4 4 -- -- 40Alkalinity 4 4 4 4 4 4 4 4 4 4 -- -- 40Anions (CL, NO3, SO4) 4 4 4 4 4 4 4 4 4 4 -- -- 40VOCs 4 4 4 4 4 4 4 4 4 4 -- -- 40SVOCs 4 4 4 4 4 4 4 4 4 4 -- 2 42SIM SVOCs 4 4 4 4 4 4 4 4 4 4 -- 2 42Pesticides 4 4 4 4 4 4 4 4 4 4 -- 2 42PCB Aroclors 4 4 4 4 4 4 4 4 4 4 -- 2 42Metals Total 4 4 4 4 4 4 4 4 4 4 -- 2 42Metals Dissolved 4 4 4 4 4 4 4 4 4 4 -- 2 42Filtered Suspended Solids Grain Size 4 4 4 4 4 4 4 4 4 4 -- -- 40Total Solids 4 4 4 4 4 4 4 4 4 4 -- -- 40SMS Metals 4 4 4 4 4 4 4 4 4 4 -- -- 40PCB Aroclors 4 -- 4 -- 4 -- 4 -- 4 -- -- -- 20SVOCs 4 -- 4 -- 4 -- 4 -- 4 -- -- 20Dioxin/Furan Congeners 4 -- -- 4 4 -- -- 4 4 -- -- -- 20PBDEs -- 4 4 -- -- 4 4 -- -- 4 -- -- 20Sediment Trap Solids TOC -- -- -- -- -- -- -- -- -- -- 4 -- 4Total Solids -- -- -- -- -- -- -- -- -- -- 4 -- 4Grain Size -- -- -- -- -- -- -- -- -- -- 4 -- 4SMS Metals -- -- -- -- -- -- -- -- -- -- 4 -- 4PCB Aroclors -- -- -- -- -- -- -- -- -- -- 4* -- 4*SVOCs -- -- -- -- -- -- -- -- -- -- 4* -- 4*SIM SVOCs -- -- -- -- -- -- -- -- -- -- 4* -- 4*Pesticides -- -- -- -- -- -- -- -- -- -- 4* -- 4*Dioxin/Furan Congeners -- -- -- -- -- -- -- -- -- -- 4* -- 4*PBDEs -- -- -- -- -- -- -- -- -- -- 4* -- 4*
Page 1 of 2

Table 3Event-based Sample Collection
Catch Basin SolidsTOC -- -- -- -- -- -- -- -- -- -- 8 -- 8Total Solids -- -- -- -- -- -- -- -- -- -- 8 -- 8Grain Size -- -- -- -- -- -- -- -- -- -- 8 -- 8SMS Metals -- -- -- -- -- -- -- -- -- -- 8 -- 8PCB Aroclors -- -- -- -- -- -- -- -- -- -- 8 -- 8SVOCs -- -- -- -- -- -- -- -- -- -- 8 -- 8SIM SVOCs -- -- -- -- -- -- -- -- -- -- 8 -- 8Pesticides -- -- -- -- -- -- -- -- -- -- 8 -- 8Dioxin/Furan Congeners -- -- -- -- -- -- -- -- -- -- 8 -- 8PBDEs -- -- -- -- -- -- -- -- -- -- 8 -- 8
Notes:* Parameter will be analyzed if sufficient material is collected.
Page 2 of 2
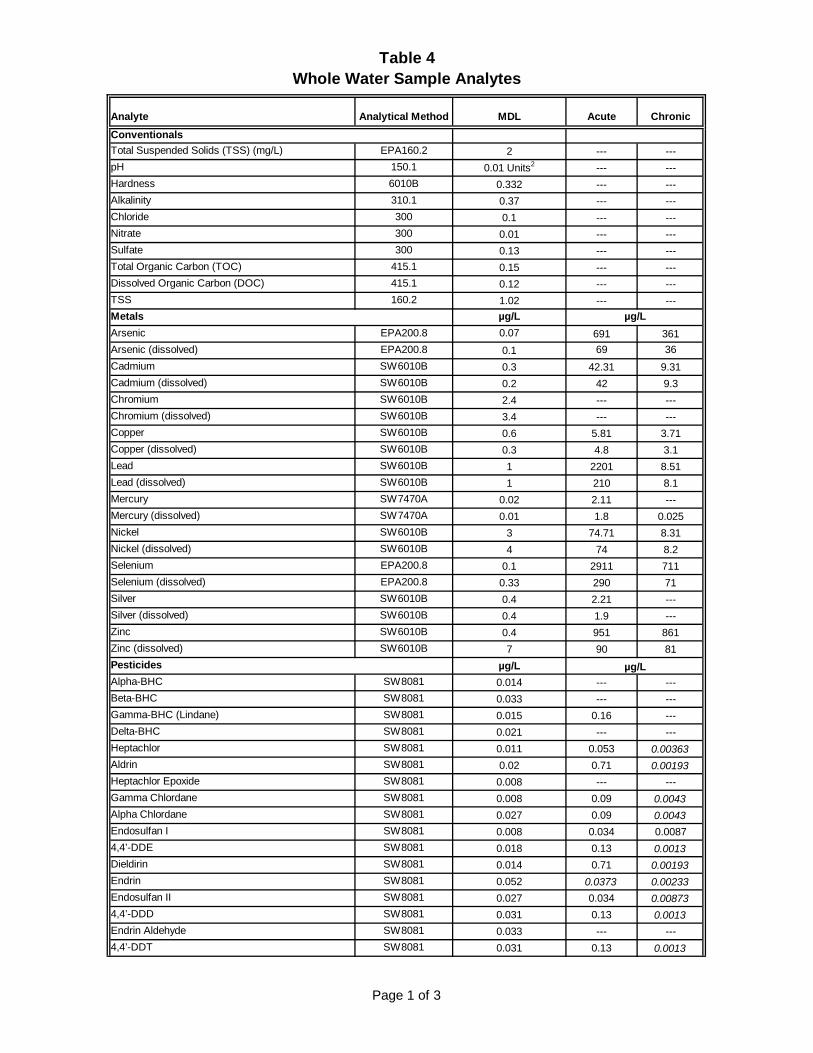
Table 4Whole Water Sample Analytes
Analyte Analytical Method MDL Acute Chronic
Total Suspended Solids (TSS) (mg/L) EPA160.2 2 --- ---pH 150.1 0.01 Units2 --- ---Hardness 6010B 0.332 --- ---Alkalinity 310.1 0.37 --- ---Chloride 300 0.1 --- ---Nitrate 300 0.01 --- ---Sulfate 300 0.13 --- ---Total Organic Carbon (TOC) 415.1 0.15 --- ---Dissolved Organic Carbon (DOC) 415.1 0.12 --- ---TSS 160.2 1.02 --- ---
µg/LArsenic EPA200.8 0.07 691 361Arsenic (dissolved) EPA200.8 0.1 69 36Cadmium SW6010B 0.3 42.31 9.31Cadmium (dissolved) SW6010B 0.2 42 9.3Chromium SW6010B 2.4 --- ---Chromium (dissolved) SW6010B 3.4 --- ---Copper SW6010B 0.6 5.81 3.71Copper (dissolved) SW6010B 0.3 4.8 3.1Lead SW6010B 1 2201 8.51Lead (dissolved) SW6010B 1 210 8.1Mercury SW7470A 0.02 2.11 ---Mercury (dissolved) SW7470A 0.01 1.8 0.025Nickel SW6010B 3 74.71 8.31Nickel (dissolved) SW6010B 4 74 8.2Selenium EPA200.8 0.1 2911 711Selenium (dissolved) EPA200.8 0.33 290 71Silver SW6010B 0.4 2.21 ---Silver (dissolved) SW6010B 0.4 1.9 ---Zinc SW6010B 0.4 951 861Zinc (dissolved) SW6010B 7 90 81
µg/LAlpha-BHC SW8081 0.014 --- ---Beta-BHC SW8081 0.033 --- ---Gamma-BHC (Lindane) SW8081 0.015 0.16 ---Delta-BHC SW8081 0.021 --- ---Heptachlor SW8081 0.011 0.053 0.00363Aldrin SW8081 0.02 0.71 0.00193Heptachlor Epoxide SW8081 0.008 --- ---Gamma Chlordane SW8081 0.008 0.09 0.0043Alpha Chlordane SW8081 0.027 0.09 0.0043Endosulfan I SW8081 0.008 0.034 0.00874,4’-DDE SW8081 0.018 0.13 0.0013Dieldirin SW8081 0.014 0.71 0.00193Endrin SW8081 0.052 0.0373 0.00233Endosulfan II SW8081 0.027 0.034 0.008734,4’-DDD SW8081 0.031 0.13 0.0013Endrin Aldehyde SW8081 0.033 --- ---4,4’-DDT SW8081 0.031 0.13 0.0013
Conventionals
Metals µg/L
Pesticides µg/L
Page 1 of 3

Table 4Whole Water Sample Analytes
Analyte Analytical Method MDL Acute Chronic
Endosulfan Sulfate SW8081 0.022 0.034 0.00873Endrin Ketone SW8081 0.025 --- ---Methoxychlor SW8081 0.131 --- ---Hexachlorobutadiene SW8081 0.01 --- ---Hexachlorobenzene SW8081 0.009 --- ---Toxaphene SW8081 0.22 0.213 0.00023
µg/LNaphthalene SW8270D4 0.42 --- ---Acenaphthylene SW8270D4 0.45 --- ---Acenaphthene SW8270D4 0.49 --- ---Fluorene SW8270D4 0.5 --- ---Phenanthrene SW8270D4 0.45 --- ---Anthracene SW8270D4 0.46 --- ---2-Methylnaphthalene SW8270D4 0.32 --- ---
µg/LFluoranthene SW8270D4 0.59 --- ---Pyrene SW8270D4 0.34 --- ---Benzo(a)anthracene SW8270D4 0.58 --- ---Chrysene SW8270D4 0.51 --- ---Benzofluoranthenes SW8270D4 0.41 --- ---Benzo(a)pyrene SW8270D4 0.48 --- ---Indeno(1,2,3-c,d)pyrene SW8270D4 0.39 --- ---Dibenzo(a,h)anthracene SW8270D4 0.38 --- ---Benzo(g,h,i)perylene SW8270D4 0.3 --- ---
µg/L1,2-Dichlorobenzene SW8270D4 0.42 --- ---1,4-Dichlorobenzene SW8270D4 0.42 --- ---1,2,4-Trichlorobenzene SW8270D4 0.44 --- ---Hexachlorobenzene SW8270D4 0.61 --- ---
µg/LDimethyl phthalate SW8270D4 0.49 --- ---Diethyl phthalate SW8270D4 0.49 --- ---Di-n-butyl phthalate SW8270D4 0.46 --- ---Butyl benzyl phthalate SW8270D4 0.4 --- ---Bis(2-ethylhexyl)phthalate SW8270D4 0.45 --- ---Di-n-octyl phthalate SW8270D4 0.51 --- ---
µg/LPhenol SW8270D4 0.39 --- ---2 Methylphenol SW8270D4 0.4 --- ---4 Methylphenol SW8270D4 0.34 --- ---2,4-Dimethylphenol SW8270D4 0.35 --- ---Pentachlorophenol SW8270D4 2.4 --- ---Benzyl alcohol SW8270D4 1.3 --- ---Benzoic acid SW8270D4 3.7 --- ---
µg/L Trichloroethene SW8260C 0.076 --- --- 1,1,1,2-Tetrachloroethane SW8260C 0.068 --- --- 1,1,2,2-Tetrachloroethane SW8260C 0.067 --- --- Ethylbenzene SW8260C 0.094 --- ---
µg/L
Volatile Organic Compounds µg/L
µg/L
Chlorinated Benzenes µg/L
Phthalate Esters µg/L
Ionizable Organic Compounds
Low Molecular Weight Polycyclic Aromatic Hydrocarbons (PAHs) µg/L
High Molecular Weight PAHs
Page 2 of 3

Table 4Whole Water Sample Analytes
Analyte Analytical Method MDL Acute Chronic
m, p-Xylene SW8260C 0.144 --- --- o-Xylene SW8260C 0.057 --- --- Vinyl Chloride SW8260C 0.075 --- --- Methylene Chloride SW8260C 0.391 --- --- Chloroform SW8260C 0.081 --- --- 1,2-Dichloroethane SW8260C 0.075 --- --- Bromodichloromethane SW8260C 0.053 --- --- 1,2-Dichloropropane SW8260C 0.093 --- --- cis-1,3-Dichloropropene SW8260C 0.058 --- --- Dibromochloromethane SW8260C 0.212 --- --- 1,1,2-Trichloroethane SW8260C 0.035 --- --- Benzene SW8260C 0.056 --- --- Tetrachloroethene SW8260C 0.088 --- --- Toluene SW8260C 0.058 --- --- Chlorobenzene SW8260C 0.042 --- ---Polychlorinated Biphenyl Aroclors (PCBs) µg/LAroclor-1221 8082 0.01 __ __
Aroclor-1232 8082 0.01 __ __
Aroclor-1242 8082 0.01 __ __
Aroclor-1016 8082 0.01 __ __
Aroclor-1248 8082 0.01 __ __
Aroclor-1254 8082 0.01 __ __
Aroclor-1260 8082 0.01 __ __
Aroclor-1262 8082 0.01 __ __
Aroclor-1268 8082 0.01 __ __
Total PCBs SW8082 0.01 10 0.03µg/L
Dibenzofuran SW8270D4 0.31 --- ---Hexachlorobutadiene SW8270D4 0.59 --- ---N-Nitrosodiphenylamine SW8270D4 0.46 --- ---
Notes:
2. Reporting limit listed in place of method detection limit.3. Marine surface water criteria are less than ARI standard MDLs
1. WAC 173-201A-240 Table 240(3) only provides criteria for dissolved metals. Criteria presented for total metals in the above table were back calculated using the provided conversion factors. Total metals criteria should be used only as estimates.
4. Selected ion monitoring may improve the sensitivity of USEPA Method 8270D and is recommended in cases when detection limits must be lowered to human health criteria levels or when TOC levels elevate detection limits above ecological criteria levels. See PSEP Organics Chapter, Appendix B – Guidance for Selected Ion Monitoring (1997d).
Miscellaneous Compounds µg/L
µg/L
Page 3 of 3

Table 5Stormwater Solid Sample SMS Analytes
Total Solids (%) --- 160.3 0.1 --- ---Grain Size --- ASTM/Sedigraph --- --- ---
mg/kgArsenic PSEP/3050B 6010B/6020 19 57 93Cadmium PSEP/3050B 6010B/6020 1.7 5.1 6.7Chromium PSEP/3050B 6010B/6020 87 260 270Copper PSEP/3050B 6010B/6020 130 390 390Lead PSEP/3050B 6010B/6020 150 450 530Mercury --- 7471A /245.5 0.14 0.41 0.59Silver PSEP/3050B 6010B/6020 2 6.1 6.1Zinc PSEP/3050B 6010B/6020 137 410 960
µg/kgPhenol 3540C/3550B 8270D 20 420 12002 Methylphenol 3540C/3550B 8270D 6 63 634 Methylphenol 3540C/3550B 8270D 20 670 6702,4-Dimethylphenol 3540C/3550B 8270D 6 29 29Pentachlorophenol 3540C/3550B 8270D 61 360 690Benzyl alcohol 3540C/3550B 8270D 6 57 73Benzoic acid 3540C/3550B 8270D 100 650 650
LAET 2LAETµg/kg
Naphthalene 3540C/3550B 8270D 20 2100 2100Acenaphthylene 3540C/3550B 8270D 20 1300 1300Acenaphthene 3540C/3550B 8270D 20 500 500Fluorene 3540C/3550B 8270D 20 540 540Phenanthrene 3540C/3550B 8270D 20 1500 1500Anthracene 3540C/3550B 8270D 20 960 9602-Methylnaphthalene 3540C/3550B 8270D 20 670 670Total LPAH 5200 5200
µg/kgFluoranthene 3540C/3550B 8270D 20 1700 2500Pyrene 3540C/3550B 8270D 20 2600 3300Benzo(a)anthracene 3540C/3550B 8270D 20 1300 1600Chrysene 3540C/3550B 8270D 20 1400 2800Benzofluoranthenes 3540C/3550B 8270D 20 __ __
Benzo(a)pyrene 3540C/3550B 8270D 20 1600 1600Indeno(1,2,3-c,d)pyrene 3540C/3550B 8270D 20 600 690Dibenzo(a,h)anthracene 3540C/3550B 8270D 20 230 230Benzo(g,h,i)perylene 3540C/3550B 8270D 20 670 720
12000 17000µg/kg
1,2-Dichlorobenzene 3540C/3550B 8270D 3.2 35 501,4-Dichlorobenzene 3540C/3550B 8270D 3.2 110 1101,2,4-Trichlorobenzene 3540C/3550B 8270D 6 31 51Hexachlorobenzene 3540C/3550B 8270D 12 22 70
µg/kgDimethyl phthalate 3540C/3550B 8270D 20 71 160Diethyl phthalate 3540C/3550B 8270D 20 200 1200
Phthalate Esters µg/kg
Low Molecular Polycyclic Aromatic Hydrocarbons (LPAH) µg/kg
High Molecular Polycyclic Aromatic Hydrocarbons (HPAH) µg/kg
Total HPAHChlorinated Benzenes µg/kg
Conventional Parameters
Metals mg/kg
Ionizable Organic Compounds µg/kg
Analyte Prep Method1 Analytical Method2 MDL 3,4 SQS CSL
Page 1 of 2

Table 5Stormwater Solid Sample SMS Analytes
Analyte Prep Method1 Analytical Method2 MDL 3,4 SQS CSL
Di-n-butyl phthalate 3540C/3550B 8270D 20 1400 5100Butyl benzyl phthalate 3540C/3550B 8270D 20 63 900Bis(2-ethylhexyl)phthalate 3540C/3550B 8270D 20 1300 3100Di-n-octyl phthalate 3540C/3550B 8270D 20 6200 6200
µg/kgAroclor-1221 3540C/3550B 8082 20 __ __
Aroclor-1232 3540C/3550B 8082 20 __ __
Aroclor-1242 3540C/3550B 8082 20 __ __
Aroclor-1016 3540C/3550B 8082 20 __ __
Aroclor-1248 3540C/3550B 8082 20 __ __
Aroclor-1254 3540C/3550B 8082 20 __ __
Aroclor-1260 3540C/3550B 8082 20 __ __
Aroclor-1262 3540C/3550B 8082 20 __ __
Aroclor-1268 3540C/3550B 8082 20 __ __
Total PCBs 3540C/3550B 8082 67 130 1000µg/kg
Dibenzofuran 3540C/3550B 8270D 20 540 540Hexachlorobutadiene 3540C/3550B 8270D 20 11 120N-Nitrosodiphenylamine 3540C/3550B 8270D 12 28 40
Notes:
3. MDL, SQS, CSL, LAET, and 2LAET are on a dry weight basis.
1. Recommended sample preparation methods are: PSEP (1997a,b) and USEPA Method 3050B and 3500 series (sample preparation methods from SW-846 [USEPA 1986] and subject to changes by USEPA updates).
2. Recommended sample cleanup methods are: Sample extracts subjected to gel permeation chromatography (GPC) cleanup follow the procedures specified by USEPA SW-846 Method 3640A. Special care should be used during GPC to minimize loss of analytes. If sulfur is present in the samples (as is common in most marine sediments), cleanup procedures specified by USEPA SW-846 Method 3660B should be used. All PCB extracts should be subjected to sulfuric acid/permanganate cleanup as specified by USEPA SW-846 Method 3665A. Additional cleanup procedures may be necessary on a sample-by-sample basis. Alternative cleanup procedures are described in PSEP (1997a,b) and USEPA (1986).
4. The recommended MDL is based on a value equal to one third of the 1988 dry weight lowest apparent effects threshold (LAET) value (Barrick et al. 1988) except for the following chemicals: 1,2-dichlorobenzene, 1,2,4-trichlorobenzene, hexachlorobenzene, hexachlorabutadiene, n-nitrosodiphenylamine, 2-methylphenol, 2,4-dimethylphenol, and benzyl alcohol, for which the recommended MDL is equal to the full value of the 1988 dry weight LAET.
Polychlorinated Biphenyl Aroclors (PCB) µg/kg
Miscellaneous Compounds µg/kg
Page 2 of 2

Table 6Dioxin/Furan Congeners and Method Detection Limits
Analyte Analysis Method1 Sediment MDL2
2,3,7,8-TCDD 1613B 0.2 to 0.51,2,3,7,8-PeCDD 1613B 0.2 to 0.5
1,2,3,4,7,8-HxCDD 1613B 1 to 51,2,3,6,7,8-HxCDD 1613B 1 to 51,2,3,7,8,9-HxCDD 1613B 1 to 5
1,2,3,4,6,7,8-HpCDD 1613B 1 to 5OCDD 1613B 10
Total Tetra-Dioxins (TCDD) 1613B 0.2 to 0.5Total Penta-Dioxins (PeCDD) 1613B 1 to 5Total Hexa-Dioxins (HxCDD) 1613B 1 to 5Total Hepta-Dioxins (HpCDD) 1613B 1 to 5
2,3,7,8-TCDF 1613B 1 to 51,2,3,7,8-PeCDF 1613B 1 to 52,3,4,7,8-PeCDF 1613B 1 to 5
1,2,3,4,7,8-HxCDF 1613B 1 to 51,2,3,6,7,8-HxCDF 1613B 1 to 51,2,3,7,8,9-HxCDF 1613B 1 to 52,3,4,6,7,8-HxCDF 1613B 1 to 5
1,2,3,4,6,7,8-HpCDF 1613B 1 to 51,2,3,4,7,8,9-HpCDF 1613B 1 to 5
OCDF 1613B 10Total Tetra-Furans (TCDF) 1613B 0.2 to 0.5
Total Penta-Furans (PeCDF) 1613B 1 to 5Total Hexa-Furans (HxCDF) 1613B 1 to 5Total Hepta-Furans (HpCDF) 1613B 1 to 5
Notes:
1. Method 1613 Tetra- through Octa-Chlorinated Dioxins and Furans by Isotope Dilution HRGC/HRMS. U.S. Environmental Protection Agency, Office of Water, Engineering and Analysis Division. October 1994.2. MDL is on a dry weight basis in pg/g.
Page 1 of 1

Table 7PBDE Congeners and Method Detection Limits
Analyte Analysis Method1 Sediment MDL2
BR2-DPE-7 1614 1.3BR2-DPE-8/11 1614 1.5BR2-DPE-10 1614 0.8BR2-DPE-12/13 1614 2.6BR2-DPE-15 1614 0.5BR3-DPE-17/25 1614 1.2BR3-DPE-28/33 1614 1.4BR3-DPE-30 1614 1.8BR3-DPE-32 1614 0.8BR3-DPE-35 1614 0.6BR3-DPE-37 1614 0.6BR4-DPE-47 1614 2.8BR4-DPE-49 1614 0.8BR4-DPE-51 1614 0.8BR4-DPE-66 1614 1.0BR4-DPE-71 1614 0.8BR4-DPE-75 1614 1.7BR4-DPE-77 1614 0.8BR4-DPE-79 1614 1.3BR5-DPE-85 1614 0.5BR5-DPE-99 1614 2.6BR5-DPE-100 1614 0.9BR5-DPE-105 1614 1.3BR5-DPE-116 1614 1.4BR5-DPE-119/120 1614 1.3BR5-DPE-126 1614 0.7BR6-DPE-128 1614 1.3BR6-DPE-138/166 1614 1.6BR6-DPE-140 1614 1.0BR6-DPE-153 1614 0.6BR6-DPE-154 1614 0.8BR6-DPE-155 1614 0.7BR7-DPE-181 1614 1.0BR7-DPE-183 1614 0.5BR7-DPE-190 1614 1.4BR8-DPE-203 1614 2.0BR9-DPE-206 1614 12.3BR9-DPE-207 1614 11.0BR9-DPE-208 1614 8.8BR10-DPE-209 1614 124
Notes:
1. Method 1614 Brominated Diphenyl Ethers in Water, Soil, Sediment and Tissue by HRGC/HRMS. U.S. Environmental Protection Agency, Office of Water, Engineering and Analysis Division. August 2007.2. MDL is on a dry weight basis in pg/g.
Page 1 of 1

Table 8Sediment Trap and Catch Basin Solid Analytes
Analyte Prep MethodAnalytical Method
SedimentLAET 2LAETMDL
Conventional ParametersTotal Organic Carbon (%) --- Plumb 1981 0.1 --- ---Pesticides µg/kg4,4’-DDE 3540C/3550B 8081 2.3. 9 154,4’-DDD 3540C/3550B 8081 3.3 2 434,4’-DDT 3540C/3550B 8081 6.7 3.9 6Aldrin 3540C/3550B 8081 1.7 --- ---Gamma Chlordane 3540C/3550B 8081 2 --- ---Alpha Chlordane 3540C/3550B 8081 2 --- ---Dieldirin 3540C/3550B 8081 2.3 --- ---Heptachlor 3540C/3550B 8081 1.7 --- ---Gamma-BHC (Lindane) 3540C/3550B 8081 1.7 --- ---
Page 1 of 1
Related Documents