ANTHROPOLOGICAL REVIEW • Vol. 75, 19–31 (2012) Late childhood and adolescence growth sensitivity to political transition: the case of South African Cape Coloured schoolchildren during and post-apartheid Madelief G.B.C. Bertens 1 , Stanley Ulijaszek 1 , Sławomir Kozieł 2* and Maciej Henneberg 3 1 Unit for Biocultural Variation and Obesity, Institute of Social and Cultural Anthropology, University of Oxford, United Kingdom 2 Institute of Anthropology in Wroclaw, Polish Academy of Sciences, Poland 3 Biological Anthropology and Comparative Anatomy Unit, University of Adelaide, Australia ABSTRACT: South Africa underwent major social and economic change between 1987 and 1995. The release of Nelson Mandela in February 1990 proclaimed an end to the political system of apartheid, and the first freely elected non-White government in 1994 instigated social and economic reforms aimed at alleviating the consequences of apartheid. This paper aims to examine the impact of these socio-economic and polit- ical changes on height, weight and body mass index (BMI) in childhood and late adolescence. An analysis was carried out of longitudinal data of 258 urban and rural South African Cape Coloured schoolchildren (6–18 years old) across the transitional periods from apartheid between 1987 and 1990, to this transi- tion between 1991 and 1993, and finally to post-apartheid between 1994 and 1995. The anthropometric measures were standardized into age independent Z-scores. Analyses of variance with repeated measures were conducted to examine the growth in height, weight and BMI across these periods. The results show a significant main effect of measurement periods on height, weight and BMI Z-scores. Across time, the subjects increased in overall size, height, weight and BMI. For all the anthropometric measures there was a significant interaction effect between measurement period and sex, but none between measurement peri- od and SES. The average increase in height, weight and BMI across time differed significantly for girls and boys, the average z-scores being greater in girls than in boys. For boys, there was little difference in height, weight and BMI Z-scores according to SES, and little increase across periods. Girls were generally taller, heavier with greater BMI than boys, and their scores increased across the time periods. High SES girls were taller, heavier and had higher BMI than low SES girls. Across the measurement periods, BMI and weight somewhat converged between the high and low SES girls. In the discussion these differences reflecting social sex distinctions are addressed. KEY WORDS: South Africa, school children, BMI, apartheid, longitudinal analysis, (political) transition, hu- man growth Growth of African Cape Coloured schoolchildren Madelief Bertens et al. Original Article: Received 14.06.2012; Accepted 01.12.2012 DOI: 10.2478/v10044-012-0002-6 © 2012 Polish Anthtropological Society

Welcome message from author
This document is posted to help you gain knowledge. Please leave a comment to let me know what you think about it! Share it to your friends and learn new things together.
Transcript

AnthropologicAl review • Vol. 75, 19–31 (2012)
Late childhood and adolescence growth sensitivity to political transition: the case
of South African Cape Coloured schoolchildren during and post-apartheid
Madelief G.B.C. Bertens1, Stanley Ulijaszek1, Sławomir Kozieł2* and Maciej Henneberg3
1Unit for Biocultural Variation and Obesity, Institute of Social and Cultural Anthropology, University of Oxford, United Kingdom
2 Institute of Anthropology in Wroclaw, Polish Academy of Sciences, Poland 3 Biological Anthropology and Comparative Anatomy Unit, University of Adelaide, Australia
AbstrAct: South Africa underwent major social and economic change between 1987 and 1995. The release of Nelson Mandela in February 1990 proclaimed an end to the political system of apartheid, and the first freely elected non-White government in 1994 instigated social and economic reforms aimed at alleviating the consequences of apartheid. This paper aims to examine the impact of these socio-economic and polit-ical changes on height, weight and body mass index (BMI) in childhood and late adolescence. An analysis was carried out of longitudinal data of 258 urban and rural South African Cape Coloured schoolchildren (6–18 years old) across the transitional periods from apartheid between 1987 and 1990, to this transi-tion between 1991 and 1993, and finally to post-apartheid between 1994 and 1995. The anthropometric measures were standardized into age independent Z-scores. Analyses of variance with repeated measures were conducted to examine the growth in height, weight and BMI across these periods. The results show a significant main effect of measurement periods on height, weight and BMI Z-scores. Across time, the subjects increased in overall size, height, weight and BMI. For all the anthropometric measures there was a significant interaction effect between measurement period and sex, but none between measurement peri-od and SES. The average increase in height, weight and BMI across time differed significantly for girls and boys, the average z-scores being greater in girls than in boys. For boys, there was little difference in height, weight and BMI Z-scores according to SES, and little increase across periods. Girls were generally taller, heavier with greater BMI than boys, and their scores increased across the time periods. High SES girls were taller, heavier and had higher BMI than low SES girls. Across the measurement periods, BMI and weight somewhat converged between the high and low SES girls. In the discussion these differences reflecting social sex distinctions are addressed.
Key words: South Africa, school children, BMI, apartheid, longitudinal analysis, (political) transition, hu-man growth
Growth of African Cape Coloured schoolchildren
Madelief Bertens et al.
Original Article: Received 14.06.2012; Accepted 01.12.2012DOI: 10.2478/v10044-012-0002-6© 2012 Polish Anthtropological Society

20 Madelief Bertens et al.
Growth patterns of South African chil-dren and adolescents reflect political and economic realities, given that socioeco-nomic status, poverty, and political con-ditions are clustered as structurally pow-erful but distal agents in the production of growth outcomes (Ulijaszek 2006). This cluster of factors is constituted his-torically, the risks associated with pover-ty including low entitlement, poor health infrastructures, and environmental haz-ards (Sen 1986). The ability of children and adolescents to respond to improve-ments in environmental quality by in-creased growth rates and attained size is well-documented, particularly in relation to positive secular trends in weight and stature (van Weiringen 1986). Thus, the social and economic inequality that apart-heid created resulted in superior weight and stature of white children over black (Cameron 2003) and Coloured Cape children (Henneberg and Louw 1998). South Africa as a whole underwent major political, economic and social transitions between 1987 and 1995. Although social and economic reforms aimed at alleviat-ing the consequences of apartheid were undertaken, the legacy of this system in terms of economic inequality persisted (Price 2003) and Cameron’s (2003) ob-servation that the rate of improvement in child growth patterns was slower than expected is likely to reflect this reali-ty. Differences in growth status within sub-sets of the South African population have also persisted. Urban Cape Colour-ed people had already experienced some economic improvements since the estab-lishment of a Cape Coloured chamber of parliament, a limited self-government, in the early 1980s. For example, Henneberg and Louw (1995; 1998) found rural Cape Coloured school children of high socio-economic status (SES) to exhibit faster
growth in weight and height and enter puberty earlier than their urban Cape Coloured counterparts of low SES.
The Cape Coloured population of South Africa represents a unique exam-ple of a politically oppressed group that manifested its social and economic posi-tion relative to other populations there in poor growth and low stature. Numbering approximately 3 million at the time of this study (CSS 1991), Cape Coloured people are descendants of the Khoi-San, who in-termarried with whites, blacks, as well as with forced immigrants from Southeast Asia and black African immigrants (Hen-neberg and Louw 1998). They were large-ly acculturated by serving as a workforce for Afrikaners to the extent that they lost their original languages, accepting Afri-kaans as their mother tongue and, in large part adopting Dutch-derived protestant Christianity, while a significant minority remained Islamic. This population be-came largely forgotten in politically over-simplified descriptions of the transition years, often framed as the struggle be-tween blacks and whites. Cape Coloureds were not considered equal to ‘whites’ and thus oppressed under apartheid, but, at the same time, they did not identify with black Africans, due to their acculturation to Afrikaans language, religion and many borrowed cultural traits from Afrikaner culture.
In this paper we describe changes in height, weight and BMI of Cape Colour-ed children and adolescents across the periods of political economic transition from apartheid, and examine the extent to which anthropometric differences as-sociated with different levels of socioec-onomic status have persisted. We also examine the extent to which sex differ-ences in the same measures persisted across this period.
Growth of African Cape Coloured schoolchildren 21
Materials and methods
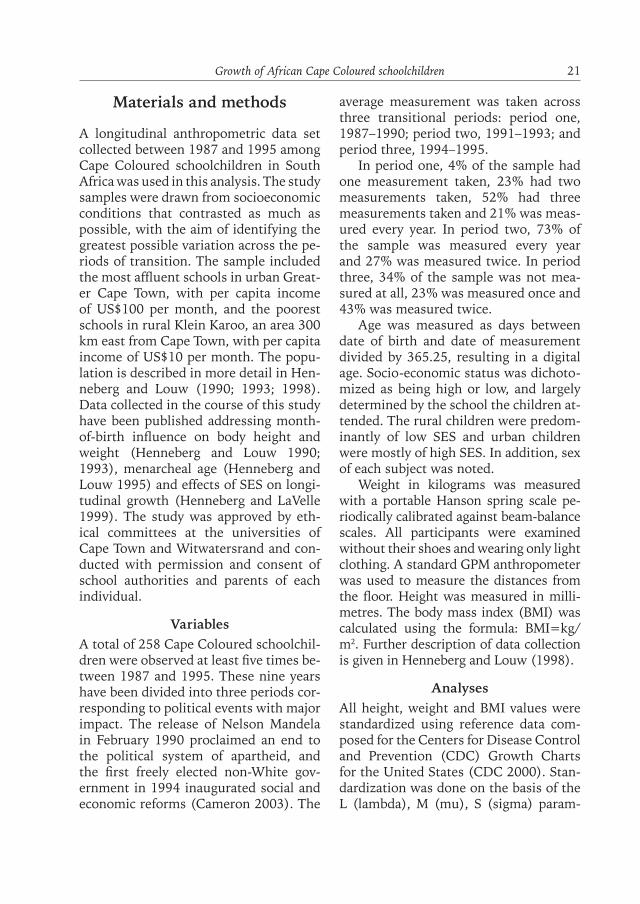
A longitudinal anthropometric data set collected between 1987 and 1995 among Cape Coloured schoolchildren in South Africa was used in this analysis. The study samples were drawn from socioeco nomic conditions that contrasted as much as possible, with the aim of identifying the greatest possible variation across the pe-riods of transition. The sample included the most affluent schools in urban Great-er Cape Town, with per capita income of US$100 per month, and the poorest schools in rural Klein Karoo, an area 300 km east from Cape Town, with per capita income of US$10 per month. The popu-lation is described in more detail in Hen-neberg and Louw (1990; 1993; 1998). Data collected in the course of this study have been published addressing month-of-birth influence on body height and weight (Henneberg and Louw 1990; 1993), menarcheal age (Henneberg and Louw 1995) and effects of SES on longi-tudinal growth (Henneberg and LaVelle 1999). The study was approved by eth-ical committees at the universities of Cape Town and Witwatersrand and con-ducted with permission and consent of school authorities and parents of each individual.
Variables A total of 258 Cape Coloured schoolchil-dren were observed at least five times be-tween 1987 and 1995. These nine years have been divided into three periods cor-responding to political events with major impact. The release of Nelson Mandela in February 1990 proclaimed an end to the political system of apartheid, and the first freely elected non-White gov-ernment in 1994 inaugurated social and economic reforms (Cameron 2003). The
average measurement was taken across three transitional periods: period one, 1987–1990; period two, 1991–1993; and period three, 1994–1995.
In period one, 4% of the sample had one measurement taken, 23% had two measurements taken, 52% had three measurements taken and 21% was meas-ured every year. In period two, 73% of the sample was measured every year and 27% was measured twice. In period three, 34% of the sample was not mea-sured at all, 23% was measured once and 43% was measured twice.
Age was measured as days between date of birth and date of measurement divided by 365.25, resulting in a digital age. Socio-economic status was dichoto-mized as being high or low, and largely determined by the school the children at-tended. The rural children were predom-inantly of low SES and urban children were mostly of high SES. In addition, sex of each subject was noted.
Weight in kilograms was measured with a portable Hanson spring scale pe-riodically calibrated against beam-balance scales. All participants were examined without their shoes and wearing only light clothing. A standard GPM anthropometer was used to measure the distances from the floor. Height was measured in milli-metres. The body mass index (BMI) was calculated using the formula: BMI=kg/m2. Further description of data collection is given in Henneberg and Louw (1998).
AnalysesAll height, weight and BMI values were standardized using reference data com-posed for the Centers for Disease Control and Prevention (CDC) Growth Charts for the United States (CDC 2000). Stan-dardization was done on the basis of the L (lambda), M (mu), S (sigma) param-

22 Madelief Bertens et al.
eters estimated by the LMS method de-scribed by Cole (1988). This method for fitting anthropometric data allows for de-parture from normality while permitting calculation of centiles from the mean and standard deviation (Cole 1989). Further-more, the method allows estimation of L, M and S smoothed curves for each tabu-lated age, measurement and sex. These represent powers of Box-Cox conver-sions to normality, the median and the coefficient of variation. After Box-Cox power transformations, the data at each age are normally distributed (Cole et al. 2000). Then the Z-scores for exact age are calculated using the formula:
where X is the anthropometric measure, and L, M, S, appropriate values for age and sex for height, weight and BMI de-rived from the United States population (Cole 1988).
SPSS 15.0 for Windows was used in the statistical analyses. Two-way ANOVAs with Type IV sums of squares, were used in comparing the mean values between boys and girls within each pe-riod of measurement.
To examine changes in height, weight and BMI across the three periods of measurement a series of analyses of vari-ance (ANOVA) with repeated measures and Bonferroni correction for multiple comparisons were carried out. Height, weight and BMI Z-scores were entered as dependent variables, with sex and SES as between-subjects factors. Tests of with-in-subject effects show changes across time within subjects, whereas tests of between-subject effects assess the differ-ences between high and low SES males and females. Analyses of variance, per anthropometric measure, with repeated
measurements and post hoc Bonferroni contrast tests were conducted separate-ly for females of high and low SES, and males of high and low SES, respectively.
ResultsIn total 258 children were measured, 129 boys and 129 girls, 147 rural low SES and 108 urban high SES children. The over-all mean age was 11.2 (SD= 1.9) years of age, ranging from 5.4 to 21.2. In peri-ods one and two, 258 subjects could be included. However, in period three only 170 children were measured. Therefore only 158 valid cases could be included in the repeated measures ANOVA.
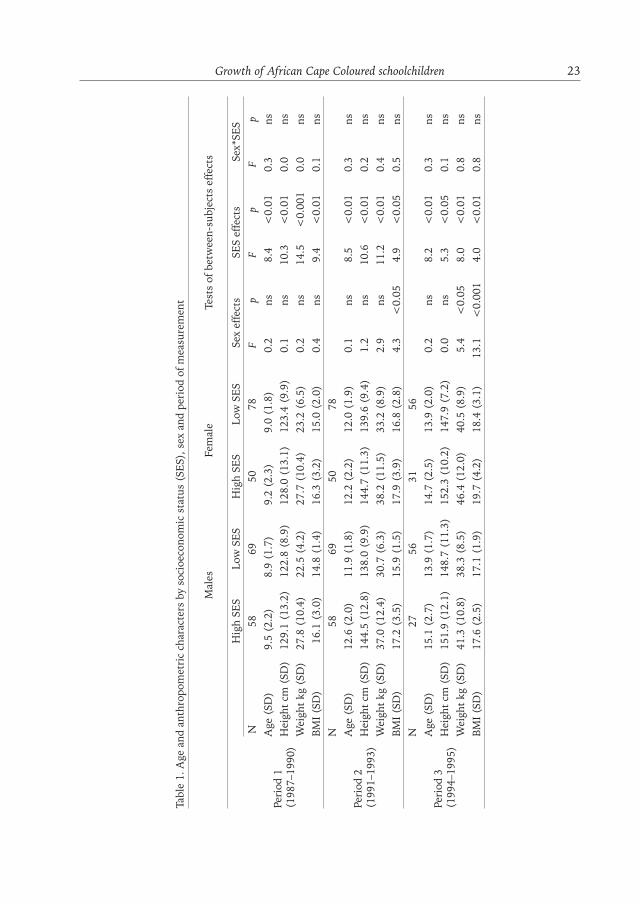
In Table 1, means and standard de-viations of age, height, weight and BMI at each period are presented separately for boys and girls and for urban afflu-ent and rural poor children. Two-way ANOVAs have been conducted to exam-ine the sex and SES effects within each time frame. There was a significant main effect of SES on absolute height, weight and BMI measures in all the periods, in-dicating that belonging to either high or low SES impacts on the anthropomet-ric measures. There was also an effect of SES on age. These results from the fact that there was some difference in the distribution of ages of participants in these two groups; high SES children being on average somewhat older than low SES participants (Table 1). The ur-ban high SES children were all larger than the low SES children in each period of measurement. There was a significant main effect of sex on BMI in period two and period three, F(1,170)=4.3, p<0.05 and F(1,170)=13.1, p<0.001, respective-ly. Furthermore there was a significant effect of sex on weight in period three, F(1,170)=5.4, p<0.05. The girls were
Growth of African Cape Coloured schoolchildren 23
Tabl
e 1.
Age
and
ant
hrop
omet
ric
char
acte
rs b
y so
cioe
cono
mic
sta
tus
(SES
), s
ex a
nd p
erio
d of
mea
sure
men
t
Mal
esFe
mal
eTe
sts
of b
etw
een-
subj
ects
eff
ects
Hig
h SE
SLo
w S
ESH
igh
SES
Low
SES
Sex
effe
cts
SES
effe
cts
Sex*
SES
Peri
od 1
(198
7–19
90)
N58
6950
78F
pF
pF
pA
ge (
SD)
9.5
(2.2
)8.
9 (1
.7)
9.2
(2.3
)9.
0 (1
.8)
0.2
ns8.
4<
0.01
0.3
nsH
eigh
t cm
(SD
)12
9.1
(13.
2)12
2.8
(8.9
)12
8.0
(13.
1)12
3.4
(9.9
)0.
1ns
10.3
<0.
010.
0ns
Wei
ght
kg (
SD)
27.8
(10
.4)
22.5
(4.
2)27
.7 (
10.4
)23
.2 (
6.5)
0.2
ns14
.5<
0.00
10.
0ns
BMI (
SD)
16.
1 (3
.0)
14.8
(1.
4)16
.3 (
3.2)
15.0
(2.
0)0.
4ns
9.4
<0.
010.
1ns
Peri
od 2
(199
1–19
93)
N58
6950
78A
ge (
SD)
12.6
(2.
0)11
.9 (
1.8)
12.2
(2.
2)12
.0 (
1.9)
0.1
ns8.
5<
0.01
0.3
nsH
eigh
t cm
(SD
)14
4.5
(12.
8)13
8.0
(9.9
)14
4.7
(11.
3)13
9.6
(9.4
)1.
2ns
10.6
<0.
010.
2ns
Wei
ght
kg (
SD)
37.0
(12
.4)
30.7
(6.
3)38
.2 (
11.5
)33
.2 (
8.9)
2.9
ns11
.2<
0.01
0.4
nsBM
I (SD
)17
.2 (
3.5)
15.9
(1.
5)17
.9 (
3.9)
16.8
(2.
8)4.
3<
0.05
4.9
<0.
050.
5ns
Peri
od 3
(199
4–19
95)
N27
5631
56A
ge (
SD)
15.1
(2.
7)13
.9 (
1.7)
14.7
(2.
5)13
.9 (
2.0)
0.2
ns8.
2<
0.01
0.3
nsH
eigh
t cm
(SD
)15
1.9
(12.
1)14
8.7
(11.
3)15
2.3
(10.
2)14
7.9
(7.2
)0.
0ns
5.3
<0.
050.
1ns
Wei
ght
kg (
SD)
41.3
(10
.8)
38.3
(8.
5)46
.4 (
12.0
)40
.5 (
8.9)
5.4
<0.
058.
0<
0.01
0.8
nsBM
I (SD
)17
.6 (
2.5)
17.1
(1.
9)19
.7 (
4.2)
18.4
(3.
1)13
.1<
0.00
14.
0<
0.01
0.8
ns

24 Madelief Bertens et al.
heavier than the boys in this sample. One has to keep in mind that these measure-ments are not standardized and are age dependent.
The measurements have therefore been standardized into Z-scores using the LMS method. Tables 2 to 4 give mean Z-scores of height, weight and BMI rel-ative to CDC reference values by period of measurement and results of repeated measures analyses of variance by period of measurement, SES and sex. Individ-ual growth patterns differed greatly. Ta-bles 2 to 4 also show the tests of with-in-subject effects, the main effects, and between-subjects effects for the anthro-pometric measures Z-scores. There was a significant main effect of time on height, weight and BMI Z-scores, with a small to medium effect size, F(2,158)=3.4, p<0.05, r=0.14; F(2,158)=28.92, p<0.00, r=0.40, F(2,158)=25.85, p<0.001, r=0.38, respectively. Across
time, the subjects increased in overall size, height, weight and BMI relative to the American reference. Closer examina-tion of the analyses of variance and the interaction effects shows a more complex picture.
For all the anthropometric measures there was a significant interaction effect between period of measurement and sex, but none between period and SES (see tables 2 to 4). This suggests that the political transition had a different effect on growth in height, weight and BMI in boys than in girls. Analyses of variance with repeated measures were conducted within each subgroup. As table 2 shows, the trend in stature increase takes place among rural females of low SES only. Weight increased across periods among females of both high and low SES and among males of low SES. This increase was greater in females than among males. The BMI Z-scores of females of both high
Table 2. Mean Z-scores of height relative to CDC reference values by period of measurement, SES and sex (Repeated measures analysis of variance)
Period of measurement Effect size
N 1Mean (SD)
2Mean (SD)
3Mean (SD) F p r
Male High SES 24 –1.54 1.16) –1.49 (0.79) –1.59 (0.70) 0.29 nsLow SES 52 –1.51 1.15) –1.49 (1.07) –1.53 (1.03) 0.15 ns
Female High SES 31 –1.15 (1.30) –0.91 (1.30) –0.79 (1.55) 2.52 nsLow SES 52 –1.61 (0.87) –1.44 (0.87) –1.39 (0.89) 5.47 **
Total High SES 55 –1.16 (1.25) –1.16 (1.14) –1.14 (1.30) 1.59 nsLow SES 103 –1.56 (1.01) –1.47 (0.96) –1.46 (0.96) 2.07 ns
Within-subject effects
Period 3.37 * 0.14Period*sex 4.58 * 0.17Period *SES 0.17 ns 0.03Period*sex*SES 0.34 ns 0.04
Between-subjects effectssex 3.51 * 0.19SES 2.31 ns 0.12
* p<0.05, ** p<0.01, *** p<0.001r=0.10 is a small effect, 1% of total variance explained; r=0.30 is a medium effect, 9% of total variance
explained; r=0.50 is a large effect, 25% of total variance explained.

Growth of African Cape Coloured schoolchildren 25
Table 3. Mean Z-scores of weight relative to CDC reference values by period of measurement, SES and sex (Repeated measures analysis of variance)
Period of measurement Effect size
N 1Mean (SD)
2Mean (SD)
3Mean (SD) F p r
Male High SES 24 –1.98 (1.21) –1.79 (.99) –1.80 (.88) 1.16 nsLow SES 52 –2.02 (1.44) –1.73 (1.42) –1.79 (1.45) 4.26 *
Female High SES 31 –1.35 (1.36) –0.87 (1.14) –0.68 (1.46) 9.01 ***Low SES 52 –1.91 (1.15) –1.42 (1.06) –1.09 (1.01) 32.17 ***
Total High SES 55 –1.62 (1.33) –1.27 (1.16) –1.17 (1.36) 9.05 ***Low SES 104 –1.97 (1.30) –1.57 (1.26) –1.44 (1.29) 25.37 ***
Within–subject effects
Period 28.92 *** 0.40Period*sex 8.47 *** 0.23Period *SES 0.30 ns 0.04Period*sex*SES 0.26 ns 0.04
Between–subjects effectssex 10.42 ** 0.25SES 0.30 ns 0.10
* p<0.05, ** p<0.01, *** p<0.001r=0.10 is a small effect, 1% of total variance explained; r=0.30 is a medium effect, 9% of total variance
explained; r=0.50 is a large effect, 25% of total variance explained.
Table 4. Mean Z-scores of BMI relative to CDC reference values by period of measurement, SES and sex (Repeated measures analysis of variance)
Period of measurement Effect size
N 1Mean (SD)
2Mean (SD)
3Mean (SD) F p r
Male High SES 24 –1.50 (1.39) –1.27 (0.97) –1.23 (0.97) 1.30 nsLow SES 51 –1.50 (1.24) –1.13 (1.11) –1.15 (1.12) 4.91 **
Female High SES 31 –0.86 (1.13) –0.48 (0.97) –0.32 (0.85) 6.98 **Low SES 52 –1.35 (1.23) –0.77 (0.95) –0.45 (1.10) 28.85 ***
Total High SES 55 –1.14 (1.28) –0.82 (1.04) –0.72 (1.04) 7.27 ***Low SES 103 –1.42 (1.23) –0.95 (1.04) –0.80 (1.13) 25.74 ***
Within-subject effects
Period 25.85 *** 0.38Period*sex 0.15 3.76 *Period *SES 0.08 1.11 nsPeriod*sex-*SES 0.05 0.51 ns
Between-subjects effectssex 13.19 *** 0.28SES 0.05 0.52 ns
* p<0.05, ** p<0.01, *** p<0.001r=0.10 is a small effect, 1% of total variance explained; r=0.30 is a medium effect, 9% of total variance
explained; r=0.50 is a large effect, 25% of total variance explained.

26 Madelief Bertens et al.
Fig. 1. Graphs of average height Z-scores across time per sex and SES
Fig. 2. Graphs of average weight Z-scores across time per sex and SES
Growth of African Cape Coloured schoolchildren 27
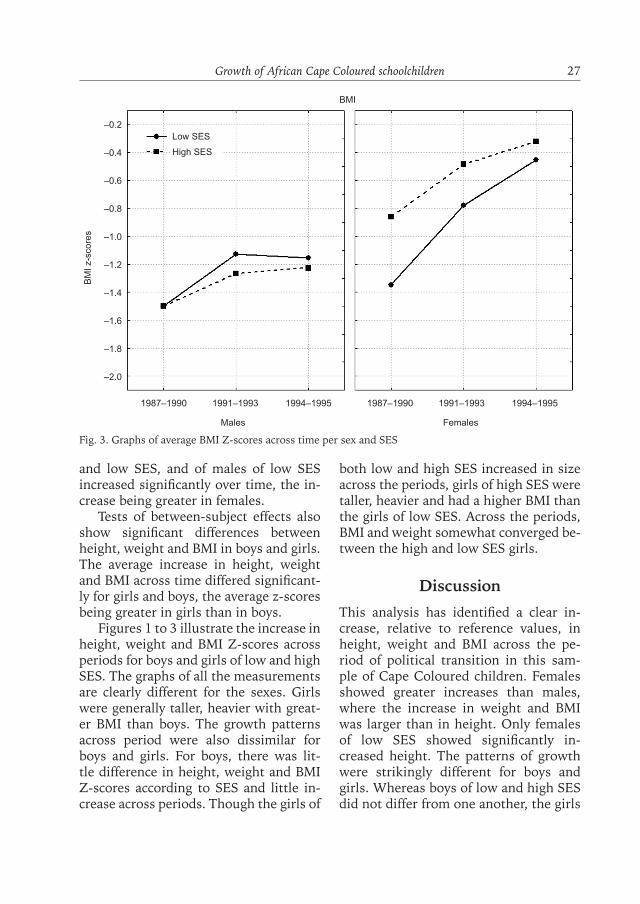
and low SES, and of males of low SES increased significantly over time, the in-crease being greater in females.
Tests of between-subject effects also show significant differences between height, weight and BMI in boys and girls. The average increase in height, weight and BMI across time differed significant-ly for girls and boys, the average z-scores being greater in girls than in boys.
Figures 1 to 3 illustrate the increase in height, weight and BMI Z-scores across periods for boys and girls of low and high SES. The graphs of all the measurements are clearly different for the sexes. Girls were generally taller, heavier with great-er BMI than boys. The growth patterns across period were also dissimilar for boys and girls. For boys, there was lit-tle difference in height, weight and BMI Z-scores according to SES and little in-crease across periods. Though the girls of
both low and high SES increased in size across the periods, girls of high SES were taller, heavier and had a higher BMI than the girls of low SES. Across the periods, BMI and weight somewhat converged be-tween the high and low SES girls.
DiscussionThis analysis has identified a clear in-crease, relative to reference values, in height, weight and BMI across the pe-riod of political transition in this sam-ple of Cape Coloured children. Females showed greater increases than males, where the increase in weight and BMI was larger than in height. Only females of low SES showed significantly in-creased height. The patterns of growth were strikingly different for boys and girls. Whereas boys of low and high SES did not differ from one another, the girls
Fig. 3. Graphs of average BMI Z-scores across time per sex and SES

28 Madelief Bertens et al.
of high SES and the girls of low SES did. The urban girls of high SES remained taller, heavier and larger. However the rural girls of low SES converged to the values of the urban girls of high SES. Since mean Z-scores remained below reference values throughout, this sug-gests improvements in the biological quality of life, rather than emergence of obesity, for this population. This outcome is different from the one that Cameron (2003) identified for Black South Africans across a similar period, and warns against broad generalizations about improvements in the biological quality of life with the dismantling of apartheid. Cameron (2003) finds that for Black Africans in 1995 there was as yet no improved growth status at nation-al and community levels. He argues that although the political changes have been rapid, the consequent economic and so-cial changes have been much more grad-ual. This study shows improvements in the biological quality of life of low SES Cape Coloured children between the late years of apartheid and the early post-apartheid years. This result may be because the Cape Coloured community had largely Western notions of lifestyle during apartheid. When the apartheid restrictions on their incomes were re-moved their quality of life could increase faster than other groups that needed to overcome cultural differences previously maintained by apartheid.
This increase in weight and BMI can-not be attributed to general increases in food availability within South Africa. Food balance data from the Food and Agriculture Organisation (2008) shows daily per capita energy availability vary-ing between 1987 and 1995 by only 120 kcal (about 500 kj), with no trend toward either increase or decline across
the period (FAOSTAT). Furthermore, since the Cape Coloured population has a long history of consumption of west-ern-style diet, nutrition transition in-volving dietary westernization (Popkin and Gordon-Larsen 2004; Popkin and Ng 2007) cannot explain the changes ob-served.
The income inequalities across the dif-ferent racial categories established by the apartheid regime were enormous. How-ever, levels of income inequality within groups were much lower, and although African Blacks had the greatest inequal-ity, the Coloured population had levels of inequality similar to that of the White populations (Leibbrandt et al. 1999). This generalisation is not true for our sample, however. Our sample was specif-ically selected for maximum SES contrast with the poorest of the Cape Coloured in the poorest area and the wealthiest Cape Coloured in the wealthiest area. The con-trast of those two groups (10 times dif-ference in income per capita) may have been much greater than among whites. For all periods of the present study, urban high SES children were taller and heavier than the rural children of low SES. In the apartheid period of measurement rural children of low SES had lower BMI than urban children of high SES.
The Cape Coloured population have had an exceptional status in South Africa. Since the early 1980s the apartheid gov-ernment granted limited self-government to the Cape Coloured people. A Cape Coloured chamber of parliament was established. Though much criticised, it gave economic benefits to predominant-ly urban people of higher SES, especially those well connected to the government. One may argue that this self-government had limited impact on the rural people of low SES. Thus urban children are like-

Growth of African Cape Coloured schoolchildren 29
ly to have experienced fewer alterations to their life-style when the apartheid system ceased to exist, compared to the rural children whose situation was possi-bly altered substantially a few years after Nelson Mandela was released in 1990. In urban Cape Coloured areas the change of the political system probably did not have much impact on incomes and life styles of the middle class. Thus the effect of political change would be expected to have been greater in the rural areas.
The hypothesis that the low SES ru-ral population would have a greater in-crease of height, weight and BMI is only part-supported with this analysis, since the trend is visible only in girls. The dif-ferences between males and females are striking. The increase in height, weight and BMI is much higher in the female sample over time. In boys the increase in weight and BMI occurs only in the low SES boys. It seems that the girls, partic-ularly those of low SES, benefitted most from political transition. The underlying mechanisms for this are not clear. Sex dimorphism in age of onset of puberty might have affected the results obtained. It is well documented that during pu-berty the velocity of growth increases markedly for all the traits studied. We have used US growth curves to standard-ize our data, but the South African pop-ulation might exhibit different growth patterns, especially for BMI and weight. Both of these measures are affected by environmental factors. However, the ef-fects of environmental confounders are difficult to assess. Large differences in age of onset of puberty both between the reference and studied population and be-tween boys and girls of the studied pop-ulation might have distorted the results, although the use of standardized Z-score
should have removed most of this possi-ble distortion.
The Cape Coloured girls are typically matured at an earlier age than boys, and so they became taller and heavier during puberty (Henneberg and Louw 1998). Others have documented greater subcu-taneous fat gain for non-white South Af-rican girls relative to boys especially after the start of menarche at the age of 14 years (Mukuddem-Petersen and Kruger 2004). Among Cape Coloured girls, the age of menarche was 12.75 for high SES which was(was?) lower than that of any group of black South African girls and white girls (Henneberg and Louw 1995).
One possible socio-cultural explana-tion for the different patterns between boys and girls is that of gender specific practices in which, in a situation of scarci-ty and deprivation, boys were given pref-erential food and care to the detriment of girls. This may be understandable in communities of seasonal workers where males are considered main breadwinners for families. Another explanation might be that boys carry a greater physical work burden than girls, resulting in poorer nu-tritional status among them. However there is little evidence to support this.
Authors’ contributionMGBCB conceived of the paper aim and design, served as principal investigator for the research project; SU served as the project investigator; SK performed sta-tistical analyses and analyzed data; MH served as project manager. All authors were involved in drafting the manuscript and approved its final version.
Conflicting interestsThe authors declare that they have no conflicts of interest in the research.
30 Madelief Bertens et al.
Acknowledgements
We acknowledge the cooperation of a number of schools in Cape Town and Klein Karoo and, first of all, participants in our longitudinal study who willingly allowed us to subject them annually to anthropometric and functional examina-tions.
Corresponding authorSławomir Kozieł, Polish Academy of Sciences, Institute of Anthropology in Wrocław, Kuźnicza 35, 50-951 Wro-cław, Poland; e-mail address: [email protected]
ReferencesCameron N. 2003. Physical growth in a tran-
sitional economy: the aftermath of South African apartheid. Econ Hum Biol 1:29–43.
CDC. 2000. http://www.cdc.gov/growthcharts/. Cole TJ. 1988. Fitting smoothed centiles
curves to reference (with Discussion). J R Stat Soc B 26:211–52.
Cole TJ. 1989. Using the LMS method to measure skewness in the NCHS and Dutch National height standards. Ann Hum Biol 16:407–19.
Cole TJ, Bellizi MC, Flegal KM, Dietz WH. 2000. Establishing a standard definition for child overweight and obesity world-wide: international survey. BMJ 320:1–6.
CSS. 1991. Population Census (No. 03–01–10): Central Statistical Service.
FAOSTAT. Retrieved 23rd July 2008. from Food and Agriculture Organisation of the United Nations: Faostat.fao.org.
Henneberg M, Louw GJ. 1990. Height and weight differences among South Afri-can urban schoolchildren born in vari-ous months of the year. Am J Hum Biol 2:227–33.
Henneberg M, Louw GJ. 1993. Further stud-ies on the month-of-birth effect on body
size: Rural schoolchildren and an animal model. Am J Phys Anthropol 91:235–44.
Henneberg M, Louw GJ. 1995. Average me-narcheal age of higher socioeconomic sta-tus urban Cape Coloured girls assessed by means of status quo and recall methods. Am J Phys Anthropol 96:1–5.
Henneberg M, Louw GJ. 1998. Cross-section-al survey of growth of urban and rural ‘Cape Coloured’ schoolchildren: Anthro-pometry and functional tests. Am J Hum Biol 10:73–85.
Henneberg M, LaVelle M. 1999. Socioeco-nomic category has negligible effects on child growth in body size among urban and rural South African Cape Coloured children. Perspectives in Human Biology 4(2):41–49.
Leibbrandt M, Bhorat H, Woolard I. 1999. Understanding contemporary household inequality in South Africa. Cape Town: Development Policy Research Unit, Uni-versity of Cape Town. 99/25.
Mukuddem-Petersen J, Kruger HS. 2004. Association between stunting and over-weight among 10–15-y-old children in the North West Province of South Africa: the THUSA BANA Study. Int J Obes 28:842–51.
Popkin BM. 1998. The nutrition transition and its health implications in lower-in-come countries. Public Health Nutr 1(1):5–21.
Popkin BM. 2002. An overview on the nutri-tion transition and its health implications: the Bellagio meeting. Public Health Nutr 5:93–103.
Popkin BM, Gordon-Larsen P. 2004. The nu-trition transition: worldwide obesity dy-namics and their determinants. Int J Obes 28:2–9.
Popkin BM, Ng SW. 2007. The nutrition tran-sition in high- and low-income countries: what are the policy lessons? Agric Econ 37(S1):199–210.
Price TL. 2003. The Ethics of Authentic Transformational Leadership. Leadership Quart 14(1):67–81.

Growth of African Cape Coloured schoolchildren 31
Sen AK. 1986. Commodities and capabilities. Amsterdam: North Holland.
Ulijaszek SJ. 2006. The International Growth Standard for Children and Adolescents Project: Environmental influences on preadolescent and adolescent growth
in weight and height. Food Nutr Bull 27(4):279–294.
van Weiringen JC. 1986. Secular growth changes. In: F. Falkner and TM Tanner, ed-itors. Human Growth-A Comprehensive Treatise. 2 edition. 307–331.
Related Documents