Introduction Solidification cracking is a well-known weldability issue with austenitic stainless steels, with solidi- fication mode and impurity content being important factors. Part 1 of this study (Ref. 1) presented the effects of S and P on solidification cracking un- der primary austenite solidification, and the relationship between solidifi- cation mode chemical composition represented as Cr eq as a function of Ni eq for Type 21Cr-6Ni-9Mn (21-6-9), an alloy also known as Nitronic® 40. Previous research on welding of austenitic stainless steels related solidi- fication cracking to both solidification mode and impurity content by develop- ing weldability diagrams (Refs. 2–6). The weldability diagrams mapped crack- ing behavior on a plot of impurity con- tent of P plus S vs. Cr eq /Ni eq . In the weldability diagram at low Cr eq /Ni eq , primary austenite solidification occurs and cracking was present unless the combined impurity content was below approximately 0.02 wt-%. As Cr eq /Ni eq increases above some critical value where primary ferrite solidification oc- curs, cracking is prevented regardless of impurity content. The weldability dia- grams were originally developed for arc welding. Later it was discovered that the rapid solidification conditions of high- energy-density welding at high travel speeds in austenitic stainless steels can cause a shift to primary austenite solidi- fication when primary ferrite solidifica- tion mode would be expected (Refs. 7– 12). One theory to explain the shift holds that increasing solidification rates increase the undercooling at the solidifi- cation front, thereby increasing the sta- bility of the austenite relative to the fer- rite (Refs. 4, 13). The shift in solidifica- tion behavior also changes the composi- tion ranges that are crack susceptible (Refs. 4, 14), which led to the develop- ment of weldability diagrams for pulsed laser welding of 300 series austenitic stainless steels (Refs. 4–6). The weldability diagrams discussed above relate solidification cracking to alloy composition and impurity levels for 300 series stainless steels for both laser and arc welding. It is unlikely that the diagrams developed for 300 series stainless steels are pertinent to solidifi- cation cracking of 21-6-9. Given the higher N and Mn content of 21-6-9, the relationship between solidification cracking and chemical composition for 21-6-9 is likely different than predicted by existing weldability diagrams. In the weldability diagrams devel- oped thus far (Refs. 2–6), the effects of S and P have been equally weighted WELDING RESEARCH NOVEMBER 2016 / WELDING JOURNAL 409-s SUPPLEMENT TO THE WELDING JOURNAL, NOVEMBER 2016 Sponsored by the American Welding Society and the Welding Research Council Laser Weldability of 21Cr-6Ni-9Mn Stainless Steel: Part 2 — Weldability Diagrams Fourteen commercial and 20 experimental 21-6-9 alloys, as well as seven other high-N and high-Mn austenitic stainless steels, were welded at different speeds to develop weldability diagrams BY S. B. TATE, D. A. JAVERNICK, T. J. LIENERT, AND S. LIU ABSTRACT In this second part of the study, weldability diagrams developed to relate solidifica- tion crack susceptibility and chemical composition for laser-welded Type 21Cr-6Ni-9Mn (21-6-9) stainless steel are presented. Sigmajig testing on 14 commercial 21-6-9 alloys, 20 experimental 21-6-9 alloys, and seven other high-N, high-Mn austenitic stainless steels was used to develop weldability diagrams for solidification crack susceptibility for laser welding of Type 21-6-9. Three travel speeds were used to show the changes in minimum Cr eq /Ni eq for primary ferrite solidification as solidification rate increased with travel speed. Primary austenite solidification was observed below 1.55 Cr eq /Ni eq (Espy equivalents) at 21 mm/s travel speed. At 42 mm/s travel speed, a mix of solidification modes were displayed for alloys from 1.55 to 1.75 Cr eq /Ni eq . Primary ferrite solidifica- tion was observed above 1.75 Cr eq /Ni eq at both 42 and 85 mm/s travel speeds. No so- lidification cracking was observed for alloys with primary ferrite solidification. Variable cracking behavior was found in alloys with primary austenite solidification, but in gen- eral, cracking was observed in alloys with greater than 0.02 wt-% combined impurity content according to (P + 0.2S). KEYWORDS • Solidification Cracking • Stainless Steel • Weldability Diagrams • Nitronic S. B. TATE ([email protected]), formerly a graduate student at the Colorado School of Mines, is with AK Steel Corp., Middletown, Ohio. D. A. JAVERNICK ([email protected]) and T. J. LIENERT ([email protected]) are with the Los Alamos National Laboratory, Los Alamos, N.Mex. S. LIU ([email protected]) is with the Colorado School of Mines, Golden, Colo.

Welcome message from author
This document is posted to help you gain knowledge. Please leave a comment to let me know what you think about it! Share it to your friends and learn new things together.
Transcript

Introduction Solidification cracking is a well-known weldability issue withaustenitic stainless steels, with solidi-fication mode and impurity contentbeing important factors. Part 1 of thisstudy (Ref. 1) presented the effects ofS and P on solidification cracking un-der primary austenite solidification,and the relationship between solidifi-cation mode chemical compositionrepresented as Creq as a function ofNieq for Type 21Cr-6Ni-9Mn (21-6-9),an alloy also known as Nitronic® 40.
Previous research on welding ofaustenitic stainless steels related solidi-fication cracking to both solidificationmode and impurity content by develop-ing weldability diagrams (Refs. 2–6).The weldability diagrams mapped crack-ing behavior on a plot of impurity con-tent of P plus S vs. Creq/Nieq. In theweldability diagram at low Creq/Nieq,primary austenite solidification occursand cracking was present unless thecombined impurity content was belowapproximately 0.02 wt-%. As Creq/Nieqincreases above some critical valuewhere primary ferrite solidification oc-
curs, cracking is prevented regardless ofimpurity content. The weldability dia-grams were originally developed for arcwelding. Later it was discovered that therapid solidification conditions of high-energy-density welding at high travelspeeds in austenitic stainless steels cancause a shift to primary austenite solidi-fication when primary ferrite solidifica-tion mode would be expected (Refs. 7–12). One theory to explain the shiftholds that increasing solidification ratesincrease the undercooling at the solidifi-cation front, thereby increasing the sta-bility of the austenite relative to the fer-rite (Refs. 4, 13). The shift in solidifica-tion behavior also changes the composi-tion ranges that are crack susceptible(Refs. 4, 14), which led to the develop-ment of weldability diagrams for pulsedlaser welding of 300 series austeniticstainless steels (Refs. 4–6). The weldability diagrams discussedabove relate solidification cracking toalloy composition and impurity levelsfor 300 series stainless steels for bothlaser and arc welding. It is unlikely thatthe diagrams developed for 300 seriesstainless steels are pertinent to solidifi-cation cracking of 21-6-9. Given thehigher N and Mn content of 21-6-9, therelationship between solidificationcracking and chemical composition for21-6-9 is likely different than predictedby existing weldability diagrams. In the weldability diagrams devel-oped thus far (Refs. 2–6), the effectsof S and P have been equally weighted
WELDING RESEARCH
NOVEMBER 2016 / WELDING JOURNAL 409-s
SUPPLEMENT TO THE WELDING JOURNAL, NOVEMBER 2016Sponsored by the American Welding Society and the Welding Research Council
Laser Weldability of 21Cr6Ni9Mn Stainless Steel:Part 2 — Weldability Diagrams
Fourteen commercial and 20 experimental 2169 alloys, as well as seven other highN andhighMn austenitic stainless steels, were welded at different speeds to develop
weldability diagrams
BY S. B. TATE, D. A. JAVERNICK, T. J. LIENERT, AND S. LIU
ABSTRACT In this second part of the study, weldability diagrams developed to relate solidification crack susceptibility and chemical composition for laserwelded Type 21Cr6Ni9Mn(2169) stainless steel are presented. Sigmajig testing on 14 commercial 2169 alloys,20 experimental 2169 alloys, and seven other highN, highMn austenitic stainlesssteels was used to develop weldability diagrams for solidification crack susceptibility forlaser welding of Type 2169. Three travel speeds were used to show the changes inminimum Creq/Nieq for primary ferrite solidification as solidification rate increased withtravel speed. Primary austenite solidification was observed below 1.55 Creq/Nieq (Espyequivalents) at 21 mm/s travel speed. At 42 mm/s travel speed, a mix of solidificationmodes were displayed for alloys from 1.55 to 1.75 Creq/Nieq. Primary ferrite solidification was observed above 1.75 Creq/Nieq at both 42 and 85 mm/s travel speeds. No solidification cracking was observed for alloys with primary ferrite solidification. Variablecracking behavior was found in alloys with primary austenite solidification, but in general, cracking was observed in alloys with greater than 0.02 wt% combined impuritycontent according to (P + 0.2S).
KEYWORDS • Solidification Cracking • Stainless Steel • Weldability Diagrams • Nitronic
S. B. TATE ([email protected]), formerly a graduate student at the Colorado School of Mines, is with AK Steel Corp., Middletown,Ohio. D. A. JAVERNICK ([email protected]) and T. J. LIENERT ([email protected]) are with the Los Alamos National Laboratory, Los Alamos, N.Mex.S. LIU ([email protected]) is with the Colorado School of Mines, Golden, Colo.
Tate 11-16.qxp_Layout 1 10/14/16 10:09 AM Page 409
regarding influence on crack susceptibility. Several researchershave shown that P has a larger effecton increasing solidification crackingsusceptibility than S in bothaustenitic stainless steels (Refs. 15–18) and high-manganese steels (Ref.19). The differing effects of P and Son solidification cracking were alsoobserved for 21-6-9 (Ref. 1) and weretaken into consideration for the weld-ability diagrams developed. The goal of Part 2 of this work wasto characterize the solidification crack-ing behavior of 21-6-9 during laserwelding. Weldability diagrams for laserwelded 21-6-9 were developed, relat-ing solidification mode and solidifica-tion cracking to chemical compositionand impurity content. The weldabilitydiagrams were created using a largenumber of heats of 21-6-9 for a rangeof solidification rates to observe theshift in critical Creq/Nieq for primaryferrite solidification as solidificationrate increases.
Experimental A brief recapitulation of the experi-mental work is given here. For furtherdetails, see Part 1 of this investigation(Ref. 1). A wide range of chemical compositions of high-nitrogen, high-manganese stainless steel materials,found in Table 1, were tested to exam-ine their solidification mode and solid-ification cracking behavior. All chemi-cal compositions were determined us-
ing optical emission spec-troscopy (OES) for the ma-jority of the elements, andLeco inert gas fusion tech-niques for nitrogen, carbon,and sulfur. The chemicalcomposition presented is
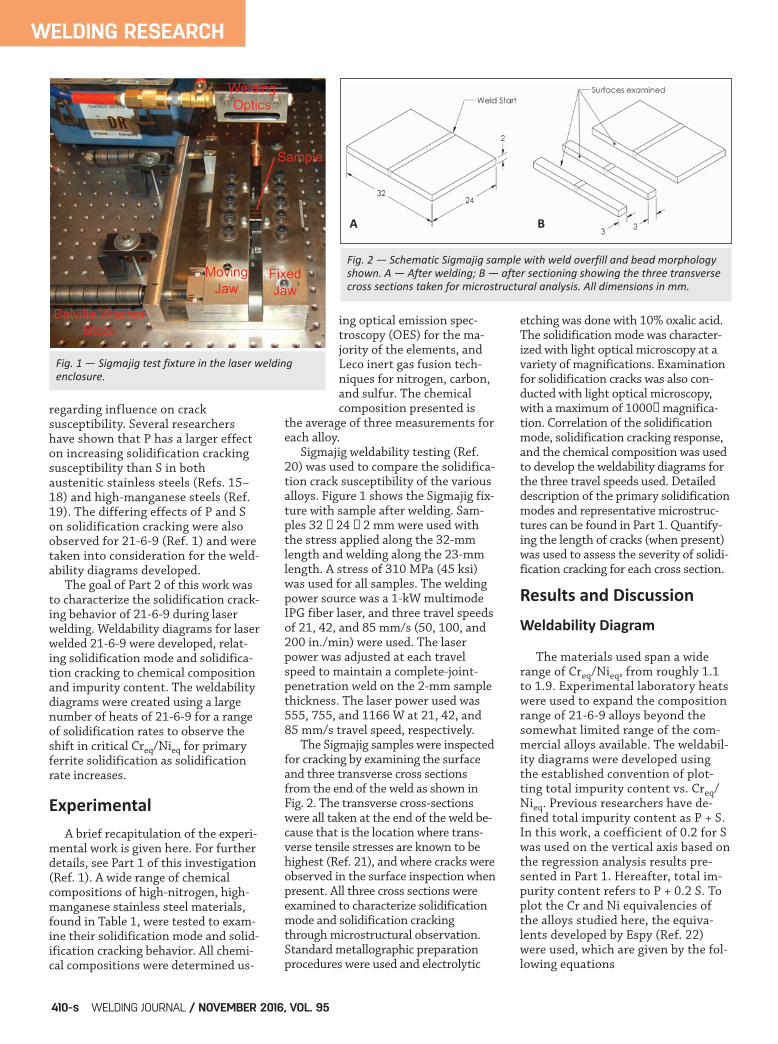
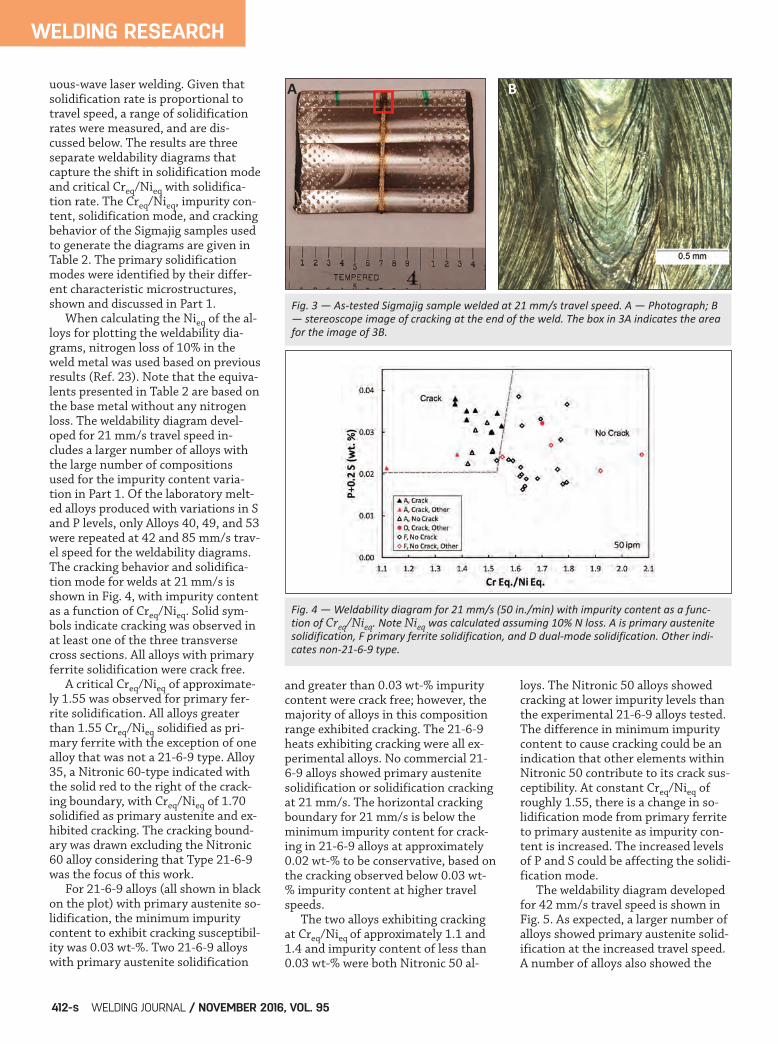
the average of three measurements foreach alloy. Sigmajig weldability testing (Ref.20) was used to compare the solidifica-tion crack susceptibility of the variousalloys. Figure 1 shows the Sigmajig fix-ture with sample after welding. Sam-ples 32 ¥ 24 ¥ 2 mm were used withthe stress applied along the 32-mmlength and welding along the 23-mmlength. A stress of 310 MPa (45 ksi)was used for all samples. The weldingpower source was a 1-kW multimodeIPG fiber laser, and three travel speedsof 21, 42, and 85 mm/s (50, 100, and200 in./min) were used. The laserpower was adjusted at each travelspeed to maintain a complete-joint-penetration weld on the 2-mm samplethickness. The laser power used was555, 755, and 1166 W at 21, 42, and85 mm/s travel speed, respectively. The Sigmajig samples were inspectedfor cracking by examining the surfaceand three transverse cross sectionsfrom the end of the weld as shown inFig. 2. The transverse cross-sectionswere all taken at the end of the weld be-cause that is the location where trans-verse tensile stresses are known to behighest (Ref. 21), and where cracks wereobserved in the surface inspection whenpresent. All three cross sections wereexamined to characterize solidificationmode and solidification crackingthrough microstructural observation.Standard metallographic preparationprocedures were used and electrolytic
etching was done with 10% oxalic acid.The solidification mode was character-ized with light optical microscopy at avariety of magnifications. Examinationfor solidification cracks was also con-ducted with light optical microscopy,with a maximum of 1000¥ magnifica-tion. Correlation of the solidificationmode, solidification cracking response,and the chemical composition was usedto develop the weldability diagrams forthe three travel speeds used. Detaileddescription of the primary solidificationmodes and representative microstruc-tures can be found in Part 1. Quantify-ing the length of cracks (when present)was used to assess the severity of solidi-fication cracking for each cross section.
Results and DiscussionWeldability Diagram
The materials used span a widerange of Creq/Nieq, from roughly 1.1to 1.9. Experimental laboratory heatswere used to expand the compositionrange of 21-6-9 alloys beyond thesomewhat limited range of the com-mercial alloys available. The weldabil-ity diagrams were developed usingthe established convention of plot-ting total impurity content vs. Creq/Nieq. Previous researchers have de-fined total impurity content as P + S.In this work, a coefficient of 0.2 for Swas used on the vertical axis based onthe regression analysis results pre-sented in Part 1. Hereafter, total im-purity content refers to P + 0.2 S. Toplot the Cr and Ni equivalencies ofthe alloys studied here, the equiva-lents developed by Espy (Ref. 22)were used, which are given by the fol-lowing equations
WELDING RESEARCH
WELDING JOURNAL / NOVEMBER 2016, VOL. 95410-s
Fig. 1 — Sigmajig test fixture in the laser welding enclosure.
Fig. 2 — Schematic Sigmajig sample with weld overfill and bead morphologyshown. A — After welding; B — after sectioning showing the three transversecross sections taken for microstructural analysis. All dimensions in mm.
A B
Tate 11-16.qxp_Layout 1 10/14/16 10:10 AM Page 410

Creq = %Cr + %Mo + 1.5 ¥ %Si + 0.5 ¥ %Nb + 5 ¥ %V + 3 ¥ %Al Nieq = %Ni + 30 ¥ %C + 0.87 for Mn + 0.33 ¥ %Cu + (%N – 0.45)
¥ NCoef.
where NCoef . = 30 when nitrogen is0.0–0.20 wt-% or NCoef. = 22 when ni-trogen is 0.21–0.25 wt-% or NCoef. = 20
when nitrogen is 0.26–0.35 wt-%. TheEspy coefficients were developed usingcomposition ranges of approximately17–22 wt-% Cr, 4–13 wt-% Ni, 5–14wt-% Mn, 0.5–4 wt-% Si, and 0.1–0.35wt-% N. Espy coefficients were chosenbased on their known applicability to21-6-9, as detailed in Part 1. Some ofthe other alloys tested in this work ex-tend beyond the composition ranges
to develop the equivalents. It was as-sumed the equivalents could be ex-trapolated to be used for the few alloysoutside the original compositionrange. Matching the primary solidificationmode diagrams presented in Part 1,the weldability diagrams were devel-oped at three distinct travel speedsthat span a range common for contin-
WELDING RESEARCH
NOVEMBER 2016 / WELDING JOURNAL 411-s
Table 1 — Alloy Compositions (wt%, balance Fe)
Alloy Type Element Cr Ni Mn N C Si P S Mo Ti Nb Cu V Al Co
1 2169 19.90 6.49 8.94 0.23 0.031 0.54 0.017 0.001 0.047 0.001 0.019 0.010 0.039 0.025 0.193 2 2169 19.89 6.55 8.96 0.31 0.030 0.49 0.016 0.001 0.100 0.001 0.019 0.016 0.039 0.032 0.205 3 2169 19.80 7.11 9.43 0.27 0.030 0.39 0.019 0.001 0.179 0.001 0.026 0.000 0.099 0.023 0.055 4 2169 19.93 6.51 8.93 0.30 0.032 0.50 0.017 0.001 0.103 0.001 0.019 0.020 0.040 0.034 0.195 5 2169 19.88 6.14 8.91 0.28 0.029 0.49 0.018 0.001 0.102 0.001 0.022 0.052 0.136 0.029 0.158 6 2169 19.46 7.26 9.32 0.27 0.021 0.54 0.019 0.001 0.111 0.001 0.022 0.182 0.053 0.021 0.149 7 2169 19.40 7.20 9.04 0.26 0.034 0.45 0.020 0.001 0.092 0.001 0.032 0.137 0.137 0.022 0.096 8 2169 19.74 6.62 9.47 0.27 0.021 0.43 0.027 0.005 0.382 0.008 0.056 0.343 0.132 0.014 0.317 9 2169 19.73 6.44 8.72 0.31 0.021 0.31 0.022 0.001 0.080 0.001 0.023 0.159 0.050 0.010 0.040 10 2169 20.44 7.06 8.94 0.36 0.028 0.70 0.023 0.001 0.248 0.001 0.041 0.350 0.063 0.025 0.081 11 2169 19.43 6.20 9.36 0.33 0.034 0.38 0.023 0.002 0.227 0.001 0.034 0.243 0.112 0.009 0.066 12 2169 18.74 6.89 9.31 0.23 0.011 0.30 0.019 0.002 0.044 0.001 0.019 0.000 0.027 0.024 0.040 13 2169 19.49 6.89 9.31 0.30 0.028 0.36 0.023 0.001 0.419 0.001 0.038 0.197 0.096 0.020 0.161 14 2169 19.99 6.35 8.88 0.27 0.032 0.44 0.021 0.002 0.126 0.006 0.055 0.121 0.130 0.007 0.136
30 18212 18.64 1.23 11.50 0.35 0.101 0.71 0.021 0.001 0.088 0.001 0.031 0.105 0.094 0.009 0.049 31 SCF260 18.73 2.73 17.40 0.60 0.035 0.54 0.024 0.001 2.258 0.001 0.028 0.040 0.149 0.027 0.063 32 1515HS Max 18.89 1.02 16.97 0.57 0.033 0.43 0.027 0.001 0.816 0.001 0.033 0.085 0.161 0.023 0.070 33 Nitronic 50 21.42 15.18 4.97 0.35 0.048 0.35 0.020 0.007 2.466 0.056 0.127 0.093 0.199 0.011 0.135 34 Nitronic 50 21.23 11.92 5.00 0.25 0.031 0.27 0.024 0.004 2.090 0.005 0.140 0.500 0.140 0.005 0.050 35 Nitronic 60 16.99 7.95 7.78 0.16 0.061 3.74 0.032 0.001 0.341 0.010 0.005 0.273 0.065 0.020 0.097 36 Nitronic 30 16.58 3.28 8.51 0.17 0.029 0.33 0.024 0.005 0.110 0.005 0.013 0.523 0.059 0.008 0.071
40 14 19.67 7.06 8.86 0.39 0.030 0.46 0.022 0.003 0.127 0.006 0.055 0.136 0.138 0.011 0.138 41 14 19.65 7.14 8.95 0.33 0.030 0.46 0.023 0.012 0.127 0.006 0.055 0.138 0.137 0.011 0.142 42 14 19.67 6.98 8.80 0.34 0.031 0.47 0.021 0.024 0.125 0.006 0.055 0.140 0.141 0.011 0.140 43 14 19.46 6.97 9.06 0.33 0.031 0.48 0.023 0.035 0.127 0.006 0.055 0.149 0.144 0.011 0.137 44 14 19.60 7.02 8.74 0.38 0.030 0.45 0.025 0.003 0.125 0.006 0.055 0.131 0.133 0.011 0.132 45 14 19.69 7.11 8.74 0.37 0.031 0.46 0.030 0.003 0.127 0.006 0.055 0.136 0.139 0.011 0.134 46 14 19.58 7.09 8.91 0.38 0.030 0.47 0.035 0.003 0.129 0.006 0.055 0.139 0.140 0.011 0.134 47 14 19.53 7.13 9.00 0.38 0.031 0.46 0.031 0.012 0.128 0.006 0.055 0.137 0.137 0.011 0.130 48 14 19.54 7.08 8.81 0.37 0.030 0.44 0.024 0.009 0.125 0.006 0.055 0.128 0.131 0.011 0.134 49 14 19.39 7.06 9.04 0.33 0.031 0.47 0.026 0.019 0.128 0.006 0.055 0.142 0.140 0.011 0.135 50 14 19.52 7.05 8.87 0.37 0.030 0.48 0.031 0.019 0.128 0.006 0.055 0.145 0.143 0.011 0.137 51 14 19.33 6.90 8.98 0.35 0.030 0.48 0.024 0.041 0.125 0.006 0.055 0.153 0.144 0.011 0.140 52 14 19.41 7.02 8.93 0.31 0.031 0.45 0.022 0.048 0.128 0.006 0.055 0.135 0.136 0.011 0.135 53 14 19.35 6.98 8.97 0.32 0.029 0.47 0.023 0.058 0.128 0.006 0.055 0.142 0.140 0.011 0.138 54 11 18.93 7.33 9.64 0.36 0.034 0.42 0.034 0.012 0.215 0.004 0.031 0.258 0.114 0.014 0.069 55 11 18.97 7.35 9.40 0.36 0.034 0.42 0.034 0.017 0.214 0.003 0.030 0.249 0.113 0.012 0.067 56 14 19.88 6.16 9.19 0.34 0.030 0.46 0.029 0.014 0.125 0.002 0.018 0.140 0.131 0.016 0.136 57 14 19.84 6.24 9.14 0.34 0.031 0.48 0.035 0.019 0.127 0.002 0.019 0.147 0.135 0.016 0.138 58 14 20.01 6.16 9.21 0.31 0.031 0.48 0.031 0.012 0.125 0.002 0.019 0.147 0.135 0.017 0.135 59 14 20.12 6.18 8.93 0.27 0.031 0.45 0.033 0.019 0.124 0.001 0.017 0.136 0.130 0.014 0.132
Type for Alloys 40–59 indicate the starting material used for melting.
Tate 11-16.qxp_Layout 1 10/14/16 10:11 AM Page 411
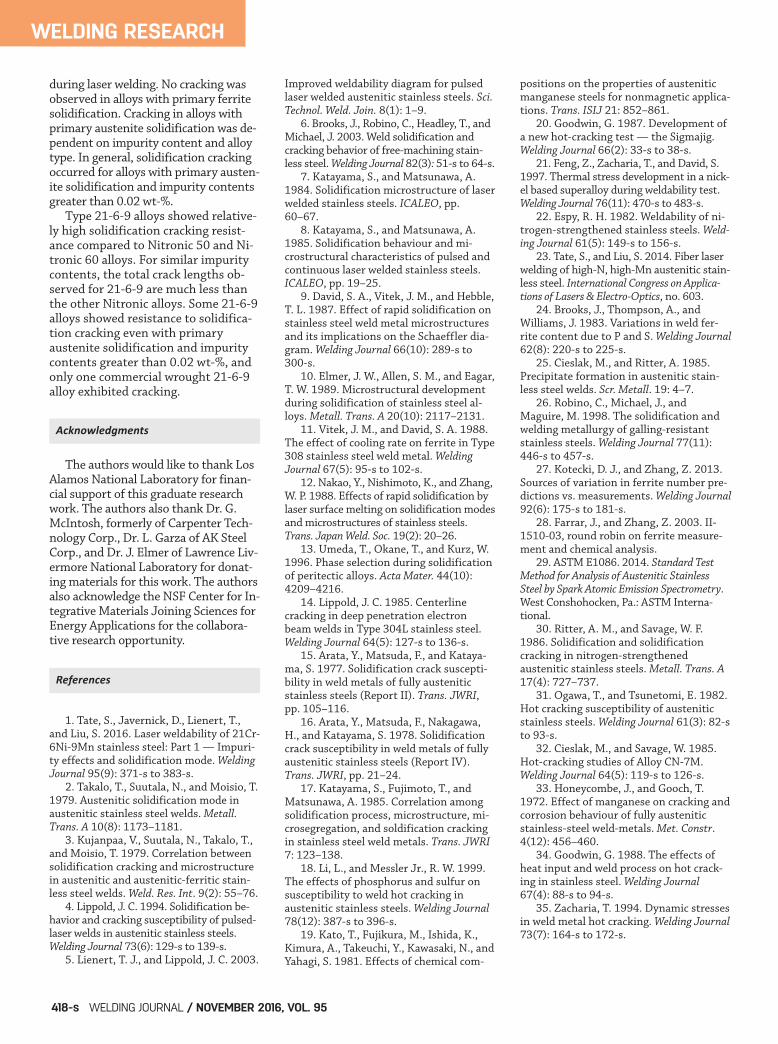
uous-wave laser welding. Given thatsolidification rate is proportional totravel speed, a range of solidificationrates were measured, and are dis-cussed below. The results are threeseparate weldability diagrams thatcapture the shift in solidification modeand critical Creq/Nieq with solidifica-tion rate. The Creq/Nieq, impurity con-tent, solidification mode, and crackingbehavior of the Sigmajig samples usedto generate the diagrams are given inTable 2. The primary solidificationmodes were identified by their differ-ent characteristic microstructures,shown and discussed in Part 1. When calculating the Nieq of the al-loys for plotting the weldability dia-grams, nitrogen loss of 10% in theweld metal was used based on previousresults (Ref. 23). Note that the equiva-lents presented in Table 2 are based onthe base metal without any nitrogenloss. The weldability diagram devel-oped for 21 mm/s travel speed in-cludes a larger number of alloys withthe large number of compositionsused for the impurity content varia-tion in Part 1. Of the laboratory melt-ed alloys produced with variations in Sand P levels, only Alloys 40, 49, and 53were repeated at 42 and 85 mm/s trav-el speed for the weldability diagrams.The cracking behavior and solidifica-tion mode for welds at 21 mm/s isshown in Fig. 4, with impurity contentas a function of Creq/Nieq. Solid sym-bols indicate cracking was observed inat least one of the three transversecross sections. All alloys with primaryferrite solidification were crack free. A critical Creq/Nieq of approximate-
ly 1.55 was observed for primary fer-rite solidification. All alloys greaterthan 1.55 Creq/Nieq solidified as pri-mary ferrite with the exception of onealloy that was not a 21-6-9 type. Alloy35, a Nitronic 60-type indicated withthe solid red to the right of the crack-ing boundary, with Creq/Nieq of 1.70solidified as primary austenite and ex-hibited cracking. The cracking bound-ary was drawn excluding the Nitronic60 alloy considering that Type 21-6-9was the focus of this work. For 21-6-9 alloys (all shown in blackon the plot) with primary austenite so-lidification, the minimum impuritycontent to exhibit cracking susceptibil-ity was 0.03 wt-%. Two 21-6-9 alloyswith primary austenite solidification
and greater than 0.03 wt-% impuritycontent were crack free; however, themajority of alloys in this compositionrange exhibited cracking. The 21-6-9heats exhibiting cracking were all ex-perimental alloys. No commercial 21-6-9 alloys showed primary austenitesolidification or solidification crackingat 21 mm/s. The horizontal crackingboundary for 21 mm/s is below theminimum impurity content for crack-ing in 21-6-9 alloys at approximately0.02 wt-% to be conservative, based onthe cracking observed below 0.03 wt-% impurity content at higher travelspeeds. The two alloys exhibiting crackingat Creq/Nieq of approximately 1.1 and1.4 and impurity content of less than0.03 wt-% were both Nitronic 50 al-
loys. The Nitronic 50 alloys showedcracking at lower impurity levels thanthe experimental 21-6-9 alloys tested.The difference in minimum impuritycontent to cause cracking could be anindication that other elements withinNitronic 50 contribute to its crack sus-ceptibility. At constant Creq/Nieq ofroughly 1.55, there is a change in so-lidification mode from primary ferriteto primary austenite as impurity con-tent is increased. The increased levelsof P and S could be affecting the solidi-fication mode. The weldability diagram developedfor 42 mm/s travel speed is shown inFig. 5. As expected, a larger number ofalloys showed primary austenite solid-ification at the increased travel speed. A number of alloys also showed the
WELDING RESEARCH
WELDING JOURNAL / NOVEMBER 2016, VOL. 95412-s
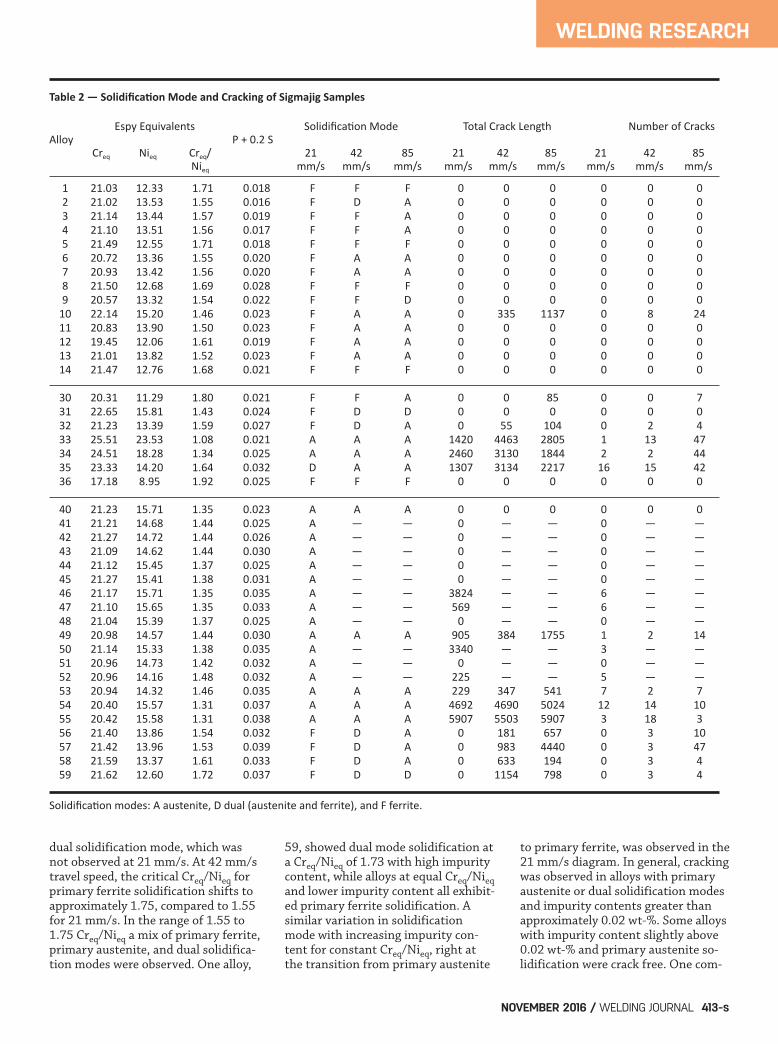
Fig. 3 — Astested Sigmajig sample welded at 21 mm/s travel speed. A — Photograph; B— stereoscope image of cracking at the end of the weld. The box in 3A indicates the areafor the image of 3B.
Fig. 4 — Weldability diagram for 21 mm/s (50 in./min) with impurity content as a function of Creq/Nieq. Note Nieq was calculated assuming 10% N loss. A is primary austenitesolidification, F primary ferrite solidification, and D dualmode solidification. Other indicates non2169 type.
A B
Tate 11-16.qxp_Layout 1 10/14/16 10:13 AM Page 412
dual solidification mode, which wasnot observed at 21 mm/s. At 42 mm/stravel speed, the critical Creq/Nieq forprimary ferrite solidification shifts toapproximately 1.75, compared to 1.55for 21 mm/s. In the range of 1.55 to1.75 Creq/Nieq a mix of primary ferrite,primary austenite, and dual solidifica-tion modes were observed. One alloy,
59, showed dual mode solidification ata Creq/Nieq of 1.73 with high impuritycontent, while alloys at equal Creq/Nieqand lower impurity content all exhibit-ed primary ferrite solidification. Asimilar variation in solidificationmode with increasing impurity con-tent for constant Creq/Nieq, right atthe transition from primary austenite
to primary ferrite, was observed in the21 mm/s diagram. In general, crackingwas observed in alloys with primaryaustenite or dual solidification modesand impurity contents greater thanapproximately 0.02 wt-%. Some alloyswith impurity content slightly above0.02 wt-% and primary austenite so-lidification were crack free. One com-
WELDING RESEARCH
NOVEMBER 2016 / WELDING JOURNAL 413-s
Table 2 — Solidification Mode and Cracking of Sigmajig Samples
Espy Equivalents Solidification Mode Total Crack Length Number of CracksAlloy P + 0.2 S Creq Nieq Creq/ 21 42 85 21 42 85 21 42 85 Nieq mm/s mm/s mm/s mm/s mm/s mm/s mm/s mm/s mm/s
1 21.03 12.33 1.71 0.018 F F F 0 0 0 0 0 0 2 21.02 13.53 1.55 0.016 F D A 0 0 0 0 0 0 3 21.14 13.44 1.57 0.019 F F A 0 0 0 0 0 0 4 21.10 13.51 1.56 0.017 F F A 0 0 0 0 0 0 5 21.49 12.55 1.71 0.018 F F F 0 0 0 0 0 0 6 20.72 13.36 1.55 0.020 F A A 0 0 0 0 0 0 7 20.93 13.42 1.56 0.020 F A A 0 0 0 0 0 0 8 21.50 12.68 1.69 0.028 F F F 0 0 0 0 0 0 9 20.57 13.32 1.54 0.022 F F D 0 0 0 0 0 0 10 22.14 15.20 1.46 0.023 F A A 0 335 1137 0 8 24 11 20.83 13.90 1.50 0.023 F A A 0 0 0 0 0 0 12 19.45 12.06 1.61 0.019 F A A 0 0 0 0 0 0 13 21.01 13.82 1.52 0.023 F A A 0 0 0 0 0 0 14 21.47 12.76 1.68 0.021 F F F 0 0 0 0 0 0
30 20.31 11.29 1.80 0.021 F F A 0 0 85 0 0 7 31 22.65 15.81 1.43 0.024 F D D 0 0 0 0 0 0 32 21.23 13.39 1.59 0.027 F D A 0 55 104 0 2 4 33 25.51 23.53 1.08 0.021 A A A 1420 4463 2805 1 13 47 34 24.51 18.28 1.34 0.025 A A A 2460 3130 1844 2 2 44 35 23.33 14.20 1.64 0.032 D A A 1307 3134 2217 16 15 42 36 17.18 8.95 1.92 0.025 F F F 0 0 0 0 0 0
40 21.23 15.71 1.35 0.023 A A A 0 0 0 0 0 0 41 21.21 14.68 1.44 0.025 A — — 0 — — 0 — — 42 21.27 14.72 1.44 0.026 A — — 0 — — 0 — — 43 21.09 14.62 1.44 0.030 A — — 0 — — 0 — — 44 21.12 15.45 1.37 0.025 A — — 0 — — 0 — — 45 21.27 15.41 1.38 0.031 A — — 0 — — 0 — — 46 21.17 15.71 1.35 0.035 A — — 3824 — — 6 — — 47 21.10 15.65 1.35 0.033 A — — 569 — — 6 — — 48 21.04 15.39 1.37 0.025 A — — 0 — — 0 — — 49 20.98 14.57 1.44 0.030 A A A 905 384 1755 1 2 14 50 21.14 15.33 1.38 0.035 A — — 3340 — — 3 — — 51 20.96 14.73 1.42 0.032 A — — 0 — — 0 — — 52 20.96 14.16 1.48 0.032 A — — 225 — — 5 — — 53 20.94 14.32 1.46 0.035 A A A 229 347 541 7 2 7 54 20.40 15.57 1.31 0.037 A A A 4692 4690 5024 12 14 10 55 20.42 15.58 1.31 0.038 A A A 5907 5503 5907 3 18 3 56 21.40 13.86 1.54 0.032 F D A 0 181 657 0 3 10 57 21.42 13.96 1.53 0.039 F D A 0 983 4440 0 3 47 58 21.59 13.37 1.61 0.033 F D A 0 633 194 0 3 4 59 21.62 12.60 1.72 0.037 F D D 0 1154 798 0 3 4
Solidification modes: A austenite, D dual (austenite and ferrite), and F ferrite.
Tate 11-16.qxp_Layout 1 10/14/16 10:13 AM Page 413

mercial 21-6-9 alloy, 10, showed crack-ing at 42 mm/s travel speed as the so-lidification mode had shifted to pri-mary austenite. However, other 21-6-9alloys (both experimental and com-mercial) with similar impurity levelsthat also had primary austenite solidi-fication showed no cracking. Alloyswith impurity contents less than 0.02wt-% or primary ferrite solidificationwere crack free. Figure 6 shows the weldability dia-gram developed for 85 mm/s. TheCreq/Nieq of 1.75 separating primaryaustenite from primary ferrite solidifi-cation has not shifted as the travelspeed was increased from 42 to 85mm/s. At 85 mm/s, all but one of thealloys in the range of 1.55 to 1.75Creq/Nieq exhibit primary austenite so-lidification compared to the variationof solidification modes in thatCreq/Nieq range at 42 mm/s travelspeed. The cracking behaviors ob-served are similar to those found at 42mm/s, with no cracking in alloys withprimary ferrite solidification, and themajority of the alloys with Creq/Nieqless than 1.75 and impurity contentsof 0.02 wt-% and greater displayingcracking. One alloy, 30, of 18Cr-2Ni-12Mn type, at Creq/Nieq of 1.92,showed primary austenite solidifica-tion and minor cracking, and again,because the focus of this work wasType 21-6-9, the cracking demarcationwas drawn discounting the Alloy 30point at 85 mm/s. Again, of the com-mercial 21-6-9 alloys, only Alloy 10
showed cracking. The other eight 21-6-9 alloys with primary austenite so-lidification mode showed no crackingeven at similar impurity levels. Alsosimilar to the observations at 42mm/s, at the highest travel speed,there was still variation in solidifica-tion mode at constant Creq/Nieq wherethe vertical crack demarcation line islocated. Alloy 59 showed dual solidifi-cation modes with high impurity con-tent and Creq/Nieq of 1.79 while pri-mary ferrite solidification was ob-served in several alloys at lower impu-rity content. Uncertainty values are not present-ed on the weldability diagrams shownin Figs. 4–6 because the plots becomedifficult to interpret with the largenumber of error bars. Uncertainty ofthe chemical analysis was calculatedusing one standard deviation of theanalysis for each element based on thethree measurements of each alloy forchemical composition. With the aver-age standard deviation for each ele-ment from all the alloys, the uncer-tainty of the Cr and Ni equivalentswere calculated. The maximum andminimum equivalents calculated gavean uncertainty of ±0.019 Creq/Nieq.The uncertainty calculated for the im-purity content is ±0.0015 wt-% P +0.2S. Graphically on the plots, theseuncertainty values would be approxi-mately twice the size of the symbolsplotted. Given the uncertainty valuescalculated, the results presented forthe three weldability diagrams are con-
sidered reasonable. To summarize the weldability dia-gram results, cracking is expectedwhen both impurity contents (P +0.2S) are greater than 0.02 wt-% andprimary austenite solidification occursfor all travel speeds. At 21 mm/s travelspeed, a minimum Creq/Nieq of 1.55for primary ferrite solidification is re-quired. As travel speed increases to 42and 85 mm/s, the minimum Creq/Nieqfor primary ferrite solidification in-creases to approximately 1.75. Similar to previous weldability dia-grams (Refs. 3, 5), the horizontal lineseparating cracking and crack-free re-gions in the diagram is drawn flat withno slope, indicating there is no changein minimum impurity content for anyalloy with primary austenite solidifica-tion. The variability in cracking in theimpurity content range of 0.02–0.03wt-% discussed previously may indi-cate that a broader line or uncertaintybands may be appropriate on the hori-zontal portion of the cracking bound-ary. No ‘knee’ or curvature was includ-ed in the cracking line, with both thevertical and horizontal pieces connect-ing at a common point. Given the lackof data points in the region that wouldcontain the curvature and the uncer-tainty associated with the data pointsof the diagrams, no curvature was in-cluded in the cracking boundary. Unlike some previously developeddiagrams, the vertical cracking bound-ary was drawn at a slight inclination toindicate that solidification mode may
WELDING RESEARCH
WELDING JOURNAL / NOVEMBER 2016, VOL. 95414-s
Fig. 5 — Weldability diagram for 42 mm/s (100 in./min) withimpurity content as a function of Creq/Nieq. Note Nieq was calculated assuming 10% N loss. A is primary austenite solidification, F primary ferrite solidification, and D dualmodesolidification. Other indicates non2169 type.
Fig. 6 — Weldability diagram for 85 mm/s with impurity contentas a function of Creq/Nieq. Note Nieq was calculated assuming10% N loss. A is primary austenite solidification, F primary ferrite solidification, and D dualmode solidification. Other indicates non2169 type.
Tate 11-16.qxp_Layout 1 10/14/16 10:14 AM Page 414

be related to impurity content. At allthree travel speeds, at the Creq/Nieq forthe transition between primary ferriteand primary austenite solidification, avariation in solidification mode withimpurity content was observed. For aconstant Creq/Nieq of 1.55 at 21 mm/sand 1.75 at 42 and 85 mm/s, primaryferrite solidification was observed atlow impurity contents and dual or pri-mary austenite solidification modesare observed at high impurity content.The change in solidification modecould be due to impurity content af-fecting the solidification mode, orsome other factors not captured in theCr and Ni equivalencies such as ele-ments not included in the regressionor interaction effects between ele-ments. Possible elements not capturedin the Espy equivalents include Ti, aferrite stabilizer, and Co, an austenitestabilizer. Considering the composi-tions of Alloys 1 and 59, which exhibitthe variability in solidification mode atconstant Creq/Nieq for 42 and 85 mm/stravel speed welds, there is only minorvariation in the Ti and Co contents be-tween alloys. If anything, the slightlyhigher Co content of Alloy 1 shouldslightly increase the tendency for pri-mary austenite solidification relativeto Alloy 59. Literature (Refs. 24, 25)has shown that P and S can lower Crcontent of the matrix by forming Cr-rich sulfides and phosphides duringsolidification, effectively reducing theCr equivalent. Brooks et al. (Ref. 6) ob-served a similar shift in solidificationmode as impurity level increased atconstant Creq/Nieq for welding of free-machining austenitic stainless steelsand incorporated a similar slope to thevertical portion of the cracking bound-ary in the weldability diagram devel-oped in that work. The influence of Pand S levels of solidification behaviorare likely the cause of the shift in so-lidification mode at constantCreq/Nieq, and the slight slope of thevertical cracking boundary line isappropriate. The outlier (compared to the trendobserved for 21-6-9 solidificationmode) in the 21 mm/s travel speed di-agram of Alloy 35 with some primaryaustenite solidification at Creq/Nieq of1.70 agrees with work from Robino etal. (Ref. 26) where it was observed thatGall-Tough®, an alloy similar to Ni-tronic 60, shifted to primary austenite
solidification withpulsed laser weld-ing at a Creq/Nieqof 1.79. The rea-son for the outlierin the 85 mm/s di-agram with pri-mary austenite so-lidification in Al-loy 30 atCreq/Nieqof 1.92 isunknown. The uncertain-ty values of±0.019 Creq/Nieqand ±0.0015 wt-%impurity contentdiscussed aboverepresent onestandard devia-tion of the chemi-cal composition analysis from thethree analyses on the same laboratoryequipment. The variation in chemicalcomposition analysis between labora-tories must also be considered whenapplying the results of the weldabilitydiagrams. Recent work from Koteckiand Zhang (Ref. 27) highlights the re-sults on chemical composition analysisvariability from round robin interlabo-ratory testing of chemical compositionfor several stainless steel alloys. Toconsider the possible interlaboratoryvariability and bias, the Creq/Nieq un-certainty was estimated using pub-lished standard deviations for chemi-cal analysis from both round robin in-terlaboratory chemistry testing (Refs.27, 28) and ASTM E1086 (Ref. 29), therelevant standard. Calculating the un-certainty of Cr and Ni equivalents, thepossible range of Creq/Nieq is approxi-mately ±0.13 Creq/Nieq. Using the in-terlaboratory standard deviation for Pand S and using OES analysis fromASTM E1086 gives an uncertainty of±0.0018 wt-% P + 0.2S, slightly higherthan the impurity content uncertaintycalculated from the single laboratoryvalue. The interlaboratory impuritycontent uncertainty should be reducedslightly when using inert gas fusiontechnique to measure S as was done inthis work. The interlaboratory variability ofimpurity content is not likely to make alarge difference when applying theweldability diagram to predict solidifi-cation crack susceptibility, but the largeinterlaboratory variation in Creq/Nieq
could impair the applicability of the di-agrams. Such a large variation in meas-ured chemical composition would notbe expected typically, but the largemagnitude in possible variation ofCreq/Nieq must be taken into accountwhen applying the weldability diagram.Calibration of the OES instrument to a21-6-9 type standard when measuringthe chemical compositions should re-duce the uncertainty closer to the levelscalculated for the single instrumentanalysis of ±0.019 Creq/Nieq and±0.0015 wt-% impurity content. As reported in Part 1, average solid-ification rates of 6 mm/s at 21 mm/stravel speed, 13 mm/s at 42 mm/stravel speed, and 25 mm/s at 85 mm/stravel speed were observed at 50%penetration depth, which approachthe solidification rates reported forpulsed laser welding. Knowing that thesolidification rates at 85 mm/s areclose to pulsed laser welding that wasused to develop a weldability diagramfor 300 series stainless steels (Ref. 5)allows for comparison between thatdiagram and the 85 mm/s diagram.With pulsed laser welding, Lienert andLippold reported a minimum Creq/Nieqof 1.69 (H&S) for primary ferrite so-lidification, which is similar to the1.75 Espy Creq/Nieq observed for 21-6-9 at 25 mm/s solidification rate. Com-paring diagrams developed with differ-ent equivalents is subjective, and thelower solidification rates of this workcompared to pulsed laser welding mustalso be considered. For pulsed laserwelding of 21-6-9 or higher travelspeeds with continuous-wave laser
WELDING RESEARCH
NOVEMBER 2016 / WELDING JOURNAL 415-s
Fig. 7 — Total crack length as a function of travel speed for all alloys showing cracking.
Tate 11-16.qxp_Layout 1 10/14/16 10:17 AM Page 415

welding where the solidification rateswould be greater than the conditionsin this work, the minimum Creq/Nieqto ensure primary ferrite solidificationmay increase above 1.75.
Crack Severity
The binary representation of crackor no-crack on the weldability dia-grams does not completely capture thedifferences in the extent of the crack-ing observed. The severity of crackingwas evaluated using the measured to-tal crack lengths given in Table 2. Crack lengths presented are the total
for the entire area of all three cross sec-tions of an alloy. Total crack length var-ied significantly between different al-loys, and varied to a lesser extent withtravel speeds for a given alloy. Totalcrack length as a function of travelspeed is shown in Fig. 7 for three groupsof alloys — 21-6-9 alloys with impuritycontent greater than 0.035 wt-%, 21-6-9 alloys with impurity content less than0.035 wt-%, and other alloys. The highimpurity content 21-6-9 alloys withlarge (>3000 mm) total crack lengthsshowed relatively constant crack severi-ty as travel speed increased. Alloys otherthan 21-6-9 showed the highest cracklengths at 42 mm/s travel speed, butthis trend is not observed in the othermaterials. Overall, the crack severity ismuch more a function of chemical com-position than travel speed. For alloysthat showed cracking at all three travelspeeds, there was no clear trend inchange in crack length with travelspeed. While total crack length is roughly
constant for a given alloy as travelspeed varied, the number of cracks in-creased at 85 mm/s travel speed for allalloys except Alloy 55. Excluding Alloy55, it was observed that the length ofindividual cracks decreased and thenumber of cracks increased for 85mm/s travel speed. Alloy 55 had com-plete sample separation at 85 mm/s;the “cracks” were characterized asthree cracks, being one through-thick-ness centerline crack in each cross sec-tion. For the majority of alloys, at 85mm/s travel speed, the cracking shift-ed away from large centerline cracks tomultiple cracks on solidification grainboundaries away from the weld center-line. The change in weld pool shapeand growth angle as travel speed in-creases may affect the location of thecracking. Figure 8 shows the change incracking observed for Alloy 57 as trav-el speed increased from 42 to 85mm/s, typical of the shift observedfrom large centerline cracking to mul-tiple noncenterline cracks. The variation in crack severity inthe experimental 21-6-9 alloys waspresented previously. Comparing totalcrack length between commercial al-loys with similar impurity levels, theNitronic 50 and Nitronic 60 alloys(33–35) showed much greater crackingthan the 21-6-9 Alloy 10. Type 21-6-9alloys only showed large total cracklengths in the experimental alloyswith high impurity contents. The oth-er commercial alloys that showedcracking, 30 and 32, also showed verylow total crack lengths. Dual-mode solidification conditionstended to show lower total crack
lengths compared to primary austen-ite solidification in the same alloy,which is likely due to the cracking oc-curring only in regions of primaryaustenite solidification. With a lowervolume of weld pool that undergoesprimary austenite solidification that issusceptible to cracking, decreasedcrack lengths would be expected.
Chemical Composition and Solidification Cracking
Care must be used when applyingthe results of the limited study pre-sented here on the effects of S and Pon solidification cracking in 21-6-9 toother high-N, high-Mn austeniticstainless steel alloys. In general, forhigh-N, high-Mn stainless steels, theother minor constituents of an alloycould significantly change the cracksusceptibility. One indication of this isthe lower impurity levels that causedcracking in Nitronic 50 alloys com-pared to 21-6-9 observed in the weld-ability diagram at 21 mm/s travelspeed. Ritter and Savage (Ref. 30)showed that solidification cracking inNitronic 50 is related to the formationof a niobium carbonitride eutectic inthe interdendritic region during solidi-fication. Extensive cracking was alsoobserved for the Nitronic 50 alloys inthis work. The larger total cracklengths observed for Nitronic 50 alloysrelative to 21-6-9 at similar impuritycontent could be a function of the nio-bium-rich final solidification productsexpected for Nitronic 50 alloys. Even within 21-6-9 alloys there isvariable cracking at impurity contents
WELDING RESEARCH
WELDING JOURNAL / NOVEMBER 2016, VOL. 95416-s
Fig. 8 — Micrographs showing solidification cracking in Alloy 57. A — 42 mm/s travel speed; B — 85 mm/s travel speed.
A B
Tate 11-16.qxp_Layout 1 10/14/16 10:16 AM Page 416

of 0.02 to 0.03 wt-%. Alloy 10 showedcracking at 42 and 85 mm/s travelspeeds, but Alloys 11, 13, and 40 withsimilar impurity content and primaryaustenite solidification were crackfree. Small differences in alloy chemi-cal composition other than S and Pcould cause the variable cracking be-havior. Looking at the alloy composi-tions, the only noticeable differencesfor Alloy 10 are higher Si and Cu con-tents. Silicon is known to be detrimen-tal to solidification cracking resistancewith primary austenite solidification(Refs. 31, 32), and could have con-tributed to the difference in crackingbehavior of Alloy 10 relative to theother commercial 21-6-9 alloys. How-ever, further investigation is requiredto clarify the cracking mechanisms forAlloy 10 with primary austenite solidi-fication and the change in crack sus-ceptibility with chemical compositionvariation other than P and S. In gener-al, for Type 21-6-9 or other similar al-loys, it must be considered thatchanges in levels of minor alloying ele-ments (i.e., Mo, Nb, Si) or other resid-ual elements (possibly Cu) could causesignificant changes in solidificationbehavior and crack susceptibility rela-tive to the results observed here. The 21-6-9 alloys with primaryaustenite solidification and impuritycontents greater than 0.02 wt-% thattested crack free included Alloys 11, 13,and 40–45. Based on results from previ-ous weldability diagrams, crackingwould be expected in those conditions.The explanation for the difference incracking behavior for these 21-6-9 al-loys compared to the 300 series stain-less steels used in previous weldabilitydiagrams is unknown. The high Mn lev-el of 21-6-9 may allow 21-6-9 to toleratehigher S content, which could con-tribute to the difference in cracking be-havior. Considering the S levels are lowin the commercial 21-6-9 heats, the dif-ference in cracking behavior is likely notrelated to the propensity for 21-6-9 toform MnS. Excluding Alloy 10, the com-mercial 21-6-9 alloys showed lowercrack susceptibility than 300 series al-loys for given impurity contents in therange of 0.02–0.03 wt-%. Ogawa andTsunetomi (Ref. 31) showed that in-creasing weld metal N content de-creased crack susceptibility for a givenimpurity level in fully austenitic 310weld metal, and attributed the differ-
ence to reduced enrichment of Si atboundaries with higher N content. Thehigher N levels in 21-6-9 alloys relativeto 300 series alloys could influence par-titioning behavior of Si or other ele-ments that could contribute to cracksusceptibility. It is also possible the highMn content may be beneficial in aspectsother than just forming MnS, whichwould support the observations fromHoneycombe and Gooch (Ref. 33) ofMn significantly decreasing solidifica-tion cracking when added to 310 arcwelding filler metal. Additional work isnecessary to confirm the possibility andmechanism of either such hypothesis.
Effect of Restraint
No solidification cracking was ob-served in the alloys with primary fer-rite solidification for the given Sigma-jig testing conditions. The stress levelfor this work was chosen to create re-producible cracking in a known crack-susceptible heat of 309 stainless steelwith primary austenite solidification.Cracking may be observed at higherstress levels in alloys even with pri-mary ferrite solidification. However,in practical use, it is known that reduc-tion in crack susceptibility with pri-mary ferrite solidification is sufficientto avoid solidification cracking weld-ability issues. In this work, the travel speed wasvaried to change the solidification rateto observe changes in solidificationmode. The change in heat input withtravel speed and subsequent changesin local stress on the solidifying weldpool were unintentional. Goodwin(Ref. 34) showed that decreasing heatinput increased the stress level re-quired to initiate cracking for Sigmajigtesting. However, the changes in cracksusceptibility with heat input are con-sidered negligible compared to thechanges in crack susceptibility with so-lidification mode. It is known that immediately be-hind the weld pool the transverse (rel-ative to the welding direction) stressesare compressive, and only at somepoint away from the pool does thetransverse stress change to tensile(Ref. 35), where solidification crackscan then initiate in a susceptible mi-crostructure. Also, as discussed whendescribing the location for the crosssections taken from the Sigmajig sam-
ples, modeling work by Feng et al.(Ref. 21) showed the transverse tensilestress is only expected to develop inthe second half of the sample. Varyingtravel speed during the Sigmajig testshifts the locations at which the ten-sile transverse stress is present. In thework by Feng et al., at low travelspeeds (4.2 mm/s), the tensile regiononly develops in the final 20% of theweld length, and at high travel speeds(14.8 mm/s) the tensile region waspresent along 50% of the weld length.For the roughly constant cracking ob-served with variation in travel speedin this work, the increase in theamount of the sample subject to trans-verse tensile stress as travel speed in-creases could be offset by the reducedheat input at higher travel speeds. The modeling work also showedthat the longitudinal stress that couldpromote transverse cracking is presentin a much larger portion of the sampleat high travel speeds compared to onlyat the end of the weld at low travelspeeds. The large increase in the num-ber of noncenterline cracks observedat 85 mm/s travel speed relative to thelower travel speeds in this work maybe due to changes in the longitudinalstress within the weld. The lower travel speeds and arc weld-ing used in previous modeling of theSigmajig test are certainly differentthan the conditions used to develop theweldability diagrams here. Compared toarc welding, the laser welding thermalcycle, weld pool shape, and increasedtravel speeds would change the stressstate and the transient nature of thestresses. Modeling work of the Sigmajigtesting with laser welding would be ben-eficial to better quantify the changes inrestraint between the three weldabilitydiagrams.
Conclusions Weldability diagrams to predict so-lidification crack susceptibility for laserwelding of 21-6-9 were developed at 21,42, and 85 mm/s travel speeds. Theminimum Creq/Nieq for primary ferritesolidification of 1.55 at 21 mm/s travelspeed using Espy equivalents shifted to1.75 Creq/Nieq at 42 and 85 mm/s travelspeeds due to the increase in solidifica-tion rate as travel speed increased. TheCreq/Nieq ratios were calculated using aNieq that accounts for 10% nitrogen loss
WELDING RESEARCH
NOVEMBER 2016 / WELDING JOURNAL 417-s
Tate 11-16.qxp_Layout 1 10/14/16 10:17 AM Page 417
during laser welding. No cracking wasobserved in alloys with primary ferritesolidification. Cracking in alloys withprimary austenite solidification was de-pendent on impurity content and alloytype. In general, solidification crackingoccurred for alloys with primary austen-ite solidification and impurity contentsgreater than 0.02 wt-%. Type 21-6-9 alloys showed relative-ly high solidification cracking resist-ance compared to Nitronic 50 and Ni-tronic 60 alloys. For similar impuritycontents, the total crack lengths ob-served for 21-6-9 are much less thanthe other Nitronic alloys. Some 21-6-9alloys showed resistance to solidifica-tion cracking even with primaryaustenite solidification and impuritycontents greater than 0.02 wt-%, andonly one commercial wrought 21-6-9alloy exhibited cracking.
The authors would like to thank LosAlamos National Laboratory for finan-cial support of this graduate researchwork. The authors also thank Dr. G.McIntosh, formerly of Carpenter Tech-nology Corp., Dr. L. Garza of AK SteelCorp., and Dr. J. Elmer of Lawrence Liv-ermore National Laboratory for donat-ing materials for this work. The authorsalso acknowledge the NSF Center for In-tegrative Materials Joining Sciences forEnergy Applications for the collabora-tive research opportunity.
1. Tate, S., Javernick, D., Lienert, T.,and Liu, S. 2016. Laser weldability of 21Cr-6Ni-9Mn stainless steel: Part 1 — Impuri-ty effects and solidification mode. WeldingJournal 95(9): 371-s to 383-s. 2. Takalo, T., Suutala, N., and Moisio, T.1979. Austenitic solidification mode inaustenitic stainless steel welds. Metall.Trans. A 10(8): 1173–1181. 3. Kujanpaa, V., Suutala, N., Takalo, T.,and Moisio, T. 1979. Correlation betweensolidification cracking and microstructurein austenitic and austenitic-ferritic stain-less steel welds. Weld. Res. Int. 9(2): 55–76. 4. Lippold, J. C. 1994. Solidification be-havior and cracking susceptibility of pulsed-laser welds in austenitic stainless steels.Welding Journal 73(6): 129-s to 139-s. 5. Lienert, T. J., and Lippold, J. C. 2003.
Improved weldability diagram for pulsedlaser welded austenitic stainless steels. Sci.Technol. Weld. Join. 8(1): 1–9. 6. Brooks, J., Robino, C., Headley, T., andMichael, J. 2003. Weld solidification andcracking behavior of free-machining stain-less steel. Welding Journal 82(3): 51-s to 64-s. 7. Katayama, S., and Matsunawa, A.1984. Solidification microstructure of laserwelded stainless steels. ICALEO, pp.60–67. 8. Katayama, S., and Matsunawa, A.1985. Solidification behaviour and mi-crostructural characteristics of pulsed andcontinuous laser welded stainless steels.ICALEO, pp. 19–25. 9. David, S. A., Vitek, J. M., and Hebble,T. L. 1987. Effect of rapid solidification onstainless steel weld metal microstructuresand its implications on the Schaeffler dia-gram. Welding Journal 66(10): 289-s to300-s. 10. Elmer, J. W., Allen, S. M., and Eagar,T. W. 1989. Microstructural developmentduring solidification of stainless steel al-loys. Metall. Trans. A 20(10): 2117–2131. 11. Vitek, J. M., and David, S. A. 1988.The effect of cooling rate on ferrite in Type308 stainless steel weld metal. WeldingJournal 67(5): 95-s to 102-s. 12. Nakao, Y., Nishimoto, K., and Zhang,W. P. 1988. Effects of rapid solidification bylaser surface melting on solidification modesand microstructures of stainless steels.Trans. Japan Weld. Soc. 19(2): 20–26. 13. Umeda, T., Okane, T., and Kurz, W.1996. Phase selection during solidificationof peritectic alloys. Acta Mater. 44(10):4209–4216. 14. Lippold, J. C. 1985. Centerlinecracking in deep penetration electronbeam welds in Type 304L stainless steel.Welding Journal 64(5): 127-s to 136-s. 15. Arata, Y., Matsuda, F., and Kataya-ma, S. 1977. Solidification crack suscepti-bility in weld metals of fully austeniticstainless steels (Report II). Trans. JWRI,pp. 105–116. 16. Arata, Y., Matsuda, F., Nakagawa,H., and Katayama, S. 1978. Solidificationcrack susceptibility in weld metals of fullyaustenitic stainless steels (Report IV).Trans. JWRI, pp. 21–24. 17. Katayama, S., Fujimoto, T., andMatsunawa, A. 1985. Correlation amongsolidification process, microstructure, mi-crosegregation, and soldification crackingin stainless steel weld metals. Trans. JWRI7: 123–138. 18. Li, L., and Messler Jr., R. W. 1999.The effects of phosphorus and sulfur onsusceptibility to weld hot cracking inaustenitic stainless steels. Welding Journal78(12): 387-s to 396-s. 19. Kato, T., Fujikura, M., Ishida, K.,Kimura, A., Takeuchi, Y., Kawasaki, N., andYahagi, S. 1981. Effects of chemical com-
positions on the properties of austeniticmanganese steels for nonmagnetic applica-tions. Trans. ISIJ 21: 852–861. 20. Goodwin, G. 1987. Development ofa new hot-cracking test — the Sigmajig.Welding Journal 66(2): 33-s to 38-s. 21. Feng, Z., Zacharia, T., and David, S.1997. Thermal stress development in a nick-el based superalloy during weldability test.Welding Journal 76(11): 470-s to 483-s. 22. Espy, R. H. 1982. Weldability of ni-trogen-strengthened stainless steels. Weld-ing Journal 61(5): 149-s to 156-s. 23. Tate, S., and Liu, S. 2014. Fiber laserwelding of high-N, high-Mn austenitic stain-less steel. International Congress on Applica-tions of Lasers & Electro-Optics, no. 603. 24. Brooks, J., Thompson, A., andWilliams, J. 1983. Variations in weld fer-rite content due to P and S. Welding Journal62(8): 220-s to 225-s. 25. Cieslak, M., and Ritter, A. 1985.Precipitate formation in austenitic stain-less steel welds. Scr. Metall. 19: 4–7. 26. Robino, C., Michael, J., andMaguire, M. 1998. The solidification andwelding metallurgy of galling-resistantstainless steels. Welding Journal 77(11):446-s to 457-s. 27. Kotecki, D. J., and Zhang, Z. 2013.Sources of variation in ferrite number pre-dictions vs. measurements. Welding Journal92(6): 175-s to 181-s. 28. Farrar, J., and Zhang, Z. 2003. II-1510-03, round robin on ferrite measure-ment and chemical analysis. 29. ASTM E1086. 2014. Standard TestMethod for Analysis of Austenitic StainlessSteel by Spark Atomic Emission Spectrometry.West Conshohocken, Pa.: ASTM Interna-tional. 30. Ritter, A. M., and Savage, W. F.1986. Solidification and solidificationcracking in nitrogen-strengthenedaustenitic stainless steels. Metall. Trans. A17(4): 727–737. 31. Ogawa, T., and Tsunetomi, E. 1982.Hot cracking susceptibility of austeniticstainless steels. Welding Journal 61(3): 82-sto 93-s. 32. Cieslak, M., and Savage, W. 1985.Hot-cracking studies of Alloy CN-7M.Welding Journal 64(5): 119-s to 126-s. 33. Honeycombe, J., and Gooch, T.1972. Effect of manganese on cracking andcorrosion behaviour of fully austeniticstainless-steel weld-metals. Met. Constr.4(12): 456–460. 34. Goodwin, G. 1988. The effects ofheat input and weld process on hot crack-ing in stainless steel. Welding Journal67(4): 88-s to 94-s. 35. Zacharia, T. 1994. Dynamic stressesin weld metal hot cracking. Welding Journal73(7): 164-s to 172-s.
WELDING RESEARCH
WELDING JOURNAL / NOVEMBER 2016, VOL. 95418-s
References
Acknowledgments
Tate 11-16.qxp_Layout 1 10/14/16 10:18 AM Page 418
Related Documents