Page 1 of 29 2010-01-1508 Laser-Induced Fluorescence Investigation of Nitric Oxide Formation and Hydroxyl Radicals in a Diesel Rapid Compression Machine Romain Demory, Cyril Crua, Morgan Heikal Sir Harry Ricardo Laboratories, University of Brighton, UK Copyright © 2010 SAE International ABSTRACT The research presented here aims at providing a deeper understanding of the formation of nitric oxide in diesel combustion. To this end, in-cylinder distributions of nitric oxide (NO) were acquired by laser-induced fluorescence (LIF) in a rapid compression machine at conditions representative of a modern diesel passenger vehicle. In particular, the effects of injection and in-cylinder pressure on NO formation were investigated temporally and spatially to offer new insight into the formation of NO. Excitation and collection strategies were notably fine-tuned to avoid the collection of spurious signal due to oxygen (O 2 ) fluorescence. NO fluorescence was first recorded slightly after the onset of the diffusion flame and until late in the expansion stroke. The early low levels of NO were located on the lean side of the high density of hydroxyl radicals (OH). The absence of NO inside the flame plume could however not be investigated because of the severe attenuation of the laser light attributed to hot CO 2 molecules, intermediate species and soot. The formation rate of nitric oxide was found almost constant during the mixing-controlled combustion, the OH densities were restricted to the upstream part of the flame and moved inwards. High OH densities and high soot densities were not found to coexist. Finally, at the end of fuel injection, the spray collapsed on itself thus resulting in high densities of OH and NO throughout. Some of the NO seemed to be formed after the end of apparent combustion, when OH radicals were not detected. The observed fluorescence signal increase was linked to a rapid cooling of the flame plume and the associated freezing of the thermal NO mechanism. Injection pressure was found to influence the location and extent of regions with high densities of NO, but not the overall formation or width of the flame plume. Raising the in-cylinder pressure from 5 MPa to 7 MPa led to a shorter flame penetration and ignition delay with more NO formed early and in the upstream part of the flame. The plume and flame front width were seen to contract with rising in-cylinder pressure, and higher rates of NO formation could be observed as a result of increased air density and local temperatures. INTRODUCTION Nitrogen oxides (NOx) emissions are responsible for a number of environmental and health issues [1] both on small scale, like the apparition of “smog” over big cities, and large scale, like global warming or the intensification of acid rain. Whereas levels of formed NOx in diesel combustion can be lower than in spark- ignition engines, their after-treatment is substantially more difficult because of the overall lean combustion. Therefore, addressing the formation of NOx inside the combustion chamber could minimise the need for complex and costly after-treatment [2]. The outskirts of the diffusion flame have long been suspected to be the major region of NO formation. Indeed, this region combines elevated temperatures and high concentrations of oxygen – two prerequisites for the important Zeldovich mechanism [3]. Although recent in-situ investigations have largely confirmed the above assumption [4-7], “the periphery of the combusting spray” remains a fairly

Welcome message from author
This document is posted to help you gain knowledge. Please leave a comment to let me know what you think about it! Share it to your friends and learn new things together.
Transcript
Page 1 of 29
2010-01-1508
Laser-Induced Fluorescence Investigation of Nitric Oxide Formation and Hydroxyl Radicals in a Diesel Rapid Compression Machine
Romain Demory, Cyril Crua, Morgan Heikal Sir Harry Ricardo Laboratories, University of Brighton, UK
Copyright © 2010 SAE International
ABSTRACT
The research presented here aims at providing a deeper understanding of the formation of nitric oxide in diesel combustion. To this end, in-cylinder distributions of nitric oxide (NO) were acquired by laser-induced fluorescence (LIF) in a rapid compression machine at conditions representative of a modern diesel passenger vehicle. In particular, the effects of injection and in-cylinder pressure on NO formation were investigated temporally and spatially to offer new insight into the formation of NO. Excitation and collection strategies were notably fine-tuned to avoid the collection of spurious signal due to oxygen (O2) fluorescence. NO fluorescence was first recorded slightly after the onset of the diffusion flame and until late in the expansion stroke. The early low levels of NO were located on the lean side of the high density of hydroxyl radicals (OH). The absence of NO inside the flame plume could however not be investigated because of the severe attenuation of the laser light attributed to hot CO2 molecules, intermediate species and soot. The formation rate of nitric oxide was found almost constant during the mixing-controlled combustion, the OH densities were restricted to the upstream part of the flame and moved inwards. High OH densities and high soot densities were not found to coexist. Finally, at the end of fuel injection, the spray collapsed on itself thus resulting in high densities of OH and NO throughout. Some of the NO seemed to be formed after the end of apparent combustion, when OH radicals were not detected. The observed fluorescence signal increase was linked to a rapid cooling of the flame plume and the associated freezing of the thermal NO mechanism. Injection pressure was found to influence the location and extent of regions with high densities of NO, but not the overall formation or width of the flame plume. Raising the in-cylinder pressure from 5 MPa to 7 MPa led to a shorter flame penetration and ignition delay with more NO formed early and in the upstream part of the flame. The plume and flame front width were seen to contract with rising in-cylinder pressure, and higher rates of NO formation could be observed as a result of increased air density and local temperatures.
INTRODUCTION
Nitrogen oxides (NOx) emissions are responsible for a number of environmental and health issues [1] both on small scale, like the apparition of “smog” over big cities, and large scale, like global warming or the intensification of acid rain. Whereas levels of formed NOx in diesel combustion can be lower than in spark-ignition engines, their after-treatment is substantially more difficult because of the overall lean combustion. Therefore, addressing the formation of NOx inside the combustion chamber could minimise the need for complex and costly after-treatment [2]. The outskirts of the diffusion flame have long been suspected to be the major region of NO formation. Indeed, this region combines elevated temperatures and high concentrations of oxygen – two prerequisites for the important Zeldovich mechanism [3]. Although recent in-situ investigations have largely confirmed the above assumption [4-7], “the periphery of the combusting spray” remains a fairly
Page 2 of 29
vague description of the NO formation zone. Notably, the published results are mostly based on measurements with the probing light propagating upstream the spray, often severely affected by attenuation at the tip of the flame. Furthermore, the relative importance of the sides and tip of the diffusion flame in the overall NO production is unknown. The influence of swirl air motion or characteristics such as the diameter of the piston bowl, spray cone angle, and nozzle hole diameter would be easier to understand with this information.
To this aim, the flame development was analysed comparing distributions of hydroxyl (OH) radicals with the natural flame luminosity for a range of engine parameters. OH radicals have proven to be a good marker of the diffusion flame location [8]. The evolution of NO distributions in the combustion chamber was associated with the flame development and in particular, the effects on NO distributions of the injection and in-cylinder pressures will be presented.
EXPERIMENTAL SETUP
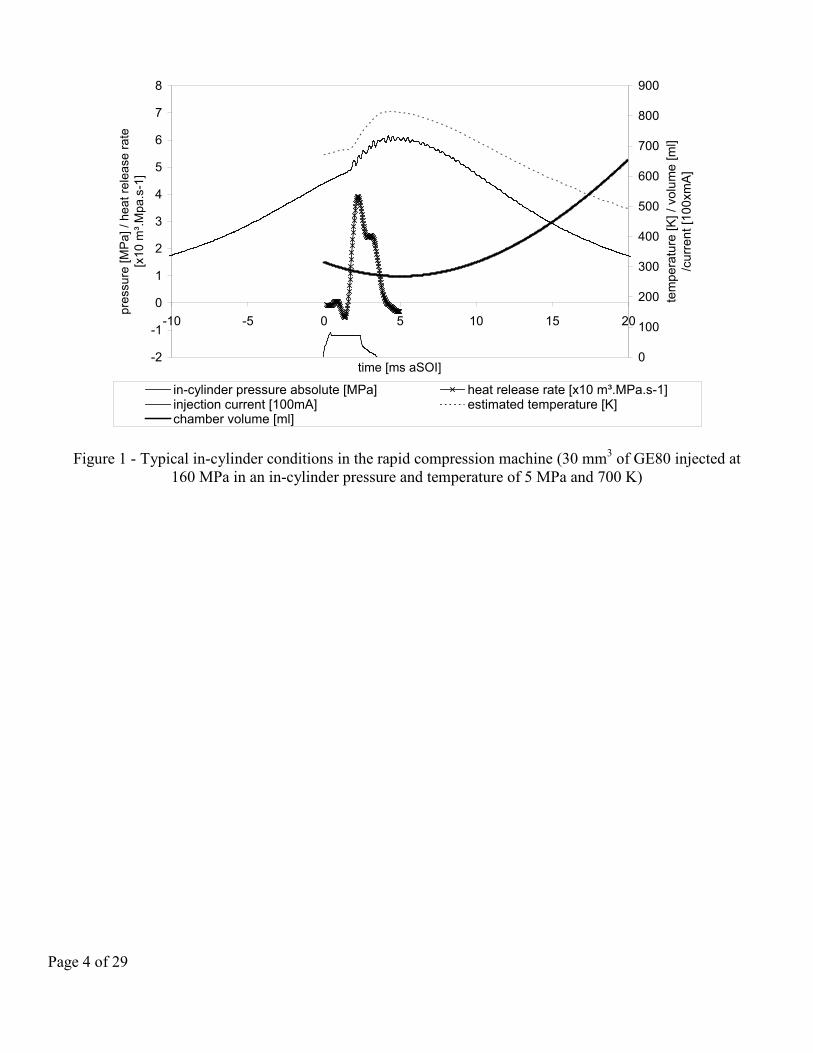
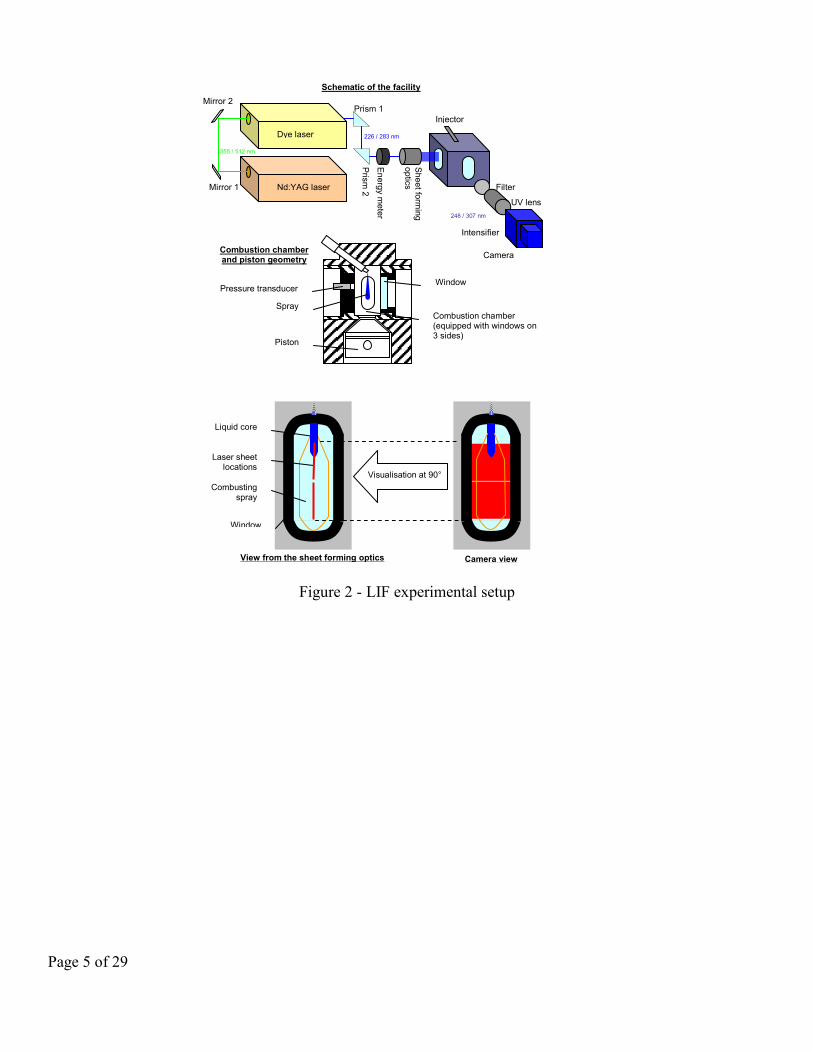
Nitric oxide and hydroxyl radicals distributions were acquired via planar laser induced fluorescence (PLIF) in an optical rapid compression machine, otherwise described in Crua [10]. The rapid compression machine is based on a single cylinder diesel engine with a modified head to allow optical access. Because of its low compression ratio, the intake air had to be boosted to reach in-cylinder pressures of 4 to 7 MPa at the time of injection. The density and temperature of the gases in the chamber were therefore adjusted to be close to those found at TDC in a modern light duty diesel engine running at low loads. A constant volume of 30 mm3 of fuel was injected through a VCO Ø200 µm single hole nozzle at a nominal cone angle of 135°. The operating conditions for the rapid compression machine and the fuel injection equipment are listed in Table 1 and typical in-cylinder conditions are reported in Figure 1. The experimental setup, the combustion chamber and piston geometry as well as the camera and laser sheet orientations relative to the jet are presented in Figure 2.
Table 1: Rapid compression machine operating conditions
Type Two-stroke, one-cylinder DI Bore 135 mm Stroke 150 mm Displacement 2.4 l Compression ratio 9:1 Exhaust port opening 85°c.a. Inlet port opening 95°c.a. Speed 500 rpm Motored TDC pressure 4-7 MPa Motored TDC temperature 700 K Intake air temperature 393K Intake air pressure 0.2-0.3 MPa absolute Injection system 2nd gen. common rail Firing rate Every 10th cycle Start of injection 15°c.a. bTDC Injection pressure 60, 100, 140, 160 MPa Injector nozzle Single hole Ø200 µm VCO Cone angle 135° Injected fuel volume 30 mm3 Injection duration 2.4 ms-4.2 ms (160-60 MPa)
Page 3 of 29
To minimise laser and fluorescence light attenuation by soot or poly-aromatic hydrocarbons (PAH), an oxygenated fuel blend was used, with properties similar to our reference fuel. The blend was composed of 80% of Tripropylene glycol monomethyl ether (TPGME) and 20% of hepta-methyl nonane (HMN) by volume [
Excitation and collection scheme
11] (referenced hereafter as GE80). Similarly, in order to obtain a reasonable PLIF signal to noise ratio, the oxygen content of the intake air was boosted. Raising oxygen concentration in the air can be seen as the opposite measure to exhaust gas recirculation (EGR). In a similar manner as EGR is commonly used to lower NOx emissions, oxygen boosting can be used to amplify the PLIF signal to noise ratio [12].
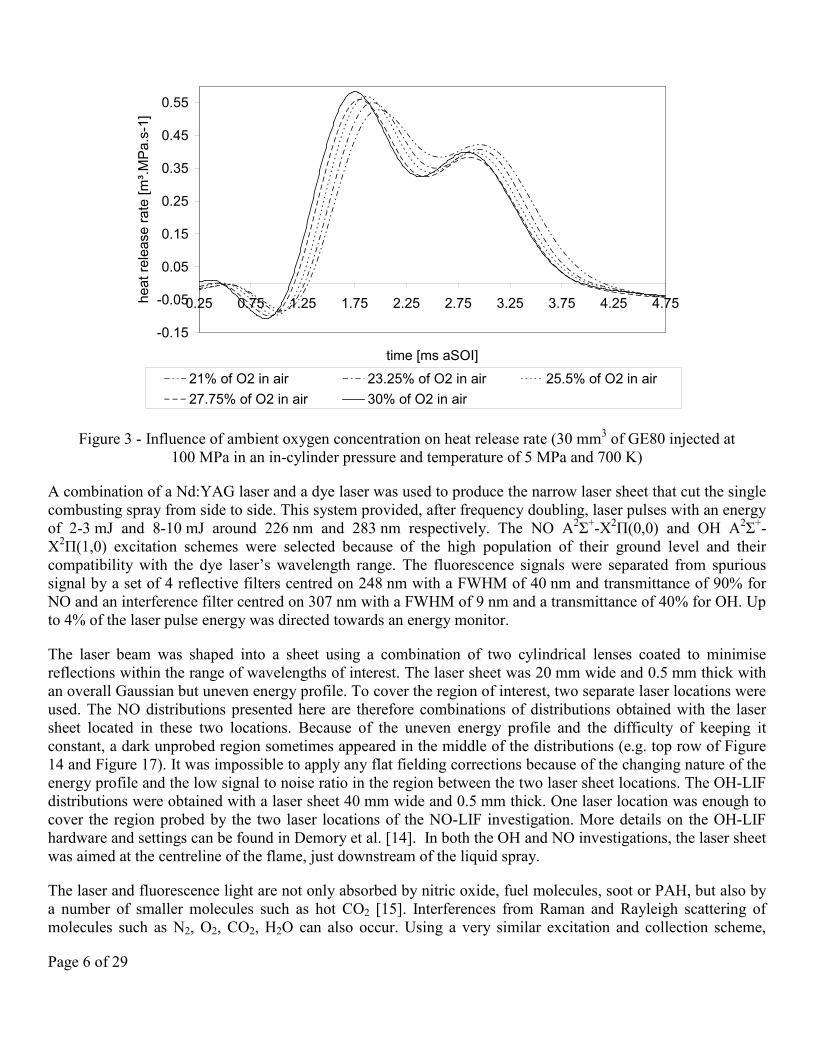
The addition of oxygen and the use of a fuel with a high effective cetane number changed the combustion timing, shortening the ignition delay and potentially affected the combusting spray extent. For instance, Figure 3 shows the influence of ambient oxygen concentration on the heat release rate. The ignition delay of GE80 was found by Pickett and Siebers [13] to be two to three times shorter than that of a research grade diesel fuel at conditions close to the present investigation. In addition, because of the injector and combustion chamber geometries, the temperature at TDC and the injection durations were not perfectly representative of a typical diesel combustion. The low gas temperature cancelled out some of the effects of the high fuel cetane number and gas oxygen content on ignition delay. Overall, the ignition delay and to a greater extent the flame lift-off length were not fully representative of a diesel combustion. The mixing of oxygen with the fuel was facilitated and affected the intensity of the premixed combustion, the burnout after the end of injection, and the dimensions of the diffusion flame, as identified by the OH images.
However, it is believed that the general mechanisms and trends of NO formation are reflected in the data presented. Moreover, in-cylinder conditions and heat release rate reported in Figure 1 are still very close to typical diesel combustion. Finally, care was taken to keep the oxygen inlet flow constant, representing a mole fraction of 25.5% of the aspirated gas in the case of 5 MPa TDC in-cylinder pressure.
Page 4 of 29
-2
-1
0
1
2
3
4
5
6
7
8
-10 -5 0 5 10 15 20
time [ms aSOI]
pres
sure
[MPa
] / h
eat r
elea
se ra
te
[x10
m³.M
pa.s
-1]
0
100
200
300
400
500
600
700
800
900
tem
pera
ture
[K] /
vol
ume
[ml]
/cur
rent
[100
xmA
]
in-cylinder pressure absolute [MPa] heat release rate [x10 m³.MPa.s-1]injection current [100mA] estimated temperature [K]chamber volume [ml]
Figure 1 - Typical in-cylinder conditions in the rapid compression machine (30 mm3 of GE80 injected at 160 MPa in an in-cylinder pressure and temperature of 5 MPa and 700 K)
Page 5 of 29
Figure 2 - LIF experimental setup
Nd:YAG laser
Dye laser
Mirror 1
Prism 1
Prism
2
Filter
UV lens
Intensifier
Camera
Mirror 2
Energy m
eter
Sheet form
ing optics
Injector
Liquid core
Laser sheet locations
Combusting spray
Window
Visualisation at 90°
View from the sheet forming optics Camera view
Combustion chamber and piston geometry
Spray
Window
Combustion chamber (equipped with windows on 3 sides)
Piston
Schematic of the facility
355 / 512 nm
226 / 283 nm
248 / 307 nm
Pressure transducer
Page 6 of 29
-0.15
-0.05
0.05
0.15
0.25
0.35
0.45
0.55
0.25 0.75 1.25 1.75 2.25 2.75 3.25 3.75 4.25 4.75
time [ms aSOI]
heat
rele
ase
rate
[m³.M
Pa.
s-1]
21% of O2 in air 23.25% of O2 in air 25.5% of O2 in air27.75% of O2 in air 30% of O2 in air
Figure 3 - Influence of ambient oxygen concentration on heat release rate (30 mm3 of GE80 injected at 100 MPa in an in-cylinder pressure and temperature of 5 MPa and 700 K)
A combination of a Nd:YAG laser and a dye laser was used to produce the narrow laser sheet that cut the single combusting spray from side to side. This system provided, after frequency doubling, laser pulses with an energy of 2-3 mJ and 8-10 mJ around 226 nm and 283 nm respectively. The NO A2Σ+-X2Π(0,0) and OH A2Σ+-X2Π(1,0) excitation schemes were selected because of the high population of their ground level and their compatibility with the dye laser’s wavelength range. The fluorescence signals were separated from spurious signal by a set of 4 reflective filters centred on 248 nm with a FWHM of 40 nm and transmittance of 90% for NO and an interference filter centred on 307 nm with a FWHM of 9 nm and a transmittance of 40% for OH. Up to 4% of the laser pulse energy was directed towards an energy monitor.
The laser beam was shaped into a sheet using a combination of two cylindrical lenses coated to minimise reflections within the range of wavelengths of interest. The laser sheet was 20 mm wide and 0.5 mm thick with an overall Gaussian but uneven energy profile. To cover the region of interest, two separate laser locations were used. The NO distributions presented here are therefore combinations of distributions obtained with the laser sheet located in these two locations. Because of the uneven energy profile and the difficulty of keeping it constant, a dark unprobed region sometimes appeared in the middle of the distributions (e.g. top row of Figure 14 and Figure 17). It was impossible to apply any flat fielding corrections because of the changing nature of the energy profile and the low signal to noise ratio in the region between the two laser sheet locations. The OH-LIF distributions were obtained with a laser sheet 40 mm wide and 0.5 mm thick. One laser location was enough to cover the region probed by the two laser locations of the NO-LIF investigation. More details on the OH-LIF hardware and settings can be found in Demory et al. [14]. In both the OH and NO investigations, the laser sheet was aimed at the centreline of the flame, just downstream of the liquid spray.
The laser and fluorescence light are not only absorbed by nitric oxide, fuel molecules, soot or PAH, but also by a number of smaller molecules such as hot CO2 [15]. Interferences from Raman and Rayleigh scattering of molecules such as N2, O2, CO2, H2O can also occur. Using a very similar excitation and collection scheme,
Page 7 of 29
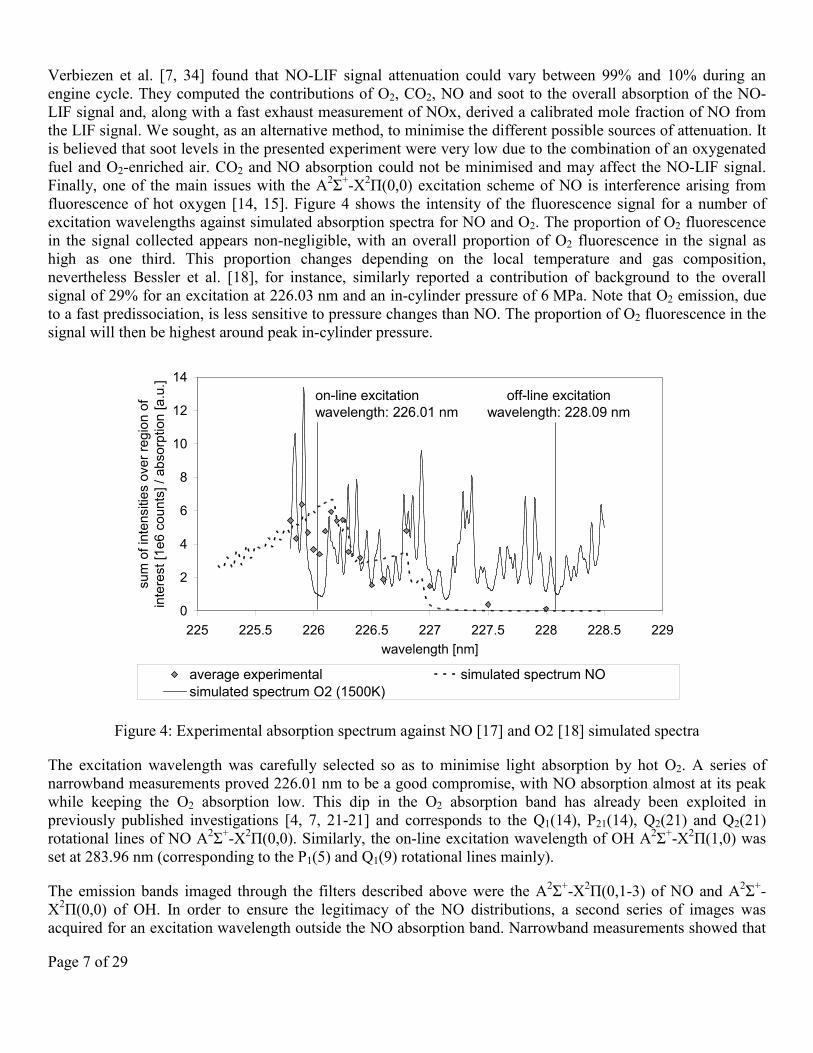
Verbiezen et al. [7, 34] found that NO-LIF signal attenuation could vary between 99% and 10% during an engine cycle. They computed the contributions of O2, CO2, NO and soot to the overall absorption of the NO-LIF signal and, along with a fast exhaust measurement of NOx, derived a calibrated mole fraction of NO from the LIF signal. We sought, as an alternative method, to minimise the different possible sources of attenuation. It is believed that soot levels in the presented experiment were very low due to the combination of an oxygenated fuel and O2-enriched air. CO2 and NO absorption could not be minimised and may affect the NO-LIF signal. Finally, one of the main issues with the A2Σ+-X2Π(0,0) excitation scheme of NO is interference arising from fluorescence of hot oxygen [14, 15]. Figure 4 shows the intensity of the fluorescence signal for a number of excitation wavelengths against simulated absorption spectra for NO and O2. The proportion of O2 fluorescence in the signal collected appears non-negligible, with an overall proportion of O2 fluorescence in the signal as high as one third. This proportion changes depending on the local temperature and gas composition, nevertheless Bessler et al. [18], for instance, similarly reported a contribution of background to the overall signal of 29% for an excitation at 226.03 nm and an in-cylinder pressure of 6 MPa. Note that O2 emission, due to a fast predissociation, is less sensitive to pressure changes than NO. The proportion of O2 fluorescence in the signal will then be highest around peak in-cylinder pressure.
0
2
4
6
8
10
12
14
225 225.5 226 226.5 227 227.5 228 228.5 229wavelength [nm]
sum
of i
nten
sitie
s ov
er re
gion
of
inte
rest
[1e6
cou
nts]
/ ab
sorp
tion
[a.u
.]
average experimental simulated spectrum NOsimulated spectrum O2 (1500K)
on-line excitation wavelength: 226.01 nm
off-line excitation wavelength: 228.09 nm
Figure 4: Experimental absorption spectrum against NO [17] and O2 [18] simulated spectra
The excitation wavelength was carefully selected so as to minimise light absorption by hot O2. A series of narrowband measurements proved 226.01 nm to be a good compromise, with NO absorption almost at its peak while keeping the O2 absorption low. This dip in the O2 absorption band has already been exploited in previously published investigations [4, 7, 21-21] and corresponds to the Q1(14), P21(14), Q2(21) and Q2(21) rotational lines of NO A2Σ+-X2Π(0,0). Similarly, the on-line excitation wavelength of OH A2Σ+-X2Π(1,0) was set at 283.96 nm (corresponding to the P1(5) and Q1(9) rotational lines mainly).
The emission bands imaged through the filters described above were the A2Σ+-X2Π(0,1-3) of NO and A2Σ+-X2Π(0,0) of OH. In order to ensure the legitimacy of the NO distributions, a second series of images was acquired for an excitation wavelength outside the NO absorption band. Narrowband measurements showed that
Page 8 of 29
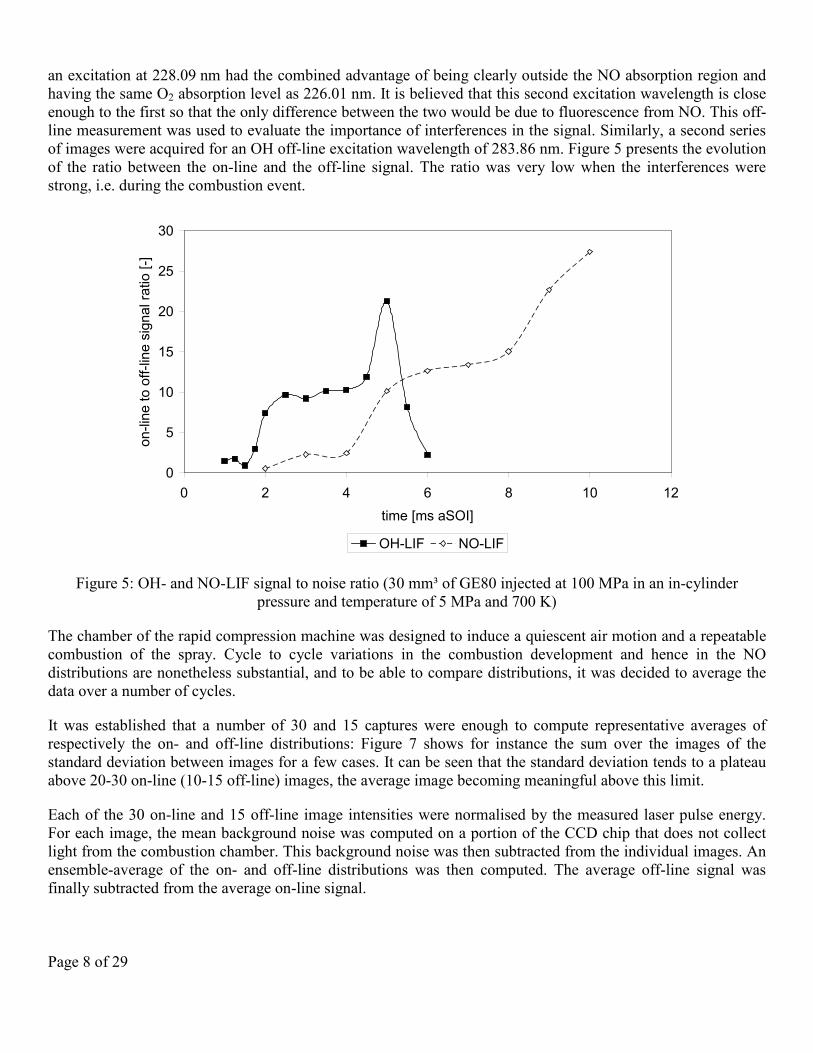
an excitation at 228.09 nm had the combined advantage of being clearly outside the NO absorption region and having the same O2 absorption level as 226.01 nm. It is believed that this second excitation wavelength is close enough to the first so that the only difference between the two would be due to fluorescence from NO. This off-line measurement was used to evaluate the importance of interferences in the signal. Similarly, a second series of images were acquired for an OH off-line excitation wavelength of 283.86 nm. Figure 5 presents the evolution of the ratio between the on-line and the off-line signal. The ratio was very low when the interferences were strong, i.e. during the combustion event.
0
5
10
15
20
25
30
0 2 4 6 8 10 12time [ms aSOI]
on-li
ne to
off-
line
sign
al ra
tio [-
]
OH-LIF NO-LIF
Figure 5: OH- and NO-LIF signal to noise ratio (30 mm³ of GE80 injected at 100 MPa in an in-cylinder pressure and temperature of 5 MPa and 700 K)
The chamber of the rapid compression machine was designed to induce a quiescent air motion and a repeatable combustion of the spray. Cycle to cycle variations in the combustion development and hence in the NO distributions are nonetheless substantial, and to be able to compare distributions, it was decided to average the data over a number of cycles.
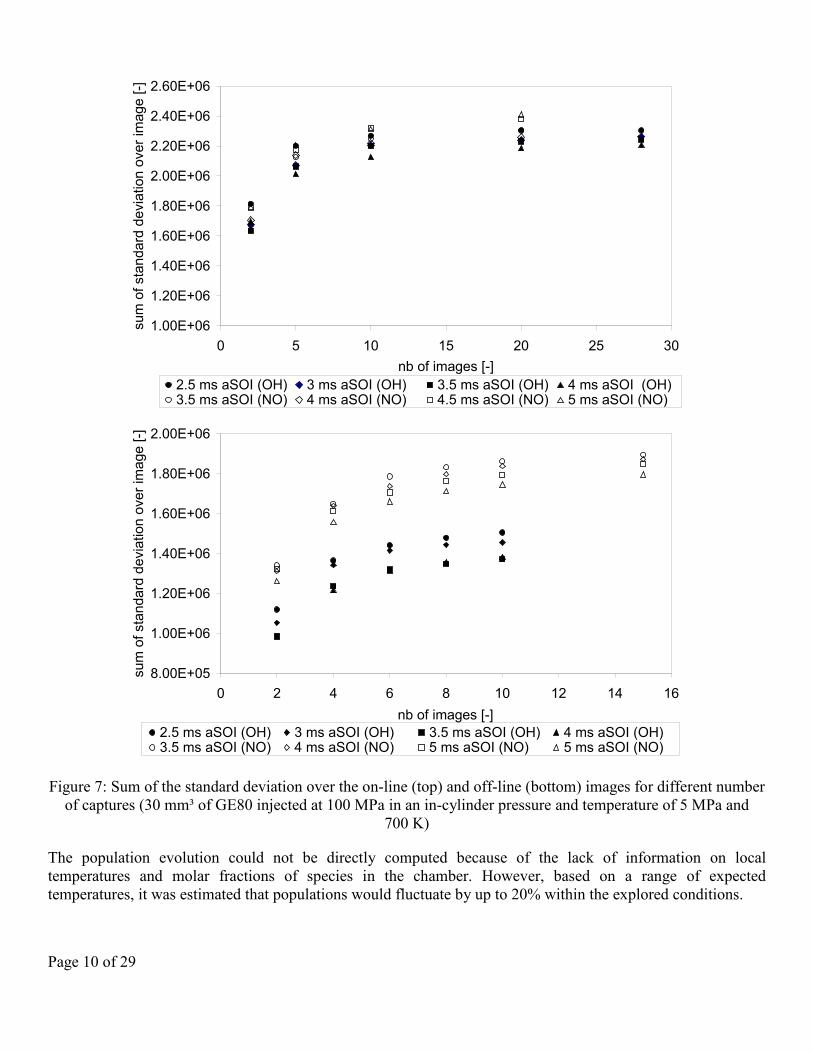
It was established that a number of 30 and 15 captures were enough to compute representative averages of respectively the on- and off-line distributions: Figure 7 shows for instance the sum over the images of the standard deviation between images for a few cases. It can be seen that the standard deviation tends to a plateau above 20-30 on-line (10-15 off-line) images, the average image becoming meaningful above this limit.
Each of the 30 on-line and 15 off-line image intensities were normalised by the measured laser pulse energy. For each image, the mean background noise was computed on a portion of the CCD chip that does not collect light from the combustion chamber. This background noise was then subtracted from the individual images. An ensemble-average of the on- and off-line distributions was then computed. The average off-line signal was finally subtracted from the average on-line signal.
Page 9 of 29
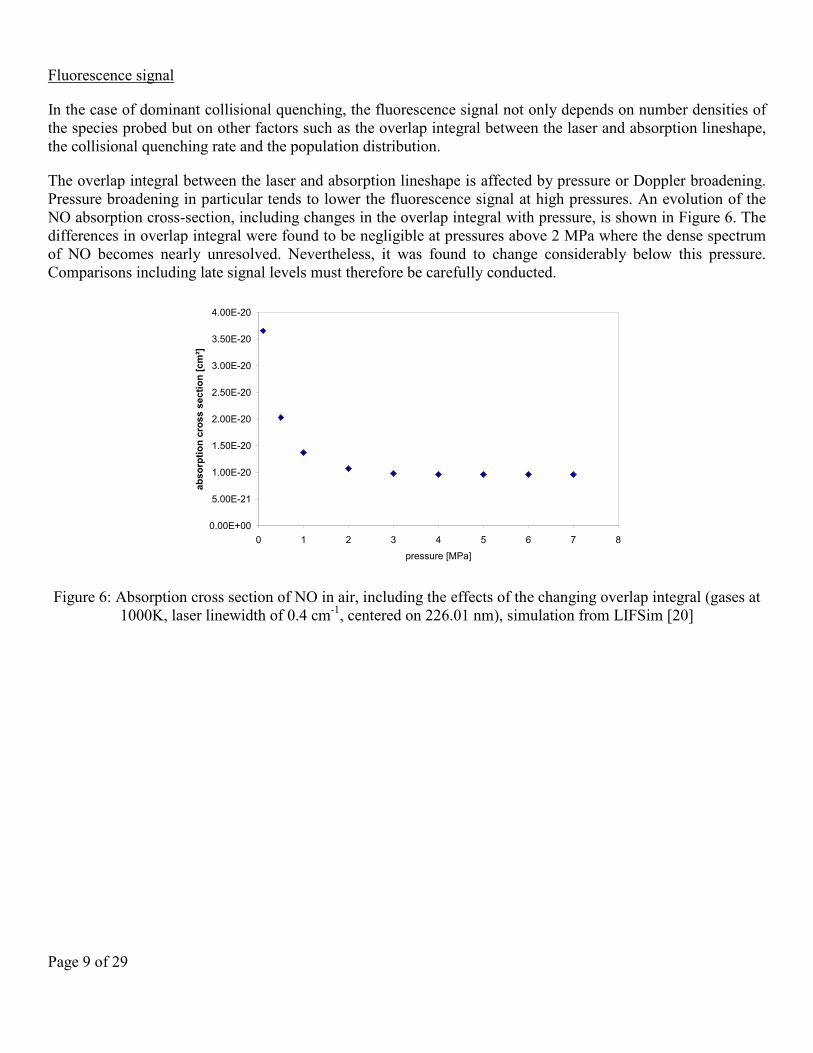
In the case of dominant collisional quenching, the fluorescence signal not only depends on number densities of the species probed but on other factors such as the overlap integral between the laser and absorption lineshape, the collisional quenching rate and the population distribution.
Fluorescence signal
The overlap integral between the laser and absorption lineshape is affected by pressure or Doppler broadening. Pressure broadening in particular tends to lower the fluorescence signal at high pressures. An evolution of the NO absorption cross-section, including changes in the overlap integral with pressure, is shown in Figure 6. The differences in overlap integral were found to be negligible at pressures above 2 MPa where the dense spectrum of NO becomes nearly unresolved. Nevertheless, it was found to change considerably below this pressure. Comparisons including late signal levels must therefore be carefully conducted.
0.00E+00
5.00E-21
1.00E-20
1.50E-20
2.00E-20
2.50E-20
3.00E-20
3.50E-20
4.00E-20
0 1 2 3 4 5 6 7 8pressure [MPa]
abso
rptio
n cr
oss
sect
ion
[cm
²]
Figure 6: Absorption cross section of NO in air, including the effects of the changing overlap integral (gases at 1000K, laser linewidth of 0.4 cm-1, centered on 226.01 nm), simulation from LIFSim [20]
Page 10 of 29
1.00E+06
1.20E+06
1.40E+06
1.60E+06
1.80E+06
2.00E+06
2.20E+06
2.40E+06
2.60E+06
0 5 10 15 20 25 30nb of images [-]
sum
of s
tand
ard
devi
atio
n ov
er im
age
[-]
2.5 ms aSOI (OH) 3 ms aSOI (OH) 3.5 ms aSOI (OH) 4 ms aSOI (OH)3.5 ms aSOI (NO) 4 ms aSOI (NO) 4.5 ms aSOI (NO) 5 ms aSOI (NO)
8.00E+05
1.00E+06
1.20E+06
1.40E+06
1.60E+06
1.80E+06
2.00E+06
0 2 4 6 8 10 12 14 16nb of images [-]
sum
of s
tand
ard
devi
atio
n ov
er im
age
[-]
2.5 ms aSOI (OH) 3 ms aSOI (OH) 3.5 ms aSOI (OH) 4 ms aSOI (OH)3.5 ms aSOI (NO) 4 ms aSOI (NO) 5 ms aSOI (NO) 5 ms aSOI (NO)
Figure 7: Sum of the standard deviation over the on-line (top) and off-line (bottom) images for different number of captures (30 mm³ of GE80 injected at 100 MPa in an in-cylinder pressure and temperature of 5 MPa and
700 K)
The population evolution could not be directly computed because of the lack of information on local temperatures and molar fractions of species in the chamber. However, based on a range of expected temperatures, it was estimated that populations would fluctuate by up to 20% within the explored conditions.
Page 11 of 29
Finally, the fluorescence signal will be weakened by collisional quenching. Both quenching and number density are proportional to pressure, so that for an increase in pressure, the weakening of the fluorescence signal due to the stronger quenching will be cancelled out by the increase in signal due to the higher number density.
RESULTS AND DISCUSSION
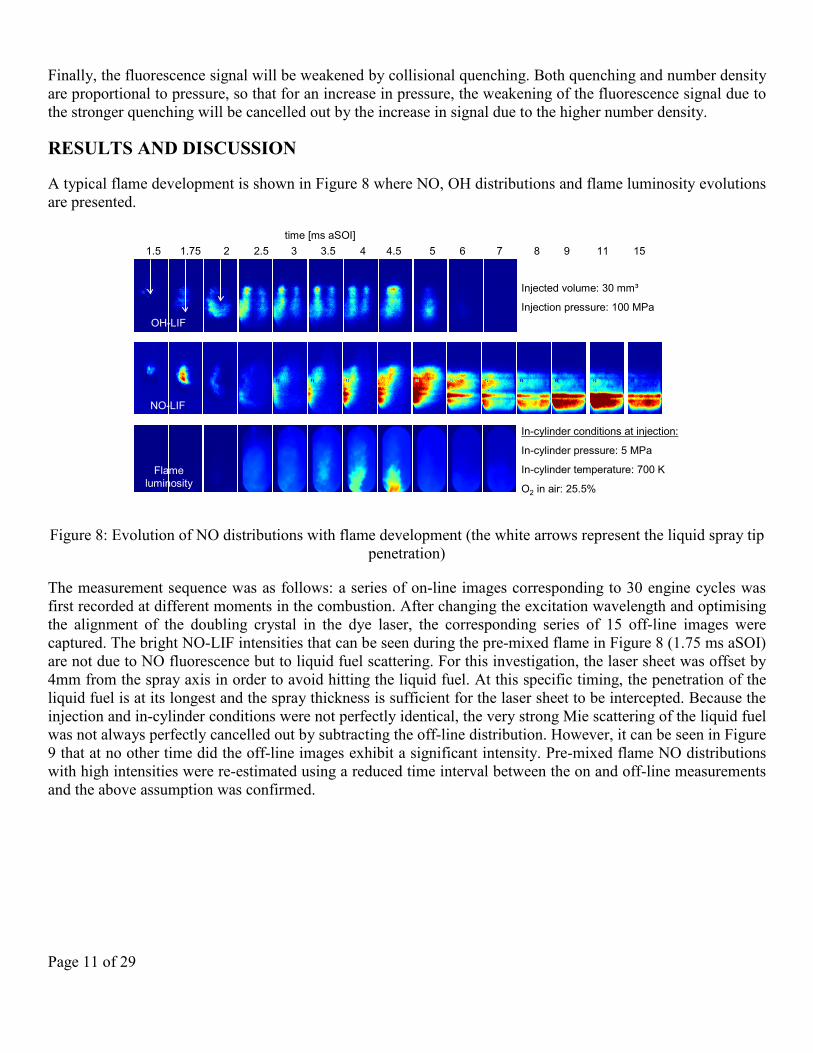
A typical flame development is shown in Figure 8 where NO, OH distributions and flame luminosity evolutions are presented.
OH-LIF
Flame luminosity
NO-LIF
1.5 1.75 2 2.5 3 3.5 4 4.5 5 6 7 8 9time [ms aSOI]
11 15
Injected volume: 30 mm³
Injection pressure: 100 MPa
In-cylinder conditions at injection:
In-cylinder pressure: 5 MPa
In-cylinder temperature: 700 K
O2 in air: 25.5%
Figure 8: Evolution of NO distributions with flame development (the white arrows represent the liquid spray tip penetration)
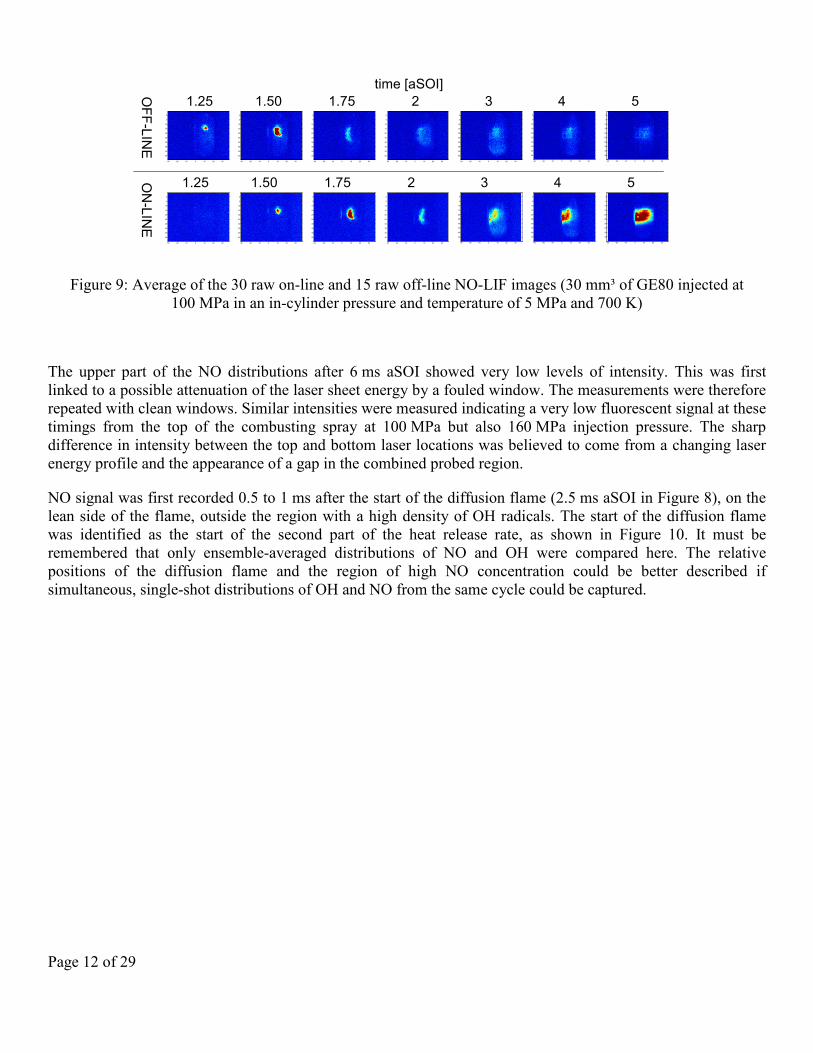
The measurement sequence was as follows: a series of on-line images corresponding to 30 engine cycles was first recorded at different moments in the combustion. After changing the excitation wavelength and optimising the alignment of the doubling crystal in the dye laser, the corresponding series of 15 off-line images were captured. The bright NO-LIF intensities that can be seen during the pre-mixed flame in Figure 8 (1.75 ms aSOI) are not due to NO fluorescence but to liquid fuel scattering. For this investigation, the laser sheet was offset by 4mm from the spray axis in order to avoid hitting the liquid fuel. At this specific timing, the penetration of the liquid fuel is at its longest and the spray thickness is sufficient for the laser sheet to be intercepted. Because the injection and in-cylinder conditions were not perfectly identical, the very strong Mie scattering of the liquid fuel was not always perfectly cancelled out by subtracting the off-line distribution. However, it can be seen in Figure 9 that at no other time did the off-line images exhibit a significant intensity. Pre-mixed flame NO distributions with high intensities were re-estimated using a reduced time interval between the on and off-line measurements and the above assumption was confirmed.
Page 12 of 29
time [aSOI] 1.25 1.50 1.75 2 3 4 5
1.25 1.50 1.75 2 3 4 5
OFF-LIN
EO
N-LIN
E
-30 -20 -10 0 10 20 30
0
5
10
15
20
25
30
35
40
45
-30 -20 -10 0 10 20 30
0
5
10
15
20
25
30
35
40
45
-30 -20 -10 0 10 20 30
0
5
10
15
20
25
30
35
40
45
-30 -20 -10 0 10 20 30
0
5
10
15
20
25
30
35
40
45
-30 -20 -10 0 10 20 30
0
5
10
15
20
25
30
35
40
45
-30 -20 -10 0 10 20 30
0
5
10
15
20
25
30
35
40
45
-30 -20 -10 0 10 20 30
0
5
10
15
20
25
30
35
40
45
-30 -20 -10 0 10 20 30
0
5
10
15
20
25
30
35
40
45
-30 -20 -10 0 10 20 30
0
5
10
15
20
25
30
35
40
45
-30 -20 -10 0 10 20 30
0
5
10
15
20
25
30
35
40
45
-30 -20 -10 0 10 20 30
0
5
10
15
20
25
30
35
40
45
-30 -20 -10 0 10 20 30
0
5
10
15
20
25
30
35
40
45
-30 -20 -10 0 10 20 30
0
5
10
15
20
25
30
35
40
45
-30 -20 -10 0 10 20 30
0
5
10
15
20
25
30
35
40
45
Figure 9: Average of the 30 raw on-line and 15 raw off-line NO-LIF images (30 mm³ of GE80 injected at 100 MPa in an in-cylinder pressure and temperature of 5 MPa and 700 K)
The upper part of the NO distributions after 6 ms aSOI showed very low levels of intensity. This was first linked to a possible attenuation of the laser sheet energy by a fouled window. The measurements were therefore repeated with clean windows. Similar intensities were measured indicating a very low fluorescent signal at these timings from the top of the combusting spray at 100 MPa but also 160 MPa injection pressure. The sharp difference in intensity between the top and bottom laser locations was believed to come from a changing laser energy profile and the appearance of a gap in the combined probed region.
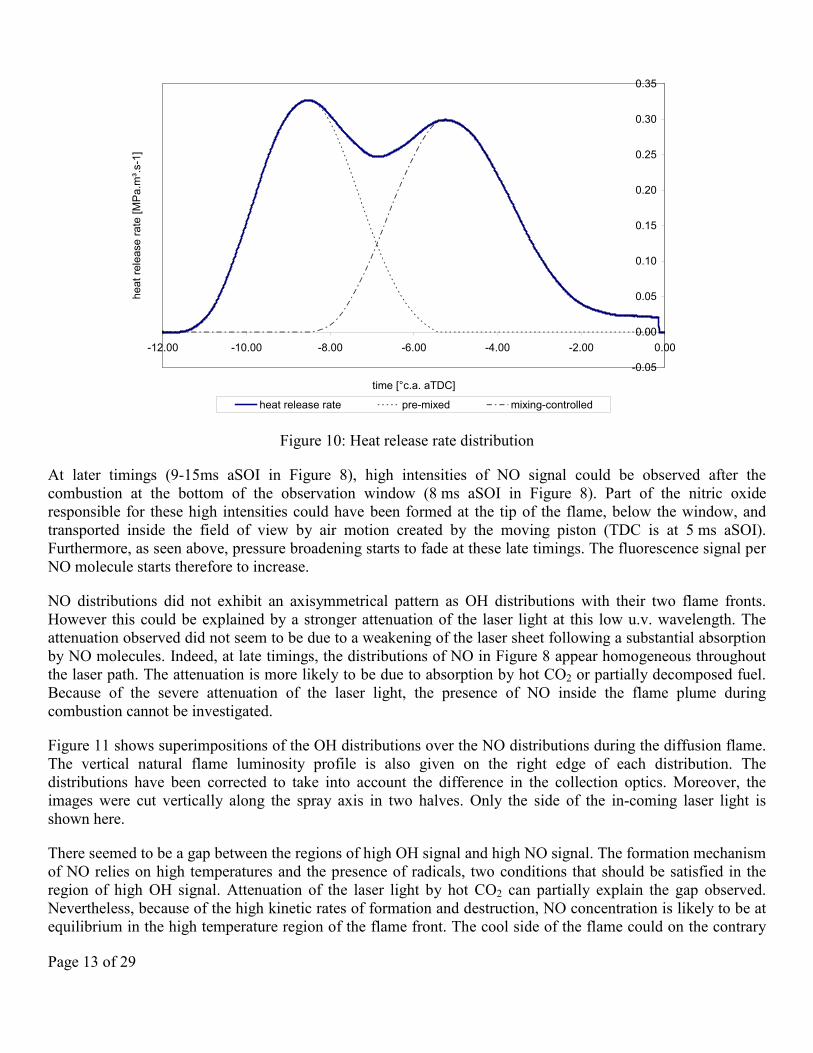
NO signal was first recorded 0.5 to 1 ms after the start of the diffusion flame (2.5 ms aSOI in Figure 8), on the lean side of the flame, outside the region with a high density of OH radicals. The start of the diffusion flame was identified as the start of the second part of the heat release rate, as shown in Figure 10. It must be remembered that only ensemble-averaged distributions of NO and OH were compared here. The relative positions of the diffusion flame and the region of high NO concentration could be better described if simultaneous, single-shot distributions of OH and NO from the same cycle could be captured.
Page 13 of 29
-0.05
0.00
0.05
0.10
0.15
0.20
0.25
0.30
0.35
-12.00 -10.00 -8.00 -6.00 -4.00 -2.00 0.00
time [°c.a. aTDC]
heat
rele
ase
rate
[MP
a.m
³.s-1
]
heat release rate pre-mixed mixing-controlled
Figure 10: Heat release rate distribution
At later timings (9-15ms aSOI in Figure 8), high intensities of NO signal could be observed after the combustion at the bottom of the observation window (8 ms aSOI in Figure 8). Part of the nitric oxide responsible for these high intensities could have been formed at the tip of the flame, below the window, and transported inside the field of view by air motion created by the moving piston (TDC is at 5 ms aSOI). Furthermore, as seen above, pressure broadening starts to fade at these late timings. The fluorescence signal per NO molecule starts therefore to increase.
NO distributions did not exhibit an axisymmetrical pattern as OH distributions with their two flame fronts. However this could be explained by a stronger attenuation of the laser light at this low u.v. wavelength. The attenuation observed did not seem to be due to a weakening of the laser sheet following a substantial absorption by NO molecules. Indeed, at late timings, the distributions of NO in Figure 8 appear homogeneous throughout the laser path. The attenuation is more likely to be due to absorption by hot CO2 or partially decomposed fuel. Because of the severe attenuation of the laser light, the presence of NO inside the flame plume during combustion cannot be investigated.
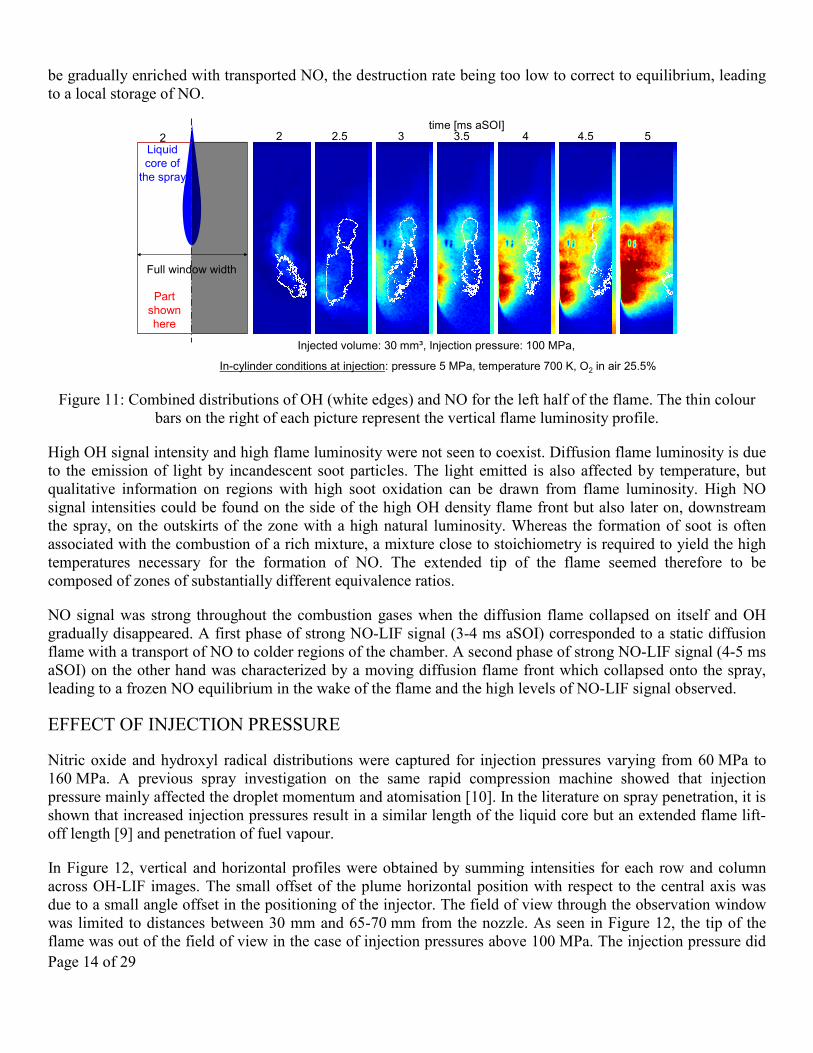
Figure 11 shows superimpositions of the OH distributions over the NO distributions during the diffusion flame. The vertical natural flame luminosity profile is also given on the right edge of each distribution. The distributions have been corrected to take into account the difference in the collection optics. Moreover, the images were cut vertically along the spray axis in two halves. Only the side of the in-coming laser light is shown here.
There seemed to be a gap between the regions of high OH signal and high NO signal. The formation mechanism of NO relies on high temperatures and the presence of radicals, two conditions that should be satisfied in the region of high OH signal. Attenuation of the laser light by hot CO2 can partially explain the gap observed. Nevertheless, because of the high kinetic rates of formation and destruction, NO concentration is likely to be at equilibrium in the high temperature region of the flame front. The cool side of the flame could on the contrary
Page 14 of 29
be gradually enriched with transported NO, the destruction rate being too low to correct to equilibrium, leading to a local storage of NO.
Injected volume: 30 mm³, Injection pressure: 100 MPa,
In-cylinder conditions at injection: pressure 5 MPa, temperature 700 K, O2 in air 25.5%
2 2.5 3 3.5 4 4.5 5time [ms aSOI]
2
Part shown here
Liquid core of
the spray
Full window width
Figure 11: Combined distributions of OH (white edges) and NO for the left half of the flame. The thin colour bars on the right of each picture represent the vertical flame luminosity profile.
High OH signal intensity and high flame luminosity were not seen to coexist. Diffusion flame luminosity is due to the emission of light by incandescent soot particles. The light emitted is also affected by temperature, but qualitative information on regions with high soot oxidation can be drawn from flame luminosity. High NO signal intensities could be found on the side of the high OH density flame front but also later on, downstream the spray, on the outskirts of the zone with a high natural luminosity. Whereas the formation of soot is often associated with the combustion of a rich mixture, a mixture close to stoichiometry is required to yield the high temperatures necessary for the formation of NO. The extended tip of the flame seemed therefore to be composed of zones of substantially different equivalence ratios.
NO signal was strong throughout the combustion gases when the diffusion flame collapsed on itself and OH gradually disappeared. A first phase of strong NO-LIF signal (3-4 ms aSOI) corresponded to a static diffusion flame with a transport of NO to colder regions of the chamber. A second phase of strong NO-LIF signal (4-5 ms aSOI) on the other hand was characterized by a moving diffusion flame front which collapsed onto the spray, leading to a frozen NO equilibrium in the wake of the flame and the high levels of NO-LIF signal observed.
EFFECT OF INJECTION PRESSURE
Nitric oxide and hydroxyl radical distributions were captured for injection pressures varying from 60 MPa to 160 MPa. A previous spray investigation on the same rapid compression machine showed that injection pressure mainly affected the droplet momentum and atomisation [10]. In the literature on spray penetration, it is shown that increased injection pressures result in a similar length of the liquid core but an extended flame lift-off length [9] and penetration of fuel vapour.
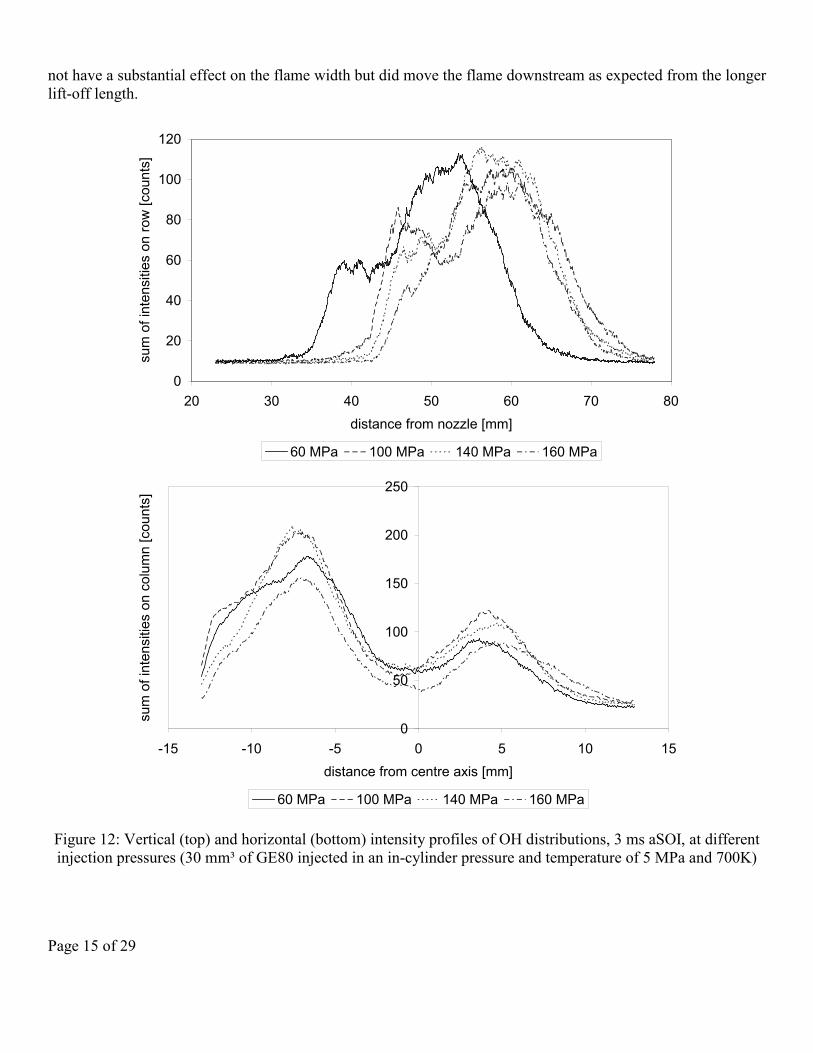
In Figure 12, vertical and horizontal profiles were obtained by summing intensities for each row and column across OH-LIF images. The small offset of the plume horizontal position with respect to the central axis was due to a small angle offset in the positioning of the injector. The field of view through the observation window was limited to distances between 30 mm and 65-70 mm from the nozzle. As seen in Figure 12, the tip of the flame was out of the field of view in the case of injection pressures above 100 MPa. The injection pressure did
Page 15 of 29
not have a substantial effect on the flame width but did move the flame downstream as expected from the longer lift-off length.
0
20
40
60
80
100
120
20 30 40 50 60 70 80distance from nozzle [mm]
sum
of i
nten
sitie
s on
row
[cou
nts]
60 MPa 100 MPa 140 MPa 160 MPa
0
50
100
150
200
250
-15 -10 -5 0 5 10 15distance from centre axis [mm]
sum
of i
nten
sitie
s on
col
umn
[cou
nts]
60 MPa 100 MPa 140 MPa 160 MPa
Figure 12: Vertical (top) and horizontal (bottom) intensity profiles of OH distributions, 3 ms aSOI, at different injection pressures (30 mm³ of GE80 injected in an in-cylinder pressure and temperature of 5 MPa and 700K)
Page 16 of 29
-0.2
-0.1
0
0.1
0.2
0.3
0.4
0.5
0.6
0.7
0 1 2 3 4 5 6
time [ms aSOI]
hrr [
m³.M
Pa.
s-1]
60 MPa 100 MPa 140 MPa 160 MPa
Heat release distribution(pre-mixed / mixing-controlled)
160 MPa: 57 / 43 %140 MPa: 53 / 47 %100 Mpa: 44 / 56 %60 Mpa: 36 / 64 %
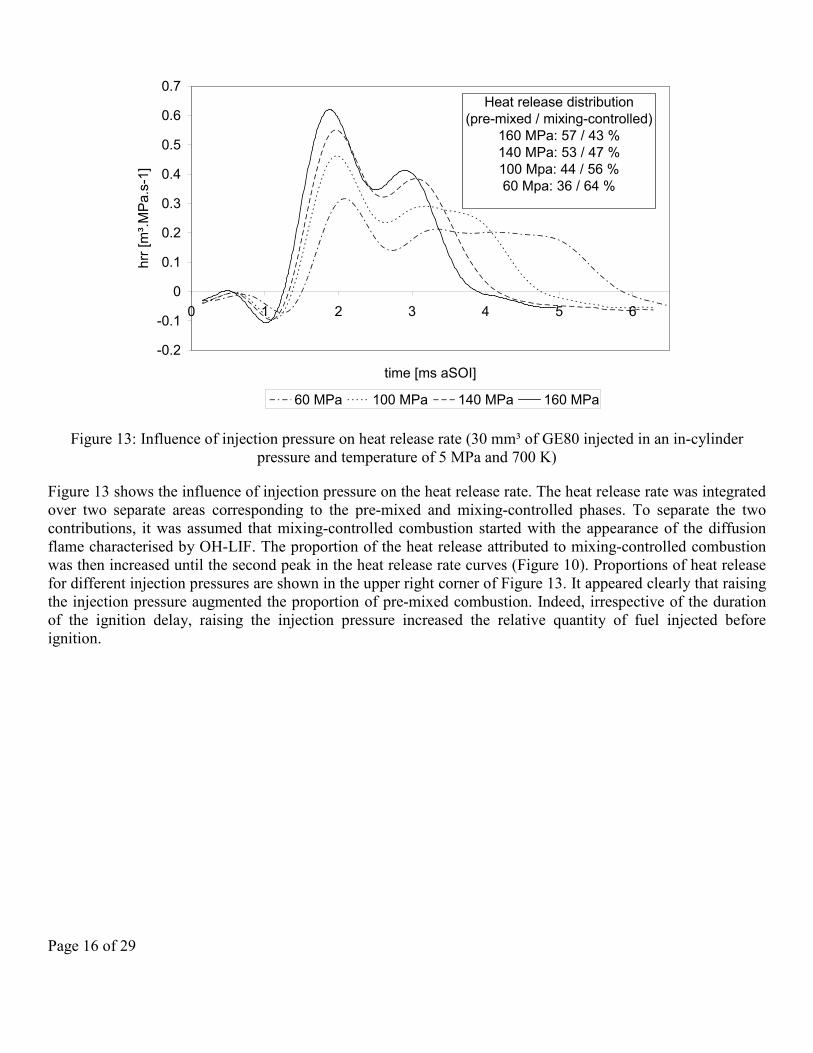
Figure 13: Influence of injection pressure on heat release rate (30 mm³ of GE80 injected in an in-cylinder pressure and temperature of 5 MPa and 700 K)
Figure 13 shows the influence of injection pressure on the heat release rate. The heat release rate was integrated over two separate areas corresponding to the pre-mixed and mixing-controlled phases. To separate the two contributions, it was assumed that mixing-controlled combustion started with the appearance of the diffusion flame characterised by OH-LIF. The proportion of the heat release attributed to mixing-controlled combustion was then increased until the second peak in the heat release rate curves (Figure 10). Proportions of heat release for different injection pressures are shown in the upper right corner of Figure 13. It appeared clearly that raising the injection pressure augmented the proportion of pre-mixed combustion. Indeed, irrespective of the duration of the ignition delay, raising the injection pressure increased the relative quantity of fuel injected before ignition.
Page 17 of 29
2 2.5 3 3.5 4 4.5 5time [ms aSOI]
5.5
Injected vol. : 30 mm³
Conditions at injection:
Pressure: 5 MPa
Temperature: 700 K
O2 in air: 25.5%
60 MPa
100 MPa
140 MPa
160 MPa
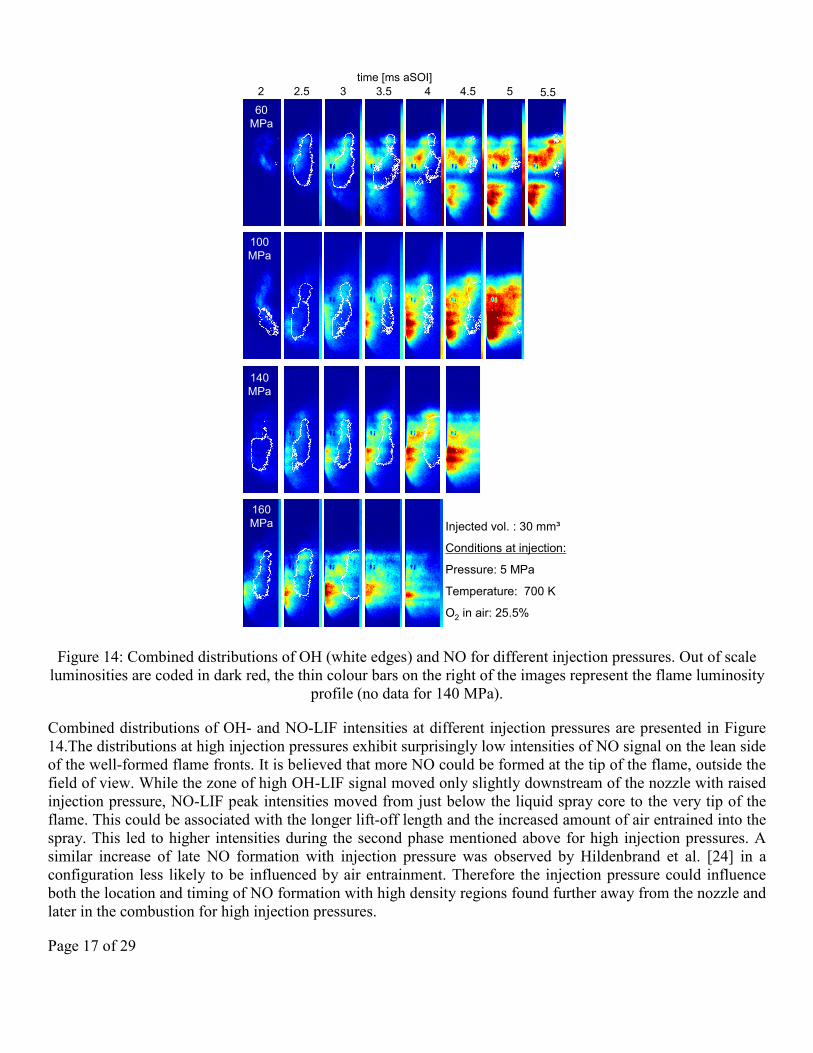
Figure 14: Combined distributions of OH (white edges) and NO for different injection pressures. Out of scale luminosities are coded in dark red, the thin colour bars on the right of the images represent the flame luminosity
profile (no data for 140 MPa).
Combined distributions of OH- and NO-LIF intensities at different injection pressures are presented in Figure 14.The distributions at high injection pressures exhibit surprisingly low intensities of NO signal on the lean side of the well-formed flame fronts. It is believed that more NO could be formed at the tip of the flame, outside the field of view. While the zone of high OH-LIF signal moved only slightly downstream of the nozzle with raised injection pressure, NO-LIF peak intensities moved from just below the liquid spray core to the very tip of the flame. This could be associated with the longer lift-off length and the increased amount of air entrained into the spray. This led to higher intensities during the second phase mentioned above for high injection pressures. A similar increase of late NO formation with injection pressure was observed by Hildenbrand et al. [24] in a configuration less likely to be influenced by air entrainment. Therefore the injection pressure could influence both the location and timing of NO formation with high density regions found further away from the nozzle and later in the combustion for high injection pressures.
Page 18 of 29
No fundamental difference was found in the initial overall NO production rate across the injection pressures The NO densities were found to increase linearly during combustion, as found elsewhere [25-27]. A local upsurge in NO formation appeared in all cases just after the end of combustion of the respective flames. This was associated in time and space with the “collapse” of the combusting spray on itself and the high densities of OH and NO observed subsequently. Rapid cooling of the CO2 could also be at the origin of a weaker attenuation of the laser light and a stronger NO signal.
EFFECT OF IN-CYLINDER PRESSURE
Nitric oxide and hydroxyl radical distributions were captured for in-cylinder pressures varying from 5 MPa to 7 MPa. As seen in Figure 15, the flame moved upstream as in-cylinder pressures were increased. This can be explained by decrease in the flame lift-off length, as also found by Siebers and Higgins [9]
Page 19 of 29
0
20
40
60
80
100
120
20 30 40 50 60 70 80distance from nozzle [mm]
sum
of i
nten
sitie
s on
row
[cou
nts]
5 MPa 6 MPa 7 MPa
0
20
40
60
80
100
120
140
160
180
-15 -10 -5 0 5 10 15distance from centre axis [mm]
sum
of i
nten
sitie
s on
col
umn
[cou
nts]
5 MPa 6 MPa 7 MPa
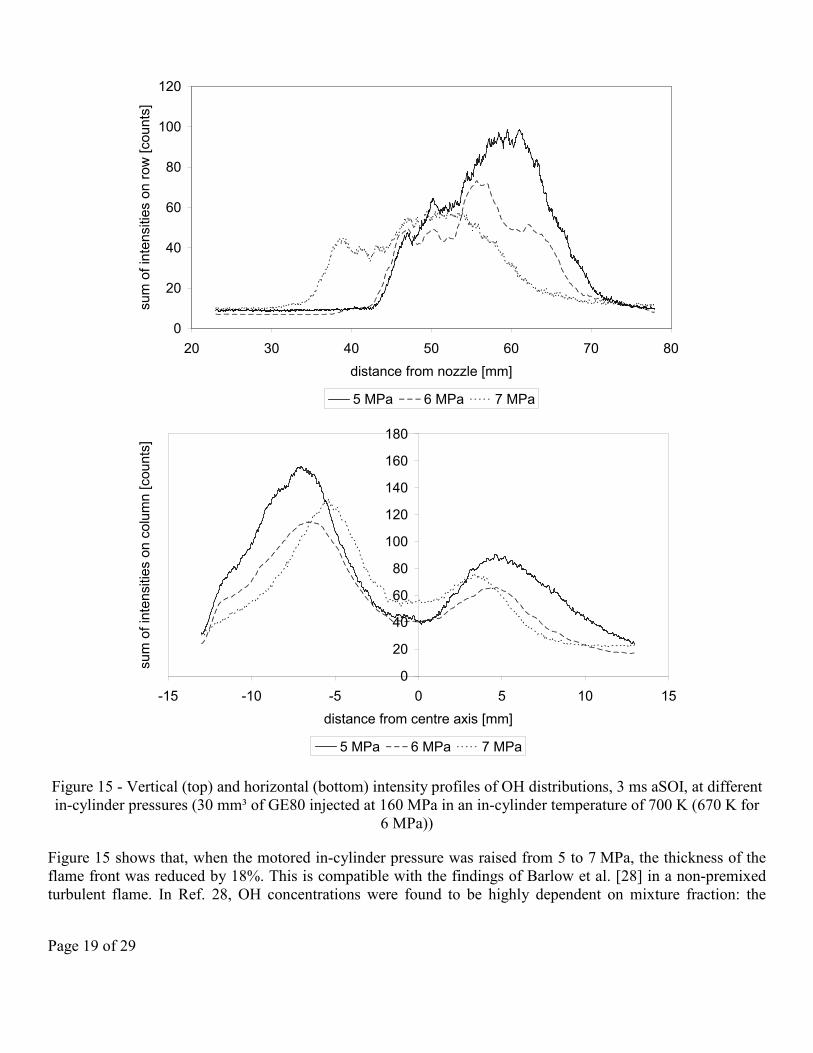
Figure 15 - Vertical (top) and horizontal (bottom) intensity profiles of OH distributions, 3 ms aSOI, at different in-cylinder pressures (30 mm³ of GE80 injected at 160 MPa in an in-cylinder temperature of 700 K (670 K for
6 MPa))
Figure 15 shows that, when the motored in-cylinder pressure was raised from 5 to 7 MPa, the thickness of the flame front was reduced by 18%. This is compatible with the findings of Barlow et al. [28] in a non-premixed turbulent flame. In Ref. 28, OH concentrations were found to be highly dependent on mixture fraction: the
Page 20 of 29
concentrations peaked for stoichiometric mixtures and declined for richer or leaner mixtures. The rising gas density sharpened the mixture gradients, leading to a thinner peak concentration of OH.
Whereas the liquid spray dispersion is expected to expand with increasing gas density [28], in Figure 15 the flame plume width was reduced by as much as 21% when rising from 5 to 7 MPa in-cylinder pressures.
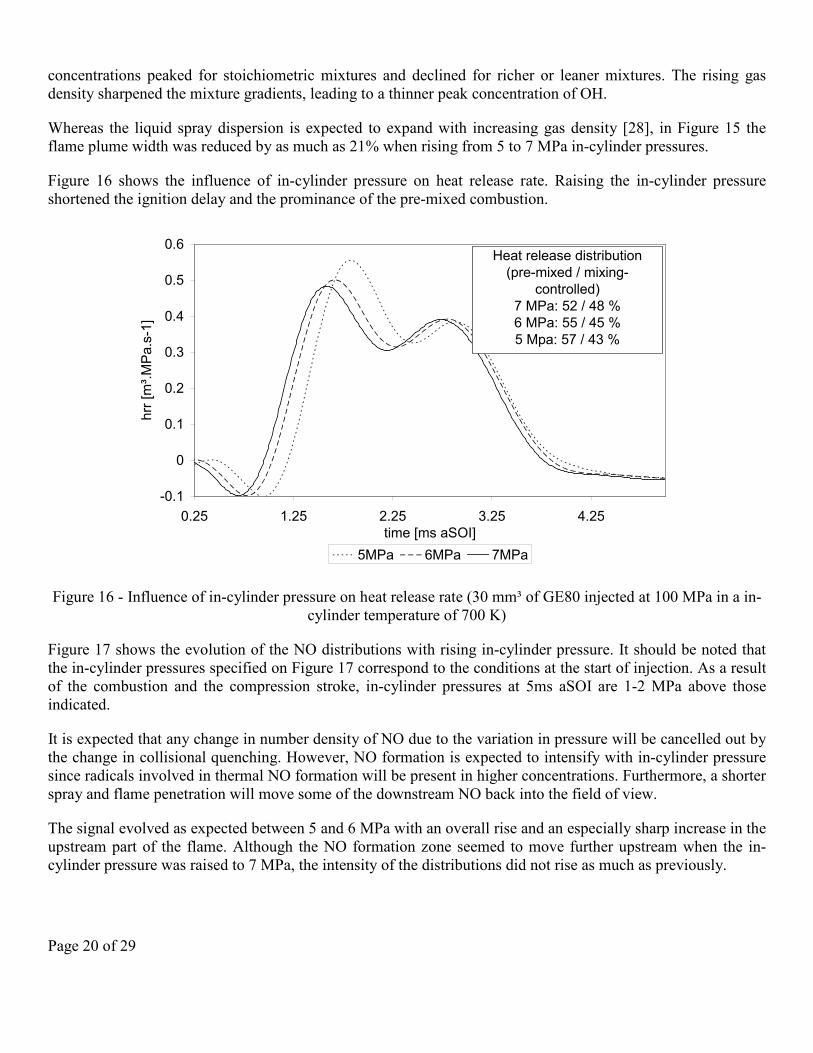
Figure 16 shows the influence of in-cylinder pressure on heat release rate. Raising the in-cylinder pressure shortened the ignition delay and the prominance of the pre-mixed combustion.
-0.1
0
0.1
0.2
0.3
0.4
0.5
0.6
0.25 1.25 2.25 3.25 4.25time [ms aSOI]
hrr [
m³.M
Pa.
s-1]
5MPa 6MPa 7MPa
Heat release distribution(pre-mixed / mixing-
controlled)7 MPa: 52 / 48 %6 MPa: 55 / 45 %5 Mpa: 57 / 43 %
Figure 16 - Influence of in-cylinder pressure on heat release rate (30 mm³ of GE80 injected at 100 MPa in a in-cylinder temperature of 700 K)
Figure 17 shows the evolution of the NO distributions with rising in-cylinder pressure. It should be noted that the in-cylinder pressures specified on Figure 17 correspond to the conditions at the start of injection. As a result of the combustion and the compression stroke, in-cylinder pressures at 5ms aSOI are 1-2 MPa above those indicated.
It is expected that any change in number density of NO due to the variation in pressure will be cancelled out by the change in collisional quenching. However, NO formation is expected to intensify with in-cylinder pressure since radicals involved in thermal NO formation will be present in higher concentrations. Furthermore, a shorter spray and flame penetration will move some of the downstream NO back into the field of view.
The signal evolved as expected between 5 and 6 MPa with an overall rise and an especially sharp increase in the upstream part of the flame. Although the NO formation zone seemed to move further upstream when the in-cylinder pressure was raised to 7 MPa, the intensity of the distributions did not rise as much as previously.
Page 21 of 29
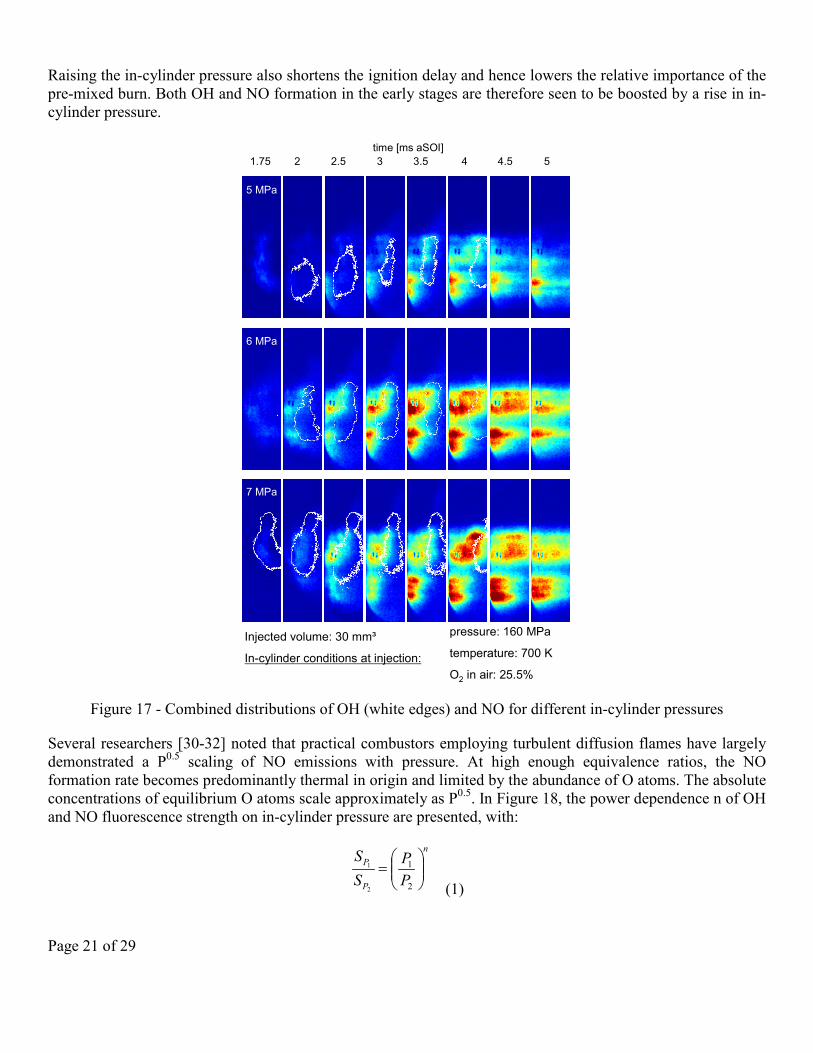
Raising the in-cylinder pressure also shortens the ignition delay and hence lowers the relative importance of the pre-mixed burn. Both OH and NO formation in the early stages are therefore seen to be boosted by a rise in in-cylinder pressure.
2 2.5 3 3.5 4 4.5 5time [ms aSOI]
Injected volume: 30 mm³
In-cylinder conditions at injection:
1.75
pressure: 160 MPa
temperature: 700 K
O2 in air: 25.5%
5 MPa
6 MPa
7 MPa
Figure 17 - Combined distributions of OH (white edges) and NO for different in-cylinder pressures
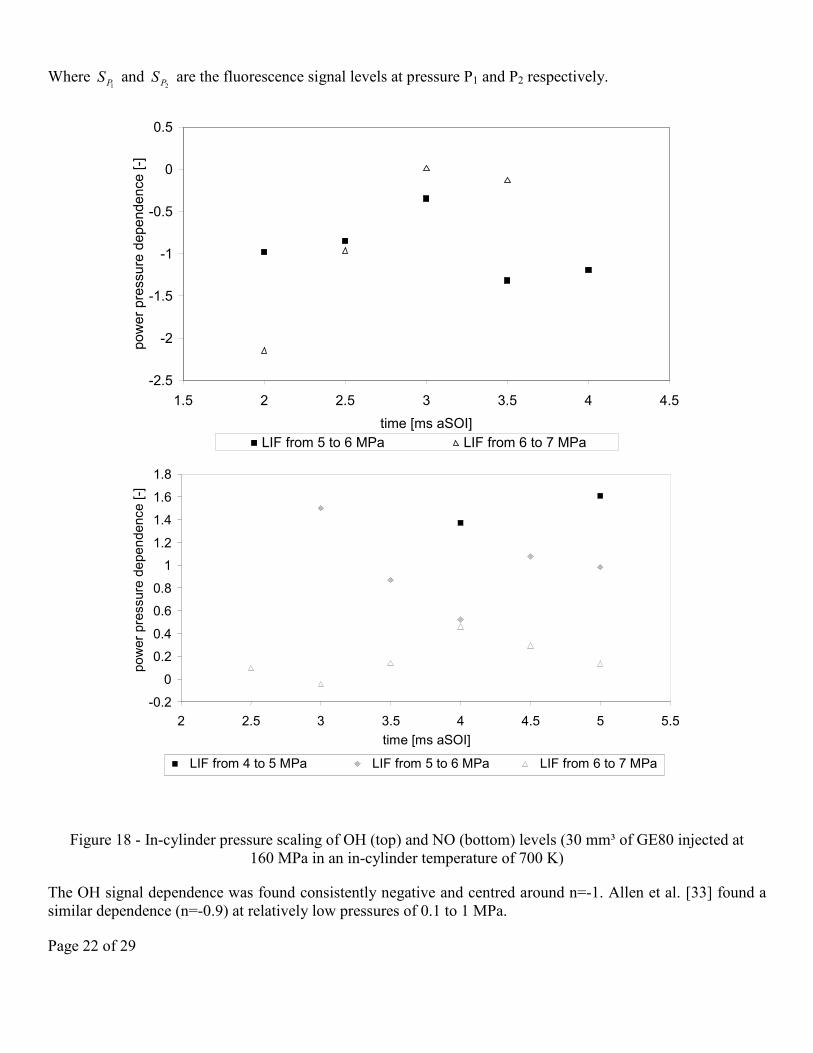
Several researchers [30-32] noted that practical combustors employing turbulent diffusion flames have largely demonstrated a P0.5 scaling of NO emissions with pressure. At high enough equivalence ratios, the NO formation rate becomes predominantly thermal in origin and limited by the abundance of O atoms. The absolute concentrations of equilibrium O atoms scale approximately as P0.5. In Figure 18, the power dependence n of OH and NO fluorescence strength on in-cylinder pressure are presented, with:
n
P
P
PP
SS
=
2
1
2
1
(1)
Page 22 of 29
Where 1PS and
2PS are the fluorescence signal levels at pressure P1 and P2 respectively.
-2.5
-2
-1.5
-1
-0.5
0
0.5
1.5 2 2.5 3 3.5 4 4.5time [ms aSOI]
pow
er p
ress
ure
depe
nden
ce [-
]
LIF from 5 to 6 MPa LIF from 6 to 7 MPa
Figure 18 - In-cylinder pressure scaling of OH (top) and NO (bottom) levels (30 mm³ of GE80 injected at 160 MPa in an in-cylinder temperature of 700 K)
The OH signal dependence was found consistently negative and centred around n=-1. Allen et al. [33] found a similar dependence (n=-0.9) at relatively low pressures of 0.1 to 1 MPa.
-0.2 0
0.2 0.4 0.6 0.8
1 1.2 1.4 1.6 1.8
2 2.5 3 3.5 4 4.5 5 5.5 time [ms aSOI]
pow
er p
ress
ure
depe
nden
ce [-
]
LIF from 4 to 5 MPa LIF from 5 to 6 MPa LIF from 6 to 7 MPa
Page 23 of 29
The NO signal power dependence was found to vary greatly and scalings far from P0.5 were found. Nevertheless, the dependence showed a clear decline with rising in-cylinder pressure. The LIF levels used to compute n in Figure 18 are averaged intensities over a constant section of the acquired image. The flame position being affected by in-cylinder pressure, the probed region could not perfectly account for the overall NO signal evolution. For instance, some of the NO formed at the tip of the flame was not accounted for at 7 MPa in-cylinder pressure.
The equivalence ratio of the pre-mixed combustion mixture was affected by the changes in injection and in-cylinder pressure. Nevertheless, the NO densities stayed under the detectability limit of the setup until after the onset of the diffusion flame. Over the range of equivalence ratios explored, the formation of NO during the pre-mixed phase was therefore negligible compared to the mixing-controlled formation.
CONCLUSIONS
The OH and NO-PLIF techniques were applied to a diesel combusting spray at working in-cylinder pressures in excess of 7 MPa and injection pressures up to 160 MPa.
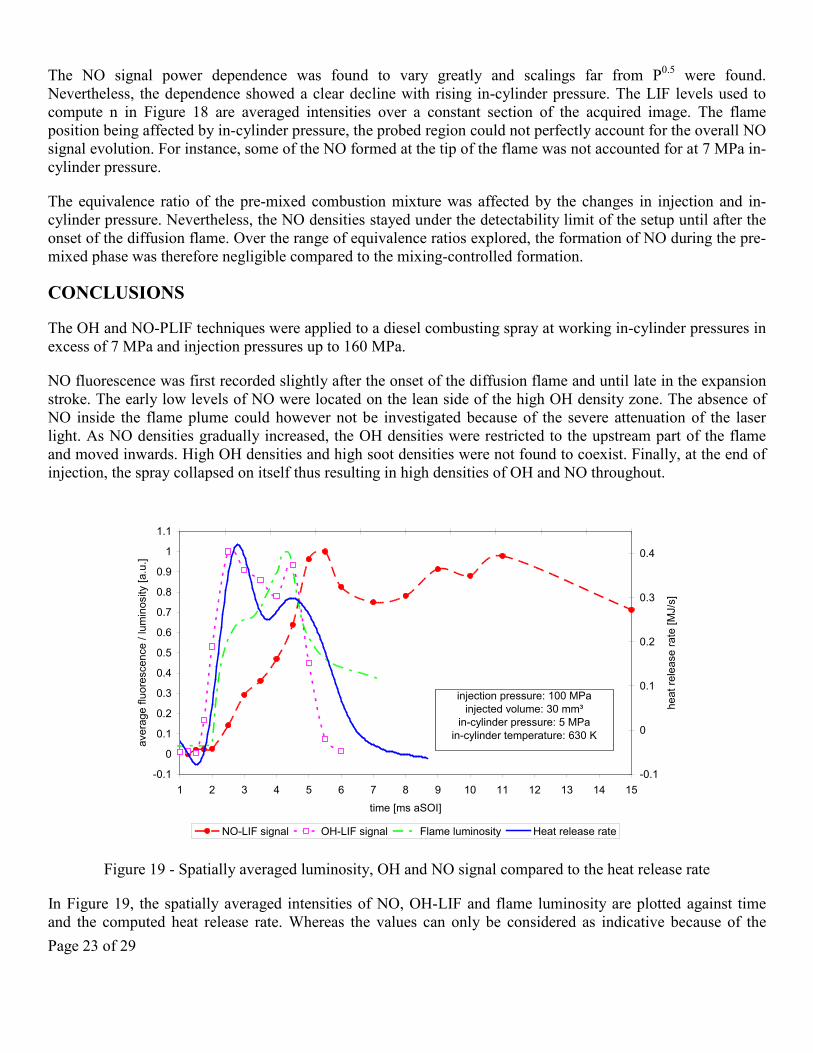
NO fluorescence was first recorded slightly after the onset of the diffusion flame and until late in the expansion stroke. The early low levels of NO were located on the lean side of the high OH density zone. The absence of NO inside the flame plume could however not be investigated because of the severe attenuation of the laser light. As NO densities gradually increased, the OH densities were restricted to the upstream part of the flame and moved inwards. High OH densities and high soot densities were not found to coexist. Finally, at the end of injection, the spray collapsed on itself thus resulting in high densities of OH and NO throughout.
-0.1
0
0.1
0.2
0.3
0.4
0.5
0.6
0.7
0.8
0.9
1
1.1
1 2 3 4 5 6 7 8 9 10 11 12 13 14 15
time [ms aSOI]
aver
age
fluor
esce
nce
/ lum
inos
ity [a
.u.]
-0.1
0
0.1
0.2
0.3
0.4
1 2 3 4 5 6 7 8 9 10 11
heat
rele
ase
rate
[MJ/
s]
NO-LIF signal OH-LIF signal Flame luminosity Heat release rate
injection pressure: 100 MPainjected volume: 30 mm³
in-cylinder pressure: 5 MPain-cylinder temperature: 630 K
Figure 19 - Spatially averaged luminosity, OH and NO signal compared to the heat release rate
In Figure 19, the spatially averaged intensities of NO, OH-LIF and flame luminosity are plotted against time and the computed heat release rate. Whereas the values can only be considered as indicative because of the
Page 24 of 29
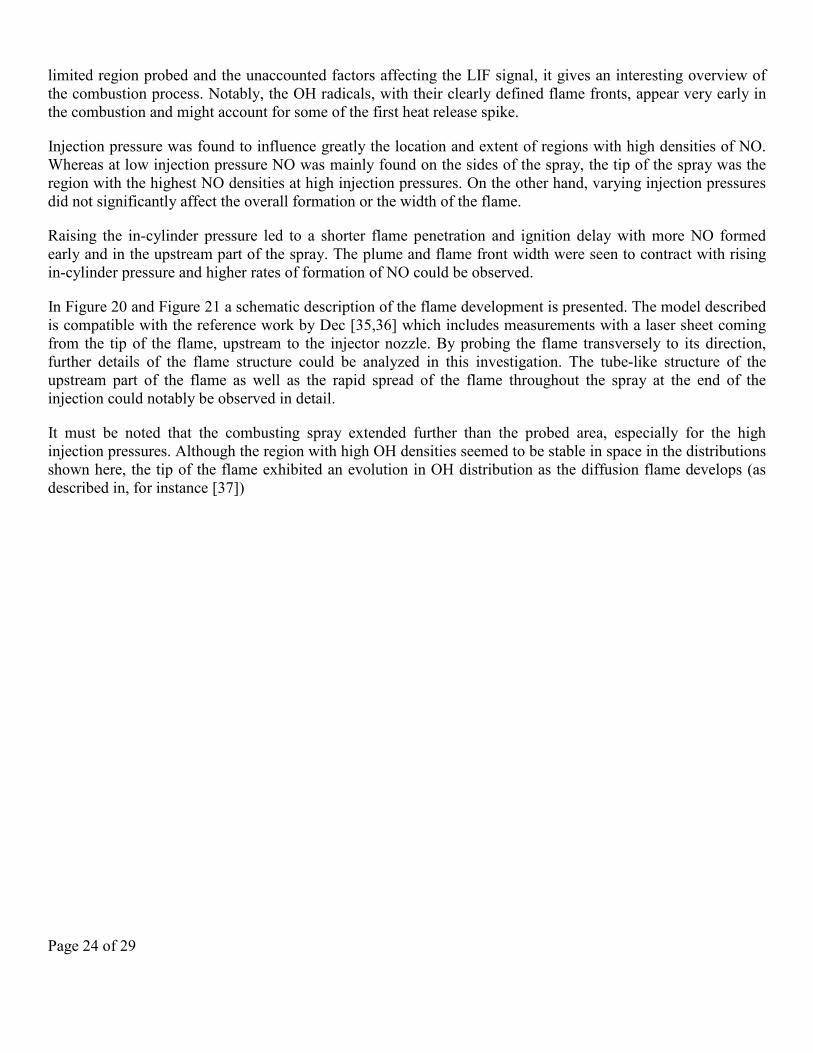
limited region probed and the unaccounted factors affecting the LIF signal, it gives an interesting overview of the combustion process. Notably, the OH radicals, with their clearly defined flame fronts, appear very early in the combustion and might account for some of the first heat release spike.
Injection pressure was found to influence greatly the location and extent of regions with high densities of NO. Whereas at low injection pressure NO was mainly found on the sides of the spray, the tip of the spray was the region with the highest NO densities at high injection pressures. On the other hand, varying injection pressures did not significantly affect the overall formation or the width of the flame.
Raising the in-cylinder pressure led to a shorter flame penetration and ignition delay with more NO formed early and in the upstream part of the spray. The plume and flame front width were seen to contract with rising in-cylinder pressure and higher rates of formation of NO could be observed.
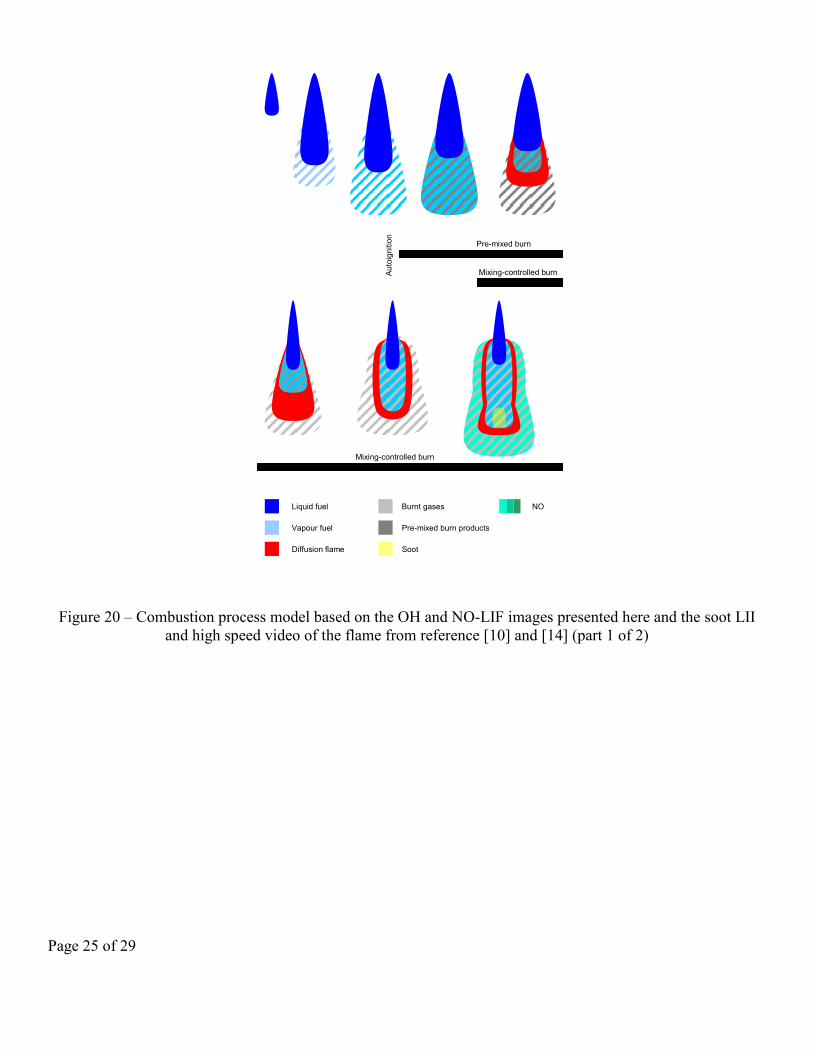
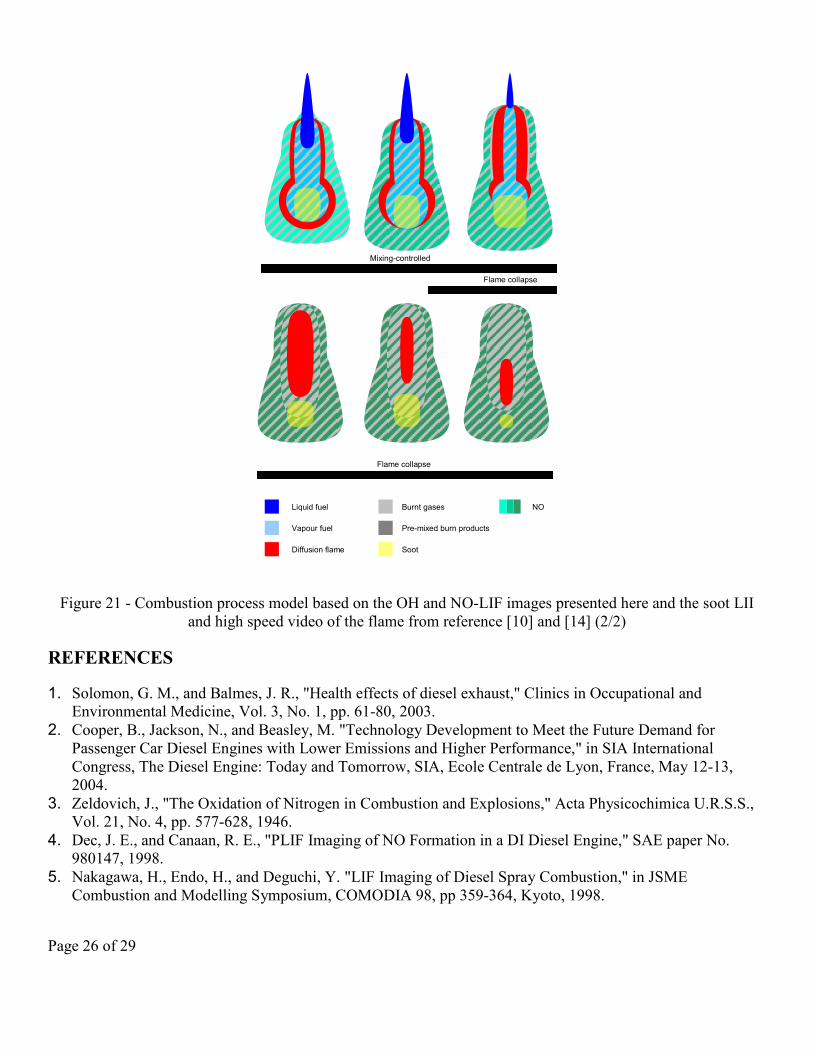
In Figure 20 and Figure 21 a schematic description of the flame development is presented. The model described is compatible with the reference work by Dec [35,36] which includes measurements with a laser sheet coming from the tip of the flame, upstream to the injector nozzle. By probing the flame transversely to its direction, further details of the flame structure could be analyzed in this investigation. The tube-like structure of the upstream part of the flame as well as the rapid spread of the flame throughout the spray at the end of the injection could notably be observed in detail.
It must be noted that the combusting spray extended further than the probed area, especially for the high injection pressures. Although the region with high OH densities seemed to be stable in space in the distributions shown here, the tip of the flame exhibited an evolution in OH distribution as the diffusion flame develops (as described in, for instance [37])
Page 25 of 29
Figure 20 – Combustion process model based on the OH and NO-LIF images presented here and the soot LII and high speed video of the flame from reference [10] and [14] (part 1 of 2)
Pre-mixed burn
Mixing-controlled burn
Mixing-controlled burn
Auto
igni
tion
Liquid fuel
Diffusion flame
Vapour fuel
Burnt gases
Pre-mixed burn products
Soot
NO
Page 26 of 29
Figure 21 - Combustion process model based on the OH and NO-LIF images presented here and the soot LII and high speed video of the flame from reference [10] and [14] (2/2)
REFERENCES
1. Solomon, G. M., and Balmes, J. R., "Health effects of diesel exhaust," Clinics in Occupational and Environmental Medicine, Vol. 3, No. 1, pp. 61-80, 2003.
2. Cooper, B., Jackson, N., and Beasley, M. "Technology Development to Meet the Future Demand for Passenger Car Diesel Engines with Lower Emissions and Higher Performance," in SIA International Congress, The Diesel Engine: Today and Tomorrow, SIA, Ecole Centrale de Lyon, France, May 12-13, 2004.
3. Zeldovich, J., "The Oxidation of Nitrogen in Combustion and Explosions," Acta Physicochimica U.R.S.S., Vol. 21, No. 4, pp. 577-628, 1946.
4. Dec, J. E., and Canaan, R. E., "PLIF Imaging of NO Formation in a DI Diesel Engine," SAE paper No. 980147, 1998.
5. Nakagawa, H., Endo, H., and Deguchi, Y. "LIF Imaging of Diesel Spray Combustion," in JSME Combustion and Modelling Symposium, COMODIA 98, pp 359-364, Kyoto, 1998.
Liquid fuel
Diffusion flame
Vapour fuel
Burnt gases
Pre-mixed burn products
Flame collapse
Soot
Flame collapse
Mixing-controlled flame
NO
Page 27 of 29
6. Stoffels, G. G. M., "Nitric oxide in a diesel engine: laser-based detection and interpretation," PhD Thesis, Katholieke Universiteit Nijmegen, 1999.
7. Verbiezen, K., Klein-Douwel, R. J. H., Vliet, A. P. v., Donkerbroek, A. J., Meerts, W. L., Meerts, N. J., Dam, N. J., and Meulen, J. J. t., "Quantitative Laser-Induced Fluorescence Measurements of Nitric-Oxide in a Heavy-Duty Diesel Engine," Proceeding of the Combustion Institute, Vol. 31, No. 1, pp. 765-773, 2006.
8. Dec, J. E. and Coy, E. B., "OH Radical Imaging in a DI Diesel Engine and the Structure of the Early Diffusion Flame", SAE Paper No 960831, 1996.
9. Siebers, D. and Higgins, B., "Flame Lift-Off on Direct Injection Diesel Sprays Under Quiescent Conditions", SAE Paper No 2001-01-0530, 2001.
10. Crua, C., "Combustion Processes in a Diesel Engine," PhD Thesis, University of Brigthon, 2002. 11. Gonzalez, M. A., Piel, W., Asmus, T., Clark, W., Garbak, J., Limey, E., Natarajan, M., Naegelli, D. W.,
Yost, D., Frame, E. A., Wallace, J. P., "Oxygenates Screening for Advanced Petroleum-Based Diesel Fuels: Part 2. The Effect of Oxygenate Blending Compounds on Exhaust Emissions.", SAE paper No 2001-01-3632, 2001
12. Watson, H. C., Milkins, E. E., and Rigby, G. R., "A New Look at Oxygen Enrichment: 1) The Diesel Engine," SAE Paper No. 900344, 1990.
13. Pickett, L. M. and Siebers, D., "Fuel Effects of Soot Processes of Fuel Jets at DI Diesel Conditions", SAE Paper No. 2003-01-3080, 2003.
14. Demory, R., Crua, C., Gold, M. R., and Heikal, M. R. "Measuring and processing in-cylinder distributions of NO and OH obtained by laser-induced fluorescence in a diesel rapid compression machine," in Applied Laser Techniques to Fluid Mechanics, Lisbon, Portugal, June 26-29, 2006.
15. Hildenbrand, F., and Schulz, C., "Measurements and simulations of in-cylinder UV-absorption in spark ignition and Diesel engines," Appl. Phys. B, Vol. 73, pp. 165-172, 2001.
16. Schulz, C., Sick, V., Heinze, J., and Sticker, W., "Laser-Induced Fluorescence Detection of Nitric Oxide in High-Pressure Flames with A-X(0,2) excitation," Applied Optics, Vol. 36, No. 15, pp. 3227-3232, 1997.
17. Hildenbrand, F., Schulz, C., Keller, F., König, G., and Wagner, E., "Quantitative Laser Diagnostics Studies of the NO Distribution in a DI Diesel Engine with PLN and CR Injection Systems," SAE Paper No. 2001-01-3500, 2001.
18. Bessler, W. G., Schulz, C., Lee, T., Shin, D.-I., Hofmann, M., Jeffries, J. B., Wolfrum, J., and Hanson, R. K., "Quantitative NO-LIF imaging in high-pressure flames," Appl. Phys. B, Vol. 75, pp. 97-102, 2002.
19. Luque, J., and Crosley, D. R., "LIFBASE, Database and spectral simulation for diatomic molecules (v 1.6)," SRI International Report MP-99-009, 1999.
20. Bessler, W. G., Schulz, C., Sick, V., and Daily, J. W. "A versatile modeling tool for nitric oxide LIF spectra," in Third Joint Meeting of the US Sections of The Combustion Institute, Chicago, March 16-19, 2003.
21. Battles, B. E., and Hanson, R. K., "Laser-Induced Fluorescence Measurements of NO and OH Mole Fraction in Fuel-Lean, High-Pressure (1-10 atm) Methane Flames: Fluorescence Modeling and Experimental Validation," J. Quant. Spectrosc. Radiat. Transfer, Vol. 54, No. 3, pp. 521-537, 1995.
22. DiRosa, M. D., Klavuhn, K. G., and Hanson, R. K., "LIF Spectroscopy of NO and O2 in High-Pressure Flames," Combust. Sci. and Tech., Vol. 118, pp. 257-283, 1996.
23. Bessler, W. G., Schulz, C., Lee, T., Jeffries, J. B., and Hanson, R. K., "Carbon dioxide UV laser-induced fluorescence in high-pressure flames," Chemical Physics Letter, Vol. 375, pp. 344-349, 2003.
24. Hildenbrand, F., Schulz, C., Keller, F., and Wagner, E. "Laser-Induced Fluorescence Imaging of NO in a DI Diesel Engine using KrF Excimer Radiation," in Towards Clean Diesel Engines, IFP, June 2000.
25. Voiculescu, I. A., and Borman, G. L., "An Experimental Study of Diesel Engine Cylinder-Averaged Histories," SAE Paper No. 780228, 1978.
Page 28 of 29
26. Donahue, R. J., Borman, G. L., and Bower, G. R., "Cylinder-Averaged Histories of Nitric Oxide in a D.I. Diesel with Simulated Turbocharging," SAE Paper No. 942046, 1994.
27. Kitamura, Y., Mohammadi, A., Ishiyama, T., and Shioji, M., "Fundamental Investigation of NOx Formation in Diesel Combustion Under Supercharged and EGR Conditions," SAE Paper No. 2005-01-0364, 2005.
28. Barlow, R. S., Dibble, R. W., and Lucht, R. P., "Simultaneous Measurement of Raman Scattering and Laser-Induced OH Fluorescence in Nonpremixed Turbulent Jet Flames," Optics Letters, Vol. 14, No. 5, pp. 263-265, 1989.
29. Naber J. D. and Siebers, D. L., "Effects of Gas Density and Vaporization on Penetration and Dispersion of Diesel Sprays", SAE Paper No 960034, 1996.
30. Correa, S. M., "A review of NOx Formation under Gas-Turbine Combustion," Combust. Sci. and Tech., Vol. 87, pp. 329-362, 1992.
31. Drake, M. C., Correa, S. M., Pitz, R. W., Shyy, W., and Fenimore, C. P., "Superequilibrium and Thermal Nitric Oxide Formation in Turbulent Diffusion Flames," Combustion and Flame, Vol. 69, pp. 347-365, 1987.
32. Cooper, C. S., and Laurendeau, N. M., "Quantitative measurements of nitric oxide in high-pressure (2-5 atm), swirl-stabilized spray flames via laser-induced fluorescence," Combustion and Flame, Vol. 123, No. 1-2, pp. 175-188, 2000.
33. Allen, M. G., McManus, K. R., and Sonnenfroh, D. M., "PLIF Imaging Measurements in High-Pressure Spray Flame Combustion," AIAA, Vol. 2913, 1994.
34. Verbiezen, K., Donkerbroek, A. J., Klein-Douwel, R. J. H., van Vliet, A. P., Frijters, P. J. M., Seykens, X L. J., Baert R. S. G., Meerts, W. L., Dam, N. J., ter Meulen, J. J., "Diesel combustion: In-cylinder NO concentrations in relation to injection timing", Combustion and Flame, Vol. 151, pp. 333-346, 2007.
35. Dec, J. E., Coy, E. B., "OH Radical Imaging in a Diesel Engine and the Structure of the Early Diffusion Flame, SAE 960831, 1996.
36. Dec, J. E., "Conceptual model of DI diesel combustion based on laser-sheet imaging", SAE 970873, 1997 37. Bruneaux, G., "Combustion structure of free and wall-impinging diesel jets by simultaneous laser-induced
fluorescence of formaldehyde, poly-aromatic hydrocarbons, and hydroxides", Int. J. Engine Res., Vol. 9, pp. 249-265, 2008
CONTACT INFORMATION
Cyril Crua
www.brighton.ac.uk/shrl
ACKNOWLEDGMENTS
The authors would like to thank Benoit Oger for assisting with the experiments and the data processing, as well as Eric Domingues (CORIA, France) for his valuable suggestions and for providing some optical filters. The authors wish to acknowledge the financial support of Delphi Diesel Systems, Ricardo UK and the EPSRC (GR/R08094/01), as well as the EPSRC Instrument Loan Pool for supplying a high-speed video camera used to capture the flame luminosity and spray development.
Page 29 of 29
DEFINITIONS/ABBREVIATIONS
aSOI After Start Of Injection c.a. Crank Angle DI Direct Injection EGR Exhaust Gas Recirculation GE80 Blend made of 80% TPGME and 20% HMN HMN Hepta-Methyl Nonane LIF Laser-Induced Fluorescence NO Nitric Oxides OH Hydroxyl PAH Poly-Aromatic Hydrocarbons PLIF Planar Laser-Induced Fluorescence TDC Top Dead Centre TPGME TriPropylene Glycol Monomethyl Ether VCO Valve-Covered Orifice
Related Documents


![In Vivo Cell Wall Loosening by Hydroxyl Radicals …...In Vivo Cell Wall Loosening by Hydroxyl Radicals during Cress Seed Germination and Elongation Growth1[W][OA] Kerstin Mu¨ller,](https://static.cupdf.com/doc/110x72/5fa270bcf76a9306b149591c/in-vivo-cell-wall-loosening-by-hydroxyl-radicals-in-vivo-cell-wall-loosening.jpg)