Laser Excitation and Fourier Transform Emission Spectroscopy of ScS R. S. Ram Department of Chemistry, University of Arizona, Tucson, AZ 85721 J. Gengler, T. C. Steimle Department of Chemistry, Arizona State University, Tempe, AZ 85287 P. F. Bernath Department of Chemistry, University of Waterloo, Waterloo, Ont. Canada N2L 3G1

Welcome message from author
This document is posted to help you gain knowledge. Please leave a comment to let me know what you think about it! Share it to your friends and learn new things together.
Transcript

Laser Excitation and Fourier Transform Emission Spectroscopy of ScS
R. S. RamDepartment of Chemistry, University of Arizona,
Tucson, AZ 85721
J. Gengler, T. C. SteimleDepartment of Chemistry, Arizona State University,
Tempe, AZ 85287
P. F. BernathDepartment of Chemistry, University of Waterloo,
Waterloo, Ont. Canada N2L 3G1

Introduction
Chemical importance
Diatomic molecules such as ScS represent simple metal systems where d electrons take part in the bonding. Such molecules provide ideal models for the understanding the bonding and reactivity in transition metal systems.
Astrophysical importance
Like diatomic oxides and hydrides, sulfide molecules may also be found in the atmospheres of cool stars. TiS and ZrS have been identified in S-type Mira variable stars and there is strong possibility that ScS may also be found. If found, their spectra will provide data on the abundance of sulfur in cool stars.
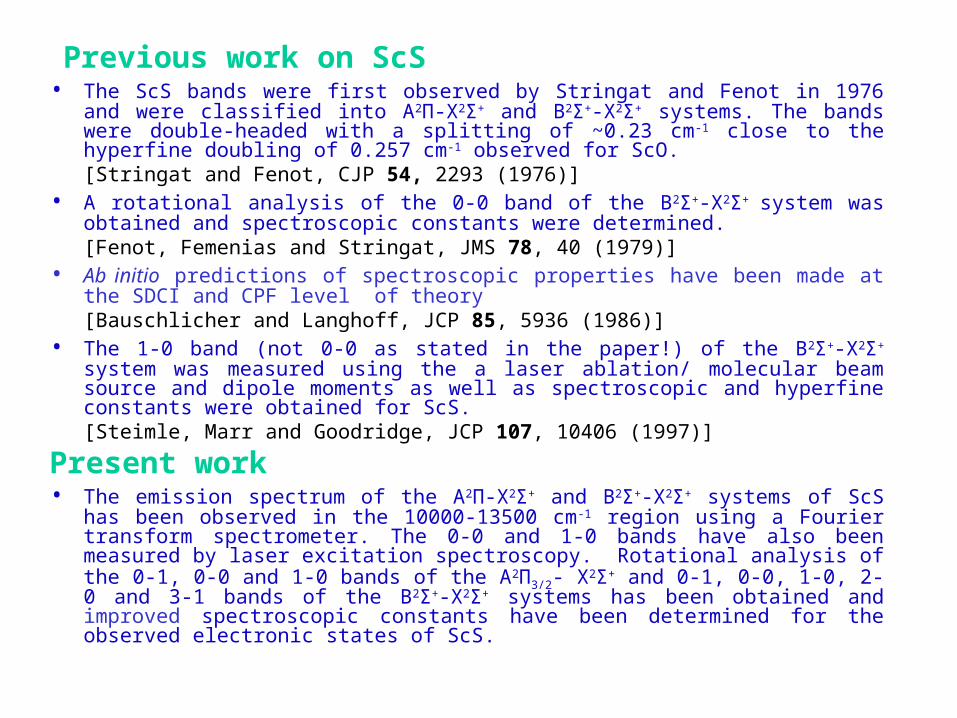
Previous work on ScS• The ScS bands were first observed by Stringat and Fenot in 1976 and were classified into
A2Π-X2Σ+ and B2Σ+-X2Σ+ systems. The bands were double-headed with a splitting of ~0.23 cm-1 close to the hyperfine doubling of 0.257 cm-1 observed for ScO.[Stringat and Fenot, CJP 54, 2293 (1976)]
• A rotational analysis of the 0-0 band of the B2Σ+-X2Σ+ system was obtained and spectroscopic constants were determined. [Fenot, Femenias and Stringat, JMS 78, 40 (1979)]
• Ab initio predictions of spectroscopic properties have been made at the SDCI and CPF level of theory[Bauschlicher and Langhoff, JCP 85, 5936 (1986)]
• The 1-0 band (not 0-0 as stated in the paper!) of the B2Σ+-X2Σ+ system was measured using the a laser ablation/ molecular beam source and dipole moments as well as spectroscopic and hyperfine constants were obtained for ScS. [Steimle, Marr and Goodridge, JCP 107, 10406 (1997)]
Present work • The emission spectrum of the A2Π-X2Σ+ and B2Σ+-X2Σ+ systems of ScS has been observed in
the 10000-13500 cm-1 region using a Fourier transform spectrometer. The 0-0 and 1-0 bands have also been measured by laser excitation spectroscopy. Rotational analysis of the 0-1, 0-0 and 1-0 bands of the A2Π3/2- X2Σ+ and 0-1, 0-0, 1-0, 2-0 and 3-1 bands of the B2Σ+-X2Σ+ systems has been obtained and improved spectroscopic constants have been determined for the observed electronic states of ScS.

Fig. 1. DC discharge – furnace setup
Experimental Setup for FTS Observations
Beamsplitter UV Number of scans: 4
Detectors: Midrange Si diode Signal-to-noise ratio: 8Filter: RG645 Furnace Temp.: 2125ºCResolution: 0.05 cm-1 He pressure: 261 Torr

Fig. 2. An overview of the emission spectrum of ScS observed using the FT spectrometer at Kitt Peak.

Observations for ScS
FTS Observations:B2Σ+ -X2Σ+ 0-1 11894 cm-1 J=128.5
0-0 12456 147.5
1-0 12940 142.5
2-0 13336 106.5
3-1 13420 95.5
A2Π3/2 -X2Σ+ 0-1 10583 95.5
0-0 11145 118.5
1-0 11624 70.5
Laser Excitation Spectroscopy: B2Σ+ -X2Σ+ 0-0, 1-0 bands
A2Π -X2Σ+ 1-0 band

Fig. 3. A portion of the emission spectrum marking band heads of the B2Σ+ -X2Σ+ transition of ScS.

Fig. 4. Labeling of branches in the of the A2Π- X2Σ+ and B 2Σ+- X2Σ+ systems of ScS

Fig. 5. Four R heads of the 0-0, B2Σ+ - X2Σ+ band of ScS arising due to spin splitting in the B2Σ+ state and hyperfine splitting of 0.23 cm-1 in the X2Σ+ state


Table II. The re-measured raw data set for the (1,0) B2+ - X2+ band system of ScS.
Branch N F’-F Observeda Obs.-Calc.a F’-Fc Observedb Obs.-Calc.b
PP24 3 5-6 12939.120 -0.006 12939.1247 -0.0027 4-5 39.122 -0.007 39.1264 -0.0027 4-4 39.124 -0.007 39.1289 -0.0026 3-3 39.127 -0.006 39.1316 -0.0020 2-2 39.1343 -0.0009 2-1 39.1358 -0.0014
PP13+PQ13 3 1-1 39.1938 -0.0014 2-2 39.1961 -0.0014 3-4 39.198 -0.001 2-3 39.1984 -0.0008 4-4 39.200 -0.001 3-3 39.1996 -0.0010 4-5 39.202 -0.001 3-4 39.2021 -0.0004 4-4 39.2040 -0.0003 5-5 39.205 -0.001 4-5 39.2055 -0.0004 5-6 39.2086 -0.0004
PP23 3 4-4 39.3490 -0.0055 5-6 39.350 -0.001 4-5 39.3512 -0.0049 4-5 39.352 0.001 5-6 39.3537 -0.0033
RR13 0 2-3 40.844 -0.005 40.8633 0.0054 3-3 40.846 -0.005 40.8658 0.0055 4-3 40.859 0.005 40.8683 0.0049 1 2-2 41.1722 0.0007 3-3 41.168 0.000 41.1772 0.0014 4-3 41.171 0.001 41.1797 0.0021 5-4 41.172 0.000 41.1822 0.0025 2 0-1 41.457 0.006 1-1 41.4599 0.0015 2-2 41.4636 0.0029 4-3 41.4674 0.0026 5-4 41.4699 0.0020 6-5 41.4718 0.0017

Table 1. Spectroscopic constants (in cm-1) for the B2Σ+-X2Σ+ system of ScS
Note: The ground state spin splitting constant was fixed at 0.0032 cm-1, a value reported by Steimle et al. [ JCP 107, 10406 (1997)].

a Unpublished results by Steimle et al.
Parameters Value Error
B (X2+ v=0) 0.197330 0.000007D 1.4*10-7 0.3*10-7
0.00309 0.00002bF 0.05595 0.00003c 0.0036 0.0002eQq0 0.0020 0.0007A (A2 v=1) 111.7191 0.0002AD -0.000086 0.000002B 0.183664 0.000006D 1.3*10-7 0.3*10-7
p+2q -0.05740 0.00003q -0.00012 0.00002a 0.0056 0.0001d 0.00695 0.00007(1,0) Band Origin 11571.4220 0.0001
Spectroscopic Constants (in cm-1) for the A2Π-X2Σ+ System of ScS

Conclusion
Financial support for this work was provided by the NASA laboratory astrophysics program. We thank the National Solar Observatory for access to the FTS and Mike Dulick for experimental assistance.
Acknowledgements
The A2Π3/2 -X2Σ+ and B2Σ+ -X2Σ+ bands of ScS have been observed in a high temperature furnace as well as laser excitation spectroscopy. A rotational analysis of a number of bands have provided the following equilibrium constants for the low-lying electronic states of ScS.
X2Σ+: Be=0.1976700(77) cm-1, αe=0.008075(92) cm-1, re=2.136443(42) Å A2Π3/2: Be=0.1848833(29) cm-1, αe=0.008531(29) cm-1, re=2.209087(17) ÅB2Σ+: e=488.777(27) cm-1, exe=2.0700(75) cm-1, Be=0.1860282(67) cm-1, αe=0.0009372(29) cm-1, re=2.202279(40) Å
Related Documents